
Financial Results for the Six Months Ended …1 Number of FLET’S Hikari (including Hikari...
18
Financial Results for the Six Months Ended September 30, 2015 November 6, 2015
Transcript of Financial Results for the Six Months Ended …1 Number of FLET’S Hikari (including Hikari...

Financial Results for the Six Months Ended September 30, 2015
November 6, 2015

Copyright (c) 2015 Nippon Telegraph and Telephone Corporation Financial Results for the Six Months Ended September 30, 2015
The forward-looking statements and projected figures concerning the future performance of NTT and its subsidiaries and affiliates contained or referred to herein are based on a series of assumptions, projections, estimates, judgments and beliefs of the management of NTT in light of information currently available to it regarding NTT and its subsidiaries and affiliates, the economy and telecommunications industry in Japan and overseas, and other factors. These projections and estimates may be affected by the future business operations of NTT and its subsidiaries and affiliates, the state of the economy in Japan and abroad, possible fluctuations in the securities markets, the pricing of services, the effects of competition, the performance of new products, services and new businesses, changes to laws and regulations affecting the telecommunications industry in Japan and elsewhere, other changes in circumstances that could cause actual results to differ materially from the forecasts contained or referred to herein, as well as other risks included in NTT’s most recent Annual Report on Form 20-F and other filings and submissions with the United States Securities and Exchange Commission.
-1-
* “E” in this material represents that the figure is a plan or projection for operation. ** “FY” in this material indicates the fiscal year ending March 31 of the succeeding year. *** “2Q” in this material represents the 6-month period beginning on April 1 and ending on September 30.

Copyright (c) 2015 Nippon Telegraph and Telephone Corporation Financial Results for the Six Months Ended September 30, 2015 -2-
5,373.7
FY2014/2Q FY2015/2Q
5,589.0
590.9
FY2014/2Q FY2015/2Q
FY2015/2Q Highlights
33.2 38.7
747.5 929.5
Total Sales Overseas Sales (Billions of yen)
Consolidated Operating Revenues
Total Operating Income
Overseas Operating Income*1
733.5
(Billions of yen)
Consolidated Operating Income
Both Operating Revenues and Operating Income increased, with Operating Revenues increasing for the sixth consecutive year and reaching record levels
*1 Operating Income excludes M&A-related temporary expenses, such as depreciation costs of intangible fixed assets. *2 Total number of large-scale corporate or local government customers. Excludes small-scale restaurants, etc.
Overseas Sales: +182.0 billion yen increase year-on-year Overseas Operating Income*1: +5.4 billion yen increase year-on-year
Expansion of global cloud services
Shareholder Returns
Enhanced Operating Revenues from network services Expansion of NTT’s user base • 68.49 million mobile phone subscribers (net increase of 1.90 million subscribers) • 19.04 million FTTH subscribers (net increase of 0.32 million subscribers) including
2.35 million subscribers to the “Hikari Collaboration Model” (includes 0.27 million new subscribers and 1.80 million subscribers who switched subscriptions from FLET'S Hikari to the Hikari Collaboration Model)
Cost reductions (fixed-line and mobile access): achieved cost reductions of 225.0 billion yen compared to FY2014/2Q
Growing number of Wi-Fi area owners*2: 248 (+ 93 increase year-on-year)
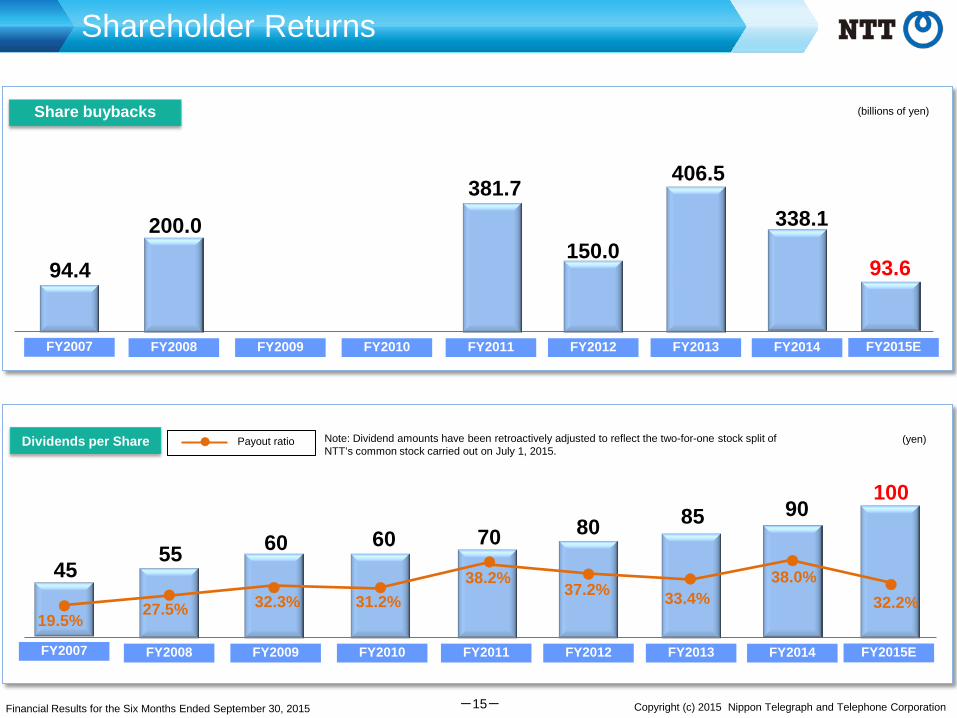
NTT concluded the repurchase of 21 million shares of its treasury stock for 93.6 billion yen on October 1
Promotion of the B2B2X model NTT entered into a business alliance with Hitachi Ltd. in the
development of urban infrastructure that utilizes ICT NTT entered into an agreement with the city of Sapporo to cooperate
in the use of ICT to address social issues

Copyright (c) 2015 Nippon Telegraph and Telephone Corporation Financial Results for the Six Months Ended September 30, 2015 -3-
FY2015/2Q Highlights Consolidated Results and Forecasts (U.S. GAAP)
Net income represents net income attributable to NTT, excluding noncontrolling interests. *
(Billions of yen)
OperatingRevenues 5,589.0 +215.3 +4.0% 5,373.7
OperatingExpenses 4,855.5 +72.8 +1.5% 4,782.7
OperatingIncome 733.5 +142.5 +24.1% 590.9
Net Income 377.3 +87.0 +30.0% 290.3
[%]Change
year-on-year
FY2015/2QFY2014/2Q
*
Operating Revenues reached record levels, increasing for the sixth consecutive year Operating Income increased due to cost control measures in the Regional communications and Mobile communications segments
Net Income increased due to an increase in Operating Income as well as a reduction in taxes

Copyright (c) 2015 Nippon Telegraph and Telephone Corporation Financial Results for the Six Months Ended September 30, 2015
: Operating Income reached record levels due to reduced marketing costs, among other factors, despite the continuation of the trend of decreasing Operating Revenues.
: Operating Revenues increased while Operating Income decreased due to the growth in overseas businesses and anticipatory investments in growing segments.
: Both Operating Revenues and Operating Income increased due to growth in revenues from the Smart Life area and DOCOMO Hikari, and a decrease in depreciation costs from efficient investment strategies and initiatives to improve cost efficiency.
: Both Operating Revenues and Operating Income increased as a result of sales growth.
733.5
78.3154.656.447.6
397.8
461.2
27.5
38.2
23.1
27.6
+76.3
(8.8)
+63.4
+10.6 +4.6
+142.5
590.9
5,589.0
1,714.4 1,680.6
950.0 1,097.2
2,173.0 2,215.0
695.6 745.7591.6 567.8
+147.3
+215.3
(23.8)
+50.1
+42.1
(33.9)
5,373.7
-4-
*
*
FY2014 4-9 FY2015 4-9
* *
FY2015 Contributing Factors by Segment Consolidated Results and Forecasts (U.S. GAAP)
Operating Income Operating Revenues
Regional communications business
Mobile Communications business Long distance and international communications business
Data communications business
Other business
(Billions of yen)
*Includes adjustments such as elimination
FY2014 4-9 FY2015 4-9

Copyright (c) 2015 Nippon Telegraph and Telephone Corporation Financial Results for the Six Months Ended September 30, 2015 -5-
Consolidated Forecasts for FY2015 Consolidated Results and Forecasts (U.S. GAAP)
Net income represents net income attributable to NTT, excluding noncontrolling interests. *
*
(yen)
(Billions of yen)
OperatingRevenues 11,400.0 +50.0 5,589.0 49.0%
OperatingExpenses 10,150.0 - 4,855.5 47.8%
OperatingIncome 1,250.0 +50.0 733.5 58.7%
Net Income 655.0 +25.0 377.3 57.6%
EPS 311.00 +13.50
% ProgressCompared to
FY2015Forecasts
FY2015/2QFY2015 Forecasts
Changefrom InitialForecasts
(yen)
Forecasts for both Operating Revenues and Operating Income have been revised upward
due to the growth in overseas businesses, increased revenues from the Smart Life area
and domestic SI operations, and effective cost control efforts.

Copyright (c) 2015 Nippon Telegraph and Telephone Corporation Financial Results for the Six Months Ended September 30, 2015
: The forecast for Operating Income has been revised upward due to the progress in Hikari Collaboration and cost control efforts. The forecast for Operating Revenues remains unchanged.
: The forecast for Operating Revenues has been revised upward based on growth in overseas businesses. The forecast for Operating Income remains unchanged partly due to the impact of anticipatory investments.
: The forecast for Operating Income has been revised upward due to accelerated growth in the Smart Life area and further progress in cost efficiency strategies. The forecast for Operating Revenues has been revised downward due to the re-evaluation of NTT’s device sales plan.
:The forecasts for both Operating Revenues and Operating Income remain unchanged.
1,250.0
168.9 250.0113.6
100.0
635.8705.0
86.4
110.067.5
50.0
+81.1
(13.6)
+69.2
+23.6 (17.5)
+165.4 1,084.6
11,400.0
3,505.5 3,400.0
1,998.6 2,280.0
4,383.4 4,490.0
1,511.0 1,540.01,272.2 1,270.0
+281.4
+304.7 (2.2)
+29.0
+106.6
(105.5)
11,095.3
-6-
FY2015 Forecast Summary by Segment Consolidated Results and Forecasts (U.S. GAAP)
*
*
FY2014 FY2015E
* * Operating Income Operating Revenues
Regional communications business
Mobile Communications business Long distance and international communications business
Data communications business
Other business
(Billions of yen)
*Includes adjustments such as elimination
FY2014 FY2015E

Progress of Broadband Services

Copyright (c) 2015 Nippon Telegraph and Telephone Corporation Financial Results for the Six Months Ended September 30, 2015
2014.6 2014.9 2014.12 2015.3 2015.6 2015.9 2016.3E
(Thousands)
4-6 7-9 10-12 1-3 4-6 7-9 4-9269 136 162 99 235 85 320 665 600
Number ofopened
connections879 683 684 720 810 559 1,369 2,966 2,750
(85) (65) (58) (56) (58) (37) (95) (264) (218)
251 199 204 198 135 50 185 852 0
FY2015E
FLET’S Hikari
FLET’S ADSL
Hikari Denwa
FY2014 FY2015FY2014
18,319 18,455 18,617 18,716 18,951 19,0361,398 1,333 1,275 1,219 1,162 1,125
19,717 19,788 19,892 19,935 20,113 20,161
16,507 16,705 16,910 17,108 17,243 17,293
10,000
12,000
14,000
16,000
18,000
20,000
22,000
19,316
1,001
20,317
17,108
Number of subscribers
-7-
Number of Subscribers for Fixed Broadband Services Progress of Broadband Services
FLET’S ADSL
Hikari Denwa
Changes from the preceding quarter
*
*
1
3
* 2 1 *
5 * 4 *
[270] [2,348]
FLET’S Hikari (including Hikari Collaboration Model)
*1 Number of FLET’S Hikari (including Hikari Collaboration Model) subscribers includes B FLET’S, FLET’S Hikari Next, FLET’S Hikari Light and FLET’S Hikari WiFi Access provided by NTT East, B FLET’S, FLET’S Hikari Premium, FLET’S Hikari Mytown, FLET’S Hikari Next, FLET’S Hikari Light and FLET’S Hikari WiFi Access provided by NTT West, and wholesale services (Hikari Collaboration Model) provided by both NTT East and NTT West.
*2 Figures in [ ] represent FTTH access services which NTT East and NTT West provide to service providers. *3 Number of opened connections excludes openings as a result of relocations. *4 Numbers for Hikari Denwa include wholesale services provided to service providers by NTT East and NTT West. *5 Numbers of Hikari Denwa subscribers are presented in thousands of channels.
(Thousands)
[1,322] [6,250]

Copyright (c) 2015 Nippon Telegraph and Telephone Corporation Financial Results for the Six Months Ended September 30, 2015
2014.6 2014.9 2014.12 2015.3 2015.6 2015.9 2016.3E
(Thousands)
4-6 7-9 10-12 1-3 4-6 7-9 4-9
461 729 979 1,322 936 962 1,898 3,490 3,800
FY2014FY2014 FY2015E
LTE("Xi")+FOMA
FY2015
39,523 38,080 36,976 35,851 34,923 33,989
24,043 26,215 28,298 30,744 32,609 34,504
63,566 64,295 65,274 66,595 67,532 68,494
0
10,000
20,000
30,000
40,000
50,000
60,000
70,000
37,800
32,600
70,400
-8-
Number of Subscribers for Mobile Broadband Services Progress of Broadband Services
Number of subscribers
Changes from the preceding quarter
* (Thousands)
*
FOMA
LTE(“Xi”)
The number of FOMA subscribers includes communications module service subscribers

Copyright (c) 2015 Nippon Telegraph and Telephone Corporation Financial Results for the Six Months Ended September 30, 2015
2014.6 2014.9 2014.12 2015.3 2015.6 2015.9 2016.3E
2,877 2,927 2,971 3,014 3,038 3,043
1,209 1,256 1,304 1,345 1,378 1,398
4,086 4,183 4,275 4,359 4,416 4,442
0
1,000
2,000
3,000
4,000
5,000
3,150
1,372
4,522
-9-
(Thousands)
Number of Subscribers for Video Services Progress of Broadband Services
* 1
* 2
FLET'S TV
Hikari TV * 1 * 2
“FLET’S TV” requires a subscription to “FLET’S TV Transmission Services” provided by NTT East and NTT West, and a subscription to SKY Perfect JSAT’s “SKY Perfect JSAT Facility Use Services” broadcast service.
Numbers of subscribers to “FLET’S TV Transmission Services” include wholesale services provided to service providers by NTT East and NTT West.

Financial Information

Copyright (c) 2015 Nippon Telegraph and Telephone Corporation Financial Results for the Six Months Ended September 30, 2015
SI revenues and sales of telecommunications
equipment
-10-
4,782.7 4,855.5
5,373.7 5,589.0 101.5
186.2
Details of Consolidated Statement of Income
FY2014/2Q FY2015/2Q
FY2014/2Q FY2015/2Q
Operating Expenses
Operating Revenues [ year-on-year:+215.3]
[year-on-year:+72.8]
Voice related services revenues
IP/packet communications
services revenues
Other revenues
(Billions of yen)
Systems Integration : +207.7 Telecommunications equipment : (21.5)
Fixed voice : (62.8) Mobile voice : (38.7)
Personnel expenses Depreciation expenses and loss on
disposal of assets
Other expenses
36.9 93.7
33.8 88.1 52.5
3.3 Expenses for purchase of goods and services and other expenses
Copyright (c) 2015 Nippon Telegraph and Telephone Corporation Financial Results for the Six Months Ended September 30, 2015 -11-
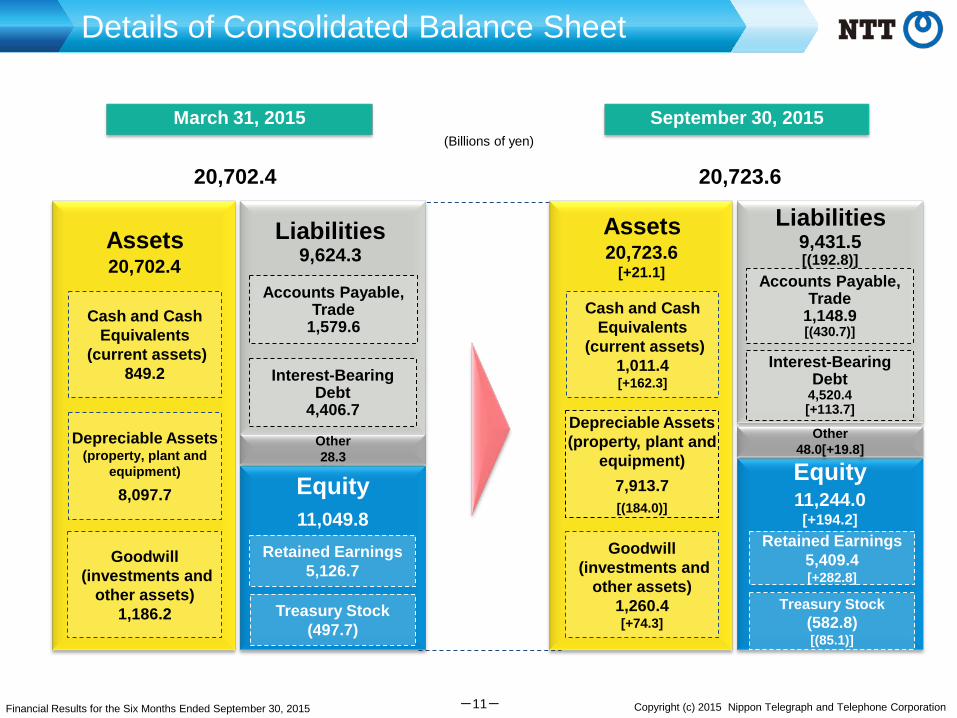
March 31, 2015 (Billions of yen)
20,723.6 20,702.4
Treasury Stock (582.8) [(85.1)]
Interest-Bearing Debt
4,520.4 [+113.7]
20,723.6 [+21.1]
Assets
Equity 11,244.0
[+194.2]
9,431.5 [(192.8)]
Liabilities
Depreciable Assets (property, plant and
equipment) 7,913.7 [(184.0)]
Other 48.0[+19.8]
Treasury Stock (497.7)
Interest-Bearing Debt
4,406.7
20,702.4 Assets
Depreciable Assets (property, plant and
equipment)
8,097.7
9,624.3 Liabilities
Goodwill (investments and
other assets) 1,186.2
Equity 11,049.8
Other 28.3
Details of Consolidated Balance Sheet
September 30, 2015
Cash and Cash Equivalents
(current assets) 849.2
Accounts Payable, Trade
1,579.6
Retained Earnings 5,126.7
Goodwill (investments and
other assets) 1,260.4 [+74.3]
Cash and Cash Equivalents
(current assets) 1,011.4 [+162.3]
Accounts Payable, Trade
1,148.9 [(430.7)]
Retained Earnings 5,409.4 [+282.8]

Copyright (c) 2015 Nippon Telegraph and Telephone Corporation Financial Results for the Six Months Ended September 30, 2015 -12-
Details of Consolidated Cash Flows
Cash flows from operating activities
(A)
Cash flows from investing activities
(B)
Cash flows from financing activities
FCF (A) + (B)
(Billions of yen)
Increase/Decrease from the same period of the previous fiscal year
(54.0)
1,101.4
(951.1)
150.2
(137.0)
1,269.4
(919.5)
349.9
(191.0)
(2,000)
(1,000)
0
1,000
2,000
FY2014
FY2015
+168.0
+31.7
+199.7

Copyright (c) 2015 Nippon Telegraph and Telephone Corporation Financial Results for the Six Months Ended September 30, 2015
301.8 292.5219.5
161.3128.7
102.7
158.4140.0
121.4
62.9
49.0
55.0
72.2
58.1
58.2
31.6
58.1
65.4Other
NTT DATA(Consolidated)NTTCommunicationsNTT West
NTT East
NTT DOCOMO(Consolidated)
-13-
1,795.7 [1,892.8] 1,702.9
[1,817.5] 1,630.0 [1,730.0]
FY2013/2Q FY2013
FY2014/2Q FY2014
FY2015/2Q FY2015E
* Figures in [ ] include investments related to real estate and solar power generation operations.
(Billions of yen)
Details of Capital Investment
788.2 [824.6] 726.4
[753.5] 622.2 [645.6]
1,660.0 [1,760.0] (30.0)
FY2015E (Initial Forecast)

Copyright (c) 2015 Nippon Telegraph and Telephone Corporation Financial Results for the Six Months Ended September 30, 2015 -14-
Toward Efficient and Sustainable Operations
Streamlining Capital Investment At least 200 billion yen by FY2017 (Domestic network business, compared to FY2014)
Cost reductions At least 600 billion yen by FY2017 (in fixed-line/mobile networks, compared to FY2014)
Effective Usage of Assets/facilities
Optimization of Specifications for Hardware and Software
BPR
Cross-utilization of services and functions
Train engineers to handle various technologies onsite Optimize service quality level
Improve efficiency of procurement and development through simplified specification
Improve efficiency of installation and operation
Improvement of ROA through streamlining and reallocating facilities
・Commoditization and integration of hardware
・Remote control
Optimize Domestic Network Businesses Improve effective usage of network
infrastructure
* SDN:Software Defined Networking, a network in which functions and configurations can be defined and controlled using software. NFV:Network Functions Virtualization, the virtualization of network functions using software.
New Technologies (SDN/NFV*, AI, etc.)
Shift to integrated platform and streamlining of IT systems
Copyright (c) 2015 Nippon Telegraph and Telephone Corporation Financial Results for the Six Months Ended September 30, 2015 -15-
Shareholder Returns
381.7
150.0
406.5
200.0 338.1
93.6 94.4
70 80 85
55
90 100
60 60
27.5% 32.3% 31.2% 38.2%
37.2% 33.4% 38.0%
32.2% ● ● ●
● ● ●
●
● 45
19.5% ●
Share buybacks (billions of yen)
FY2009 FY2010 FY2011 FY2012 FY2013 FY2014 FY2008 FY2015E FY2007
● Payout ratio (yen) Dividends per Share Note: Dividend amounts have been retroactively adjusted to reflect the two-for-one stock split of NTT’s common stock carried out on July 1, 2015.
FY2009 FY2010 FY2011 FY2012 FY2013 FY2014 FY2008 FY2015E FY2007