Financial Results for FY2018 1H (Apr.-Sep.) - mhi.com · Sep. 30, 2018 : 497.5 billion yen (Aug. 3,...
25
© 2018 MITSUBISHI HEAVY INDUSTRIES, LTD. All Rights Reserved. October 31, 2018 Financial Results for FY2018 1H (Apr.-Sep.)
Transcript of Financial Results for FY2018 1H (Apr.-Sep.) - mhi.com · Sep. 30, 2018 : 497.5 billion yen (Aug. 3,...
© 2018 MITSUBISHI HEAVY INDUSTRIES, LTD. All Rights Reserved.
October 31, 2018
Financial Results for FY2018 1H (Apr.-Sep.)
© 2018 MITSUBISHI HEAVY INDUSTRIES, LTD. All Rights Reserved.
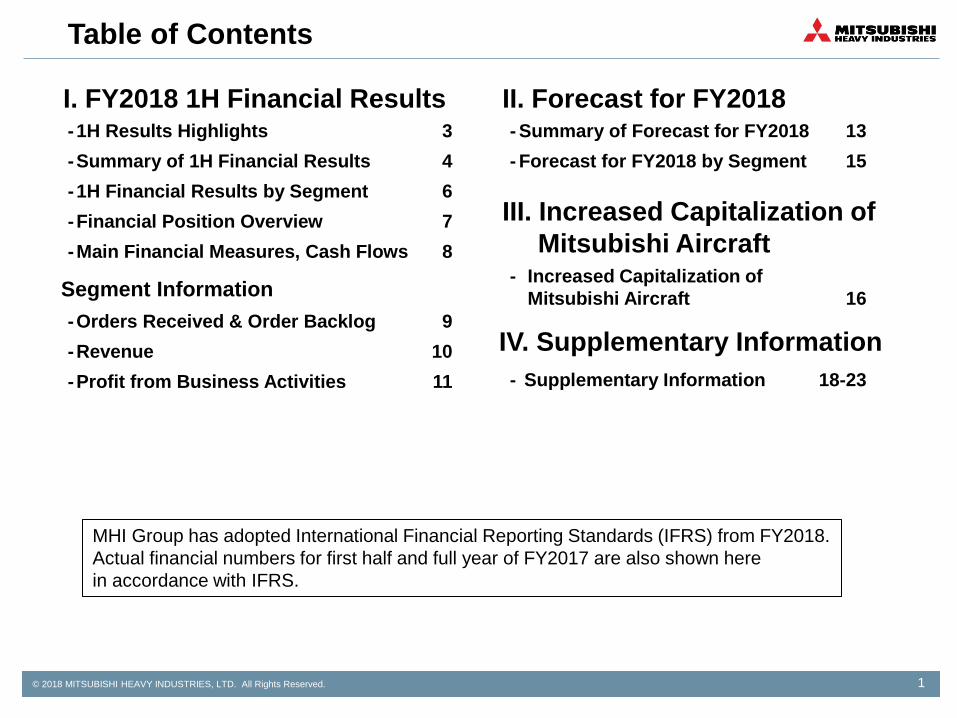
Table of Contents
1
I. FY2018 1H Financial Results - 1H Results Highlights 3 - Summary of 1H Financial Results 4 - 1H Financial Results by Segment 6 - Financial Position Overview 7 - Main Financial Measures, Cash Flows 8
Segment Information - Orders Received & Order Backlog 9 - Revenue 10 - Profit from Business Activities 11 - Supplementary Information 18-23
IV. Supplementary Information
II. Forecast for FY2018 - Summary of Forecast for FY2018 13 - Forecast for FY2018 by Segment 15
MHI Group has adopted International Financial Reporting Standards (IFRS) from FY2018. Actual financial numbers for first half and full year of FY2017 are also shown here in accordance with IFRS.
III. Increased Capitalization of Mitsubishi Aircraft
- Increased Capitalization of Mitsubishi Aircraft 16
I. FY2018 1H Financial Results
2
© 2018 MITSUBISHI HEAVY INDUSTRIES, LTD. All Rights Reserved. 3
1H Results Highlights
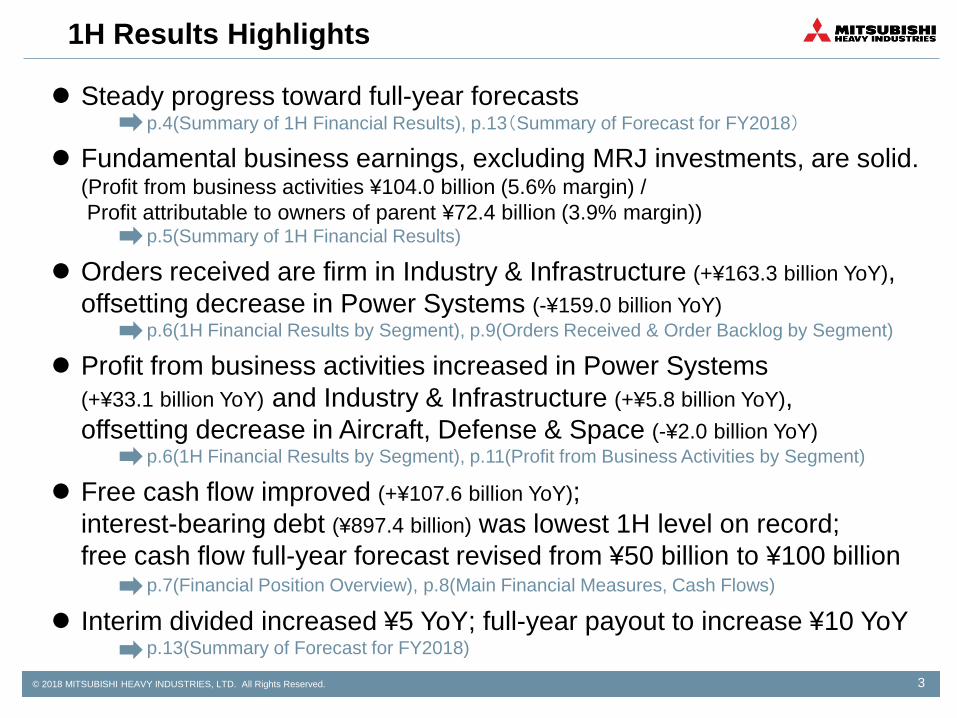
Steady progress toward full-year forecasts p.4(Summary of 1H Financial Results), p.13(Summary of Forecast for FY2018)
Fundamental business earnings, excluding MRJ investments, are solid. (Profit from business activities ¥104.0 billion (5.6% margin) / Profit attributable to owners of parent ¥72.4 billion (3.9% margin)) p.5(Summary of 1H Financial Results)
Orders received are firm in Industry & Infrastructure (+¥163.3 billion YoY), offsetting decrease in Power Systems (-¥159.0 billion YoY) p.6(1H Financial Results by Segment), p.9(Orders Received & Order Backlog by Segment)
Profit from business activities increased in Power Systems (+¥33.1 billion YoY) and Industry & Infrastructure (+¥5.8 billion YoY), offsetting decrease in Aircraft, Defense & Space (-¥2.0 billion YoY) p.6(1H Financial Results by Segment), p.11(Profit from Business Activities by Segment)
Free cash flow improved (+¥107.6 billion YoY); interest-bearing debt (¥897.4 billion) was lowest 1H level on record; free cash flow full-year forecast revised from ¥50 billion to ¥100 billion p.7(Financial Position Overview), p.8(Main Financial Measures, Cash Flows)
Interim divided increased ¥5 YoY; full-year payout to increase ¥10 YoY p.13(Summary of Forecast for FY2018)
© 2018 MITSUBISHI HEAVY INDUSTRIES, LTD. All Rights Reserved.
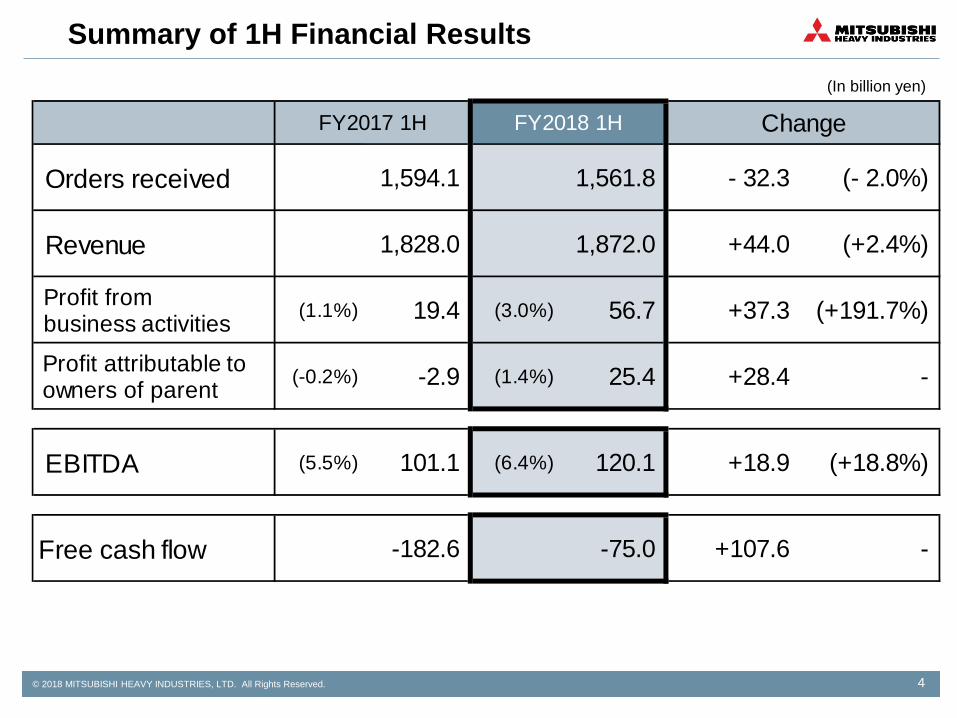
Orders received 1,594.1 1,561.8 - 32.3 (- 2.0%)
Revenue 1,828.0 1,872.0 +44.0 (+2.4%)
(1.1%) 19.4 (3.0%) 56.7 +37.3 (+191.7%)
(-0.2%) -2.9 (1.4%) 25.4 +28.4 -
EBITDA (5.5%) 101.1 (6.4%) 120.1 +18.9 (+18.8%)
Free cash flow -182.6 -75.0 +107.6 -
ChangeFY2017 1H FY2018 1H
Profit attributable to owners of parent
Profit from business activities
(In billion yen)
4
Summary of 1H Financial Results
© 2018 MITSUBISHI HEAVY INDUSTRIES, LTD. All Rights Reserved. 5
Summary of 1H Financial Results
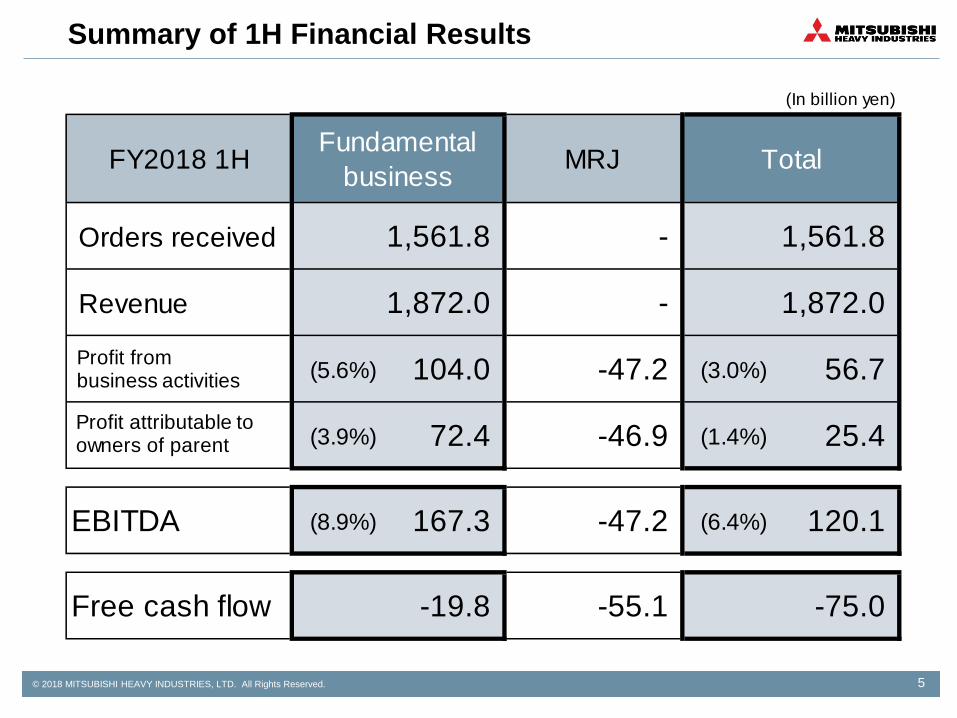
(In billion yen)
FY2018 1H MRJ
Orders received 1,561.8 - 1,561.8
Revenue 1,872.0 - 1,872.0
(5.6%) 104.0 -47.2 (3.0%) 56.7
(3.9%) 72.4 -46.9 (1.4%) 25.4
EBITDA (8.9%) 167.3 -47.2 (6.4%) 120.1
Free cash flow -19.8 -55.1 -75.0
TotalFundamentalbusiness
Profit attributable to owners of parent
Profit from business activities
© 2018 MITSUBISHI HEAVY INDUSTRIES, LTD. All Rights Reserved. 6
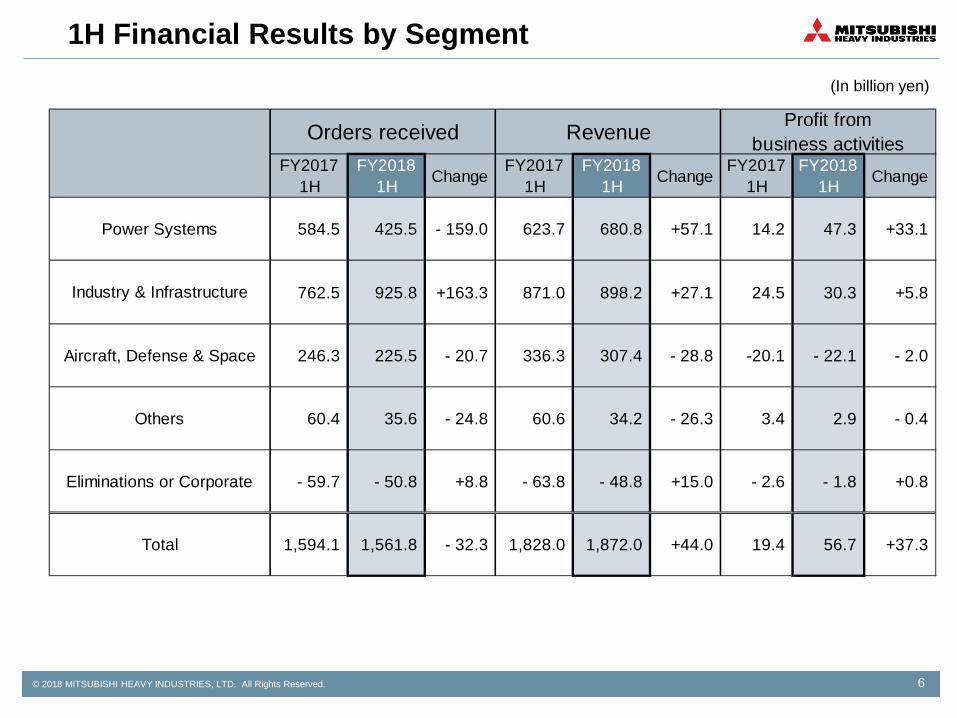
1H Financial Results by Segment (In billion yen)
FY20171H
FY20181H Change FY2017
1HFY2018
1H Change FY20171H
FY20181H Change
584.5 425.5 - 159.0 623.7 680.8 +57.1 14.2 47.3 +33.1
762.5 925.8 +163.3 871.0 898.2 +27.1 24.5 30.3 +5.8
246.3 225.5 - 20.7 336.3 307.4 - 28.8 -20.1 - 22.1 - 2.0
60.4 35.6 - 24.8 60.6 34.2 - 26.3 3.4 2.9 - 0.4
- 59.7 - 50.8 +8.8 - 63.8 - 48.8 +15.0 - 2.6 - 1.8 +0.8
1,594.1 1,561.8 - 32.3 1,828.0 1,872.0 +44.0 19.4 56.7 +37.3 Total
Orders received Revenue Profit frombusiness activities
Industry & Infrastructure
Power Systems
Aircraft, Defense & Space
Others
Eliminations or Corporate
© 2018 MITSUBISHI HEAVY INDUSTRIES, LTD. All Rights Reserved. 7
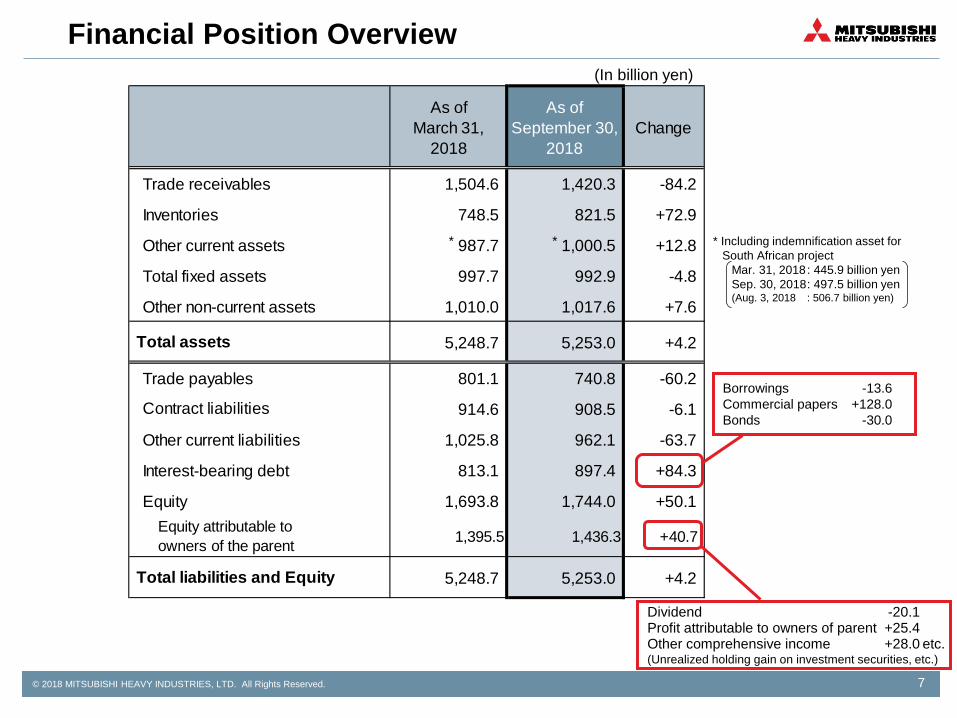
Financial Position Overview (In billion yen)
As ofMarch 31,
2018
As ofSeptember 30,
2018Change
Trade receivables 1,504.6 1,420.3 -84.2
Inventories 748.5 821.5 +72.9
Other current assets 987.7 1,000.5 +12.8
Total fixed assets 997.7 992.9 -4.8
Other non-current assets 1,010.0 1,017.6 +7.6
Total assets 5,248.7 5,253.0 +4.2
Trade payables 801.1 740.8 -60.2
914.6 908.5 -6.1
Other current liabilities 1,025.8 962.1 -63.7
Interest-bearing debt 813.1 897.4 +84.3
Equity 1,693.8 1,744.0 +50.1
1,395.5 1,436.3 +40.7
Total liabilities and Equity 5,248.7 5,253.0 +4.2
Contract liabilities
Equity attributable to owners of the parent
* Including indemnification asset for South African project
Mar. 31, 2018 : 445.9 billion yen Sep. 30, 2018 : 497.5 billion yen (Aug. 3, 2018 : 506.7 billion yen)
*
Borrowings -13.6 Commercial papers +128.0 Bonds -30.0
Dividend -20.1 Profit attributable to owners of parent +25.4 Other comprehensive income +28.0 etc. (Unrealized holding gain on investment securities, etc.)
*
© 2018 MITSUBISHI HEAVY INDUSTRIES, LTD. All Rights Reserved.
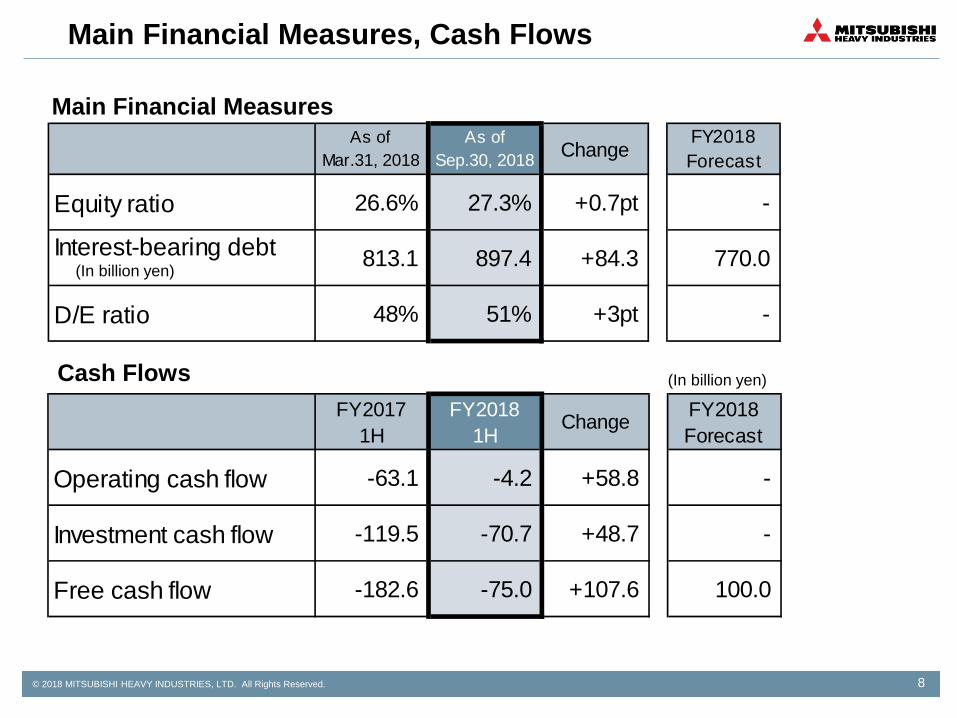
Main Financial Measures, Cash Flows
8
As ofMar.31, 2018
As ofSep.30, 2018 Change
FY2018Forecast
Equity ratio 26.6% 27.3% +0.7pt -
Interest-bearing debt 813.1 897.4 +84.3 770.0
D/E ratio 48% 51% +3pt -
FY20171H
FY20181H
Change FY2018Forecast
Operating cash flow -63.1 -4.2 +58.8 -
Investment cash flow -119.5 -70.7 +48.7 -
Free cash flow -182.6 -75.0 +107.6 100.0
Cash Flows
Main Financial Measures
(In billion yen)
(In billion yen)
© 2018 MITSUBISHI HEAVY INDUSTRIES, LTD. All Rights Reserved.
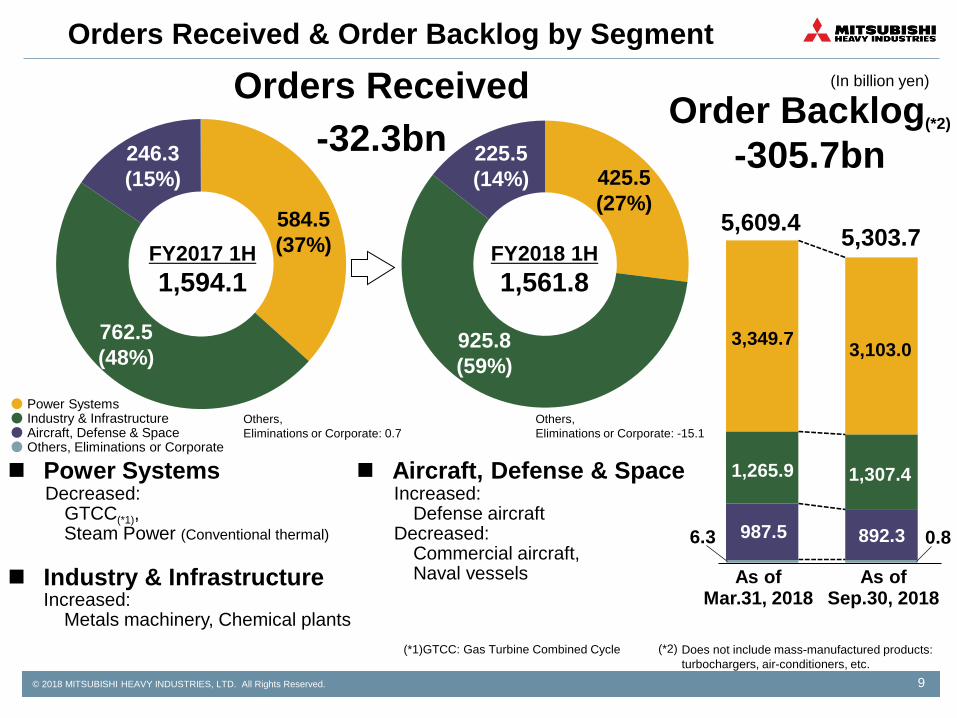
Orders Received & Order Backlog by Segment
● Power Systems ● Industry & Infrastructure ● Aircraft, Defense & Space ● Others, Eliminations or Corporate
FY2017 1H 1,594.1
(In billion yen)
246.3 (15%)
762.5 (48%)
584.5 (37%)
987.5
1,265.9
6.3
3,349.7
Orders Received -32.3bn
Order Backlog(*2)
-305.7bn
Does not include mass-manufactured products: turbochargers, air-conditioners, etc.
As of Sep.30, 2018
5,609.4
892.3
1,307.4
0.8
3,103.0
5,303.7 FY2018 1H 1,561.8
225.5 (14%)
925.8 (59%)
Power Systems Decreased:
GTCC(*1), Steam Power (Conventional thermal)
Aircraft, Defense & Space Increased:
Defense aircraft Decreased:
Commercial aircraft, Naval vessels Industry & Infrastructure
Increased: Metals machinery, Chemical plants
425.5 (27%)
(*2)
As of Mar.31, 2018
(*1)GTCC: Gas Turbine Combined Cycle
9
Others, Eliminations or Corporate: -15.1
Others, Eliminations or Corporate: 0.7
© 2018 MITSUBISHI HEAVY INDUSTRIES, LTD. All Rights Reserved.
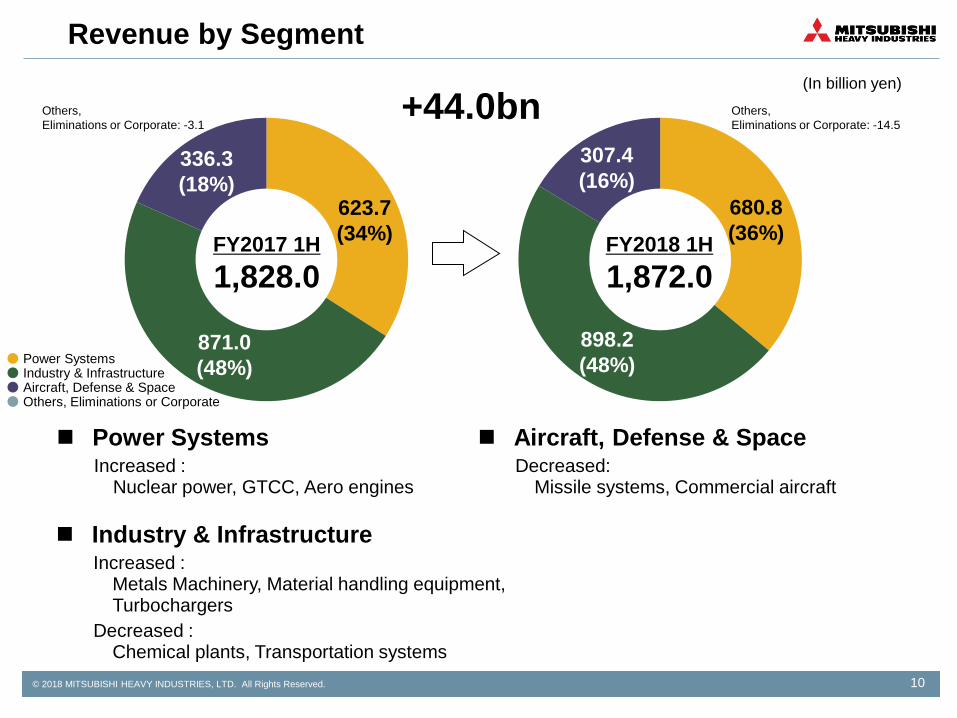
Revenue by Segment
10
(In billion yen)
FY2017 1H 1,828.0
336.3 (18%)
871.0 (48%)
623.7 (34%)
+44.0bn
● Power Systems ● Industry & Infrastructure ● Aircraft, Defense & Space ● Others, Eliminations or Corporate
FY2018 1H 1,872.0
307.4 (16%)
898.2 (48%)
Others, Eliminations or Corporate: -14.5
680.8 (36%)
Power Systems Increased :
Nuclear power, GTCC, Aero engines
Aircraft, Defense & Space Decreased:
Missile systems, Commercial aircraft
Industry & Infrastructure Increased :
Metals Machinery, Material handling equipment, Turbochargers
Decreased : Chemical plants, Transportation systems
Others, Eliminations or Corporate: -3.1
© 2018 MITSUBISHI HEAVY INDUSTRIES, LTD. All Rights Reserved.
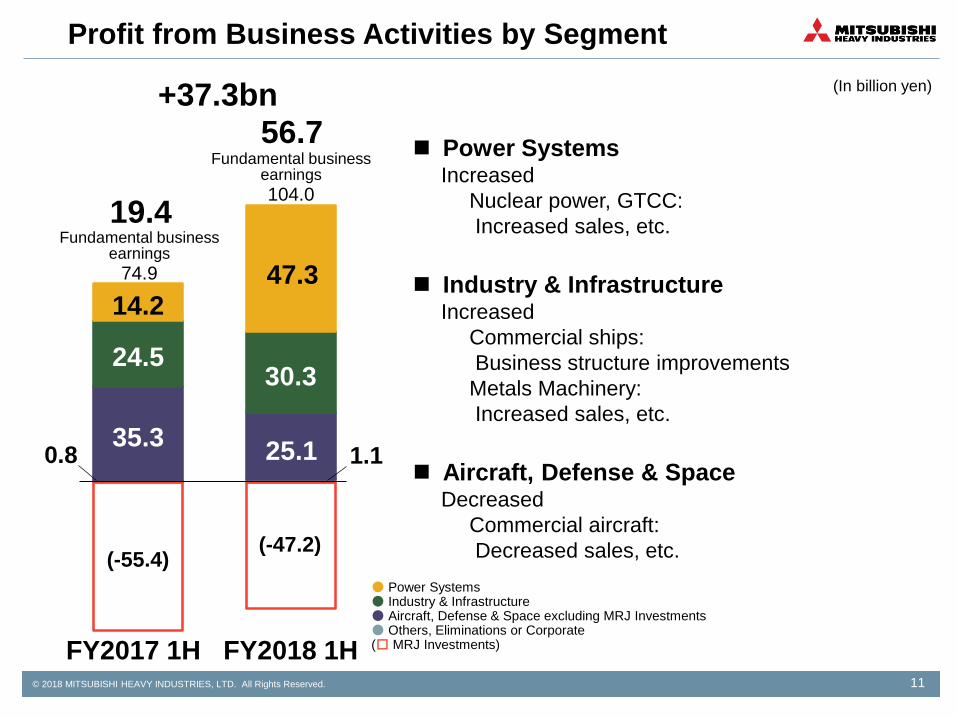
Profit from Business Activities by Segment
11
FY2017 1H FY2018 1H
19.4
(In billion yen)
(-55.4)
+37.3bn
24.5
35.3
Power Systems Increased
Nuclear power, GTCC: Increased sales, etc.
Industry & Infrastructure
Increased Commercial ships: Business structure improvements Metals Machinery: Increased sales, etc.
Aircraft, Defense & Space
Decreased Commercial aircraft: Decreased sales, etc.
56.7
25.1
47.3
30.3
1.1
● Power Systems ● Industry & Infrastructure ● Aircraft, Defense & Space excluding MRJ Investments ● Others, Eliminations or Corporate (□ MRJ Investments)
0.8
(-47.2)
Fundamental business earnings 104.0
Fundamental business earnings
74.9
14.2
II. Forecast for FY2018
12
Forecasts regarding future performance in these materials are based on judgments made in accordance with information available at the time this presentation was prepared. As such, those projections involve risks and insecurity. For this reason, investors are recommended not to depend solely on these projections for making investment decisions. It is possible that actual results may vary significantly from these projections due to a number of factors. These include, but are not limited to, economic trends affecting the Company’s operating environment, currency movements of the yen value to the U.S. dollar and other foreign currencies, and trends of stock markets in Japan. Also, the results projected here should not be construed in any way as being guaranteed by the company.
© 2018 MITSUBISHI HEAVY INDUSTRIES, LTD. All Rights Reserved.
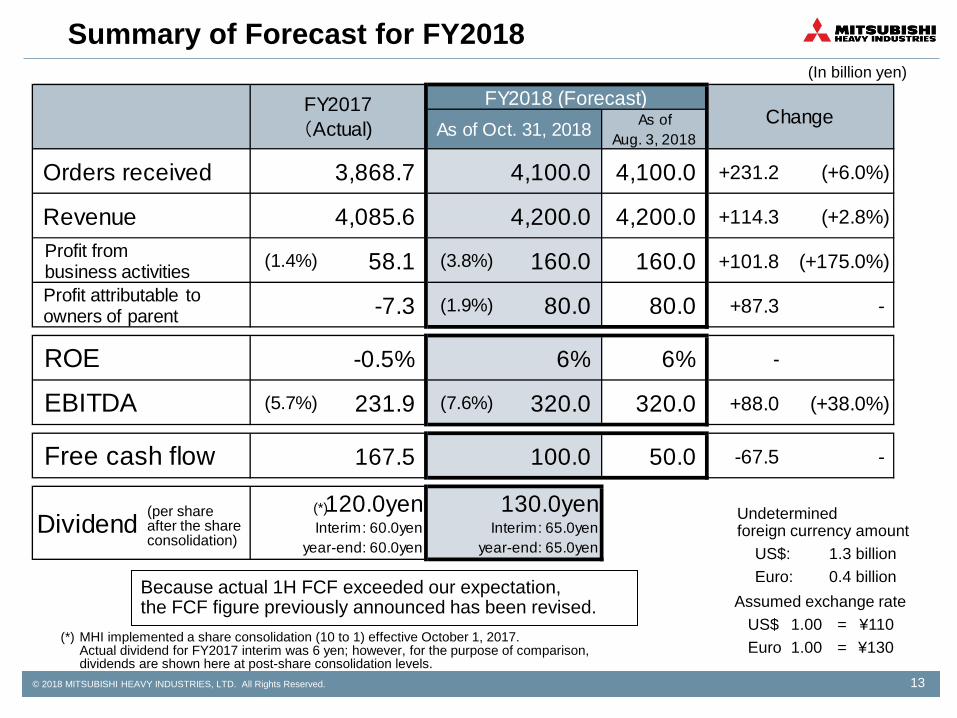
As ofAug. 3, 2018
Orders received 3,868.7 4,100.0 4,100.0 +231.2 (+6.0%)
Revenue 4,085.6 4,200.0 4,200.0 +114.3 (+2.8%)
(1.4%) 58.1 (3.8%) 160.0 160.0 +101.8 (+175.0%)
-7.3 (1.9%) 80.0 80.0 +87.3 -
ROE -0.5% 6% 6% -
EBITDA (5.7%) 231.9 (7.6%) 320.0 320.0 +88.0 (+38.0%)
Free cash flow 167.5 100.0 50.0 -67.5 -
Dividend120.0yen
Interim: 60.0yenyear-end: 60.0yen
FY2017(Actual) Change
130.0yenInterim: 65.0yen
year-end: 65.0yen
FY2018 (Forecast)As of Oct. 31, 2018
Profit attributable toowners of parent
Profit from business activities
13
Summary of Forecast for FY2018
Assumed exchange rate US$ 1.00 = ¥110 Euro 1.00 = ¥130
Undetermined foreign currency amount US$: 1.3 billion Euro: 0.4 billion
(In billion yen)
(*) MHI implemented a share consolidation (10 to 1) effective October 1, 2017. Actual dividend for FY2017 interim was 6 yen; however, for the purpose of comparison, dividends are shown here at post-share consolidation levels.
(*) (per share after the share consolidation)
Because actual 1H FCF exceeded our expectation, the FCF figure previously announced has been revised.
© 2018 MITSUBISHI HEAVY INDUSTRIES, LTD. All Rights Reserved. 14
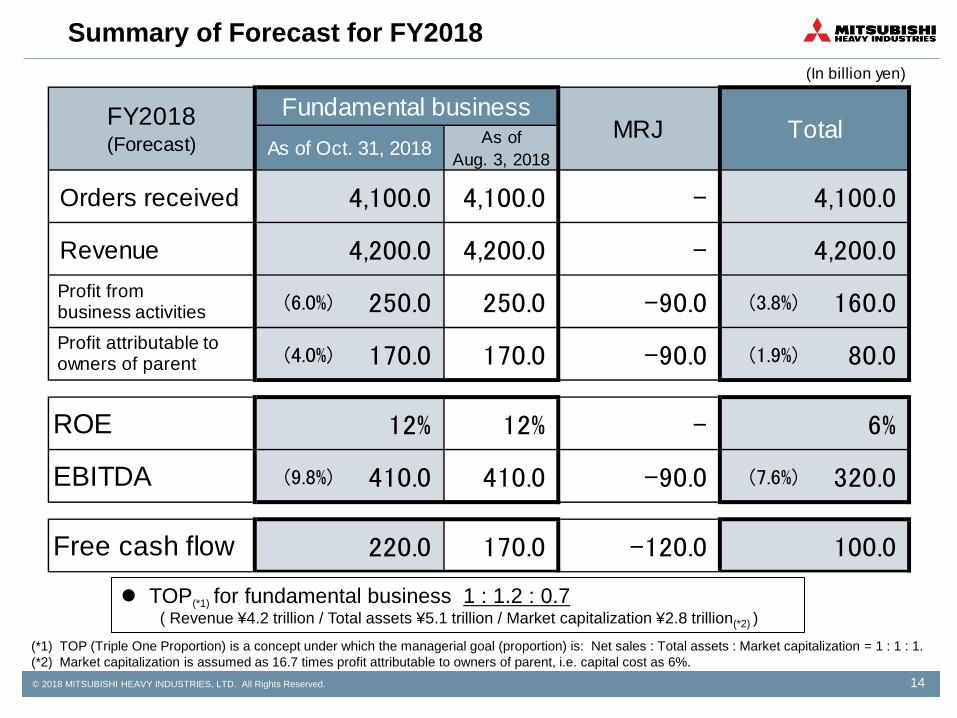
Summary of Forecast for FY2018 (In billion yen)
As ofAug. 3, 2018
Orders received 4,100.0 4,100.0 - 4,100.0
Revenue 4,200.0 4,200.0 - 4,200.0
(6.0%) 250.0 250.0 -90.0 (3.8%) 160.0
(4.0%) 170.0 170.0 -90.0 (1.9%) 80.0
ROE 12% 12% - 6%
EBITDA (9.8%) 410.0 410.0 -90.0 (7.6%) 320.0
Free cash flow 220.0 170.0 -120.0 100.0
FY2018(Forecast)
Fundamental businessAs of Oct. 31, 2018
MRJ Total
Profit attributable to owners of parent
Profit from business activities
TOP(*1) for fundamental business 1 : 1.2 : 0.7 ( Revenue ¥4.2 trillion / Total assets ¥5.1 trillion / Market capitalization ¥2.8 trillion(*2) )
(*1) TOP (Triple One Proportion) is a concept under which the managerial goal (proportion) is: Net sales : Total assets : Market capitalization = 1 : 1 : 1. (*2) Market capitalization is assumed as 16.7 times profit attributable to owners of parent, i.e. capital cost as 6%.
© 2018 MITSUBISHI HEAVY INDUSTRIES, LTD. All Rights Reserved. 15
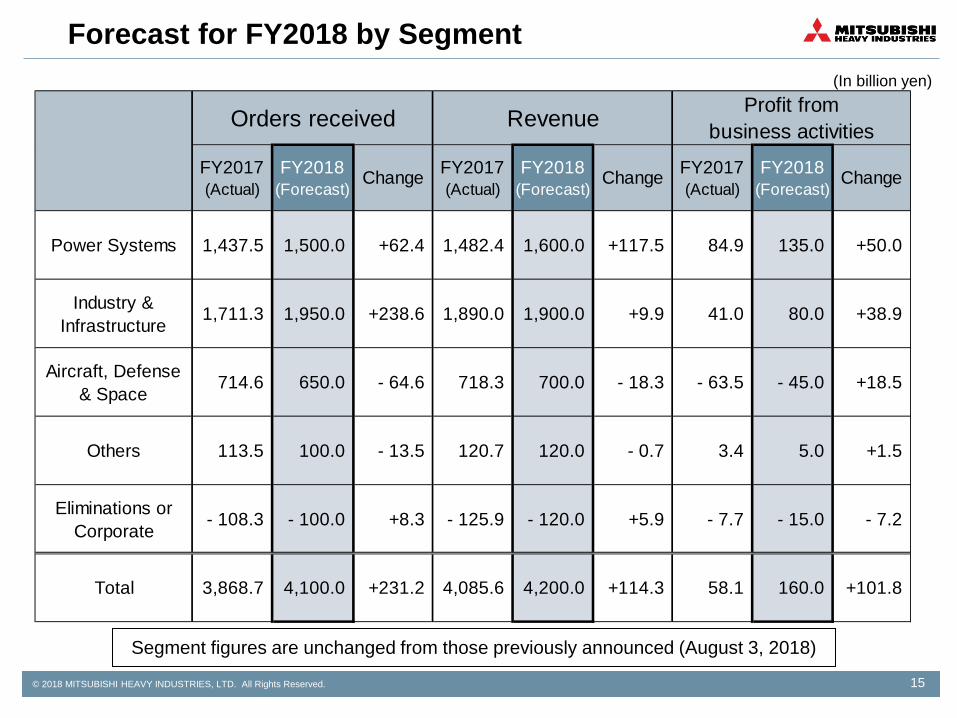
Forecast for FY2018 by Segment (In billion yen)
Power Systems 1,437.5 1,500.0 +62.4 1,482.4 1,600.0 +117.5 84.9 135.0 +50.0
Industry &Infrastructure 1,711.3 1,950.0 +238.6 1,890.0 1,900.0 +9.9 41.0 80.0 +38.9
Aircraft, Defense& Space 714.6 650.0 - 64.6 718.3 700.0 - 18.3 - 63.5 - 45.0 +18.5
Others 113.5 100.0 - 13.5 120.7 120.0 - 0.7 3.4 5.0 +1.5
Eliminations orCorporate - 108.3 - 100.0 +8.3 - 125.9 - 120.0 +5.9 - 7.7 - 15.0 - 7.2
Total 3,868.7 4,100.0 +231.2 4,085.6 4,200.0 +114.3 58.1 160.0 +101.8
FY2017(Actual)
FY2017(Actual)
FY2017(Actual)
Change Change ChangeFY2018(Forecast)
FY2018(Forecast)
FY2018(Forecast)
Orders received Revenue Profit frombusiness activities
Segment figures are unchanged from those previously announced (August 3, 2018)
III. Increased capitalization of Mitsubishi Aircraft
16
© 2018 MITSUBISHI HEAVY INDUSTRIES, LTD. All Rights Reserved.
Increased Capitalization of Mitsubishi Aircraft
17
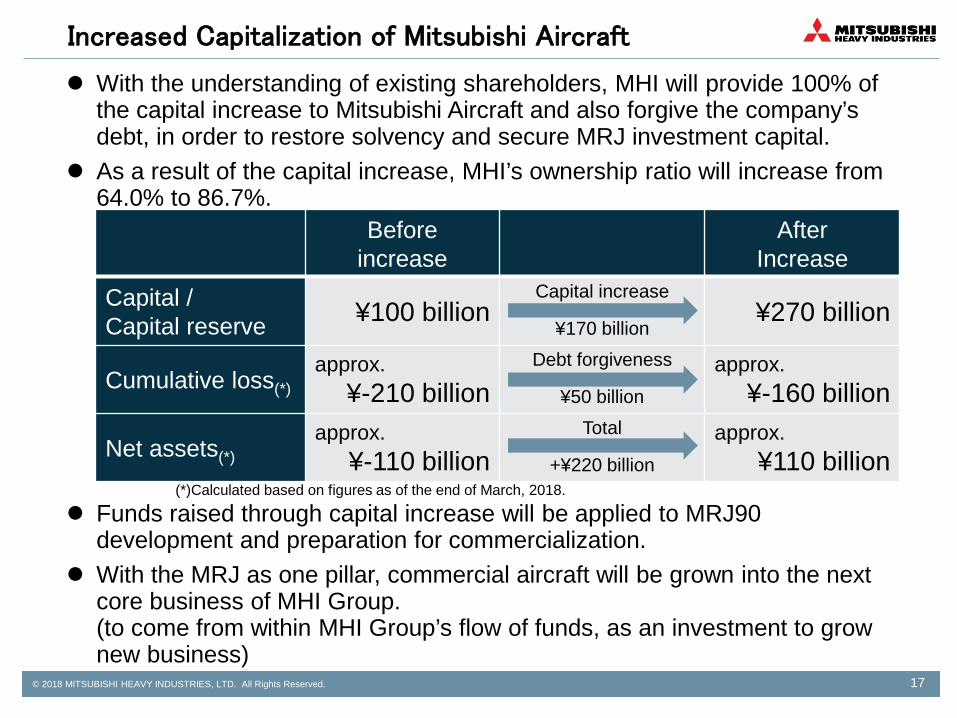
With the understanding of existing shareholders, MHI will provide 100% of the capital increase to Mitsubishi Aircraft and also forgive the company’s debt, in order to restore solvency and secure MRJ investment capital.
As a result of the capital increase, MHI’s ownership ratio will increase from 64.0% to 86.7%.
Funds raised through capital increase will be applied to MRJ90 development and preparation for commercialization.
With the MRJ as one pillar, commercial aircraft will be grown into the next core business of MHI Group. (to come from within MHI Group’s flow of funds, as an investment to grow new business)
Before increase
After Increase
Capital / Capital reserve ¥100 billion
Capital increase
¥170 billion ¥270 billion
Cumulative loss(*) approx.
¥-210 billion Debt forgiveness
¥50 billion
approx. ¥-160 billion
Net assets(*) approx.
¥-110 billion Total
+¥220 billion
approx. ¥110 billion
(*)Calculated based on figures as of the end of March, 2018.
IV. Supplementary Information
18
© 2018 MITSUBISHI HEAVY INDUSTRIES, LTD. All Rights Reserved.
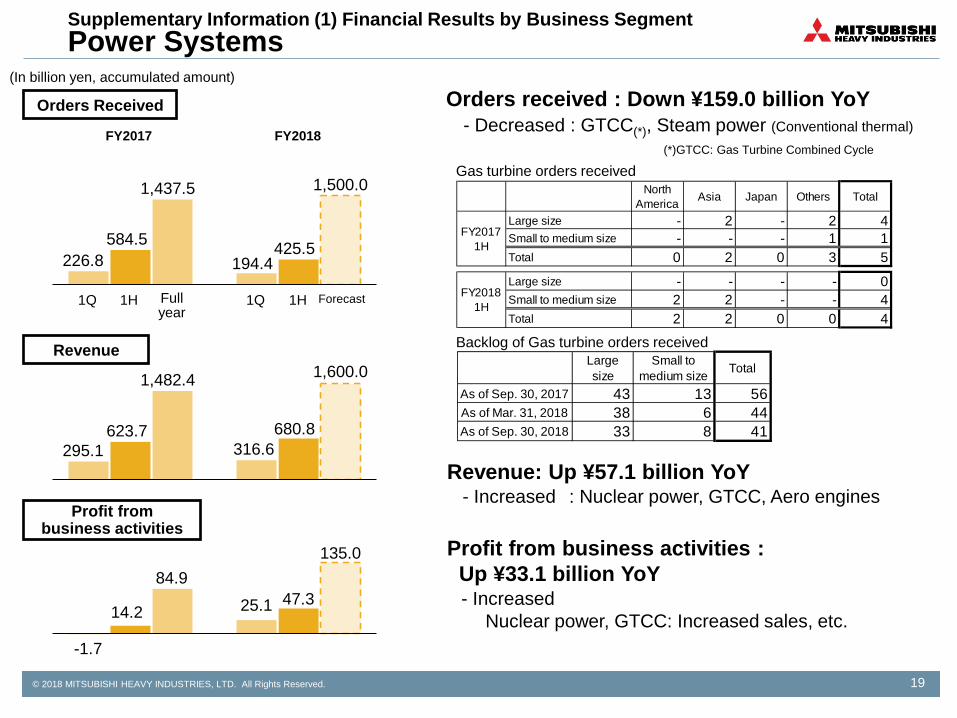
Largesize
Small tomedium size Total
As of Sep. 30, 2017 43 13 56As of Mar. 31, 2018 38 6 44As of Sep. 30, 2018 33 8 41
NorthAmerica Asia Japan Others Total
Large size - 2 - 2 4Small to medium size - - - 1 1Total 0 2 0 3 5Large size - - - - 0Small to medium size 2 2 - - 4Total 2 2 0 0 4
FY20171H
FY20181H
19
Supplementary Information (1) Financial Results by Business Segment Power Systems
Revenue: Up ¥57.1 billion YoY
(In billion yen, accumulated amount)
Gas turbine orders received
Profit from business activities : Up ¥33.1 billion YoY
Orders received : Down ¥159.0 billion YoY
Backlog of Gas turbine orders received
- Decreased : GTCC(*), Steam power (Conventional thermal)
- Increased : Nuclear power, GTCC, Aero engines
- Increased Nuclear power, GTCC: Increased sales, etc.
(*)GTCC: Gas Turbine Combined Cycle
226.8 584.5
1,437.5
194.4 425.5
1,500.0
295.1 623.7
1,482.4
316.6 680.8
1,600.0
1Q Full year
1Q Forecast
FY2017 FY2018
Revenue
-1.7
14.2
84.9 25.1 47.3
135.0
Profit from business activities
Orders Received
1H 1H
© 2018 MITSUBISHI HEAVY INDUSTRIES, LTD. All Rights Reserved. 20
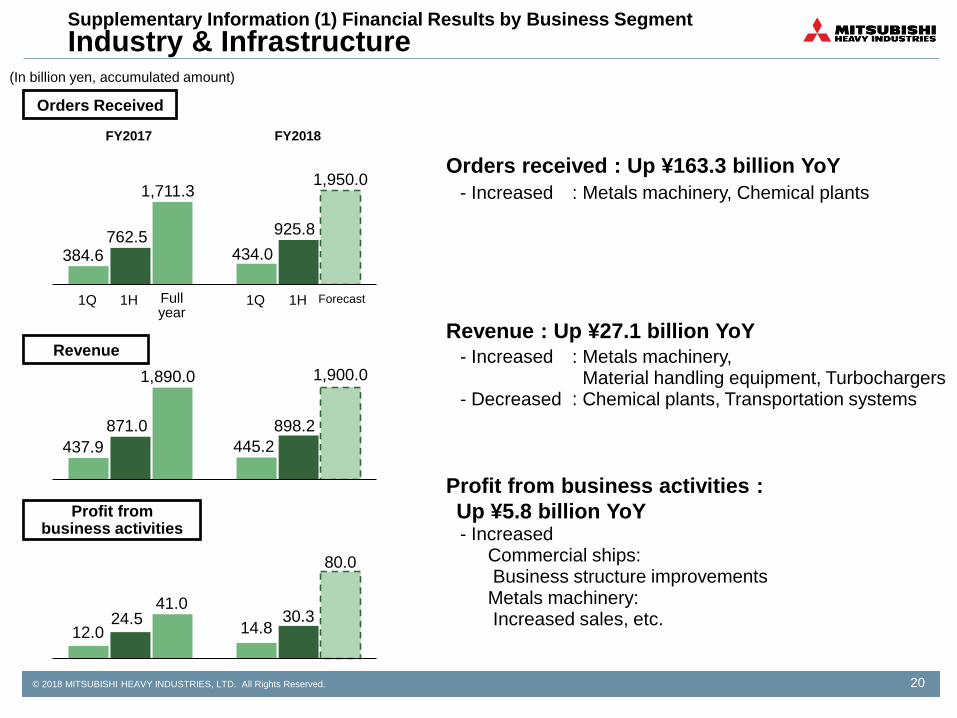
Orders received : Up ¥163.3 billion YoY
Profit from business activities : Up ¥5.8 billion YoY
Supplementary Information (1) Financial Results by Business Segment Industry & Infrastructure
Revenue : Up ¥27.1 billion YoY
- Increased : Metals machinery, Chemical plants
- Increased Commercial ships: Business structure improvements Metals machinery: Increased sales, etc.
- Increased : Metals machinery, Material handling equipment, Turbochargers
- Decreased : Chemical plants, Transportation systems
(In billion yen, accumulated amount)
384.6 762.5
1,711.3
434.0 925.8
1,950.0
437.9 871.0
1,890.0
445.2 898.2
1,900.0
FY2017 FY2018
Revenue
12.0 24.5
41.0 14.8
30.3
80.0
Profit from business activities
Orders Received
1Q 1Q Forecast 1H 1H Full year
© 2018 MITSUBISHI HEAVY INDUSTRIES, LTD. All Rights Reserved. 21
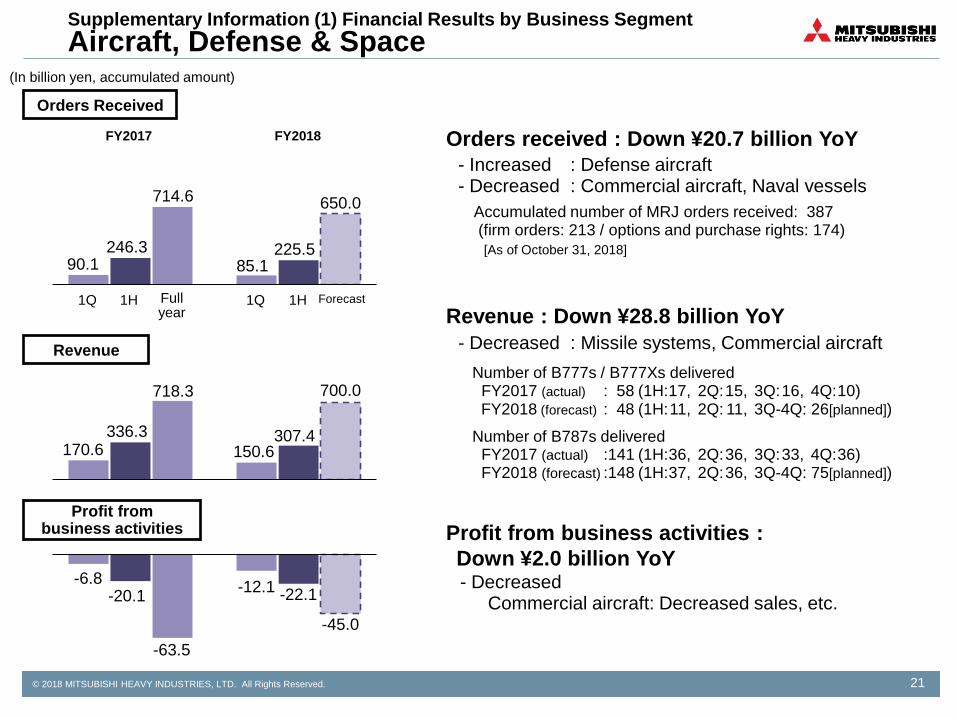
Orders received : Down ¥20.7 billion YoY
Revenue : Down ¥28.8 billion YoY
Profit from business activities : Down ¥2.0 billion YoY
Supplementary Information (1) Financial Results by Business Segment Aircraft, Defense & Space
- Increased : Defense aircraft - Decreased : Commercial aircraft, Naval vessels
- Decreased : Missile systems, Commercial aircraft Number of B777s / B777Xs delivered FY2017 (actual) : 58 (1H: 17, 2Q: 15, 3Q: 16, 4Q: 10) FY2018 (forecast) : 48 (1H: 11, 2Q: 11, 3Q-4Q: 26[planned])
Number of B787s delivered FY2017 (actual) :141 (1H: 36, 2Q: 36, 3Q: 33, 4Q: 36) FY2018 (forecast) :148 (1H: 37, 2Q: 36, 3Q-4Q: 75[planned])
- Decreased Commercial aircraft: Decreased sales, etc.
Accumulated number of MRJ orders received: 387 (firm orders: 213 / options and purchase rights: 174)
[As of October 31, 2018]
(In billion yen, accumulated amount)
90.1 246.3
714.6
85.1 225.5
650.0
170.6 336.3
718.3
150.6 307.4
700.0
FY2017 FY2018
Revenue
-6.8 -20.1
-63.5
-12.1 -22.1
-45.0
Profit from business activities
Orders Received
1Q 1Q Forecast 1H 1H Full year
© 2018 MITSUBISHI HEAVY INDUSTRIES, LTD. All Rights Reserved. 22
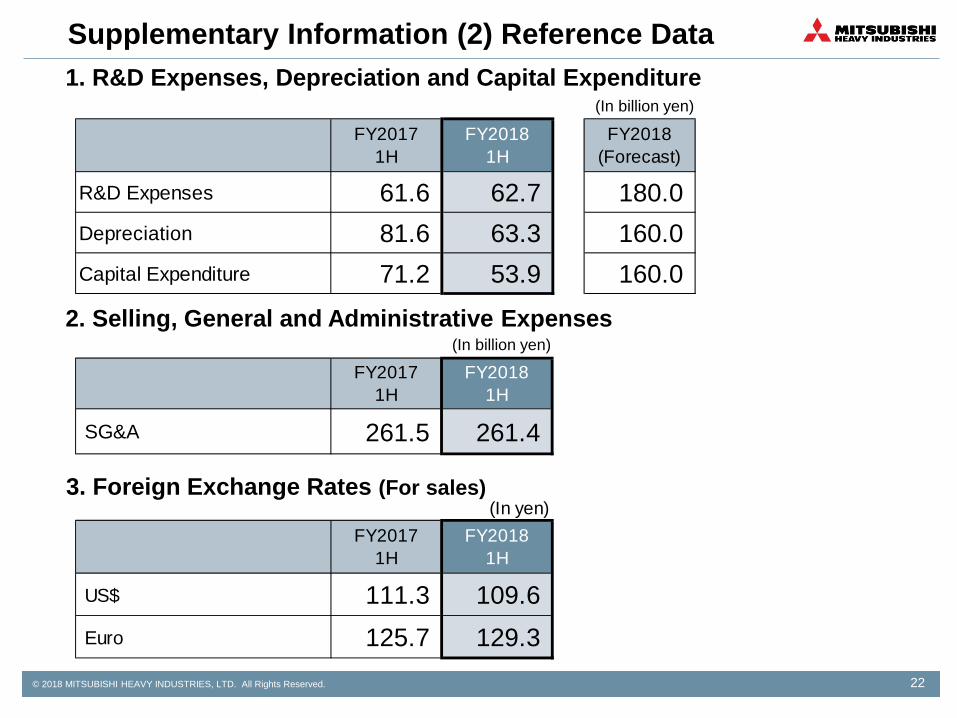
Supplementary Information (2) Reference Data
3. Foreign Exchange Rates (For sales)
R&D Expenses 61.6 62.7 180.0Depreciation 81.6 63.3 160.0Capital Expenditure 71.2 53.9 160.0
FY2018(Forecast)
FY20181H
FY20171H
(In billion yen)
2. Selling, General and Administrative Expenses
SG&A 261.5 261.4
FY20181H
FY20171H
(In yen)
US$ 111.3 109.6 Euro 125.7 129.3
FY20181H
FY20171H
(In billion yen)
1. R&D Expenses, Depreciation and Capital Expenditure
© 2018 MITSUBISHI HEAVY INDUSTRIES, LTD. All Rights Reserved. 23
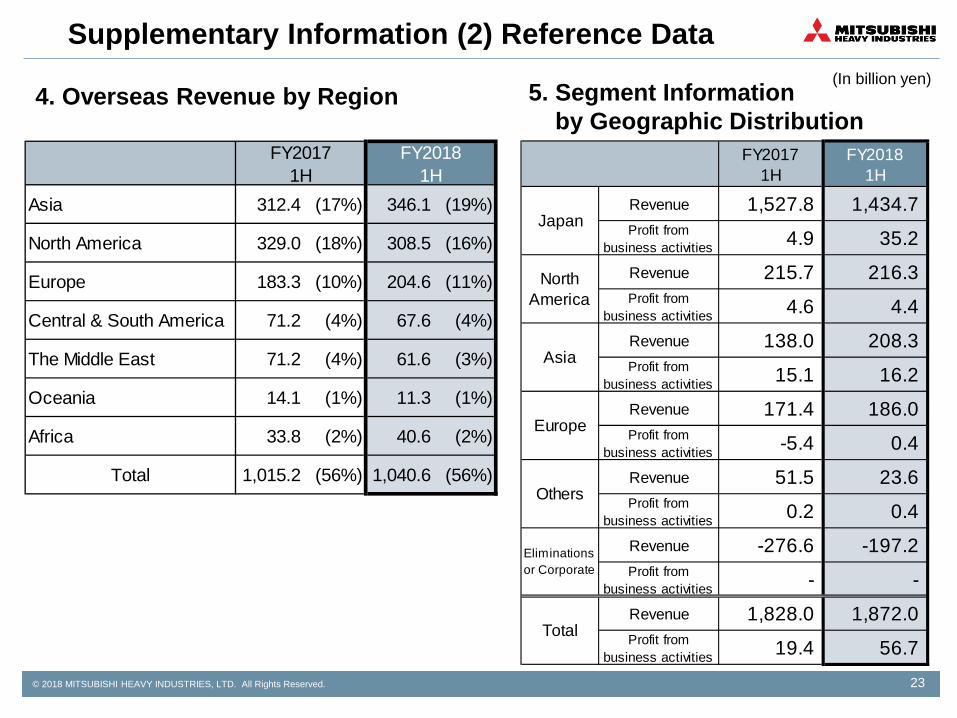
Supplementary Information (2) Reference Data
Asia (17%) (19%)
North America (18%) (16%)
Europe (10%) (11%)
Central & South America (4%) (4%)
The Middle East (4%) (3%)
Oceania (1%) (1%)
Africa (2%) (2%)
Total (56%) (56%)
14.1
204.6183.3
71.2
67.6
FY20181H
1,015.2
33.8
71.2
1,040.6
308.5329.0
11.3
61.6
FY20171H
40.6
346.1312.4
4. Overseas Revenue by Region
FY20171H
FY20181H
Revenue 1,527.8 1,434.7Profit from
business activities 4.9 35.2Revenue 215.7 216.3Profit from
business activities 4.6 4.4Revenue 138.0 208.3Profit from
business activities 15.1 16.2Revenue 171.4 186.0Profit from
business activities -5.4 0.4Revenue 51.5 23.6Profit from
business activities 0.2 0.4Revenue -276.6 -197.2Profit from
business activities - - Revenue 1,828.0 1,872.0Profit from
business activities 19.4 56.7
Japan
NorthAmerica
Total
Asia
Europe
Others
Eliminationsor Corporate
5. Segment Information by Geographic Distribution
(In billion yen)
24 © 2018 MITSUBISHI HEAVY INDUSTRIES, LTD. All Rights Reserved.


![[Overview of the consolidated financial results] · [Overview of the consolidated financial results] We posted revenue of 4,524.5 billion yen, up 214.7 billion yen from the previous](https://static.fdocuments.net/doc/165x107/5ed81d306ce43d1ebd3ca094/overview-of-the-consolidated-financial-results-overview-of-the-consolidated-financial.jpg)
![[Overview of the consolidated financial results]...[Overview of the consolidated financial results] We posted revenue of 4,527.1 billion yen, up 2.6 billion yen from the previous year,](https://static.fdocuments.net/doc/165x107/5e2c1adca539961b0e2c7a89/overview-of-the-consolidated-financial-results-overview-of-the-consolidated.jpg)