
Financial results for FY ended 3/2018 & Financial ...Apr 27, 2018 · Financial results for FY...
45
Financial results for FY ended 3/2018 & Financial forecasts for FY ending 3/2019 April 27, 2018 The Kansai Electric Power Co., Inc. Financial forecasts are subject to change depending upon the changes of business environments and other conditions.
Transcript of Financial results for FY ended 3/2018 & Financial ...Apr 27, 2018 · Financial results for FY...

Financial results for FY ended 3/2018
&Financial forecasts for FY ending 3/2019
April 27, 2018
The Kansai Electric Power Co., Inc.
Financial forecasts are subject to change depending upon the changes of business environments and other conditions.
1
■Financial highlights for FY ended 3/2017
・Overview
・Financial highlights
(consolidated, non-consolidated)
■Financial highlights for FY ended 3/2017
・Major factors (non-consolidated)
・Non-consolidated statements of operations
・Consolidated statements of operations
・Segment information
・Consolidated balance sheets
■FY2017 Year-end dividend・FY2017 Year-end dividend
■Financial forecasts for FY ending 3/2018・Financial forecasts
(consolidated, non-consolidated)
Contents■Appendix
・Electricity sales
・Non-consolidated balance sheets
・Consolidated statements of cash flows
・Profit and loss by business segment
・Prospective profit and loss by business segment
・Interest-bearing debt (non-consolidated)
・Actual supply and demand (Sending end)
・Maintenance costs and depreciation in comparison
with the previous term
・Time lag from the fuel cost adjustment system
・Framework of feed-in tariff scheme for renewable
energy
・Outline of electricity rate reduction
・Electricity and gas sales efforts in the Kansai area
・Overview of “Nattoku Pack”
・Advantages when choosing “Nattoku Pack”
・Electricity sales efforts made so far in the Tokyo
metropolitan area
・Outline of gas business
・Outline of IT/Communications business
・Outline of Real Estate business
・Overseas investment projects
・The KEPCO Group’s introduction and development
plan of renewable energy
・KEPCO’s power source composition
・Initiatives on climate change issues and CO2 reduction
・Fuel change plan and suspension of operation for
thermal power plant
・Digest of Medium-term Management Plan
・Financial/corporate data
-------- 2
-------- 3
-------- 4
-------- 5
-------- 6
-------- 7
-------- 8
-------- 9
-------- 10
-------- 12-------- 13-------- 14-------- 15-------- 16-------- 17-------- 18
-------- 19-------- 20
-------- 21-------- 22-------- 24-------- 25-------- 26
-------- 27-------- 28-------- 29-------- 30-------- 31
-------- 32-------- 33-------- 34
-------- 35-------- 36-------- 38
2
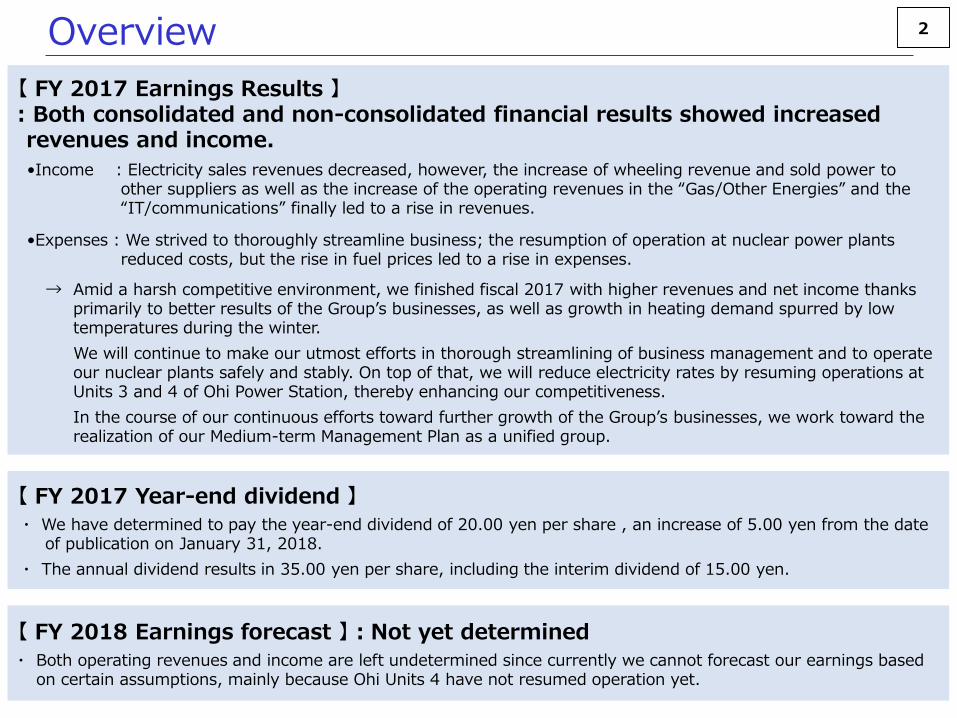
【 FY 2017 Earnings Results 】: Both consolidated and non-consolidated financial results showed increased revenues and income.
•Income : Electricity sales revenues decreased, however, the increase of wheeling revenue and sold power to other suppliers as well as the increase of the operating revenues in the “Gas/Other Energies” and the “IT/communications” finally led to a rise in revenues.
•Expenses : We strived to thoroughly streamline business; the resumption of operation at nuclear power plantsreduced costs, but the rise in fuel prices led to a rise in expenses.
→ Amid a harsh competitive environment, we finished fiscal 2017 with higher revenues and net income thanks primarily to better results of the Group’s businesses, as well as growth in heating demand spurred by low temperatures during the winter.
We will continue to make our utmost efforts in thorough streamlining of business management and to operate our nuclear plants safely and stably. On top of that, we will reduce electricity rates by resuming operations at Units 3 and 4 of Ohi Power Station, thereby enhancing our competitiveness.
In the course of our continuous efforts toward further growth of the Group’s businesses, we work toward the realization of our Medium-term Management Plan as a unified group.
Overview
【 FY 2018 Earnings forecast 】:Not yet determined・ Both operating revenues and income are left undetermined since currently we cannot forecast our earnings based
on certain assumptions, mainly because Ohi Units 4 have not resumed operation yet.
【 FY 2017 Year-end dividend 】・ We have determined to pay the year-end dividend of 20.00 yen per share , an increase of 5.00 yen from the date
of publication on January 31, 2018.
・ The annual dividend results in 35.00 yen per share, including the interim dividend of 15.00 yen.
3
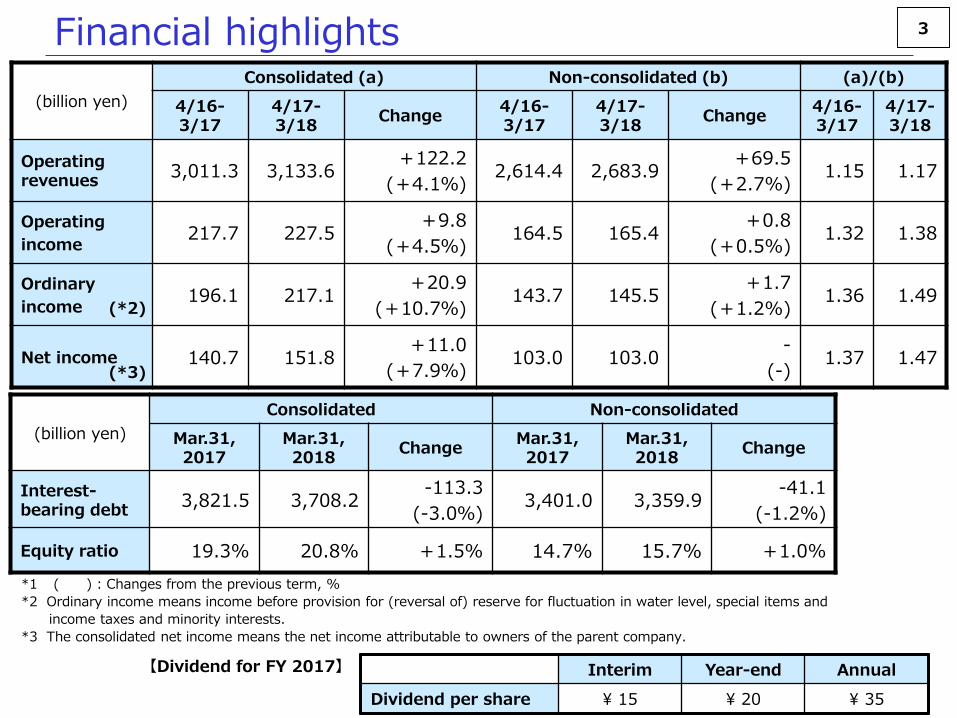
(billion yen)
Consolidated (a) Non-consolidated (b) (a)/(b)
4/16-3/17
4/17-3/18
Change4/16-3/17
4/17-3/18
Change4/16-3/17
4/17-3/18
Operating revenues
3,011.3 3,133.6+122.2
(+4.1%)2,614.4 2,683.9
+69.5
(+2.7%)1.15 1.17
Operating
income217.7 227.5
+9.8
(+4.5%)164.5 165.4
+0.8
(+0.5%)1.32 1.38
Ordinary
income196.1 217.1
+20.9
(+10.7%)143.7 145.5
+1.7
(+1.2%)1.36 1.49
Net income 140.7 151.8+11.0
(+7.9%)103.0 103.0
-
(-)1.37 1.47
(billion yen)
Consolidated Non-consolidated
Mar.31, 2017
Mar.31, 2018
ChangeMar.31, 2017
Mar.31, 2018
Change
Interest-bearing debt
3,821.5 3,708.2-113.3
(-3.0%)3,401.0 3,359.9
-41.1
(-1.2%)
Equity ratio 19.3% 20.8% +1.5% 14.7% 15.7% +1.0%
Financial highlights
【Dividend for FY 2017】 Interim Year-end Annual
Dividend per share ¥ 15 ¥ 20 ¥ 35
*1 ( ) : Changes from the previous term, %
*2 Ordinary income means income before provision for (reversal of) reserve for fluctuation in water level, special items and
income taxes and minority interests.
*3 The consolidated net income means the net income attributable to owners of the parent company.
(*2)
(*3)
4
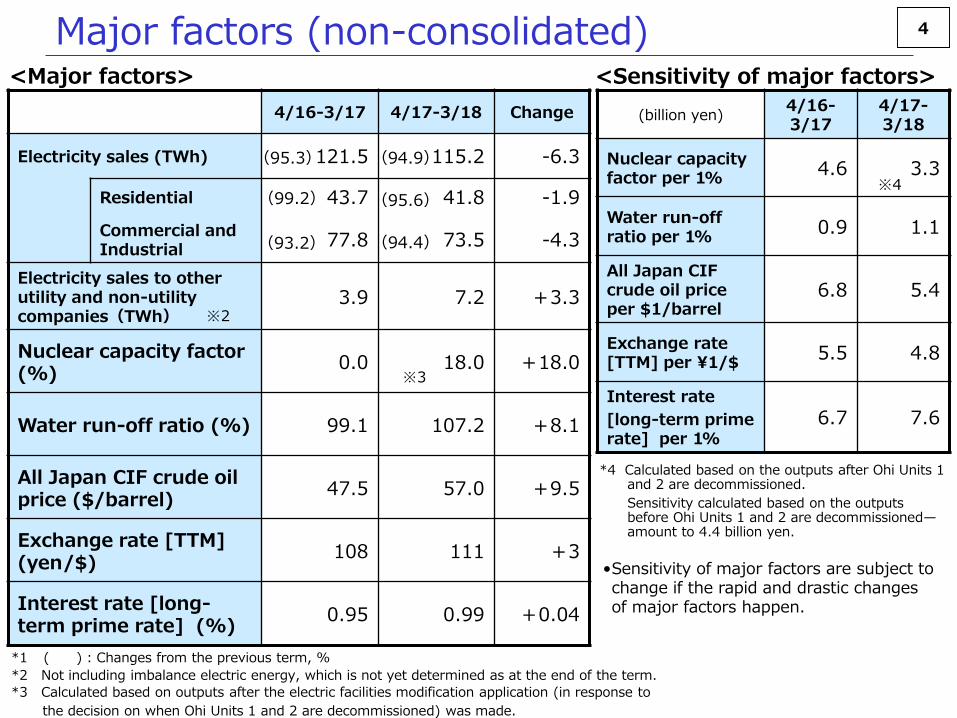
(billion yen)4/16-3/17
4/17-3/18
Nuclear capacity factor per 1%
4.6 3.3
Water run-off ratio per 1%
0.9 1.1
All Japan CIF crude oil price per $1/barrel
6.8 5.4
Exchange rate [TTM] per ¥1/$
5.5 4.8
Interest rate
[long-term prime rate] per 1%
6.7 7.6
4/16-3/17 4/17-3/18 Change
Electricity sales (TWh) 121.5 115.2 -6.3
Residential 43.7 41.8 -1.9
Commercial and Industrial
77.8 73.5 -4.3
Electricity sales to other utility and non-utility companies(TWh)
3.9 7.2 +3.3
Nuclear capacity factor (%)
0.0 18.0 +18.0
Water run-off ratio (%) 99.1 107.2 +8.1
All Japan CIF crude oil price ($/barrel)
47.5 57.0 +9.5
Exchange rate [TTM] (yen/$)
108 111 +3
Interest rate [long-term prime rate] (%)
0.95 0.99 +0.04
※2
※4
(94.9)
(95.6)
(94.4)
※3
(95.3)
(99.2)
(93.2)
Major factors (non-consolidated)<Major factors> <Sensitivity of major factors>
•Sensitivity of major factors are subject to change if the rapid and drastic changes of major factors happen.
*1 ( ) : Changes from the previous term, %
*2 Not including imbalance electric energy, which is not yet determined as at the end of the term.
*3 Calculated based on outputs after the electric facilities modification application (in response to
the decision on when Ohi Units 1 and 2 are decommissioned) was made.
*4 Calculated based on the outputs after Ohi Units 1 and 2 are decommissioned.
Sensitivity calculated based on the outputs before Ohi Units 1 and 2 are decommissioned—amount to 4.4 billion yen.

5
(billion yen) 4/16-3/17 4/17-3/18 Change Breakdown
Ordinary revenues
(Operating revenues)
2,653.4 2,704.9 +51.5
(2,614.4) (2,683.9) (+69.5)
Electricity sales 2,296.6 2,236.6 -60.0・Decrease in electricity sales volume -106.0・Decrease in revenue per kWh due to the effects of revision of electricity rates -56.0・Increase in revenue per kWh due to renewable energy power promotion surcharge +29.4
Grant under act on purchase of renewable energy sourced electricity
130.5 148.6 +18.0
Others 226.1 319.6 +93.5・Wheeling revenues +51.5・Cost of sold power (other utility companies, other non-utility companies) +33.4・Non-electric business +26.0
Ordinary expenses 2,509.6 2,559.4 +49.7
Personnel expenses 204.6 217.2 +12.5
Fuel costs 523.5 520.1 -3.4 ・Fossil-fuel costs -15.2・Nuclear-fuel costs +11.7
Backend expenses of nuclear power
32.2 59.9 +27.7
Maintenance costs 189.5 184.1 -5.4
Taxes other than income taxes 148.4 144.7 -3.6
Depreciation 277.4 250.7 -26.7
Purchased power 461.6 466.7 +5.0 ・From other utility companies +2.1・From other non-utility companies +2.8
Interest expenses 42.9 33.3 -9.5
Levy under act on purchase of renewable energy sourced electricity
230.6 260.0 +29.4
Other 398.5 422.3 +23.8 ・Non-electric business +30.1
Ordinary income 143.7 145.5 +1.7
Provision for or reversal of reserve for fluctuation in water levels
-1.0 1.4 +2.5
Income taxes 41.6 40.9 -0.7
Net Income 103.0 103.0 -
・Decrease in electricity sales volume -41.0・Increase in other utility and non-utility companies +21.0・Increase in nuclear capacity factor -85.0・Fluctuation of fossil-fuel prices +72.0・Depreciation of yen +8.0・Other +10.0
Non-consolidated statements of income

6
(billion yen)4/16-3/17
4/17-3/18
Change Breakdown
Ordinary revenues
(Operating revenues)
3,068.1 3,169.5 +101.3
(3,011.3) (3,133.6) (+122.2)
Electric operating revenues
2,556.5 2,596.1 +39.5・Grant under act on purchase of renewable energy sourced
electricity +18.0
Other operating revenues
454.7 537.5 +82.7・Sales of external transactions in non-electric business +56.8
・Sales of external transactions in subsidiaries +25.9
Non-operating revenues 56.8 35.8 -20.9 ・Gain on sales of non-current assets -14.1
Ordinary expenses 2,872.0 2,952.3 +80.3
Electric operating expenses
2,394.7 2,430.1 +35.3 ・Backend expenses of nuclear power +27.7
Other operating expenses
398.8 475.9 +77.1 ・Costs for non-electric business +47.6・Costs for subsidiaries +29.4
Non-operating expenses 78.4 46.3 -32.1 ・Interest expenses -11.1
Ordinary income 196.1 217.1 +20.9
Provision for or reversal of reserve for fluctuation in water levels
-1.0 1.4 +2.5
Income taxes 56.3 63.0 +6.7
Net income 140.7 151.8 +11.0
Comprehensive income 143.1 168.4 +25.2
※
Consolidated statements of income
* The consolidated net income means the net income attributable to owners of the parent.

7
(billion yen)
Reportable segments
Other TotalEliminations/
CorporateConsolidated
Comprehensive Energy/PowerTransmission and Distribution Business IT/
CommunicationsElectric
Power
Gas/Other
EnergiesSubtotal
Operating revenues
2,612.9
(+43.4)
174.1
(+56.7)
2,787.1
(+100.2)
243.4
(+16.5)
423.2
(+17.3)
3,453.7
(+134.0)
-320.1
(-11.7)
3,133.6
(+122.2)
Operating revenues
(external transactions)
2,596.1
(+39.5)
141.2
(+48.0)
2,737.3
(+87.5)
203.1
(+17.5)
193.1
(+17.2)
3,133.6
(+122.2)-
3,133.6
(+122.2)
Operating income
170.3
(+5.0)
0.9
(-5.0)
171.2
(-)
26.2
(+6.7)
30.4
(+5.0)
227.9
(+11.8)
-0.4
(-1.9)
227.5
(+9.8)
Breakdown of changes in IT/CommunicationsOperating revenues(external transactions)・Operating income:Increase in FTTH, MVNO, and retail electricity
service customers
Breakdown of changes in Gas/Other EnergiesOperating revenues(external transactions):Increase in gas business revenues Operating income
:Increase in gas business costs
Segment information( ):Changes from the previous term
8
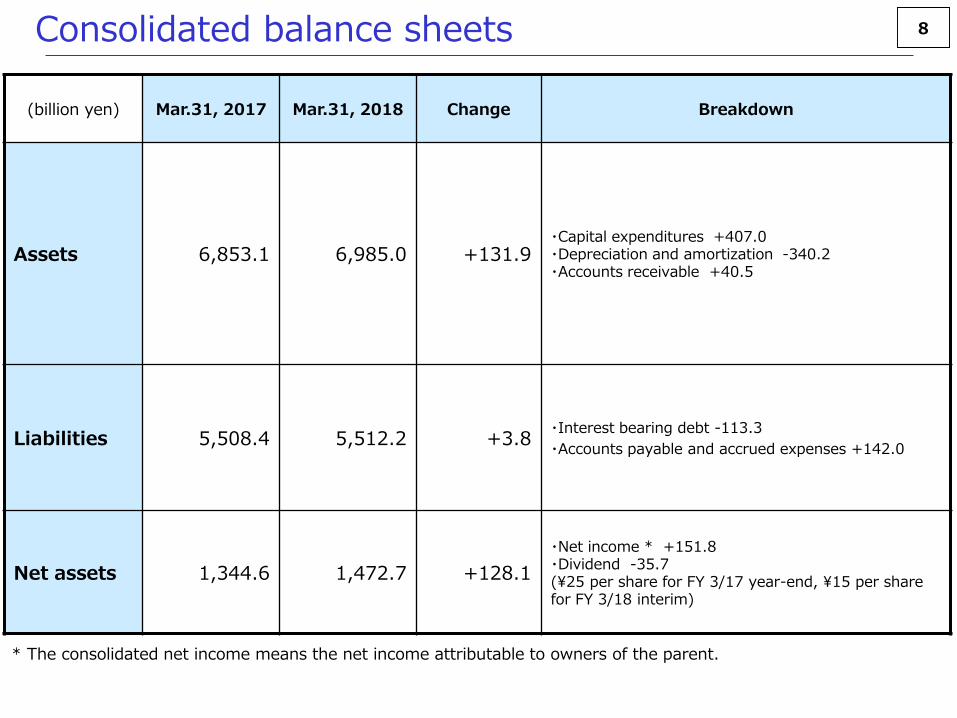
(billion yen) Mar.31, 2017 Mar.31, 2018 Change Breakdown
Assets 6,853.1 6,985.0 +131.9・Capital expenditures +407.0 ・Depreciation and amortization -340.2・Accounts receivable +40.5
Liabilities 5,508.4 5,512.2 +3.8・Interest bearing debt -113.3
・Accounts payable and accrued expenses +142.0
Net assets 1,344.6 1,472.7 +128.1
・Net income * +151.8・Dividend -35.7(¥25 per share for FY 3/17 year-end, ¥15 per share for FY 3/18 interim)
Consolidated balance sheets
* The consolidated net income means the net income attributable to owners of the parent.
9FY 2017 Year-end dividend
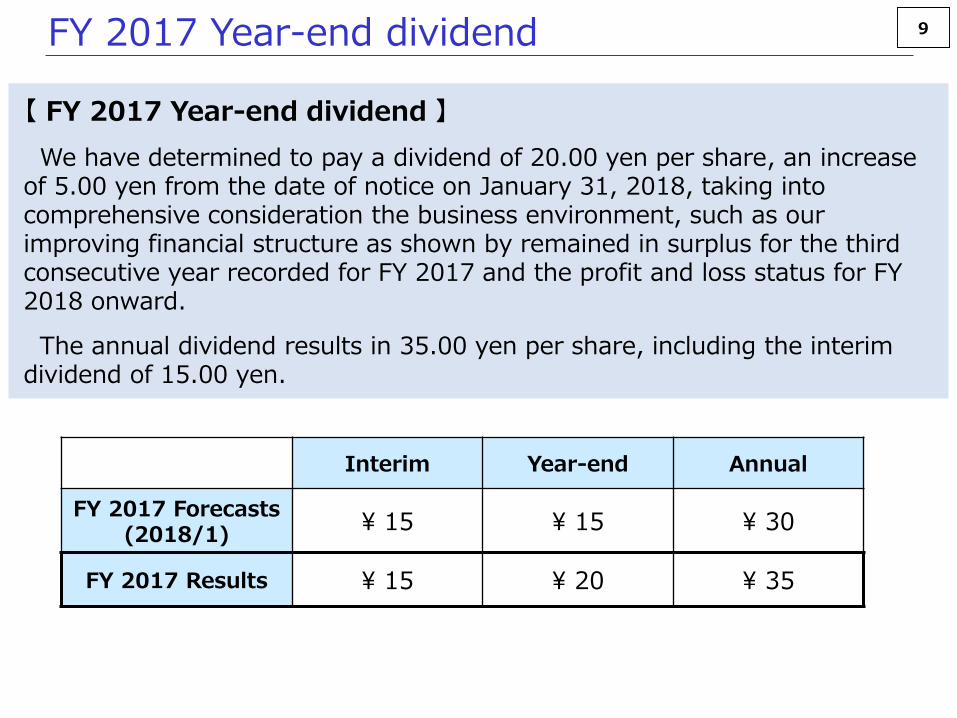
【 FY 2017 Year-end dividend 】
We have determined to pay a dividend of 20.00 yen per share, an increase of 5.00 yen from the date of notice on January 31, 2018, taking into comprehensive consideration the business environment, such as our improving financial structure as shown by remained in surplus for the third consecutive year recorded for FY 2017 and the profit and loss status for FY 2018 onward.
The annual dividend results in 35.00 yen per share, including the interim dividend of 15.00 yen.
Interim Year-end Annual
FY 2017 Forecasts(2018/1)
¥ 15 ¥ 15 ¥ 30
FY 2017 Results ¥ 15 ¥ 20 ¥ 35
10FY 2018 Financial forecasts
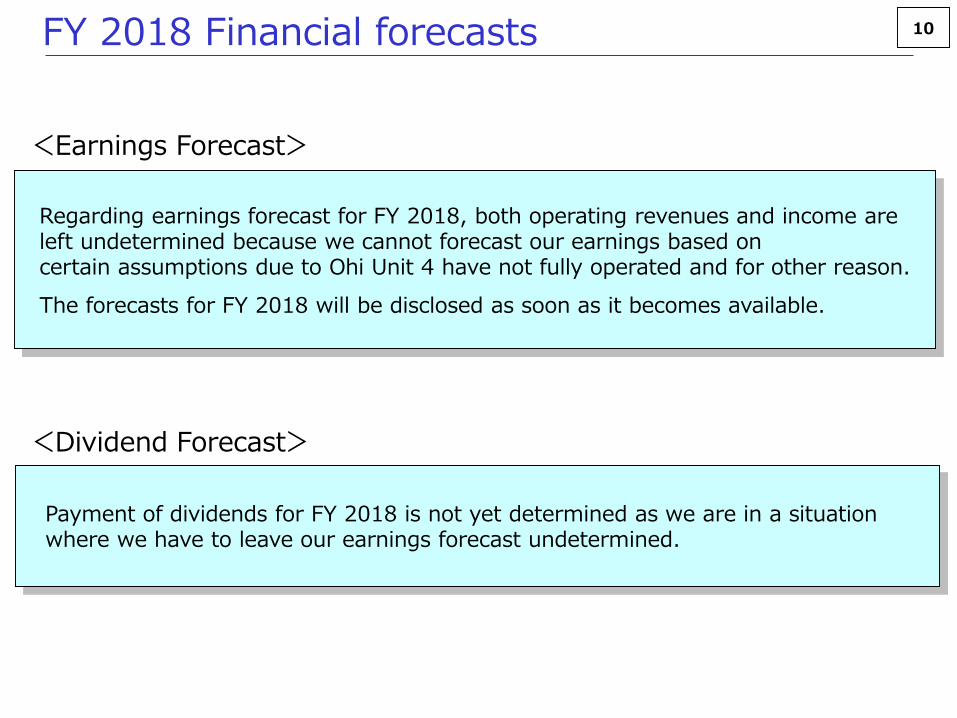
<Earnings Forecast>
<Dividend Forecast>
Payment of dividends for FY 2018 is not yet determined as we are in a situation where we have to leave our earnings forecast undetermined.
Regarding earnings forecast for FY 2018, both operating revenues and income areleft undetermined because we cannot forecast our earnings based on certain assumptions due to Ohi Unit 4 have not fully operated and for other reason.
The forecasts for FY 2018 will be disclosed as soon as it becomes available.

11
Appendix
12
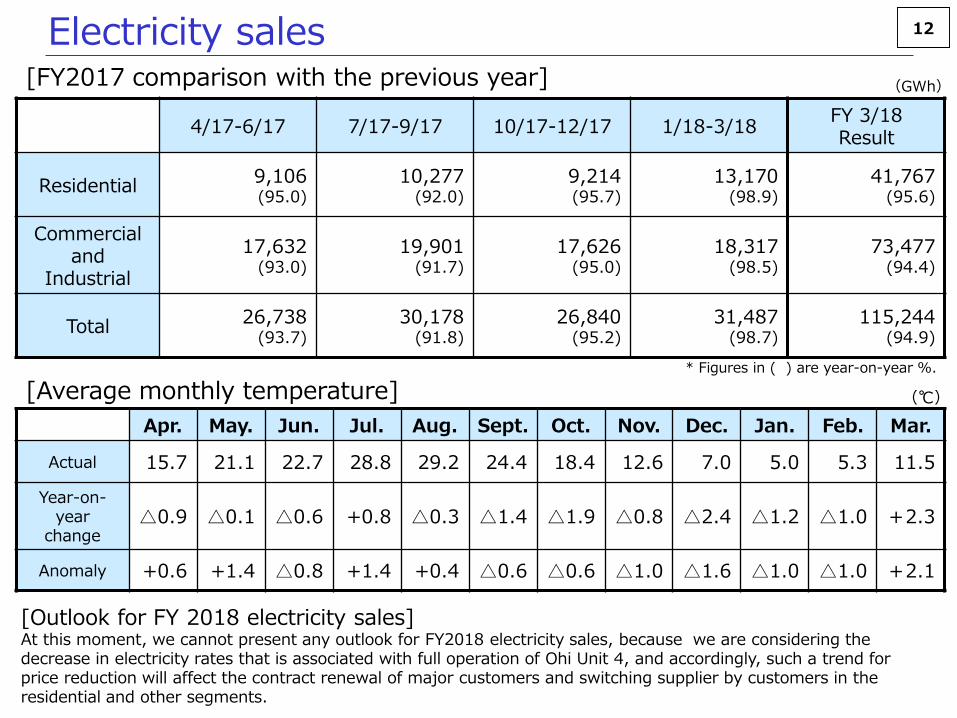
4/17-6/17 7/17-9/17 10/17-12/17 1/18-3/18FY 3/18Result
Residential9,106(95.0)
10,277(92.0)
9,214(95.7)
13,170(98.9)
41,767(95.6)
Commercial and
Industrial
17,632(93.0)
19,901(91.7)
17,626(95.0)
18,317(98.5)
73,477(94.4)
Total 26,738
(93.7)30,178
(91.8)26,840
(95.2)31,487
(98.7)115,244
(94.9)
Apr. May. Jun. Jul. Aug. Sept. Oct. Nov. Dec. Jan. Feb. Mar.
Actual 15.7 21.1 22.7 28.8 29.2 24.4 18.4 12.6 7.0 5.0 5.3 11.5
Year-on-year
change△0.9 △0.1 △0.6 +0.8 △0.3 △1.4 △1.9 △0.8 △2.4 △1.2 △1.0 +2.3
Anomaly +0.6 +1.4 △0.8 +1.4 +0.4 △0.6 △0.6 △1.0 △1.6 △1.0 △1.0 +2.1
Electricity sales[FY2017 comparison with the previous year] (GWh)
* Figures in ( ) are year-on-year %.
(℃)[Average monthly temperature]
[Outlook for FY 2018 electricity sales]At this moment, we cannot present any outlook for FY2018 electricity sales, because we are considering the decrease in electricity rates that is associated with full operation of Ohi Unit 4, and accordingly, such a trend for price reduction will affect the contract renewal of major customers and switching supplier by customers in the residential and other segments.
13
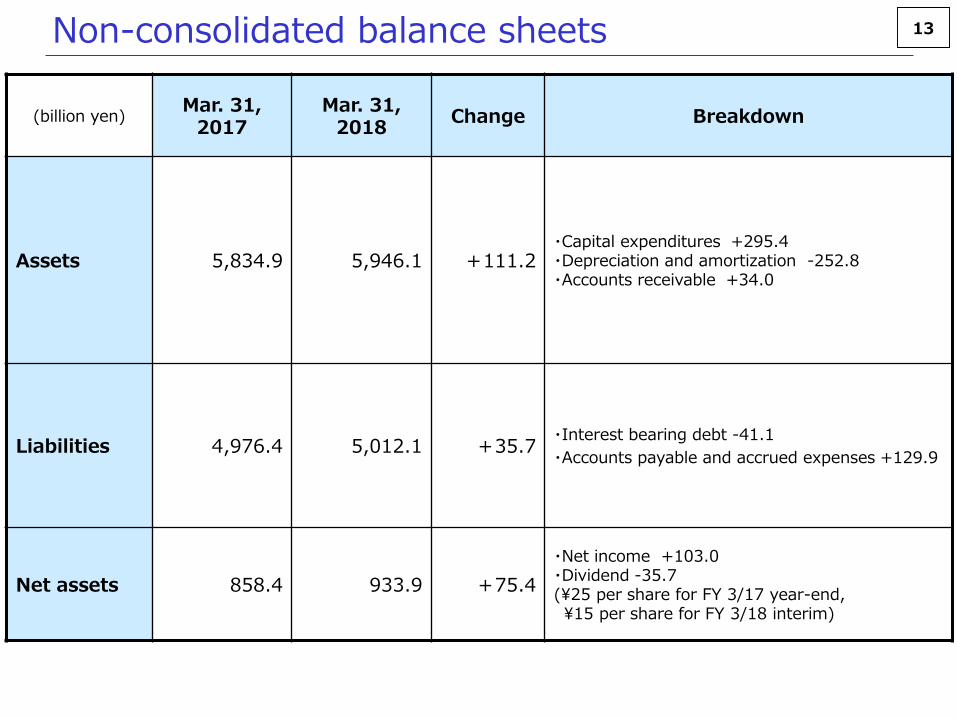
(billion yen)Mar. 31,
2017Mar. 31,
2018Change Breakdown
Assets 5,834.9 5,946.1 +111.2・Capital expenditures +295.4・Depreciation and amortization -252.8・Accounts receivable +34.0
Liabilities 4,976.4 5,012.1 +35.7・Interest bearing debt -41.1
・Accounts payable and accrued expenses +129.9
Net assets 858.4 933.9 +75.4
・Net income +103.0・Dividend -35.7(¥25 per share for FY 3/17 year-end, ¥15 per share for FY 3/18 interim)
Non-consolidated balance sheets

14
(billion yen) 4/16-3/17 4/17-3/18 Change Breakdown
Operating activities 485.6 623.2 +137.5
・Decrease in electricity sales revenues -80.7・Increase in wheeling revenues +45.4・Increase in income from electricity sales (other utility companies/other non-utility companies)
+33.0・Decrease in fossil-fuel costs +17.9・Decrease in payments of consumption taxes+116.9
Investing
activities-345.7 -447.2 -101.4
・Increase in expenses purchase of property -59.9・Increase in expenditures for investment and lending -21.1
・Increase in expenditures for acquisition of subsidiaries’ shares -20.4
(Free cash flows) (139.9) (176.0) (+36.1)
Financing activities -130.3 -162.2 -31.9
・Dividends paid -35.5(¥25 per share for FY 3/17 year-end, ¥15 per share for FY 3/18 interim)
Consolidated statements of cash flows
15
(billion yen) 4/16-3/17 4/17-3/18 Change Breakdown
Com
pre
hensiv
e E
nerg
y /
Pow
er T
ransm
issio
n a
nd
Distrib
utio
n
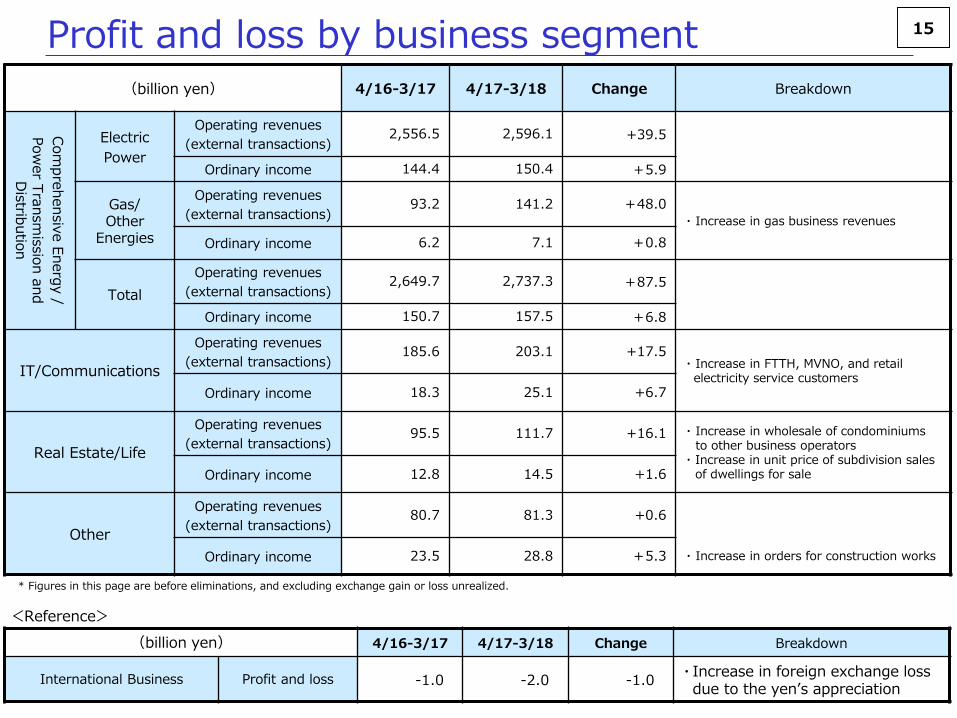
Electric
Power
Operating revenues
(external transactions)2,556.5 2,596.1 +39.5
Ordinary income 144.4 150.4 +5.9
Gas/Other
Energies
Operating revenues
(external transactions)93.2 141.2 +48.0
・ Increase in gas business revenues
Ordinary income 6.2 7.1 +0.8
Total
Operating revenues
(external transactions)2,649.7 2,737.3 +87.5
Ordinary income 150.7 157.5 +6.8
IT/Communications
Operating revenues
(external transactions)185.6 203.1 +17.5
・ Increase in FTTH, MVNO, and retail electricity service customers
Ordinary income 18.3 25.1 +6.7
Real Estate/Life
Operating revenues
(external transactions)95.5 111.7 +16.1 ・ Increase in wholesale of condominiums
to other business operators ・ Increase in unit price of subdivision sales
of dwellings for saleOrdinary income 12.8 14.5 +1.6
Other
Operating revenues
(external transactions)80.7 81.3 +0.6
・ Increase in orders for construction worksOrdinary income 23.5 28.8 +5.3
(billion yen) 4/16-3/17 4/17-3/18 Change Breakdown
International Business Profit and loss -1.0 -2.0 -1.0・ Increase in foreign exchange loss due to the yen’s appreciation
Profit and loss by business segment
* Figures in this page are before eliminations, and excluding exchange gain or loss unrealized.
<Reference>
16
(billion yen)4/17-3/18
(Results)
4/18-3/19
(Forecasts)Change Breakdown
Com
pre
hensiv
e E
nerg
y /
Pow
er T
ransm
issio
n a
nd
Distrib
utio
n
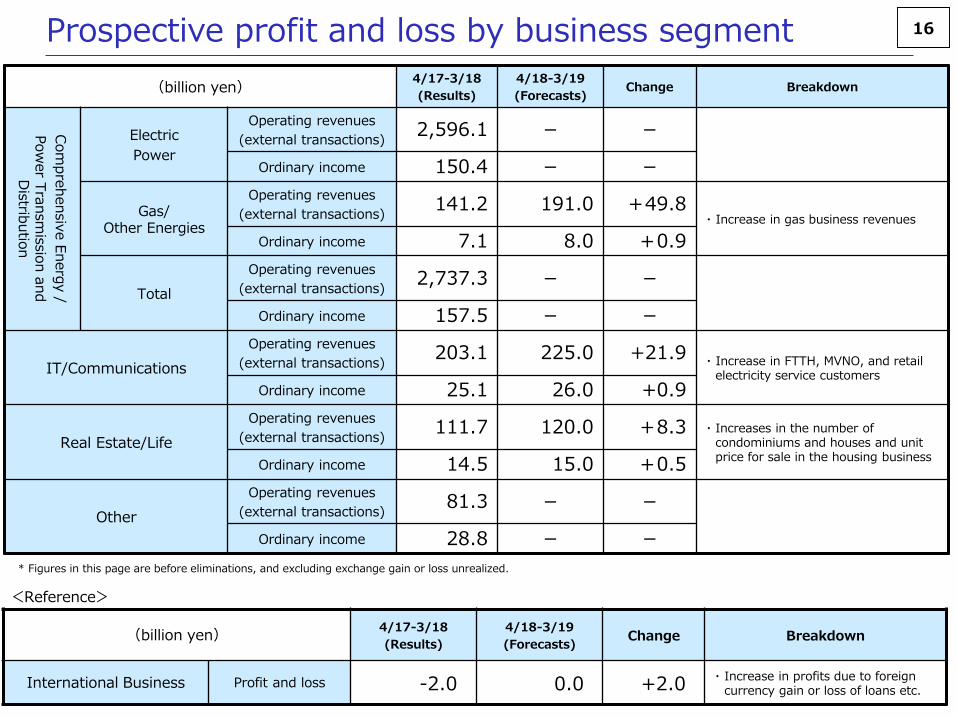
Electric
Power
Operating revenues
(external transactions)2,596.1 - -
Ordinary income 150.4 - -
Gas/Other Energies
Operating revenues
(external transactions)141.2 191.0 +49.8
・ Increase in gas business revenues
Ordinary income 7.1 8.0 +0.9
Total
Operating revenues
(external transactions)2,737.3 - -
Ordinary income 157.5 - -
IT/Communications
Operating revenues
(external transactions)203.1 225.0 +21.9
・ Increase in FTTH, MVNO, and retail electricity service customers
Ordinary income 25.1 26.0 +0.9
Real Estate/Life
Operating revenues
(external transactions)111.7 120.0 +8.3 ・ Increases in the number of
condominiums and houses and unit price for sale in the housing business
Ordinary income 14.5 15.0 +0.5
Other
Operating revenues
(external transactions)81.3 - -
Ordinary income 28.8 - -
(billion yen)4/17-3/18
(Results)
4/18-3/19
(Forecasts)Change Breakdown
International Business Profit and loss -2.0 0.0 +2.0・ Increase in profits due to foreign
currency gain or loss of loans etc.
Prospective profit and loss by business segment
* Figures in this page are before eliminations, and excluding exchange gain or loss unrealized.
<Reference>

17
(billion yen)Mar. 31,
2017
Mar. 31,
2018Change (*)
Bonds 1,322.6 1,240.9-81.6
(+250.0、△331.7)
Borrowings 1,964.3 1,964.9+0.5
(+561.0、-560.4)
Long-term 1,834.3 1,834.9+0.5
(+301.0、-300.4)
Short-term 130.0 130.0-
(+260.0、-260.0)
Commercial paper 114.0 154.0+400
(+404.0、-364.0)
Interest-bearing debt 3,401.0 3,359.9 -41.1
Interest rate (%)(as of fiscal year-end)
1.09 0.89 -0.20
(*) +(plus) in the bracket means financing, -(minus) in the bracket means repayment.
Interest-bearing debt (non-consolidated)

18
(GWh)4/16-3/17
Composition ratio
4/17-3/18
Composition ratio
Change
KEPCO
Hydro 13,362 14% 13,761 15% +400
Thermal 81,523 86% 67,787 72% -13,737
Nuclear -440 0% 12,867 14% +13,307
New energy sources 93 0% 80 0% -13
KEPCO Total 94,537 100% 94,495 100% -43
Other-utility companies 34,898 27,503 -7,395
Captive use by hydoropower -1,653 -1,490 +162
Total 127,783 120,508 -7,275
*1 Some rounding errors may be observed.*2 “Other-utility companies” does not include imbalance electric energy, which is not yet determined as at the end of the term.
Actual supply and demand (Sending end)
19
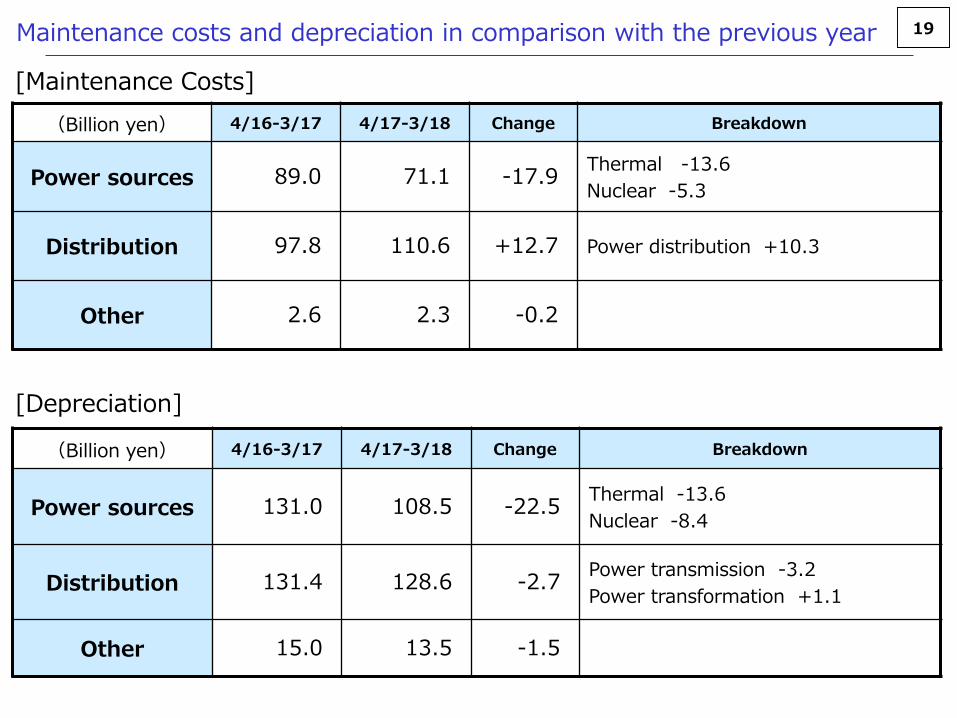
(Billion yen) 4/16-3/17 4/17-3/18 Change Breakdown
Power sources 89.0 71.1 -17.9Thermal -13.6
Nuclear -5.3
Distribution 97.8 110.6 +12.7 Power distribution +10.3
Other 2.6 2.3 -0.2
(Billion yen) 4/16-3/17 4/17-3/18 Change Breakdown
Power sources 131.0 108.5 -22.5Thermal -13.6
Nuclear -8.4
Distribution 131.4 128.6 -2.7Power transmission -3.2
Power transformation +1.1
Other 15.0 13.5 -1.5
Maintenance costs and depreciation in comparison with the previous year
[Maintenance Costs]
[Depreciation]

20
•The fuel cost adjustment system is a mechanism utilized to reflect, in the electricity rates, the impact of fluctuations in the exchange rate and the market price of fuel on thermal fuel costs.
•Fluctuations in fuel prices of each month is reflected in fuel cost adjustment unit price 3–5 months later. This generates a gap (time lag) between the fluctuations in fuel prices and the timing of reflecting them in fuel cost adjustment unit price.
-4
-3
-2
-1
FY2016 Effect on profit increase caused by time lag About -27.0 billion yen
Change from the same period last year
: About +10.0 billion yen
0
1
-1
-2
FY2017Effect on profit decrease caused by time lag About – 17.0 billion yen
Time lag from the fuel cost adjustment system
(yen)
Adjusted fuel cost unit price without time lag
Adjusted fuel cost unit priceApril,2017 MarchApril,2016
*The above-mentioned time lag indicates time gap on the income front in each accounting period, and differs from the income and expenditure effect calculated based on actual thermal power fuel cost etc.
*Presupposed elements of fuel cost adjustments are being reviewed following the review of electricity rates conducted on August 1, 2017 due to the changes in generation mix and fuel prices.
August 1, 2017Revision of electricity rates
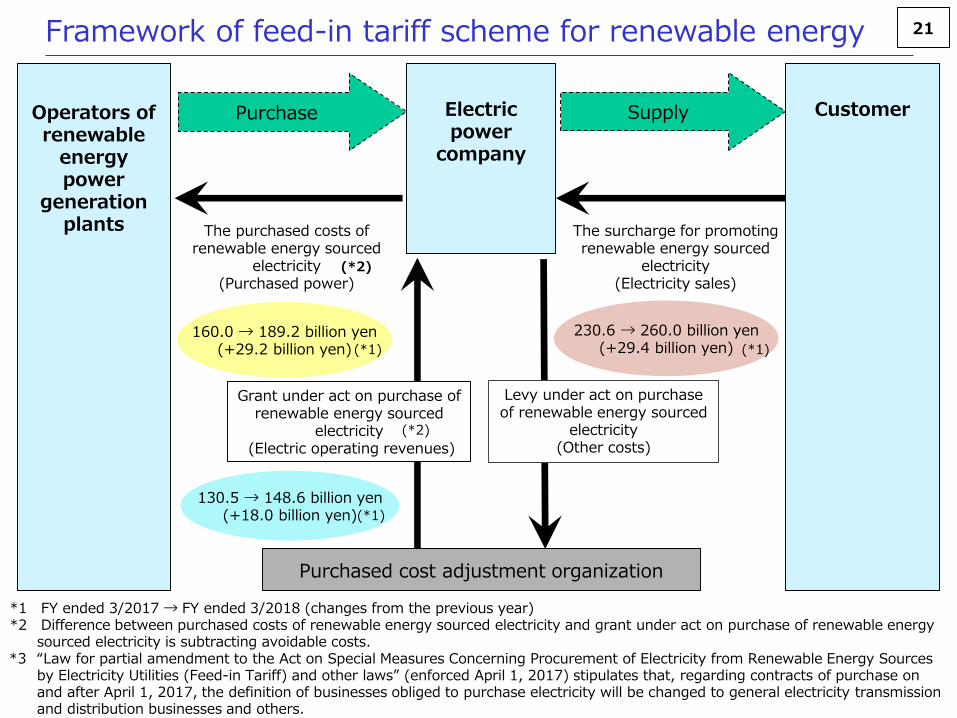
21Framework of feed-in tariff scheme for renewable energy
Electric power
company
CustomerOperators of renewable
energy power
generation plants
Purchase Supply
The surcharge for promoting renewable energy sourced
electricity(Electricity sales)
The purchased costs of renewable energy sourced
electricity(Purchased power)
130.5 → 148.6 billion yen(+18.0 billion yen)
Levy under act on purchase of renewable energy sourced
electricity(Other costs)
Grant under act on purchase of renewable energy sourced
electricity(Electric operating revenues)
230.6 → 260.0 billion yen(+29.4 billion yen)
Purchased cost adjustment organization
(*1)
160.0 → 189.2 billion yen(+29.2 billion yen) (*1)
(*1)
(*2)
(*2)
*1 FY ended 3/2017 → FY ended 3/2018 (changes from the previous year)*2 Difference between purchased costs of renewable energy sourced electricity and grant under act on purchase of renewable energy
sourced electricity is subtracting avoidable costs.*3 “Law for partial amendment to the Act on Special Measures Concerning Procurement of Electricity from Renewable Energy Sources
by Electricity Utilities (Feed-in Tariff) and other laws” (enforced April 1, 2017) stipulates that, regarding contracts of purchase on and after April 1, 2017, the definition of businesses obliged to purchase electricity will be changed to general electricity transmission and distribution businesses and others.

22Outline of electricity rate reduction [1]
○Saving of fuel costs for thermal power generation due to resumption of operation of Units 3 and 4 of Takahama Nuclear Power Plant, and deepened streamlining of management, etc. result in the cost of 1,953.8 billion yen after this rate reduction which represents reduction by -4.29% (-87.7 billion yen) on average as compared with 2,041.5 billion yen that is the electricity income before the rate reduction.
2,041.5
1,953.8
-4.29%(-87.7)
Comparison of the cost this time and the electricity income before the rate reduction (income at the current rate)(Unit: billion yen)
Electricity sales 114.4 TWh
Income from the rate before the reduction this time(17.85 yen/kWh)
Cost this time(17.08 yen/kWh)
Rate reduction due to resumption of operation of Takahama Units 3 and 4, deepened streamlining of management, etc.
Regulated field -3.15%
Liberalized field -4.90%
* The period for cost calculation this time is FY2017.* Electricity income before the rate reduction is
calculated based on electric sales that is the precondition of cost calculation this time and unit electricity rate (Excluding renewable energy promotion surcharge, and amount equivalent to consumption tax)
* Revenue from intra-area wheeling service is excluded.
* Implemented on August 1, 2017

23
[2]Rate reduction due to resumption of operation
[1]Rate reduction due to fuel cost adjustment
Outline of electricity rate reduction [2]
19.96
17.08
-11%
-2.0%
-2.3%
○For fuel cost adjustment, crude oil price reduction results in the rate reduction. Refer to [1] below: approximately -11%
○ This time, the rate is reduced by -4.29% on average.• Reflection of saving of fuel costs for thermal power generation due to resumption of operation of
Takahama Units 3 and 4*1
Refer to [2] below: approximately -2.0%(-41.0 bllion yen)• Further reflection of deepened streamlining of management, etc.
Refer to [3] below: approximately -2.3% (-46.7 billion yen)
Rate reduction this time-4.29%(-87.7 billion yen)
Fuel costs for thermal power generation after electricity rate reduction
-11%
-2.0%
The electricity rate after the reduction this time(Unit : yen/kWh)
[1]Reduction due to fuel cost adjustment
[2]Reduction due to resumption of operation of Takahama Units 3 and 4(-41.0 billion yen)
[3]Rate reduction due to deepened streamlining of management, etc.(Of -46.7 billion yen,-46.1 billion yen represents amount from deepened streamlining)
After the rate increase in June 2015*2
After the rate reduction this time
*1 Saving of fuel costs for thermal power generation, etc.: Improvement of nuclear power capacity factor+9.0% Amount affected by change in nuclear power capacity factor by 1% -4.6 billion yen -41.0 billion yen*2 After the rate increase in June 2015:Level of electricity rate after expiration of period for mitigation (June 1 ~ September 30, 2015)
Unit cost of fuel for thermal power generation
Quantity of fuel for thermal power generation
(Scale is for illustration purpose only.)
* Implemented on August 1, 2017
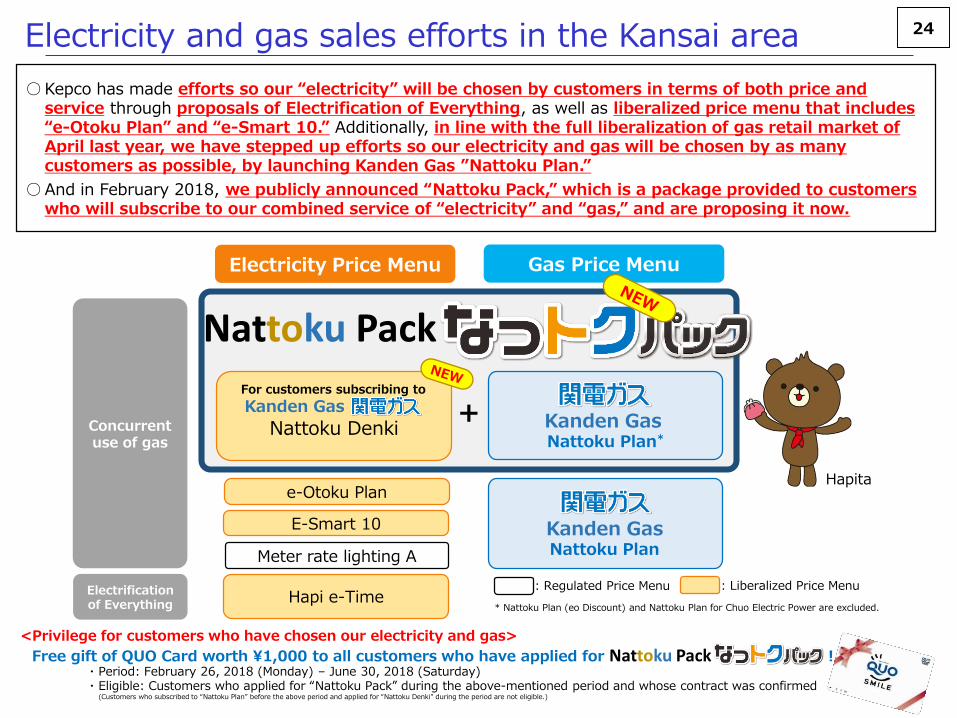
24Electricity and gas sales efforts in the Kansai area
○ Kepco has made efforts so our “electricity” will be chosen by customers in terms of both price and service through proposals of Electrification of Everything, as well as liberalized price menu that includes “e-Otoku Plan” and “e-Smart 10.” Additionally, in line with the full liberalization of gas retail market of April last year, we have stepped up efforts so our electricity and gas will be chosen by as many customers as possible, by launching Kanden Gas ”Nattoku Plan.”
○ And in February 2018, we publicly announced “Nattoku Pack,” which is a package provided to customers who will subscribe to our combined service of “electricity” and “gas,” and are proposing it now.
Electricity Price Menu Gas Price Menu
: Regulated Price Menu : Liberalized Price Menu
* Nattoku Plan (eo Discount) and Nattoku Plan for Chuo Electric Power are excluded.
Concurrent use of gas
Electrification of Everything
Hapita
Hapi e-Time
E-Smart 10 Kanden GasNattoku PlanMeter rate lighting A
e-Otoku Plan
Nattoku Denki Kanden GasNattoku Plan*
For customers subscribing to
Kanden Gas +
<Privilege for customers who have chosen our electricity and gas>
Free gift of QUO Card worth ¥1,000 to all customers who have applied for Nattoku Pack !・ Period: February 26, 2018 (Monday) – June 30, 2018 (Saturday)・ Eligible: Customers who applied for “Nattoku Pack” during the above-mentioned period and whose contract was confirmed
(Customers who subscribed to “Nattoku Plan” before the above period and applied for “Nattoku Denki” during the period are not eligible.)
Nattoku Pack
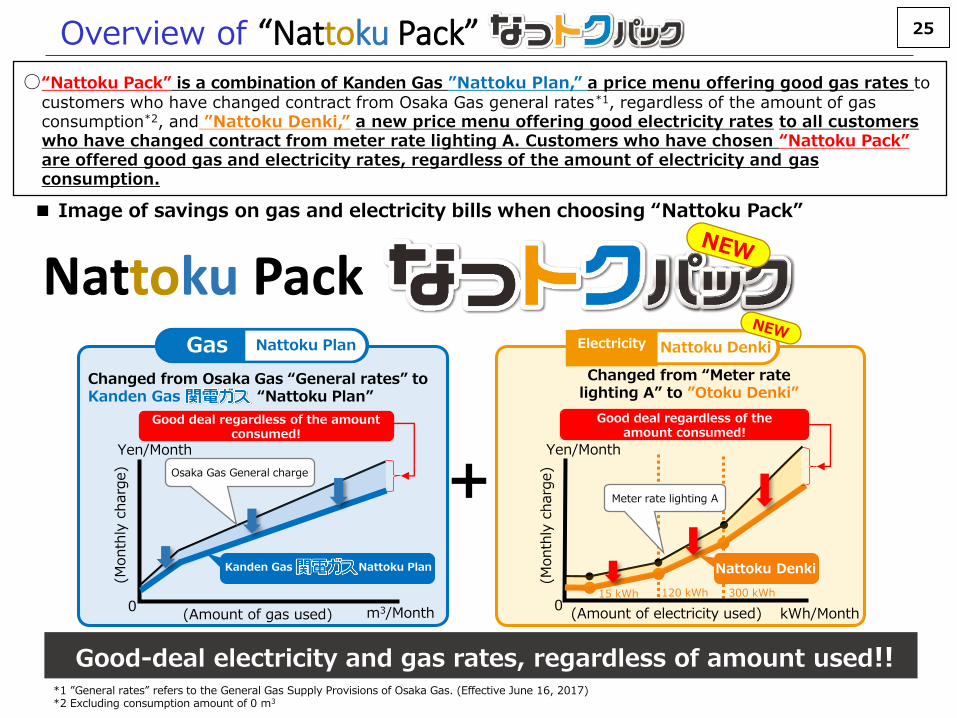
25Overview of “Nattoku Pack”○“Nattoku Pack” is a combination of Kanden Gas ”Nattoku Plan,” a price menu offering good gas rates to
customers who have changed contract from Osaka Gas general rates*1, regardless of the amount of gas consumption*2, and ”Nattoku Denki,” a new price menu offering good electricity rates to all customers who have changed contract from meter rate lighting A. Customers who have chosen “Nattoku Pack”are offered good gas and electricity rates, regardless of the amount of electricity and gas consumption.
■ Image of savings on gas and electricity bills when choosing “Nattoku Pack”
*1 ”General rates” refers to the General Gas Supply Provisions of Osaka Gas. (Effective June 16, 2017) *2 Excluding consumption amount of 0 m3
(Amount of gas used)
(Month
ly c
harg
e)
Yen/Month
m3/Month0
Kanden Gas Nattoku Plan
Osaka Gas General charge
Changed from Osaka Gas “General rates” to Kanden Gas “Nattoku Plan”
Electricity Nattoku DenkiGas Nattoku Plan
Changed from “Meter rate lighting A” to ”Otoku Denki”
(Amount of electricity used)
(Month
ly c
harg
e)
Yen/Month
kWh/Month0
120 kWh 300 kWh15 kWh
Nattoku Denki
Meter rate lighting A
Good deal regardless of the amount consumed!
Good deal regardless of the amount consumed!
Good-deal electricity and gas rates, regardless of amount used!!
+
Nattoku Pack
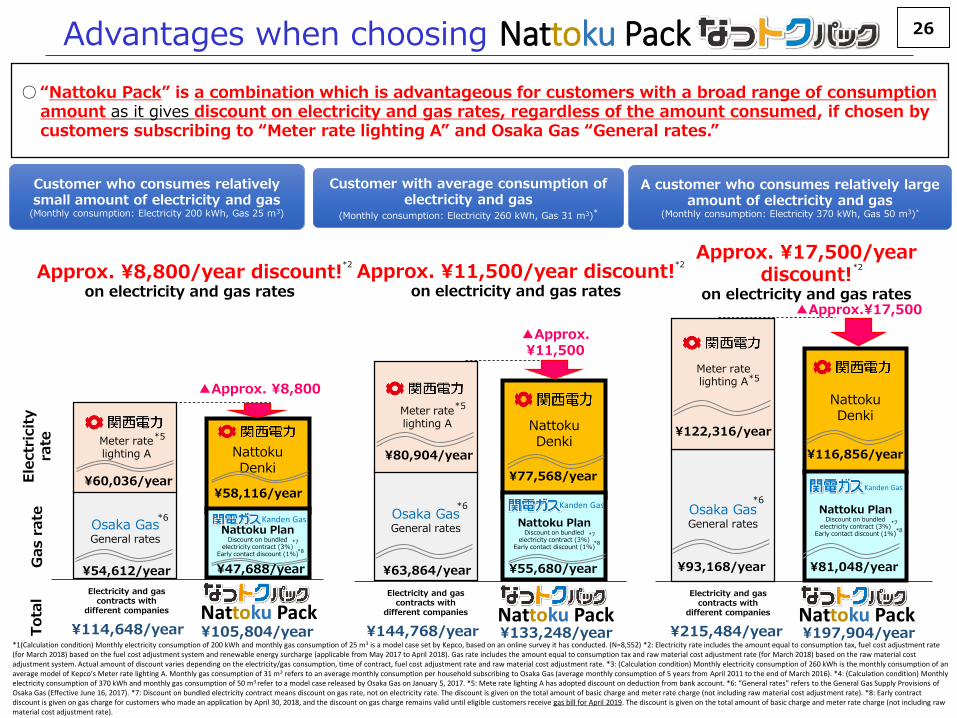
26Advantages when choosing Nattoku Pack
*1(Calculation condition) Monthly electricity consumption of 200 kWh and monthly gas consumption of 25 m3 is a model case set by Kepco, based on an online survey it has conducted. (N=8,552) *2: Electricity rate includes the amount equal to consumption tax, fuel cost adjustment rate (for March 2018) based on the fuel cost adjustment system and renewable energy surcharge (applicable from May 2017 to April 2018). Gas rate includes the amount equal to consumption tax and raw material cost adjustment rate (for March 2018) based on the raw material cost adjustment system. Actual amount of discount varies depending on the electricity/gas consumption, time of contract, fuel cost adjustment rate and raw material cost adjustment rate. *3: (Calculation condition) Monthly electricity consumption of 260 kWh is the monthly consumption of an average model of Kepco’s Meter rate lighting A. Monthly gas consumption of 31 m3 refers to an average monthly consumption per household subscribing to Osaka Gas (average monthly consumption of 5 years from April 2011 to the end of March 2016). *4: (Calculation condition) Monthly electricity consumption of 370 kWh and monthly gas consumption of 50 m3 refer to a model case released by Osaka Gas on January 5, 2017. *5: Mete rate lighting A has adopted discount on deduction from bank account. *6: “General rates” refers to the General Gas Supply Provisions of Osaka Gas (Effective June 16, 2017). *7: Discount on bundled electricity contract means discount on gas rate, not on electricity rate. The discount is given on the total amount of basic charge and meter rate charge (not including raw material cost adjustment rate). *8: Early contract discount is given on gas charge for customers who made an application by April 30, 2018, and the discount on gas charge remains valid until eligible customers receive gas bill for April 2019. The discount is given on the total amount of basic charge and meter rate charge (not including raw material cost adjustment rate).
Customer who consumes relatively small amount of electricity and gas
(Monthly consumption: Electricity 200 kWh, Gas 25 m3)
Approx. ¥8,800/year discount!on electricity and gas rates
※1 ※3 ※4
Ele
ctr
icit
y
rate
Gas r
ate
Tota
l
¥133,248/year¥144,768/year ¥197,904/year¥215,484/year¥105,804/year¥114,648/year
Electricity and gas contracts with
different companies
Electricity and gas contracts with
different companies
Electricity and gas contracts with
different companies
NattokuDenki
¥116,856/year
Nattoku PlanDiscount on bundled
electricity contract (3%)Early contact discount (1%)
¥81,048/year
Osaka GasGeneral rates
▲Approx.¥17,500
Meter rate lighting A
¥122,316/year
¥93,168/year
NattokuDenki
Nattoku PlanDiscount on bundled
electricity contract (3%)Early contact discount (1%)
Osaka GasGeneral rates
¥63,864/year
¥80,904/year
▲Approx. ¥11,500
Meter rate lighting A
NattokuDenki
Nattoku PlanDiscount on bundled
electricity contract (3%)Early contact discount (1%)
Osaka GasGeneral rates
¥54,612/year
¥60,036/year
▲Approx. ¥8,800
Meter rate lighting A
¥55,680/year
¥77,568/year
¥58,116/year
¥47,688/year
*7
*8
Approx. ¥11,500/year discount!on electricity and gas rates
Approx. ¥17,500/year discount!
on electricity and gas rates
*2
*7
*8
*7
*8
*6
*6*6
*5
*5
*5
○ “Nattoku Pack” is a combination which is advantageous for customers with a broad range of consumption amount as it gives discount on electricity and gas rates, regardless of the amount consumed, if chosen by customers subscribing to “Meter rate lighting A” and Osaka Gas “General rates.”
A customer who consumes relatively large amount of electricity and gas
(Monthly consumption: Electricity 370 kWh, Gas 50 m3)*
Customer with average consumption of electricity and gas
(Monthly consumption: Electricity 260 kWh, Gas 31 m3)*
*2 *2
Kanden Gas
Nattoku Pack Nattoku Pack Nattoku Pack
Kanden Gas
Kanden Gas
27Electricity sales efforts made so far in the Tokyo metropolitan area
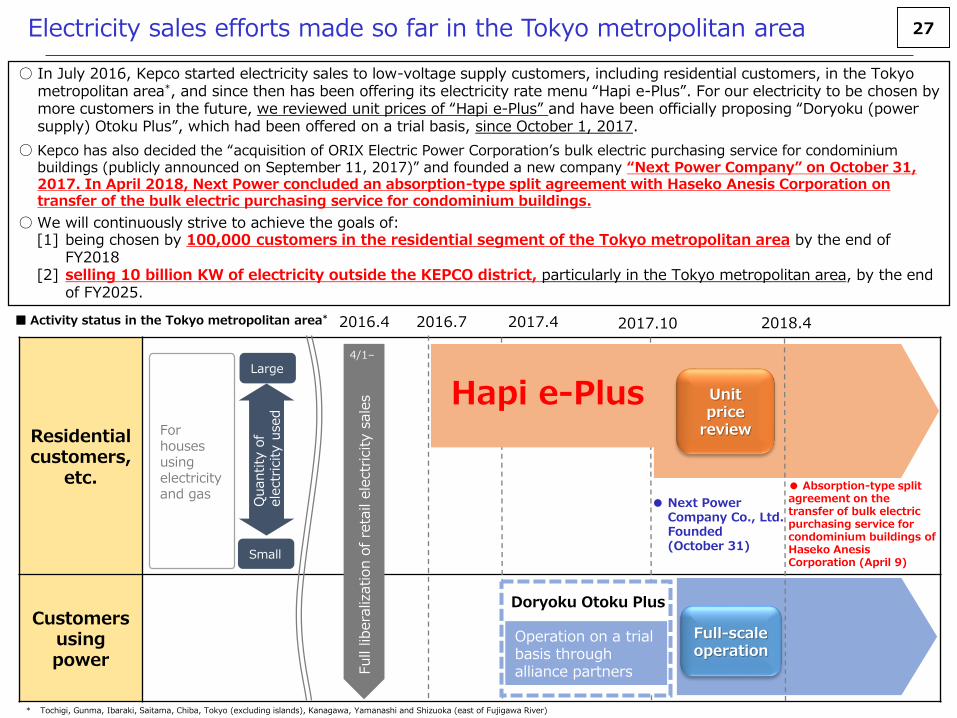
○ In July 2016, Kepco started electricity sales to low-voltage supply customers, including residential customers, in the Tokyo metropolitan area*, and since then has been offering its electricity rate menu “Hapi e-Plus”. For our electricity to be chosen by more customers in the future, we reviewed unit prices of “Hapi e-Plus” and have been officially proposing “Doryoku (power supply) Otoku Plus”, which had been offered on a trial basis, since October 1, 2017.
○ Kepco has also decided the “acquisition of ORIX Electric Power Corporation’s bulk electric purchasing service for condominium buildings (publicly announced on September 11, 2017)” and founded a new company “Next Power Company” on October 31, 2017. In April 2018, Next Power concluded an absorption-type split agreement with Haseko Anesis Corporation on transfer of the bulk electric purchasing service for condominium buildings.
○ We will continuously strive to achieve the goals of:[1] being chosen by 100,000 customers in the residential segment of the Tokyo metropolitan area by the end of
FY2018[2] selling 10 billion KW of electricity outside the KEPCO district, particularly in the Tokyo metropolitan area, by the end
of FY2025.
Residential customers,
etc.
Customers using power
2016.72016.4
Full
libera
lization o
f re
tail
ele
ctr
icity
sale
s 4/1–
Activity status in the Tokyo metropolitan area*
For houses using electricity and gas
Quantity
of
ele
ctr
icity u
sed
Large
Small
* Tochigi, Gunma, Ibaraki, Saitama, Chiba, Tokyo (excluding islands), Kanagawa, Yamanashi and Shizuoka (east of Fujigawa River)
2017.4 2017.10 2018.4
Doryoku Otoku Plus
Operation on a trial basis through alliance partners
Full-scale operation
● Next PowerCompany Co., Ltd.Founded(October 31)
Hapi e-Plus Unit price
review
● Absorption-type split agreement on the transfer of bulk electric purchasing service for condominium buildings of Haseko AnesisCorporation (April 9)
28
0
50
100
150
2000 2002 2005 2016 2017
7153
18
100
170
2018 2025
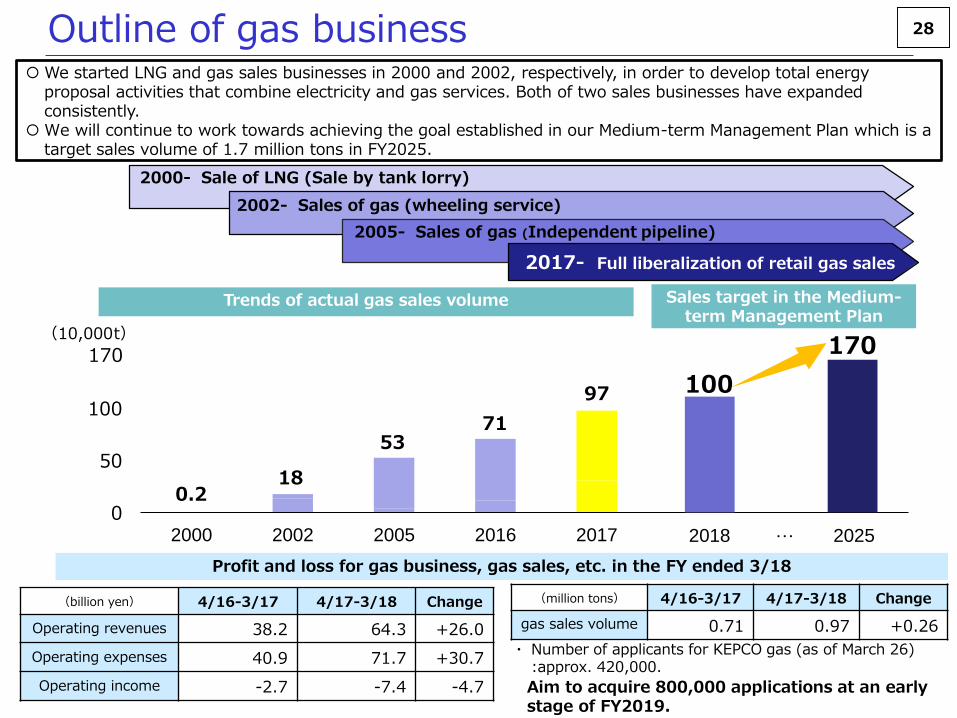
(billion yen) 4/16-3/17 4/17-3/18 Change
Operating revenues 38.2 64.3 +26.0
Operating expenses 40.9 71.7 +30.7
Operating income -2.7 -7.4 -4.7
(million tons) 4/16-3/17 4/17-3/18 Change
gas sales volume 0.71 0.97 +0.26
0.2
170
97
…
We started LNG and gas sales businesses in 2000 and 2002, respectively, in order to develop total energy proposal activities that combine electricity and gas services. Both of two sales businesses have expanded consistently.
We will continue to work towards achieving the goal established in our Medium-term Management Plan which is a target sales volume of 1.7 million tons in FY2025.
Outline of gas business
(10,000t)
2000- Sale of LNG (Sale by tank lorry)
2002- Sales of gas (wheeling service)
2005- Sales of gas (Independent pipeline)
Trends of actual gas sales volume Sales target in the Medium-term Management Plan
2017- Full liberalization of retail gas sales
Profit and loss for gas business, gas sales, etc. in the FY ended 3/18
・ Number of applicants for KEPCO gas (as of March 26):approx. 420,000.
Aim to acquire 800,000 applications at an early stage of FY2019.

29Outline of IT/Communications business○ Working mainly with K-Opticom Corporation, a core company, and Kanden System Solutions Co., Inc. , we
are actively promoting new services including IoT, in addition to fixed-line services using optical fiber networks, mobile phone services, and information system development, aiming to achieve 30 billion yen of ordinary income for FY2025.
[Results and target of Medium-term Management Plan]
Internet
Mobile phone (MVNO)
Data center/Cloud
FTTH for residentialcustomers
Optical line for
corporate customers
Information system
development
Solutions such as cloud
Key Businesses and Accomplishments of IT/Communications Business
MVNO Business (mineo)
FTTH Business
12.2%
11.4%
13.9%
Source: Mobile Marketing Data Lab., “Survey of low-cost SIM services satisfaction for March 2017”
[External evaluation of customer satisfaction]
Optical Fiber Network
Source: MM Research Institute, “Fluctuations in the domestic MVNO market (end of September 2017)”
[MVNO share (September 2017)]
• Having been providing the optical fiber-based network, telephone and TV by the set in step with the diffusion of broadband. Acquired more than 1.6 million contracts and stable profits secured.
• Started to offer privileges for long-term subscribers and sell electricity and gas by the set in addition to providing high-quality support, with the result of high commendation from customers.
• Achieve 1 million lines in April.
• Co-creation of services with customers such as line services compatible with au and docomo lines and the community site, “mineo”, and enhancement of support in real shops, with resulting high customer satisfaction.
(billion yen) 2016(Results)
2017(Results)
2018(Forecasts)
2025(Target)
Operating revenues
(external transactions)
185.6 203.1 225.0 270.0
Ordinary income 18.3 25.1 26.0 30.0
LP gas meter
Solution using IoT(new business)
Our foothold is steadily being reinforced for the achievement of our medium-term management plan.
[Community site]
Community that “co-creates” services with “fans” online
[External evaluation of customer satisfaction][Privileges for long-term subscribers]
mineo8.2%

30Outline of Real Estate businessWe have established a consolidated real estate business group centered on the core company, Kanden Realty & Development Co., Ltd., a group which works on real estate leasing, sales, management, and leisure. Targeting 30 billion yen of ordinary income for FY2025, we will accelerate growth and diversify risks by expanding business areas and business domains (diversifying revenue sources).
(billion yen) 2016(Results)
2017(Results)
2018(Forecasts)
2025(Target)
Operating revenues
(external transactions)95.5 111.7 120.0 150.0
Ordinary income 12.8 14.5 15.0 30.0
[Results/planned number of units for sale]Number of housing units for sale, growing because of active promotion
of the new brand “CIELIA”
Proactive expansion to the Tokyo Metropolitan area
• Medium-term Management Plan formulated.
• Business foundation was reinforced by restructuring of real estate business.
<Strength in the KEPCO group real estate business>
Strength in brand power and credit-worthiness long cultivated in the Kansai area, and total capacity as a group that is expected to produce synergetic effects.
<Expansion of business areas and business domains>Expanding to the solid Tokyo Metropolitan market, core cities nationwide, and overseas including South East Asia and North America with Kansai as the axis.
Business centering on the Kansai area
(Units)
Expansion to overseas and other areas in Japan as well
[Condominium in Kansai]“CIELIA TOWER Senrichuo”
* To be completed in February 2019 (552 units)
[Condominium in the Tokyo metropolitan area]“CIELIA Shonantsujido”
* To be completed in February 2018 (352 units)
<Flagship Project>
* 469 units separately sold wholesale to other operators
* Investment in the US office building fund (2 cases)
* Participation in the condominium development project in Vietnam.
Expected to achieve the 2018 target because of growing sales of condominiumsand other factors.
* Including Life business[Results and target of Medium-term Management Plan]
* Acquisition of Shiba-Park Building
630 605800
1,000 1,000
2016 2017 2018 2019 2020(※)
31Overseas investment projects
Project TitleStart of operation,
etc.(schedule)Total output
(MW)
KEPCO’s investment
(%)
Output by KEPCO’s investment
(MW-equivalent)
In o
pera
tion
Philippines San Roque Hydropower 2003/05 436 50 218
Thailand Rojana Electricity and Heat Supply 1999/05 505 39 197
TaiwanMing Jian Hydropower 2007/09 17 24 4
Kuo Kuang Thermal Power 2003/11 480 20 96
Singapore Senoko Thermal Power Established 1995/10 3,300 15 495
Australia Bluewaters Thermal power 2009/12 459 50 229
USA
West Deptford
Thermal power generation business
2014/11 768 17.5 134
Empire Thermal power generation business
2010/9 635 25 159
Ireland Evalair Limited 2013/12 Other 223 24 54
Under d
evelo
pm
ent
Indonesia
Rajamandala Hydropower Scheduled in 2019 47 49 23
Tanjung Jati B Thermal Power Scheduled in 2021 2,140 25 535
Laos Nam Ngiep Hydropower Scheduled in 2019 290 45 131
USAHickory-Run Thermal power generation business
Scheduled in2020
1,000 30 300
UK・Germany
NeuConnect InterconnectorScheduled in
2022ー 18.3 ー
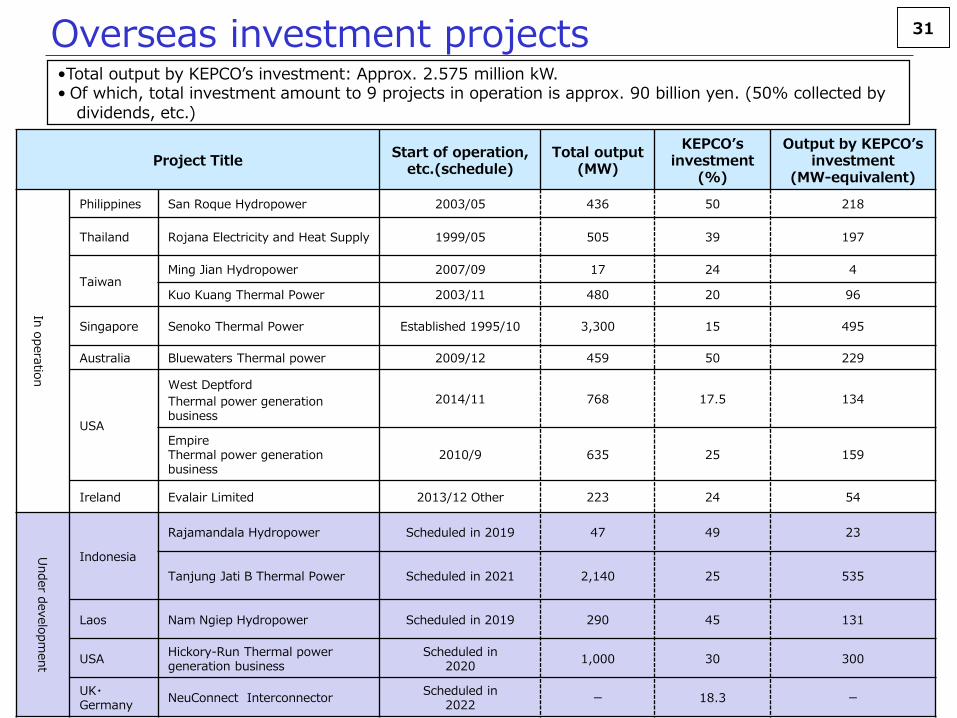
•Total output by KEPCO’s investment: Approx. 2.575 million kW.• Of which, total investment amount to 9 projects in operation is approx. 90 billion yen. (50% collected by
dividends, etc.)
32
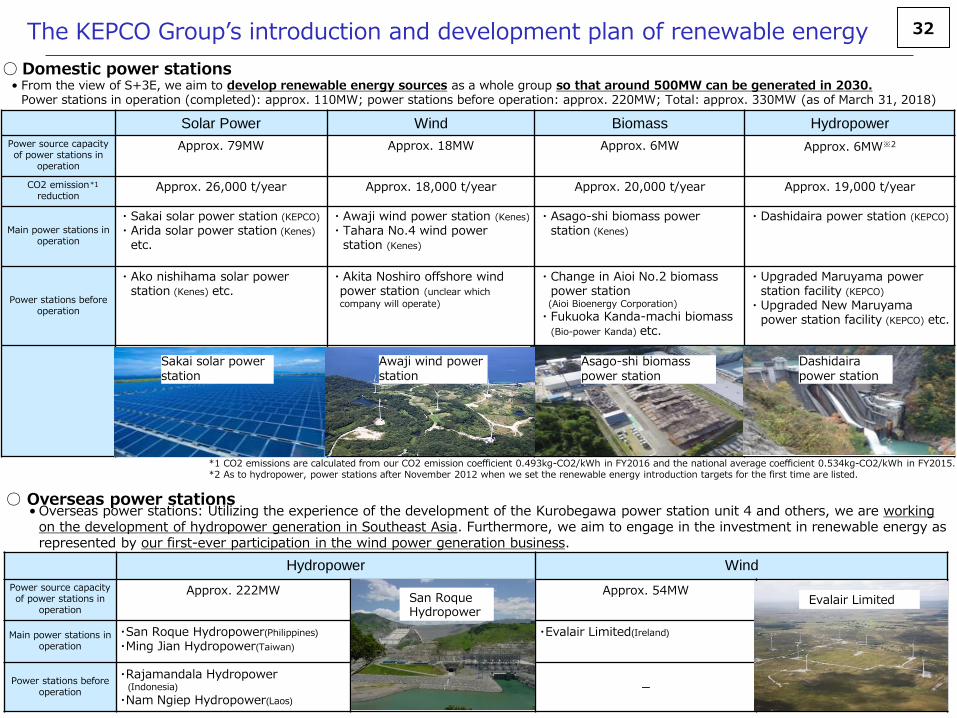
• Overseas power stations: Utilizing the experience of the development of the Kurobegawa power station unit 4 and others, we are working on the development of hydropower generation in Southeast Asia. Furthermore, we aim to engage in the investment in renewable energy as represented by our first-ever participation in the wind power generation business.
• From the view of S+3E, we aim to develop renewable energy sources as a whole group so that around 500MW can be generated in 2030.Power stations in operation (completed): approx. 110MW; power stations before operation: approx. 220MW; Total: approx. 330MW (as of March 31, 2018)
○ Domestic power stations
○ Overseas power stations
*1 CO2 emissions are calculated from our CO2 emission coefficient 0.493kg-CO2/kWh in FY2016 and the national average coefficient 0.534kg-CO2/kWh in FY2015.*2 As to hydropower, power stations after November 2012 when we set the renewable energy introduction targets for the first time are listed.
Solar Power Wind Biomass Hydropower
Power source capacity of power stations in
operation
Approx. 79MW Approx. 18MW Approx. 6MW Approx. 6MW※2
CO2 emission reduction
Approx. 26,000 t/year Approx. 18,000 t/year Approx. 20,000 t/year Approx. 19,000 t/year
Main power stations in operation
・Sakai solar power station (KEPCO)
・Arida solar power station (Kenes)
etc.
・Awaji wind power station (Kenes)
・Tahara No.4 wind power station (Kenes)
・Asago-shi biomass power station (Kenes)
・Dashidaira power station (KEPCO)
Power stations before operation
・Ako nishihama solar power station (Kenes) etc.
・Akita Noshiro offshore wind power station (unclear which
company will operate)
・Change in Aioi No.2 biomass power station(Aioi Bioenergy Corporation)
・Fukuoka Kanda-machi biomass (Bio-power Kanda) etc.
・Upgraded Maruyama powerstation facility (KEPCO)
・Upgraded New Maruyama power station facility (KEPCO) etc.
Sakai solar power station
Awaji wind power station
Asago-shi biomass power station
Dashidairapower station
Hydropower Wind
Power source capacity of power stations in
operation
Approx. 222MW Approx. 54MW
Main power stations in operation
・San Roque Hydropower(Philippines)
・Ming Jian Hydropower(Taiwan)
・Evalair Limited(Ireland)
Power stations before operation
・Rajamandala Hydropower(Indonesia)
・Nam Ngiep Hydropower(Laos)
ー
San RoqueHydropower
Evalair Limited
*1
The KEPCO Group’s introduction and development plan of renewable energy

33
2010 2016 2017
Fuel and purchased electricity cost (billion yen) 7,656 9,851 9,750
CO2 emission factor (kg-CO2/kWh) 0.281 0.493 -
Nuclear capacity factor (%) 78.2 0.0 18.0
※1 ※2
KEPCO’s power source composition
○From the view of “S+3E”, we will deal with use of nuclear power and development of hydropower and renewable energy in a balanced manner, and make efforts for cost reduction of fuel etc. and CO2 emission control.
To be increasedby achieving early restart of operation
火力
水力・再エネ
To be increased by FIT and self-development
In the future
At the end ofFY2017
【Total power generation capacity 】 【Total power source composition 】
2010
Nuclear44%
Oil 4%
Hydro & renewable energy
11%
2017
Thermal
Nuclear
Hydro & renewable
energy Renewable energy
Hydro
Nuclear
LNG
Coal
Oil
26%
27%
20~22%
13~15%
8~9%
3%
【 Expected energy supply and demand structure in the government 】
Non-fo
ssil
To be operated effectively based on supply-demand balance
Hydro & Renewable energy &FIT31%
LNG24%
Coal12%
Oil17%
Nuclear16%
(Including from other electric company) (Including from other electric company)
Coal21%
LNG20%
otherLess than 1%*
Oil 3%
Coal26%
LNG41%
Nuclear10%
Hydro & renewable
energy12%
FIT 4%other 4%
OtherLess than 1%*
2030* Includes electricity whose suppliers cannot be specified. Procured in the wholesale power market or from other companies.
* Some rounding errors may be observed. Expected energy supply and demand structure defined by the government→ The goal is stable supply, economical efficiency and environmentally balanced mix on the premise of safety.
Reduction of fuelcost etc.
Reduction of emissionbasic units
*1 After deduction reflecting CO2 credit *2. Actual results of FY2017 are now being calculated. (The calculation results are to be released on our website from the end of July to the beginning of August.)
34
【排出係数などの推移】
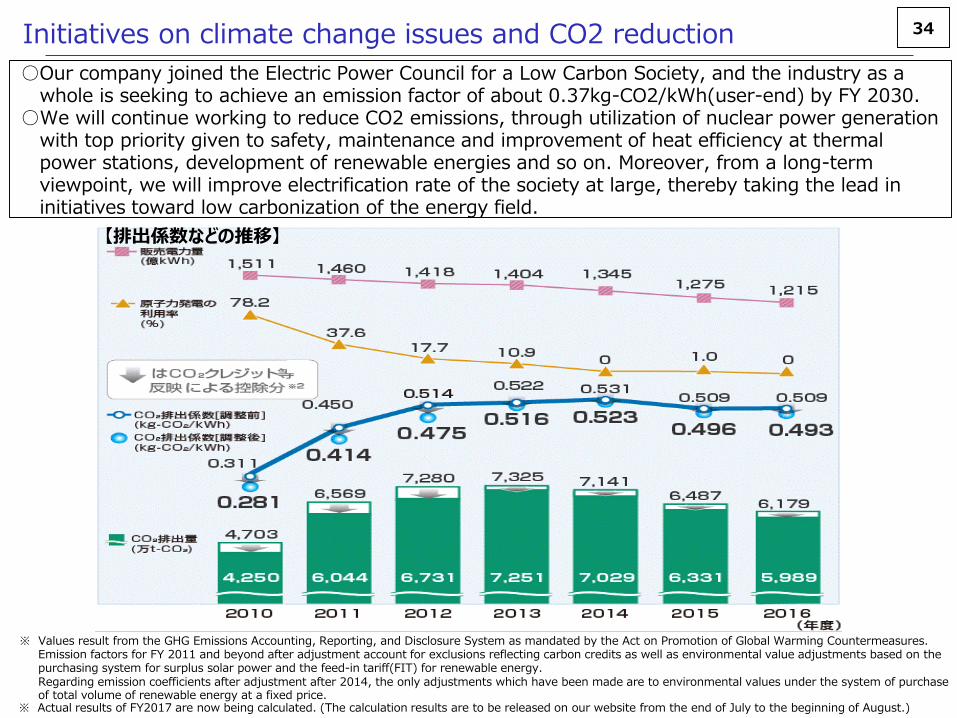
○Our company joined the Electric Power Council for a Low Carbon Society, and the industry as a whole is seeking to achieve an emission factor of about 0.37kg-CO2/kWh(user-end) by FY 2030.
○We will continue working to reduce CO2 emissions, through utilization of nuclear power generation with top priority given to safety, maintenance and improvement of heat efficiency at thermal power stations, development of renewable energies and so on. Moreover, from a long-term viewpoint, we will improve electrification rate of the society at large, thereby taking the lead in initiatives toward low carbonization of the energy field.
※ Values result from the GHG Emissions Accounting, Reporting, and Disclosure System as mandated by the Act on Promotion of Global Warming Countermeasures.Emission factors for FY 2011 and beyond after adjustment account for exclusions reflecting carbon credits as well as environmental value adjustments based on the purchasing system for surplus solar power and the feed-in tariff(FIT) for renewable energy.Regarding emission coefficients after adjustment after 2014, the only adjustments which have been made are to environmental values under the system of purchase of total volume of renewable energy at a fixed price.
※ Actual results of FY2017 are now being calculated. (The calculation results are to be released on our website from the end of July to the beginning of August.)
Initiatives on climate change issues and CO2 reduction
35
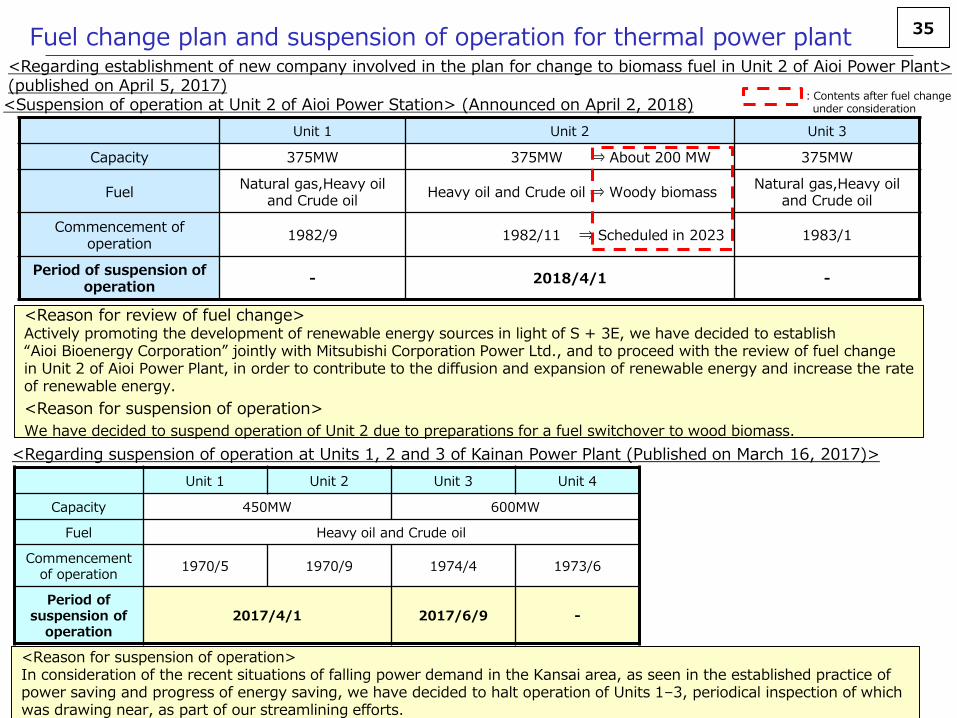
<Reason for review of fuel change>Actively promoting the development of renewable energy sources in light of S + 3E, we have decided to establish “Aioi Bioenergy Corporation” jointly with Mitsubishi Corporation Power Ltd., and to proceed with the review of fuel change in Unit 2 of Aioi Power Plant, in order to contribute to the diffusion and expansion of renewable energy and increase the rateof renewable energy.
<Reason for suspension of operation>
We have decided to suspend operation of Unit 2 due to preparations for a fuel switchover to wood biomass.
Unit 1 Unit 2 Unit 3
Capacity 375MW 375MW ⇒ About 200 MW 375MW
FuelNatural gas,Heavy oil
and Crude oilHeavy oil and Crude oil ⇒ Woody biomass
Natural gas,Heavy oil and Crude oil
Commencement of operation
1982/9 1982/11 ⇒ Scheduled in 2023 1983/1
Period of suspension of operation
- 2018/4/1 -
Fuel change plan and suspension of operation for thermal power plant<Regarding establishment of new company involved in the plan for change to biomass fuel in Unit 2 of Aioi Power Plant> (published on April 5, 2017)
<Regarding suspension of operation at Units 1, 2 and 3 of Kainan Power Plant (Published on March 16, 2017)>
Unit 1 Unit 2 Unit 3 Unit 4
Capacity 450MW 600MW
Fuel Heavy oil and Crude oil
Commencement of operation
1970/5 1970/9 1974/4 1973/6
Period of suspension of
operation2017/4/1 2017/6/9 -
<Reason for suspension of operation>In consideration of the recent situations of falling power demand in the Kansai area, as seen in the established practice of power saving and progress of energy saving, we have decided to halt operation of Units 1–3, periodical inspection of which was drawing near, as part of our streamlining efforts.
<Suspension of operation at Unit 2 of Aioi Power Station> (Announced on April 2, 2018):Contents after fuel change
under consideration
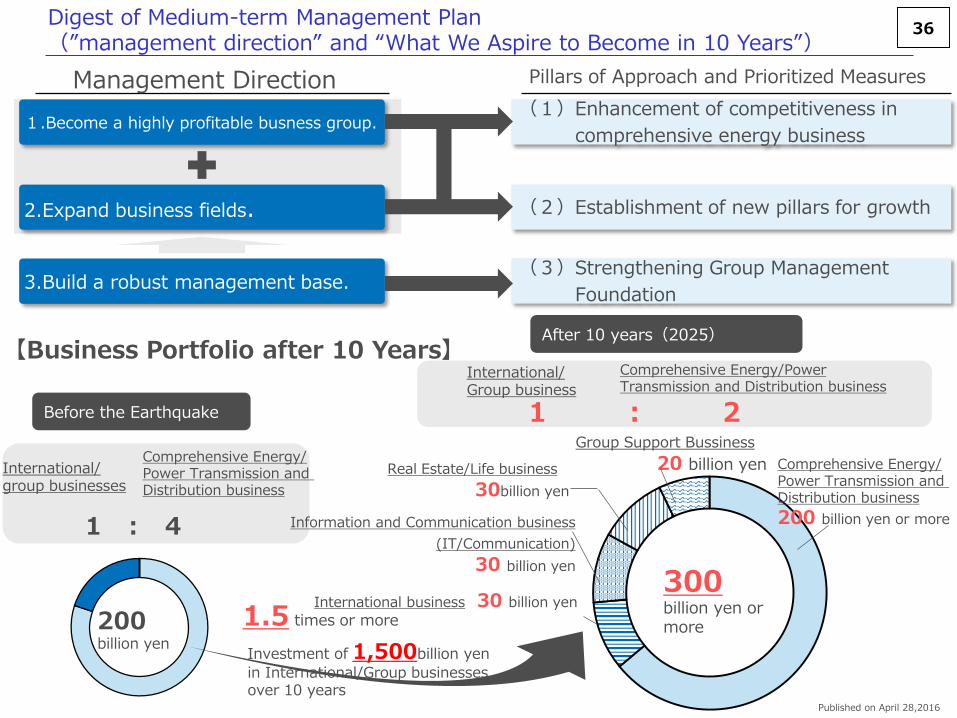
36Digest of Medium-term Management Plan(”management direction” and “What We Aspire to Become in 10 Years”)
1.5 times or more
Management Direction Pillars of Approach and Prioritized Measures
Comprehensive Energy/Power Transmission and Distribution business
International/group businesses
After 10 years(2025)
Before the Earthquake
200billion yen
1 : 4
Group Support Bussiness
20 billion yen
300billion yen or more
Comprehensive Energy/Power Transmission and Distribution business
200 billion yen or more
International business 30 billion yen
Information and Communication business
(IT/Communication)
30 billion yen
Real Estate/Life business
30billion yen
1 : 2
Investment of 1,500billion yen
in International/Group businesses over 10 years
Comprehensive Energy/Power Transmission and Distribution business
International/Group business
【Business Portfolio after 10 Years】
1.Become a highly profitable busness group.
2.Expand business fields.
3.Build a robust management base.
(1)Enhancement of competitiveness in
comprehensive energy business
(2)Establishment of new pillars for growth
(3)Strengthening Group Management
Foundation
Published on April 28,2016

37Digest of Medium-term Management Plan(Financial goal and policy or return to shareholders)
□ Financial goals 〔Consolidated base〕
□ Policy of return to shareholders
Our Policy of return to shareholders is to secure sound financial strength and
maintain stable dividends in order to distribute surplus to all shareholders
appropriately as the Kansai Electric Power group.
Item 2018 fiscal year 2025 fiscal year
Ordinary income 200 billion Yen 300 billion Yen
Equity ratio Approx. 20% Approx. 30%
ROA Approx. 3.5% Approx. 4%(※)
(※)Business Profit 〔Ordinary income+interest expense〕 ÷ Total Assets 〔Average of beginning and end of term〕
Published on April 28,2016

38Financial/corporate data (1)
<Consolidated>
3/11 3/12 3/13 3/14 3/15 3/16 3/17 3/183/18
Forecasts
(Jan.2018)
3/19
Forecasts
Statement of operations
Operating revenues billion yen 2,769.7 2,811.4 2,859.0 3,327.4 3,406.0 3,245.9 3,011.3 3,133.6 3080.0 -
Operating income or loss billion yen 273.8 -229.3 -314.0 -71.7 -78.6 256.7 217.7 227.5 200.0 -
Ordinary income or loss billion yen 237.9 -265.5 -353.1 -111.3 -113.0 241.6 196.1 217.1 195.0 -
Extraordinary profit billion yen - - - - - - - - - -
Extraordinary loss billion yen 37.1 - - - - - - - - -
Net income or loss(※) billion yen 123.1 -242.2 -243.4 -97.4 -148.3 140.8 140.7 151.8 140.0 -
Net income/loss per share (EPS) yen 137.66 -271.12 -272.43 -109.01 -166.06 157.59 157.58 170.01 156.71 -
Balance sheets
Total assets billion yen 7,310.1 7,521.3 7,635.1 7,777.5 7,743.3 7,412.4 6,853.1 6,985.0
Net assets billion yen 1,832.4 1,529.8 1,278.1 1,213.1 1,060.2 1,201.8 1,344.6 1,472.7
Interest-bearing debt billion yen 3,409.8 3,864.9 4,210.2 4,396.8 4,315.2 3,938.2 3,821.5 3,708.2
Equity ratio % 24.8 20.1 16.5 15.3 13.4 15.9 19.3 20.8
Capital expenditures
Capital expenditures billion yen 455.5 420.6 435.2 418.9 420.6 369.3 344.0 407.0
Financial data
ROA (※) % 4.0 -2.9 -3.9 -0.7 -0.7 3.9 3.4 3.7
Operating cash flow billion yen 610.5 43.8 142.6 347.7 447.6 595.1 485.6 623.2
Free cash flow billion yen 62.5 -364.4 -287.9 -3.2 59.0 204.2 139.9 176.0
(※) The rate of business profit on total assets = business profit ( ordinary income + interest expense ) / total assets ( average of beginning and end of term )
Profit distribution to shareholders
Total amount of dividend billion yen 53.6 53.6 - - - - 22.3 35.7
Share-buyback billion yen 15.9 - - - - - - -
Total distribution (※) billion yen 53.6 53.6 - - - - 22.3 -
The rate of total distribution on net assets % 3.0 3.2 - - - - 1.8 -
(※) ( total amount of dividend for Fiscal year (N) ) + ( share-buyback for Fiscal year (N+1) )
Employees
Employees 32,418 32,961 33,537 33,657 33,539 33,089 32,666 32,527
(※)The consolidated net income or loss means the net income or loss attributable to owners of the parent company.
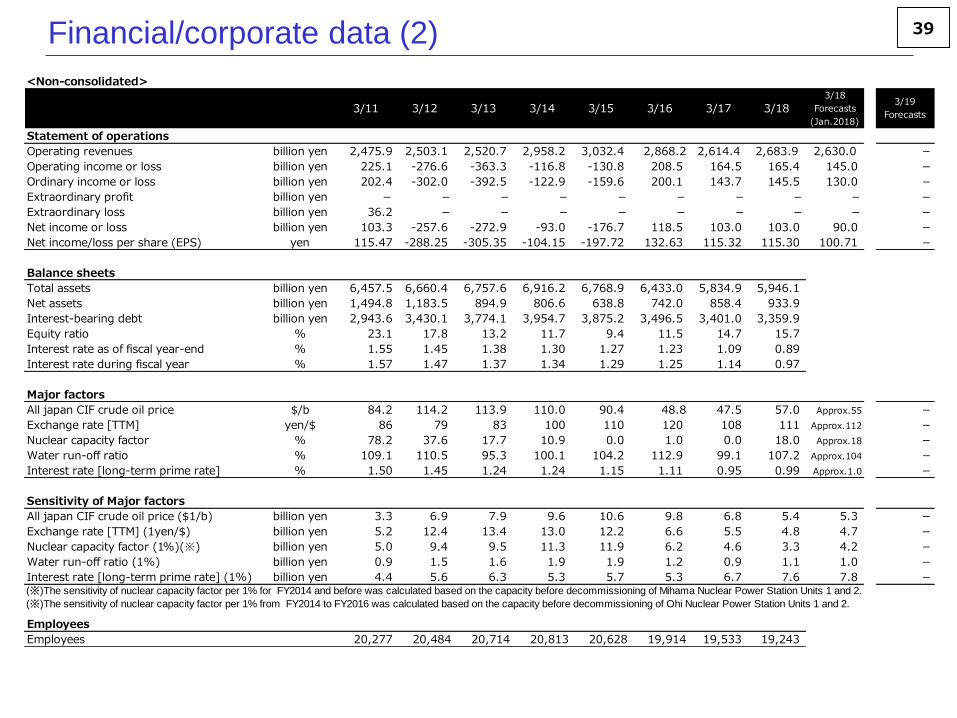
39Financial/corporate data (2)
<Non-consolidated>
3/11 3/12 3/13 3/14 3/15 3/16 3/17 3/183/18
Forecasts
(Jan.2018)
3/19
Forecasts
Statement of operations
Operating revenues billion yen 2,475.9 2,503.1 2,520.7 2,958.2 3,032.4 2,868.2 2,614.4 2,683.9 2,630.0 -
Operating income or loss billion yen 225.1 -276.6 -363.3 -116.8 -130.8 208.5 164.5 165.4 145.0 -
Ordinary income or loss billion yen 202.4 -302.0 -392.5 -122.9 -159.6 200.1 143.7 145.5 130.0 -
Extraordinary profit billion yen - - - - - - - - - -
Extraordinary loss billion yen 36.2 - - - - - - - - -
Net income or loss billion yen 103.3 -257.6 -272.9 -93.0 -176.7 118.5 103.0 103.0 90.0 -
Net income/loss per share (EPS) yen 115.47 -288.25 -305.35 -104.15 -197.72 132.63 115.32 115.30 100.71 -
Balance sheets
Total assets billion yen 6,457.5 6,660.4 6,757.6 6,916.2 6,768.9 6,433.0 5,834.9 5,946.1
Net assets billion yen 1,494.8 1,183.5 894.9 806.6 638.8 742.0 858.4 933.9
Interest-bearing debt billion yen 2,943.6 3,430.1 3,774.1 3,954.7 3,875.2 3,496.5 3,401.0 3,359.9
Equity ratio % 23.1 17.8 13.2 11.7 9.4 11.5 14.7 15.7
Interest rate as of fiscal year-end % 1.55 1.45 1.38 1.30 1.27 1.23 1.09 0.89
Interest rate during fiscal year % 1.57 1.47 1.37 1.34 1.29 1.25 1.14 0.97
Major factors
All japan CIF crude oil price $/b 84.2 114.2 113.9 110.0 90.4 48.8 47.5 57.0 Approx.55 -
Exchange rate [TTM] yen/$ 86 79 83 100 110 120 108 111 Approx.112 -
Nuclear capacity factor % 78.2 37.6 17.7 10.9 0.0 1.0 0.0 18.0 Approx.18 -
Water run-off ratio % 109.1 110.5 95.3 100.1 104.2 112.9 99.1 107.2 Approx.104 -
Interest rate [long-term prime rate] % 1.50 1.45 1.24 1.24 1.15 1.11 0.95 0.99 Approx.1.0 -
Sensitivity of Major factors
All japan CIF crude oil price ($1/b) billion yen 3.3 6.9 7.9 9.6 10.6 9.8 6.8 5.4 5.3 -
Exchange rate [TTM] (1yen/$) billion yen 5.2 12.4 13.4 13.0 12.2 6.6 5.5 4.8 4.7 -
Nuclear capacity factor (1%)(※) billion yen 5.0 9.4 9.5 11.3 11.9 6.2 4.6 3.3 4.2 -
Water run-off ratio (1%) billion yen 0.9 1.5 1.6 1.9 1.9 1.2 0.9 1.1 1.0 -
Interest rate [long-term prime rate] (1%) billion yen 4.4 5.6 6.3 5.3 5.7 5.3 6.7 7.6 7.8 -(※)The sensitivity of nuclear capacity factor per 1% for FY2014 and before was calculated based on the capacity before decommissioning of Mihama Nuclear Power Station Units 1 and 2.
(※)The sensitivity of nuclear capacity factor per 1% from FY2014 to FY2016 was calculated based on the capacity before decommissioning of Ohi Nuclear Power Station Units 1 and 2.
Employees
Employees 20,277 20,484 20,714 20,813 20,628 19,914 19,533 19,243

40Financial/corporate data (3)
<Non-Consolidated(Billion yen)>
Revenues and Expenses 3/11 3/12 3/13 3/14 3/15 3/16 3/17 3/18
Ordinary revenues 2,505.5 2,532.2 2,546.7 3,008.0 3,074.7 2,913.3 2,653.4 2,704.9
(Operating revenues) (2,475.9) (2,503.1) (2,520.7) (2,958.2) (3,032.4) (2,868.2) (2,614.4) (2,683.9)
Electricity sales 2,347.6 2,338.6 2,354.2 2,751.6 2,784.1 2,594.0 2,296.6 2,236.6
Grant under act on purchase of renewable energy sourced electricity - - 11.4 40.8 68.6 102.5 130.5 148.6
Others 157.9 193.5 181.0 215.5 221.9 216.7 226.1 319.6
Ordinary expenses 2,303.1 2,834.2 2,939.3 3,130.9 3,234.3 2,713.2 2,509.6 2,559.4
Personnel expenses 238.7 236.0 231.2 198.1 195.9 196.7 204.6 217.2
Fuel costs 387.4 776.8 919.8 1,159.2 1,186.5 710.3 523.5 520.1
Backend expenses of nuclear power 93.9 73.4 57.7 52.8 42.9 37.6 32.2 59.9
Maintenance costs 275.8 272.5 202.6 178.5 184.6 185.3 189.5 184.1
Taxes other than income taxes 152.8 148.8 145.6 149.8 148.4 148.0 148.4 144.7
Depreciation 339.6 316.9 294.7 298.3 298.1 281.7 277.4 250.7
Purchased power 378.2 530.3 567.9 554.9 571.1 493.5 461.6 466.7
Interest expenses 46.9 46.3 49.9 51.5 50.6 46.7 42.9 33.3
Levy under act on purchase of renewable energy sourced electricity - - 19.2 43.0 84.2 167.0 230.6 260.0
Others 389.3 432.9 450.3 444.4 471.5 445.9 398.5 422.3
Ordinary income or loss 202.4 -302.0 -392.5 -122.9 -159.6 200.1 143.7 145.5

41Financial/corporate data (4)
<Electricity sales (TWh)>
3/11 3/12 3/13 3/14 3/15 3/16 3/17 3/18
3/18
Forecasts
(Jan.2018)
3/19
Forecasts
Residential 52.3 50.0 49.0 48.4 45.9 44.1 43.7 41.8 41.0 -
Commercial and
Industrial 98.8 96.0 92.7 92.1 88.6 83.5 77.8 73.5 72.4 -
Total 151.1 146.0 141.8 140.4 134.5 127.5 121.5 115.2 113.5 -
*1 Some rounding errors may be observed.
<Electricity sales to other utility and non-utility companies(TWh)>
3/11 3/12 3/13 3/14 3/15 3/16 3/17 3/18
3/18
Forecasts
(Jan.2018)
3/19
Forecasts
2.4 3.3 2.3 2.4 3.3 3.1 3.9 7.2 6.6 -
*2 Not including imbalance electric energy, which is not yet determined as at the end of the term.
<Non-consolidated CAPEX (billion yen)>
3/11 3/12 3/13 3/14 3/15 3/16 3/17 3/18
3/18
Forecasts
(Jan.2018)
3/19
Forecasts
Power generating facilities 165.2 129.4 157.2 184.7 145.8 116.2 99.6 127.1 - -
Transmission 40.9 37.7 40.4 36.6 40.3 41.0 40.4 44.5 - -
Transformation 40.2 37.6 34.3 33.1 36.1 34.5 35.6 32.8 - -
Distribution 30.1 29.9 28.9 25.4 26.0 28.3 24.5 24.3 - -
Others 26.4 29.5 35.8 22.4 22.6 16.8 13.1 12.4 - -
Subtotal 302.8 264.1 296.6 302.2 270.8 237.0 213.5 241.4 - -
Nuclear fuel 58.2 55.0 37.8 22.8 29.0 16.4 14.3 53.0 - -
Total 361.0 319.1 334.4 325.0 299.8 253.4 227.9 294.5 - -
Non-electric business 1.1 0.8 0.1 - 0.2 0.7 4.5 0.9 - -
Grand total 362.1 319.9 334.5 325.0 300.0 254.1 232.4 295.4 Approx.330 -

42Financial/corporate data (5)<Total Power Generation(TWh)>
( ): composition ratio, %
3/17 3/18
Hydro 13.4( 14) 13.8( 15)
Oil/others 6.6( 7) 1.9( 2)
LNG 61.9( 65) 52.7( 56)
Coal 13.1( 14) 13.1( 14)
Total 81.5( 86) 67.8( 72)
Nuclear -0.4( 0) 12.9( 14)
New energy sources 0.1( 0) 0.1( 0)
Total 94.5(100) 94.5(100)
Other-non-utility companies 34.9 27.5
Captive use by hydropower -1.7 -1.5
Total 127.8 120.5
* Kepco’s FY 2016 figures represent sending end.
* Some rounding errors may be observed.
* "Other-non-utility companies″does not include imbalance electric energy, which is not yet determined as at the end of the term.
<Total Power Generation(TWh)> ( ): composition ratio, %
3/11 3/12 3/13 3/14 3/15 3/16
Hydro 15.1( 11) 15.0( 12) 13.0( 11) 13.3( 12) 13.6( 12) 14.8( 15)
Oil/others 5.6( 4 ) 19.1( 16) 23.6( 20) 27.0( 23) 19.5( 18) 15.2( 15)
LNG 31.5( 24) 43.7( 36) 49.3( 43) 52.5( 46) 62.3( 57) 58.4( 57)
Coal 12.3( 9) 12.4( 10) 14.0( 12) 12.8( 11) 13.4( 12) 12.9( 13)
Total 49.4( 38) 75.2( 61) 86.9( 75) 92.2( 80) 95.2( 87) 86.5( 85)
Nuclear 67.0( 51) 32.3( 26) 15.2( 13) 9.3( 8) 0( 0) 0.8( 1)
New energy sources 0.1( 0) 0.1( 0) 0.1( 0) 0.1( 0) 0.1( 0) 0.1( 0)
Total 131.5(100) 122.6(100) 115.1(100) 114.9(100) 108.8(100) 102.3(100)
Other-non-utility companies 30.4 33.0 33.9 36.0 35.7 35.5
Other-utility companies 5.5 5.0 6.0 2.9 2.8 1.3
Captive use by hydropower -2.8 -2.1 -1.7 -1.6 -1.4 -1.1
Total 164.6 158.6 153.3 152.2 145.9 138.1
* Kepco’s figures of FY 2015 and older represent generating end.
* Some rounding errors may be observed.
* Regarding generated and purchased electric power, Kepco-generated electric power represents generating-end figures, while
purchase from Other-non-utility companies and Other-utility companies represents receiving-end figures.
* Electricity of PPS is included in purchased electricitiy from other companies.
<Power source combination (10MW)> ( ): composition ratio, %
3/11 3/12 3/13 3/14 3/15 3/16 3/17 3/18
Hydro 891( 22) 891( 22) 892( 22) 892( 21) 894( 21) 897( 19) 897( 19) 897( 20)
Fossil-firedOil/others 864( 21) 864( 21) 864( 21) 853( 20) 857( 20) 874( 19) 788( 17) 788( 18)
LNG 776( 19) 779( 19) 786( 19) 872( 21) 1,018( 24) 1,018( 22) 1,093( 23) 1,055( 24)
Coal 512( 13) 499( 12) 499( 12) 499( 12) 499( 12) 507( 11) 507( 11) 512( 12)
Total 2,153( 53) 2,142( 53) 2,149( 53) 2,224( 53) 2,374( 55) 2,399( 52) 2,388( 51) 2,355( 53)
Nuclear 1,033( 25) 1,033( 25) 1,033( 25) 1,033( 25) 1,015( 23) 966( 21) 966( 21) 731( 16)
New energy sources - - 7( 0) 25( 1) 49( 1) 375( 8) 408( 9) 468( 11)
Total 4,077(100) 4,066(100) 4,081(100) 4,174(100) 4,332(100) 4,637(100) 4,659(100) 4,452(100)
* Purchased electricity from other companies is included in the above table.
* Some rounding errors may be observed.
* Solar power generation is included in new energy sources from 3/13.
KEPCO
KEPCO

43Financial/corporate data (6)
<Profit and loss by business segment(billion yen)>
3/17 3/183/18
Forecasts
(Jan.2018)
3/19
Forecasts
Operating revenues(external transactions) 93.2 141.2 139.0 191.0
Ordinary income 6.2 7.1 6.0 8.0
Operating revenues(external transactions) 185.6 203.1 203.0 225.0
Ordinary income 18.3 25.1 23.0 26.0
Operating revenues(external transactions) 95.5 111.7 111.0 120.0
Ordinary income 12.8 14.5 12.0 15.0
Operating revenues(external transactions) 80.7 81.3 80.0 -
Ordinary income 23.5 28.8 22.0 -
*1 Figures in this page are before eliminations, and excluding exchange gain or loss unrealized.
International Business Profit(Reference) -1.0 -2.0 -2.0 0.0
*2 Described from the FY 2016 after setting the medium-term management plan
<Sales volume of gas(million tons)>
3/11 3/12 3/13 3/14 3/15 3/16 3/17 3/18
3/18
Forecasts
(Jan.2018)
3/19
Forecasts
0.69 0.88 0.88 0.86 0.74 0.72 0.71 0.97 0.96 -
* equivalent to LNG(Total sum of Gas and LNG)
<Number of FTTH subscribers(million subscribers)>
3/10 3/11 3/12 3/13 3/14 3/15 3/16 3/17
3/18
Forecasts
(Jan.2018)
3/19
Forecasts
11.82 12.98 13.96 14.84 15.28 15.90 16.25 16.30 16.30 -
<Number of houses sold (units)>
3/10 3/11 3/12 3/13 3/14 3/15 3/16 3/17
3/18
Forecasts
(Jan.2018)
3/19
Forecasts
533 729 1,022 1,156 777 712 630 605 613 800
Gas/ Other Energies
IT/Communications
Real Estate/Life
Other
*2
*
*
*

44
Planning Group (Investor Relations)Office of Accounting and Finance The Kansai Electric Power Co., Inc.
Telephone :+81 6 6441 8821 (Operator)Facsimile :+81 6 6441 0569Website :http://www.kepco.co.jp
For further information


