Financial Results Briefing for the Fiscal Year Ended March ...
36
©Foster Electric Company, Limited. 2021. All rights reserved. Foster Electric Company, Limited (Stock code: 6794, First Section, Tokyo Stock Exchange) May 20, 2021 Financial Results Briefing for the Fiscal Year Ended March 31, 2021
Transcript of Financial Results Briefing for the Fiscal Year Ended March ...

©Foster Electric Company, Limited. 2021. All rights reserved.
Foster Electric Company, Limited(Stock code: 6794, First Section, Tokyo Stock Exchange)
May 20, 2021
Financial Results Briefing for the Fiscal Year Ended March 31, 2021

©Foster Electric Company, Limited. 2021. All rights reserved.
Contents
I. Overview of Financial Results for the Fiscal Year Ended March 31, 2021
II. Summary of the Full Year and Forecasts for Fiscal Year Ending March 31, 2022
III.Progress of Medium-Term Business Plan
IV.Reference Materials
1
P. 2
P. 11
P. 17
P. 23

©Foster Electric Company, Limited.2021. All rights reserved..
I. Overview of Financial Results for the Fiscal Year Ended March 31, 2021
©Foster Electric Company, Limited. 2021. All rights reserved.
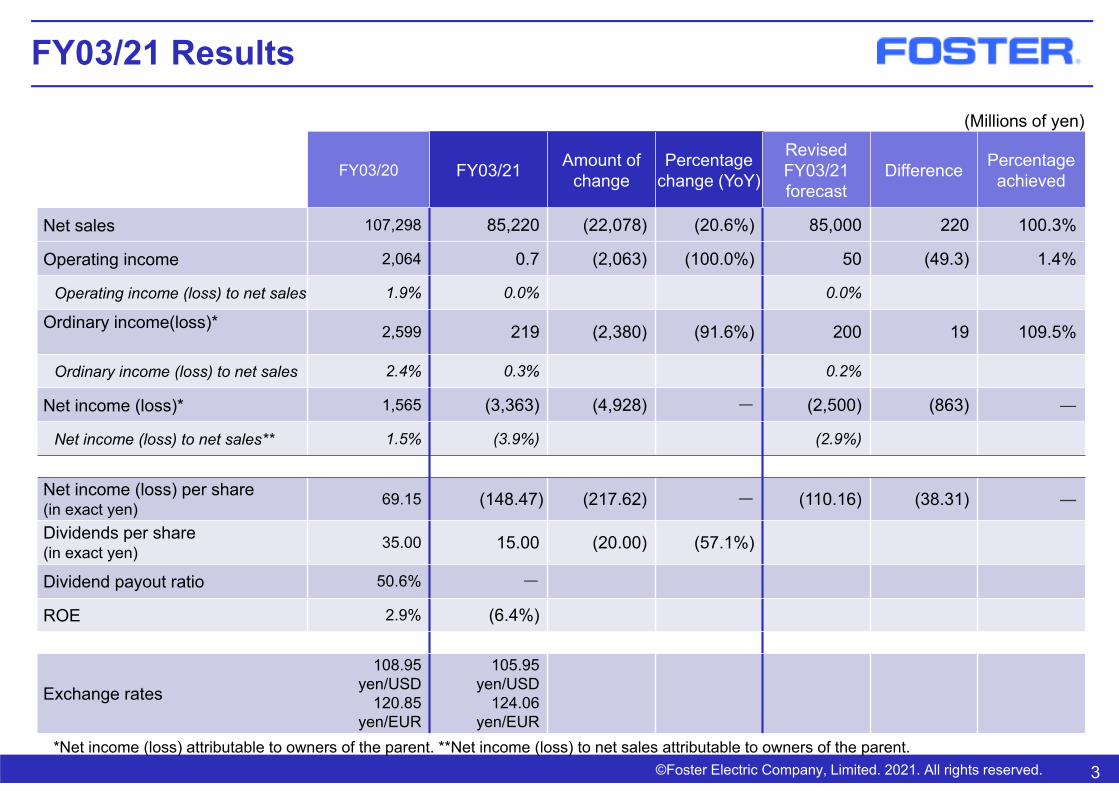
FY03/21 Results
3
FY03/20 FY03/21 Amount of change
Percentage change (YoY)
RevisedFY03/21forecast
Difference Percentage achieved
Net sales 107,298 85,220 (22,078) (20.6%) 85,000 220 100.3%
Operating income 2,064 0.7 (2,063) (100.0%) 50 (49.3) 1.4%
Operating income (loss) to net sales 1.9% 0.0% 0.0%
Ordinary income(loss)* 2,599 219 (2,380) (91.6%) 200 19 109.5%
Ordinary income (loss) to net sales 2.4% 0.3% 0.2%
Net income (loss)* 1,565 (3,363) (4,928) - (2,500) (863) ―
Net income (loss) to net sales** 1.5% (3.9%) (2.9%)
Net income (loss) per share (in exact yen) 69.15 (148.47) (217.62) - (110.16) (38.31) ―
Dividends per share(in exact yen) 35.00 15.00 (20.00) (57.1%)
Dividend payout ratio 50.6% -
ROE 2.9% (6.4%)
Exchange rates108.95
yen/USD120.85
yen/EUR
105.95 yen/USD
124.06 yen/EUR
*Net income (loss) attributable to owners of the parent. **Net income (loss) to net sales attributable to owners of the parent.
(Millions of yen)
©Foster Electric Company, Limited. 2021. All rights reserved.
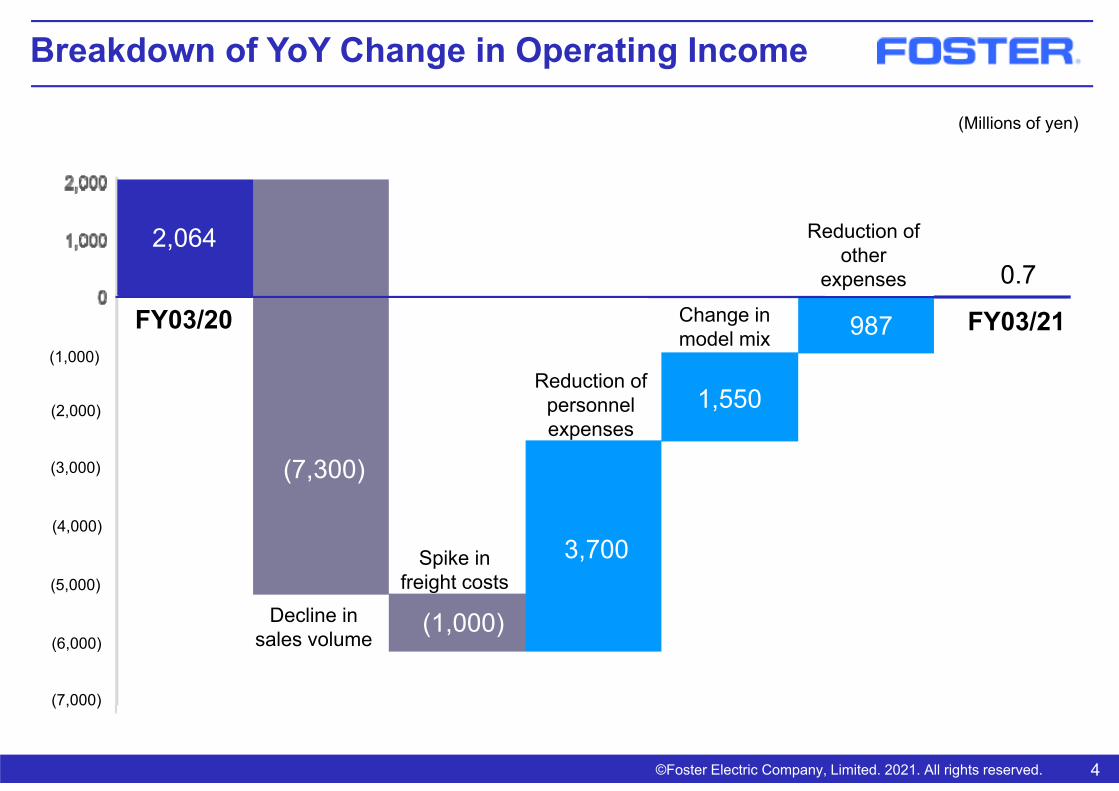
Breakdown of YoY Change in Operating Income
4
(Millions of yen)
Decline in sales volume
Reduction of personnel expenses
Change in model mix
2,064
(1,000)
3,700
987
0.7
1,550
(7,300)
Reduction ofother
expenses
FY03/20 FY03/21
Spike in freight costs
(1,000)
(2,000)
(3,000)
(4,000)
(5,000)
(6,000)
(7,000)

©Foster Electric Company, Limited. 2021. All rights reserved.
Segment Performance
5
(Millions of yen)
FY03/20 Composition ratio FY03/21 Composition
ratioPercentage
change (YoY)
Net sales 107,298 85,220 (20.6%)
Operating income 2,064 0.7 (100.0%)
Income ratio 1.9% 0.0%
Speaker
Sales 63,955 59.5% 56,736 66.5% (11.3%)
Operating income 2,571 ― 377 - (85.3%)
Income ratio 4.0% 0.7%
Mobile Audio
Sales 37,059 34.5% 21,574 25.3% (41.8%)
Operating income (187) ― (424) - -
Income ratio (0.5%) (2.0%)
Other
Sales 6,454 6.0% 7,244 8.2% 12.2%
Operating income (320) ― 47 - -
Income ratio (5.0%) 0.6%
©Foster Electric Company, Limited. 2021. All rights reserved.
Sales Operating income andincome ratio
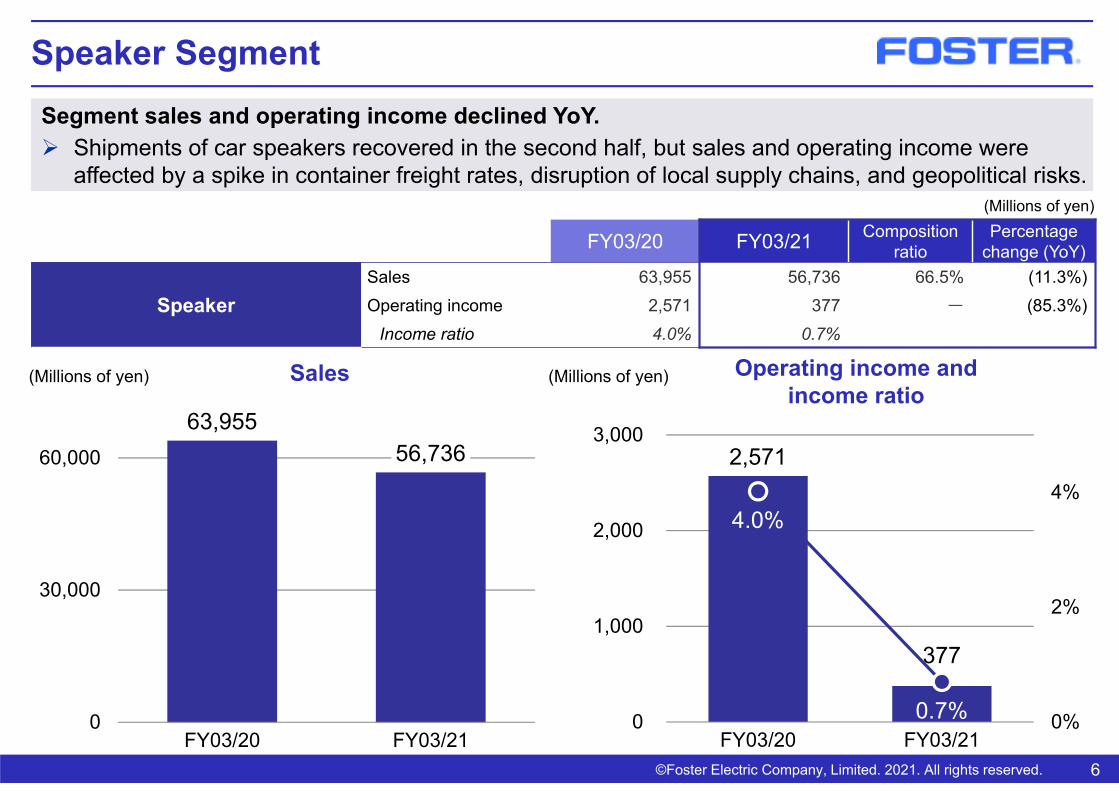
Speaker SegmentSegment sales and operating income declined YoY. Shipments of car speakers recovered in the second half, but sales and operating income were
affected by a spike in container freight rates, disruption of local supply chains, and geopolitical risks.
6
(Millions of yen)
FY03/20 FY03/21 Composition ratio
Percentage change (YoY)
SpeakerSales 63,955 56,736 66.5% (11.3%)Operating income 2,571 377 - (85.3%)
Income ratio 4.0% 0.7%
63,95556,736
0
30,000
60,000
FY03/20 FY03/21
2,571
377
4.0%
0.7% 0%
2%
4%
0
1,000
2,000
3,000
FY03/20 FY03/21
(Millions of yen)(Millions of yen)

©Foster Electric Company, Limited. 2021. All rights reserved.
Sales Operating income andincome ratio
Mobile Audio SegmentSegment sales and operating income declined YoY. Shipments of consumer-use actuators were in line with the plan, but the sales volume of headsets
for customers declined.
7
(Millions of yen)
FY03/20 FY03/21 Composition ratio
Percentage change (YoY)
Mobile AudioSales 37,059 21,574 25.3% (41.8%)Operating income (187) (424) - -
Income ratio (0.5%) (2.0%)
37,059
21,574
0
20,000
40,000
FY03/20 FY03/21
(187)
(424)
(0.5%)
(2.0%)△2%
△1%
0%
△500
△300
△100
FY03/20 FY03/21
(100)
(300)
(500)
(1%)
(2%)
0
(Millions of yen) (Millions of yen)

©Foster Electric Company, Limited. 2021. All rights reserved.
Sales Operating income and income ratio
Other Segment
Segment sales and operating income increased YoY. Results were robust for micro acoustic components used in automotive applications.
8
(Millions of yen)
FY03/20 FY03/21 Composition ratio
Percentage change (YoY)
OtherSales 6,454 7,244 8.2% 12.2%Operating income (320) 47 - -
Income ratio (5.0%) 0.6%
6,454 7,244
0
2,500
5,000
7,500
FY03/20 FY03/21
(320)
47
(5.0%)
0.6%
△5%
△3%
0%
△500
△300
△100
100
FY03/20 FY03/21
0 0
(Millions of yen) (Millions of yen)
(100)
(300)
(500)
(3%)
(5%)

©Foster Electric Company, Limited. 2021. All rights reserved.
Equity ratio as of March 31, 2021 was 65.6% (66.5% as of March 31, 2020).
Consolidated Balance Sheet
9
(Millions of yen)
End-FY03/20 End-FY03/21 Amount of changeCurrent assets 59,952 59,040 (912)
Cash and deposits 14,770 15,470 700Notes and accounts receivable – trade 15,145 16,945 1,800Inventories 17,622 18,479 857Other 12,415 8,146 (4,269)
Non-current assets 20,872 18,193 (2,679)Property, plant and equipment 17,980 15,213 (2,767)Intangible assets 217 189 (28)Investments and other assets 2,675 2,790 115
Total assets 80,825 77,233 (3,592)
Current liabilities 17,783 18,738 955Notes and accounts payable – trade 7,390 8,735 1,345Short-term bank loans 2,138 2,556 418Current portion of long-term debt 1,766 1,528 (238)Other 6,489 5,919 (570)
Non-current liabilities 4,047 2,501 (1,546)Long-term debt 2,637 1,118 (1,519)Other 1,410 1,383 (27)
Net assets 58,995 55,993 (3,002)Shareholders’ equity 55,335 50,837 (4,498)Total accumulated other comprehensive income (1,563) (198) 1,365Non-controlling interests 5,224 5,354 130
Total liabilities and net assets 80,825 77,233 (3,592)

©Foster Electric Company, Limited. 2021. All rights reserved.
(Millions of yen)
FY03/20 FY03/21 Amount of change
Operating activities 11,092 739 (10,353)
Investing activities 516 (1,960) (2,476)
Free cash flow* 11,608 (1,221) (12,829)
Financing activities (8,823) (2,624) 6,199
Net increase (decrease) in cash and cash equivalents 2,406 (3,557) (5,963)
Cash and cash equivalents at the end of the period 23,930 20,373 (3,557)
Statement of Cash Flows
10
Free cash flow for FY03/21 was -1.22 billion yen.
*Free cash flow = Cash flow from operating activities + cash flow from investing activities

©Foster Electric Company, Limited.2021. All rights reserved..
II. Summary of the Full Year and Forecasts for Fiscal Year Ending March 31, 2022

©Foster Electric Company, Limited. 2021. All rights reserved.
Summary of FY03/21
12
Net sales were in line with the initial plan, but profits came in below the initial plan.
Sales recovered as we captured the revival of demand in the auto industry after the slump caused by the COVID-19 pandemic1
3 Suspended production in Myanmar
4
2Impact of COVID-19(Spike in sea freight rates due to shipping container shortages, rise in transportation costs due to an increase in air transport, disruption of local supply chains)
Made efforts to strengthen the corporate structure(Cost reduction, rationalization of operations, further work-style reforms)

©Foster Electric Company, Limited. 2021. All rights reserved.
Car Speaker Sales by Region
13
4Q sales recovered to a level exceeding each quarter of the previous fiscal year. Full-year sales in China exceeded those of the previous fiscal year.
0
2,000
4,000
6,000
8,000
10,000
12,000
14,000
16,000
Japan China Asia NorthAmerica
Europe Other
Annual comparison of car speaker sales by region
FY03/21
FY03/20
0
2,000
4,000
6,000
8,000
10,000
12,000
14,000
16,000
1QFY03/20
2QFY03/20
3QFY03/20
4QFY03/20
1QFY03/21
2QFY03/21
3QFY03/21
4QFY03/21
Quarterly car speaker sales by region
Japan China Asia North America Europe Other

©Foster Electric Company, Limited. 2021. All rights reserved.
Near-term Concerns and Countermeasures
15
Higher shipping costs due to a surge in container ship freight rates and increased air
transport<Current>
Container ship freight rates remain at the highest level
<Countermeasures> Develop alternative transportation routes Strengthen logistics management system Promote local production for local consumption
Impact of COVID-19
<Current> Watch the situation for the time being
<Countermeasures> Substitute production in China and Vietnam → Minimize effects on customer Booked impairment during the previous fiscal year as financial allowance → Preparing for the worst
Political upheaval in Myanmar
Local supply chain disruption
<Current> Several supply chains disrupted
<Countermeasures> Secure and cultivate alternative suppliers Further promote in-house production of core
components
14

©Foster Electric Company, Limited. 2021. All rights reserved.
FY03/22 Forecasts
15
(Millions of yen)
FY03/21 FY03/22 (Forecast)
Amount ofchange
Percentagechange (YoY)
Net sales 85,220 90,000 4,780 5.6%
Operating income 0.7 1,000 999.3 -
Operating income to net sales 0.0% 1.1%
Ordinary income 219 1,000 781 356.3%
Ordinary income to net sales 0.3% 1.1%
Net income (loss)* (3,363) 300 3,663 -
Net income (loss) to net sales** (3.9%) 0.3%
Net income (loss) per share (in exact yen) (148.47) 13.48 161.95 -
Dividends per share (in exact yen) 15.0 20.0 5 33.3%
Dividend payout ratio - 151.1% -
Exchange rates 105.95 yen/USD124.06 yen/EUR
108.00 yen/USD128.00 yen/EUR
*Net income (loss) attributable to owners of the parent. **Net income (loss) to net sales attributable to owners of the parent.
©Foster Electric Company, Limited. 2021. All rights reserved. 16
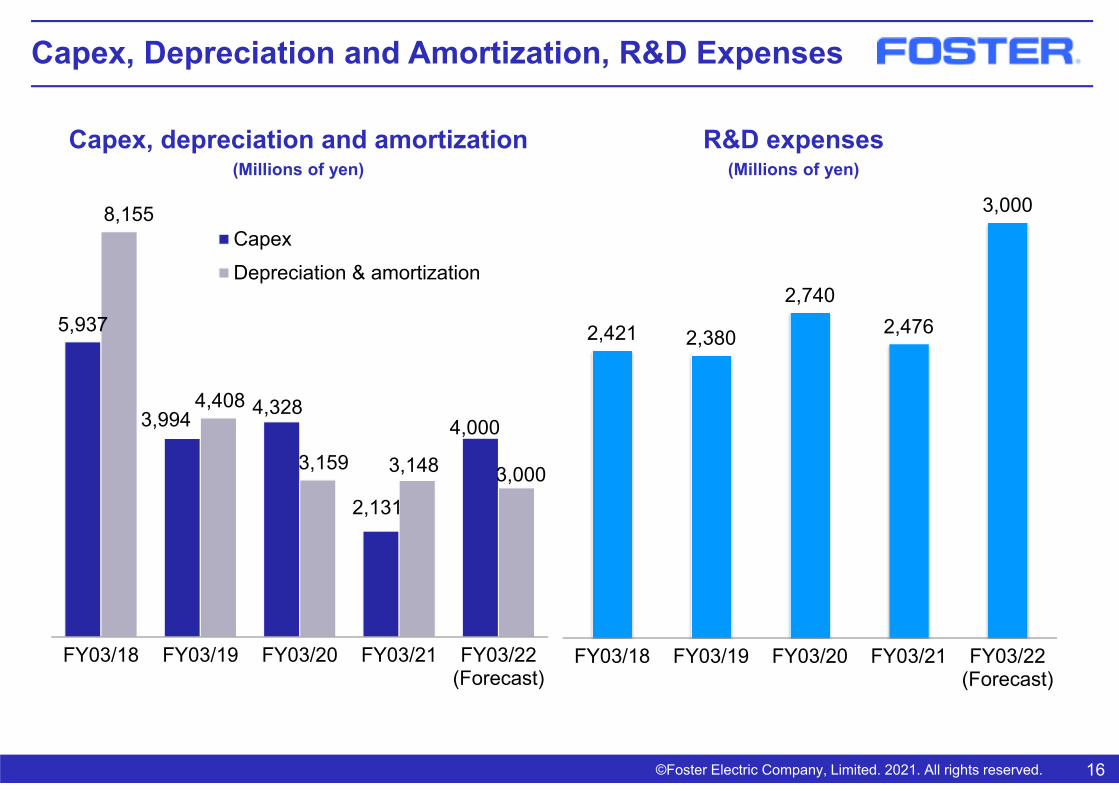
Capex, Depreciation and Amortization, R&D Expenses
Capex, depreciation and amortization(Millions of yen) R&D expenses
5,937
3,994 4,328
2,131
4,000
8,155
4,408
3,159 3,148 3,000
FY03/18 FY03/19 FY03/20 FY03/21 FY03/22(Forecast)
CapexDepreciation & amortization
2,421 2,380
2,740 2,476
3,000
FY03/18 FY03/19 FY03/20 FY03/21 FY03/22(Forecast)
R&D expenses(Millions of yen)
©Foster Electric Company, Limited.2021. All rights reserved..
III. Progress of Medium-Term Business Plan

©Foster Electric Company, Limited. 2021. All rights reserved.
Medium-to Long-Term Goals
18
FY2020 FY2024 FY2030
Medium term(through FY2024)
Long term(through FY2030)
Management philosophy
GoalElevate position from OEM/ODM supplier to strategic partner
GoalThe world’s No. 1 “acoustic” solution partner
Corporate VisionTo make contributions for future society through accoustics
Mission StatementThrough acoustic products or its solutions, a total commitment to help create a comfortable life and pleasure of communication around the world. A truly global enterprise our future society counts on
…
Providing human sensibilities
Be Happy 80%Environment: “Zero Emissions”Quality: “Zero Defects”
[FY2024: Financial Targets]Net sales: 120 billion yenOperating income: 5 billion yenIncome ratio: 4.2%
ESG targets
©Foster Electric Company, Limited. 2021. All rights reserved.
5
19
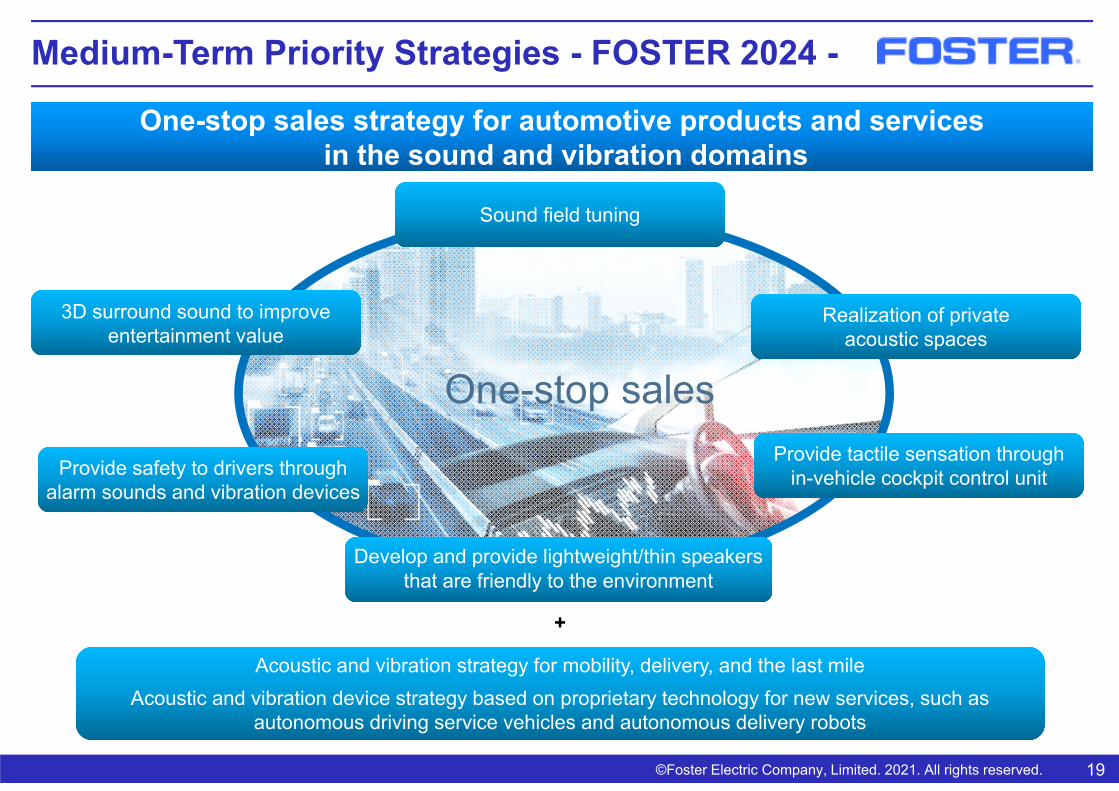
One-stop sales strategy for automotive products and servicesin the sound and vibration domains
Sound field tuning
Provide tactile sensation through in-vehicle cockpit control unit
Develop and provide lightweight/thin speakers that are friendly to the environment
Provide safety to drivers through alarm sounds and vibration devices
Realization of private acoustic spaces
3D surround sound to improve entertainment value
Acoustic and vibration strategy for mobility, delivery, and the last mileAcoustic and vibration device strategy based on proprietary technology for new services, such as
autonomous driving service vehicles and autonomous delivery robots
+
Medium-Term Priority Strategies - FOSTER 2024 -
One-stop sales

©Foster Electric Company, Limited. 2021. All rights reserved. 20
Regional strategyJapan/US/Europe: Strengthen our sales capabilities by shifting from a divisional sales framework to a regional sales
framework, which enables one-stop management of all productsChina: Strengthen our sales capabilities by leveraging our brand profile and high-quality local production
system
European, American, and Japanese finished
car manufacturers
Chinese local manufacturers
The expanding Chinese automobile market
Strategies tailored to needs(E.g.) Double-brand strategy
Near-term strategic challenge: Capturing the Chinese market
Capturing the Chinese automobile market is the key to achieving the goalsof our medium-term business plan centered on the automotive business.
Medium-Term Priority Strategies - FOSTER 2024 -

©Foster Electric Company, Limited. 2021. All rights reserved. 21
M&A strategy
In-house production of rare core components and acquisition of technological fields that are lacking
Medium-Term Priority Strategies - FOSTER 2024 -
Speaker production strategy
Strengthen production system in Vietnam and promote local production for local consumption
Uncertainty in Myanmar production
Increase production in Vietnam
Promote local production for local consumption

©Foster Electric Company, Limited. 2021. All rights reserved. 22
In the Mobile Audio Segment and new business domains, we will expand our customer contact points to strengthen our proactive and proposal-based sales. And we will develop and commercialize next products (innovation).
We will pursue added value and launch products in markets where we can leverage our strengths including our ability to provide human sensibilities.
Decline in boundledheadsets business
Wearables
Medical/Healthcare
Measuring instrument
Noise cancellation /
Noise reduction
Robotics
Start full-scale production of consumer vibration actuators
In line with accelerating technological innovations, discover new business seeds and selectively commercialize them
Period
Earn
ings
Earnings from the Mobile Audio Segment and new businesses(conceptual image)
Our focus areas
Long-Term Priority Strategies

©Foster Electric Company, Limited.2021. All rights reserved..
IV. Reference Materials

©Foster Electric Company, Limited. 2021. All rights reserved. 24
Company Profile
Our Corporate Creed is “Sincerity.”Our Vision is “To make contributions to future society through acoustics.”
Company name Foster Electric Company, Limited
Representative Hiromi Yoshizawa, CEOAtsushi Narikawa, COO
Founded June 20, 1949
Headquarters 1-1-109 Tsutsujigaoka, Akishima, Tokyo 196-8550
Stock exchange Second Section of the Tokyo Stock Exchange (May 1962)First Section of the Tokyo Stock Exchange (September 1999)
Common stock 6,770 million yen (as of March 31, 2021)
Business domain Production and sales of speakers, audio equipment, and electronic equipment
Number of employees
Consolidated: 18,611 (including employees at a contract manufacturer inPanyu, China)Non-consolidated: 492 (as of March 31, 2021 for both consolidated and non-consolidated)

©Foster Electric Company, Limited. 2021. All rights reserved.
Alarm buzzers and sounders,FOSTEX brand products,and logistics services
Audio and TV speakers and speaker systems; car speakers and speaker systems
Headsets, headphones, micro speakers, and vibration actuators
Other Segment
Speaker Segment Mobile Audio Segment
We provide acoustic products, leveraging our original analog technologies mainly through ODMs and OEMs.
Business Domain
25
HeadphonesTV speakers Car speakers Car speaker systems
HeadsetsMicro speakers
for PCs and smartphones
Actuators
Micro acoustic components
FOSTEX products
60% 32%
8%
67% 25%
8%
FY03/21Net sales
composition

©Foster Electric Company, Limited. 2021. All rights reserved.
Half-Year and Full-Year Results
Results (Millions of yen)
Net sales (Millions of yen)
Profits (Millions of yen)
26
0
50,000
100,000
150,000
200,000
1H 2H Full year 1H 2H Full year 1H 2H Full year 1H 2H Full yearFY03/18 FY03/19 FY03/20 FY03/21
FY03/18 FY03/19 FY03/20 FY03/211H 2H Full year 1H 2H Full year 1H 2H Full year 1H 2H Full year
Net sales 80,286 104,514 184,800 68,758 71,545 140,303 55,277 52,021 107,298 39,528 45,692 85,220Operating income 4,015 5,292 9,307 1,938 1,999 3,937 1,594 470 2,064 (688) 688 0.7Ordinary income 3,973 5,089 9,062 2,198 2,120 4,318 1,668 931 2,599 (488) 707 219Net income* 2,559 1,706 4,265 (1,776) (250) (2,026) 2,090 (525) 1,565 (829) (2,534) (3,363)
Income ratio 5.0% 5.1% 5.0% 2.8% 2.8% 2.8% 2.9% 0.9% 1.9% (1.7%) 1.5% 0.0%Ordinary income to net sales 4.9% 4.9% 4.9% 3.2% 3.0% 3.1% 3.0% 1.8% 2.4% (1.2%) 1.5% 0.3%Net income to net sales** 3.2% 1.6% 2.3% (2.6%) (0.3%) (1.4%) 3.8% (1.0%) 1.5% (2.1%) (5.5%) (3.9%)
*Net income (loss) attributable to owners of the parent. **Net income (loss) to net sales attributable to owners of the parent.
△3,500△1,500
5002,5004,5006,5008,500
10,500
1H 2H Full year 1H 2H Full year 1H 2H Full year 1H 2H Full yearFY03/18 FY03/19 FY03/20 FY03/21
Operating income Ordinary income Net income (loss)*
(1,500)(3,500)
*

©Foster Electric Company, Limited. 2021. All rights reserved.
Half-Year and Full-Year Results by Segment
27
Results (Millions of yen)
Net sales (Millions of yen)
Operating income (Millions of yen)
050,000
100,000150,000200,000
1H 2H Full year 1H 2H Full year 1H 2H Full year 1H 2H Full yearFY03/18 FY03/19 FY03/20 FY03/21
Speaker Mobile Audio Other
△ 500
3,500
7,500
1H 2H Full year 1H 2H Full year 1H 2H Full year 1H 2H Full yearFY03/18 FY03/19 FY03/20 FY03/21
Speaker Mobile Audio Other
FY03/18 FY03/19 FY03/20 FY03/21Net sales 1H 2H Full year 1H 2H Full year 1H 2H Full year 1H 2H Full yearSpeaker 36,946 38,574 75,520 34,450 35,953 70,403 32,631 31,324 63,955 23,892 32,844 56,736Mobile Audio 40,440 63,073 103,513 31,407 32,444 63,851 19,603 17,456 37,059 12,593 8,981 21,574Other 2,900 2,986 5,886 2,990 3,234 6,224 3,107 3,347 6,454 3,176 4,068 7,244Operating incomeSpeaker 2,579 2,057 4,636 2,050 2,293 4,343 1,754 817 2,571 (584) 961 377Mobile Audio 1,212 3,047 4,259 (254) (416) (670) (170) (17) (187) 5 (429) (424)Other 223 190 413 143 122 265 10 (330) (320) (109) 156 47
(500)

©Foster Electric Company, Limited. 2021. All rights reserved.
Half-Year and Full-Year Capex, Depreciation and Amortization, and R&D Expenses
28
Capex, depreciation & amortization, and R&D expenses (Millions of yen)
Capex, depreciation & amortization (Millions of yen)
R&D expenses (Millions of yen)
FY03/18 FY03/19 FY03/20 FY03/21
1H 2H Full year 1H 2H Full year 1H 2H Full year 1H 2H Full year
Capex 3,266 2,671 5,937 1,786 2,208 3,994 1,894 2,434 4,328 1,263 868 2,131
Depreciation & amortization 4,102 4,053 8,155 2,631 1,777 4,408 1,576 1,583 3,159 1,560 1,588 3,148
R&D expenses 1,101 1,320 2,421 1,029 1,351 2,380 1,333 1,407 2,740 1,209 1,267 2,476
0
3,000
6,000
9,000
1H 2H Full year 1H 2H Full year 1H 2H Full year 1H 2H Full yearFY03/18 FY03/19 FY03/20 FY03/21
Capex Depreciation & amortization
0
1,000
2,000
3,000
1H 2H Full year 1H 2H Full year 1H 2H Full year 1H 2H Full yearFY03/18 FY03/19 FY03/20 FY03/21

©Foster Electric Company, Limited. 2021. All rights reserved.
Quarterly Results
Results (Millions of yen)
Net sales (Millions of yen)
Profits (Millions of yen)
29
FY03/18 FY03/19 FY03/20 FY03/211Q 2Q 3Q 4Q 1Q 2Q 3Q 4Q 1Q 2Q 3Q 4Q 1Q 2Q 3Q 4Q
Net sales 37,800 42,486 58,660 45,854 36,512 32,246 39,894 31,651 27,561 27,716 29,132 22,889 18,480 21,048 22,641 23,051Operating income 1,468 2,547 4,647 645 947 991 1,682 317 741 853 1,117 (647) (507) (181) 799 (110)Ordinary income 1,656 2,317 4,722 367 1,101 1,097 1,815 305 648 1,020 1,166 (235) (518) 30 900 (193)Net income* 770 1,789 3,474 (1,768) (2,464) 688 (244) (6) 2,067 23 (740) 215 (791) (38) (373) (2,161)
Income ratio 3.9% 6.0% 7.9% 1.4% 2.6% 3.1% 4.2% 1.0% 2.7% 3.1% 3.8% (2.8%) (2.7%) (0.9%) 3.5% (0.5%)Ordinary income to net sales 4.4% 5.5% 8.0% 0.8% 3.0% 3.4% 4.5% 1.0% 2.4% 3.7% 4.0% (1.0%) (2.8%) 0.1% 4.0% (0.8%)Net income to net sales* 2.0% 4.2% 5.9% (3.9%) (6.7%) 2.1% (0.6%) (0.0%) 7.5% 0.1% (2.5%) 0.9% (4.3%) (0.2%) (1.6%) (9.4%)
0
20,000
40,000
60,000
1Q 2Q 3Q 4Q 1Q 2Q 3Q 4Q 1Q 2Q 3Q 4Q 1Q 2Q 3Q 4QFY03/18 FY03/19 FY03/20 FY03/21
△3,000
△1,000
1,000
3,000
5,000
1Q 2Q 3Q 4Q 1Q 2Q 3Q 4Q 1Q 2Q 3Q 4Q 1Q 2Q 3Q 4QFY03/18 FY03/19 FY03/20 FY03/21
Operating income Ordinary income Net income (loss)*
*Net income (loss) attributable to owners of the parent. **Net income (loss) to net sales attributable to owners of the parent.
(1,000)
(3,000)
*

©Foster Electric Company, Limited. 2021. All rights reserved.
Quarterly Results by Segment
Results (Millions of yen)
Net sales (Millions of yen)
Operating income (Millions of yen)
30
FY03/18 FY03/19 FY03/20 FY03/21Net sales 1Q 2Q 3Q 4Q 1Q 2Q 3Q 4Q 1Q 2Q 3Q 4Q 1Q 2Q 3Q 4QSpeaker 18,647 18,299 18,879 19,695 17,462 16,988 18,269 17,684 16,253 16,378 16,097 15,227 10,619 13,273 15,802 17,042Mobile Audio 17,719 22,721 38,306 24,767 17,693 13,714 19,941 12,503 9,826 9,777 11,374 6,082 6,633 5,960 4,909 4,072Other 1,434 1,466 1,536 1,450 1,399 1,591 1,731 1,503 1,511 1,596 1,706 1,641 1,321 1,855 2,010 2,058Operating incomeSpeaker 1,359 1,220 1,375 682 1,077 973 1,315 978 915 839 817 0 (448) (136) 722 239Mobile Audio 16 1,196 3,059 (12) (203) (51) 235 (651) (205) 35 558 (575) 6 (1) (46) (383)Other 92 131 214 (24) 76 67 130 (8) 30 (20) (258) (72) (65) (44) 123 33
0
20000
40000
60000
1Q 2Q 3Q 4Q 1Q 2Q 3Q 4Q 1Q 2Q 3Q 4Q 1Q 2Q 3Q 4QFY03/18 FY03/19 FY03/20 FY03/21
Speaker Mobile Audio Other
△ 700
1,300
3,300
1Q 2Q 3Q 4Q 1Q 2Q 3Q 4Q 1Q 2Q 3Q 4Q 1Q 2Q 3Q 4QFY03/18 FY03/19 FY03/20 FY03/21
Speaker Mobile Audio Other

©Foster Electric Company, Limited. 2021. All rights reserved.
Quarterly Balance Sheet and Statement of Cash FlowsBalance sheet (Millions of yen)
Statement of cash flows (Millions of yen)
31
FY03/18 FY03/19 FY03/20 FY03/211Q 2Q 3Q 4Q 1Q 2Q 3Q 4Q 1Q 2Q 3Q 4Q 1Q 2Q 3Q 4Q
Total current assets 70,265 76,770 82,913 73,614 73,361 73,013 70,263 67,773 67,221 65,381 60,986 59,952 55,066 55,396 58,394 59,040Cash and deposits 6,992 7,233 9,239 9,704 11,003 13,108 15,255 11,854 19,839 12,575 18,295 14,770 17,985 21,401 21,987 15,470Notes and accounts receivable – trade 18,817 20,534 27,107 22,243 19,939 19,324 22,174 19,261 18,721 19,289 19,187 15,145 15,351 16,018 16,794 16,945Other 44,456 49,003 46,567 41,667 42,419 40,581 32,834 36,658 28,661 33,517 23,504 30,037 21,730 17,977 19,613 26,625
Total non-current assets 31,910 31,701 30,349 27,255 24,231 24,332 23,340 23,497 22,840 22,227 22,847 20,872 20,524 20,160 18,606 18,193Net property, plant and equipment 25,157 24,914 23,727 21,120 18,768 18,922 18,357 18,475 18,927 18,116 18,013 17,980 17,673 17,312 15,787 15,213Total intangible assets 1,451 1,435 1,409 1,300 1,259 1,182 1,139 1,171 314 433 212 217 201 198 198 189
Total investments and other assets 5,301 5,351 5,212 4,835 4,203 4,227 3,844 3,851 3,598 3,677 4,621 2,675 2,649 2,649 2,621 2,790
Total assets 102,175 108,471 113,263 100,870 97,593 97,346 93,604 91,271 90,062 87,609 83,833 80,825 75,590 75,556 77,001 77,233
Total current liabilities 29,106 33,227 34,594 25,953 25,748 24,338 26,788 25,453 23,802 22,439 18,816 17,783 15,241 15,623 18,041 18,738Notes and accounts payable – trade 14,605 16,103 19,157 13,113 11,295 9,535 9,184 8,334 7,507 8,067 8,086 7,390 5,604 6,296 8,491 8,735Short-term loans and bonds payable 7,011 8,170 5,728 4,603 7,322 6,952 9,953 9,497 9,473 7,586 3,859 3,904 4,479 3,669 3,697 4,084Other 7,490 8,954 9,709 8,237 7,131 7,851 7,651 7,622 6,822 6,786 6,871 6,489 5,158 5,658 5,853 5,919
Total non-current liabilities 9,147 8,855 8,592 8,124 8,555 9,293 7,380 6,523 6,088 5,567 5,232 4,047 3,144 2,916 2,699 2,501Long-term debt and bonds payable 8,095 7,726 7,507 7,098 7,529 8,243 5,455 5,108 4,490 3,918 3,365 2,637 1,850 1,606 1,362 1,118Other 1,052 1,129 1,085 1,026 1,026 1,050 1,925 1,415 1,598 1,649 1,867 1,410 1,294 1,310 1,337 1,383
Total net assets 63,922 66,388 70,076 66,792 63,289 63,714 59,436 59,294 60,171 59,602 59,785 58,995 57,205 57,015 56,260 55,993Shareholders’ equity 59,099 60,887 63,845 62,077 58,634 58,155 54,328 54,322 56,162 56,185 55,120 55,335 54,201 54,169 53,568 50,837Accumulated other comprehensive income 633 1,230 1,691 (15) 263 975 154 27 (931) (1,474) (310) (1,563) (1,952) (2,132) (2,486) (198)Non-controlling interests 4,188 4,270 4,539 4,731 4,391 4,583 4,952 4,944 4,939 4,891 4,975 5,224 4,956 4,978 5,178 5,354
Total liabilities and net assets 102,175 108,471 113,263 100,870 97,593 97,346 93,604 91,271 90,062 87,609 83,833 80,825 75,590 75,556 77,001 77,233
FY03/18 FY03/19 FY03/20 FY03/21
1Q 2Q 3Q 4Q 1Q 2Q 3Q 4Q 1Q 2Q 3Q 4Q 1Q 2Q 3Q 4Q
Operating activities (2,243) 884 6,742 2,770 675 2,942 7,373 6,971 873 2,375 4,250 3,594 (2,309) 3,626 960 (1,538)
Investing activities (1,738) (1,927) (2,311) (1,155) (556) (1,598) (533) (738) 1,862 (690) (1,322) 666 (1,246) (351) (144) (219)
Financing activities 859 801 (3,188) (1,331) 2,043 (885) (3,315) (780) (1,023) (2,308) (4,758) (734) (691) (1,004) (384) (545)
Foreign exchange impact (420) 140 377 (146) (320) 510 (318) (96) (229) (269) (75) 195 (375) (40) (76) 778
Net increase (decrease) in cash flow (3,541) (104) 1,622 137 1,840 972 3,204 5,357 1,482 (892) (1,905) 3,721 (4,622) 2,231 357 (1,523)
Cash balance at the end of period 8,495 8,392 10,013 10,150 11,991 12,962 16,167 21,514 23,007 22,114 20,209 23,930 19,307 21,539 21,895 20,373

©Foster Electric Company, Limited. 2021. All rights reserved.
Quarterly Capex, Depreciation and Amortization, and R&D ExpensesCapex, depreciation & amortization, and R&D expenses (Millions of yen)
R&D expenses (Millions of yen)
Capex, depreciation & amortization (Millions of yen)
32
FY03/18 FY03/19 FY03/20 FY03/21
1Q 2Q 3Q 4Q 1Q 2Q 3Q 4Q 1Q 2Q 3Q 4Q 1Q 2Q 3Q 4Q
Capex 1,687 1,579 1,198 1,473 1,036 750 1,116 1,092 627 1,267 1,858 576 734 528 330 538
Depreciation & amortization 2,103 1,999 2,057 1,996 1,680 951 921 856 826 750 812 771 781 779 797 791
R&D expenses 607 494 681 639 667 362 831 520 655 678 744 663 686 523 659 608
0
1,000
2,000
3,000
1Q 2Q 3Q 4Q 1Q 2Q 3Q 4Q 1Q 2Q 3Q 4Q 1Q 2Q 3Q 4QFY03/18 FY03/19 FY03/20 FY03/21
Capex Depreciation & amortization
0
200
400
600
800
1,000
1Q 2Q 3Q 4Q 1Q 2Q 3Q 4Q 1Q 2Q 3Q 4Q 1Q 2Q 3Q 4QFY03/18 FY03/19 FY03/20 FY03/21

©Foster Electric Company, Limited. 2021. All rights reserved.
Quarterly Sales Weighting of Car Speakers by RegionSales weighting of car speakers by region
33
14% 15% 16% 15% 16% 15% 16% 17% 17% 14% 15% 14%
16% 15% 16% 14% 13% 13% 14% 12% 18% 19% 19% 19%
14% 18% 16% 17% 17% 18% 17% 18%20%
16% 16% 15%
32% 28% 28% 28% 28% 27% 26% 28%25%
28% 25% 30%
24% 22% 22% 25% 24% 24% 24% 23% 18% 22% 22% 20%
1% 1% 2% 1% 2% 2% 2% 2% 2% 2% 3% 2%
0%
10%
20%
30%
40%
50%
60%
70%
80%
90%
100%
1Q 2Q 3Q 4Q 1Q 2Q 3Q 4Q 1Q 2Q 3Q 4Q
FY03/19 FY03/20 FY03/21
Japan China Asia North America Europe Other
FY03/19 FY03/20 FY03/211Q 2Q 3Q 4Q 1Q 2Q 3Q 4Q 1Q 2Q 3Q 4Q
Japan 14% 15% 16% 15% 16% 15% 16% 17% 17% 14% 15% 14%China 16% 15% 16% 14% 13% 13% 14% 12% 18% 19% 19% 19%Asia 14% 18% 16% 17% 17% 18% 17% 18% 20% 16% 16% 15%North America 32% 28% 28% 28% 28% 27% 26% 28% 25% 28% 25% 30%Europe 24% 22% 22% 25% 24% 24% 24% 23% 18% 22% 22% 20%Other 1% 1% 2% 1% 2% 2% 2% 2% 2% 2% 3% 2%Total 100% 100% 100% 100% 100% 100% 100% 100% 100% 100% 100% 100%Total sales (Millions of yen) 15,165 14,611 14,820 14,739 13,598 13,735 13,233 12,840 8,479 11,898 13,155 14,985

©Foster Electric Company, Limited. 2021. All rights reserved.
The Group’s Major Manufacturing Sites
(As of March 31, 2021)
Headphones and Headsets Speakers
Guangzhou Panyu Jiu Shui Keng Foster Electric FactoryGuangzhou Panyu Jiu Shui Keng Foster Electric Factory
Foster Electric (Heyuan) Co., Ltd.Foster Electric (Heyuan) Co., Ltd.
ESTec Electronics (Jiaxing) Co., Ltd.ESTec Electronics (Jiaxing) Co., Ltd.
Foster Electric (Thilawa) Co., Ltd.Foster Electric (Thilawa) Co., Ltd.
Thomas K.L. Indústria de Alto-falantes S.A. Thomas K.L. Indústria de Alto-falantes S.A.
Foster Electric (Vietnam) Co., Ltd.Foster Electric (Vietnam) Co., Ltd.
Foster Electric (Nanning) Co., Ltd.Foster Electric (Nanning) Co., Ltd.
Foster Electric (Da Nang) Co., Ltd.Foster Electric (Da Nang) Co., Ltd.
Foster Electric (Quang Ngai) Co., Ltd.Foster Electric (Quang Ngai) Co., Ltd.
ESTec Phu Tho Co., Ltd.ESTec Phu Tho Co., Ltd.
China
VietnamFoster Electric (Bac Ninh) Co., Ltd.Foster Electric (Bac Ninh) Co., Ltd.
ESTec VINA Co., Ltd.ESTec VINA Co., Ltd.
Myanmar
Brazil
ChinaGuangzhou Panyu Jiu Shui Keng Foster Electric FactoryGuangzhou Panyu Jiu Shui Keng Foster Electric Factory
Vietnam
South KoreaESTec CorporationESTec Corporation
34
El Paso OperationsEl Paso OperationsUSA

©Foster Electric Company, Limited. 2021. All rights reserved.©Foster Electric Company, Limited. 2021. All rights reserved.
[Precautionary Statement]All forward-looking statements contained in this material, including forecasts, plans, and outlooks on current or future earnings, are based on currently available information and assumptions on risks and uncertainties that may affect future earnings. Actual results may differ from forecasts or estimates due to a range of factors, including economic conditions surrounding the Group’s operations, business conditions of related markets and at OEM customers, the competitive environment and pricing competition in Japan and overseas, raw material prices, foreign exchange rates, risks affecting overseas business, regulations in Japan and overseas, disasters or accidents, and share prices.
[Inquiries]IR Section, IR and Legal Affairs Department, Foster Electric Company, LimitedTEL: +81-42-546-2305 / FAX: +81-42-546-23171-1-109 Tsutsujigaoka, Akishima, Tokyo 196-8550, Japan
35