
Financial Results 2011 - EOH · Condensed Consolidated Statement of Financial Position July July...
26
Financial Results 2011 12 th September 2011 12 September 2011 Presentation to the Investment Analysts’ Society of EOH Holdings Limited’s Annual Results for the period ended 31 July 2011 period ended 31 July 2011
Transcript of Financial Results 2011 - EOH · Condensed Consolidated Statement of Financial Position July July...
Financial Results 201112th September 201112 September 2011
Presentation to the Investment Analysts’ Society of EOH Holdings Limited’s Annual Results for the
period ended 31 July 2011period ended 31 July 2011
Agenda
▲Business overview• Jane Thomson• Ebrahim Laher• Rob Godlonton• Jehan MacKay• Johan van Jaarsveld
▲Financial review• John King
▲Highlights and the way forward• Asher Bohbot
Business Overview
Jane Thomson
EOH vision
To be the best technology and business solutions company to work for, partner with
and invest in
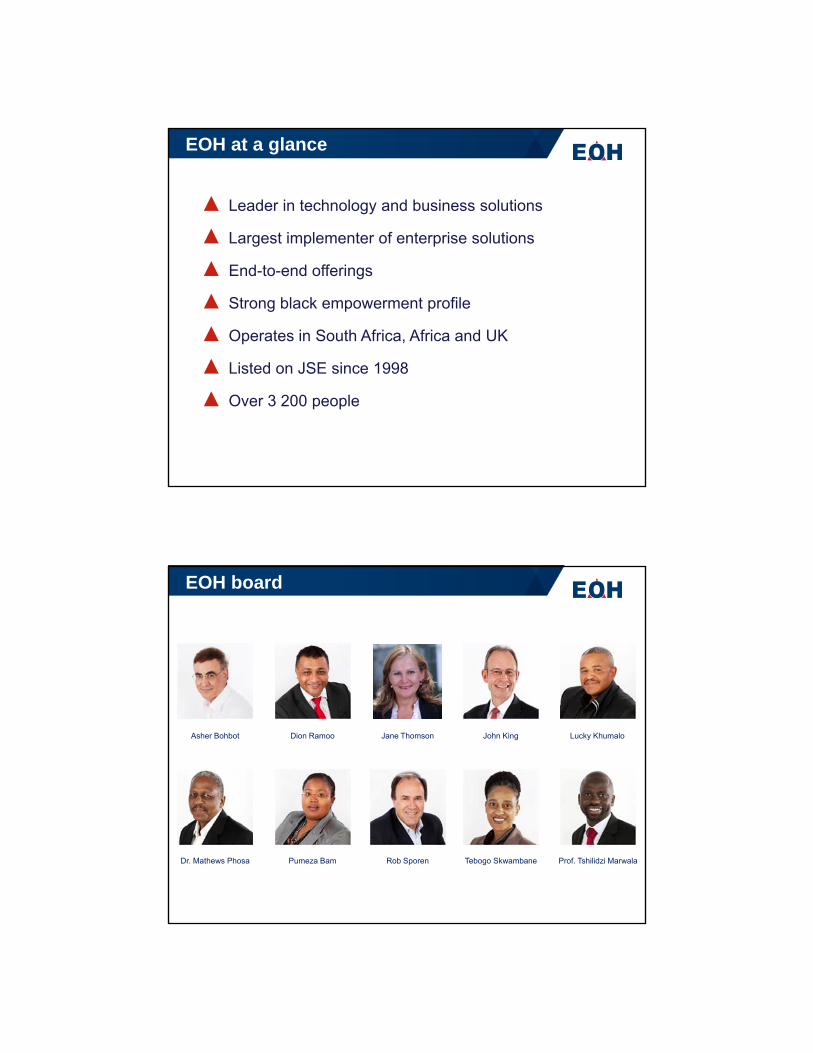
▲ Leader in technology and business solutions
▲ Largest implementer of enterprise solutions
EOH at a glance
▲ End-to-end offerings
▲ Strong black empowerment profile
▲ Operates in South Africa, Africa and UK
▲ Listed on JSE since 1998▲ Listed on JSE since 1998
▲ Over 3 200 people
EOH board
Lucky KhumaloAsher Bohbot John KingJane ThomsonDion Ramoo
Prof. Tshilidzi MarwalaRob SporenPumeza BamDr. Mathews Phosa Tebogo Skwambane
EOH executive committee
Asher Bohbot
Gary Lawrence Jane Thomson Johan Cloete Johan v Jaarsveld
Ebrahim LaherDion RamooBrian GubbinsAndrew Krause
Jehan MacKay
Zunaid MayetRob GodlontonPumeza BamJohn King
y y
What we do
▲ We develop business and technology solutions with our clients to help them
• Increase revenue
• Increase service delivery
• Increase efficiency
• Reduce cost
• R d i k• Reduce risk
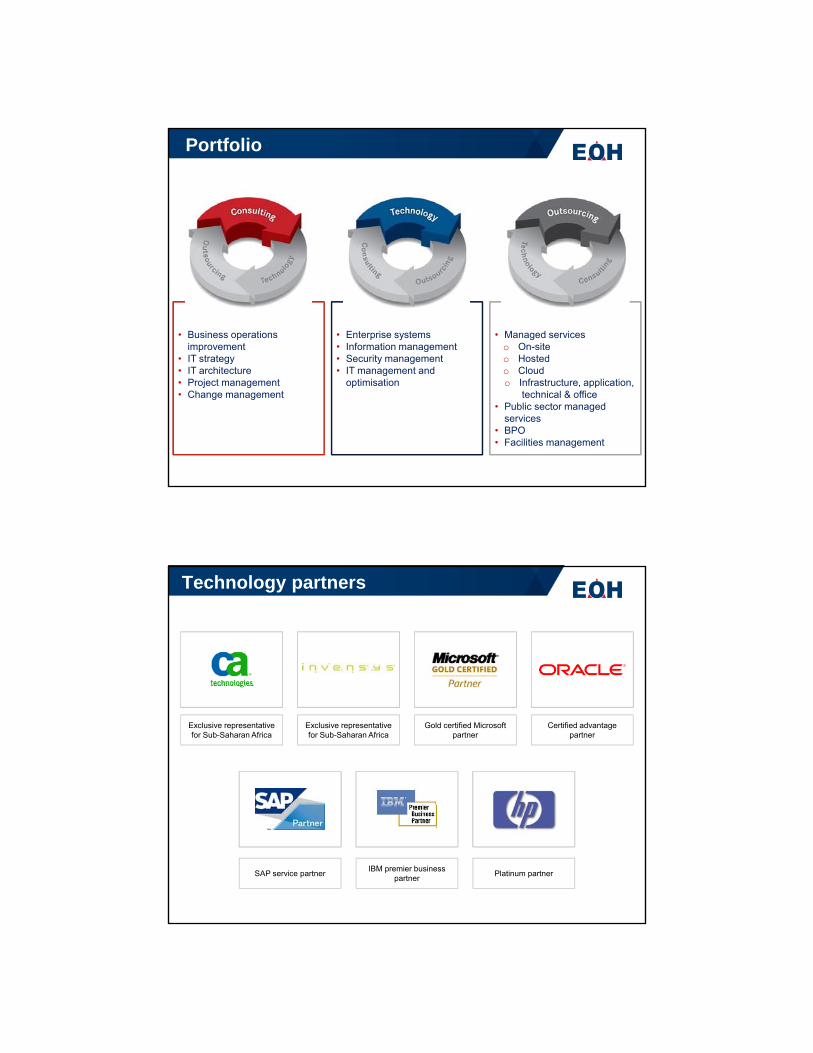
Industries served
▲ We provide solutions in the following industries
• Financial ServicesFinancial Services
• Telecommunications
• Mining
• Manufacturing
• Public Sector
Operating model
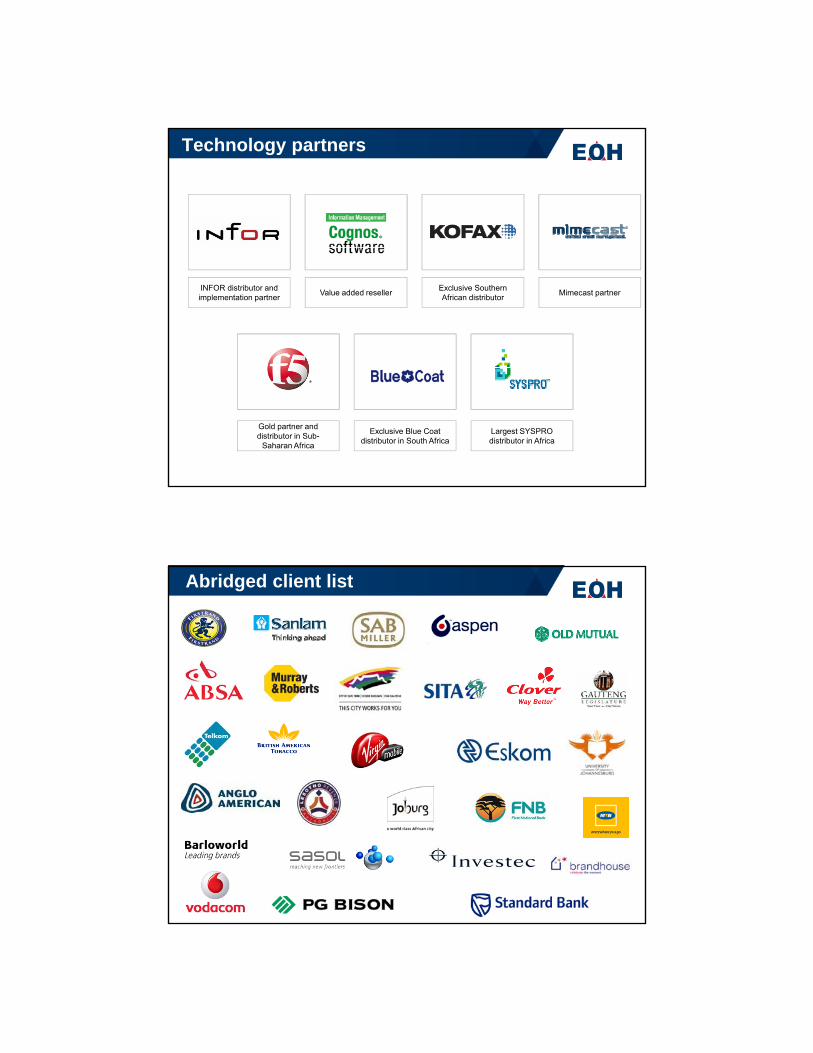
Portfolio
• Business operations improvement
• IT strategy IT hit t
• Enterprise systems• Information management• Security management
IT t d
• Managed serviceso On-siteo Hosted
Cl d• IT architecture• Project management• Change management
• IT management and optimisation
o Cloudo Infrastructure, application,
technical & office • Public sector managed
services • BPO• Facilities management
Technology partners
Exclusive representative for Sub-Saharan Africa
Exclusive representative for Sub-Saharan Africa
Gold certified Microsoft partner
Certified advantage partner
SAP service partner IBM premier business partner Platinum partner
Technology partners
INFOR distributor and implementation partner Value added reseller Exclusive Southern
African distributor Mimecast partner
Gold partner and distributor in Sub-
Saharan Africa
Exclusive Blue Coat distributor in South Africa
Largest SYSPRO distributor in Africa
Abridged client list

Portfolio
• Business operations improvement
• IT strategy IT hit t
• Enterprise systems• Information management• Security management
IT t d
• Managed serviceso On-siteo Hosted
Cl d• IT architecture• Project management• Change management
• IT management and optimisation
o Cloudo Infrastructure, application,
technical & office • Public sector managed
services • BPO• Facilities management
Ebrahim Laher
Enterprise systems
The engine room of your organisation
▲ Finance, HR, Procurement ▲▲ Core banking, supply chains▲ Customer relationship management ▲ Executed implementation in all industry sectors▲ Biggest range of application
Reinvents your business with best practice process management
Enterprise systems, cont.
▲ Solid implementation track record in all industry sectors
▲ From shop floor to boardroom
▲ Biggest range of applications
▲ Industry and process templates
▲ Delivering over the cloud
Enterprise systems, cont.
▲ SAP
▲ Oracle
▲ Infor
▲ Microsoft
▲ Syspro
Information management
Optimise your information assets
▲▲ Information strategy development
▲ Enterprise performance management
▲ Enterprise content management
▲ Master data management
▲ Business analytics
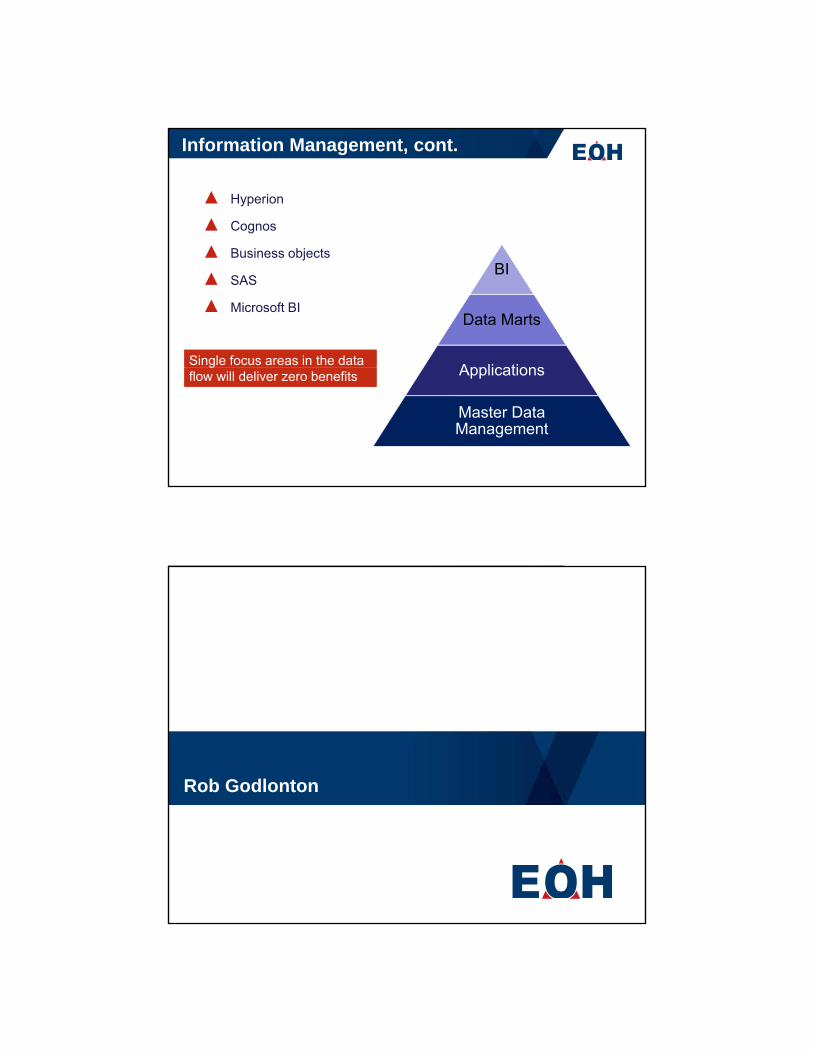
Information Management, cont.
▲ Hyperion
▲ Cognos
▲BI
Data Marts
ApplicationsSingle focus areas in the data Single focus areas in the data
▲ Business objects
▲ SAS
▲ Microsoft BI
Applications
Master Data Management
gflow will deliver zero benefits
gflow will deliver zero benefits
Rob Godlonton
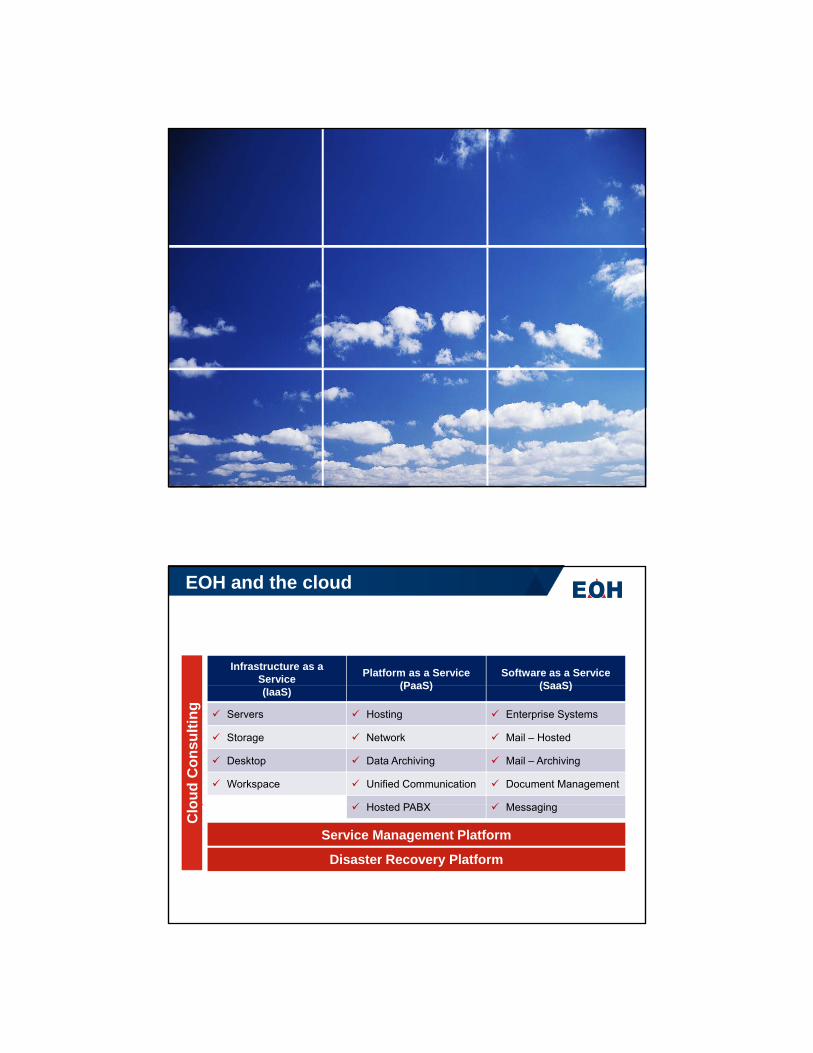
EOH and the cloud
Infrastructure as a Service Platform as a Service
(PaaS)Software as a Service
(SaaS)(IaaS) (PaaS) (SaaS)
Servers Hosting Enterprise Systems
Storage Network Mail – Hosted
Desktop Data Archiving Mail – Archiving
Workspace Unified Communication Document Management
H t d PABX M ioud
Con
sulti
ng
Hosted PABX Messaging
Service Management Platform
Disaster Recovery Platform
Clo
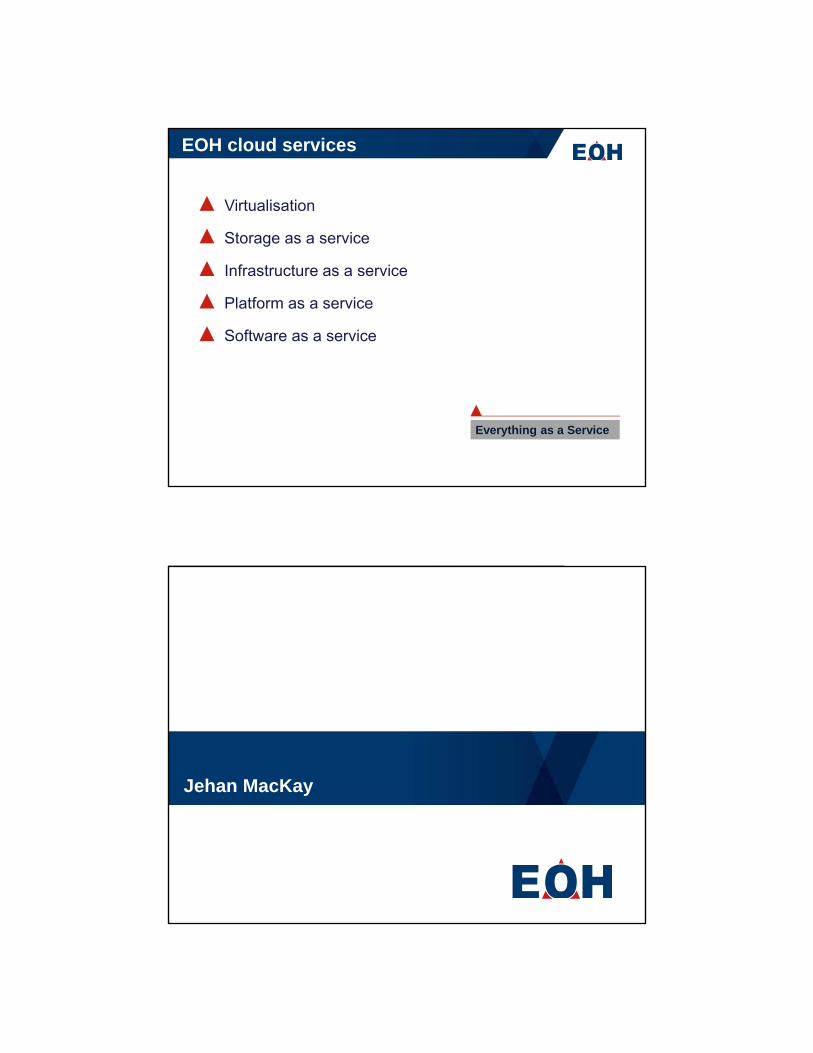
EOH cloud services
▲ Virtualisation
▲ Storage as a service
▲ Infrastructure as a service
▲ Platform as a service
▲ Software as a service
Everything as a Service
Jehan MacKay
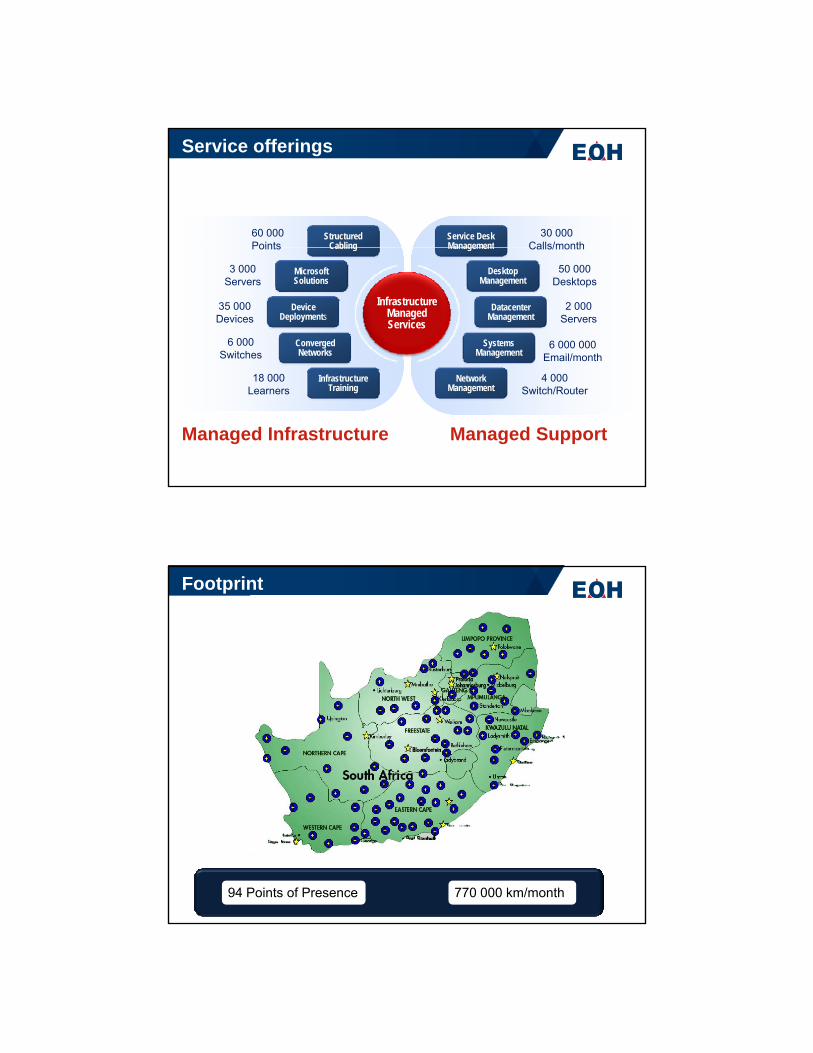
Structured Cabling
Service Desk Management
60 000 Points
30 000Calls/month
Service offerings
Cabling
Microsoft Solutions
Device Deployments
Converged Networks
Management
Desktop Management
Systems Management
Datacenter Management
InfrastructureManagedServices
Points
3 000 Servers
35 000 Devices
6 000 Switches
Calls/month
50 000Desktops
2 000Servers
6 000 000Email/month
Managed Infrastructure Managed Support
Infrastructure Training
Network Management
18 000 Learners
4 000Switch/Router
Footprint
94 Points of Presence 770 000 km/month
Johan van Jaarsveld
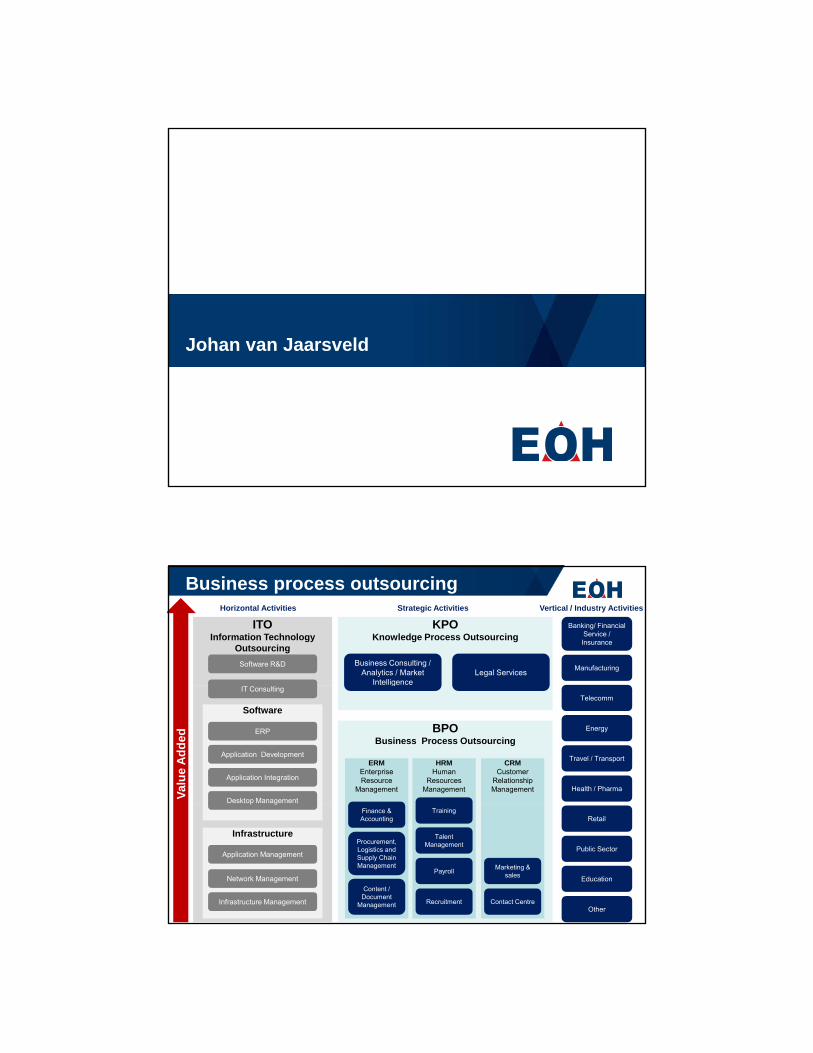
KPOKnowledge Process Outsourcing
Legal ServicesBusiness Consulting /
Analytics / Market Intelligence
ITO Information Technology
OutsourcingSoftware R&D
Banking/ Financial Service / Insurance
Manufacturing
Horizontal Activities Strategic Activities Vertical / Industry Activities
Business process outsourcing
g
BPOBusiness Process Outsourcing
ERMEnterprise Resource
Management
HRMHuman
Resources Management
CRMCustomer
Relationship Management
Software
Desktop Management
ERP
Application Development
Application Integration
IT ConsultingTelecomm
Energy
Travel / Transport
Health / PharmaValu
e Ad
ded
Finance & Accounting
Procurement, Logistics and Supply Chain Management
Content / Document
Management
Training
Talent Management
Payroll
Recruitment
Marketing & sales
Contact Centre
Infrastructure
Application Management
Network Management
Infrastructure Management
Retail
Public Sector
Education
Other
Growth strategy
▲ Grow our Business Process Outsourcing business and leverage the existing
• Applications• Infrastructure• Customers
▲ Business functional areas:• Human Resources Outsourcing• Legal Process OutsourcingLegal Process Outsourcing• Healthcare Solutions• Educational Services Solutions• Cross Enterprise Administration Services
Financial ReviewJohn KingJohn King
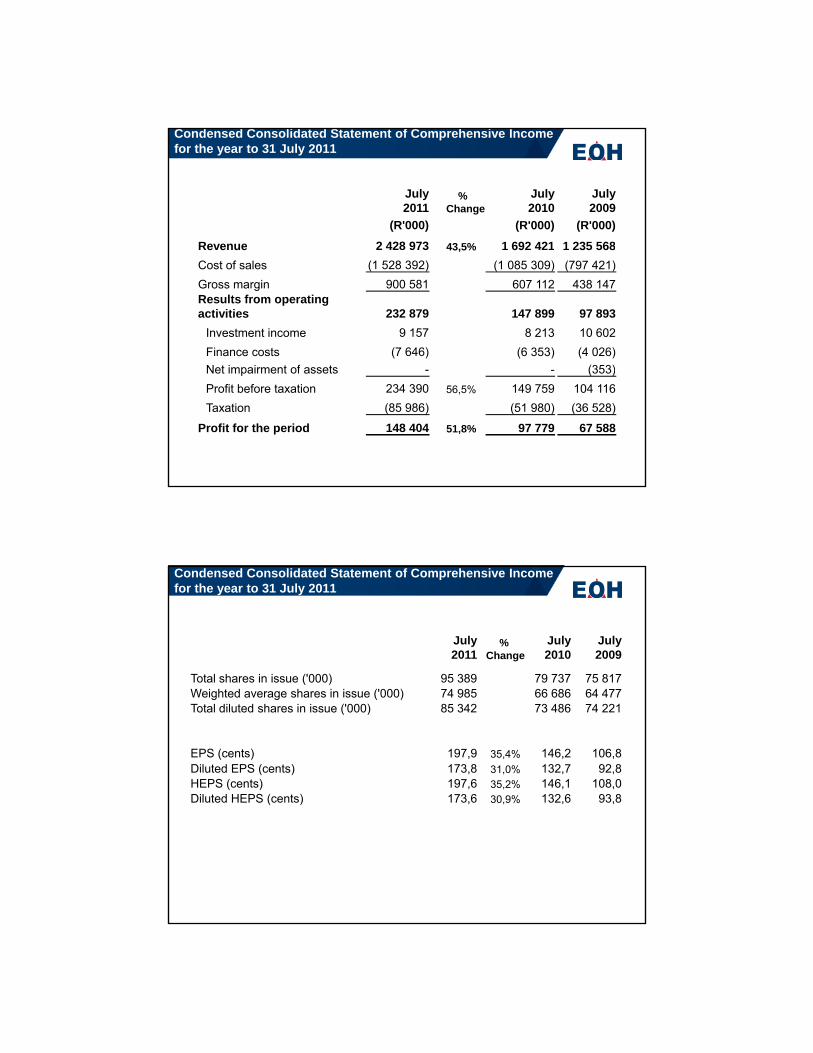
Condensed Consolidated Statement of Comprehensive Income for the year to 31 July 2011
July2011
% Change
July2010
July2009
(R'000) (R'000) (R'000)Revenue 2 428 973 43 5% 1 692 421 1 235 568Revenue 2 428 973 43,5% 1 692 421 1 235 568Cost of sales (1 528 392) (1 085 309) (797 421)Gross margin 900 581 607 112 438 147Results from operating activities 232 879 147 899 97 893
Investment income 9 157 8 213 10 602Finance costs (7 646) (6 353) (4 026)Net impairment of assets (353)Net impairment of assets - - (353)Profit before taxation 234 390 56,5% 149 759 104 116Taxation (85 986) (51 980) (36 528)
Profit for the period 148 404 51,8% 97 779 67 588
Condensed Consolidated Statement of Comprehensive Income for the year to 31 July 2011
July2011
%Change
July2010
July2009
Total shares in issue ('000) 95 389 79 737 75 817Weighted average shares in issue ('000) 74 985 66 686 64 477Total diluted shares in issue ('000) 85 342 73 486 74 221
EPS (cents) 197,9 35,4% 146,2 106,8Diluted EPS (cents) 173,8 31,0% 132,7 92,8HEPS (cents) 197,6 35,2% 146,1 108,0Diluted HEPS (cents) 173,6 30,9% 132,6 93,8( )
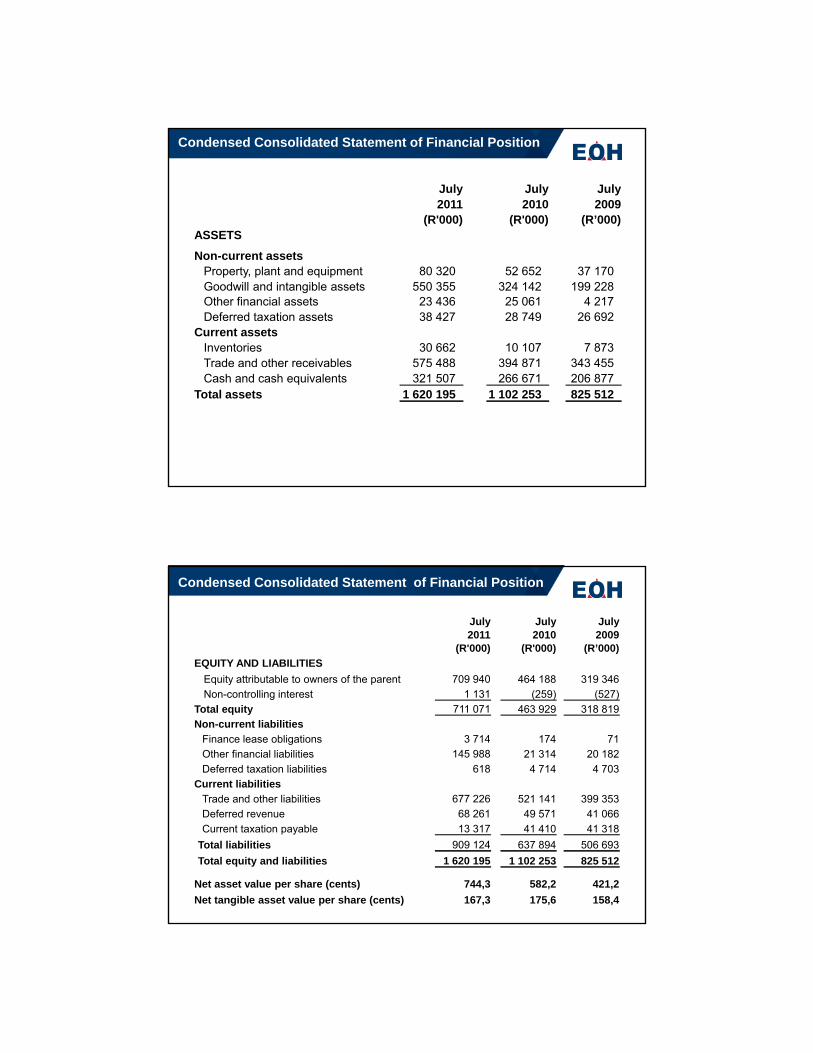
Condensed Consolidated Statement of Financial Position
July July July2011 2010 2009
(R'000) (R'000) (R’000)ASSETSNon-current assets
Property, plant and equipment 80 320 52 652 37 170Goodwill and intangible assets 550 355 324 142 199 228Other financial assets 23 436 25 061 4 217Deferred taxation assets 38 427 28 749 26 692
Current assetsInventories 30 662 10 107 7 873Trade and other receivables 575 488 394 871 343 455Cash and cash equivalents 321 507 266 671 206 877
Total assets 1 620 195 1 102 253 825 512
Condensed Consolidated Statement of Financial Position
July July July2011 2010 2009
(R'000) (R'000) (R’000)EQUITY AND LIABILITIES
Equity attributable to owners of the parent 709 940 464 188 319 346Non-controlling interest 1 131 (259) (527)
Total equity 711 071 463 929 318 819Non-current liabilities
Finance lease obligations 3 714 174 71Other financial liabilities 145 988 21 314 20 182Deferred taxation liabilities 618 4 714 4 703
Current liabilitiesTrade and other liabilities 677 226 521 141 399 353Deferred revenue 68 261 49 571 41 066Current taxation payable 13 317 41 410 41 318
Total liabilities 909 124 637 894 506 693Total equity and liabilities 1 620 195 1 102 253 825 512
Net asset value per share (cents) 744,3 582,2 421,2Net tangible asset value per share (cents) 167,3 175,6 158,4
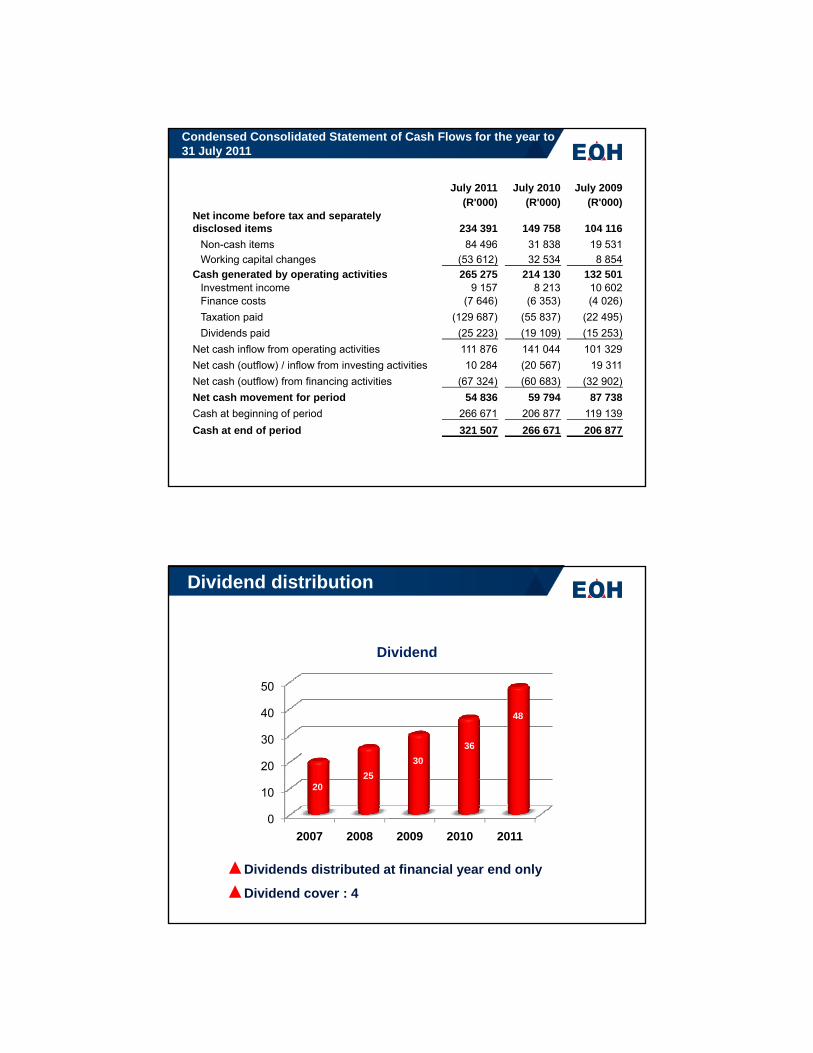
Condensed Consolidated Statement of Cash Flows for the year to 31 July 2011
July 2011 July 2010 July 2009(R'000) (R'000) (R'000)
Net income before tax and separately disclosed items 234 391 149 758 104 116
Non-cash items 84 496 31 838 19 531Non cash items 84 496 31 838 19 531Working capital changes (53 612) 32 534 8 854
Cash generated by operating activities 265 275 214 130 132 501Investment income 9 157 8 213 10 602Finance costs (7 646) (6 353) (4 026)Taxation paid (129 687) (55 837) (22 495)Dividends paid (25 223) (19 109) (15 253)
Net cash inflow from operating activities 111 876 141 044 101 329Net cash (outflow) / inflow from investing activities 10 284 (20 567) 19 311Net cash (outflow) / inflow from investing activities 10 284 (20 567) 19 311Net cash (outflow) from financing activities (67 324) (60 683) (32 902)Net cash movement for period 54 836 59 794 87 738Cash at beginning of period 266 671 206 877 119 139Cash at end of period 321 507 266 671 206 877
50
Dividend
Dividend distribution
10
20
30
40
50
2025
3036
48
02007 2008 2009 2010 2011
▲Dividends distributed at financial year end only
▲Dividend cover : 4
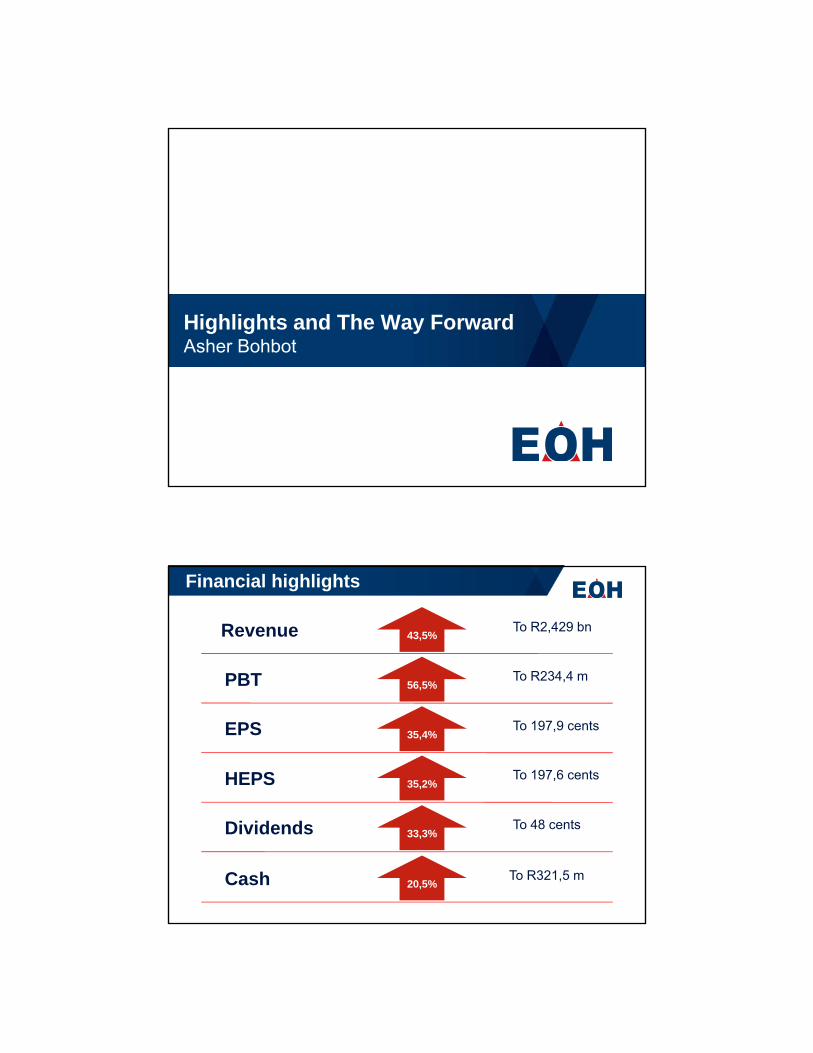
Highlights and The Way ForwardAsher Bohbot
To R2,429 bn43,5%
To R234,4 m56 5%
Revenue
PBT
Financial highlights
56,5%
To 197,9 cents35,4%
To 197,6 cents35,2%
PBT
EPS
HEPS
To 48 cents33,3%Dividends
To R321,5 m20,5%Cash
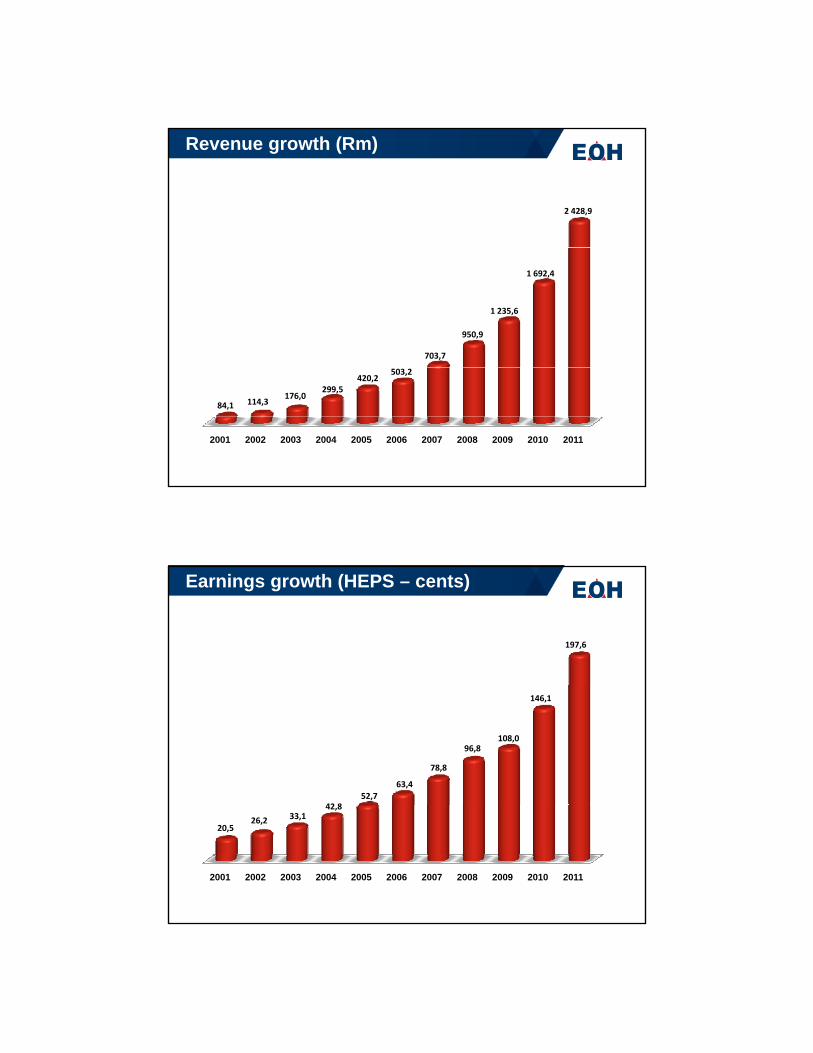
Revenue growth (Rm)
2 428,9
1 692,4
1 235,6
950,9
703,7
2001 2002 2003 2004 2005 2006 2007 2008 2009 2010 2011
84,1 114,3 176,0
503,2420,2
299,5
Earnings growth (HEPS – cents)
197,6
146,1
108,096,8
78,8
63,452,7
42 8
2001 2002 2003 2004 2005 2006 2007 2008 2009 2010 2011
20,526,2 33,1
42,8
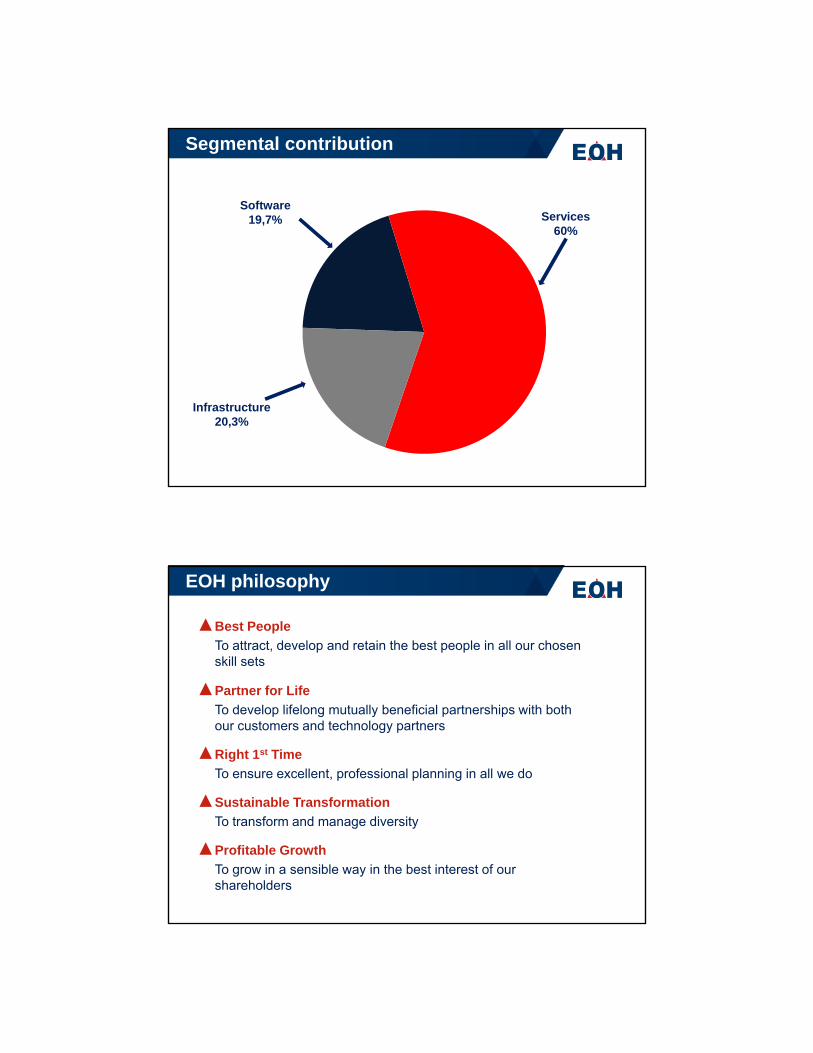
Segmental contribution
Services60%
Software19,7%
Infrastructure20,3%
▲Best PeopleTo attract, develop and retain the best people in all our chosen skill sets
▲
EOH philosophy
▲Partner for LifeTo develop lifelong mutually beneficial partnerships with both our customers and technology partners
▲Right 1st Time To ensure excellent, professional planning in all we do
▲Sustainable Transformation▲Sustainable TransformationTo transform and manage diversity
▲Profitable GrowthTo grow in a sensible way in the best interest of our shareholders
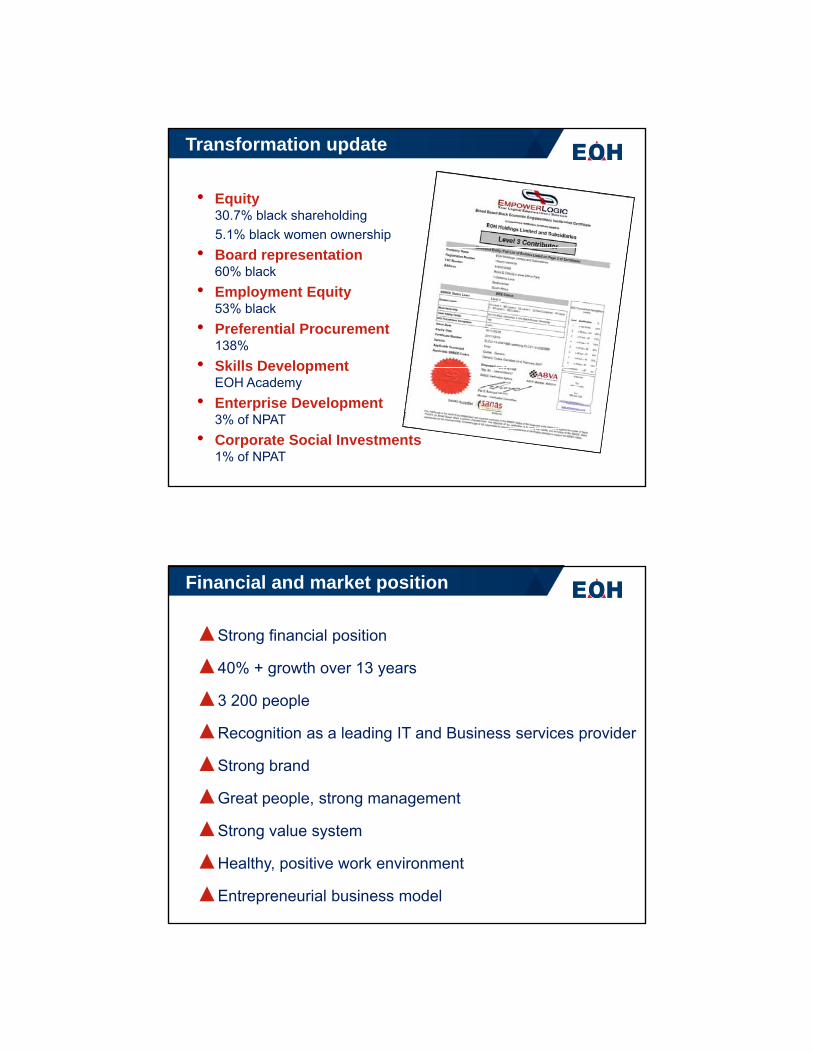
• Equity30.7% black shareholding5.1% black women ownership
Transformation update
• Board representation60% black
• Employment Equity 53% black
• Preferential Procurement138%
• Skills DevelopmentSkills DevelopmentEOH Academy
• Enterprise Development3% of NPAT
• Corporate Social Investments 1% of NPAT
Financial and market position
▲Strong financial position
▲40% + growth over 13 years
▲3 200 people
▲Recognition as a leading IT and Business services provider
▲Strong brand
▲Great people, strong managementp p , g g
▲Strong value system
▲Healthy, positive work environment
▲Entrepreneurial business model
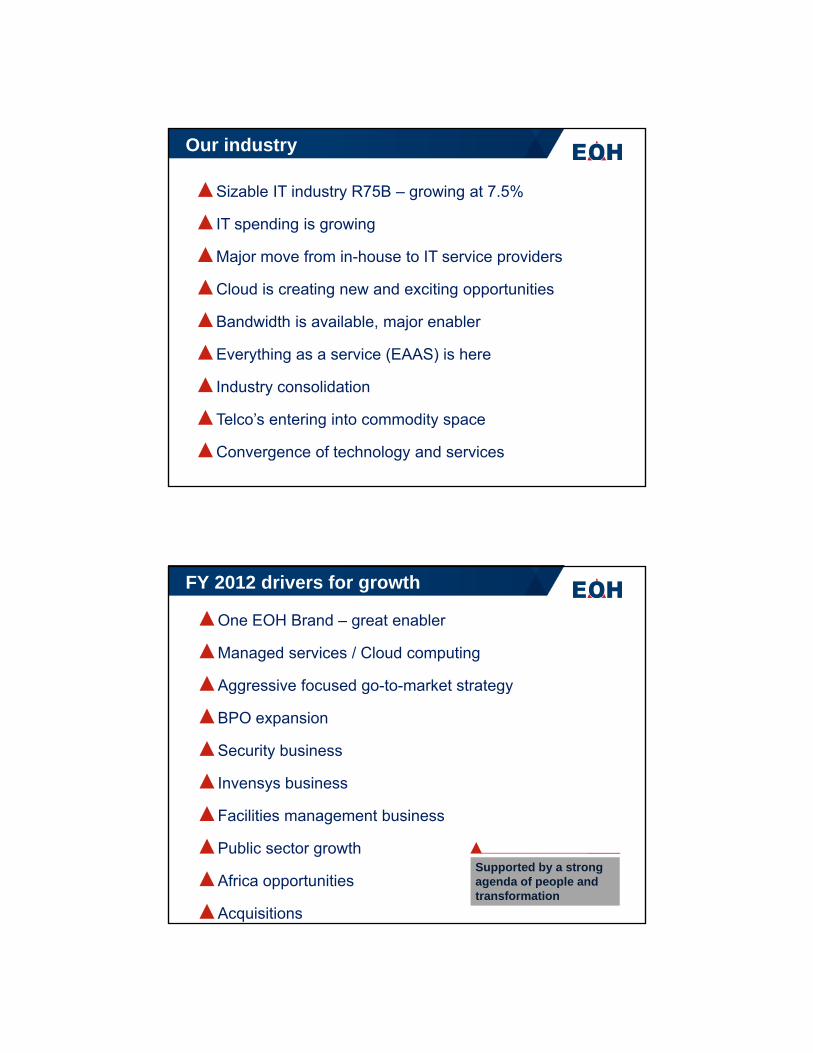
Our industry
▲Sizable IT industry R75B – growing at 7.5%
▲IT spending is growing
▲▲Major move from in-house to IT service providers
▲Cloud is creating new and exciting opportunities
▲Bandwidth is available, major enabler
▲Everything as a service (EAAS) is here
▲Industry consolidation
▲Telco’s entering into commodity space
▲Convergence of technology and services
FY 2012 drivers for growth
▲One EOH Brand – great enabler
▲Managed services / Cloud computing
▲Aggressive focused go to market strategy▲Aggressive focused go-to-market strategy
▲BPO expansion
▲Security business
▲Invensys business
▲Facilities management business
▲Public sector growth
▲Africa opportunities
▲Acquisitions
Supported by a strong agenda of people and transformation
EOH job creation initiative▲8m people unemployed – 8m potential clients
▲Government alone cannot take responsibility
▲Business needs to provide leadership and do more
▲We need to bring back off-shored jobs and do more off-shoring
▲EOH is forming a team that will work with our top 300 clients and
Business Partners to devise ways and means to:
• Generate ideas and meaningful plans
• Develop and train young people, new skill = new job
• Work jointly with Government Departments in mobilising existing and
new job creation initiativesBusiness needs to lead and get actively involved in South Africa
Thank You


![A self-gravitating disc around L1527 IRS?arXiv:1304.7390v1 [astro-ph.SR] 27 Apr 2013 Mon. Not. R. Astron. Soc. 000, 000–000 (0000) Printed 27 July 2018 (MN LATEX style file v2.2)](https://static.fdocuments.net/doc/165x107/60ab8659447d0c69117d790e/a-self-gravitating-disc-around-l1527-irs-arxiv13047390v1-astro-phsr-27-apr.jpg)


