FINANCIAL REPORT - case.edu
36
20 21 FINANCIAL REPORT
Transcript of FINANCIAL REPORT - case.edu

2021FINANCIALREPORT

TABLE OF CONTENTS
Discussion of Financial Results (unaudited) 1
Selected Financial Data (unaudited) 7
Report of Independent Auditors 8
Statements of Financial Position 10
Statement of Activities 11
Statements of Cash Flows 12
Notes to Financial Statements 13
This document may also be found at: case.edu/finance

CASE WESTERN RESERVE UNIVERSITY FY21 FINANCIAL REPORT | 1
Case Western Reserve University (the “University”) successfully managed its financial and operational challenges brought on by the COVID-19 pandemic during Fiscal Year 2021 (“FY21”) yielding an $11.7 million operating surplus and a net operating activity of $133 million on a Generally Accepted Accounting Principles (“GAAP”) basis.
FY21 FINANCIAL HIGHLIGHTS
Statement of Operations – Modified Cash Basis The University’s management of its resources produced an operating surplus of $11.7 million as reflected on the Statement of Operations – Modified Cash Basis. This surplus is higher than the FY21 operating budget, primarily due to the focus on cost containment.
The FY21 operating budget incorporated a $77 million cost reduction or 10% of direct expense in response to pandemic risks. The budget reflected a planned surplus of $10.8 million on a modified cash basis and also included a general contingency for unknown pandemic costs of $28 million. These efforts helped to mitigate the pandemic’s financial impact.
Overall, the University’s financial results were better than expected, and $10 million of budgeted pension plan reductions were restored. The FY21 operating surplus was $11.7 million.
During FY21 the University maintained its operations at near-normal levels with the exception of on-campus student auxiliaries. Student auxiliary services were at approximately 42% of normal capacity due to de- densification efforts for residential housing. Auxiliary revenue and activity have returned to 100% of normal, historic levels for FY22.
Statement of Activities – GAAP BasisThe University’s management of its resources produced a net operating activity of $133 million or a 12.1% operating margin as reflected on the Statement of Activities (GAAP Basis).
The cost reductions, net of non-recurring COVID-19 costs and combined with larger restricted gifts and pledges provided a larger net operating activity.
A summary of the estimated FY21 COVID-19 costs follows (in thousands):
COVID-19 Estimated Impact:Housing/Dining Costs $ 20,306Health Services Costs 17,496Facilities Management Costs 3,743Academic Continuity Costs 2,810School and UGEN Costs 960UTech Costs 191
FY21 Estimated Costs 45,506Ohio CARES Act Funding (4,800 )HEERF II Funding (4,300 )
Net COVID-19 Impact $ 36,406
The financial investment markets rebounded during FY21, and the endowment funds earned an annual return of approximately 31.50% with a fair market value of $2.3 billion. Two significant construction projects, The Fribley Dining Hall renovation and the Maltz Performing Arts Center Phase II, were completed on-time and on-budget. The University’s long-term debt was reduced by $52 million with no reliance on the line of credit at year end. The defined benefit pension liability improved by $43 million due to increases in plan assets coupled with favorable movement in pension assumptions.
Both net operating activity and operating surplus have been positive for well over a decade. See Selected Financial Data on page 7 for more information.
The FY22 operating budget includes a restoration of Retirement Plan A funding and salary increases. The FY22 budget reflects a planned surplus of $13 million and includes a $10 million provision for unknown COVID-19 related expense.
Following are additional comments related to the University’s operations and financial results, with Selected Financial Data shown on page 7.
DISCUSSION OF FINANCIAL RESULTS
2 | DISCUSSION OF FINANCIAL RESULTS - unaudited
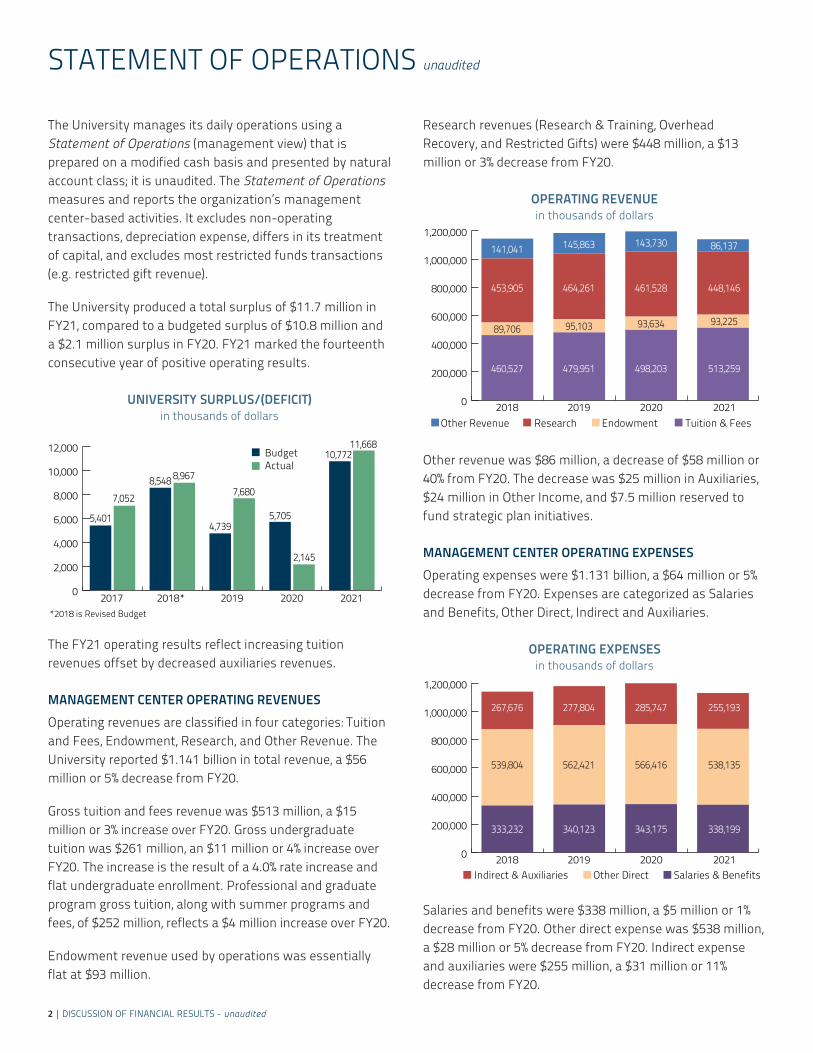
The University manages its daily operations using a Statement of Operations (management view) that is prepared on a modified cash basis and presented by natural account class; it is unaudited. The Statement of Operations measures and reports the organization’s management center-based activities. It excludes non-operating transactions, depreciation expense, differs in its treatment of capital, and excludes most restricted funds transactions (e.g. restricted gift revenue).
The University produced a total surplus of $11.7 million in FY21, compared to a budgeted surplus of $10.8 million and a $2.1 million surplus in FY20. FY21 marked the fourteenth consecutive year of positive operating results.
UNIVERSITY SURPLUS/(DEFICIT) in thousands of dollars
Other Revenue Research Endowment Tuition & Fees
0
2,000
4,000
6,000
8,000
10,000
12,000
2017
2018 2019 2020 2021
2018* 2019 2020 2021
Investment ReturnsTuition (net offinancial aid)
Auxiliaries
Other
Gifts & Pledges
SponsoredResearchActivity
Overhead Recovery
Operating investments
*2018 is Revised Budget
5,401
7,0528,548 8,967
4,739
7,680
5,705
2,145
10,77211,668
BudgetActual
0
200,000
400,000
600,000
800,000
1,000,000
1,200,000
460,527 479,951 498,203 513,259
453,905 464,261 461,528 448,146
141,041 145,863 143,730 86,137
89,706 95,103 93,634 93,225
Indirect & Auxiliaries Other Direct Salaries & Benefits2018 2019 2020 20210
200,000
400,000
600,000
800,000
1,000,000
1,200,000
333,232 340,123 343,175 338,199
267,676 277,804 285,747 255,193
539,804 562,421 566,416 538,135
10%
32%
7%14%
4%4%
29%
Funds held in trust by others
Investmentsheld forlong-termpurposes
Other 1% Receivables
Health Education Campus, net ofdepreciation
Property, plant,equipment, net ofdepreciation
Cash and cash equivalents
9%4%
19%
4%7%
7%
49%
Support Services
SponsoredResearchActivity
Instructional
Auxiliaries
19%
8%
34%
39%
The FY21 operating results reflect increasing tuition revenues offset by decreased auxiliaries revenues.
MANAGEMENT CENTER OPERATING REVENUESOperating revenues are classified in four categories: Tuition and Fees, Endowment, Research, and Other Revenue. The University reported $1.141 billion in total revenue, a $56 million or 5% decrease from FY20.
Gross tuition and fees revenue was $513 million, a $15 million or 3% increase over FY20. Gross undergraduate tuition was $261 million, an $11 million or 4% increase over FY20. The increase is the result of a 4.0% rate increase and flat undergraduate enrollment. Professional and graduate program gross tuition, along with summer programs and fees, of $252 million, reflects a $4 million increase over FY20.
Endowment revenue used by operations was essentially flat at $93 million.
Research revenues (Research & Training, Overhead Recovery, and Restricted Gifts) were $448 million, a $13 million or 3% decrease from FY20.
OPERATING REVENUE in thousands of dollars
Other Revenue Research Endowment Tuition & Fees
0
2,000
4,000
6,000
8,000
10,000
12,000
2017
2018 2019 2020 2021
2018* 2019 2020 2021
Investment ReturnsTuition (net offinancial aid)
Auxiliaries
Other
Gifts & Pledges
SponsoredResearchActivity
Overhead Recovery
Operating investments
*2018 is Revised Budget
5,401
7,0528,548 8,967
4,739
7,680
5,705
2,145
10,77211,668
BudgetActual
0
200,000
400,000
600,000
800,000
1,000,000
1,200,000
460,527 479,951 498,203 513,259
453,905 464,261 461,528 448,146
141,041 145,863 143,730 86,137
89,706 95,103 93,634 93,225
Indirect & Auxiliaries Other Direct Salaries & Benefits2018 2019 2020 20210
200,000
400,000
600,000
800,000
1,000,000
1,200,000
333,232 340,123 343,175 338,199
267,676 277,804 285,747 255,193
539,804 562,421 566,416 538,135
10%
32%
7%14%
4%4%
29%
Funds held in trust by others
Investmentsheld forlong-termpurposes
Other 1% Receivables
Health Education Campus, net ofdepreciation
Property, plant,equipment, net ofdepreciation
Cash and cash equivalents
9%4%
19%
4%7%
7%
49%
Support Services
SponsoredResearchActivity
Instructional
Auxiliaries
19%
8%
34%
39%
Other revenue was $86 million, a decrease of $58 million or 40% from FY20. The decrease was $25 million in Auxiliaries, $24 million in Other Income, and $7.5 million reserved to fund strategic plan initiatives.
MANAGEMENT CENTER OPERATING EXPENSESOperating expenses were $1.131 billion, a $64 million or 5% decrease from FY20. Expenses are categorized as Salaries and Benefits, Other Direct, Indirect and Auxiliaries.
OPERATING EXPENSES in thousands of dollars
Other Revenue Research Endowment Tuition & Fees
0
2,000
4,000
6,000
8,000
10,000
12,000
2017
2018 2019 2020 2021
2018* 2019 2020 2021
Investment ReturnsTuition (net offinancial aid)
Auxiliaries
Other
Gifts & Pledges
SponsoredResearchActivity
Overhead Recovery
Operating investments
*2018 is Revised Budget
5,401
7,0528,548 8,967
4,739
7,680
5,705
2,145
10,77211,668
BudgetActual
0
200,000
400,000
600,000
800,000
1,000,000
1,200,000
460,527 479,951 498,203 513,259
453,905 464,261 461,528 448,146
141,041 145,863 143,730 86,137
89,706 95,103 93,634 93,225
Indirect & Auxiliaries Other Direct Salaries & Benefits2018 2019 2020 20210
200,000
400,000
600,000
800,000
1,000,000
1,200,000
333,232 340,123 343,175 338,199
267,676 277,804 285,747 255,193
539,804 562,421 566,416 538,135
10%
32%
7%14%
4%4%
29%
Funds held in trust by others
Investmentsheld forlong-termpurposes
Other 1% Receivables
Health Education Campus, net ofdepreciation
Property, plant,equipment, net ofdepreciation
Cash and cash equivalents
9%4%
19%
4%7%
7%
49%
Support Services
SponsoredResearchActivity
Instructional
Auxiliaries
19%
8%
34%
39%
Salaries and benefits were $338 million, a $5 million or 1% decrease from FY20. Other direct expense was $538 million, a $28 million or 5% decrease from FY20. Indirect expense and auxiliaries were $255 million, a $31 million or 11% decrease from FY20.
STATEMENT OF OPERATIONS unaudited

CASE WESTERN RESERVE UNIVERSITY FY21 FINANCIAL REPORT | 3
The Statement of Activities (GAAP Basis) includes results from the University’s operating and non-operating activities which produced a $679 million increase in net assets. Net operating activity contributed $133 million of the increase and net appreciation in long-term investments contributed $546 million. In FY20, operating activity contributed $54 million to net assets.
OPERATING REVENUES AND OTHER SUPPORTTotal operating revenues and other support were $1.101 billion, an increase of $25 million or 2% over FY20. The components of the University’s revenues are shown below and additional detail of operating revenue follows.
OPERATING REVENUES AND OTHER SUPPORT $1.101 billion
Other Revenue Research Endowment Tuition & Fees
0
2,000
4,000
6,000
8,000
10,000
12,000
2017
2018 2019 2020 2021
2018* 2019 2020 2021
Investment ReturnsTuition (net offinancial aid)
Auxiliaries
Other
Gifts & Pledges
SponsoredResearchActivity
Overhead Recovery
Operating investments
*2018 is Revised Budget
5,401
7,0528,548 8,967
4,739
7,680
5,705
2,145
10,77211,668
BudgetActual
0
200,000
400,000
600,000
800,000
1,000,000
1,200,000
460,527 479,951 498,203 513,259
453,905 464,261 461,528 448,146
141,041 145,863 143,730 86,137
89,706 95,103 93,634 93,225
Indirect & Auxiliaries Other Direct Salaries & Benefits2018 2019 2020 20210
200,000
400,000
600,000
800,000
1,000,000
1,200,000
333,232 340,123 343,175 338,199
267,676 277,804 285,747 255,193
539,804 562,421 566,416 538,135
10%
32%
7%14%
4%4%
29%
Funds held in trust by others
Investmentsheld forlong-termpurposes
Other 1% Receivables
Health Education Campus, net ofdepreciation
Property, plant,equipment, net ofdepreciation
Cash and cash equivalents
9%4%
19%
4%7%
7%
49%
Support Services
SponsoredResearchActivity
Instructional
Auxiliaries
19%
8%
34%
39%
Statement of Activities data
Tuition incomeGross tuition income of $528 million increased $19 million or 4% over FY20, and includes fees and undergraduate, graduate, summer, and professional tuition. Gross tuition income is offset in part by financial aid awarded; the financial aid offset for FY21 was $209 million, resulting in net tuition of $319 million, or 29% of operating revenues.
The net tuition and fees income of $319 million represents a $16 million or 5% increase over FY20, with increased revenues generated primarily by an increase in tuition rates.
Investment returnsInvestment returns included $67 million in returns distributed from the long-term investment pool, $34 million in returns on operating investments, and $15 million in
distributions from funds held in trust by others (“FHBO”) for endowment spending. Investment returns, which represent 10% of operating revenues, totaled $116 million, or a 18% increase over FY20.
Grants and contractsGrants and contracts revenue includes awards to the University and also its affliates, most notably the Cleveland Clinic Lerner College of Medicine (“CCLCM”).
Grants and contracts received for research and training purposes totaled $352 million, including $96 million in CCLCM awards. This amount reflects a decrease of $13 million, or 4% change from FY20. Grants and contracts revenue was down $8 million as research and training activity ramped down during the pandemic. The total represents 32% of overall University operating revenues.
Overhead cost recoveryFacilities and administrative cost recovery applicable to federally sponsored projects and all other sponsored activity was $73 million in FY21, a $4 million or 5% decrease from FY20. Overhead recovery represents 7% of operating revenues.
Gifts and pledgesGifts and pledges income was $152 million, an increase of $41 million or 37% over FY20. Gifts and pledges, which represent 14% of operating revenues, are recorded in the appropriate asset category when received.
Other revenueOther revenue of $46 million decreased $11 million or 19% from FY20. Other revenue represents 4% of operating revenues and includes the State of Ohio appropriation, Organized Activities, and Other Sources.
AuxiliariesAuxiliaries revenue of $43 million decreased $22 million or 34% from FY20 due to fewer students living on campus during the pandemic. Auxiliaries revenue is categorized as either “Student,” which is largely Housing, Food, and Health Services, totaling $37 million, or “Other,” including Rental Properties and Parking, totaling $6 million for FY21. Auxiliaries revenue represents 4% of operating revenues.
STATEMENT OF ACTIVITIES AND OTHER SUPPORT

4 | DISCUSSION OF FINANCIAL RESULTS - unaudited
OPERATING EXPENSESTotal expenses of $968 million decreased $53 million or 5% from FY20. The components of the University’s expenses are shown below and additional detail of operating expenses follows.
OPERATING EXPENSES $968 million
Other Revenue Research Endowment Tuition & Fees
0
2,000
4,000
6,000
8,000
10,000
12,000
2017
2018 2019 2020 2021
2018* 2019 2020 2021
Investment ReturnsTuition (net offinancial aid)
Auxiliaries
Other
Gifts & Pledges
SponsoredResearchActivity
Overhead Recovery
Operating investments
*2018 is Revised Budget
5,401
7,0528,548 8,967
4,739
7,680
5,705
2,145
10,77211,668
BudgetActual
0
200,000
400,000
600,000
800,000
1,000,000
1,200,000
460,527 479,951 498,203 513,259
453,905 464,261 461,528 448,146
141,041 145,863 143,730 86,137
89,706 95,103 93,634 93,225
Indirect & Auxiliaries Other Direct Salaries & Benefits2018 2019 2020 20210
200,000
400,000
600,000
800,000
1,000,000
1,200,000
333,232 340,123 343,175 338,199
267,676 277,804 285,747 255,193
539,804 562,421 566,416 538,135
10%
32%
7%14%
4%4%
29%
Funds held in trust by others
Investmentsheld forlong-termpurposes
Other 1% Receivables
Health Education Campus, net ofdepreciation
Property, plant,equipment, net ofdepreciation
Cash and cash equivalents
9%4%
19%
4%7%
7%
49%
Support Services
SponsoredResearchActivity
Instructional
Auxiliaries
19%
8%
34%
39%
Statement of Activities data
Instructional costs of $330 million, represents 34% of operating expenses, decreased by $28 million or 8% from FY20. Included in direct instructional costs are faculty and staff salaries and benefits.
Sponsored research activity of $373 million, represents 39% of operating expenses, decreased $12 million or 3% from FY20. Sponsored research activity includes sponsored research and training, other sponsored projects, and CCLCM research and training expenses.
Support services costs of $188 million, represents 19% of operating expenses, including libraries, student services, and university services, decreased $2 million or 1% from FY20. The decrease is primarily in libraries.
Auxiliaries expenses of $77 million represents 8% of operating expenses, decreased $11 million or 13% from FY20.
NON-OPERATING ACTIVITIESNon-operating activities increased net assets by $546 million, compared to a $103 million decrease in FY20. The FY21 increase includes positive mark-to-market valuation adjustments to long-term investments of $507 million. Pension plan changes other than periodic benefit costs of $41 million are $70 million lower than FY20 and are primarily the result of increases in plan assets and favorable movement in pension assumptions.
CHANGE IN NET ASSETSThe combined net operating activity of $133 million and net non-operating activity of $546 million resulted in an increase in net assets of $679 million or 29% from FY20.
THE UNIVERSITY’S ENDOWMENTCase Western Reserve University’s investment pool consist of a group of funds, including the endowment funds, funds functioning as endowments (also referred to as quasi-endowment), Board-designated funds, and operating funds, that are invested in a broadly diversified portfolio. The total investment return for the investment pool, net of external manager fees, approximated 31.83% (2021) and 1.30% (2020). Additional detail on the investment pool is shown in Footnote 7.
The University’s combined endowment, the purpose of which is to generate revenue in perpetuity, is comprised of funds invested and managed by the University, that includes endowment funds and quasi-endowments (referred to as the endowment pool) and funds invested and managed outside the University (referred to as funds held in trust). The University’s combined endowment at June 30, 2021 and 2020 is shown in the table below:
(in thousands) 2021 2020Endowment Pool:
Donor-restricted $ 1,546,675 $ 1,207,487
Donor-purpose restricted 353,552 283,975Quasi-endowment 104,147 79,097
Funds held in trust 349,816 280,247
Total combined endowment $ 2,354,190 $ 1,850,806Change in market value 27.20% (0.84)%
Activities and total investment return for the combined endowment for the years ended June 30, 2021 and 2020 are shown in the table below:
(in thousands) 2021 2020Beginning combined endowment $ 1,850,806 $ 1,866,500Additions 41,851 55,218
Spending distribution (81,428) (86,212)Operating support (12,089) (9,171)Appreciation and investment income 555,050 24,471Ending combined endowment $ 2,354,190 $ 1,850,806Combined endowment investment return 31.50% 1.17%

CASE WESTERN RESERVE UNIVERSITY FY21 FINANCIAL REPORT | 5
The University’s Statements of Financial Position reflect total assets of $3.873 billion with a primarily sizable cash and investment balance of $2.699 billion.
ASSETSTotal assets increased $598 million or 18% over FY20. Total cash and investments of $2.699 billion, including cash and cash equivalents, operating investments, investments held for long-term purposes and funds held in trust by others, combined total 70% of University assets. Property, plant, equipment and books represent an additional $736 million or 19% of assets.
TOTAL ASSETS $3.783 billion
Other Revenue Research Endowment Tuition & Fees
0
2,000
4,000
6,000
8,000
10,000
12,000
2017
2018 2019 2020 2021
2018* 2019 2020 2021
Investment ReturnsTuition (net offinancial aid)
Auxiliaries
Other
Gifts & Pledges
SponsoredResearchActivity
Overhead Recovery
Operating investments
*2018 is Revised Budget
5,401
7,0528,548 8,967
4,739
7,680
5,705
2,145
10,77211,668
BudgetActual
0
200,000
400,000
600,000
800,000
1,000,000
1,200,000
460,527 479,951 498,203 513,259
453,905 464,261 461,528 448,146
141,041 145,863 143,730 86,137
89,706 95,103 93,634 93,225
Indirect & Auxiliaries Other Direct Salaries & Benefits2018 2019 2020 20210
200,000
400,000
600,000
800,000
1,000,000
1,200,000
333,232 340,123 343,175 338,199
267,676 277,804 285,747 255,193
539,804 562,421 566,416 538,135
10%
32%
7%14%
4%4%
29%
Funds held in trust by others
Investmentsheld forlong-termpurposes
Other 1% Receivables
Health Education Campus, net ofdepreciation
Property, plant,equipment, net ofdepreciation
Cash and cash equivalents
9%4%
19%
4%7%
7%
49%
Support Services
SponsoredResearchActivity
Instructional
Auxiliaries
19%
8%
34%
39%
Statement of Financial Position data
Cash and cash equivalentsThe University actively manages its cash and cash equivalents to maintain targeted levels of working capital in highly liquid assets to meet daily operating requirements. Working capital and Board designated-funds in excess of the liquidity target are retained in operating investments to produce a higher investment return.
The University’s cash position on June 30 was $145 million, an increase of $37 million or 34% over FY20. Cash equivalents include all highly liquid investments with original purchase maturity of 90 or fewer days, and appropriated endowment income which may be spent on demand.
Operating investmentsThe University’s operations were supported by $288 million of operational investments in addition to cash and
cash equivalents. These investments generally have a maturity of greater than 90 days but may be liquidated on demand. Operating investments increased $56 million or 24% from FY20.
Receivables Receivables include net accounts and loans receivable as well as net pledges receivable. In total, the University had $270 million in receivables, which represent 7% of assets. Receivables increased $25 million or 10% from FY20.
Investments, held for long-term purposesLong-term investments of $1.916 billion increased $380 million or 25% from FY20. Because a majority of the University’s long-term investments are endowments or similar funds, the Board of Trustees’ annually-approved endowment spending allocation and support for certain development-related activities had an impact of approximately $81 million on long-term investments in FY21.
Funds held in trust by othersFunds held in trust by others of $350 million increased $70 million or 25% from FY20.
Health Education CampusThe University has shared interests in the Health Education Campus (“HEC”) with the Cleveland Clinic Foundation. Occupancy began in spring 2019. The University’s basis of $149 million is a $14 million increase over FY20.
Property, plant, equipment, and booksProperty, plant, equipment, and books, net of depreciation, constitute 19% of the University’s assets, totaling $736 million for FY21. Net plant assets increased $17 million or 2% over FY20.
LIABILITIESTotal liabilities of $844 million decreased $81 million or 9% from FY20. The decrease is comprised of (in thousands):
Notes & bonds payable (51,767)Accrued pension liability (43,305)Other 14,097
Decrease in liabilities ($80,975)
STATEMENTS OF FINANCIAL POSITION

6 | DISCUSSION OF FINANCIAL RESULTS - unaudited
Retirement plansThe University provides defined benefit and defined contribution pension plans for its faculty and staff. The pension plan discount rate for the defined benefit plan of 3.25% in FY21 is an increase from 3.20% in FY20. The University’s accrued pension liability decreased $43 million from FY20, to a total accrued pension liability of $87 million in FY21.
DebtTotal liability on notes and bonds payable, including the line of credit and unamortized bond premium and issuance costs, decreased $52 million from FY20 to $491 million. The decrease is primarily due to scheduled principal payments of $16 million and a reduction in the line of credit of $34 million.
The University’s entire variable rate debt of $68 million is synthetically fixed with four floating-to-fixed rate swaps.
During the year, S&P Global Ratings affirmed its rating of AA- and stable outlook. A formal review with Moody’s Investor Services will take place in FY22.
NET ASSETSIn FY21, the University’s total net assets increased $679 million or 29% from FY20 to $3.029 billion due primarily to positive mark-to-market valuation adjustments to long-term investments. Net operating activity increased net assets by $133 million. Net non-operating activity increased net assets by $546 million, including $507 million of net appreciation in long-term investments.
CHANGE IN NET ASSETS(in thousands) 2021 2020Beginning net assets $ 2,349,400 $ 2,398,580Increase (decrease) in net assets 679,131 (49,180)Ending net assets $ 3,028,531 $ 2,349,400
Net assets without donor restrictionsNet assets without donor restrictions increased $118 million or 52% over FY20 to $343 million. Net operating activity added $76 million and net non-operating activity increased net assets by $42 million.
Net assets with donor restrictionsNet assets with donor restrictions increased $561 million or 26% over FY20 to $2.686 billion, driven by $448 million in positive valuation adjustments on restricted long-term investments and $70 million in investment income. The University received $110 million of new restricted gifts and pledges and $52 million in net assets released from restrictions in net operating activity. Non-operating activity decreased net assets with donor restrictions by $11 million in assets released from restrictions.
PROSPECTIVE DISCUSSIONThe University expects to maintain a positive operating position as reflected in its FY22 operating budget surplus of $13 million. Preparations continue to focus on potential pandemic operational impacts. Lastly, senior leadership is continuously engaged in improving operating performance, strengthening the University’s financial position and maintaining strategic momentum using a disciplined approach.
John F. Sideras, CPA Executive Vice President and Chief Financial Officer

CASE WESTERN RESERVE UNIVERSITY FY21 FINANCIAL REPORT | 7
SELECTED FINANCIAL DATA unauditedFiscal Years Ended June 30
in thousands of dollars 2021 2020 2019 2018STATEMENT OF OPERATIONS HIGHLIGHTS – Management View
Total revenue $ 1,140,767 $ 1,197,095 $ 1,185,178 $ 1,145,179Total expense 1,131,527 1,195,338 1,180,348 1,140,712
Operating margin 9,240 1,757 4,830 4,467Retained surplus use 2,428 388 2,850 4,500
Surplus $ 11,668 $ 2,145 $ 7,680 $ 8,967
STATEMENT OF ACTIVITIES HIGHLIGHTS – GAAP BasisTuition and fees (net of student aid) $ 318,662 $ 302,802 $ 300,703 $ 289,278Investment, FHBO, and operational returns 115,658 97,822 97,893 97,584Grants and contracts 351,668 364,688 365,693 361,177Facilities and administrative cost recovery 73,334 76,856 78,765 76,642Gifts and pledges 151,848 110,818 98,173 70,449Other revenue 46,471 57,108 50,914 48,523Auxiliary services 43,436 65,505 75,767 72,645
Total operating revenues and other support 1,101,077 1,075,599 1,067,908 1,016,298Instructional expenses 330,401 358,200 341,555 331,878Sponsored research activity 372,899 385,277 393,959 386,071Support services 187,800 189,724 186,782 180,568Auxiliary services 76,733 87,961 84,976 83,370
Total operating expense 967,833 1,021,162 1,007,272 981,887Net operating activity $ 133,244 $ 54,437 $ 60,636 $ 34,411
Long-term investment activities 575,295 (1,854) 77,014 136,238Other non-operating activities (29,408) (101,763) (92,510) (60,520)
Net non-operating activities $ 545,887 $ (103,617) $ (15,496) $ 75,718Change in net assets $ 679,131 $ (49,180) $ 45,140 $ 110,129
FINANCIAL POSITION HIGHLIGHTSCash and cash equivalents $ 145,314 $ 108,276 $ 80,586 $ 105,409Operating investments, at market 287,818 232,034 255,668 238,988Receivables, net 269,636 244,883 268,206 247,359Investments (held for long-term purposes) 1,915,558 1,535,878 1,511,280 1,463,671Funds held in trust by others 349,816 280,247 298,189 303,597Health Education Campus 148,663 134,611 59,890 46,120Property, plant, equipment, and books, net of depreciation 736,443 719,320 733,010 742,416Prepaid expenses and other assets 19,739 19,582 10,564 11,946
Total assets $ 3,872,987 $ 3,274,831 $ 3,217,393 $ 3,159,506Total liabilities $ 844,456 $ 925,431 $ 818,813 $ 806,066Total net assets $ 3,028,531 $ 2,349,400 $ 2,398,580 $ 2,353,440
OTHER FINANCIAL INFORMATIONNet investments (including FHBO), at fair value $ 2,553,192 $ 2,048,159 $ 2,065,137 $ 2,006,256Investments payout in support of operations $ 81,428 $ 86,212 $ 83,634 $ 81,345
Total gifts and pledges (attainment) $ 171,766 $ 167,964 $ 182,093 $ 207,973Total gifts - cash basis $ 136,288 $ 135,426 $ 112,557 $ 113,178
STUDENTSEnrollment*
Undergraduate 5,334 5,286 5,151 5,035Post-Baccalaureate 5,458 5,790 5,921 5,882
*Enrollment for fall semester of fiscal year in FTEs

Report of Independent Auditors
To the Board of Trustees Case Western Reserve University:
We have audited the accompanying financial statements of Case Western Reserve University, which comprise the statements of financial position as of June 30, 2021 and 2020, and the related statements of activities for the year ended June 30, 2021 and of cash flows for the years ended June 30, 2021 and 2020.
Management’s Responsibility for the Financial Statements
Management is responsible for the preparation and fair presentation of the financial statements in accordance with accounting principles generally accepted in the United States of America; this includes the design, implementation and maintenance of internal control relevant to the preparation and fair presentation of financial statements that are free from material misstatement, whether due to fraud or error.
Auditors’ Responsibility
Our responsibility is to express an opinion on the financial statements based on our audit. We conducted our audit in accordance with auditing standards generally accepted in the United States of America. Those standards require that we plan and perform the audit to obtain reasonable assurance about whether the financial statements are free from material misstatement.
An audit involves performing procedures to obtain audit evidence about the amounts and disclosures in the financial statements. The procedures selected depend on our judgment, including the assessment of the risks of material misstatement of the financial statements, whether due to fraud or error. In making those risk assessments, we consider internal control relevant to the University’s preparation and fair presentation of the financial statements in order to design audit procedures that are appropriate in the circumstances, but not for the purpose of expressing an opinion on the effectiveness of the University’s internal control. Accordingly, we express no such opinion. An audit also includes evaluating the appropriateness of accounting policies used and the reasonableness of significant accounting estimates made by management, as well as evaluating the overall presentation of the financial statements. We believe that the audit evidence we have obtained is sufficient and appropriate to provide a basis for our audit opinion.
Opinion
In our opinion, the financial statements referred to above present fairly, in all material respects, the financial position of Case Western Reserve University as of June 30, 2021 and 2020, and the changes in its net assets for the year ended June 30, 2021 and its cash flows for the years ended June 30, 2021 and 2020 in accordance with accounting principles generally accepted in the United States of America.

Other Matter
We previously audited the statement of financial position as of June 30, 2020, and the related statements of activities (not presented herein) and of cash flows for the year then ended, and in our report dated October 16, 2020, we expressed an unmodified opinion on those financial statements. In our opinion, the information set forth in the accompanying summarized financial information as of June 30, 2020 and for the year then ended is consistent, in all material respects, with the audited financial statements from which it has been derived.
Cleveland, Ohio October 1 , 2021

10 | FINANCIAL STATEMENTS
STATEMENTS OF FINANCIAL POSITION
June 30
In thousands of dollars 2021 2020
ASSETSCash and cash equivalents $ 145,314 $ 108,276 Operating investments 287,818 232,034 Accounts and loans receivable, net 99,375 91,682 Pledges receivable, net 170,261 153,201 Prepaid expenses and other assets 9,705 10,533 Right-of-use assets - operating leases 10,034 9,049 Investments, held for long-term purposes 1,915,558 1,535,878 Funds held in trust by others 349,816 280,247 Health Education Campus, net 148,663 134,611 Property, plant, equipment and books, net 736,443 719,320
TOTAL ASSETS $ 3,872,987 $ 3,274,831
LIABILITIES AND NET ASSETSLIABILITIES
Accounts payable and accrued expenses $ 78,066 $ 60,691 Deferred income and other liabilities 107,964 116,613 Operating lease obligations 10,034 9,049 Annuities payable 38,117 36,724 Refundable advances 11,704 5,863 Accrued pension liability 87,098 130,403 Notes and bonds payable 491,140 542,907 Refundable federal student loans 20,333 23,181
TOTAL LIABILITIES $ 844,456 $ 925,431 NET ASSETS
Without donor restrictions $ 342,619 $ 224,696 With donor restrictions 2,685,912 2,124,704
TOTAL NET ASSETS $ 3,028,531 $ 2,349,400 TOTAL LIABILITIES AND NET ASSETS $ 3,872,987 $ 3,274,831
The accompanying notes are an integral part of the consolidated financial statements.

CASE WESTERN RESERVE UNIVERSITY FY21 FINANCIAL REPORT | 11
STATEMENT OF ACTIVITIESwith summarized financial information for the year ended June 30, 2020
For the year ended June 30
In thousands of dollars
Without Donor
RestrictionsWith Donor Restrictions 2021 2020
OPERATING REVENUES AND OTHER SUPPORTStudent tuition and fees, net of student aid of $209,397 and $206,737, respectively $ 318,662 $ 318,662 $ 302,802 Investment returns distributed for operations 66,671 66,671 69,999 FHBO returns distributed 14,757 14,757 16,213 Investment returns on operating investments 34,230 34,230 11,610 Grants and contracts 255,520 255,520 263,749 CCLCM grants and contracts 96,148 96,148 100,939 Gifts and pledges 41,794 $ 110,054 151,848 110,818 State of Ohio appropriation 2,551 2,551 2,492 Facilities and administrative cost recovery 73,334 73,334 76,856 Organized activities 9,308 9,308 10,044 Other sources 34,530 82 34,612 44,572 Auxiliary services - students 37,421 37,421 57,956 Auxiliary services - other 6,015 6,015 7,549 Net assets released from restrictions 52,414 (52,414) -
TOTAL OPERATING REVENUES AND OTHER SUPPORT $ 1,043,355 $ 57,722 $ 1,101,077 $ 1,075,599 OPERATING EXPENSES
Instructional 330,401 330,401 358,200 Sponsored research and training 242,815 242,815 258,792 Other sponsored projects 33,936 33,936 25,546 CCLCM research and training 96,148 96,148 100,939 Libraries 20,683 20,683 22,850 Student services 29,999 29,999 35,275 University services 137,118 137,118 131,599 Auxiliary services - students 63,225 63,225 72,022 Auxiliary services - other 13,508 13,508 15,939
TOTAL OPERATING EXPENSES $ 967,833 $ - $ 967,833 $ 1,021,162 NET OPERATING ACTIVITY $ 75,522 $ 57,722 $ 133,244 $ 54,437
NON-OPERATING ACTIVITIESLong-term investment activities Investment (loss) income $ (1,653) $ 70,006 $ 68,353 $ 37,532 Net appreciation (depreciation) 59,259 447,683 506,942 (39,386)Total long-term investment activities 57,606 517,689 575,295 (1,854)Investment returns distributed for operations (66,671) (66,671) (69,999)Change in liabilities due under life-income agreements (10) (3,056) (3,066) (2,128)Loss on disposal of plant assets (416) (416) (535)Pension plan changes other than periodic benefit costs 40,745 40,745 (29,101)Net assets released from restrictions 11,147 (11,147) -
NET NON-OPERATING ACTIVITY $ 42,401 $ 503,486 $ 545,887 $ (103,617)
CHANGE IN NET ASSETS $ 117,923 $ 561,208 $ 679,131 $ (49,180)Beginning net assets 224,696 2,124,704 2,349,400 2,398,580 ENDING NET ASSETS $ 342,619 $ 2,685,912 $ 3,028,531 $ 2,349,400
The accompanying notes are an integral part of the financial statements.

12 | FINANCIAL STATEMENTS
STATEMENTS OF CASH FLOWSFor the year ended
June 30In thousands of dollars 2021 2020CASH FLOWS FROM OPERATING ACTIVITIESChange in net assets $ 679,131 $ (49,180)Adjustments to reconcile change in net assets to net cash provided by (used for) operating activities:
Depreciation 67,579 70,434 Amortization of bond issuance costs 341 326 Amortization of bond premiums (6,487) (5,368)Amortization of right-of-use assets - operating leases 2,209 1,183 Realized and unrealized net gains on investments (534,644) (29,434)Increase to annuities payable resulting from actuarial adjustments 3,066 2,128 Gifts of property and equipment (1,972) (489)Loss on disposal of plant assets 416 535 Contributions restricted for long-term investment (49,980) (48,098)(Increase) decrease in accounts and loans receivable, net (10,486) 8,588 (Increase) decrease in pledges receivable, net (17,060) 11,055 Decrease in prepaid expenses and other assets 828 31 (Increase) decrease in funds held in trust by others (69,569) 17,942 Increase (decrease) in accounts payable and accrued expenses 16,228 (2,881)Increase (decrease) in deferred income and other liabilities 1,351 (1,329)Decrease in operating lease obligations (2,209) (1,183)Increase (decrease) in refundable advances 5,841 (1,847)(Decrease) increase in accrued pension liability (43,305) 26,211
NET CASH PROVIDED BY (USED FOR) OPERATING ACTIVITIES $ 41,278 $ (1,376)CASH FLOWS FROM INVESTING ACTIVITIES
Student loans Collected $ 7,148 $ 7,993 Issued (4,355) (4,313)Increase in donor-restricted cash for long-term investment (2,083) (3,862)Proceeds from the sale of investments 1,028,312 925,137 Purchase of investments (929,132) (896,667)Increase in Health Education Campus (26,144) (27,911)Proceeds from the sale of plant assets 107 333 Purchases of property, plant, equipment and books (80,014) (54,161)
NET CASH USED FOR INVESTING ACTIVITIES $ (6,161) $ (53,451)CASH FLOWS FROM FINANCING ACTIVITIES
Decrease in federal advances for student loans $ (2,848) $ (2,917)Contributions restricted for long-term investment 32,235 36,008 Proceeds from the sale of investments received as gifts 19,828 15,952 Proceeds from short-term debt 96,000 228,000 Repayment of short-term debt (130,000) (231,000)Proceeds from notes and bonds payable 4,138 76,014 Repayment of notes and bonds payable (15,759) (37,715)Increase to annuities payable resulting from new gifts 441 214 Decrease to annuities payable resulting from payments (2,114) (2,039)
NET CASH PROVIDED BY FINANCING ACTIVITIES $ 1,921 $ 82,517
NET INCREASE IN CASH AND CASH EQUIVALENTS $ 37,038 $ 27,690 Cash and cash equivalents, beginning of year 108,276 80,586 CASH AND CASH EQUIVALENTS, END OF YEAR $ 145,314 $ 108,276
SUPPLEMENTAL DATA:Interest paid in cash $ 18,125 $ 19,523 Construction-in-progress payments included in accounts payable 3,830 2,682 Noncash activity:Commencement of new operation lease obligation 3,194 Initial adoption of ASU 2016-02: “Leases (Topic 842)” (Note 5) 10,232 Health Education Campus University obligation (Note 9) 40,000 50,000
The accompanying notes are an integral part of the consolidated financial statements.

CASE WESTERN RESERVE UNIVERSITY FY21 FINANCIAL REPORT | 13
Basis of PresentationCase Western Reserve University (“the University”) is an Ohio not-for-profit corporation that operates a private research university in Cleveland, Ohio. The financial statements of the University as of June 30, 2021 and 2020, and for the years then ended, have been prepared in accordance with accounting principles generally accepted in the United States of America (“U.S. GAAP”). Accordingly, the accompanying financial statements have been prepared on the accrual basis of accounting.
Net Asset CategoriesStandards for external financial reporting by not-for-profit organizations require that resources be classified for reporting purposes into two net asset categories according to donor-imposed restrictions (Note 17):
Without Donor Restrictions are those net assets not subject to donor-imposed restrictions. All revenues, gains and losses that are not restricted by donors are included in this classification. All operating expenses are reported as decreases in net assets without donor restrictions.
Contributions not subject to donor-imposed restrictions and donor-restricted contributions that are received and either spent, or deemed spent, for the restricted purpose within the same year are reported as increases to net assets without donor restrictions.
Net assets without donor restrictions include certain funds that are Board-designated as functioning as endowment and a liquidity reserve.
With Donor Restrictions are those net assets subject to donor-imposed time or purpose restrictions that are expected to be met and those subject to donor-imposed perpetual restrictions. These net assets include donor-restricted endowment, unconditional pledges, certain funds restricted for capital projects, split-interest agreements, and interests in perpetual trusts held by others.
For donor-imposed time or purpose restrictions, the University meets such donor restrictions through the passage of time, the appropriation of endowment earnings, placing gift-funded capital projects into service, and/or the University incurring expenses. When such restrictions are met, the related net assets are reported as Net assets released from restrictions in the statement of activities.
ContributionsContributions, including unconditional pledges to give and irrevocable trusts held by others with the University as the beneficiary, are recognized as revenues in the period received or promised. They are classified as net assets without donor restrictions or with donor restrictions depending upon the donor’s intent.
Contributions restricted for the acquisition of land, buildings and equipment are reported as revenues with donor restrictions. These contributions are reclassified to net assets without donor restrictions when the assets are placed in service. Promises to give that are subject to donor-imposed stipulations that the corpus be maintained in perpetuity are recognized as increases in net assets with donor restrictions.
Conditional promises to give are not recognized until the conditions on which they depend are substantially met. Contributions of assets other than cash are reported at their estimated fair value at the date of gift. Contributions scheduled to be received after one year are discounted using a market rate (Note 4).
Grants and Contracts (Government and Private)Government and private grant contracts are reviewed to determine whether they constitute an exchange transaction or a contribution, and whether conditions are present that would affect the timing of revenue recognition. Those determined to be contributions without conditions will have revenue recognized in the period the grant or contract is entered into and those determined to have conditions will have revenue recognized once the condition has been met. Those determined to be exchange transactions will have revenue recognized when barriers to the grant or contract funding have been overcome as qualifying expenses are incurred. Any payment received before barriers to funding have been overcome is recorded as a refundable advance. The University had refundable advances of $11,704 (2021) and $5,863 (2020). Once recognition is allowed, projects funded by grants and contracts that incur expenses prior to payment receipts are recorded as revenue with a corresponding receivable.
Investment Returns on Operating InvestmentsThe University has invested excess operating funds and certain Board-designated funds with the University’s
1. SUMMARY OF SIGNIFICANT ACCOUNTING POLICIES

14 | NOTES TO THE FINANCIAL STATEMENTS - in thousands of dollars
investment pool. The operating funds are invested alongside other funds and receive a pro-rata portion of income, expenses, gains, and losses of the pool.
Cash and Cash EquivalentsThe University considers all highly liquid investments with an original maturity of 90 days or less when purchased as cash and cash equivalents, except those amounts managed by investment managers as part of the investment pool that do not belong to operations, or unspent bond proceeds, which are classified as investments. The University maintains operating cash and reserves for replacement balances in financial institutions which, from time to time, may exceed federally insured limits. The University periodically assesses the financial condition of these institutions and believes that the risk of loss is minimal.
Operating InvestmentsOperating investments are stated at fair value and include all other current investments with original maturities greater than 90 days that are used to support operations. These investments may include obligations of triple A-rated banks, various United States Government agencies, other investments, and internal operating funds invested in the University’s investment pool. Although the pool primarily invests in mid- to long-term investments, the pool maintains a sufficient investment mix that allows operating assets to be liquidated upon demand.
LeasesThe University determines if an arrangement is a lease at inception. The University has both leases under which it is obligated as a lessee and leases for which it is a lessor. Operating leases as a lessee are included in Right-of-use assets – operating leases and Operating lease obligations in the statements of financial position. Right-of-use assets represent the University’s right to use an underlying asset for the lease term. Lease obligations represent the University’s liability to make lease payments arising from the lease. Operating lease right-of-use assets and related obligations are recognized at commencement date based on the present value of lease payments over the lease term and discounted using an appropriate incremental borrowing rate. The incremental borrowing rate is based on the information available at commencement date. The value of an option to extend a lease is reflected to the extent it is reasonably certain management will exercise that option.
InvestmentsInvestments are made within guidelines authorized by the University’s Board of Trustees (“the Board”). Investments are initially recorded at cost at date of acquisition or fair value at date of donation in the case of gifts.
Ownership of marketable securities is recognized as of the trade date. Endowment returns are calculated net of internal and external investment management expenses.
Investments are stated at fair value as defined by Accounting Standards Codification (“ASC”) 820, “Fair Value Measurements and Disclosures.” Fair value is defined under ASC 820 as the exchange price that would be received for an asset or paid to transfer a liability, i.e., an exit price, in the principal or most advantageous market for the asset or liability in an orderly transaction between market participants on the measurement date.
The fair value of all debt and equity securities with readily determinable fair values are based on quotations obtained from national securities exchanges. The alternative investments, which are not readily marketable, are carried at estimated fair values based on the University’s proportional share of the net asset value of the total fund as provided by the investment managers. The University reviews and evaluates the values provided by the investment managers including the valuation methods and assumptions used in determining the fair value of the alternative investments. Those estimated fair values may differ significantly from the values that would have been used had a ready market for these securities existed.
Realized gains and losses on investments are included in Investment (loss) income in the statement of activities. Average cost is generally used to determine gains or losses on securities sold. Unrealized changes in the fair value of investments are shown as net unrealized appreciation or depreciation.
The following describes the hierarchy of inputs used to measure fair value and the primary valuation methodologies used by the University for financial instruments measured at fair value on a recurring basis (Note 8). The three levels of inputs are as follows:
Level 1 – Quoted unadjusted prices in active markets for identical assets or liabilities. An active market is one in which transactions occur with sufficient frequency and volume to produce pricing information on an

CASE WESTERN RESERVE UNIVERSITY FY21 FINANCIAL REPORT | 15
ongoing basis. Market price data are generally obtained from exchange or dealer markets.
Level 2 – Pricing inputs other than Level 1 that are observable, either directly or indirectly, such as quoted prices for similar assets or liabilities; quoted prices in markets that are not active; or other inputs that are observable or can be corroborated by observable market data for substantially the same term of the assets or liabilities. Inputs are obtained from various sources including market participants, dealers and brokers.
Level 3 – Unobservable inputs that are supported by little or no market activity and that are significant to the fair value of the assets or liabilities.
CollectionsThe University’s collections of historically significant artifacts, scientific specimens, and art objects are held for education, research, scientific inquiry, and public exhibition. They are neither disposed of for financial gain nor encumbered in any manner. Accordingly, their value is not reflected in the University’s financial statements.
Funds Held in Trust by OthersFunds held in trust by others are assets held and administered by outside trustees from which the University derives income or residual interest. Funds held in trust by others are reported at their fair value as of June 30, 2021 and 2020.
Income received from funds held in trust by others is classified as net assets with donor restrictions until those amounts are appropriated and expended by the University. Income appropriated within the same year earned/received is classified as without donor restrictions. Unrealized changes in the fair value of investments are shown as net unrealized appreciation or depreciation in net assets with donor restrictions.
Health Education CampusThe University currently has shared interests in the Health Education Campus (“HEC”) with the Cleveland Clinic Foundation (“CCF”). Commencing in fiscal year 2014, the University and CCF began a joint effort to raise funds for the construction of the HEC project. Occupancy of the HEC, which includes an academic building and separate dental clinic, began in spring 2019 and the University’s basis is determined on cash transfers toward the HEC project. Upon
the completion of fundraising and final funding of the project, the parties are committed to joint ownership of the above described properties (Note 9).
Fixed Assets When capital assets are sold or disposed, the carrying value of such assets and any accumulated depreciation are removed from the asset accounts. Any resulting gain or loss on disposal is recognized in the non-operating portion of the statement of activities.
Expenditures for construction-in-progress are capitalized as incurred and depreciated over the estimated life of the asset when placed into service. All identifiable direct costs including other costs incurred to ready the asset for its intended use are included in the cost of the project. The University capitalizes interest on borrowings to finance facilities, net of any investment income earned through the temporary investment of project borrowings, during construction until the project has been substantially completed.
Split-Interest AgreementsThe University has split-interest agreements consisting primarily of pooled income funds, charitable gift annuities and charitable remainder unitrusts and annuities. Contributions are recognized at the date the trusts and annuities are established, net of a liability for the present value of the estimated future cash outflows to beneficiaries, using a discount rate of 1.94% and 1.20% for June 30, 2021 and 2020, respectively. These assets are invested and payments are made to donors and beneficiaries in accordance with the respective agreements.
Allocation of Certain ExpensesThe statement of activities presents expenses by function. Some expenses – such as depreciation, amortization, and expenses related to the operation of the physical plant – are allocated by square footage. Interest expense is allocated to the functions that derive the greatest benefit from the facilities financed (Note 16).
Retirement PlansThe University accounts for its defined benefit postretirement plan in accordance with ASC 715, “Compensation – Retirement Benefits.” The University recognizes the overfunded or underfunded status of a defined benefit postretirement plan as an asset or liability in its statements of financial position in the year in which

16 | NOTES TO THE FINANCIAL STATEMENTS - in thousands of dollars
the change occurs, with an offsetting impact to net assets without donor restriction.
Use of EstimatesFinancial statements using U.S. GAAP rely on estimates. At June 30, management makes certain estimates and assumptions, which affect assets and liabilities, disclosures of contingent assets and liabilities, and reported revenues and expenses during the period. Actual results may differ from these estimates.
Comparative InformationThe statement of activities includes prior year summarized comparative information in total, but not by net asset category. Such information does not include enough detail to constitute a presentation in conformity with U.S. GAAP. Accordingly, such information should be read in conjunction with the University’s financial statements for the year ended June 30, 2020, from which it was derived.
Income TaxesThe University is exempt from federal income tax to the extent provided under section 501(c) (3) of the Internal Revenue Code (“IRC”). The University is classified as an organization that is not a private foundation under section 509(a) of the IRC, and as such, gifts to the University qualify for deduction as charitable contributions. The University is exempt from federal income tax; however, it is required to pay federal income tax on unrelated business income. The University did not have any material income tax liabilities for the years ended June 30, 2021 and 2020. ASC 740, “Income Taxes,” prescribes a recognition threshold and measurement requirements for financial statement recognition and measurement of a tax position taken or expected to be taken in a tax return. In addition, ASC 740 provides guidance on recognition, classification and disclosure requirements for uncertain tax provisions. The University has no financial reporting requirements associated with ASC 740 for the years ended June 30, 2021 and 2020.
Revenue RecognitionThe University appropriately reflects the consideration to which they expect to be entitled in exchange for goods and services by allocating transaction price to identified performance obligations and recognizing revenue as performance obligations are satisfied. Significant judgments, such as the timing of satisfaction
of performance obligation and associated transaction prices, may be required in the recognition of revenue, and certain economic factors, such as varying student class sizes, may affect revenue recognized in future years. Student tuition and fees are recorded as revenues during the year the related academic services are provided and are displayed net of student aid on the statement of activities. Student tuition and fees received in advance of services provided are recorded as deferred revenue. The University’s significant revenue sources, shown in disaggregated form, for the fiscal years ended June 30, 2021 and 2020 are as follows:
2021 2020STUDENT TUITION AND FEES Undergraduate tuition $ 276,845 $ 258,938 Less: Student aid (142,179) (139,961)
134,666 118,977
Graduate and professional tuition 242,614 242,915 Less: Student aid (67,218) (66,776)
175,396 176,139
Fees 8,600 7,686TOTAL NET STUDENT TUITION AND FEES $ 318,662 $ 302,802
AUXILIARY SERVICES REVENUE Food Services $ 9,052 $ 15,492 Housing and greek life 21,950 35,747 Health services 6,081 6,123 Parking 4,077 5,001 Other 2,276 3,142TOTAL AUXILIARY SERVICES REVENUES $ 43,436 $ 65,505
New PronouncementsIn June 2016, the FASB issued ASU 2016-13: “Financial Instruments-Credit Losses (Topic 326): Measurement of Credit Losses on Financial Instruments.” The standard’s main goal is to improve financial reporting by requiring earlier recognition of credit losses on financing receivables and other financial assets in scope. The standard is effective for fiscal years beginning after December 31, 2022. The University is evaluating the impact this will have on financial statements for the fiscal year ending June 30, 2024, the first year in which the standard is effective.
In March 2017, the FASB issued ASU 2017-08: “Receivables – Nonrefundable Fees and Other Costs (Subtopic 310-20): Premium Amortization on Purchased Callable Debt

CASE WESTERN RESERVE UNIVERSITY FY21 FINANCIAL REPORT | 17
Securities,” which shortens the amortization period of premiums on certain purchased callable debt securities to the earliest call date. The standard is effective for fiscal years beginning after December 15, 2019, and has been adopted by the University in the current fiscal year and did not have a material effect on the financial statements.
In August 2017, the FASB issued ASU 2017-12: “Targeted Improvements to Accounting for Hedging Activities,” which improves the financial reporting of hedging relationships to better portray the economic results of an entity’s risk management activities in its financial statements. The standard is effective for fiscal years beginning after December 15, 2020. The University is evaluating the impact this will have on the financial statements for the fiscal year ending June 30, 2022, the first year in which the standard is effective.
In August 2018, the FASB issued ASU 2018-13: “Fair Value Measurement (Topic 820): Disclosure Framework – Changes to the Disclosure Requirements for Fair Value Measurement,” which modifies the disclosure requirements on fair value measurements in Topic 820, including disclosure related to Level 3 investments. The standard is effective for fiscal years beginning after December 15, 2019, and has been adopted by the University in the current fiscal year and did not have a material effect on the financial statements.
In August 2018, the FASB issued ASU 2018-14: “Compensation – Defined Benefit Plans (Subtopic 715-20): Disclosure Framework – Changes to the Disclosure Requirements for Defined Benefit Plans,” which modifies the disclosure requirements for employers that sponsor defined benefit pension or other postretirement plans, including disclosures related to plan cost and timing. The standard is effective for fiscal years ending after December 15, 2021. The University is evaluating the impact this will have on the financial statements for the
fiscal year ending June 30, 2022, the first year in which the standard is effective.
In March 2019, the FASB issued ASU 2019-03: “Not-for-Profit Entities (Topic 958): Updating the Definition of Collections,” which modifies the definition of the term collections and requires that a collection-holding entity disclose its policy for the use of proceeds from when collected items are deaccessioned. The standard is effective for fiscal years beginning after December 15, 2019, and has been adopted by the University in the current fiscal year and did not have a material effect on the financial statements.
In March 2020, the FASB issued ASU 2020-04: “Reference Rate Reform (Topic 848): Facilitation of the Effects of Reference Rate Reform on Financial Reporting.” The standard provides temporary optional expedients and exceptions to U.S. GAAP guidance on contract modifications and hedge accounting to ease the financial reporting burdens of the expected market transition from the London Inter-Bank Offered Rate (“LIBOR”) and other interbank offered rates to alternative reference rates, such as the Secured Overnight Financing Rate. The standard is effective March 12, 2020 through December 31, 2022. The University is evaluating the impact this will have on the financial statements for the fiscal year ending June 30, 2023.
In September 2020, the FASB issued ASU 2020-07: “Not-for-Profit Entities (Topic 958): Presentation and Disclosures by Not-for-Profit Entities for Contributed Nonfinancial Assets.” The standard provides increased transparency of contributed nonfinancial assets through enhancements to presentation and disclosure. The standard is effective for fiscal years beginning after June 15, 2021. The University is evaluating the impact this will have on the financial statements for the fiscal year ending June 30, 2022, the first year in which the standard is effective.

18 | NOTES TO THE FINANCIAL STATEMENTS - in thousands of dollars
The University manages its financial assets and liquidity resources in order to provide cash for payment of general expenditures, such as operating expenses, construction costs, and obligations related to debt. Financial assets classified below as available for general expenditure within one year are those that are considered both convertible to cash and free of donor-imposed and/or contractual
restrictions that would limit or prevent the use of such cash to fund general expenditures.
As of June 30, 2021 and 2020, the University’s financial assets and liquidity resources available for general expenditure within one year are as follows:
Additionally, the University has Board-designated funds of $230,450 and $187,860, including a liquidity reserve of $126,303 and $108,763, as of June 30, 2021 and 2020, respectively. Although the University does not intend to spend from these investment funds, other than amounts appropriated by the Board for fiscal year 2022, amounts from its Board-designated funds could be made available, if necessary.
In addition to the financial assets above, a significant portion of the University’s annual expenditures will be funded by current year operating revenues including tuition, grant and contract income and auxiliary services income. The University’s cash flows have seasonal variations during the year primarily attributable to student billings and
the concentration of contributions received at calendar and fiscal year ends. As part of the University’s liquidity management, the University invests cash in excess of daily requirements in various short-term investment instruments.
Under the University’s cash management policies, cash received from endowment spending related to either funds functioning as endowment or donor-restricted endowments is available for general expenditure. Endowment spending distributed from donor-restricted endowments is reflected in the University’s net assets with donor restrictions until the expenditures actually are incurred; such expenditures are funded by available liquidity resources at the time they are paid.
2. LIQUIDITY
2021 2020Financial assets available within one year: Cash and cash equivalents $ 145,314 $ 108,276 Operating investments 56,358 40,364 Accounts and notes receivable, net 57,770 47,683 Expected pledge payments available for operations 22,494 15,869 Other assets 694 579 Fiscal year 2022 and 2021 pooled endowment and similar funds spending allocation, respectively 68,700 72,300
TOTAL FINANCIAL ASSETS AVAILABLE WITHIN ONE YEAR $ 351,330 $ 285,071
Liquidity resources: Committed lines of credit (Note 11) 200,000 150,000 Less: current borrowings under lines of credit (34,000) Total 200,000 116,000
TOTAL FINANCIAL ASSETS AND LIQUIDITY RESOURCES AVAILABLE WITHIN ONE YEAR $ 551,330 $ 401,071

CASE WESTERN RESERVE UNIVERSITY FY21 FINANCIAL REPORT | 19
Accounts and loans receivable of the University at June 30, 2021 and 2020 were as follows:
2021 2020ACCOUNTS RECEIVABLE, NET Grants, contracts and others $ 54,276 $ 46,377 Students 3,859 1,502STUDENT LOANS, NET 41,240 43,803ACCOUNTS AND LOANS RECEIVABLE, NET $ 99,375 $ 91,682
Allowance for doubtful accounts: Accounts receivable $ 6,546 $ 6,059 Loans receivable $ 1,310 $ 1,531 Management regularly assesses the adequacy of the allowance for doubtful accounts by performing ongoing evaluations of the various components of the accounts receivable and student loan portfolios, including such factors as the differing economic risks associated with each category, the financial condition of specific borrowers,
the economic environment in which the borrowers operate, the level of delinquent loans, and the past history of the various borrowers and the University.
Factors also considered by management when performing its assessment, in addition to general economic conditions and the other factors described above, included, but were not limited to, a detailed review of the aging of the various receivables and loans, and a review of the default rate by loan category in comparison to prior years. The level of the allowance is adjusted based on the results of management’s analysis.
Management considers the allowance for doubtful accounts to be prudent and reasonable. Furthermore, the University’s allowance is general in nature and is available to absorb losses from any loan category.
Management believes that the allowance for doubtful accounts at June 30, 2021 is adequate to absorb credit losses inherent in the portfolio as of that date.
Unconditional promises to give are included in the financial statements as pledges receivable and revenue of the appropriate net asset category. Multi-year pledges are recorded after discounting based on the market rate to the present value of expected future cash flows. The discount rate utilized for fiscal 2021 and 2020 was 5%.
Unconditional promises to give at June 30, 2021 and 2020 are expected to be realized in the following periods:
2021 2020Less than one year $ 60,763 $ 54, 233Between one year and five years 124,217 111,639More than five years 13,373 18,069
198,353 183,941Less: Discount (7,012) (12,007)Less: Allowance (21,080) (18,733)TOTAL PLEDGES RECEIVABLE, NET $ 170,261 $ 153,201 Management follows a similar approach as described in Note 3 for accounts and loans receivable in evaluating the adequacy of the allowance for doubtful accounts for
pledges receivable. Management considers the allowance for doubtful accounts to be prudent and reasonable. Management believes that the allowance for doubtful accounts at June 30, 2021 is adequate to absorb any uncollectible pledges as of that date.
Pledges receivable at June 30, 2021 and 2020 had the following restrictions:
2021 2020Department programs and activities $ 74,230 $ 58,505Endowments for scholarships and department programs and activities 74,734 60,896Building construction 21,297 33,800TOTAL PLEDGES RECEIVABLE, NET $ 170,261 $ 153,201
Uncollectible pledges totaling $13,488 (2021) and $17,452 (2020) were written off against the allowance for uncollectible pledges. The University had unsecured related party pledges of $5,918 (2021) and $3,527 (2020) and conditional pledge commitments totaling $19,403 (2021) and $16,863 (2020).
3. ACCOUNTS AND LOANS RECEIVABLE
4. PLEDGES RECEIVABLE

20 | NOTES TO THE FINANCIAL STATEMENTS - in thousands of dollars
The University is committed to minimum annual rent payments under several operating leases for educational and commercial space through fiscal year 2032. The components of lease expense are as follows:
LEASE COST 2021 2020Operating lease expense $ 2,584 $ 1,581Short-term lease expense 548 396 Sublease income (500) (500)TOTAL LEASE EXPENSE $ 2,632 $ 1,477
OTHER INFORMATION:Weighted-average remaining lease term in years – operating leases 7.2 years 9 years
Weighted-average discount rate – operating leases 3.06% 3.09%
Payments due include options to extend operating leases through fiscal year 2032 and are summarized below as of June 30, 2021:
Year2022 $ 2,5652023 2,204 2024 989 2025 916 2026 930 Thereafter 3,750
11,354 Less: amounts representing interest (1,320)TOTAL OPERATING LEASE OBLIGATION $ 10,034
The University is the lessor in two leases for commercial space through fiscal year 2041. Future minimum rental revenue due is summarized below as of June 30, 2021:
Year2022 $ 1,0162023 1,5322024 1,4902025 1,0322026 1,032Thereafter 14,960TOTAL $ 21,062
The University holds long-term investments for endowment funds with donor restrictions, donor-restricted funds, annuity assets, Board-designated funds and excess operating assets that are able to be invested in longer term investments.
The University invests through traditional investments as well as operating an investment pool that works similar to a mutual fund (Note 7). The University’s long-term investments at June 30, 2021 and 2020 were as follows:
5. LEASING
6. LONG-TERM INVESTMENTS
2021 2020Equity securities $ 426,472 $ 364,849Fixed-income securities 138,914 163,028 Limited partnerships and Other Venture capital 23,211 28,084 Private equity 803,510 604,785 Real estate 44,698 5,974 Absolute return 711,728 551,776 Other 54,762 49,335Equity real estate 81 81TOTAL INVESTMENTS $ 2,203,376 $ 1,767,912
2021 2020Operating investments $ 287,818 $ 232,034Investments, held for long-term purposes 1,915,558 1,535,878 TOTAL INVESTMENTS $ 2,203,376 $ 1,767,912

CASE WESTERN RESERVE UNIVERSITY FY21 FINANCIAL REPORT | 21
Endowment FundsThe purpose of endowment funds is to generate in perpetuity revenue to support specific activities or for general institutional use. Endowments represent only those net assets that are under the control of the University. Gift annuities, interests in funds held in trust by others, and pledges designated for the endowment but not yet received are not considered components of the endowment.
The state of Ohio has enacted legislation that incorporates the provisions outlined in the Uniform Prudent Manage-ment of Institutional Funds Act (“UPMIFA”). UPMIFA stipulates that unless directed otherwise in the gift instrument, donor-restricted assets in an endowment fund are restricted assets until appropriated for expenditure by the institution. Accordingly, the following items are recorded as net assets with donor restrictions:
l The original value of initial gifts donated to the permanent endowment
l The original value of subsequent gifts to the permanent endowment
l For those endowment funds with donor-specified reinvestment provisions, accumulations to the permanent endowment made in accordance with the gift instrument at the time the accumulation is added to the fund
Similar FundsThe Board has designated certain funds to function as endowments and has co-invested as such. Donor purpose-restricted funds were not given to the University with the understanding that the gift amount would be maintained in perpetuity; these funds are classified as net assets with donor restrictions. Even though the Board has elected to treat these funds in the same fashion as an endowment fund, at its option, the Board may elect to change that treatment and spend these funds in accordance with the intentions of the donor, if any, without the constraints of the University endowment spending formula. All other Board-designated funds are classified as net assets without donor restrictions and include quasi-endowments and a liquidity reserve (Note 17).
The breakdown of these classifications are:
Investment PoolThe Board’s interpretation of its fiduciary responsibilities for endowment and similar funds is to preserve intergenerational equity to the extent possible. This principle holds that future beneficiaries should receive at least the same level of economic support that the current generation enjoys. To that end, investment goals are formulated to
earn returns over the long term that equal or exceed the Board-approved distribution rates plus the impacts of inflation. The University’s endowment and similar funds are invested in a broadly diversified portfolio designed to produce long-term rates of return that sustain or increase the real spending contribution from endowed and similar assets and to mitigate downturns in a single sector.
7. ENDOWMENT AND SIMILAR FUNDS
Without Donor
RestrictionsWith Donor Restrictions TotalJune 30, 2021
Endowments $ 1,546,675 $ 1,546,675 Purpose-restricted funds functioning as endowments 353,552 353,552 Board-designated funds $ 104,147 104,147 TOTAL ENDOWMENT AND SIMILAR FUNDS $ 104,147 $ 1,900,227 $ 2,004,374
Without Donor
RestrictionsWith Donor Restrictions TotalJune 30, 2020
Endowments $ 1,207,487 $ 1,207,487Purpose-restricted funds functioning as endowments 283,975 283,975Board-designated funds $ 79,097 79,097TOTAL ENDOWMENT AND SIMILAR FUNDS $ 79,097 $ 1,491,462 $ 1,570,559

22 | NOTES TO THE FINANCIAL STATEMENTS - in thousands of dollars
Unless otherwise directed in the gift instrument, both endowment and similar funds are pooled for efficient investment purposes.
The pool is accounted for on a dollarized method of accounting similar to a money market fund and accounted for on an account basis. The total investment return for the pooled investments, net of external manager fees, approximated 31.83% (2021) and 1.30% (2020).
Spending PolicyThe Board has approved an endowment spending policy for pooled investments based on a rolling ten-year average methodology. This approach takes into consideration the long-term effect of total return, spending, university support and inflation. The objective of this approach is to provide support for operations, preserve intergenerational equity, and insulate programming supported by endowment and similar funds from short-term fluctuations in the investment markets.
Specific appropriation for expenditure of funds under the policy occurs each spring when the Board approves the operating budget for the following year. The fiscal year 2021 and 2020 pooled endowment and similar funds spending allocation approved by the Investment Committee of the Board were $72,300 and $67,100, respectively. The approved spending rate for fiscal year 2021 and 2020 were 4.70% and 4.70% of beginning market value, respectively. The total amount allocated was $71,453 and $66,688, respectively.
While the policy provides guidance for the level of spending permitted (allocation), the actual spending will vary from the spending allocation based on the timing of actual expenditures. Funds are transferred from the investment pool to the University’s operating account after they have been spent in accordance with the endowment and similar funds requirements. The actual movement of cash and investments between the investment pool and operating accounts occurs on a periodic basis as determined by the University and its processes to maintain the proper balance between liquidity and the remaining invested.
For years where actual investment return exceeds actual approved spending, the difference remains in net assets with donor restrictions; years in which the actual endowment and similar funds return is less than distributions under the policy, the shortfall is covered by realized returns from prior years. Both fiscal years 2021 and 2020 pooled endowment and similar funds distribution were funded from a combination of current year investment income and prior year accumulated realized gains.
In addition to the general distribution described above, the Board has authorized a supplemental distribution of previously reinvested income and realized appreciation to support certain development-related activities. This distribution totaled $9,000 in 2021 and $6,000 in 2020.
Changes in endowment and similar funds net assets for fiscal year 2021 and 2020 are as follows:
Without Donor
RestrictionsWith Donor Restrictions Total
ENDOWMENT AND SIMILAR FUNDS NET ASSETS, JUNE 30, 2019 $ 77,264 $ 1,491,047 $ 1,568,311 Investment income 3,634 61,177 64,811Realized and unrealized losses (2,488) (45,294) (47,782)TOTAL INVESTMENT RETURN 1,146 15,883 17,029Contributions 3,965 51,253 55,218Current year expenditures (3,278) (66,721) (69,999)ENDOWMENT AND SIMILAR FUNDS NET ASSETS, JUNE 30, 2020 $ 79,097 $ 1,491,462 $ 1,570,559Investment income 4,218 67,208 71,426 Realized and unrealized gains 19,919 367,290 387,209 TOTAL INVESTMENT RETURN 24,137 434,498 458,635 Contributions 3,235 38,616 41,851 Current year expenditures (2,322) (64,349) (66,671)ENDOWMENT AND SIMILAR FUNDS NET ASSETS, JUNE 30, 2021 $ 104,147 $ 1,900,227 $ 2,004,374

CASE WESTERN RESERVE UNIVERSITY FY21 FINANCIAL REPORT | 23
Occasionally, the fair market value of assets associated with individual donor-restricted endowment funds falls below the value of the original gift amounts. These deficits resulted from unfavorable market fluctuations that occurred after the investment of recently established endowments and additions, and authorized appropriation that was deemed prudent. The aggregate deficiencies in fair
value relative to historical cost for underwater endowments as of June 30 were as follows:
2021 2020Aggregate historical value $ 8,803 $ 159,796Aggregate fair value 7,596 147,092AGGREGATE DEFICIENCY $ (1,207 ) $ (12,704)
Financial instruments carried at fair market value as of June 30, 2021 and 2020 by the ASC 820 valuation hierarchy are as follows:
June 30, 2021
Quoted Prices
in ActiveMarkets(Level 1)
SignificantOther
ObservableInputs
(Level 2)
SignificantUnobservable
Inputs(Level 3)
NetAssetValue Total
INVESTMENTS Equity securities $ 326,537 $ 54 $ 99,881 $ 426,472 Fixed-income securities 120,828 18,086 138,914 Limited partnerships and Other Venture capital 23,211 23,211 Private equity 803,510 803,510 Real estate 44,698 44,698 Absolute return 711,728 711,728 Other $ 43,587 11,175 54,762 Equity real estate 81 81 TOTAL INVESTMENTS $ 447,365 $ 18,140 $ 43,668 $ 1,694,203 $ 2,203,376
FUNDS HELD IN TRUST BY OTHERS $ - $ - $ 349,816 $ - $ 349,816
PENSION PLAN ASSETS Cash and cash equivalents $ 8,068 $ 8,068 Equity securities 133,534 133,534 Fixed-income securities 43,017 $ 5,233 48,250 Limited partnerships and Other Absolute return $ 23,310 23,310 Other 13,145 13,145 Equity real estate 10,245 10,245 TOTAL PENSION PLAN ASSETS (Note 12) $ 184,619 $ 5,233 $ - $ 46,700 $ 236,552
ASSETS AT FAIR VALUE $ 631,984 $ 23,373 $ 393,484 $ 1,740,903 $ 2,789,744
Interest rate swaps payable (Note 15) $ - $ 13,337 $ - $ - $ 13,337
LIABILITIES AT FAIR VALUE $ - $ 13,337 $ - $ - $ 13,337
8. FAIR VALUE MEASUREMENTS

24 | NOTES TO THE FINANCIAL STATEMENTS - in thousands of dollars
June 30, 2020
Quoted Prices
in ActiveMarkets(Level 1)
SignificantOther
ObservableInputs
(Level 2)
SignificantUnobservable
Inputs(Level 3)
NetAssetValue Total
INVESTMENTS Equity securities $ 265,534 $ 54 $ 99,261 $ 364,849 Fixed-income securities 143,668 19,360 163,028 Limited partnerships and Other Venture capital 28,084 28,084 Private equity 604,785 604,785 Real estate 5,974 5,974 Absolute return 551,776 551,776 Other $ 37,729 11,606 49,335 Equity real estate 81 81TOTAL INVESTMENTS $ 409,202 $ 19,414 $ 37,810 $ 1,301,486 $ 1,767,912
FUNDS HELD IN TRUST BY OTHERS $ - $ - $ 280,247 $ - $ 280,247
PENSION PLAN ASSETS Cash and cash equivalents $ 3,410 $ 3,410 Equity securities 95,402 95,402 Fixed-income securities 42,064 $ 3,417 45,481 Limited partnerships and Other Absolute return $ 25,797 25,797 Other 12,091 12,091 Equity real estate 9,600 9,600TOTAL PENSION PLAN ASSETS (Note 12) $ 140,876 $ 3,417 $ - $ 47,488 $ 191,781
ASSETS AT FAIR VALUE $ 550,078 $ 22,831 $ 318,057 $ 1,348,974 $ 2,239,940
Interest rate swaps payable (Note 15) $ - $ 17,334 $ - $ - $ 17,334
LIABILITIES AT FAIR VALUE $ - $ 17,334 $ - $ - $ 17,334
Level 3 Investment InformationInvestments included in Level 3 consist primarily of the University’s funds held in trust by others that are assets held and administered by outside trustees from which the University derives income or residual interest. The
University’s interests are reported at estimated fair value, based on the value of the underlying assets, which approximates the present value of future income from these trusts.

CASE WESTERN RESERVE UNIVERSITY FY21 FINANCIAL REPORT | 25
The net realized and unrealized gains and losses in the table above are included in the University’s statement of activities in one of two financial statement lines: Investment (loss) income or Net appreciation (depreciation).
The pricing inputs and methods described above could produce a fair value calculation that may not be indicative of net realizable value or reflective of future fair values. Furthermore, while the University believes its valuation methods are appropriate and consistent with other market participants, the use of different methodologies or assumptions to determine the fair value of certain financial instruments could result in a different estimate of fair value at the reporting date.
The University is permitted under U.S. GAAP to estimate the fair value of an investment at the measurement date using the reported net asset value (“NAV”) without further adjustment unless the entity expects to sell the investment at a value other than NAV or if the NAV is not calculated in accordance with U.S. GAAP. The University’s investments in equity securities, certain venture capital, certain private
equity, real estate and certain hedge funds in the absolute return portfolio are fair value based on the most current NAV.
The University performs additional procedures including due diligence reviews on its investments in investment companies and other procedures with respect to the capital account or NAV provided to ensure conformity with U.S. GAAP. The University has assessed factors including, but not limited to, managers’ compliance with the Fair Value Measurement standard, price transparency at NAV at the measurement date, and existence of certain redemption restrictions at the measurement date.
The guidance also requires additional disclosures to enable users of the financial statements to understand the nature and risk of the University’s investments.
The table below illustrates the fair value of the University’s investments measured at NAV and the commitments that have been made for future purchases:
A roll forward of the statements of financial position amounts for financial instruments classified by the University within Level 3 of the fair value hierarchy is as follows:
EquityReal Estate Other
Funds Heldby Others Total
June 30, 2019 $ 81 $ 37,161 $ 298,189 $ 335,431Investment income 170 170Unrealized gains (losses) 589 (17,942) (17,353)Settlements (76) (76)Transfers (115) (115)June 30, 2020 $ 81 $ 37,729 $ 280,247 $ 318,057Investment loss (723) (723)Unrealized gains 6,502 69,569 76,071 Settlements (71) (71)Transfers 150 150 June 30, 2021 $ 81 $ 43,587 $ 349,816 $ 393,484
Category Redemption FrequencyRedemption
Notice Period Fair ValueUnfunded
CommitmentsEquity securities (a) monthly, quarterly, annually 30–90 days $ 99,881 Limited partnerships and Other Venture capital (b) 23,211 $ 58,152 Private equity (c) 803,510 134,315 Real estate (d) 44,698 49,278 Absolute return (e) monthly, quarterly, annually 30–90 days 735,038 15,711 Other (f) 24,320 Equity real estate (g) 10,245 TOTAL $ 1,740,903 $ 257,456
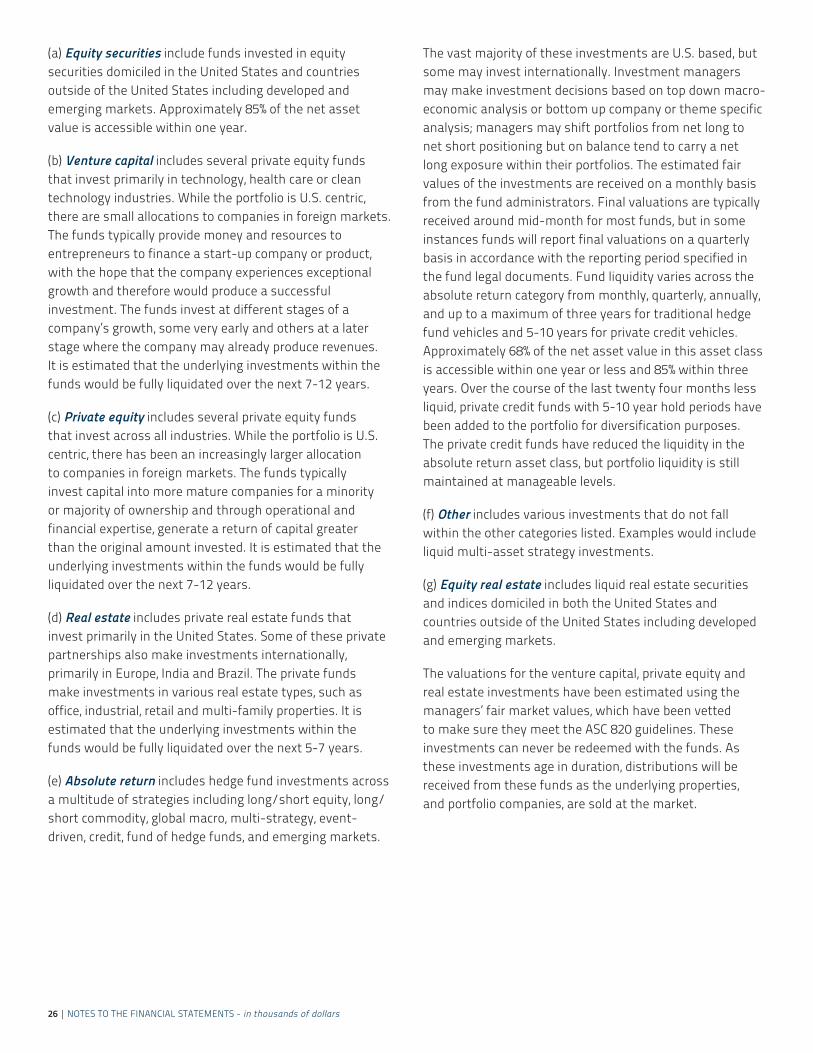
26 | NOTES TO THE FINANCIAL STATEMENTS - in thousands of dollars
(a) Equity securities include funds invested in equity securities domiciled in the United States and countries outside of the United States including developed and emerging markets. Approximately 85% of the net asset value is accessible within one year.
(b) Venture capital includes several private equity funds that invest primarily in technology, health care or clean technology industries. While the portfolio is U.S. centric, there are small allocations to companies in foreign markets. The funds typically provide money and resources to entrepreneurs to finance a start-up company or product, with the hope that the company experiences exceptional growth and therefore would produce a successful investment. The funds invest at different stages of a company’s growth, some very early and others at a later stage where the company may already produce revenues. It is estimated that the underlying investments within the funds would be fully liquidated over the next 7-12 years.
(c) Private equity includes several private equity funds that invest across all industries. While the portfolio is U.S. centric, there has been an increasingly larger allocation to companies in foreign markets. The funds typically invest capital into more mature companies for a minority or majority of ownership and through operational and financial expertise, generate a return of capital greater than the original amount invested. It is estimated that the underlying investments within the funds would be fully liquidated over the next 7-12 years.
(d) Real estate includes private real estate funds that invest primarily in the United States. Some of these private partnerships also make investments internationally, primarily in Europe, India and Brazil. The private funds make investments in various real estate types, such as office, industrial, retail and multi-family properties. It is estimated that the underlying investments within the funds would be fully liquidated over the next 5-7 years.
(e) Absolute return includes hedge fund investments across a multitude of strategies including long/short equity, long/short commodity, global macro, multi-strategy, event-driven, credit, fund of hedge funds, and emerging markets.
The vast majority of these investments are U.S. based, but some may invest internationally. Investment managers may make investment decisions based on top down macro-economic analysis or bottom up company or theme specific analysis; managers may shift portfolios from net long to net short positioning but on balance tend to carry a net long exposure within their portfolios. The estimated fair values of the investments are received on a monthly basis from the fund administrators. Final valuations are typically received around mid-month for most funds, but in some instances funds will report final valuations on a quarterly basis in accordance with the reporting period specified in the fund legal documents. Fund liquidity varies across the absolute return category from monthly, quarterly, annually, and up to a maximum of three years for traditional hedge fund vehicles and 5-10 years for private credit vehicles. Approximately 68% of the net asset value in this asset class is accessible within one year or less and 85% within three years. Over the course of the last twenty four months less liquid, private credit funds with 5-10 year hold periods have been added to the portfolio for diversification purposes. The private credit funds have reduced the liquidity in the absolute return asset class, but portfolio liquidity is still maintained at manageable levels.
(f) Other includes various investments that do not fall within the other categories listed. Examples would include liquid multi-asset strategy investments.
(g) Equity real estate includes liquid real estate securities and indices domiciled in both the United States and countries outside of the United States including developed and emerging markets.
The valuations for the venture capital, private equity and real estate investments have been estimated using the managers’ fair market values, which have been vetted to make sure they meet the ASC 820 guidelines. These investments can never be redeemed with the funds. As these investments age in duration, distributions will be received from these funds as the underlying properties, and portfolio companies, are sold at the market.
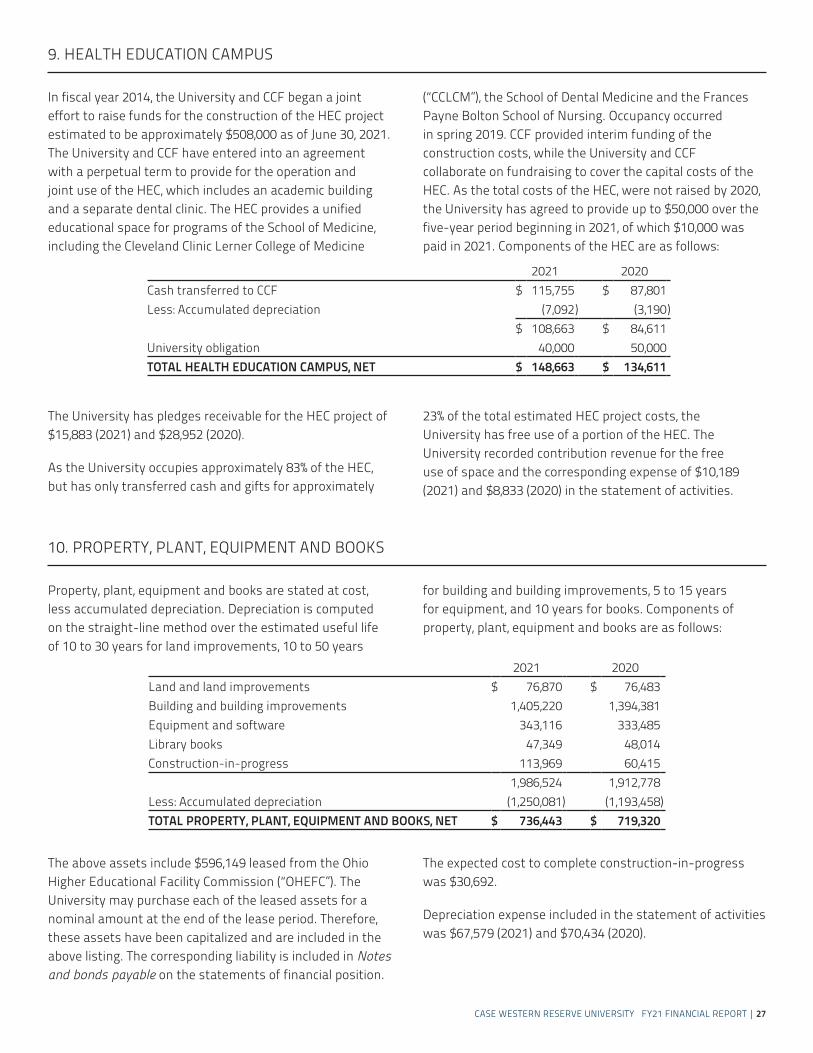
CASE WESTERN RESERVE UNIVERSITY FY21 FINANCIAL REPORT | 27
In fiscal year 2014, the University and CCF began a joint effort to raise funds for the construction of the HEC project estimated to be approximately $508,000 as of June 30, 2021. The University and CCF have entered into an agreement with a perpetual term to provide for the operation and joint use of the HEC, which includes an academic building and a separate dental clinic. The HEC provides a unified educational space for programs of the School of Medicine, including the Cleveland Clinic Lerner College of Medicine
(“CCLCM”), the School of Dental Medicine and the Frances Payne Bolton School of Nursing. Occupancy occurred in spring 2019. CCF provided interim funding of the construction costs, while the University and CCF collaborate on fundraising to cover the capital costs of the HEC. As the total costs of the HEC, were not raised by 2020, the University has agreed to provide up to $50,000 over the five-year period beginning in 2021, of which $10,000 was paid in 2021. Components of the HEC are as follows:
Property, plant, equipment and books are stated at cost, less accumulated depreciation. Depreciation is computed on the straight-line method over the estimated useful life of 10 to 30 years for land improvements, 10 to 50 years
for building and building improvements, 5 to 15 years for equipment, and 10 years for books. Components of property, plant, equipment and books are as follows:
The above assets include $596,149 leased from the Ohio Higher Educational Facility Commission (“OHEFC”). The University may purchase each of the leased assets for a nominal amount at the end of the lease period. Therefore, these assets have been capitalized and are included in the above listing. The corresponding liability is included in Notes and bonds payable on the statements of financial position.
The expected cost to complete construction-in-progress was $30,692.
Depreciation expense included in the statement of activities was $67,579 (2021) and $70,434 (2020).
The University has pledges receivable for the HEC project of $15,883 (2021) and $28,952 (2020).
As the University occupies approximately 83% of the HEC, but has only transferred cash and gifts for approximately
23% of the total estimated HEC project costs, the University has free use of a portion of the HEC. The University recorded contribution revenue for the free use of space and the corresponding expense of $10,189 (2021) and $8,833 (2020) in the statement of activities.
9. HEALTH EDUCATION CAMPUS
10. PROPERTY, PLANT, EQUIPMENT AND BOOKS
2021 2020 Cash transferred to CCF $ 115,755 $ 87,801Less: Accumulated depreciation (7,092) (3,190)
$ 108,663 $ 84,611University obligation 40,000 50,000TOTAL HEALTH EDUCATION CAMPUS, NET $ 148,663 $ 134,611
2021 2020 Land and land improvements $ 76,870 $ 76,483Building and building improvements 1,405,220 1,394,381Equipment and software 343,116 333,485Library books 47,349 48,014Construction-in-progress 113,969 60,415
1,986,524 1,912,778Less: Accumulated depreciation (1,250,081) (1,193,458)TOTAL PROPERTY, PLANT, EQUIPMENT AND BOOKS, NET $ 736,443 $ 719,320
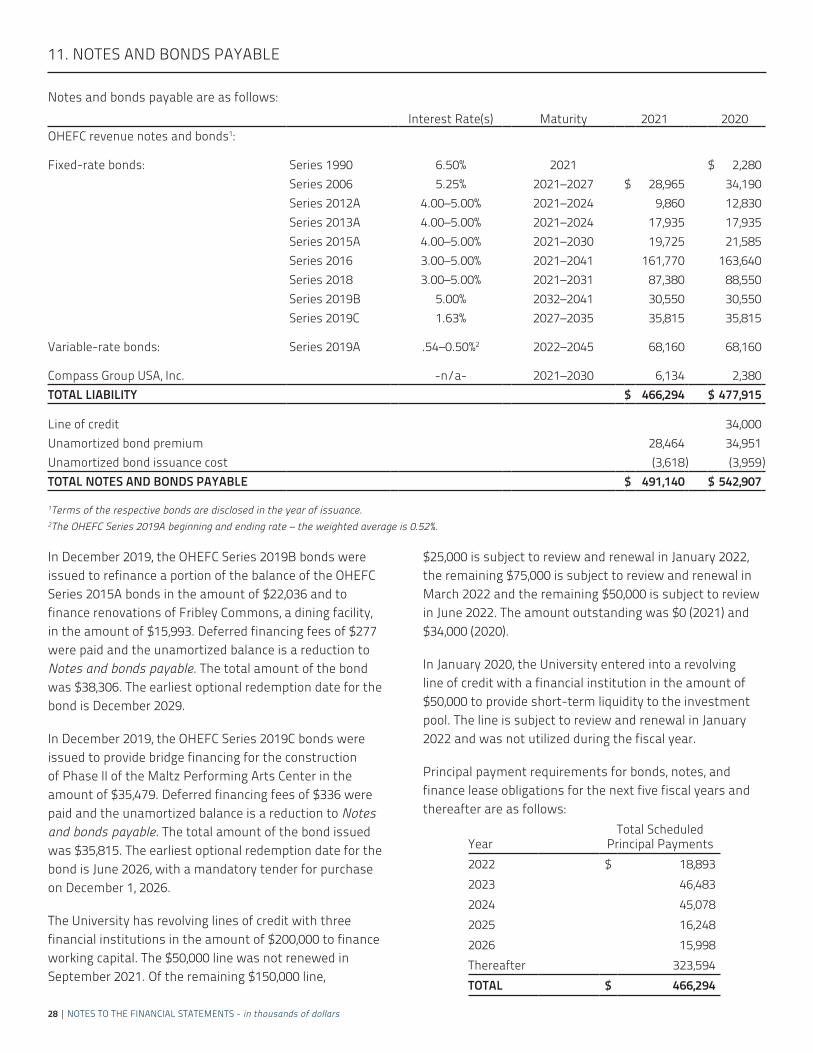
28 | NOTES TO THE FINANCIAL STATEMENTS - in thousands of dollars
Notes and bonds payable are as follows: Interest Rate(s) Maturity 2021 2020
OHEFC revenue notes and bonds1:
Fixed-rate bonds: Series 1990 6.50% 2021 $ 2,280 Series 2006 5.25% 2021–2027 $ 28,965 34,190 Series 2012A 4.00–5.00% 2021–2024 9,860 12,830 Series 2013A 4.00–5.00% 2021–2024 17,935 17,935 Series 2015A 4.00–5.00% 2021–2030 19,725 21,585 Series 2016 3.00–5.00% 2021–2041 161,770 163,640 Series 2018 3.00–5.00% 2021–2031 87,380 88,550 Series 2019B 5.00% 2032–2041 30,550 30,550 Series 2019C 1.63% 2027–2035 35,815 35,815
Variable-rate bonds: Series 2019A .54–0.50%2 2022–2045 68,160 68,160
Compass Group USA, Inc. -n/a- 2021–2030 6,134 2,380TOTAL LIABILITY $ 466,294 $ 477,915
Line of credit 34,000Unamortized bond premium 28,464 34,951Unamortized bond issuance cost (3,618) (3,959)TOTAL NOTES AND BONDS PAYABLE $ 491,140 $ 542,907
1Terms of the respective bonds are disclosed in the year of issuance.2The OHEFC Series 2019A beginning and ending rate – the weighted average is 0.52%.
11. NOTES AND BONDS PAYABLE
In December 2019, the OHEFC Series 2019B bonds were issued to refinance a portion of the balance of the OHEFC Series 2015A bonds in the amount of $22,036 and to finance renovations of Fribley Commons, a dining facility, in the amount of $15,993. Deferred financing fees of $277 were paid and the unamortized balance is a reduction to Notes and bonds payable. The total amount of the bond was $38,306. The earliest optional redemption date for the bond is December 2029.
In December 2019, the OHEFC Series 2019C bonds were issued to provide bridge financing for the construction of Phase II of the Maltz Performing Arts Center in the amount of $35,479. Deferred financing fees of $336 were paid and the unamortized balance is a reduction to Notes and bonds payable. The total amount of the bond issued was $35,815. The earliest optional redemption date for the bond is June 2026, with a mandatory tender for purchase on December 1, 2026.
The University has revolving lines of credit with three financial institutions in the amount of $200,000 to finance working capital. The $50,000 line was not renewed in September 2021. Of the remaining $150,000 line,
$25,000 is subject to review and renewal in January 2022, the remaining $75,000 is subject to review and renewal in March 2022 and the remaining $50,000 is subject to review in June 2022. The amount outstanding was $0 (2021) and $34,000 (2020).
In January 2020, the University entered into a revolving line of credit with a financial institution in the amount of $50,000 to provide short-term liquidity to the investment pool. The line is subject to review and renewal in January 2022 and was not utilized during the fiscal year.
Principal payment requirements for bonds, notes, and finance lease obligations for the next five fiscal years and thereafter are as follows:
YearTotal Scheduled
Principal Payments2022 $ 18,893 2023 46,483 2024 45,078 2025 16,248 2026 15,998 Thereafter 323,594 TOTAL $ 466,294

CASE WESTERN RESERVE UNIVERSITY FY21 FINANCIAL REPORT | 29
The University has both defined benefit and defined contribution pension plans for its employees. In accordance with provisions of the Employee Retirement Income Security Act of 1974, the University has established a trust to hold plan assets for its defined benefit plan. The funded status of the University’s defined benefit plan is as follows:
2021 2020Funded status at June 30 of prior fiscal year $ (130,403) $ (104,192)
Service cost (9,218) (9,130)Interest cost (10,415) (11,254)Expected return on assets 15,620 14,631Actuarial gain (loss) 31,065 (36,137)Employer contributions 16,253 15,679 FUNDED STATUS AT JUNE 30 $ (87,098) $ (130,403)
Accumulated benefit obligation $ 322,419 $ 320,684
Benefit plan costs for the defined benefit plan are as follows:
2021 2020Net periodic benefit cost $ 13,693 $ 12,789Employer contributions 16,253 15,679Benefits paid 12,262 6,695
Estimated benefits expected to be paid under the defined benefit plan for the next five fiscal years are as follows:
2022 $ 8,613 2023 9,130 2024 9,985 2025 10,704 2026 11,223
Amounts expected to be paid between 2027 and 2031 total $67,347. The University’s estimated employer contribution for the defined benefit plan in fiscal 2022 will depend on the results of the July 1, 2021 actuarial valuation and is estimated to be $17,008.
Weighted-average assumptions used to determine the benefit obligation and benefit plan costs are as follows:
2021 2020BENEFIT OBLIGATIONDiscount rate 3.25% 3.20%Rate of compensation increase 2.25% 2.25%Measurement date 6/30/21 6/30/20Census date 7/1/20 7/1/19
NET PERIODIC BENEFIT COSTDiscount rate 3.20% 3.90%Expected return on plan assets 7.50% 7.50%Rate of compensation increase 2.25% 2.25%
The expected long-term rate of return for the defined benefit plan was estimated using market benchmarks for equities and bonds applied to the plan’s target asset allocation. Management estimated the rate by which the plan assets would outperform the market in the future based on historical experience adjusted for changes in asset allocation and expectations compared to past periods.
The investment objective for the defined benefit plan is to maximize total return with tolerance for slightly above average risk, in order to meet the obligations that the University has to its plan beneficiaries. To accomplish this objective, the University has established a broadly-diversified asset allocation strategy that includes equity investments (55%), fixed income (20%), absolute return strategies (combination of fixed income and equity securities) (10%), private credit (6%), real estate (4%), and cash (5%). The weightings of the investments relative to each other in the total portfolio fluctuate as market conditions vary; they are adjusted regularly to remain within acceptable ranges.
12. RETIREMENT PLANS

30 | NOTES TO THE FINANCIAL STATEMENTS - in thousands of dollars
The weighted-average asset allocation for the defined benefit plan is as follows:
2021 2020Equity securities 56% 50%Fixed income securities 25% 25%Real estate 4% 5%Other 15% 20%TOTAL ASSET ALLOCATION 100% 100%
The amounts recognized in the University’s statements of financial position and in net assets without donor restrictions related to the defined benefit plan are as follows:
2021 2020Benefit obligation at June 30 $ 323,650 $ 322,184Fair value of plan assets at June 30 236,552 191,781NET LIABILITY $ (87,098) $ (130,403)
NET ASSETS WITHOUT DONOR RESTRICTIONSAccumulated actuarial losses 98,492 139,237 AMOUNT RECOGNIZED AS REDUCTION OF NET ASSETS WITHOUT DONOR RESTRICTIONS $ 98,492 $ 139,237
The estimated amortization of the net loss expected in fiscal 2022 totals $8,229. Components of the net periodic benefit cost and other changes in plan assets that are recognized in the statement of activities are as follows:
2021 2020Change in actuarial (gain) loss $ (40,745) $ 29,101TOTAL (GAIN) LOSS RECOGNIZED, NET ASSETS WITHOUT DONOR RESTRICTIONS (40,745) 29,101
Service cost 9,218 9,130 Interest cost 10,415 11,254 Expected return on assets (15,620) (14,631)Net loss amortization 9,680 7,036 Net periodic benefit cost 13,693 12,789 TOTAL (GAIN) LOSS RECOGNIZED, STATEMENT OF ACTIVITIES $ (27,052) $ 41,890
Benefit plan costs for the defined contribution plan are $13,764 (2021) and $24,490 (2020).
In its normal operations, the University is subject to various claims and lawsuits. In management’s opinion, the resolution of these contingencies will not have a significant adverse effect on the University’s financial position, operations, or cash flows.
In May 2002, the University entered into an agreement with CCF to form a new medical education and research program, CCLCM. Beginning in 2004, research grants from the National Institutes of Health to support work by CCF-based investigators were awarded to and administered through the University by CCLCM, which operates as an academic unit of the School of Medicine. Expenditures for research conducted under this joint agreement totaled $96,148 (2021) and $100,939 (2020).
In April 2006, the Boards of University Hospitals Health System and the University approved an affiliation
agreement between the School of Medicine and University Hospitals of Cleveland (“UHC”). This agreement created the Case Medical Center, a virtual entity that encompasses certain teaching, research, and clinical activities of the School of Medicine and UHC. In September 2016, the affiliation agreement was renewed with the exception of the Case Medical Center designation. Even though the virtual entity will be dissolved, there will be continued collaboration in education and research.
The University is self-insured for workers compensation and employee and student medical coverage. Property is commercially insured with an aggregate deductible of $700. The University also carries general liability insurance with a deductible of $500 per occurrence. The University believes its reserves for self-insured risks and the deductible portion of insured risks are sufficient.
13. COMMITMENTS AND CONTINGENCIES

CASE WESTERN RESERVE UNIVERSITY FY21 FINANCIAL REPORT | 31
In 1998, the University entered into a thirty-year agreement with the Medical Center Company (a cooperative utility company formed by and serving institutions in the University Circle area) to purchase steam, chilled water, and other utilities for several University buildings. The amounts purchased were $20,818 (2021) and $20,442 (2020). No obligation associated with this agreement is recorded in the accompanying financial statements.
In August 2015, the Medical Center Company approved an energy efficiency grant in the amount of $829, of which
$255 was used. The payback terms related to this project are 36 months beginning March 2016. The obligation related to this project recorded in Deferred income and other liabilities is $0 (2021) and $23 (2020).
In October 2017, the Medical Center Company approved an additional energy efficiency grant in the amount of $1,084, of which $1,084 was used. The payback terms related to this project are 36 months beginning December 2018. The obligation related to this project recorded in Deferred income and other liabilities is $151 (2021) and $512 (2020).
The University uses floating-to-fixed interest rate swap agreements of various durations to manage both its funding cost and the interest rate risk associated with variable rate debt. Under these swap agreements, the University pays a fixed rate and receives from its counterparty a variable rate payment, each calculated by reference to specified notional principal amounts during the agreement period. Operations are charged the variable rate interest on the corresponding bonds; the difference between the fixed and variable interest amounts under the swap agreements is recorded in non-operating revenues and expenses as Investment (loss) income.
The University follows accounting guidance that defines fair value, establishes a framework for measuring fair value, and expands disclosure requirements about fair value measurements, including derivatives. The University’s interest rate swaps are valued by an independent swap
consultant that uses the mid-market levels, as of the close of business, to value the agreements. The valuations provided are derived from proprietary models based upon well-recognized financial principles and reasonable estimates about relevant future market conditions and the University’s credit worthiness. The University’s interest rate swap arrangements have inputs that can generally be corroborated by market data and are classified as Level 2 in the fair value hierarchy. Under four agreements in effect at June 30, 2021, the counterparty pays a variable interest rate equal to a percentage of the one-month LIBOR.
The following table provides detailed information on the interest rate swaps at June 30, 2021, with comparative fair values for June 30, 2021. Information related to the interest rate swap agreements and the liability recognized in the statements of financial position in Deferred income and other liabilities are as follows:
Changes in the fair value of derivative instruments are recorded in non-operating revenues and expenses as Investment (loss) income. The provisions of the swap agreements require that on a weekly basis the University place into an escrow fund collateral sufficient to limit the counter-party’s financial exposure to the University to no
more than $20,000. The University had placed $0 (2021 and 2020) into such a fund.
Interest expense recorded for the swap agreements in the non-operating activities for the year ended June 30 was $2,718 (2021) and $1,986 (2020).
14. RELATED PARTY TRANSACTIONS
15. DERIVATIVES
Notional Amount Interest Rate Commencement Termination Date Basis
2021 2020 Level 2 Fair Market Value
$ 5,445 4.34% Aug. 12, 2004 Oct. 1, 2022 LIBOR $ (217) $ (460) 15,000 4.43% Jun. 5, 2002 Jun. 5, 2022 LIBOR (657) (1,284) 15,000 3.60% Sept. 25, 2002 Sept. 25, 2022 LIBOR (686) (1,194) 35,000 3.81% Aug. 4, 2004 Aug. 1, 2034 LIBOR (11,777) (14,396)
TOTAL INTEREST RATE SWAP AGREEMENT LIABILITY $ (13,337) $ (17,334)

32 | NOTES TO THE FINANCIAL STATEMENTS - in thousands of dollars
Expenses are reported in the statement of activities by functional categories and include allocations of depreciation expense, interest on indebtedness and plant operation and maintenance costs.
Operating expenses by nature and function are summarized as follows for the years ended June 30, 2021 and 2020:
16. NATURAL AND FUNCTIONAL CLASSIFICATION OF EXPENSES
June 30, 2021 InstructionalSponsored
projects LibrariesStudent services
University services Auxiliaries
Total operating expenses
Salaries and wages $ 189,270 $ 144,453 $ 5,601 $ 16,112 $ 51,217 $ 11,271 $ 417,924 Fringe benefits 52,418 34,735 1,656 4,621 15,087 3,223 111,740 Other operating expense 55,679 163,883 3,653 7,017 50,812 26,312 307,356
Allocations Depreciation 14,154 14,536 6,488 1,162 10,924 20,315 67,579 Interest 1,423 3,485 304 146 1,625 9,909 16,892 Plant operations and maintenance 17,457 11,807 2,981 941 7,453 5,703 46,342 TOTAL $ 330,401 $ 372,899 $ 20,683 $ 29,999 $ 137,118 $ 76,733 $ 967,833
June 30, 2020 InstructionalSponsored
projects LibrariesStudent services
University services Auxiliaries
Total operating expenses
Salaries and wages $ 196,338 $ 148,452 $ 6,304 $ 17,111 $ 54,248 $ 12,059 $ 434,512 Fringe benefits 59,532 37,777 1,925 5,302 17,548 3,802 125,886 Other operating expense 67,030 167,628 4,208 10,365 42,539 30,486 322,256
Allocations Depreciation 14,299 15,656 7,106 1,400 7,696 24,277 70,434 Interest 1,607 3,994 360 164 1,817 11,020 18,962 Plant operations and maintenance 19,394 11,770 2,947 933 7,751 6,317 49,112 TOTAL $ 358,200 $ 385,277 $ 22,850 $ 35,275 $ 131,599 $ 87,961 $ 1,021,162

CASE WESTERN RESERVE UNIVERSITY FY21 FINANCIAL REPORT | 33
The University’s net assets as of June 30 were as follows:
2021 2020Without donor restrictions: Board-designated: Quasi-endowments $ 104,147 $ 79,097 Liquidity reserve 126,303 108,763TOTAL BOARD-DESIGNATED 230,450 187,860Unrestricted 112,169 36,836TOTAL NET ASSETS WITHOUT DONOR RESTRICTIONS $ 342,619 $ 224,696
With donor restrictions: Endowments $ 1,546,675 $ 1,207,487 Split-interest agreements 19,129 11,878 Other for purpose or time: Purpose-restricted funds functioning as endowments 353,552 283,975 Pledges receivable 145,384 114,360 Funds held in trust by others 354,022 284,516 Student loan funds 37,275 37,449 Purpose-restricted funds 229,875 185,039
1,120,108 905,339
TOTAL NET ASSETS WITH DONOR RESTRICTIONS $ 2,685,912 $ 2,124,704
The University has performed an evaluation of subsequent events through October 15, 2021, the date on which the financial statements were issued.
17. NET ASSETS
18. SUBSEQUENT EVENTS


![Safe Sharing on Social Networks - Case Western Reserve University · 2019-06-05 · security@case.edu [U]Tech Service Desk UNIVERSITY TECHNOLOGY . help@case.edu . CASE WESTERN R,!::SERVE](https://static.fdocuments.net/doc/165x107/5f11888d6f6a5f127d65603a/safe-sharing-on-social-networks-case-western-reserve-university-2019-06-05-securitycaseedu.jpg)