
Financial Report 2006
256
Financial Report 2006
Transcript of Financial Report 2006

Financial Report 2006


�
Introduction �UBS financial highlights 2Who we are 3More about us 4Contacts 6
Presentation of Financial Information 7UBS reporting structure 8Measurement and analysis of performance 10Changes in accounting and presentation in 2007 12
UBS 13Results 14Risk factors 14
UBS Performance Indicators 17
Financial Businesses 21Results 22Global Wealth Management & Business Banking 30Global Asset Management 44Investment Bank 49Corporate Center 54
Industrial Holdings 57
Balance Sheet and Cash Flows 61Balance sheet and off-balance sheet 62Cash flows 65
Accounting Standards and Policies 67Accounting principles 68Critical accounting policies 70
Financial Statements 75
UBS AG (Parent Bank) 215
Additional Disclosure Required under SEC Regulations 229
Introduction
Our Financial Report comprises the audited financial state-ments of UBS for 2006, 2005 and 2004, prepared according to International Financial Reporting Standards (IFRS) and rec-onciled to the United States Generally Accepted Accounting Principles (US GAAP). It includes the audited financial state-ments of UBS AG (the “Parent Bank”) for 2006 and 2005, prepared according to Swiss banking law. Our Financial Report also discusses the financial and business performance of UBS and its Business Groups, and provides additional disclosure required by Swiss and US regulations.
The Financial Report should be read together with the other publications set out on page 4.
We hope that you will find this Financial Report useful and informative. We believe that UBS is one of the leaders in cor-porate disclosure, and would be keen to hear your views on how we might improve the content, information or presen-tation of all our publications.
Tom HillChief Communication OfficerUBS

2
UBS financial highlights
UBSincomestatement
As of or for the year ended % change from
CHF million, except where indicated 31.12.06 31.12.05 31.12.04 31.12.05
Net profit attributable to UBS shareholders 12,257 14,029 8,016 (13)
Diluted earnings per share (CHF) 1 5.95 6.68 3.70 (11)
Basic earnings per share (CHF) 1 6.20 6.97 3.89 (11)
Return on equity attributable to UBS shareholders (%) 2,3 28.2 39.7 25.8
Performance indicators from continuing operations
Diluted earnings per share (CHF) 1 5.58 4.66 3.49 20
Return on equity attributable to UBS shareholders (%) 3,4 26.5 27.7 24.3
FinancialBusinesses5
Operating income 47,171 39,896 35,971 18
Operating expenses 32,782 27,704 26,149 18
Net profit attributable to UBS shareholders 11,253 13,517 7,656 (17)
Net profit attributable to UBS shareholders from continuing operations 11,249 9,442 7,357 19
Cost / income ratio (%) 6 69.7 70.1 73.2
Net new money (CHF billion) 7 151.7 148.5 89.9
Personnel (full-time equivalents) 78,140 69,569 67,407 12
UBSbalancesheet&capitalmanagement
Total assets 2,396,511 2,058,348 1,737,171 16
Equity attributable to UBS shareholders 3 49,686 44,015 33,632 13
Market capitalization 154,222 131,949 103,649
BIS capital ratios
Tier 1 (%) 8 11.9 12.8 11.8
Total BIS (%) 14.7 14.1 13.6
Risk-weighted assets 341,892 310,409 264,832 10
Invested assets (CHF billion) 2,989 2,652 2,217 13
Long-term ratings
Fitch, London AA+ AA+ AA+
Moody’s, New York Aa2 Aa2 Aa2
Standard & Poor’s, New York AA+ AA+ AA+
1 For the EPS calculation, see note 8 to the financial statements. 2 Net profit attributable to UBS shareholders / average equity attributable to UBS shareholders less proposed distributions. 3 Equity attributable to UBS shareholders has been adjusted for the full-year periods ending 31 December 2006, 2005 and 2004 and is now different from the figure published in the Fourth Quarter 2006 Report. For more information, please refer to note 1 to the financial statements. 4 Net profit attributable to UBS shareholders from continuing operations / average equity attributable to UBS shareholders less proposed distributions. 5 Excludes results from Industrial Holdings. 6 Operating expenses / operating income less credit loss expense or recovery. 7 Excludes interest and dividend income. 8 Includes hybrid Tier 1 capital. Please refer to the BIS capital and ratios table in the capital management section and note 29 to the financial statements.
All share and earnings per share figures throughout this report, unless otherwise indicated, reflect the 2-for-1 share split made on 10 July 2006.
Introduction

3
Who we are
We are one of the world’s leading financial firms, serving a discerning international client base. Our business, global in scale, is focused on growth. As an integrated firm, we create added value for clients by drawing on the combined resourc-es and expertise of all our businesses.
We are present in all major financial centers, with offices in more than 50 countries. We employ around 78,000 peo-ple, with 39% in the Americas, 35% in Switzerland, 16% in the rest of Europe and 10% in the Asia Pacific region.
We are one of the best capitalized financial institutions in the world, with a BIS Tier 1 ratio of 11.9%, invested assets of CHF 3.0 trillion, equity attributable to UBS shareholders of around CHF 50 billion and market capitalization of roughly CHF 154 billion (on 31 December 2006).
What we do
In wealth management, our services are designed for high net worth and affluent individuals around the world, whether investing internationally or in their home country. We pro-vide them with tailored, unbiased advice and investment ser-vices – ranging from asset management to estate planning and from corporate finance to art banking.
As an asset manager, we offer innovative investment management solutions in nearly every asset class to private, institutional and corporate clients, and through financial intermediaries. Our investment capabilities comprise tradi-tional assets (for instance equities, fixed income and asset allocation), alternative and quantitative investments (multi-manager funds, funds of hedge funds, hedge funds) and real estate.
In the investment banking and securities businesses, we provide securities products and research (in the areas of equities, fixed income, rates, foreign exchange, energy and metals) as well as advice and access to the world’s capital markets to corporate, institutional, intermediary and alter-native asset management clients.
Our Swiss retail and corporate banking business provides a complete set of banking and securities services for domes-tic individual and corporate clients.
Ourvision
We are determined to be the best global financial services company. We focus on wealth and asset management, and on investment banking and securities businesses. We continually earn recognition and trust from clients, shareholders, and staff through our ability to anticipate, learn and shape our future. We share a common ambition to succeed by delivering quality in what we do. Our purpose is to help our clients make financial decisions with confidence. We use our resources to develop effective solutions and services for our clients. We foster a distinctive, meritocratic culture of ambition, perfor-mance and learning as this attracts, retains and develops the best talent for our company. By growing both our client and our talent franchises, we add sustainable value for our shareholders.

4
How to order reportsThese reports are available in PDF format on the internet at www.ubs.com/investors in the reporting section. Printed copies can be ordered from the same website by accessing the order / subscribe panel on the right-hand side of the screen. Alternatively, they can be ordered by quoting the SAP number and the language preference where applicable, from UBS AG, Information Center, P.O. Box, CH-8098 Zurich, Switzerland.
Informationtoolsforinvestors
WebsiteOur Analysts and Investors website at www.ubs.com/inves-tors offers a wide range of information about UBS, financial information (including SEC filings), corporate information, share price graphs and data, an event calendar, dividend in-formation and recent presentations given by senior manage-ment to investors at external conferences. Information on the internet is available in English and German, with some sections also in French and Italian.
Messaging serviceOn the Analysts and Investors website, you can register to receive news alerts about UBS via Short Messaging System (SMS) or e-mail. Messages are sent in either English or German and users are able to state their preferences for the topics of the alerts received.
Results presentationsSenior management presents UBS’s results every quarter. These presentations are broadcast live over the internet, and can be downloaded on demand. The most recent result webcasts can be found in the Financials section of our Ana-lysts and Investors website.
This Financial Report contains UBS’s audited financial statements for the year 2006 and related detailed analysis. This Financial Report is available in English and German. (SAP no. 80531). You can find out more about UBS from the sources shown below.
Publications
Annual Review 2006Our Annual Review this year looks at some major global economic and financial trends, and the part we play in them. It also briefly reviews our financial performance in 2006, corporate governance, and approach to corporate responsibi-lity. It is available in English, German, French, Italian, Chinese and Japanese. (SAP no. 80530).
Handbook 2006 / 2007The Handbook contains a detailed description of UBS, its strategy, organization, businesses, employees, corporate governance and responsibility, as well as risk and treasury management. (SAP no. 80532).
Quarterly reportsWe provide detailed quarterly financial reporting and analy-sis, including comment on the progress of our businesses and key strategic initiatives. These quarterly reports are avail-able in English.
Compensation Report 2006The Compensation Report 2006 provides detailed informa-tion on the compensation paid to the members of UBS’s Board of Directors (BoD) and the Group Executive Board (GEB). The report is available in English and German. (SAP no. 82307). The same information can also be read in the Corporate Gov-ernance chapter of the Handbook 2006 / 2007.
The making of UBSOur “The making of UBS” brochure outlines the series of transformational mergers and acquisitions that created today’s UBS. It also includes brief profiles of the firm’s ante-cedent companies and their historical roots. It is available in English and German. (SAP no. 82252).
More about us
Introduction

5
Form 20-F and other submissions to the US Securities and Exchange Commission
We file periodic reports and submit other information about UBS to the US Securities and Exchange Commission (SEC). Principal among these filings is our Annual Report on Form 20-F, filed pursuant to the US Securities Exchange Act of 1934.
Our Form 20-F filing is structured as a “wrap-around” document. Most sections of the filing are satisfied by refer-ring to parts of the Handbook 2006 / 2007 or to parts of this Financial Report 2006. However, there is a small amount of additional information in Form 20-F which is not presented elsewhere, and is particularly targeted at readers in the US. You are encouraged to refer to this additional disclosure.
You may read and copy any document that we file with the SEC on the SEC’s website, www.sec.gov, or at the SEC’s public reference room at 100 F Street, N.E., Room 1580, Washington, DC 20549. Please call the SEC by dialling +1-800-SEC-0330 (in the US) or +1 202 942 8088 (outside the US) for further information on the operation of its public reference room. You may also inspect our SEC reports and other information at the New York Stock Ex-change, Inc., 20 Broad Street, New York, NY 10005. Much of this additional information may also be found on the UBS website at www.ubs.com/investors, and copies of documents filed with the SEC may be obtained from UBS’s Investor Relations team at the address shown on the con-tacts page.
Corporate information
The legal and commercial name of the company is UBS AG. The company was formed on 29 June 1998, when Union Bank of Switzerland (founded 1862) and Swiss Bank Corporation (founded 1872) merged to form UBS.UBS AG is incorporated and domiciled in Switzerland and operates under
Swiss Company Law and Swiss Federal Banking Law as an Aktiengesellschaft, a corporation that has issued shares of common stock to investors.The addresses and telephone numbers of our two registered offices are:Bahnhofstrasse 45, CH-8001 Zurich, Switzerland, phone +41-44-234 11 11;
and Aeschenvorstadt 1, CH-4051 Basel, Switzerland, phone +41-61-288 20 20.
UBS AG shares are listed on the SWX Swiss Exchange (traded through its trading platform virt-x), on the New York Stock Exchange (NYSE) and on the Tokyo Stock Exchange (TSE).

6
Contacts
Introduction
SwitchboardsFor all general queries. Zurich +41-44-234 1111
London +44-20-7568 0000
New York +1-212-821 3000
Hong Kong +852-2971 8888
InvestorRelationsOur Investor Relations team supports institutional, professional and retail investors from our offices in Zurich and New York.
www.ubs.com/investors
Hotline +41-44-234 4100 UBS AG
New York +1-212-882 5734 Investor Relations
Fax (Zurich) +44-44-234 3415 P.O. Box
CH-8098 Zurich, Switzerland
MediaRelationsOur Media Relations team supports global media and journalists from offices in Zurich, London, New York and Hong Kong.
www.ubs.com/media
Zurich +41-44-234 8500 [email protected]
London +44-20-7567 4714 [email protected]
New York +1-212-882 5857 [email protected]
Hong Kong +852-2971 8200 [email protected]
ShareholderServicesUBS Shareholder Services, a unit of the Company Secretary, is responsible for the registration of the Global Registered Shares.
Hotline +41-44-235 6202 UBS AG
Fax +41-44-235 3154 Shareholder Services
P.O. Box
CH-8098 Zurich, Switzerland
US Transfer AgentFor all Global Registered share-related queries in the US, www.melloninvestor.com
Calls from the US +866-541 9689 Mellon Investor Services
Calls outside the US +1-201-680 6578 480 Washington Boulevard
Fax +1-201-680 4675 Jersey City, NJ 07310, USA

Presentation of Financial Information

8
UBS reporting structure
Changes to reporting structure and presentation in 2006 and other adjustments
Dillon Read Capital Management (DRCM)On 5 June 2006, we transferred the principal finance and credit arbitrage and commercial real estate businesses in the fixed income, rates and currencies area of the Investment Bank to Global Asset Management. The business, now called Dillon Read Capital Management (DRCM), manages alter-native investment vehicles on behalf of the Investment Bank. Towards the end of 2006, it launched its first outside inves-tor fund. The Investment Bank continues to record the trad-ing revenues generated by the assets managed by DRCM on its fixed income, rates and currencies revenues line. DRCM personnel and general and administrative expenses are booked in Global Asset Management. DRCM charges the Investment Bank for providing investment management services. Those charges and expenses are reported in the “Services to / from other business units” line. This arrange-ment, also shown in the diagram below, has no impact on UBS’s consolidated financial results.
Prime BrokerageOur prime brokerage activities have, until now, been treated differently in the United Kingdom than they have in the Unit-ed States. Transactions in the US prime brokerage business were booked as a secured loan balance in the Due to / from customer line, whereas in the United Kingdom they were treated as a securities borrowing / lending activity. Even though there is no regulatory guidance on how to present this particular business activity, we have decided to start reporting it consistently in all locations. In the future, we will report all of the transactions in the prime brokerage business as a secured loan in the Due to / from customer line in our balance sheet. This treatment best reflects most of the busi-ness activity in prime brokerage and the market’s under-standing of the business – which is to provide financing facilities to clients from which they can obtain custody and brokerage facilities, exposure to credit and interest rate de-rivatives and exposure to other financial instruments that the Investment Bank can provide.
To reflect the changes, we have restated our consolidated financial statements and the segment reporting of business
Reporting of Dillon Read Capital Management
Investment Bank
Income
Expenses
DRCM revenues on Investment Bank capital
DRCM personnel expenses
DRCM general and administrative expenses
Income
Expenses
DRCM revenues on Investment Bank capital
Charge from Global Asset Management for investment management services
Global Asset Management
Investment Bank
No impact on Global Asset Management
“Services to/from otherbusiness units” cost line
Fro
m 5
Ju
ne
2006
Un
til 4
Ju
ne
2006
Global Asset Management
Income
Expenses
Charge to Investment Bank for investment management services
DRCM personnel expenses
DRCM general and administrative expenses
Revenues from DRCM’s external investor investment management business
Presentation of Financial InformationUBS reporting structure

9
option, we reduce temporary profits and losses caused by the previous and different accounting treatments of the loans and loan commitments and the hedging credit deriva-tives (refer to Notes 1, 9 and 19 in the Financial Statements section). In second half 2006, we additionally applied the fair value option to certain hybrid instruments resulting from structured repurchase and reverse repurchase agreements and to a hedge fund investment which is part of a portfolio managed on a fair value basis.
Changes in presentation in our credit risk disclosure
We have stopped reporting non-performing loans as a key performance indicator for the Investment Bank and Business Banking Switzerland in our 2006 Financial Report. We will also stop disclosing them in quarterly reports from first quar-ter 2007. The disclosure and discussion of the impaired lend-ing portfolio, which is a key component of our internal cred-it risk management and control processes, will continue. As in previous years, non-performing loans, as defined under Swiss Federal Banking Commission (SFBC) regulation, will be reported in the notes to the annual financial statements.
Othernewdisclosures
We have made some minor enhancements to our disclosure in 2006 as part of our continuing effort to improve the trans-parency of our financial reporting and provide the best pos-sible understanding of our business.
In first quarter 2006, we changed the name of our ad-justed regulatory capital performance indicator to “allocated regulatory capital”. The new term more accurately reflects the fact that capital is actually allocated to the Business Groups based on risk-weighted assets, goodwill and excess intangible assets.
In our US wealth management business, the calculation of revenues includes net goodwill funding as acquisition costs are no longer disclosed separately when discussing results.
units affected for all prior periods. The figures and results presented in this report are based on restated numbers. While the restatement affected certain interest income and interest expense components, it did not have an impact on UBS’s income statement, its internal measures of credit ex-posure, or its regulatory capital.
Obligations to employeesUBS has adjusted its opening balance sheet per 1 January 2002 to reflect obligations for untaken holidays of employ-ees, sabbatical leave and service anniversary awards. The retained earnings for each full-year and interim period from 2002 to 2006 are affected by the same adjustment, which reduces the equity attributable to UBS shareholders by CHF 309 million. This has led to a recalculation of return on equity, which is reflected in the current ratio and all past ones published since 2002. Additional information is avail-able in note 1 to the financial statements.
Changes to accounting
At the start of 2006, we implemented accounting changes based on the revised IAS 39 Financial Instruments: Recognition and Measurement; Amendment to the Fair Value Option. All financial instruments designated at fair value through profit or loss on 31 December 2005 continued to qualify for the use of the fair value option under the revised fair value option and we did not apply the fair value option to any previously recognized financial asset or financial liabil-ity for which the fair value option was not adopted under former guidance. Because of this, the adoption of the re-vised standard did not have any effect on our financial state-ments on the transition date, 1 January 2006.
Until the beginning of 2006, we had mainly applied the fair value option to hybrid debt instruments. Starting in second quarter, in line with the revised fair value option, we also applied the fair value option to certain new loans and loan commitments made by the Investment Bank, which are substantially hedged with credit derivatives. By adopting this
UBS Reporting Structure
Financial Businesses
Wealth Management International & Switzerland
Wealth Management US
Business Banking Switzerland
Global Wealth Management & Business Banking
Global Asset Management Investment Bank Corporate Center Private Equity
Industrial Holdings

10
UBS’s performance is reported in accordance with Interna-tional Financial Reporting Standards (IFRS). Our results dis-cussion and analysis comments on the underlying opera-tional performance of our business, focusing on continuing operations. As discontinued activities are no longer relevant to our management of the company, we do not consider them to be indicative of our future potential performance. They are therefore not included in our business planning de-cisions. This helps to better assess our performance against peers and to estimate future growth potential.
In the last three years, two discontinued operations had a significant impact on our consolidated financial statements:– In fourth quarter 2005, we sold our Private Banks & GAM
unit to Julius Baer at a gain of CHF 3,705 million after tax (pre-tax CHF 4,095 million). The unit comprised the Ban-co di Lugano, Ehinger & Armand von Ernst and Ferrier Lullin private banks as well as specialist asset manager GAM. After the sale, we retained a stake of 20.7% in the new Julius Baer.
– On 23 March 2006, UBS sold its 55.6% stake in Motor-Columbus to a consortium representing Atel’s Swiss mi-nority shareholders, EOS Holding and Atel, as well as to French utility Electricité de France (EDF) for a sale price of approximately CHF 1,295 million, leading to an after-tax gain on sale of CHF 387 million.Up to and including 2005, we provided comments and
analysis on an adjusted basis that also excluded the amorti-zation of goodwill and other acquired intangible assets. With the introduction of IFRS 3 Business Combinations at the be-ginning of 2005, we ceased amortizing goodwill, which was by far the largest adjustment made to our results. In this Fi-nancial Report, comments related to 2004 include goodwill amortization.
Seasonalcharacteristics
Our main businesses do not generally show significant seasonal patterns, except for the Investment Bank, where revenues are impacted by the seasonal characteristics of general financial market activity and deal flows in invest-ment banking.
When discussing quarterly performance, we therefore compare the Investment Bank’s financial results of the reported quarter with those achieved in the same period of the previous year. Similarly, when considering the impact of the Investment Bank’s performance on UBS’s financial state-ments, we discuss our overall quarterly performance on a year-on-year basis – comparing the actual quarter with the same quarter in the previous year. Because of the volatile
nature of market movements and the resulting business and trading opportunities, the market risk and balance sheet items in our Investment Bank are compared on a present quarter to previous quarter basis. For all other Business Groups and Units, recent quarterly results are compared with the previous quarter’s, as they are only slightly impacted by seasonal components such as asset withdrawals in fourth quarter and lower client activity levels related to the end-of-year holiday season.
Performance measures
UBS performance indicatorsFor the last seven years, we have consistently assessed our performance against a set of four measures that were de-signed to ensure the delivery of continuously improving returns to our shareholders. In that time, UBS has evolved, and its business and client base have grown. By late 2005 we had arrived at a point where we were steadily exceeding the original targets.
That is why, starting in first quarter 2006, we modified our measures. On average through periods of varying mar-ket conditions, we:– seek to increase the value of UBS by achieving a sustain-
able, after-tax return on equity of a minimum of 20% (we previously targeted a range of 15–20%).
– aim to achieve a clear growth trend in net new money for all our financial businesses, including Global Asset Man-agement and Business Banking Switzerland (this measure was previously only applied to our wealth management units).
– use diluted earnings per share (EPS) instead of basic EPS as a reference for our EPS growth target that remains, as before, annual double-digit percentage growth.
– continue our unchanged objective to manage our Busi-ness Group / Business Unit cost / income ratios at levels that compare well with our competitors. Our cost / income ratio target is limited to our financial businesses.
Business Group Key Performance IndicatorsAt the Business Group or Business Unit level, our perfor-mance is measured by carefully chosen Key Performance Indicators (KPIs). They indicate the Business Group’s or Busi-ness Unit’s success in creating value for shareholders but do not disclose explicit targets. The KPIs show the key drivers of each unit’s core business activities and include financial metrics, such as cost / income ratios and invested assets, along with non-financial metrics, such as the number of client advisors.
Measurement and analysis of performance
Presentation of Financial InformationMeasurement and analysis of performance

��
These Business Group KPIs are used for internal per-formance measurement and planning as well as external reporting. This ensures management accountability for per-formance by senior executives and consistency in external and internal performance measurement.
Client / invested assets reportingSince 2001, we have reported two distinct metrics for client funds:– Client assets are all client assets managed by or deposited
with UBS including custody-only assets and assets held for purely transactional purposes.
– Invested assets is a more restrictive term and includes all client assets managed by or deposited with UBS for investment purposes.Invested assets is our central measure and includes, for
example, discretionary and advisory wealth management portfolios, managed institutional assets, managed fund assets and wealth management securities or brokerage accounts. It excludes all assets held for purely transactional and custody-only purposes as UBS only administers the
Key performance indicators
Business Key performance indicators Definition
Business groups (excluding Corporate Center) and business units within Financial Businesses
Cost / income ratio (%) Total operating expenses / total operating income before adjusted expected credit loss.
Wealth & Asset Management businesses and Business Banking Switzerland
Invested assets (CHF billion) Client assets managed by or deposited with UBS for investment purposes only (for further details please see below).
Net new money (CHF billion) Inflow of invested assets from new clients + inflows from existing clients – outflows from existing clients – outflows due to client defection
Wealth & Asset Management businesses Gross margin on invested assets (bps) Operating income before adjusted expected credit loss / average invested assets.
Wealth Management International & Switzerland
Client advisors Expressed in full-time equivalents.
Wealth Management US Recurring income (CHF million) Interest, asset-based revenues for portfolio management and fund distribution, account-based and advisory fees (as opposed to transactional revenues).
Revenues per advisor (CHF thousand) Income (including net goodwill funding) / average number of financial advisors. Net goodwill funding is defined as goodwill and intangible asset-related funding, net of risk-free return on the corresponding capital allocated.
Business Banking Switzerland Impaired lending portfolio, as a % of total lending portfolio, gross
Impaired lending portfolio, gross / total lending portfolio, gross.
Return on allocated regulatory capital (%)
Business Unit performance before tax / average allocated regulatory capital.
Investment Bank Compensation ratio (%) Personnel expenses / operating income before adjusted expected credit loss.
Impaired lending portfolio, as a % of total lending portfolio, gross
Impaired lending portfolio, gross / total lending portfolio, gross.
Return on allocated regulatory capital (%)
Business Group performance before tax / average allocated regulatory capital.
Average VaR (10-day, 99% confidence, 5 years of historical data)
Value at Risk (VaR) expresses the potential loss on a trading portfolio over a 10-day time horizon, and measured to a 99% level of confidence, based on 5 years of historical data.
Corporate Center IT infrastructure (ITI) cost per Financial Businesses full-time employee
ITI costs / average number of Financial Businesses employees.
assets and does not offer advice on how these assets should be invested. Since 1 January 2004, corporate client assets (other than pension funds) deposited with the Business Banking Switzerland unit have been excluded from invested assets, as we have a minimal advisory role for such clients and as asset flows are driven more by liquidity requirements than investment reasons. The same holds true for the corpo-rate cash management business of the Wealth Management US unit, which we excluded from invested assets towards the end of 2005. Non-bankable assets (for example art col-lections) and deposits from third-party banks for funding or trading purposes are excluded from both measures.
Net new money in a reported period is the net amount of invested assets that are entrusted to the bank by new and existing clients less those withdrawn by existing clients and clients who terminate their relationship with UBS. Net new money is calculated using the direct method, by which in- and outflows to and from invested assets are determined at the client level based on transactions. Interest expenses clients pay on their loans are treated as net new money out-flows. Interest and dividend income from invested assets is

12
not counted as net new money inflow. Market and currency movements as well as fees and commissions are excluded from net new money, as are the effects resulting from any acquisition or divestment of a UBS subsidiary or business. Reclassifications between invested assets and client assets as a result of a change in the service level delivered are treated as net new money flow.
When products are managed in one Business Group and sold in another, they are counted in both the investment management unit and the distribution unit. This results in double counting in UBS’s total invested assets as both units
provide an independent service to their respective client, add value and generate revenues. Most double counting arises where mutual funds are managed by the Global Asset Management business and sold by Global Wealth Management & Business Banking. Both businesses involved count these funds as invested assets. This approach is in line with industry practice and our open architecture strategy and allows us to accurately reflect the performance of each individual business. Overall, CHF 371 billion of in-vested assets were double counted in 2006 (CHF 332 bil-lion in 2005).
Changes in accounting and presentation in 2007
IFRS7Financial Instruments: DisclosuresEffective 2007, we will adopt the disclosure requirements for financial instruments under IFRS 7. The new standard has no impact on recognition, measurement and presentation of financial instruments. Rather, it requires entities to provide disclosures in their financial statements that enable users to evaluate: a) the significance of financial instruments for the entity’s financial position and performance; and b) the nature and extent of the credit, market and liquidity risks arising from financial instruments during the
period and at the reporting date, and how the entity manages those risks. The principles of IFRS 7 complement the principles for recognizing, measur-ing and presenting financial assets and financial liabilities in IAS 32 Financial Instruments: Presentation and IAS 39 Financial Instruments: Recognition and Measurement.UBS has entered into transactions for which fair value is determined using valuation models for which not all inputs are market observable prices or rates. Such financial instruments are initially recognized in UBS’s financial statements at the transaction price,
which is generally the best indicator of fair value, although the value obtained from the relevant valuation model may differ. Where such differences arise, UBS will be required by IFRS 7 to disclose, by class of financial instru-ment: (a) its accounting policy for recognizing that difference in profit or loss to reflect a change in factors (including time) that market partici-pants would consider in setting a price, and (b) the aggregate difference yet to be recognized in profit or loss at the beginning and end of the period and a reconciliation of changes in the balance of this difference.
Presentation of Financial InformationMeasurement and analysis of performance

UBS

14
2006
In 2006, attributable profit was CHF 12,257 million, down 13% from CHF 14,029 million a year earlier, which included a net gain of CHF 3,705 million from the sale of Private Banks & GAM.
Our financial businesses contributed CHF 11,253 million to attributable profit, of which CHF 11,249 million was from continuing operations. This was an improvement of 19% from CHF 9,442 million in 2005. Discontinued operations contributed CHF 4 million net profit to financial businesses. Industrial Holdings added CHF 1,004 million to attributable profit, with CHF 242 million stemming from continuing op-erations.
Dividend
The Board of Directors will propose to the shareholders at the Annual General Meeting (AGM) that we raise the payout to CHF 2.20 a share in order to match our strong 2006 re-sult. Subject to approval, this is a 16% increase from the
total payout last year, which included a par value repayment of CHF 0.30 a share for the gain realized from the sale of Private Banks & GAM. It is also 38% higher than last year’s regular dividend of CHF 1.60 a share (after the 2-for-1 share split). Our dividend for the 2004 financial year (paid in 2005) was CHF 1.50 a share (after the 2-for-1 share split).
If the dividend is approved, the ex-dividend date will be 19 April 2007, with payment on 23 April 2007 for share-holders of record on 18 April 2007.
2005
In 2005, attributable profit was CHF 14,029 million, includ-ing a net gain of CHF 3,705 million from the sale of Private Banks & GAM.
Our financial businesses contributed CHF 13,517 million to attributable profit, of which CHF 9,442 million was from continuing operations. This was an improvement of 28% from CHF 7,357 million in 2004. Discontinued operations contributed CHF 4,075 million. Industrial Holdings added CHF 512 million to attributable profit, with CHF 334 million stemming from continuing operations.
Results
Risk factors
Certain risk factors, including those described below, can impact our ability to carry out our business strategies and can directly affect our earnings. As a consequence, our revenues and operating profit have varied – and are likely to continue to vary – from period to period and revenues and operating profit for any particular period may not be indicative of sustainable results.
Performance in our industry depends on the economic climate – negative developments can adversely affect our business activities The financial services industry prospers in conditions of economic growth, market liquidity and buoyancy and positive investor sentiment. An economic downturn, inflation or a severe financial crisis could negatively
affect our revenues, and we would be unable to immediately adjust all our costs to the resulting deterioration in market or business conditions.A market downturn can be precipi-tated by geopolitical events, changes in monetary or fiscal policy, develop-ment of trade imbalances, natural disasters, pandemics and civil unrest, and war or terrorism. Because financial markets are global and highly interconnected, even local and regional events can have widespread impact well beyond their sources. A crisis could develop, regionally or globally, as a result of disruption in emerging markets, which are particu-larly susceptible to macro-economic and geopolitical developments, or as a result of the failure of a major market participant. As our presence and
business in emerging markets increases, we may become more exposed to these risks.Adverse and extreme developments of this kind could affect our businesses in a number of ways:– a general reduction in business
activity and market volumes affects fees, commissions and margins from market-making and customer-driven transactions and activities. A market downturn may reduce the volume and valuations of assets we manage on behalf of clients, reducing our asset- and perfor-mance-based fees
– reduced market liquidity may limit trading and arbitrage opportunities or impede our ability to manage risks, impacting both trading income and performance-based fees
UBSResults

15
– the assets we hold for our own account as investments or trading positions may fall in value
– impairments and defaults on credit exposures and on trading and investment positions may increase. Losses may be exacerbated by falling collateral values
– if individual countries impose restrictions on cross-border payments or other exchange or capital controls we may suffer losses from enforced default by counterparties, we may be unable to access our own assets, or we may be impeded in – or prevented from – managing our risks.
We might be unable to identify or capture competitive opportunitiesThe financial services industry is characterized by intense competition, continuous innovation, detailed – and sometimes fragmented – regulation and ongoing consolidation. We face competition at the level of local markets and individual business lines, and from global financial institutions comparable to UBS in their size and breadth. Barriers to entry in individual markets are being eroded by new technology. We expect these trends to continue and competition to increase in the future.If we are unable to identify market trends and developments, do not respond to them by devising and implementing adequate business strategies, or are unable to attract or retain the qualified people to carry them out, our competitive strength and market position might be eroded.
Our risk management and control processes may not always protect us from lossRisk-taking is a major part of the business of a financial services firm. We derive a substantial part of our revenue from market making and proprietary trading in cash and
derivatives markets and credit is an integral part of many of our retail and investment bank activities. Interest rates, equity prices, foreign exchange levels and other market fluctuations can adversely affect our earnings. Some losses from risk-taking activities are inevitable but to be successful over time we must balance the risks we take with the returns we generate. We must therefore diligently identify, assess, manage and control our risks, not only in normal market conditions but also as they might develop under more extreme – “stressed” – condi-tions, when concentrations of exposure can lead to severe losses. Our risk management and control culture, tools and processes for market and credit risk, including country risk, are described in the Risk Management chapter of our Handbook 2006 / 2007. We could, however, suffer losses if:– we do not fully identify the risks in
our portfolio, in particular risk concentrations and correlated risks
– our assessment of the risks we have identified, or our response to negative trends proves to be inadequate or incorrect
– markets move in ways that are unexpected in terms of their speed, direction, severity or correlation and our ability to manage risks in the resultant environment is restricted
– third parties to whom we have credit exposure or whose securities we hold for our own account or as collateral are severely affected by unexpected events and we suffer defaults and impairments beyond the level implied by our risk assessment
-– collateral or other security provided by our counterparties proves inadequate to cover their obliga-tions at the time of their default.
We also manage risk on behalf of our clients in our asset and wealth management businesses, and our performance in these activities could
be harmed by the same factors. If clients suffer losses or our perfor-mance does not match that of our competitors, we may suffer reduced fee income and a decline in assets under management or withdrawal of mandates.
Liquidity and funding management are critical to our ongoing performanceA substantial part of our funding requirement is met using short-term unsecured funding sources, including wholesale and retail deposits and the regular issuance of money market paper. The volume of these funding sources is largely stable. If this situation were to change, we could be forced to liquidate assets, in particular from our trading portfolio, to meet maturing liabilities or deposit with-drawals. We might be forced to sell them at discounts that could adversely affect our profitability and our business franchises.A reduction in our credit rating could adversely affect our cost of borrowing, in particular from wholesale unsecured sources, and reduce our access to capital markets. It could also result in our having to make additional cash payments or post collateral, or in the premature termination of contracts with rating trigger clauses.Our approach to liquidity and funding management is described in the Treasury Management chapter of our Handbook 2006 / 2007.
Operational risks may affect our businessAll our businesses are dependent on our ability to process a large number of complex transactions across many and diverse markets in different currencies and subject to many different legal and regulatory regimes. Our operational risk management and control systems and processes, which are described in the Risk Management chapter of our Handbook 2006 / 2007
Risk factors (continued)

16
under “Operational Risk”, are designed to ensure that the risks associated with our activities, includ-ing those arising from process error, failed execution, fraud, systems failure, and failure of security and physical protection, are appropriately con-trolled. If these internal controls fail or prove ineffective in identifying and remedying such risks, we could suffer operational failures that might result in losses.
Legal claims may arise in the conduct of our businessIn the ordinary course of our business we are involved in a variety of claims, disputes and legal proceedings in
Switzerland and other jurisdictions where we are active, including the United States. Such legal proceedings may expose us to substantial mone- tary damages and legal defense costs, injunctive relief and criminal and civil penalties.
Our global presence exposes us to other risksWe operate in more than 50 countries, earn income and hold assets and liabilities in many different currencies and are subject to many different legal, tax and regulatory regimes. Changes in local tax laws or regula-tions may affect our clients’ ability or willingness to do business with us or
the viability of our strategies and business model.Because we prepare our accounts in Swiss francs while a substantial part of our assets, liabilities, revenues and expenses are denominated in other currencies, changes in foreign exchange rates – particularly between the Swiss franc and the US dollar (US dollar income representing the major part of our non-Swiss franc income) – may have an effect on our reported earnings. Our approach to management of this currency risk is explained in the Treasury Manage-ment chapter of our Handbook 2006 / 2007 under “Corporate currency management”.
Risk factors (continued)
UBSResults

UBS Performance Indicators

18
UBS Performance Indicators
For the year ended
31.12.06 31.12.05 31.12.04
RoE (%) 1,2
as reported 28.2 39.7 25.8
from continuing operations 26.5 27.7 24.3
Diluted EPS (CHF) 3
as reported 5.95 6.68 3.70
from continuing operations 5.58 4.66 3.49
Cost / income ratio of the financial businesses (%) 4,5 69.7 70.1 73.2
Net new money, financial businesses (CHF billion) 6 151.7 148.5 89.9
1 Net profit attributable to UBS shareholders / average equity attributable to UBS shareholders less proposed distributions. 2 RoE as reported and from continuing operations reflects the adjusted equity attributable to UBS shareholders. See note 1 to the financial statements for more information. 3 Details of the EPS calculation can be found in note 8 to the financial statements. 4 Excludes results from Industrial Holdings. 5 Operating expenses / operating income less credit loss expense or recovery. 6 Excludes interest and dividend income.
0
8
16
24
32
40
0
8
16
24
32
40
RoE1, 2
in %
2004 2005 2006
40
30
20
10
0As reported From continuing operations
25.8
24.3
39.7
27.7
26.5
28.2
Cost / income ratio of the financial businesses 4, 5
in %
2004 2005 2006
80
70
60
50
40
73.270.1 69.7
0.0
1.6
3.2
4.8
6.4
8.0
0.0
1.6
3.2
4.8
6.4
8.0
Diluted EPS3
CHF
2004 2005 2006
8.00
6.00
4.00
2.00
0.00As reported From continuing operations
3.70
3.49
4.66
5.58
6.68 5.95
0
32
64
96
128
160
Net new money, financial businesses 6
CHF billion
2004 2005 2006
160
120
80
40
0
89.9
148.5 151.7
UBS Performance Indicators

19
2006
For the last seven years, we have consistently focused on four performance indicators designed to ensure we deliver continually improving returns to our shareholders. We modi-fied some of them in 2006 to reflect the evolution of our business (see page 10). All are calculated based on results from continuing operations. The first two, return on equity and diluted earnings per share, are based on the results of the entire firm. The cost / income ratio and net new money indicators are limited to our financial businesses. On this ba-sis, performance indicators 2006 show:– return on equity in full-year 2006 at 26.5%, down from
27.7% in 2005, but well above our target of 20% mini-mum over the cycle. Higher attributable profit was offset by an increase in average equity following strong retained earnings.
– diluted earnings per share in 2006 at CHF 5.58, up 20% from CHF 4.66 a year ago, reflecting increased earnings and a slight reduction in the average number of shares outstanding (–2%) following share repurchases.
– a cost / income ratio for our financial businesses of 69.7% in 2006, down 0.4 percentage points from 70.1% a year ago. This reflects the increase in net trad-ing income and net fee and commission income, partly offset by higher personnel and general and administra-tive expenses. We have added over 8,500 employees during the last year in areas where we see long-term strategic opportunities.
– net new money at a record CHF 151.7 billion, up from CHF 148.0 billion a year earlier (excluding Private Banks & GAM), corresponding to an annual growth rate of 5.7% of the as-set base at the end of 2005. Inflows remained strong world-wide. Wealth Management International & Switzerland
Net new money 1
For the year ended
CHF billion 31.12.06 31.12.05 31.12.04
Wealth Management International & Switzerland 97.6 68.2 42.3
Wealth Management US 15.7 26.9 18.1
Business Banking Switzerland 1.2 3.4 2.6
Global Wealth Management & Business Banking 114.5 98.5 63.0
Institutional 29.8 21.3 23.7
Wholesale Intermediary 7.4 28.2 (4.5)
Global Asset Management 37.2 49.5 19.2
UBS excluding Private Banks & GAM 151.7 148.0 82.2
Corporate Center
Private Banks & GAM 2 0.5 7.7
UBS 151.7 148.5 89.9
1 Excludes interest and dividend income. 2 Private Banks & GAM was sold on 2 December 2005.
Investedassets
As of % change from
CHF billion 31.12.06 31.12.05 31.12.04 31.12.05
Wealth Management International & Switzerland 1,138 982 778 16
Wealth Management US 824 752 606 10
Business Banking Switzerland 161 153 140 5
Global Wealth Management & Business Banking 2,123 1,887 1,524 13
Institutional 519 441 344 18
Wholesale Intermediary 347 324 257 7
Global Asset Management 866 765 601 13
UBS excluding Private Banks & GAM 2,989 2,652 2,125 13
Corporate Center
Private Banks & GAM 1 0 0 92
UBS 2,989 2,652 2,217 13
1 Private Banks & GAM was sold on 2 December 2005.

20
UBS Performance Indicators
recorded inflows of CHF 97.6 billion, driven by consistent-ly high inflows during the year, particularly in Asia Pacific and Europe, both a result of our growth strategy. Our US business contributed CHF 15.7 billion in net new money, CHF 11.2 billion below 2005 levels. Global Asset Manage-ment inflows fell to CHF 37.2 billion, down from the strong CHF 49.5 billion result a year earlier. The Swiss retail busi-ness recorded net new money inflows of CHF 1.2 billion.
2005
From our continuing operations, performance indicators show:– return on equity in full-year 2005 at 27.7%, up from 24.3%
in 2004. The increase was driven by higher attributable profit, but was partially offset by an increase in average equity levels, reflecting the growth in retained earnings.
– diluted earnings per share in 2005 at CHF 4.66, up 34% from CHF 3.49 a year earlier, reflecting increased earnings and a slight reduction in the average number of shares outstanding (–3%) following share repurchases.
– a cost / income ratio for our financial businesses of 70.1% in 2005, down 3.1 percentage points from 73.2% a year earlier. This reflects the increase in net fee and commis-sion income and net income from trading activities and the absence of goodwill amortization, partly offset by higher costs related to personnel – all related to the ex-pansion of business volumes.
– for the whole of 2005, net new money of CHF 148.0 bil-lion, up 80% from CHF 82.2 billion a year earlier. This amounts to an annual growth rate of 7.0% of the asset base at the end of 2004. All the figures above exclude Private Banks & GAM.

Financial Businesses

22
Financial BusinessesResults
Income statement 1
As of or for the year ended % change from
CHF million, except where indicated 31.12.06 31.12.05 31.12.04 31.12.05
Continuing operations
Interest income 87,401 59,286 39,228 47
Interest expense (80,880) (49,758) (27,484) 63
Net interest income 6,521 9,528 11,744 (32)
Credit loss (expense) / recovery 156 375 241 (58)
Net interest income after credit loss expense 6,677 9,903 11,985 (33)
Net fee and commission income 25,881 21,436 18,506 21
Net trading income 13,318 7,996 4,902 67
Other income 1,295 561 578 131
Total operating income 47,171 39,896 35,971 18
Cash components 21,282 18,275 16,310 16
Share-based components 2 2,187 1,628 1,396 34
Total personnel expenses 23,469 19,903 17,706 18
General and administrative expenses 7,929 6,448 6,387 23
Services (to) / from other business units (9) (14) (20) 36
Depreciation of property and equipment 1,245 1,240 1,262 0
Amortization of goodwill 0 0 646
Amortization of intangible assets 148 127 168 17
Total operating expenses 32,782 27,704 26,149 18
Operating profit from continuing operations before tax 14,389 12,192 9,822 18
Tax expense 2,751 2,296 2,104 20
Net profit from continuing operations 11,638 9,896 7,718 18
Discontinued operations
Profit from discontinued operations before tax 4 4,564 396 3 (100)
Tax expense 0 489 97 (100)
Net profit from discontinued operations 4 4,075 299 (100)
Net profit 11,642 13,971 8,017 (17)
Net profit attributable to minority interests 389 454 361 (14)
from continuing operations 389 454 361 (14)
from discontinued operations 0 0 0
Net profit attributable to UBS shareholders 11,253 13,517 7,656 (17)
from continuing operations 11,249 9,442 7,357 19
from discontinued operations 4 4,075 299 (100)
Additional information
Personnel (full-time equivalents) 78,140 69,569 67,407 12
1 Excludes results from Industrial Holdings. 2 Additionally includes social security contributions and expenses related to alternative investment awards. 3 Includes goodwill amortization of CHF 68 million for the year ended 31 December 2004.
Results

23
2006
Results
On a continuing basis, 2006 was another record year for UBS, with all businesses reporting a stronger performance in 2006 compared with a year earlier. Attributable net profit in 2006 was CHF 11,253 million. Discontinued operations con-tributed CHF 4 million, compared with CHF 4,075 million in 2005, when we sold Private Banks & GAM. Net profit from continuing operations was CHF 11,249 million, up 19% from CHF 9,442 million in 2005. It was at the highest level ever, fueled by a 19% increase in income, which rose to CHF 47,015 million. Asset-based revenues showed particular strength, reflecting rising market levels as well as strong in-flows into our wealth and asset management businesses. Brokerage fees were up, reflecting brisk client activity. Cor-porate finance and underwriting fees rose, not just because of buoyant capital market conditions, but also as a result of our efforts to grow our market share in key sectors, such as large cap deals, emerging markets, technology and as a partner of financial sponsors. Overall, net fee and commis-sion income now contributes 55% to total operating income in 2006. Income from trading activities reached a record high as well, mainly driven by higher gains from equity de-rivatives, prime brokerage and equity proprietary trading. Fixed income activities saw stronger results driven by positive market conditions and improved performances in deriva-tives, mortgage-backed securities and commodities. Reve-nues from interest margin products increased to the highest level ever, reflecting the success and growth of lending ac-tivities to wealthy private clients worldwide. They also re-flected an increase in spreads for US dollar, euro and Swiss franc deposits and higher Swiss mortgage volumes. The wealth management business in the US saw the level of de-posits rise and benefited from higher spreads. In 2006, we continued to record credit loss recoveries, although they were lower than a year earlier.Expenses continued to increase in the context of our strate-gic expansion. In 2006, they rose 18% or CHF 5,078 million from 2005. Personnel expenses were up 18%, reflecting the 12% increase in personnel numbers across our businesses. Performance-related payments rose with revenues. For 2006, 53% of personnel expenses took the form of bonus or other variable compensation, up from 50% a year earlier. Average variable compensation per head in 2006 was 16% higher than in 2005.General and administrative expenses were up 23% from a year earlier. Provision expenses rose, mainly as a result of the settlement agreement with Sumitomo Corporation and the sublease of unused office space in New Jersey. Although we needed less office space than expected in New Jersey, we expanded our presence in other regions, leading to overall higher occupancy costs. Activity levels and business volumes
increased worldwide, resulting in higher spending for IT out-sourcing, communication and travel. Investment in growth initiatives resulted in higher costs for IT and strategic proj-ects, in particular at the Investment Bank.
The rise in costs was outpaced by the improvement in revenues, driving our cost / income ratio down to 69.7% – the lowest level ever recorded.
Operating incomeTotal operating income was CHF 47,171 million in 2006, up 18% from CHF 39,896 million in 2005. This was the highest level ever.
Net interest income was CHF 6,521 million in 2006, down from CHF 9,528 million a year earlier. Net trading income was CHF 13,318 million, up from CHF 7,996 million in 2005.
As well as income from interest margin-based activities (loans and deposits), net interest income includes income earned as a result of trading activities (for example, coupon and dividend income). This component is volatile from period to period, depending on the composition of the trading portfolio. In order to provide a better explanation of the movements in net interest income and net trading income, we analyze the total according to the business activities that give rise to the income, rather than by the type of income generated.
Net income from trading activities increased by 15% or CHF 1,700 million from CHF 11,419 million in 2005 to CHF 13,119 million in 2006. At CHF 4,759 million, equities trading income in 2006 was up 21% or CHF 831 million from CHF 3,928 million in 2005. Last year saw a large increase in derivatives trading, mainly in Asia Pacific and in the US, as we experienced growing market demand in these regions. Our prime brokerage services continued to grow around the globe as we were able to further expand our client base. Ad-ditionally, our proprietary business recorded higher results. These gains were partially offset by lower revenues in our cash equity business, partly due to increased client facilita-tion requirements by clients in the US and Europe. Fixed in-come trading revenues, at CHF 6,204 million in 2006, were up 8% or CHF 463 million from CHF 5,741 million in 2005. Our rates business recorded significant increases with busi-ness expansion in energy trading and in mortgage backed securities driven by higher client activity and favorable mar-ket conditions. This was partially offset by lower derivatives income due to declining customer flows. The metals busi-ness was positively affected by active markets, with the pre-cious metals business benefiting from rising gold prices. Rev-enues from our credit fixed income business were up slightly compared with last year. We recorded a loss of CHF 245 mil-lion relating to Credit Default Swaps (CDSs) hedging existing credit exposure in the loan book, against a gain of CHF 103 million a year earlier. At CHF 1,745 million, revenues from our foreign exchange business were up in 2006 compared

24
with CHF 1,458 million recorded a year earlier. Foreign ex-change trading revenues rose due to higher volumes.
Net income from interest margin products was CHF 5,829 million in 2006, up 9% from CHF 5,355 million in 2005, reflecting the growth in collateralized lending to wealthy clients worldwide. It also reflected an increase in spreads for US dollar, euro and Swiss franc deposits and higher volumes of mortgages to Swiss clients. The wealth management business in the US achieved higher levels of deposits, and benefited from higher spreads on them. This increase was partially offset by lower income from our shrink-ing Swiss recovery portfolio, which dropped by CHF 0.7 bil-lion compared to year-end 2005.
At CHF 891 million, net income from treasury and other activities in 2006 was CHF 141 million or 19% higher than CHF 750 million in 2005. Interest income increased due to a higher consolidated capital base, partially offset by lower interest rate spreads. Compared with last year, income benefited from mark-to-market gains on USD foreign ex-change options used to hedge the currency exposure arising from future earnings. The US dollar fell against the Swiss franc in 2006 while it increased in 2005. During 2005 trea-sury revenues were negatively affected by the accounting treatment of interest rate swaps, as these hedges were not fully effective.
In 2006, we experienced a net credit loss recovery of CHF 156 million, compared to a net credit loss recovery of CHF 375 million in 2005. This result reflects the favorable credit market environment that has prevailed over a pro-longed period. World economic growth continued to be ro-bust, despite a moderate slowdown in the US. Credit spreads remained very tight in almost all major developed and emerg-ing capital markets, as healthy expansion of cash flows al-lowed the corporate sector to reduce leverage and build liquidity. The ongoing positive macro-economic environment in key emerging markets allowed the release of CHF 48 mil-lion of collective loan loss provisions for country risk.
Financial BusinessesResults
Net interest and trading income
For the year ended % change from
CHF million 31.12.06 31.12.05 31.12.04 31.12.05
Net interest income 6,521 9,528 11,744 (32)
Net trading income 13,318 7,996 4,902 67
Total net interest and trading income 19,839 17,524 16,646 13
Breakdown by business activity
Equities 4,759 3,928 3,098 21
Fixed income 6,204 5,741 6,264 8
Foreign exchange 1,745 1,458 1,467 20
Other 411 292 203 41
Net income from trading activities 13,119 11,419 11,032 15
Net income from interest margin products 5,829 5,355 5,070 9
Net income from treasury and other activities 891 750 544 19
Total net interest and trading income 19,839 17,524 16,646 13
Net credit loss recovery at Global Wealth Management & Business Banking amounted to CHF 109 million in 2006 compared with a net credit loss recovery of CHF 223 million in 2005. The benign credit environment in Switzerland, where the corporate bankruptcy rate continued to fall in 2006, coupled with the measures taken in recent years to improve the quality of our credit portfolio has again resulted in a low level of new defaults. The management of our im-paired portfolio, which continues to shrink, has also contrib-uted to this result.
The Investment Bank realized a net credit loss recovery of CHF 47 million in 2006, compared with a net credit loss re-covery of CHF 152 million in 2005. This continued strong performance was the result of further recoveries of previ-ously established allowances and provisions from the work-out of the impaired portfolio, and no new defaults in 2006.
>> For further details on our risk management approach, how we
measure credit risk and the development of our credit risk
exposures, please see the “Risk Management” chapter of our
Handbook 2006 / 2007.
In 2006, net fee and commission income was CHF 25,881 million, up 21% from CHF 21,436 million a year ear-lier. The increase was driven by a strong contribution from recurring asset-based fees, higher investment fund fees and net brokerage fees, rising underwriting fees as well as cor-porate finance fees. Underwriting fees, at their highest lev-el ever, were CHF 3,538 million in 2006, up 24% from CHF 2,857 million in 2005. Equity underwriting fees, at CHF 1,834 million, increased by CHF 493 million or 37% in all regions, especially in Asia. This was partially due to our role in the initial public offering of the Bank of China during second quarter 2006, where we acted as joint coordinator and book-runner. Fixed income underwriting fees, at CHF 1,704 million, were up 12% or CHF 188 million, which reflects the strong market conditions and our enhanced competitive position in the leveraged finance business. At CHF 1,852 million, corpo-

25
rate finance fees in 2006 were up 27% from CHF 1,460 mil-lion a year earlier. Advisory gross revenues increased during 2006, as clients took advantage of strategic opportunities in the brisk merger and acquisition environment and our grow-ing franchise in this area. Net brokerage fees were CHF 6,149 million in 2006, up 21% or CHF 1,062 million from CHF 5,087 million in 2005, reflecting the improved markets and the re-sulting higher confidence of institutional and individual cli-ents – especially in the first half and at the end of 2006. Ad-ditionally, higher income from exchange-traded derivatives was driven by the acquisition of ABN AMRO’s global futures and options business. Investment fund fees, at their highest level ever, were CHF 5,858 million in 2006, up 23% from CHF 4,750 million in 2005, mainly reflecting higher asset-based fees for our wealth and asset management businesses, driven by strong client money inflows and favorable market conditions. Fiduciary fees were slightly higher in 2006, increas-ing from CHF 212 million in 2005 to CHF 252 million, reflect-ing an increase in the underlying asset base. At CHF 1,266 million, custodian fees in 2006 were up 8% from CHF 1,176 million in 2005. This increase was due to an enlarged asset base. Portfolio and other management and advisory fees in-creased by 25% to CHF 6,622 million in 2006 from CHF 5,310
million in 2005. The increase is again the result of rising in-vested asset levels driven by market valuations and strong net new money inflows and to a lesser extent due to higher per-formance fees. Insurance-related and other fees, at CHF 449 million in 2006, increased by 21% from a year earlier, due to higher commissions from insurance related products. Credit-related fees and commissions decreased by 12% to CHF 269 million in 2006 from CHF 306 million in 2005, reflecting de-clining business volumes and lower income from loans.
Commission income from other services increased by 4% from CHF 1,027 million in 2005 to CHF 1,064 million in 2006, mainly driven by equity derivative products and higher fees for credit cards.
Other income increased by 131% to CHF 1,295 million in 2006 from CHF 561 million in 2005. This was driven by gains on our New York Stock Exchange membership seats, which were exchanged into shares when it went public in March 2006. In addition we sold our stakes in the London Stock Exchange, Babcock & Brown and EBS group.
Operating expensesTotal operating expenses increased by 18% to CHF 32,782 million in 2006 from CHF 27,704 million in 2005.
Credit loss (expense) / recovery
For the year ended % change from
CHF million 31.12.06 31.12.05 31.12.04 31.12.05
Global Wealth Management & Business Banking 109 223 94 (51)
Investment Bank 47 152 147 (69)
UBS 156 375 241 (58)
Net fee and commission income
For the year ended % change from
CHF million 31.12.06 31.12.05 31.12.04 31.12.05
Equity underwriting fees 1,834 1,341 1,417 37
Debt underwriting fees 1,704 1,516 1,114 12
Total underwriting fees 3,538 2,857 2,531 24
Corporate finance fees 1,852 1,460 1,078 27
Brokerage fees 8,053 6,718 5,794 20
Investment fund fees 5,858 4,750 3,948 23
Fiduciary fees 252 212 197 19
Custodian fees 1,266 1,176 1,143 8
Portfolio and other management and advisory fees 6,622 5,310 4,488 25
Insurance-related and other fees 449 372 343 21
Total securities trading and investment activity fees 27,890 22,855 19,522 22
Credit-related fees and commissions 269 306 264 (12)
Commission income from other services 1,064 1,027 977 4
Total fee and commission income 29,223 24,188 20,763 21
Brokerage fees paid 1,904 1,631 1,387 17
Other 1,438 1,121 870 28
Total fee and commission expense 3,342 2,752 2,257 21
Net fee and commission income 25,881 21,436 18,506 21

26
Personnel expenses increased CHF 3,566 million or 18% to CHF 23,469 million in 2006 from CHF 19,903 million in 2005. The rise was driven by higher performance-related compensation reflecting the better performance in all our businesses. Personnel expenses are managed on a full-year basis with final fixing of annual performance-related pay-ments in fourth quarter. Salary expenses rose due to the 12% increase in personnel over the year, exemplifying the continuous expansion of our business as well as annual pay rises. Share-based components were up 34% or CHF 559 million to CHF 2,187 million from CHF 1,628 million, mainly reflecting more share awards granted in 2006 and the higher fair value of options, driven by the rise in the share price. Contractors’ expenses, at CHF 822 million, were CHF 1 million below 2005’s. Insurance and social security contributions rose by 9% to CHF 1,374 million in 2006 com-pared with CHF 1,256 million in 2005, reflecting higher salary and bonus payments. Contributions to retirement benefit plans rose 13% or CHF 90 million to CHF 802 million in 2006 as a result of both higher salaries paid and the increased staff levels. At CHF 1,564 million in 2006, other personnel expenses increased CHF 174 million from 2005, mainly driven by increased headcount.
At CHF 7,929 million in 2006, general and administrative expenses increased CHF 1,481 million from CHF 6,448 mil-lion a year ago. The increase was driven by a number of pro-visions, mainly for the Sumitomo settlement and the long term lease on an office building in New Jersey. Professional fees rose for projects that support our growth strategy. IT and other outsourcing costs, marketing and public relations as well as expenses for market data services were driven up by increased business volume. Higher staff levels resulted in increased costs for occupancy and for travel.
Depreciation was CHF 1,245 million in 2006, almost un-changed from CHF 1,240 million in 2005. Higher deprecia-tion on real estate was partially offset by falling IT-related charges.
There was no goodwill amortization in either 2006 or 2005.
At CHF 148 million, amortization of intangible assets was up 17% from CHF 127 million a year earlier, related to acqui-sitions made during 2006.
Indicative tax rates for financial businesses
For the year ended
in % 31.12.06 31.12.05 31.12.04 1
Global Wealth Management & Business Banking 20 19 18
Wealth Management International & Switzerland 19 18 18
Wealth Management US 42 40 37
Business Banking Switzerland 20 17 19
Global Asset Management 24 24 21
Investment Bank 31 29 30
1 The tax rates for 2004 are calculated based on pre-goodwill profits.
Tax
Tax expense for 2006 was CHF 2,751 million, resulting in an effective tax rate of 19.1%, compared with the full-year 2005 tax rate of 18.8%. The tax rate for 2006 as a whole, and particularly in fourth quarter, was positively influenced by the release of deferred tax valuation allowances, mainly reflecting improved forecast earnings in certain group com-panies and branches. We believe that a tax rate of about 22% is a reasonable initial estimate for 2007.
Business Group tax ratesIndicative Business Group and Business Unit tax rates are cal-culated on an annual basis based on the results and statu-tory tax rates of the financial year. These rates are approxi-mate calculations, based upon the application to the year’s adjusted earnings of statutory tax rates for the locations in which the Business Groups operated. These tax rates, there-fore, give guidance on the tax cost of each Business Group doing business during 2006 on a stand-alone basis, without the benefit of tax losses brought forward from earlier years.
The indicative tax rates for 2004 are presented pre-good-will. They give an indication of what the tax rate would have been if goodwill had not been charged for accounting pur-poses. It is the sum of the tax expense payable on net profit before tax and goodwill in each location, calculated on the above basis, divided by the total net profit before tax and goodwill. Tax rates post-goodwill are higher than the pre-goodwill rates, because in some jurisdictions there are limita-tions on the tax deductibility of amortization costs.
Please note that these tax rates are not necessarily indica-tive of future tax rates for the businesses or UBS as a whole.
Fair value disclosure of shares and options
The fair value of shares granted in 2006 rose to CHF 1,858 million, up CHF 477 million or 35% from CHF 1,381 million a year earlier. The increase compared with 2005 is primarily driven by higher performance-based compensation and a rise in the proportion of bonuses being delivered in restricted shares.
Financial BusinessesResults

27
The fair value of options granted as of 31 December 2006 was CHF 564 million, up CHF 202 million or 56% from CHF 362 million in 2005. The increase reflects a higher fair value per option, primarily due to a higher UBS share price.
Most share-based compensation is granted in the first quarter of the year, with any further grants mainly under the Equity Plus program, a continuing employee participation program under which voluntary investments in UBS shares each quarter are matched with option awards.
These amounts, net of forfeited awards, will be recog-nized as compensation expense over the service period, which is generally equal to the vesting period. Most UBS share and option awards vest incrementally over a three-year period.
Outlook
Our group combines global scale and focus on growth in a unique way. Our businesses occupy strong market positions in those segments of the financial industry that are expected to grow significantly faster than the economy as a whole over the long term.
When we wrote to you on 13 February, we said that in the short term, as the economic cycle matures, investors might become more sensitive to any disappointing political or economic developments, so our top-class risk control re-mains paramount. Recent market developments appear to confirm this hightened level of sensitivity. However, for UBS, 2007 has started on a positive note, with a strong deal pipe-line and continued investor confidence and activity. With a global presence that is balanced across the Americas, Europe and Asia Pacific, the building blocks of our growth strategy are firmly in place. Last year we made a highly concentrated number of acquisitions while investing heavily in organic growth. In 2007, our focus will be on integrating our new areas of activity and we expect to start seeing the benefits from them materializing for our clients and shareholders.
2005
Results
Attributable profit in 2005 was CHF 13,517 million, of which discontinued operations contributed CHF 4,075 million, re-flecting the impact of the sale of Private Banks & GAM. Net profit from continuing operations was CHF 9,442 million, up 28% from CHF 7,357 million in 2004. Higher revenues in practically all businesses drove the increase, clearly outpacing growth in costs. Asset-based revenues showed particular strength, reflecting rising market levels as well as strong inflows into the wealth and asset management businesses. We also saw a strong increase in brokerage, corporate finance and underwriting fees. Income from trading activi-ties was fueled by improved market opportunities, particu-larly in second half 2005. Revenues from interest margin products increased, reflecting the success and growth of lending activities to wealthy private clients worldwide. We also reported record credit loss recoveries. Personnel expen-ses were up 12% from a year earlier; performance-related payments rose with revenues and there was a general increase in staff numbers. For 2005, 50% of personnel expenses took the form of bonus or other variable compen-sation, up from 49% a year earlier. General and administrative expenses were up just 1% in 2005 from a year earlier. Because of the strength of revenue growth and due to the cessation of goodwill amortization in 2005, our cost / income ratio was 70.1% in 2005.
Operating incomeTotal operating income was CHF 39,896 million in 2005, up 11% from CHF 35,971 million in 2004.
Net interest income was CHF 9,528 million in 2005, down from CHF 11,744 million in the same period a year earlier. Net trading income was CHF 7,996 million, up from CHF 4,902 million in 2004.
Business Group performance from continuing operations before tax
For the year ended % change from
CHF million 31.12.06 31.12.05 31.12.04 31.12.05
Wealth Management International & Switzerland 5,203 4,161 3,396 25
Wealth Management US 582 312 29 87
Business Banking Switzerland 2,356 2,189 2,013 8
Global Wealth Management & Business Banking 8,141 6,662 5,438 22
Global Asset Management 1,392 1,057 552 32
Investment Bank 5,943 5,181 4,610 15
Corporate Center (1,087) (708) (778) (54)
Financial Businesses 14,389 12,192 9,822 18

28
Financial BusinessesResults
Net income from trading activities increased by 4% or CHF 387 million from CHF 11,032 million in 2004 to CHF 11,419 million in 2005. At CHF 3,928 million, equities trad-ing income in 2005 was up 27% or CHF 830 million from CHF 3,098 million in 2004. These gains were partially offset by lower revenues in our equity cash business. Fixed income trading revenues, at CHF 5,741 million in 2005, were down 8% or CHF 523 million from CHF 6,264 million in 2004. The drop was driven by declines in credit fixed income and fixed income, partially offset by increased revenues in our rates, principal finance and commercial real estate business. Credit fixed income saw large revenue decreases in structured cred-it. Revenues in our rates business were up, driven mainly by structured LIBOR derivatives, European interest rates and US energy trading. We recorded revenues of CHF 103 million relating to Credit Default Swaps (CDSs) hedging existing credit exposure in the loan book, against losses of CHF 62 million a year earlier. At CHF 1,458 million, revenues from our foreign exchange business were stable in 2005 com-pared with CHF 1,467 million recorded a year earlier. While derivatives trading was negatively impacted by historically low volatility levels, foreign exchange trading revenues rose due to higher volumes.
Net income from interest margin products increased by 6% to CHF 5,355 million in 2005 from CHF 5,070 million in 2004. The increase was driven by the growth in lending to wealthy US clients through our US bank, UBS Bank USA. Our domestic Swiss mortgage business and wealth management collateralized lending business also grew during the year. In addition, revenues rose due to a rise in interest rates for client liabilities. They also rose because of the appreciation of the US dollar against the Swiss franc, which helped revenues from US dollar cash accounts. This increase was partially offset by lower income from our shrinking Swiss recovery portfolio, which dropped by CHF 1.1 billion compared with year-end 2004.
At CHF 750 million, net income from treasury and other activities in 2005 was CHF 206 million or 38% higher than CHF 544 million in 2004. The increase reflects the benefits of the diversification of our capital base into currencies other than the Swiss franc in a way that matches the currency mix of our risk-weighted assets. The higher equity base had a positive impact on treasury income as well, as did a positive timing effect related to cash flow hedging.
In 2005, we experienced a net credit loss recovery of CHF 375 million, compared with a net credit loss recovery of CHF 241 million in 2004. Releases in country allowances and pro-visions of CHF 118 million reflected the generally positive macro-economic environment in key emerging markets.
The net credit loss recovery at Global Wealth Manage-ment & Business Banking was CHF 223 million in 2005 com-pared with a net credit loss recovery of CHF 94 million in 2004. The benign credit environment in Switzerland, where the corporate bankruptcy rate receded in 2005, coupled
with the measures taken in the years before to improve the quality of our credit portfolio, resulted in a continued low level of new defaults. The success we had in managing our impaired portfolio also resulted in a higher than anticipated level of recoveries.
The Investment Bank experienced a net credit loss recov-ery of CHF 152 million in 2005, compared with a net credit loss recovery of CHF 147 million in 2004. This continued strong performance was the result of minimal exposure to new defaults and strong recoveries of previously established allowances and provisions as we actively sold impaired assets at better than anticipated terms.
In 2005, net fee and commission income was CHF 21,436 million, up 16% from CHF 18,506 million a year ear-lier. Underwriting fees were CHF 2,857 million in 2005, up 13% from CHF 2,531 million in 2004. Fixed income under-writing fees increased due to significantly improved market conditions and our enhanced competitive position, but were slightly offset by lower equity underwriting fees. Fixed in-come underwriting was CHF 1,516 million in 2005, up 36% from CHF 1,114 million in 2004. Equity underwriting slightly decreased by 5% to CHF 1,341 million in the same period. At CHF 1,460 million, corporate finance fees in 2005 were up 35% from CHF 1,078 million a year earlier. Advisory gross revenues increased notably during 2005, signalling the con-tinued strength of merger and acquisition markets, and our growing franchise in this area. Net brokerage fees were CHF 5,087 million in 2005, up 15% or CHF 680 million from CHF 4,407 million in 2004, reflecting improved markets and the resulting higher confidence of institutional and individu-al clients – especially in the second half of 2005. Investment fund fees were CHF 4,750 million in 2005, up 20% from CHF 3,948 million in 2004, mainly reflecting higher asset-based fees for our wealth and asset management business-es, driven by strong client money inflows and strong market conditions. Fiduciary fees were slightly higher in 2005, in-creasing from CHF 197 million in 2004 to CHF 212 million, reflecting an increased number of mandates. At CHF 1,176 million, custodian fees in 2005 were up 3% from CHF 1,143 million in 2004. This increase was entirely due to an enlarged asset base. Portfolio and other management and advisory fees increased by 18% to CHF 5,310 million in 2005 from CHF 4,488 million in 2004. The increase is again the result of rising invested asset levels driven by market valuations and strong net new money inflows. Insurance-related and other fees, at CHF 372 million in 2005, increased by 8% from a year earlier, due to higher commissions from insurance re-lated products. Credit-related fees and commissions in-creased by 16% to CHF 306 million in 2005 from CHF 264 million in 2004, reflecting improved market conditions which brought higher volumes.
Commission income from other services increased by 5% from CHF 977 million in 2004 to CHF 1,027 million in 2005, mainly driven by equity derivative products distributed in Switzerland.

29
Other income decreased by 3% to CHF 561 million in 2005 from CHF 578 million in 2004, mainly due to lower net gains from both disposals of associates and subsidiaries and from investments in property. This was partially offset by higher net gains from disposal of investments in financial assets available-for-sale.
Operating expensesTotal operating expenses increased by 6% to CHF 27,704 million in 2005 from CHF 26,149 million in 2004.
Personnel expenses increased by CHF 2,197 million or 12% to CHF 19,903 million in 2005 from CHF 17,706 million in 2004. The rise was driven by higher performance-related compensation reflecting the better performance in all our businesses. Salary expenses rose due to the 6% increase in personnel over the year (excluding the staff of Private Banks & GAM), showing the continuous expansion of our business as well as annual pay rises. Share-based components increased by 17% or CHF 232 million to CHF 1,628 million from CHF 1,396 million. This was due to an increase in the UBS share price and the higher proportion of stock in bonuses granted in 2005, partially offset by lower option expenses. Contractors’ expenses increased to CHF 823 million in 2005, up 45% from CHF 567 million in 2004, mainly related to the integration of former Perot employees into our central ITI function. They also reflects higher usage, mainly in our Invest-ment Bank in support of increased business flows. Insurance and social security contributions rose by 23% to CHF 1,256 million in 2005 compared with CHF 1,024 million in 2004. Contributions to retirement benefit plans were up 9% or CHF 61 million from CHF 651 million in 2004 to CHF 712 million in 2005. At CHF 1,390 million in 2005, other personnel expens-es increased CHF 25 million from CHF 1,365 million in 2004, mainly driven by increased headcount, partially offset by the end of retention payments in the Wealth Management US business and lower severance payments.
At CHF 6,448 million in 2005, general and administrative expenses increased CHF 61 million from CHF 6,387 million a year ago. The increase was driven by travel and entertainment expenses, and additional administration costs, reflecting high-
er employee levels and further increases in business activity. Marketing costs increased due to continued investment in our brand. This was partially offset by lower provisions (2004 in-cluded the civil penalty levied by the Federal Reserve Board relating to our banknote trading business) and reduced ex-penses for IT outsourcing and professional fees, as well as lower rent and maintenance of machines and equipment.
Depreciation was CHF 1,240 million in 2005, down 2% from CHF 1,262 million in 2004. This was the lowest level ever, reflecting falling IT-related charges, partially offset by higher depreciation on real estate.
There was no amortization of goodwill in 2005 as we were required to cease this so at the start of the year. In 2004, amortization of goodwill was CHF 646 million.
At CHF 127 million, amortization of intangible assets was down 24% from CHF 168 million a year earlier, due to the reclassification of the Wealth Management US workforce to goodwill.
Tax
Tax expense for 2005 was CHF 2,296 million, resulting in an effective tax rate of 18.8%, down from the full-year 2004 tax rate of 21.4%. The tax rate for full-year 2005 was posi-tively influenced by the absence of goodwill amortization and the successful conclusion of tax audits in the third and fourth quarters.
Fair value disclosure of shares and options
The fair value of shares granted in 2005 rose to CHF 1,381 million, 25% higher than CHF 1,109 million a year earlier. The increase compared with 2004 was primarily driven by an increased proportion of bonuses being delivered in restricted shares.
The fair value of options granted as of 31 December 2005 was CHF 362 million, down 29% from CHF 508 million in 2004. The decrease reflected a lower fair value per option, primarily due to a change in the valuation model, and a drop in the number of options granted.

30
Financial BusinessesGlobal Wealth Management & Business Banking
Global Wealth Management & Business Banking
Pre-tax profit for our international and Swiss wealth management businesses was CHF 5,203 million, up 25% from the result achieved in 2005. In the US, pre-tax profit rose to CHF 582 million from CHF 312 million a year earlier. Business Banking Switzerland’s pre-tax profit was CHF 2,356 million, up 8% from 2005.
Marcel Rohner | Chairman and CEOGlobal Wealth Management &Business Banking
Business Group reporting
As of or for the year ended % change from
CHF million, except where indicated 31.12.06 31.12.05 31.12.04 31.12.05
Income 21,775 19,131 17,506 14
Adjusted expected credit loss 1 156 107 (38) 46
Total operating income 21,931 19,238 17,468 14
Cash components 9,043 8,252 7,630 10
Share-based components 2 306 237 235 29
Total personnel expenses 9,349 8,489 7,865 10
General and administrative expenses 3,028 2,845 2,473 6
Services (to) / from other business units 1,118 960 1,137 16
Depreciation of property and equipment 232 226 202 3
Amortization of goodwill 0 0 238
Amortization of intangible assets 63 56 115 13
Total operating expenses 13,790 12,576 12,030 10
Business Group performance before tax 8,141 6,662 5,438 22
KPIs
Cost / income ratio (%) 3 63.3 65.7 68.7
Capital return and BIS data
Return on allocated regulatory capital (%) 4 39.3 34.7 31.3
BIS risk-weighted assets 155,158 147,348 134,004 5
Goodwill and excess intangible assets 5 5,978 5,407 3,648 11
Allocated regulatory capital 6 21,494 20,142 17,048 7
Additional information
Invested assets (CHF billion) 2,123 1,887 1,524 13
Net new money (CHF billion) 114.5 98.5 63.0
Client assets (CHF billion) 3,337 2,895 2,306 15
Personnel (full-time equivalents) 48,034 44,612 42,570 8
1 In management accounts, adjusted expected credit loss rather than credit loss expense or recovery is reported for the business groups (see note 2 to the financial statements). 2 Additionally includes social security contributions and expenses related to alternative investment awards. 3 Operating expenses / income. 4 Business Group performance before tax / average allocated regulatory capital. 5 Goodwill and intangible assets in excess of 4% of BIS Tier 1 Capital. 6 10% of BIS risk-weighted assets plus goodwill and excess intangible assets.

31
Business Unit reporting
As of or for the year ended % change from
CHF million, except where indicated 31.12.06 31.12.05 31.12.04 31.12.05
Income 10,827 9,024 7,701 20
Adjusted expected credit loss 1 (29) (13) (8) 123
Total operating income 10,798 9,011 7,693 20
Cash components 2,999 2,491 2,047 20
Share-based components 2 138 88 72 57
Total personnel expenses 3,137 2,579 2,119 22
General and administrative expenses 885 804 642 10
Services (to) / from other business units 1,479 1,371 1,395 8
Depreciation of property and equipment 84 89 66 (6)
Amortization of goodwill 0 0 67
Amortization of intangible assets 10 7 8 43
Total operating expenses 5,595 4,850 4,297 15
Business Unit performance before tax 5,203 4,161 3,396 25
KPIs
Invested assets (CHF billion) 1,138 982 778 16
Net new money (CHF billion) 3 97.6 68.2 42.3
Gross margin on invested assets (bps) 4 103 102 103 1
Cost / income ratio (%) 5 51.7 53.7 55.8
Cost / income ratio excluding the European wealth management business (%) 5 47.5 47.7 47.9
Client advisors (full-time equivalents) 4,742 4,154 3,744 14
International clients
Income 7,907 6,476 5,429 22
Invested assets (CHF billion) 862 729 562 18
Net new money (CHF billion) 3 90.8 64.2 40.4
Gross margin on invested assets (bps) 4 101 100 102 1
European wealth management (part of international clients)
Income 1,010 722 437 40
Invested assets (CHF billion) 144 114 82 26
Net new money (CHF billion) 3 18.2 21.8 13.7
Client advisors (full-time equivalents) 870 803 838 8
1 In management accounts, adjusted expected credit loss rather than credit loss expense or recovery is reported for the business groups (see note 2 to the financial statements). 2 Additionally includes social security contributions and expenses related to alternative investment awards. 3 Excludes interest and dividend income. 4 Income / average invested assets. 5 Operating expenses / income.
Wealth Management International & Switzerland

32
Financial BusinessesGlobal Wealth Management & Business Banking
Business Unit reporting (continued)
As of or for the year ended % change from
CHF million, except where indicated 31.12.06 31.12.05 31.12.04 31.12.05
Swiss clients
Income 2,920 2,548 2,272 15
Invested assets (CHF billion) 276 253 216 9
Net new money (CHF billion) 1 6.8 4.0 1.9
Gross margin on invested assets (bps) 2 110 109 106 1
Capital return and BIS data
Return on allocated regulatory capital (%) 3 81.2 78.9 82.5
BIS risk-weighted assets 51,485 43,369 31,903 19
Goodwill and excess intangible assets 4 1,740 1,566 1,176 11
Allocated regulatory capital 5 6,889 5,903 4,366 17
Additional information
Recurring income 6 8,143 6,635 5,679 23
Client assets (CHF billion) 1,436 1,235 972 16
Personnel (full-time equivalents) 13,564 11,555 10,093 17
1 Excludes interest and dividend income. 2 Income / average invested assets. 3 Business Unit performance before tax / average allocated regulatory capital. 4 Goodwill and intangible assets in excess of 4% of BIS Tier 1 Capital. 5 10% of BIS risk-weighted assets plus goodwill and excess intangible assets. 6 Interest, asset-based revenues for portfolio management and fund distribution, account-based and advisory fees.
Components of operating income
Wealth Management International & Switzerland derives its operating income principally from:– fees for financial planning and wealth management services;– fees for investment management services;– transaction-related fees; and– interest income from client loans.
These revenues are based on the market value of invested assets, the level of transaction-related activity and the size of the loan book. As a result, operating income is affected by factors such as fluc-tuations in invested assets, changes in market conditions, investment performance, inflows and outflows of client funds, and investor activity levels.
2006
Key performance indicators
In 2006, net new money was a record CHF 97.6 billion, compared with CHF 68.2 billion in 2005, representing an annual growth rate of 10% of the underlying invested asset base at end-2005. This outstanding result reflected increases
Net new money
CHF billion
2004 2005 2006
100
75
50
25
0
42.3
68.2
97.6
in all geographical regions throughout the year, particu- larly in Asia Pacific and Europe, both a result of our growth strategy.
Invested assets, at CHF 1,138 billion on 31 December 2006, were up 16% from CHF 982 billion a year earlier, mainly reflecting the strong inflow of net new money and
Invested assets
CHF billion
31.12.04 31.12.05 31.12.06
1,250
1,000
750
500
250
0Swiss Clients International Clients
562729
862
276
253
216

33
rising financial markets, with CHF 4.8 billion coming from new assets gained from acquisitions we integrated in 2006. This increase was partially offset by negative currency ef-fects. The 7% fall of the US dollar against the Swiss franc contributed to this decrease – approximately 36% of invest-ed assets were denominated in US dollars at the end of 2006.
The gross margin on invested assets was 103 basis points in 2006, up 1 basis point from 102 basis points a year earlier, as the increase in recurring margin due to higher fee income and increased Lombard lending was partly offset by a lower non-recurring margin. Overall, recurring income made up 78 basis points of the margin in 2006, up from 75 basis points in 2005. Non-recurring income comprised 25 basis points of the margin in 2006, down 2 basis points from 2005.
The cost / income ratio improved to 51.7% in 2006 from 53.7% a year earlier. The cost / income ratio has improved for the fourth consecutive year despite the rise in costs in pursuit of our global expansion strategy. This improvement reflects the strong rise in income due to a higher asset base and higher volumes in Lombard lending, which more than offset the increase in personnel expenses (mainly headcount in-crease and performance-related compensation) and higher general and administrative costs.
Gross margin on invested assets
bps
2004 2005 2006
125
100
75
50
25
0Gross margin on non-recurring incomeGross margin on recurring income
76 7578
252727
Cost / income ratio
in %
2004 2005 2006
60
50
40
30
20
55.853.7
51.7
Excluding the European wealth management business, the 2006 cost / income ratio fell to 47.5% from 47.7% a year earlier.
European wealth management
Our European wealth management business continued to make good progress. With a good performance in the UK and Germany, particularly in the first half of the year, the inflow of net new money in 2006 was CHF 18.2 billion, down 17% from the 2005 intake of CHF 21.8 billion. The result reflects an annual net new money growth rate of 16% of the underlying asset base at year-end 2005, with positive contributions from all five target markets.
The level of invested assets was a record CHF 144 billion on 31 December 2006, a 26% increase compared with CHF 114 billion a year earlier. This reflected rising equity markets and new inflows across Europe, particularly in the first half of the year.
In 2006, income from our European wealth management business was CHF 1,010 million, up 40% from a year earlier, reflecting our growing asset and client base. The business was profitable in all quarters of 2006 and all five markets made a positive contribution.
Net new money European wealth management
CHF billion
2004 2005 2006
25
20
15
10
5
0
13.7
21.8
18.2
Invested assets European wealth management
CHF billion
31.12.04 31.12.05 31.12.06
160
120
80
40
0
82
114
144

34
Financial BusinessesGlobal Wealth Management & Business Banking
In 2006, the number of client advisors increased by 67. The increase in client advisors was mainly in Italy and France. We remain committed to growing our presence in our Euro-pean target markets and will continue to invest in qualified advisory staff.
Results
In 2006, pre-tax profit, at a record CHF 5,203 million, was up 25% compared with 2005. This increase reflects higher as-set-based fees as well as rising interest income, a reflection of higher volumes in our Lombard lending business. Operat-ing expenses, up 15% in 2006 from 2005, also rose as our business expanded. Personnel expenses rose 22% due to the hiring of an additional 2,009 employees.
Operating incomeTotal operating income in 2006 was CHF 10,798 million, up 20% from CHF 9,011 million a year earlier. This was the highest level ever, reflecting a rise in recurring as well as in non-recurring revenues. Recurring income increased 23% on rising asset-based fees, benefiting from a buoyant market and net new money inflows. This was accentuated by higher interest income due to the expansion of our margin lending activities. Non-recurring income rose due to higher broker-age fees, reflecting high client activity levels. These positive effects were offset by the depreciation of the US dollar against the Swiss franc.
Operating expensesAt CHF 5,595 million, operating expenses in 2006 were up 15% from CHF 4,850 million a year earlier, reflecting higher personnel expenses and general and administrative expenses as well as the ongoing investment in our growth initiatives. Personnel expenses rose 22% to CHF 3,137 million in 2006 compared with CHF 2,579 million a year earlier, reflecting the increase in salaries from the expansion of our business as well as higher performance-related compensation. Share-based expenses in 2006 increased due to higher share
Performance before tax
CHF million
2004 2005 2006
6,000
4,800
3,600
2,400
1,200
0
3,396
4,161
5,203
awards and the increased fair value of options. General and administrative expenses, at CHF 885 million, were up 10% in 2006 from CHF 804 million a year earlier due to investments in our physical and IT infrastructure, as well as travel and entertainment and marketing costs – all a consequence of our continuous business expansion. Expenses for services from other business units, at CHF 1,479 million in 2006, were up 8% from CHF 1,371 million the previous year, mainly due to higher information technology charges. Depreciation was CHF 84 million in 2006, down 6% from CHF 89 million a year earlier because of lower charges for information tech-nology equipment. Amortization of intangible assets was CHF 10 million, practically unchanged from CHF 7 million in 2005.
2005
Key performance indicators
In 2005, net new money inflows totaled CHF 68.2 billion, up 61% from CHF 42.3 billion in 2004. This increase was driven by gains in all geographical areas, especially from Asian clients, and a particularly strong inflow into our European wealth management business.
Invested assets, at CHF 982 billion on 31 December 2005, were up 26% from CHF 778 billion a year earlier, mainly re-flecting the strong inflow of net new money and the positive market performance during the second half of the year, with CHF 11.1 billion coming from new assets gained from acqui-sitions we integrated in 2005. The 15% rise of the US dollar against the Swiss franc contributed to the increase. Approxi-mately 36% of invested assets were denominated in US dol-lars at the end of 2005.
The gross margin on invested assets was 102 basis points in 2005, down 1 basis point from 103 basis points a year earlier, as the asset base was boosted by the record inflows of net new money. Overall, recurring income made up 75 basis points of the margin in 2005, down from 76 basis points in 2004. Non-recurring income comprised 27 basis points of the margin in 2005, unchanged from 2004.
The cost / income ratio improved to 53.7% in 2005 from 55.8% a year earlier, reflecting the strong rise in income, which more than offset the increase in personnel expenses (mainly performance-related compensation) and higher gen-eral and administrative costs. Excluding the European wealth management business, the 2005 cost / income ratio fell to 47.7% from 47.9% a year earlier.
European wealth management
In 2005, our European wealth management business made significant progress. With a particularly good performance in the UK and Germany, the inflow of net new money in 2005

35
was CHF 21.8 billion, up 59% from the previous year’s intake of CHF 13.7 billion. The result reflects an annual net new money inflow rate of 27% of the underlying asset base at year-end 2004.
The level of invested assets was CHF 114 billion on 31 December 2005, a 39% increase compared to the CHF 82 billion a year earlier. As well as new inflows, this reflected rising equity market levels and a 15% appreciation of the US dollar against the Swiss franc.
In 2005, income from our European wealth management business was CHF 722 million, up 65% from a year earlier, reflecting our growing asset and client base.
In 2005, the number of client advisors decreased by 35. The decline was due to the reclassification of some former Sauerborn Trust employees, and the departure of less pro-ductive client advisors.
Results
Wealth Management International and Switzerland’s 2005 pre-tax profit, at CHF 4,161 million, increased 23% from 2004, mainly due to higher asset-based fees, and strength-ening client activity. Rising interest income, a reflection of the expansion of our margin lending activities, also bolstered revenues. At the same time, our expenses, up 13% in 2005 from 2004, reflect our ongoing growth strategy.
Operating incomeTotal operating income in 2005 was CHF 9,011 million, up 17% from CHF 7,693 million in 2004. Recurring income
increased 17% on rising asset-based fees, benefiting from gains in asset levels. This was accentuated by higher interest income due to the expansion of our margin lending activi-ties. Non-recurring income rose due to higher brokerage fees and commissions for sales of investment funds, reflect-ing an increase in client activity levels. These positive effects were supported by the appreciation of the US dollar against the Swiss franc.
Operating expensesAt CHF 4,850 million, operating expenses in 2005 were up 13% from CHF 4,297 million a year earlier, reflecting higher personnel expenses as well as the ongoing investment in our growth initiatives. Personnel expenses rose 22% to CHF 2,579 million in 2005 compared to CHF 2,119 million a year earlier, reflecting the increase in salaries from the expansion of our business as well as higher performance-related compensation. General and administrative expenses, at CHF 804 million, were up 25% in 2005 from CHF 642 million a year earlier due to ongoing business expansion as well as investments in our physical and IT infrastructure. Expenses for services from other business units, at CHF 1,371 million in 2005, were down 2% from CHF 1,395 million the previous year, mainly due to lower charges for insurance. Depreciation was CHF 89 million in 2005, up 35% from CHF 66 million a year earlier because of higher charges for information technology equipment. There was no amortization of goodwill in 2005, due to a change in accounting. In 2004, amortization of goodwill totaled CHF 67 million. Amortization of intangible assets was CHF 7 million, practically unchanged from CHF 8 million in 2004.

36
Wealth Management US
Business Unit reporting
As of or for the year ended % change from
CHF million, except where indicated 31.12.06 31.12.05 31.12.04 31.12.05
Income 5,863 5,158 4,741 14
Adjusted expected credit loss 1 0 (2) (5) (100)
Total operating income 5,863 5,156 4,736 14
Cash components 3,683 3,353 3,206 10
Share-based components 2 117 107 114 9
Total personnel expenses 3,800 3,460 3,320 10
General and administrative expenses 1,073 1,047 767 2
Services (to) / from other business units 281 223 275 26
Depreciation of property and equipment 74 65 67 14
Amortization of goodwill 0 0 171
Amortization of intangible assets 53 49 107 8
Total operating expenses 5,281 4,844 4,707 9
Business Unit performance before tax 582 312 29 87
KPIs
Invested assets (CHF billion) 824 752 606 10
Net new money (CHF billion) 3 15.7 26.9 18.1
Interest and dividend income (CHF billion) 4 22.2 18.3 15.3 21
Gross margin on invested assets (bps) 5 76 75 77 1
Cost / income ratio (%) 6 90.1 93.9 99.3
Recurring income 7 3,488 2,834 2,343 23
Revenues per advisor (CHF thousand) 8 776 690 633 12
Capital return and BIS data
Return on allocated regulatory capital (%) 9 10.2 5.8 0.6
BIS risk-weighted assets 18,308 18,928 17,664 (3)
Goodwill and excess intangible assets 10 4,238 3,841 2,472 10
Allocated regulatory capital 11 6,069 5,734 4,238 6
Additional information
Client assets (CHF billion) 909 826 679 10
Personnel (full-time equivalents) 18,557 17,034 16,969 9
Financial advisors (full-time equivalents) 7,880 7,520 7,519 5
1 In management accounts, adjusted expected credit loss rather than credit loss expense or recovery is reported for the Business Groups (see note 2 to the financial statements). 2 Additionally includes social security contributions and expenses related to alternative investment awards. 3 Excludes interest and dividend income. 4 For purposes of comparison with US peers. 5 Income / average in-vested assets. 6 Operating expenses / income. 7 Interest, asset-based revenues for portfolio management and fund distribution, account-based and advisory fees. 8 Income (includes net goodwill funding) / average number of financial advisors. 9 Business Unit performance before tax / average allocated regulatory capital. 10 Goodwill and intangible assets in excess of 4% of BIS Tier 1 Capi-tal. 11 10% of BIS risk-weighted assets plus goodwill and excess intangible assets.
Components of operating income
Wealth Management US principally derives its operating income from:– fees for financial planning and wealth management services;– fees for investment management services;– transaction-related fees; and– interest income from client loans.
These revenues are based on the market value of invested assets, the level of transaction-related activity and the size of the loan book. As a result, operating income is affected by such factors as fluc-tuations in invested assets, changes in market conditions, investment performance, inflows and outflows of client funds, and investor activity levels.
Financial BusinessesGlobal Wealth Management & Business Banking

37
2006
Key performance indicatorsThe inflow of net new money in 2006 was CHF 15.7 billion, down 42% from CHF 26.9 billion in 2005. Although the result was lower, the inflow of net new money compared favorably with peers in terms of growth rate relative to the asset base.
Including interest and dividends, net new money in 2006 was CHF 37.9 billion, down from CHF 45.2 billion a year earlier.
Wealth Management US had CHF 824 billion in invested assets on 31 December 2006, up 10% from CHF 752 billion on 31 December 2005. The increase was due to the strong market performance in 2006 as well as to the inclusion of the private client branch network of Piper Jaffray in the third quarter, adding CHF 54 billion of invested assets on a net basis. In US dollar terms, invested assets were 18% higher on 31 December 2006 than they were on the same date in 2005.
The gross margin on invested assets was 76 basis points in 2006, up from 75 basis points in 2005. The increase is mainly a result of the gain in revenues outpacing the increase in average invested asset levels over the year.
The cost / income ratio was 90.1% for 2006, compared to 93.9% in 2005. The decrease in the cost / income ratio
10
15
20
25
30
18.1
26.9
15.7
Net new money
CHF billion
2004 2005 2006
30
25
20
15
10
–12% in US dollar
500
600
700
800
900
606
824
752
Invested assets
CHF billion
31.12.04 31.12.05 31.12.06
900
800
700
600
500
+10% in US dollar
reflects higher operating income due to strong growth in recurring income, partially offset by a rise in expenses mainly reflecting higher personnel expenses in support of growth initiatives and the integration of the Piper Jaffray private client branch network.
In 2006, recurring income was a record CHF 3,488 mil-lion, up 23% from CHF 2,834 million a year earlier. Excluding the impact of currency fluctuations, recurring income was also up 23% in 2006 from 2005. This increase mainly reflects 0.000000
15.625001
31.250002
46.875003
62.500004
78.125005
93.750006
109.375007
Gross margin on invested assets1
bps
2004 2005 2006
125
100
75
50
25
0Gross margin on non-recurring incomeGross margin on recurring income
38 4145
313439
1 Includes costs from the PaineWebber acquisition.
20
40
60
80
100
40
46
52
58
64
70
Cost / income ratio1
in %
2004 2005 2006
100
80
60
40
20
As reported Adjusted for goodwill and significant financial events
99.393.9
90.1
1 Includes costs from the PaineWebber acquisition.
1500
2000
2500
3000
3500
2,343
2,834
3,488
Recurring income
CHF million
2004 2005 2006
3,500
3,000
2,500
2,000
1,500
As reported 6 Before goodwill and adjusted for significant financial events 7
+15% in US dollar

38
Financial BusinessesGlobal Wealth Management & Business Banking
higher levels of managed account fees on a record level of invested assets, higher investment advisory fees and higher net interest income. Recurring income represented 59% of income in 2006 compared with 55% in 2005.
Revenue per advisor increased in 2006 to CHF 776,000 from CHF 690,000 in 2005 as a slightly higher average num-ber of financial advisors was able to produce significantly higher recurring income than a year earlier. The number of financial advisors rose by 5% compared to 2005, increasing by 360 advisors to 7,880 at the end of 2006. The increase was due to the Piper Jaffray private client group branch net-work acquisition in third quarter.
Results
In 2006, we reported a pre-tax profit of CHF 582 million compared to CHF 312 million in 2005. Because this business is almost entirely conducted in US dollars, comparisons of results with prior periods are affected by the movements of the US dollar against the Swiss franc. In US dollar terms, per-formance in 2006 was up 86% from 2005. Performance in 2006 benefited from record levels of recurring income, and lower litigation provisions.
0
200
400
600
800
633690
776
Revenues per advisor1
CHF thousand
2004 2005 2006
800
600
400
200
01 Income (including net goodwill funding)/average number of financial advisors.
4000
5000
6000
7000
8000
7,519 7,520
7,880
Financial advisors
full-time equivalents
31.12.04 31.12.05 31.12.06
8,000
7,000
6,000
5,000
4,000
Operating incomeIn 2006, total operating income was CHF 5,863 million, up 14% compared to CHF 5,156 million in 2005. Excluding cur-rency effects, operating income also increased by 14% from 2005. The increase in operating income is primarily due to strong growth in recurring income based on higher levels of assets.
Operating expensesTotal operating expenses rose 9% to CHF 5,281 million in 2006 from CHF 4,844 million in 2005. Excluding currency effects, operating expenses were also 9% higher. This re-flects higher personnel costs and general and administra-tive expenses, both also related to strategic growth initia-tives in support of our business and the Piper Jaffray private client branch network inclusion and the New Jersey office provision that was made after the decision to sublet un-used office space instead of occupying it ourselves. This was offset by a lower impact of litigation provisions com-pared to 2005.
Personnel expenses increased by CHF 340 million or 10%, with higher salaries as well as share-based compen-sation reflecting rising headcount and more financial advi-sor compensation related to higher compensable revenue. General and administrative expenses increased 2% to CHF 1,073 million in 2006 from CHF 1,047 million in 2005. In US dollar terms, they also rose 2%, reflecting higher occu-pancy and marketing expenses, partially offset by lower litigation provisions compared to 2005. Services from other business units increased by 26% from CHF 223 million in 2005 to CHF 281 million in 2006. Depreciation was also higher due to leasehold improvement. The amortization of intangibles was CHF 53 million in 2006, up 8% from CHF 49 million, mainly due to the acquisition of the Piper Jaffray private client branch network.
0
150
300
450
600
29
312
582
Performance before tax1
CHF million
2004 2005 2006
600
450
300
150
01 Includes costs from the PaineWebber acquisition.

39
2005
Key performance indicators
In 2005, inflows of net new money were CHF 26.9 billion, up 49% from CHF 18.1 billion in 2004. Including interest and dividends, net new money in 2005 was CHF 45.2 billion, up from CHF 33.4 billion a year earlier.
Wealth Management US had CHF 752 billion in invested assets on 31 December 2005, up 24% from CHF 606 billion on 31 December 2004. The increase was due to the strong appreciation of the year-end US dollar spot rate against the Swiss franc, the inflows of net new money as well as positive market movements. In US dollar terms, invested assets were 8% higher on 31 December 2005 than they were on the same date in 2004.
The gross margin on invested assets was 75 basis points in 2005, down from 77 basis points in 2004.
The cost / income ratio was 93.9% for 2005, compared to 99.3% in 2004. The decrease in the cost / income ratio reflects higher income which was slightly offset by higher expenses.
In 2005, recurring income was CHF 2,834 million, up 21% from CHF 2,343 million a year earlier. Excluding the impact of currency fluctuations, recurring income was up 20% in 2005 from 2004, mainly due to higher levels of man-aged account fees on invested assets, and increased net in-terest income from the lending business. Flows into man-aged account products were USD 16.7 billion in full-year 2005, comparing favorably to the USD 12.7 billion flow for full-year 2004.
Revenues per advisor increased in 2005 to CHF 690,000 from CHF 633,000 in 2004 as practically the same number of financial advisors were able to produce higher recurring income than a year earlier. The number of financial advisors increased by 1 to 7,520 at the end of 2005. Increases in highly efficient financial advisors and trainees were offset by attrition among less productive advisors.
Results
In 2005, we reported a pre-tax profit of CHF 312 million compared to CHF 29 million in 2004. This increase reflects mainly higher recurring income which was slightly offset by increased expenses.
Operating incomeIn 2005, total operating income was CHF 5,156 million, up 9% compared to CHF 4,736 million in 2004. Excluding currency effects, operating income increased by 8% from 2004. The increase in operating income is primarily due to higher recurring income based on higher levels of assets and rising net interest income in UBS Bank USA, which was slightly offset by lower transactional revenues.
Operating expensesTotal operating expenses rose 3% to CHF 4,844 million in 2005 from CHF 4,707 million in 2004. Excluding currency effects, operating expenses were 2% higher primarily due to the impact of increased litigation provisions in second half 2005.
Personnel expenses increased by CHF 140 million due to higher variable compensation. Excluding the currency trans-lation effect, the increase in personnel expenses amounted to 3%. General and administrative expenses increased 37% to CHF 1,047 million in 2005 from CHF 767 million in 2004. In US dollar terms, they actually rose 35%, reflecting higher litigation provisions. Services from other business units de-creased mainly due to lower charges-in from ITI. Deprecia-tion was also lower due to a drop in infrastructure charges (down CHF 2 million). There was no goodwill amortization in 2005 due to accounting changes. In 2004, amortization of goodwill totaled CHF 171 million. The amortization of intan-gibles was CHF 49 million in 2005, down 54% due to the reclassification of certain intangible assets. Under the new accounting rules, these assets are classified as goodwill, which is no longer amortized.

40
Business Banking Switzerland
Financial BusinessesGlobal Wealth Management & Business Banking
Business Unit reporting
As of or for the year ended % change from
CHF million, except where indicated 31.12.06 31.12.05 31.12.04 31.12.05
Interest income 3,339 3,317 3,390 1
Non-interest income 1,746 1,632 1,674 7
Income 5,085 4,949 5,064 3
Adjusted expected credit loss 1 185 122 (25) 52
Total operating income 5,270 5,071 5,039 4
Cash components 2,361 2,408 2,377 (2)
Share-based components 2 51 42 49 21
Total personnel expenses 2,412 2,450 2,426 (2)
General and administrative expenses 1,070 994 1,064 8
Services (to) / from other business units (642) (634) (533) (1)
Depreciation of property and equipment 74 72 69 3
Amortization of goodwill 0 0 0
Amortization of intangible assets 0 0 0
Total operating expenses 2,914 2,882 3,026 1
Business Unit performance before tax 2,356 2,189 2,013 8
KPIs
Invested assets (CHF billion) 161 153 140 5
Net new money (CHF billion) 3 1.2 3.4 2.6
Cost / income ratio (%) 4 57.3 58.2 59.8
Impaired lending portfolio as a % of total lending portfolio, gross 1.7 2.3 3.0
Capital return and BIS data
Return on allocated regulatory capital (%) 5 27.5 25.6 23.2
BIS risk-weighted assets 85,365 85,051 84,437 0
Goodwill and excess intangible assets 6 0 0 0
Allocated regulatory capital 7 8,537 8,505 8,444 0
Additional information
Deferral (included in adjusted expected credit loss) 512 485 411 6
Client assets (CHF billion) 992 834 655 19
Personnel (full-time equivalents) 15,913 16,023 15,508 (1)
1 In management accounts, adjusted expected credit loss rather than credit loss expense or recovery is reported for the Business Groups (see note 2 to the financial statements). 2 Additionally includes social security contributions and expenses related to alternative investment awards. 3 Excludes interest and dividend income. 4 Operating expenses / income. 5 Business Unit performance before tax / average allocated regulatory capital. 6 Goodwill and intangible assets in excess of 4% of BIS Tier 1 Capital. 7 10% of BIS risk-weighted assets plus goodwill and excess intangible assets.
Components of operating income
Business Banking Switzerland derives its operating income principally from:– net interest income from its lending portfolio and customer deposits;– fees for investment management services; and– transaction fees.
As a result, operating income is affected by movements in interest rates, fluctuations in invested assets, client activity levels, investment performance, changes in market conditions and the credit environ-ment.

41
2006
Key performance indicators
Net new money was CHF 1.2 billion in 2006, CHF 2.2 billion lower than the inflow of CHF 3.4 billion in 2005. This was due to a decrease in inflows from existing clients, combined with transfers of client assets from discretionary to custody mandates.
Invested assets rose to CHF 161 billion in 2006 from CHF 153 billion a year earlier, driven by positive market develop-ments and net new money inflows. This was slightly offset by the transfer of assets to Wealth Management Inter-national & Switzerland. Over the course of 2006, we trans-ferred CHF 8.2 billion in client assets from the Business Banking Switzerland unit to the Wealth Management Inter-national & Switzerland unit, reflecting the development of client relationships. In 2005, we transferred CHF 8.6 billion in client assets for the same reason.
In 2006 the cost / income ratio stood at 57.3%, 0.9 per-centage points lower than the previous year’s ratio of 58.2%, as the rise in income outpaced the increase in expenses.
Business Banking Switzerland’s gross lending portfolio was CHF 143.4 billion on 31 December 2006, up 1% from the previous year, due to an increase in volumes of private
40
45
50
55
60
40
46
52
58
64
70
Cost / income ratio
in %
2004 2005 2006
60
55
50
45
40
As reported Adjusted for goodwill and significant financial events
59.8
58.257.3
0.00
1.25
2.50
3.75
5.00
3.0
2.3
1.7
Impaired lending portfolio, gross/total lending portfolio, gross
in %31.12.04 31.12.05 31.12.06
5
4
3
2
1
0
client mortgages, which more than offset the ongoing reduction of our recovery portfolio, which fell to CHF 2.6 billion from CHF 3.3 billion a year earlier. This positive devel-opment was also reflected in the key credit quality ratio of the impaired lending portfolio, gross, to the total lending portfolio, gross, which was 1.7% compared to 2.3% in 2005.
The return on allocated regulatory capital was 27.5% for 2006, up 1.9 percentage points from 25.6% a year earlier. This reflects the increased profitability of the business unit, outpacing the increase in risk-weighted assets.
Results
Pre-tax profit in 2006, at a record level of CHF 2,356 mil-lion, was CHF 167 million or 8% above the result achieved in 2005. This was mainly due to income growth. In 2006 non-interest income rose due to higher asset-based and brokerage fees. The result also shows the continued tight management of our cost base, and an adjusted expected credit loss recovery of CHF 185 million. While personnel costs were at their lowest levels, general and administrative expenses increased, reflecting the outsourcing of Edelweiss facility management.
0
7
14
21
28
23.2
25.627.5
Return on allocated regulatory capital
in %
2004 2005 2006
28
21
14
7
0
0
625
1250
1875
2500
Performance before tax
CHF million
2004 2005 2006
2,500
2,000
1,500
1,000
500
0
As reported 6 Before goodwill and adjusted for significant financial events 7
2,013
2,189
2,356

42
Financial BusinessesGlobal Wealth Management & Business Banking
Operating incomeTotal operating income in 2006 was CHF 5,270 million, up slightly from 2005’s level of CHF 5,071 million. Interest income increased by 1% to CHF 3,339 million in 2006 from CHF 3,317 million in 2005. The slight increase reflects the expansion of our loan portfolio as well as higher invest-ment interest rates on our variable rate accounts, offset by lower revenues from our reduced recovery portfolio. Non-interest income increased by CHF 114 million to CHF 1,746 million in 2006 from CHF 1,632 million in 2005, reflecting a higher asset base as well as valuation gains from equity par-ticipations and divestment proceeds. Adjusted expected credit loss recoveries, at CHF 185 million in 2006, increased from recoveries of CHF 122 million in 2005. This positive re-sult reflects the deferred benefit of the structural improve-ment in our loan portfolio in recent years.
Operating expensesOperating expenses in 2006 were CHF 2,914 million, up 1% from CHF 2,882 million in 2005. Personnel expenses, at CHF 2,412 million, were down 2% from CHF 2,450 million in 2006, due to lower salary costs reflecting the outsourcing of Edelweiss, partly offset by higher share-based expenses, mainly reflecting higher share awards and the higher fair value of options in 2006. General and administrative expens-es, at CHF 1,070 million in 2006, rose and were 8% higher than the CHF 994 million recorded in 2005, mainly due to the outsourcing of Edelweiss facility management at the end of 2005. Net charges to other business units continued to rise to CHF 642 million in 2006 from CHF 634 million in 2005 because of lower charges-in for IT services. Deprecia-tion in 2006 slightly increased to CHF 74 million from CHF 72 million in 2005 due to higher expenses for information technology equipment.
2005
Key performance indicators
Net new money was CHF 3.4 billion in 2005, CHF 0.8 billion higher than the inflow of CHF 2.6 billion in 2004.
Invested assets rose to CHF 153 billion in 2005 from CHF 140 billion a year earlier, driven by positive market develop-ments, net new money inflows as well as favorable currency translation effects. This was partially offset by the transfer of assets to Wealth Management International & Switzerland. During the course of 2005, we transferred CHF 8.6 billion of assets from the Business Banking Switzerland unit to Wealth Management International & Switzerland, reflecting the sys-tematic development of client relationships.
The cost / income ratio was 58.2%, 1.6 percentage points below the ratio of 59.8% in 2004, mainly because of tight cost control.
Business Banking Switzerland’s gross lending portfolio was CHF 141.3 billion on 31 December 2005, up CHF 4.2 billion from the previous year. An increase in volumes of private client mortgages and higher credit demand from corporate clients were partially offset by a further reduction in the recovery portfolio, which fell to CHF 3.3 billion on 31 December 2005 from CHF 4.4 billion a year earlier. The ratio of the gross impaired lending portfolio to gross lending portfolio was 2.3% compared to 3.0% in 2004.
The return on allocated regulatory capital was 25.6% for 2005, up 2.4 percentage points from 23.2% a year earlier. This reflects the increased profitability of the business unit, outpacing the increase in risk-weighted assets.
Results
Pre-tax profit in 2005 was CHF 2,189 million, CHF 176 mil-lion or 9% higher than the result achieved in 2004. It was achieved despite a CHF 115 million fall in income, driven mainly by lower interest income. The result shows the con-tinued tight management of our cost base, with an adjusted expected credit loss recovery of CHF 122 million reflecting the structural improvement in our loan portfolio in recent years. While general and administrative costs were at their lowest levels, personnel expenses increased slightly, reflect-ing an increase in staff levels.
Operating incomeTotal operating income in 2005 was CHF 5,071 million, up slightly from 2004’s level of CHF 5,039 million. Interest income declined by 2% to CHF 3,317 million in 2005 from CHF 3,390 million in 2004. The decline reflects lower reve-nues from our reduced recovery portfolio, as well as lower interest margins in our mortgage business. This was par-tially offset by higher private client mortgage volumes. Non-interest income dropped by CHF 42 million to CHF 1,632 million in 2005 from CHF 1,674 million in 2004, reflecting the gain from the sale of a participation in the Noga Hilton hotel in 2004, partially offset by higher asset-based fees and higher client activity levels. Adjusted ex-pected credit loss recoveries, at CHF 122 million in 2005, increased from an adjusted expected credit loss expense of CHF 25 million in 2004. This positive result reflects the deferred benefit of the structural improvement in our loan portfolio in recent years.
Operating expensesOperating expenses in 2005 were CHF 2,882 million, down 5% from CHF 3,026 million in 2004. Personnel expenses, at CHF 2,450 million, were up 1% from CHF 2,426 million in 2004, as higher salary costs reflected the 3% increase in personnel, partly offset by lower share-based expenses as less share awards have been granted. General and admini-strative expenses, at CHF 994 million in 2005, continued to

43
drop and were 7% lower than the CHF 1,064 million re-corded in 2004, reflecting our continuing tight cost con-trols. Net charges to other business units rose to CHF 634 million in 2005 from CHF 533 million in 2004 because of
lower charges-in for IT services and insurance. Depreciation in 2005 slightly increased to CHF 72 million from CHF 69 million in 2004 due to higher expenses for information technology equipment.

44
Financial BusinessesGlobal Asset Management
Global Asset Management
Pre-tax profit was CHF 1,392 million in 2006, an increase of 32% from the 2005 profit of CHF 1,057 million. Compared with 2005, the increase reflects higher management fees in all businesses and alternative and quan-titative investment performance fees. The result was partly offset by higher operating expenses, reflecting increased staffing, performance-related compensation and investments in strategic initiatives and IT projects.
Business Group reporting
As of or for the year ended % change from
CHF million, except where indicated 31.12.06 31.12.05 31.12.04 31.12.05
Institutional fees 1,803 1,330 1,085 36
Wholesale Intermediary fees 1,417 1,157 937 22
Total operating income 3,220 2,487 2,022 29
Cash components 1,305 899 822 45
Share-based components 1 198 89 71 122
Total personnel expenses 1,503 988 893 52
General and administrative expenses 399 304 299 31
Services (to) / from other business units (105) 116 126
Depreciation of property and equipment 27 21 23 29
Amortization of goodwill 0 0 129
Amortization of intangible assets 4 1 0 300
Total operating expenses 1,828 1,430 1,470 28
Business Group performance before tax 1,392 1,057 552 32
KPI
Cost / income ratio (%) 2 56.8 57.5 72.7
Institutional
Invested assets (CHF billion) 519 441 344 18
of which: money market funds 28 16 17 75
Net new money (CHF billion) 3 29.8 21.3 23.7
of which: money market funds 11.0 (3.0) (1.2)
Gross margin on invested assets (bps)4 38 34 32 12
1 Additionally includes social security contributions and expenses related to alternative investment awards. 2 Operating expenses / operating income. 3 Excludes interest and dividend income. 4 Operating income / average invested assets.
John A. Fraser | Chairman and CEOGlobal Asset Management

45
Business Group reporting (continued)
As of or for the year ended % change from
CHF million, except where indicated 31.12.06 31.12.05 31.12.04 31.12.05
Wholesale Intermediary
Invested assets (CHF billion) 347 324 257 7
of which: money market funds 59 62 64 (5)
Net new money (CHF billion) 1 7.4 28.2 (4.5)
of which: money market funds (2.5) (9.7) (20.6)
Gross margin on invested assets (bps) 2 43 40 36 8
Capital return and BIS data
Return on allocated regulatory capital (%) 3 84.8 69.9 36.4
BIS risk-weighted assets 2,723 1,570 1,702 73
Goodwill and excess intangible assets 4 1,677 1,438 1,189 17
Allocated regulatory capital 5 1,949 1,595 1,359 22
Additional information
Invested assets (CHF billion) 866 765 601 13
Net new money (CHF billion) 37.2 49.5 19.2
Personnel (full-time equivalents) 3,436 2,861 2,665 20
1 Excludes interest and dividend income. 2 Operating income / average invested assets. 3 Business Group performance before tax / average allocated regulatory capital. 4 Goodwill and intangible assets in excess of 4% of BIS Tier 1 Capital. 5 10% of BIS risk-weighted assets plus goodwill and excess intangible assets.
Components of operating income
Global Asset Management generates its revenue from the asset management and fund administration services it provides to financial intermediaries and institutional investors. Fees charged to institutional clients and wholesale intermediary clients are based on the market
value of invested assets and on successful investment performance. As a result, revenues are affected by changes in market and cur-rency valuation levels, as well as flows of client funds, and relative investment performance.

46
Financial BusinessesGlobal Asset Management
2006
Key performance indicators
For 2006, the cost / income ratio was 56.8%, a decrease of 0.7 percentage points from 2005. This was a result of im-proving operating income, representing higher management fees across all businesses, combined with significantly higher performance fees in alternative and quantitative invest-ments. This was partly offset by increased operating ex-penses from increased staff levels and higher variable per-sonnel expenses, in line with business growth.
InstitutionalInstitutional invested assets were CHF 519 billion on 31 De-cember 2006 – up 18% from CHF 441 billion on 31 Decem-ber 2005, reflecting positive market performance (mainly in equities), strong net new money inflow and the inclusion of Pactual.
In 2006, net new money inflows were CHF 29.8 billion, up from the CHF 21.3 billion recorded in 2005. Strong in-flows were reported in most asset classes, partly offset by outflows from equity mandates.
The gross margin on invested assets for 2006 was 38 basis points, up 4 basis points from 2005. The increase is due to income growth, mainly driven by strong performance fees and Dillon Read Capital Management (DRCM) revenues from outside clients, which outpaced the growth in average invested assets.
Wholesale intermediaryInvested assets were CHF 347 billion on 31 December 2006, up by CHF 23 billion from 31 December 2005, reflecting positive market performance, net new money inflows and the inclusion of Pactual.
Cost/income ratio
in %
2004 2005 2006
80
70
60
50
40
30
72.7
57.5 56.8
0
150
300
450
600
Invested assets, institutional
CHF billion
31.12.04 31.12.05 31.12.06
600
480
360
240
120
0Money market funds Non-money market funds
327
425
491
17
16
28
-10
0
10
20
30
0.0
9.6
19.2
28.8
38.4
48.0
Non-money market funds Money market funds
Net new money, institutional
CHF billion
2004 2005 2006
30
20
10
0
(10)
(3.0)
24.9
(1.2)
24.3
18.8
11.0
20
25
30
35
40
Gross margin on invested assets, institutional
bps
2004 2005 2006
40
35
30
25
20
As reported 6 Before goodwill and adjusted for significant financial events 7
32
34
38
0
100
200
300
400
64
193
62
262
59
288
Invested assets, wholesale intermediary
CHF billion
31.12.04 31.12.05 31.12.06
400
300
200
100
0Money market funds Non-money market funds

47
In 2006, net new money was CHF 7.4 billion, down from CHF 28.2 billion a year earlier. In 2005, net new money in-flows resulted from the large number of product launches across all major asset classes. In 2006 we experienced out-flows in fixed income and equities while continuing to expe-rience inflows into multi-asset funds.
The 2006 gross margin on invested assets was 43 basis points, up by 3 basis points from a year earlier, largely driven by increased management fees.
-30.00
-11.25
7.50
26.25
45.00
0.0
9.6
19.2
28.8
38.4
48.0
Money market funds Non-money market funds
Net new money, wholesale intermediary
CHF billion
2004 2005 2006
45
30
15
0
(15)
(30)
(20.6) (9.7) (2.5)
9.9
37.9
16.1
10
20
30
40
50
Gross margin on invested assets,wholesale intermediary
bps
2004 2005 2006
50
40
30
20
10
As reported 6 Before goodwill and adjusted for significant financial events 7
36
4043
Results
We had a very strong full-year result in 2006. Pre-tax profit was CHF 1,392 million, up from CHF 1,057 million a year earlier. The increase reflects higher management fees in all businesses and alternative and quantitative investment per-formance fees. The result was partly offset by higher operat-ing expenses, reflecting increased staffing, performance-re-lated compensation and investments in strategic initiatives and IT projects.
Operating incomeIn 2006, operating income was CHF 3,220 million, up 29% from CHF 2,487 million a year earlier. Institutional revenues increased by 36% to CHF 1,803 million in 2006 from CHF 1,330 million in 2005, reflecting higher management fees in most investment areas, the result of net new money inflows and higher financial market valuations, combined with sig-nificantly higher performance fees in alternative and quantitative investments. Wholesale intermediary reve-nues rose by 22% to CHF 1,417 million in 2006 from CHF 1,157 million in 2005, reflecting higher management fees in most areas due to net new money inflows and higher market valuations.
Operating expensesIn 2006, operating expenses increased to CHF 1,828 million from CHF 1,430 million in 2005, due to higher staff levels and performance-related compensation. Personnel expenses were CHF 1,503 million in 2006, 52% above 2005, mainly due to the inclusion of DRCM. General and administrative expenses increased by 31% to CHF 399 million in 2006 from CHF 304 million in 2005 mainly due to investments in strate-gic initiatives. Other business units were charged CHF 105 million compared to the net charges from other business units of CHF 116 million a year earlier, mainly reflecting high-er net charges-out to the Investment Bank for investment management services provided by DRCM. Over the same pe-riod, depreciation increased by CHF 6 million to CHF 27 mil-lion. Amortization of intangible assets slightly increased to CHF 4 million in 2006.
2005
Key performance indicators
For 2005, the cost / income ratio was 57.5%, a decrease of 15.2 percentage points from 2004. This was a result of improving operating income across all businesses, mainly in-duced by higher asset-based fees. This was also helped by declining operating expenses, mainly the result of the dis-continuation of goodwill amortization in 2005.
0
400
800
1200
1600
Performance before tax
CHF million
2004 2005 2006
1,600
1,200
800
400
0
552
1,057
1,392

48
InstitutionalInstitutional invested assets were CHF 441 billion on 31 De-cember 2005 – up 28% from CHF 344 billion on 31 Decem-ber 2004, reflecting positive market performance, strong net new money and favorable currency translation effects.
For full-year 2005, net new money inflows were CHF 21.3 billion, down slightly from the CHF 23.7 billion recorded in 2004. Although inflows in traditional investments continued to grow, alternative and quantitative investments did not reach the same level as a year earlier.
The gross margin on invested assets for full-year 2005 was 34 basis points, slightly above the 32 basis points of full-year 2004.
Wholesale intermediaryInvested assets were CHF 324 billion on 31 December 2005, up by CHF 67 billion from 31 December 2004. For full-year 2005, the net new money inflow was CHF 28.2 billion com-pared with a CHF 4.5 billion outflow in 2004.
The money market outflow in 2005 was CHF 9.7 billion, compared with CHF 20.6 billion a year earlier. In 2005, this outflow was offset by positive inflows of CHF 37.9 billion, recorded across all traditional asset classes (equities, fixed income, asset allocation).
The 2005 gross margin on invested assets was 40 basis points, up by 4 basis points from a year earlier, reflecting shifts into higher margin asset classes.
Results
Pre-tax profit was CHF 1,057 million, an increase of 91% from 2004. The increase was driven by higher operating in-come, which rose 23%, reflecting strong net new money inflows and a positive market environment that resulted in higher asset valuations. In addition, performance fees, particularly in alternative and quantitative investments, in-creased. Operating expenses decreased, mainly as a result of the discontinuation of goodwill amortization in 2005, which
was partially offset by higher personnel expenses, which rose with the growth of the business.
Operating incomeIn 2005, operating income was CHF 2,487 million, up 23% from CHF 2,022 million a year earlier. The increase reflects strong net new money inflows and a positive market environ-ment resulting in higher asset valuations and consequently higher asset-based income across all businesses. In addition, performance fees, particularly in alternative and quantitative investments, increased significantly. Institutional revenues in-creased by 23% to CHF 1,330 million in 2005 from CHF 1,085 million in 2004, reflecting higher management fees in all ar-eas, and higher performance fees, mainly in alternative and quantitative investments. Wholesale intermediary revenues rose by 23% to CHF 1,157 million in 2005 from CHF 937 mil-lion in 2004, reflecting higher management fees in all areas due to net new money inflows and higher market valuations.
Operating expensesIn 2005, operating expenses decreased to CHF 1,430 million from CHF 1,470 million in 2004, primarily due to the discon-tinuation of goodwill amortization and partially offset by high-er personnel costs, which rose with the growth of the business. Personnel expenses were CHF 988 million in 2005, 11% above 2004. General and administrative expenses increased by 2% to CHF 304 million in 2005 from CHF 299 million in 2004. Net charges from other business units de-creased by CHF 10 million to CHF 116 million in 2005 from CHF 126 million in 2004, partly due to higher charges-out to the wealth management businesses reflecting the higher demand for specialized investment research. Over the same period, depreciation remained virtually unchanged at CHF 21 million, down by only CHF 2 million. There was no amortiza-tion of goodwill in 2005 due to a change in accounting. In 2004, amortization of goodwill totaled CHF 129 million. Amor-tization of intangible assets increased slightly to CHF 1 million due to the acquisition of Siemens’ real estate business.

49
In 2006, the Investment Bank’s pre-tax profit was CHF 5,943 million, up 15% from a year earlier. Revenues increased in all three business areas, particularly in equities and investment banking. This was matched by higher costs, for both personnel and general and administrative expenses, as we continued to expand our range of products and services.
Investment Bank
Financial BusinessesInvestment Bank
Business Group reporting
For the year ended % change from
CHF million 31.12.06 31.12.05 31.12.04 31.12.05
Equities 9,397 6,980 5,906 35
Fixed income, rates and currencies 9,056 7,962 8,269 14
Investment banking 3,273 2,506 1,915 31
Income 21,726 17,448 16,090 25
Adjusted expected credit loss 1 61 36 (7) 69
Total operating income 21,787 17,484 16,083 25
Cash components 9,801 8,065 7,130 22
Share-based components 2 1,552 1,194 1,022 30
Total personnel expenses 11,353 9,259 8,152 23
General and administrative expenses 3,260 2,215 2,538 47
Services (to) / from other business units 956 640 226 49
Depreciation of property and equipment 203 136 243 49
Amortization of goodwill 0 0 278
Amortization of intangible assets 72 53 36 36
Total operating expenses 15,844 12,303 11,473 29
Business Group performance before tax 5,943 5,181 4,610 15
1 In management accounts, adjusted expected credit loss rather than credit loss expense or recovery is reported for the Business Groups (see note 2 to the financial statements). 2 Additionally includes social security contributions and expenses related to alternative investment awards.
Huw Jenkins | Chairman and CEOInvestment Bank

50
Business Group reporting (continued)
As of or for the year ended % change from
CHF million, except where indicated 31.12.06 31.12.05 31.12.04 31.12.05
KPIs
Compensation ratio (%) 1 52.3 53.1 50.7
Cost / income ratio (%) 2 72.9 70.5 71.3
Impaired lending portfolio as a % of total lending portfolio, gross 3 0.1 0.2 0.5
Average VaR (10-day 99% confidence, 5 years of historical data) 420.5 346.4 358.0 21
Capital return and BIS data
Return on allocated regulatory capital (%) 4 29.4 28.6 30.5
BIS risk-weighted assets 174,599 151,313 116,512 15
Goodwill and excess intangible assets 5 5,465 4,309 3,579 27
Allocated regulatory capital 6 22,925 19,440 15,230 18
Additional information
Deferral (included in adjusted expected credit loss) 232 155 85 50
Client assets (CHF billion) 174 164 147 6
Personnel (full-time equivalents) 21,899 18,174 16,970 20
1 Personnel expenses / income. 2 Operating expenses / income. 3 Figures reflect the prime brokerage reclassification as explained in note 1 to the financial statements. 4 Business Group performance before tax / average allocated regulatory capital. 5 Goodwill and intangible assets in excess of 4% of BIS Tier 1 Capital. 6 10% of BIS risk-weighted assets plus goodwill and excess intangible assets.
Components of operating income
The Investment Bank generates operating income from:– commissions on agency transactions and spreads or markups on principal transactions;– fees from debt and equity capital markets transactions, leveraged finance, and the structuring of derivatives and complex trans- actions;– mergers and acquisitions and other advisory fees;– interest income on principal transactions and from the loan portfolio; and
– gains and losses on market making, proprietary, and arbitrage positions.As a result, operating income is affected by movements in market conditions, interest rate swings, the level of trading activity in primary and secondary markets and the extent of merger and acquisition activity. These and other factors have had, and may in the future have, a significant impact on results of operations from year to year.
2006
Key performance indicators
The cost / income ratio rose to 72.9% in 2006 from 70.5% a year earlier. The increase in performance-related personnel expenses and higher general and administrative expenses
was only partly offset by revenue growth in all of our three businesses.
The full-year compensation ratio, at 52.3%, fell 0.8 per-centage points between 2005 and 2006. Higher revenues more than offset higher performance-related compensation and increased staff levels.
60
65
70
75
80
40
46
52
58
64
70
Cost / income ratio
in %
2004 2005 2006
80
75
70
65
65
As reported Adjusted for goodwill and significant financial events
71.370.5
72.9
35
40
45
50
55
40
46
52
58
64
70
Compensation ratio
in %
2004 2005 2006
55
50
45
40
35
As reported Adjusted for goodwill and significant financial events
50.7
53.152.3
Financial BusinessesInvestment Bank

51
Average Value at Risk (VaR – 10-day, 99% confidence, 5 years of historical data) increased to CHF 420 million, up from CHF 346 million in 2005. Year-end VaR was also higher at CHF 473 million, up from CHF 355 million a year earlier, following the integration of Pactual from 1 December 2006.
Total gross lending portfolio at the Investment Bank was CHF 134 billion on 31 December 2006 compared with CHF 97 billion on 31 December 2005, reflecting our expanding prime brokerage and exchange traded derivatives businesses. The gross impaired lending portfolio to total gross lending portfolio ratio fell to 0.1% from 0.2% in the same period.
250
300
350
400
450
Average VaR (10-day, 99% confidence, 5 years of historical data)
CHF million2004 2005 2006
450
400
350
300
250
358346
420
0.0
0.2
0.4
0.6
0.8
Impaired lending portfolio, gross/total lending portfolio, gross1
in %31.12.04 31.12.05 31.12.06
0.8
0.6
0.4
0.2
0.0
0.5
0.2
0.1
1 Figures reflect the prime brokerage reclassification as explained in Note 1 to the financial statements.
0
8
16
24
32
30.528.6 29.4
Return on allocated regulatory capital
in %
2004 2005 2006
32
24
16
8
0
The return on allocated regulatory capital was 29.4% in 2006, up from 28.6% a year earlier, reflecting the increase in profit. Risk-weighted assets grew, mainly driven by higher credit exposures from OTC derivatives, collateral trading and the leveraged finance portfolio, in line with the rise in busi-ness activity. Goodwill and excess intangible assets rose com-pared with last year due to the acquisitions of ABN AMRO’s futures and options business and Pactual.
Results
This was our most profitable year ever. Pre-tax profit in 2006 was CHF 5,943 million, up 15% from 2005. This result was driven by strong revenues in equities (up 35%), due to the improved market conditions starting in second half 2005 and continuing throughout 2006. It was also helped by our investment banking business (up 31%), which saw strong performances across all regions. The increase in fixed in-come, rates and currencies (up 14%) reflects progress in our plan to expand our global syndicated finance, mortgage-backed securities, structured credit and commodities busi-nesses as well as strong revenues in foreign exchange and cash and collateral trading. DRCM‘s business activities managed on behalf of the Investment Bank achieved reve-nues at a level consistent with 2005. We also invested in our IT infrastructure and incurred more professional fees.
Operating incomeTotal operating income in 2006 was CHF 21,787 million, up 25% from CHF 17,484 million a year earlier.
Equities revenues, at CHF 9,397 million in 2006, were up 35% from CHF 6,980 million in 2005. Overall, cash equity revenues were higher, with results benefiting from positive market conditions generating strong revenues in emerging markets. Increased cash commissions were partially offset by greater facilitation requirements from our clients. Revenues in our derivatives business increased globally due to higher business demand. Equity capital markets revenues rose with increased capital raising activities. Prime brokerage services continued to grow as client numbers and balances increased. Exchange-traded derivatives revenues rose, boosted by the
2000
3000
4000
5000
6000
Performance before tax
CHF million
2004 2005 2006
6,000
5,000
4,000
3,000
2,000
As reported 6 Before goodwill and adjusted for significant financial events 7
4,610
5,181
5,943

52
Financial BusinessesInvestment Bank
impact of the acquisition of ABN AMRO’s global futures and options business towards the end of the year. Our proprie-tary as well as our equity-linked businesses contributed also higher returns compared to the previous year.
Fixed income, rates and currencies revenues were CHF 9,056 million, up 14% from CHF 7,962 million a year ear-lier. Revenues in the rates business were up against the pri-or year as a result of higher revenues in energy trading and mortgage backed securities, partially offset by lower in-come from derivatives. Credit fixed income saw strong growth in structured credit and secondary loan activity. Syndicated finance also recorded higher income as the business benefited from increased market activity. Credit default swaps hedging loan exposures recorded a loss of CHF 245 million compared with gains of CHF 103 million a year earlier. While municipal securities revenues were lower in 2006, the foreign exchange and cash collateral trading business, especially the metals business, saw a significant increase in revenues.
Investment banking revenues, at CHF 3,273 million in 2006, increased 31% from CHF 2,506 million a year earlier. This reflected growth in each region, especially in Asia. The debt and equity capital markets groups reported significant gains over the prior year. Our leveraged finance franchise continued to grow, demonstrating our strengthened com-mitment to this part of the business. Revenues from the ad-visory business also increased compared with last year, as clients took advantage of strategic opportunities.
Operating expensesOperating expenses rose by CHF 3,541 million to CHF 15,844 million in 2006, a 29% increase from CHF 12,303 million a year earlier.
Personnel expenses, at CHF 11,353 million in 2006, in-creased 23% from a year earlier, reflecting an increase in the bonus accrual and additional salaries due to higher staff levels. Share-based compensation rose 30% from prior year as a result of higher share awards in 2006, and the increased
fair value of options granted in 2006 – driven by the rise in UBS’s share price.
General and administrative expenses were CHF 3,260 million in 2006, up 47% from 2005’s CHF 2,215 million. In 2006 we recorded a number of new provisions. IT and other outsourcing costs as well as professional fees rose, driven by higher project spending in support of future business growth in fixed income, prime brokerage and emerging markets. Administration, travel and entertainment and, to a lesser ex-tent, occupancy expenses, increased as well. Provision levels in 2006 rose from 2005.
Charges from other business units increased to CHF 956 million in 2006 from CHF 640 million in 2005. The rise reflects the charges by Global Asset Management for man-aging the Investment Bank’s funds invested in DRCM as well as higher charges from ITI (IT infrastructure unit) as a result of the increased levels of staff.
Depreciation rose by 49% to CHF 203 million in 2006 from CHF 136 million in 2005 due to higher IT write-offs, of-fice expansion and renewal costs.
The amortization of intangible assets, at CHF 72 million in 2006, was up 36% from CHF 53 million a year earlier due to the two acquisitions – ABN AMRO’s futures and options business and Pactual.
2005
Key performance indicators
The cost / income ratio fell to 70.5% in 2005 from 71.3% a year earlier. Revenue growth, driven by strong performances in investment banking and equities, was partly offset by higher personnel expenses.
The full-year compensation ratio, at 53.1%, rose 2.4 per-centage points between 2004 and 2005. This reflects higher performance-related compensation and increased staff lev-els. Share-based compensation was also higher, since awards made in 2005 for the 2004 financial year contained an in-creased proportion of stock.
Market risk for the Investment Bank, as measured by the 10-day 99% Value at Risk (VaR), ended the year at CHF 355 million and averaged CHF 346 million for 2005, a slight increase on the 2004 year-end value of CHF 332 million but below the 2004 average of CHF 358 million.
The total gross lending portfolio was CHF 97 billion on 31 December 2005 compared with CHF 78 billion on 31 De-cember 2004, reflecting our expanding prime brokerage and equity finance businesses as well as increased underwriting activity. The gross impaired lending portfolio to total gross lending portfolio ratio fell to 0.2% at the end of 2005 from 0.5% on 31 December 2004.
The return on allocated regulatory capital in 2005 was 28.6%, down 1.9 percentage points from the return of
0
4000
8000
12000
16000
20000
1,9152,506
3,273
9,397
9,056
6,980
7,962
5,906
8,269
(1,602)
Income by business area
CHF million
2004 2005 2006
25,000
20,000
15,000
10,000
5,000
0
Fixed income, rates and currencies Investment banking Equities

53
30.5% a year earlier, despite the growth in pre-tax profit. This reflects the 30% increase in risk-weighted assets which rose due to currency movements and in line with increased lending activity to the Investment Bank’s growing client base.
Results
Pre-tax profit was CHF 5,181 million, up 12% from 2004. The result was driven by strong revenues in investment bank-ing (up 31%) and in equities (up 18%), reflecting our suc-cessful expansion in significant growth areas such as M&A, in particular in Asia Pacific, equity derivatives and prime bro-kerage. Results in the fixed income, rates and currencies business were slightly lower than last year. Lower revenues in structured credit – mainly driven by lower volumes and fol-lowing the turmoil in the automotive sector in second quar-ter 2005 – were offset by an increase in the rates business. At the same time, costs increased as our business continued to expand, partially offset by the cessation of goodwill amor-tization.
Operating incomeTotal operating income in 2005 was CHF 17,484 million, up 9% from CHF 16,083 million a year earlier.
Equities revenues, at CHF 6,980 million in 2005, were up 18% from CHF 5,906 million in 2004. Significant drivers of the increase were the derivatives business in the Asia Pacific region and Europe as well as prime brokerage, where we saw an impressive revenue gain in the US. Our proprietary and equity-linked businesses contributed slightly lower re-turns than the previous year.
Fixed income, rates and currencies revenues were CHF 7,962 million, down 4% from CHF 8,269 million a year earlier. Revenues in the rates business were up against the prior year as a result of rising revenues in energy trading and derivatives. Credit fixed income saw lower revenues in struc-tured credit, notably in the US and in credit trading as well as in the high-yield sector. Credit default swaps hedging loan exposures recorded gains of CHF 103 million compared with losses of CHF 62 million a year earlier.
The foreign exchange business decreased as derivatives trading was negatively impacted by historically low vola-tility levels. This was partially offset by rising cash and col-
lateral trading revenues due to higher market share and volumes.
Investment banking revenues, at CHF 2,506 million in 2005, increased 31% from CHF 1,915 million a year earlier. This reflected growth in each region. Advisory revenues grew significantly, in line with the strong momentum in the M&A business and our increased presence in important transac-tions. During 2005, our Investment Bank advised on a total of 343 transactions with a deal volume of USD 496 billion, more than doubling from a year earlier. Revenues in the capital markets business rose as well, mainly in debt underwriting and in global syndicated finance, reflecting improved market conditions and our strengthened competitive position.
Operating expensesHigher personnel costs and increased allocated costs prompted total operating expenses in 2005 to rise to CHF 12,303 million, a 7% increase from CHF 11,473 million a year earlier.
Personnel expenses, at CHF 9,259 million in 2005, in-creased 14% from a year earlier, reflecting an increase in the bonus accrual and additional salaries from higher staff levels. Share-based compensation rose 17% from prior year due to an increase in share-based awards and the higher UBS share price in 2005 compared with 2004.
General and administrative expenses were CHF 2,215 mil-lion in 2005, down 13% from 2004’s CHF 2,538 million. Provisions were lower than in 2004, when we recorded a civil penalty levied by the Federal Reserve Board relating to our banknote trading business. This was partially offset by an increase in IT and other outsourcing costs. Services from other business units increased to CHF 640 million in 2005 from CHF 226 million in 2004. Depreciation eased 44% to CHF 136 million in 2005 from CHF 243 million in 2004 due to the transfer of further IT infrastructure functions into our central ITI unit in Corporate Center. There was no amortiza-tion of goodwill in 2005, following a change in accounting. In 2004, amortization of goodwill totaled CHF 278 million. Amortization of intangible assets was CHF 53 million in 2005, up 47% from CHF 36 million a year earlier due to the inclusion of the rest of Brunswick and the capital markets division of Charles Schwab, acquired in third quarter 2004, and the purchase of our remaining stake in Prediction, which became part of UBS in 2005.

54
In 2006 Corporate Center recorded a pre-tax loss of CHF 1,083 million, compared with the pre-tax gain of CHF 3,856 million in 2005. The swing between 2005 and 2006 was due to the sale of Private Banks & GAM at the end of 2005. The continuing operations of Corporate Center reported a pre-tax loss of CHF 1,087 million, compared with a loss of CHF 708 million in 2005.
Corporate Center
Financial BusinessesCorporate Center
Business Group reporting
As of or for the year ended % change from
CHF million, except where indicated 31.12.06 31.12.05 31.12.04 31.12.05
Income 294 455 112 (35)
Credit loss (expense) / recovery 1 (61) 232 286
Total operating income 233 687 398 (66)
Cash components 1,133 1,059 728 7
Share-based components 2 131 108 68 21
Total personnel expenses 1,264 1,167 796 8
General and administrative expenses 1,242 1,084 1,077 15
Services (to) / from other business units (1,978) (1,730) (1,509) (14)
Depreciation of property and equipment 783 857 794 (9)
Amortization of goodwill 0 0 1
Amortization of intangible assets 9 17 17 (47)
Total operating expenses 3 1,320 1,395 1,176 (5)
Business Group performance from continuing operations before tax (1,087) (708) (778) (54)
Business Group performance from discontinued operations before tax 4 4,564 396 (100)
Business Group performance before tax (1,083) 3,856 (382)
Additional information
BIS risk-weighted assets 8,969 8,143 9,841 10
Personnel (full-time equivalents) 4,771 3,922 5,202 22
Personnel excluding ITI (full-time equivalents) 1,716 1,370 2,848 25
Personnel for ITI (full-time equivalents) 3,055 2,552 2,354 20
1 In order to show the relevant Business Group performance over time, the adjusted expected credit loss rather than credit loss expense or recovery is reported for all Business Groups. The difference between the adjusted expected credit loss and the credit loss expense or recovery recorded at Group level is reported in the Corporate Center (see note 2 to the financial statements). 2 Additionally includes social security contributions and expenses related to alternative investment awards. 3 Includes expenses for the Chairman's Office (comprising the Company Secretary, Board of Directors and Group Internal Audit).
Clive Standish | UBS Group Chief Financial Officer and Head of the Corporate Center

55
2006
Results
Corporate Center recorded a pre-tax loss from continuing operations of CHF 1,087 million in full-year 2006, compared with a loss of CHF 708 million a year earlier. The increase was mainly driven by a CHF 454 million decline in operating in-come. The main reason for the decrease was the credit loss expense for 2006, which contrasts with the recovery we re-corded in 2005. Additionally, 2006 was negatively impacted by losses from cash flow hedges that were not fully effec-tive.
Operating incomeTotal operating income decreased to CHF 233 million in 2006 from CHF 687 million in 2005. This reflects the credit loss expense recorded this year, which contrasts with the credit recovery we reported a year earlier. It is also a result of lower income from treasury activities.
The credit loss result booked in Corporate Center repre-sents the difference between the adjusted expected credit loss result recorded in the business units and the credit loss expense or recovery recognized in the UBS financial state-ments. In 2006, UBS recorded a credit loss recovery of CHF 156 million, compared to a recovery of CHF 375 million in 2005. In 2006, the adjusted expected credit loss recoveries of CHF 217 million credited to the Business Units exceeded UBS’s credit loss recovery. The difference of CHF 61 million was recorded in Corporate Center as a credit loss expense compared with the recovery of CHF 232 million re-corded in 2005.
Income decreased by CHF 161 million to CHF 294 million in 2006 compared to CHF 455 million in 2005, mainly due to lower real estate gains and losses related to cash flow hedg-ing (that were gains in 2005). This was slightly offset by gains from FX options in 2006.
Operating expensesTotal operating expenses were CHF 1,320 million in 2006, down CHF 75 million from CHF 1,395 million in 2005. At CHF 1,264 million in 2006, personnel expenses were up 8% from CHF 1,167 million in 2005, mainly reflecting the higher personnel numbers in ITI driven by higher business demand and hiring of people to address the growing com-plexity of regulatory requirements. Personnel costs increased due to higher performance-related compensation as well as higher expenses for share-based components as the UBS share price increased compared with 2005. In the same pe-riod, general and administrative expenses increased 15% to CHF 1,242 million from CHF 1,084 million. In ITI, expenses for rent and maintenance of IT equipment, occupancy and communications increased with higher staff levels. Costs also increased as a small portion of the provision for sub-
leasing office space in the US was booked in Corporate Center. Other businesses were charged CHF 1,978 million compared to CHF 1,730 million, reflecting the business driv-en cost increases of UBS’s IT infrastructure. Depreciation of property and equipment decreased to CHF 783 million by CHF 74 million or 9%, as several software components came to the end of their depreciation cycle. Amortization of intan-gible assets was CHF 9 million in 2006, CHF 8 million below the level a year earlier.
IT infrastructure
In 2006, the information technology infrastructure cost per average number of financial business employees was CHF 28,072, up CHF 1,341 from CHF 26,731 in 2005, reflecting the impact of supporting businesses in their growth plans. This was partially offset by cost savings from managing our information technology infrastructure centrally.
2005
Results
Corporate Center’s result from continuing operations was a loss of CHF 708 million in full-year 2005, compared to a loss of CHF 778 million a year earlier. The improvement was driv-en by a CHF 343 million increase in income.
Private Banks & GAM (discontinued operations)The sale of Private Banks & GAM to Julius Baer was com-pleted on 2 December 2005. The disposal gain and the op-erating result realized during the year before the deal closed is reported as pre-tax profit from discontinued operations of CHF 4,564 million in 2005.
Operating incomeTotal operating income increased to CHF 687 million in 2005 from CHF 398 million in 2004. The result was driven by higher revenues, partially offset by lower credit loss recover-ies.
In 2005, the credit loss recovery was CHF 375 million. The adjusted expected credit loss recovery at the Business Unit level was CHF 143 million. This resulted in a credit loss recov-ery in Corporate Center of CHF 232 million.
In 2004, the Group credit loss recovery was CHF 241 mil-lion. The adjusted expected credit loss expense at Business Unit level was CHF 45 million in the same year, resulting in a Corporate Center credit loss recovery of CHF 286 million.
Income increased by CHF 343 million to CHF 455 million in 2005 mainly due to the diversification of capital into US dollars. The higher average equity base produced a positive impact on treasury income, as did a timing effect related to cash flow hedging.

56
Operating expensesTotal operating expenses were CHF 1,395 million in 2005, up CHF 219 million from CHF 1,176 million in 2004. At CHF 1,167 million in 2005, personnel expenses were up 47% from CHF 796 million in 2004, mainly reflecting the further integra-tion of UBS’s IT infrastructure into ITI. The figure was also due to additional hiring and accruals for performance-related com-pensation. In the same period, general and administrative ex-penses increased 1% to CHF 1,084 million from CHF 1,077 million. Lower costs for rent and maintenance of IT equipment in ITI and a release of capital tax accruals were offset by costs incurred for the implementation of new accounting standards and regulatory requirements. Additionally, we saw higher ex-
Financial BusinessesCorporate Center
penses for our brand initiative and corporate real estate. Other businesses were charged CHF 1,730 million compared to CHF 1,509 million, reflecting the further integration of UBS’s IT in-frastructure into ITI. Amortization of intangible assets was CHF 17 million in 2005, at the same level as in 2004.
IT infrastructure
In 2005 the information technology infrastructure cost per average number of financial business employees was CHF 26,731, down CHF 1,600 from CHF 28,331 in 2004, show-ing the positive effects of managing our information tech-nology infrastructure centrally.

Industrial Holdings

58
Industrial Holdings
Industrial Holdings
Income statement
As of or for the year ended % change from
CHF million, except where indicated 31.12.06 31.12.05 31.12.04 31.12.05
Continuing operations
Revenues from Industrial Holdings 693 675 640 3
Other income 301 561 275 (46)
Total operating income 994 1,236 915 (20)
Personnel expenses 202 245 185 (18)
General and administrative expenses 187 184 176 2
Services (to) / from other business units 9 14 20 (36)
Depreciation of property and equipment 18 21 22 (14)
Amortization of goodwill 0 0 27
Amortization of intangible assets 5 4 2 25
Goods and materials purchased 295 283 263 4
Total operating expenses 716 751 695 (5)
Operating profit from continuing operations before tax 278 485 220 (43)
Tax expense 35 175 51 (80)
Net profit from continuing operations 243 310 169 (22)
Discontinued operations
Profit from discontinued operations before tax 852 496 385 72
Tax expense / (benefit) (13) 87 101
Net profit from discontinued operations 865 409 284 111
Net profit 1,108 719 453 54
Net profit / (loss) attributable to minority interests 104 207 93 (50)
from continuing operations 1 (24) (21)
from discontinued operations 103 231 114 (55)
Net profit attributable to UBS shareholders 1,004 512 360 96
from continuing operations 242 334 190 (28)
from discontinued operations 762 178 170 328
Additional information
Private Equity 1
Investments, at cost 2 344 744 1,219 (54)
Unrecognized gains 517 264 467 96
Portfolio fair value 861 1,008 1,686 (15)
Cost / income ratio (%) 3 72.0 60.8 76.0
BIS risk-weighted assets 443 2,035 2,773 (78)
Personnel (full-time equivalents) 4,241 21,636 29,453 (80)
1 Only comprises financial investments available-for-sale. 2 Historical cost of investments made, less divestments and impairments. 3 Operating expenses / operating income.

59
Major participations
Our private equity investments were moved to our Industrial Holdings segment in first quarter 2005, matching our strat-egy of de-emphasizing and reducing exposure to this asset class while capitalizing on orderly exit opportunities as they arise.
The sale of UBS’s 55.6% stake of Motor-Columbus to a consortium of Atel’s Swiss minority shareholders, EOS Hold-ing and Atel, as well as to French utility Electricité de France (EDF), which was included in this segment, was successfully completed on 23 March 2006. The sale price was set at approximately CHF 1,295 million. The disposal gain of CHF 387 million and the operating result of CHF 71 million real-ized during the quarter before the deal closed are reported as discontinued operations after tax. All prior periods have been restated accordingly.
2006
In 2006, the Industrial Holdings segment reported a net profit of CHF 1,108 million, of which CHF 1,004 million was attributable to UBS shareholders.
In 2006, we completed the sale of four fully consolidated investments. The realized divestment gains are presented as discontinued operations for Industrial Holdings. Previous in-come statements have also been restated to reflect these divestments.
In 2006, unconsolidated private equity investments, including those accounted for under the equity method,
recorded total divestment gains of CHF 391 million. The level of financial investments available-for-sale fell to CHF 344 million on 31 December 2006 from CHF 744 million a year earlier due to a number of exits which were partially offset by the funding of existing commitments. The fair value of this part of the portfolio decreased to CHF 861 mil-lion in 2006 from CHF 1,008 million in 2005 reflecting re-valuations and successful divestments. Unfunded commit-ments on 31 December 2006 were CHF 227 million, down from CHF 367 million at the end of December 2005.
2005
In 2005, the Industrial Holdings segment reported a net profit attributable to UBS shareholders of CHF 512 million. In 2005, it completed the sale of four fully consolidated investments. The operating profit or loss and gains on disposal are pre-sented as discontinued operations for Industrial Holdings.
In 2005, unconsolidated private equity investments, including those accounted for under the equity method, recorded total divestment gains of CHF 684 million. The level of financial investments available-for-sale fell to CHF 744 million on 31 December 2005 from CHF 1,219 million a year earlier due to a number of exits which were partially offset by the funding of existing commitments. The fair val-ue of this part of the portfolio decreased to CHF 1,008 mil-lion in 2005 from CHF 1,686 million in 2004. Unfunded commitments on 31 December 2005 were CHF 367 million, down from CHF 769 million at the end of December 2004, primarily due to the exit from one investment.

60

Balance Sheet and Cash Flows

62
16.9 billion, mainly in Europe and the US. The amount of long-term debt issued (including financial liabilities designated at fair value) grew by CHF 40.9 billion to CHF 216.3 billion.
The Due to customers line was up CHF 103.7 billion, mainly reflecting larger time deposits from private clients in our wealth management franchise around the globe and in Switzerland for our retail banking business. Growth from our Investment Bank’s prime brokerage and exchange traded de-rivative business related to the integration of ABN AMRO’s futures and options business.
Repo and securities borrowing / lendingIn 2006, cash collateral on securities borrowed and reverse repurchase agreements increased by CHF 65 billion or 9% to CHF 757 billion, while the sum of securities lent and repos grew by CHF 70 billion or 13% to CHF 609 billion. The in-crease stems primarily from the Investment Bank’s matched book (a repo portfolio comprised of assets and liabilities with equal maturities and equal value, so that the risks substan-tially cancel each other out), and equity securities borrowing activities. Securities lending and repos rose, largely to finance the growth in trading inventory.
Trading portfolioTrading assets increased by CHF 225 billion to CHF 879 billion on 31 December 2006 from CHF 654 billion on 31 December 2005. Increases were registered in debt instruments (up CHF 124 billion), mainly in asset-backed securities in our mortgage trading and securitized products business and in government securities (within the rates business). Assets in cash and col-lateral proprietary trading increased and were mostly pledged to central banks. Equity instruments were up by CHF 52 bil-lion, largely driven by the derivatives business on the back of rising equity markets. Money market paper inventories rose in our fixed income, rates and currencies business by CHF 29 bil-lion. Traded loans rose by CHF 11 billion, mainly in the securi-tization business, while precious metals grew by CHF 8 billion. Over the same period, short trading positions increased by CHF 16 billion to CHF 205 billion.
Replacement valuesIn 2006 positive and negative replacement values declined by CHF 5 billion to CHF 328 billion and CHF 333 billion re-spectively. This was the net result of increases in the Equities business from the integration of ABN Amro’s futures and op-tions business and movements in exchange rates in major currencies, slightly outweighed by the decline in replace-ment values driven by movements in interest rates.
UBS’s total assets stood at CHF 2,396.5 billion on 31 Decem-ber 2006, up from CHF 2,058.3 billion on 31 December 2005. The increase was driven by the growth in the trading portfolio (up CHF 225 billion), collateral trading (up CHF 65 billion) and the loan portfolios (up CHF 33 billion), while positive and negative replacement values each were down CHF 5 billion. Currency movements against the Swiss franc (mainly the 7% depreciation of the US dollar) partially offset the rise. Total li-abilities rose due to higher borrowing (up CHF 241 billion), collateral trading liabilities (up CHF 70 billion) and trading li-abilities (up CHF 16 billion).
Lending and borrowing
LendingCash was CHF 3.5 billion on 31 December 2006, down CHF 1.9 billion from a year earlier, mainly from lower sight de-posit balances held with central banks. At CHF 50.4 billion on 31 December 2006, the Due from banks line increased by CHF 16.8 billion, largely related to the integration of ABN AMRO’s futures and options business, and higher lending by the cash and collateral trading business, which is the central funding instance of the bank. The increase was partially off-set by lower current account balances in Industrial Holdings relating to the divestment of Motor-Columbus at the begin-ning of 2006. Our loans to customers stood at CHF 312.5 billion on 31 December 2006, up by CHF 32.6 billion from a year earlier, reflecting higher mortgage volumes in Switzer-land and increased secured lending, mainly in our interna-tional wealth management businesses. This was further ac-centuated by a substantial increase in the Investment Bank’s secured lending to prime brokerage clients and to a lesser extent by the integration of ABN AMRO’s futures and op-tions business. This was partially offset by lower secured lending balances to US mortgage originators.
BorrowingThe Due to banks line rose by CHF 79.4 billion mainly due to increased time deposits. Major movements in the Investment Bank’s cash and collateral trading activities were related to a shift from repos to uncollateralized borrowing in connection with the funding of Dillon Read Capital Management (DRCM) assets and the accommodation of the firm’s general growth. Further growth was driven by the integration of ABN AMRO’s futures and options business. Total debt issued (including fi-nancial liabilities designated at fair value) increased to CHF 335.8 billion on 31 December 2006, up CHF 57.7 billion from a year earlier. Money market paper issuance increased by CHF
Balance sheet and off-balance sheet
Balance Sheet and Cash FlowsBalance sheet and off-balance sheet

63
Other assets / liabilities Investments in associates decreased by 48%, to CHF 1.5 bil-lion on 31 December 2006, mainly due to the sale of UBS’s stake in Motor-Columbus. Property and equipment was down 27% to CHF 6.9 billion, mainly driven by write-offs, partially offset by new investments. Goodwill and other in-tangible assets, at CHF 14.8 billion on 31 December 2006, rose 10% from a year earlier, reflecting the acquisitions of several businesses during 2006, partially offset by a negative currency impact and the disposal of Motor- Columbus.
EquityAt CHF 49.7 billion on 31 December 2006, equity attribut-able to UBS shareholders increased by CHF 5.7 billion from 2005. The increase reflects the attributable profit of CHF 12.3 billion, partially offset by dividend payments and share repurchases.
Equity attributable to minority interests decreased by 20% to CHF 6.1 billion on 31 December 2006 from CHF 7.6 billion on the same date a year ago, mainly reflecting the new issuance of preferred securities and the sale of Motor-Columbus.
Contractual obligations
The table below summarizes our contractual obligations as of 31 December 2006. All contracts, with the exception of purchase obligations (those where we are committed to purchasing determined volumes of goods and services), are either recognized as liabilities on our balance sheet or, in the case of operating leases, disclosed in note 27 to the Financial Statements.
The following liabilities recognized on the balance sheet are excluded from the table because we do not consider these obligations to be contractual: provisions, current and deferred tax liabilities, liabilities to employees for equity participation plans, settlement and clearing accounts and amounts due to banks and customers.
Within purchase obligations, we have excluded our obli-gation to employees under the mandatory notice period, during which we are required to pay employees contractu-ally agreed salaries.
Contractual obligationsPayment due by period
CHF million Less than 1 year 1–3 years 3–5 years More than 5 years
Long-term debt 37,086 52,263 32,435 84,421
Capital lease obligations 154 324 115 0
Operating leases 1,003 1,919 1,561 4,280
Purchase obligations 712 528 279 103
Other long-term liabilities 419 2,079 39 1,775
Total 39,374 57,113 34,429 90,579
UBS has entered into firm commitments for the acquisi-tion of certain businesses. The terms and conditions of these agreements are disclosed in Note 37 to the Financial State-ments – Business Combinations.
Off-balance sheet arrangements
In the normal course of business, UBS enters into arrange-ments that, under IFRS, are not recognized on the balance sheet and do not affect the income statement. These types of arrangements are kept off-balance sheet as long as they do not become onerous, UBS does not incur an obligation from them or become entitled to a specific asset. As soon as such an obligation is incurred, it is recognized on the balance sheet, with the resulting loss recorded in the income state-ment. It should be noted, however, that the amount recog-nized on the balance sheet does not, in many instances, rep-resent the full loss potential inherent in such arrangements.
For the most part, the arrangements discussed below ei-ther meet the financial needs of customers or offer invest-ment opportunities through entities that are not controlled by UBS. The importance of such arrangements to us, with respect to liquidity, capital resources or market and credit risk support, is minimal. We do not rely on such arrangements as a major source of revenue. They have also not resulted in significant expenses for UBS and we do not expect them to do so in the future. The following paragraphs discuss three distinct areas of off-balance sheet arrangements and any po-tential obligations that may arise from them as of 31 Decem-ber 2006.
GuaranteesIn the normal course of business, we issue various forms of guarantees to support our customers. With the exception of related premiums, these guarantees are kept off-balance sheet unless a provision is needed to cover probable losses. The maximum claim subject to credit risk arising from these guarantees is disclosed in Note 26 to the Financial State-ments. On 31 December 2006 the amount is slightly above the level of a year earlier. Fee income from issuing guaran-tees is not material to our total revenues. Losses incurred under guarantees and income from the release of related provisions were insignificant for each of the last three years.

64
Retained interestsUBS sponsors the creation of Special Purpose Entities (SPEs) that facilitate the securitization of acquired residential and commercial mortgage loans and related securities. We also securitize customers’ debt obligations in transactions that involve SPEs which issue collateralized debt obligations. A typical securitization transaction of this kind would involve the transfer of assets into a trust or corporation in return for beneficial interests in the form of securities. Generally, the beneficial interests are sold to third parties shortly after secu-ritization. We do not provide guarantees or other forms of credit support to these SPEs. Financial assets are no longer reported in our consolidated financial statements once their
risks and rewards are transferred to a third party. For further discussion of our securitization activities, see Note 42.2 to the Financial Statements.
Derivative instruments recorded in equity We have no derivative contracts linked to our own shares that are accounted for as equity instruments. With the ex-ception of physically settled written put options (see Note 1 to the Financial Statements), derivative contracts linked to our shares are accounted for as derivative instruments and are carried at fair value on the balance sheet under positive replacement values or negative replacement values.
Balance Sheet and Cash FlowsBalance sheet and off-balance sheet

65
2006
At end-2006, the level of cash and cash equivalents rose to CHF 136.1 billion, up CHF 45.1 billion from CHF 91.0 billion at end-2005.
Operating activitiesNet cash flow used in operating activities was CHF 4.7 billion in 2006 compared to a cash outflow of CHF 63.2 billion in 2005. Operating cash inflows (before changes in operating assets and liabilities and income taxes paid) totaled CHF 15.3 billion in 2006, an increase of CHF 0.7 billion from 2005. Our net profit decreased by CHF 1.9 billion compared to 2005.
Cash of CHF 98.7 billion was used to fund the net in-crease in operating assets, while a net increase in operating liabilities generated cash inflows of CHF 81.3 billion. The in-crease in cash was used to fund operating assets – in line with the expansion of our business. Payments to tax author-ities were CHF 2.6 billion in 2006, up CHF 0.2 billion from a year earlier.
Investing activitiesInvesting activities generated a cash inflow of CHF 4.4 bil-lion. The net cash inflow for investments in associates and subsidiaries was CHF 2.9 billion. This reflected cash outflows of CHF 3.5 billion for acquisitions, which were more than offset by cash inflows of CHF 6.4 billion relating to them. Purchases of property and equipment totaled CHF 1.8 billion and the net divestment of financial investments available-for-sale was CHF 1.7 billion. Disposals of subsidiaries and as-sociates in 2006 generated a cash inflow of CHF 1.2 billion, mainly due to the sale of Motor-Columbus. In 2005, we saw a net cash outflow from investing activities of CHF 2.4 bil-lion. This was because we acquired new businesses worth CHF 1.5 billion and made CHF 1.6 billion in net purchases of property and equipment. This was only partially offset by disposals of subsidiaries and associates.
Financing activitiesIn 2006, financing activities generated cash flow of CHF 47.4 billion, which were used to finance the expansion of our business activities. This reflected the net issuance of money market paper of CHF 16.9 billion and the issuance of CHF 97.7 billion in long-term debt – the latter significantly out-pacing long-term debt repayments, which totaled CHF 60.0 billion. That inflow was partly offset by outflows attributable to net movements in treasury shares and own equity deriva-
tive activity (CHF 3.6 billion), and dividend payments (CHF 3.2 billion). In 2005, we also had a net cash inflow of CHF 64.5 billion from our financing activities. The difference be-tween the two years was mainly due to a net decrease in is-suance of long-term debt and money market paper by CHF 14.4 billion in 2006.
2005
At end-2005, the level of cash and cash equivalents rose to CHF 91.0 billion, up CHF 3.9 billion from CHF 87.1 billion at end-2004.
Operating activitiesNet cash flow used in operating activities was CHF 63.2 billion in 2005 compared to CHF 24.1 billion in 2004. Op-erating cash inflows (before changes in operating assets and liabilities and income taxes paid) totaled CHF 14.6 bil-lion in 2005, an increase of CHF 3.4 billion from 2004. Our net profit rose by CHF 6.2 billion compared to 2004. Dis-continued operations contributed CHF 3.8 billion which had to be reclassified to cash flow from investing activi-ties.
Cash of CHF 155.5 billion was used to fund the net in-crease in operating assets, while a net increase in operating liabilities generated cash inflows of CHF 80.1 billion. The increase in cash was used to fund operating assets – in line with the expansion of our business. The comparative amounts in 2004 and 2003 were smaller, primarily due to the continuing recovery seen in the financial markets. Pay-ments to tax authorities were CHF 2.4 billion in 2005, up CHF 1.1 billion from a year earlier, reflecting the increase in net profit between 2004 and 2003.
Investing activitiesInvesting activities generated a cash outflow of CHF 2.4 bil-lion, due to our acquisition of new businesses totaling CHF 1.5 billion, increase of purchase of property and equipment of CHF 1.9 billion and net increase of financial investments of CHF 2.5 billion. Disposals of subsidiaries and associates in 2005 generated a cash inflow of CHF 3.2 billion, mainly due to the sale of Private Banks & GAM of CHF 1.9 billion. By contrast, in 2004 we saw a net cash outflow from investing activities of CHF 1.0 billion mainly due to the acquisitions of new businesses of CHF 2.5 billion and a net purchase of property and equipment of CHF 0.5 billion. This was only partially offset by disposals of subsidiaries and associates and net sales of financial investments.
Cash flows
Balance Sheet and Cash FlowsCash Flows
66
Balance Sheet and Cash FlowsCash Flows
Financing activitiesIn 2005, financing activities generated cash flow of CHF 64.5 billion, which was used to finance the expansion of our busi-ness activities. This reflected the net issuance of money mar-ket paper of CHF 23.2 billion and the issuance of CHF 76.3 billion in long-term debt – the latter significantly outpacing long-term debt repayments, which totaled CHF 30.5 billion.
That inflow was partly offset by outflows attributable to net movements in treasury shares and own equity derivative ac-tivity (CHF 2.4 billion), and dividend payments (CHF 3.1 bil-lion). In contrast, in 2004, we also had a net cash inflow of CHF 39.8 billion from our financing activities. The difference between the two years was mainly due to the fact that long-term debt issuance increased by CHF 25.1 billion in 2005.

Accounting Standards and Policies

68
The UBS Financial Statements have been prepared in accor-dance with International Financial Reporting Standards (IFRS). As a US listed company, we also provide a description in Note 42 to the Financial Statements of the significant dif-ferences which would arise were our accounts to be pre-sented under the United States Generally Accepted Account-ing Principles (US GAAP), and a detailed reconciliation of equity attributable to shareholders under IFRS and net profit to US GAAP.
Except where clearly identified, all of UBS’s financial infor-mation presented in this document is presented on a con-solidated basis under IFRS.
Pages 215 to 228 contain the financial statements for the UBS AG Parent Bank – the Swiss company, including branch-es worldwide, which owns all the UBS companies, directly or indirectly. The Parent Bank’s financial statements are pre-pared in order to meet Swiss regulatory requirements and in compliance with Swiss Banking Law. Except in those pages, or where otherwise explicitly stated, all references to “UBS” refer to the UBS Group and not to the Parent Bank.
All references to 2006, 2005 and 2004 refer to the UBS Group and the Parent Bank’s fiscal years ended 31 December 2006, 2005 and 2004. The Financial Statements for the UBS Group and the Parent Bank have been audited by Ernst & Young Ltd.
An explanation of the critical accounting policies applied in the preparation of our financial statements is provided below. The basis of our accounting is given in Note 1 to the Financial Statements.
Standards for management accounting
Our management reporting systems and policies deter-mine the revenues and expenses directly attributable to each business unit. The presentation of the business segments reflects UBS’s organizational structure and management responsibilities. Internal charges and transfer pricing adjust-ments are reflected in the performance of each business unit.
Inter-business unit revenues and expenses. Revenue- sharing agreements are used to allocate external customer revenues to business units on a reasonable basis. Inter-busi-ness unit charges are reported in the line “Services to / from other Business Units” for both Business Units concerned.
Transactions between Business Units are conducted at inter-nally agreed transfer prices or at arm’s length. Corporate Center expenses are allocated to the operating Business Units to the extent appropriate.
Net interest income is allocated to the Business Units based on their balance sheet positions. Assets and liabilities of the financial businesses are funded through and invested with the central treasury departments, with the net margin reflected in the results of each Business Unit. To complete the allocation, the financial businesses are credited with a risk-free return on their regulatory capital requirements add-ing goodwill and excess intangible assets (see below).
Commissions are credited to the Business Unit with the corresponding customer relationship, with revenue-sharing agreements for the allocation of customer revenues where several business units are involved in value creation.
For internal management reporting purposes and in the results discussion, we measure credit loss using an expected loss concept. Expected credit loss reflects the average an-nual costs that are expected to arise from positions in the current portfolio that become impaired. The adjusted expected credit loss reported for each Business Group is the expected credit loss on its portfolio plus the difference be-tween credit loss expense and expected credit loss, amor-tized over a three-year period (shown as ‘deferral’ in the table). The difference between the sum of these adjusted expected credit loss figures, which are charged to the Busi-ness Groups or Units, and the credit loss expense recorded at Group level for financial reporting purposes is reported in Corporate Center. The table on the next page shows the adjusted expected credit loss charged to the Business Groups.
Regulatory capital requirements for the Business Units are defined as 10% of BIS risk-weighted assets. To measure cap-ital consumption of the Business Units, we adjust regulatory capital for the goodwill and excess intangible assets allo-cated. Return on allocated regulatory capital is a key perfor-mance indicator for the Investment Bank and the Business Banking Switzerland unit.
The levels of personnel are expressed in terms of full-time equivalents (FTE) and measured as a percentage of the standard hours normally worked by permanent full-time staff. The FTE level cannot exceed 1.0 for any individual. Per-sonnel includes all staff and trainees other than contractors.
Accounting Standards and PoliciesAccounting principles
Accounting principles

69
Credit loss result recorded at Business Group / Unit level
CHF million Global Wealth Management & Business Banking Investment Bank UBS total
For the year ended 31.12.06
Wealth ManagementInternational &
SwitzerlandWealth
Management USBusiness Banking
Switzerland
Expected credit loss (78) (8) (327) (171) (584)
Deferral 49 8 512 232 801
Adjusted expected credit loss (29) 0 185 61 217
Credit loss (expense) / recovery 1 (1) 109 47 156
Balancing item recorded as credit loss (expense) / recovery in Corporate Center (61)

70
Valuation models are used primarily to value derivatives transacted in the over-the-counter market, including credit derivatives, and unlisted securities with embedded deriva-tives. All valuation models are validated before they are used as a basis for financial reporting, and periodically reviewed thereafter, by qualified personnel independent of the area that created the model. Wherever possible, we compare valuations derived from models with quoted prices of similar financial instruments, and with actual values when realized, in order to further validate and calibrate our models.
A variety of factors are incorporated into our models, including actual or estimated market prices and rates, such as time value and volatility, and market depth and liquidity. Where available, we use market observable prices and rates derived from market verifiable data. Where such factors are not market observable, changes in assumptions could affect the reported fair value of financial instruments. We apply our models consistently from one period to the next, ensuring comparability and continuity of valuations over time, but estimating fair value inherently involves a significant degree of judgment. Management therefore establishes valuation adjustments to cover the risks associated with the estimation of unobservable input parameters and the assumptions within the models themselves. Valuation adjustments are also made to reflect such elements as deteriorating creditworthiness (in-cluding country-specific risks), concentrations in specific types of instruments and market risk factors (interest rates, curren-cies etc), and market depth and liquidity. Although a signifi-cant degree of judgment is, in some cases, required in estab-lishing fair values, management believes that the fair values recorded in the balance sheet and the changes in fair values recorded in the income statement are prudent and reflective of the underlying economics, based on our established fair value and model governance policies and the related controls and procedural safeguards we employ. Nevertheless, for valu-ations derived from models we have estimated the effect that a change in assumptions to reasonably possible alternatives could have on fair values where inputs are not market observ-able. To estimate that effect on the Financial Statements, we recalculated the model valuation adjustments at higher and lower confidence levels than originally applied. A similar ap-proach was used for valuations other than those based on models. For all financial instruments carried at fair value which rely on assumptions for their valuation, we estimate that fair value could lie in a range from CHF 1,038 million lower to CHF 955 million higher than the fair values recognized in the Financial Statements. In 2005 the estimate of that range was CHF 1,094 million lower to CHF 1,176 million higher than the amounts recognized on the balance sheet.
Basis of preparation and selection of policies
We prepare our Financial Statements in accordance with IFRS, and provide a reconciliation to generally accepted ac-counting principles in the United States (US GAAP). The ap-plication of certain of these accounting principles requires considerable judgment based upon estimates and assump-tions that involve significant uncertainty at the time they are made. Changes in assumptions may have a significant im-pact on the Financial Statements in the periods where as-sumptions are changed. Accounting treatments where sig-nificant assumptions and estimates are used are discussed in this section, as a guide to understanding how their appli-cation affects our reported results. A broader and more de-tailed description of the accounting policies we employ is shown in Note 1 to the Financial Statements.
The application of assumptions and estimates means that any selection of different assumptions would cause our re-ported results to differ. We believe that the assumptions we have made are appropriate, and that our Financial Statements therefore present our financial position and results fairly, in all material respects. The alternative outcomes discussed below are presented solely to assist the reader in understanding our Financial Statements, and are not intended to suggest that other assumptions would be more appropriate.
Many of the judgements we make when applying ac-counting principles depend on an assumption, which we be-lieve to be correct, that UBS maintains sufficient liquidity to hold positions or investments until a particular trading strat-egy matures – i.e. that we do not need to realize positions at unfavorable prices in order to fund immediate cash needs. Liquidity is discussed in more detail in the Treasury Manage-ment chapter of the Handbook 2006 / 2007.
Fair value of financial instruments
Financial assets and financial liabilities in our trading port-folio, financial assets and liabilities designated at fair value and derivative instruments are recorded at fair value on the balance sheet, with changes in fair value recorded in net trading income in the income statement. Key judgments af-fecting this accounting policy relate to how we determine fair value for such assets and liabilities.
Where no active market exists, or where quoted prices are not otherwise available, we determine fair value using a variety of valuation techniques. These include present value methods, models based on observable input parameters, and models where some of the input parameters are unob-servable.
Critical accounting policies
Accounting Standards and PoliciesCritical accounting policies

71
Recognition of deferred Day 1 profit and loss
A closely related issue to determining fair value of financial instruments is the recognition of deferred Day 1 profit and loss. We have entered into transactions, some of which will mature in the long term, where we determine fair value using valuation models for which not all inputs are market observable prices or rates. We initially recognize such a fi-nancial instrument at the transaction price, which is the best indicator of fair value, although the value obtained from the relevant valuation model may differ. Such a difference be-tween the transaction price and the model value is com-monly referred to as "Day 1 P / L". We do not immediately recognize that initial difference, usually a gain, in profit and loss because the applicable accounting literature prohibits immediate recognition of Day 1 profit. The accounting litera-ture does not, however, address its subsequent recognition prior to the time when fair value can be determined using market observable inputs or by reference to prices for similar instruments in active markets. It also does not address sub-sequent measurement of these instruments and recognition of subsequent fair value changes indicated by the model.
Our decisions regarding recognizing deferred Day 1 profit are made after careful consideration of facts and circum-stances to ensure we do not prematurely release a portion of the deferred profit to income. For each transaction, we de-termine, individually, the appropriate method of recognizing the Day 1 profit amount in the income statement. It may be amortized over the life of the transaction, or deferred until fair value can be determined using market observable in-puts, or realized through settlement. In all instances, any un-recognized Day-1 profit is immediately released to income if fair value of the financial instrument in question can be de-termined either by using market observable model inputs or by reference to a quoted price for the same product in an active market.
Changes in fair value after Day 1 resulting from changes in observable parameters or otherwise indicated by the mod-el are recognized immediately in the income statement inde-pendently of the release of deferred Day 1 profits.
Special Purpose Entities and securitizations
UBS sponsors the formation of Special Purpose Entities (SPEs) primarily to allow clients to hold investments in separate legal entities, to allow clients to jointly invest in alternative assets, for asset securitization transactions, and for buying or selling credit protection. In accordance with IFRS we do not consolidate SPEs that we do not control. In order to deter-mine whether we control an SPE or not, we have to make judgments about risks and rewards and assess our ability to make operational decisions for the SPE in question. In many instances, elements are present that, considered in isolation, indicate control or lack of control over an SPE, but when
considered together make it difficult to reach a clear conclu-sion. When assessing whether we have to consolidate an SPE we evaluate a range of factors, including whether (a) the activities of the SPE are being conducted on our behalf ac-cording to our specific business needs so that we obtain the benefits from the SPE’s operations, or (b) we have decision-making powers to obtain the majority of the benefits of the activities of the SPE, or UBS has delegated these decision-making powers by setting up an autopilot mechanism, or (c) we have the rights to obtain the majority of the benefits of the activities of an SPE and therefore may be exposed to risks arising from the activities of the SPE, or (d) we retain the majority of the residual or ownership risks related to the SPE or its assets in order to obtain the benefits from its activities. We consolidate an SPE if our assessment of the relevant fac-tors indicates that we control the SPE.
SPEs used to allow clients to hold investments are struc-tures that allow one or more clients to invest in an asset or set of assets, which are generally purchased by the SPE in the open market and not transferred from UBS. The risks and rewards of the assets held by the SPE reside with the clients. Typically, UBS will receive service and commission fees for creation of the SPE, or because it acts as investment man-ager, custodian or in some other function. Many of these SPEs are single-investor or family trusts while others allow a broad number of investors to invest in a diversified asset base through a single share or certificate. These latter SPEs range from mutual funds to trusts investing in real estate. The majority of our SPEs are created for client investment purposes and are not consolidated.
SPEs used to allow clients to jointly invest in alternative assets, e.g. feeder funds, for which generally no active mar-kets exist, are often in the form of limited partnerships. Investors are the limited partners and contribute all or the majority of the capital, whereas UBS serves as the general partner. In that capacity, UBS is the investment manager and has sole discretion about investment and other administra-tive decisions, but has no or only a nominal amount of capi-tal invested. UBS typically receives service and commission fees for its services as general partner, but does not, or only to a minor extent, participate in the risks and rewards of the vehicle, which reside with the limited partners. In most in-stances, limited partnerships are not consolidated under IFRS because UBS’s legal and contractual rights and obligations indicate that UBS does not have the power to govern the financial and operating policies of these entities and concur-rently does not have the objective of obtaining benefits from its activities through such power.
SPEs used for securitization. SPEs for securitization are created when UBS has assets (for example a portfolio of loans) which it sells to an SPE, and the SPE in turn sells inter-ests in the assets as securities to investors. Consolidation of these SPEs depends mainly on whether UBS retains the ma-jority of the benefits or risks of the assets in the SPE.

72
Accounting Standards and PoliciesCritical accounting policies
We do not consolidate SPEs for securitization if UBS has no control over the assets and no longer retains any signifi-cant exposure (for gain or loss) to the income or investment returns on the assets sold to the SPE or the proceeds of their liquidation. This type of SPE is a bankruptcy remote entity – if UBS were to go bankrupt the holders of the securities would clearly be owners of the asset, while if the SPE were to go bankrupt the securities holders would have no re-course to UBS.
SPEs for credit protection are set up to allow UBS to sell the credit risk on portfolios, which may or may not be held by UBS, to investors. They exist primarily to allow UBS to have a single counterparty (the SPE), which sells credit pro-tection to UBS. The SPE in turn has investors who provide it with capital and participate in the risks and rewards of the credit events that it insures. SPEs used for credit protection are generally consolidated.
Allowances and provisions for credit losses
Financial assets accounted for at amortized cost are assessed for objective evidence of impairment and required allowan-ces are estimated in accordance with IAS 39. Impairment exists if the book value of a claim or a portfolio of claims exceeds the present value of the cash flows actually expect-ed in future periods. These cash flows include scheduled in-terest payments, principal repayments, or other payments due (for example from guarantees), including liquidation of collateral where available.
The total allowance for recognized financial assets and credit loss provision for off-balance sheet obligations con-sists of two components: specific counterparty allowances and provisions, and collectively assessed allowances and pro-visions. The specific counterparty component applies to claims evaluated individually for impairment and is based upon management’s best estimate of the present value of the cash flows which are expected to be received. In estimat-ing these cash flows, management makes judgments about a counterparty’s financial situation and the net realizable value of any underlying collateral or guarantees in our favor. Each impaired financial asset is assessed on its merits, and the workout strategy and estimate of cash flows considered recoverable are independently approved by the Credit Risk Control function. Collectively assessed credit loss allowances and provisions cover credit losses inherent in portfolios of claims with similar economic characteristics where there is objective evidence to suggest that they contain impaired claims but the individual impaired items cannot yet be identi-fied. In assessing the need for collective loan loss allowances and provisions, management considers factors such as credit quality, portfolio size, concentrations, and economic factors. In order to estimate the required allowance or provision, we
make assumptions both to define the way we model inher-ent losses and to determine the required input parameters, based on historical experience and current economic condi-tions.
The accuracy of the allowances and provisions we make depends on how well we estimate future cash flows for spe-cific counterparty allowances and provisions and the model assumptions and parameters used in determining collective allowances and provisions. While this necessarily involves judgment, we believe that our allowances and provisions are reasonable and supportable.
Further details on this subject are given in Note 1a10) to the Financial Statements and in the Risk Management chap-ter of the Handbook 2006 / 2007.
Equity compensation
IFRS 2, Share-based Payments, addresses the accounting for share-based employee compensation and was adopted by UBS on 1 January 2005 on a fully retrospective basis. The effect of applying IFRS 2 is disclosed in Note 1b) to the Finan-cial Statements, and further information on UBS equity com-pensation plans, including inputs used to determine the fair value of options, is disclosed in Note 32.
IFRS 2 requires that share options awarded to employees are recognized as compensation expense based on their fair value at grant date. The share options we issue to our em-ployees have features that make them incomparable to op-tions on our shares traded in active markets. Accordingly, we cannot determine fair value by reference to a quoted market price, but we rather estimate it using an option valuation model. The model, a Monte Carlo simulation, requires inputs such as interest rates, expected dividends, volatility measures and specific employee exercise behavior patterns based on statistical data.
Some of the model inputs we use are not market-observ-able and have to be estimated or derived from available data. Use of different estimates would produce different op-tion values, which in turn would result in higher or lower compensation expense recognized.
Several recognized models for the valuation of options exist but none can be singled out as the best or most correct. The model we apply has been selected because it is able to handle some of the specific features included in the options granted to our employees. If we were to use a different model, the option values produced would be different, even if we used the same inputs.
Using both different inputs and a different valuation model could have a significant impact on the fair value of employee share options, which could be either higher or lower than the values produced by the model we apply and the inputs we have used.

Financial Statements

74
Financial StatementsTable of Contents
Financial StatementsTable of Contents
Management’s Report on Internal Controls over Financial Reporting 77
Report of Independent Registered Public Accounting
Firm – Internal Control over Financial Reporting 78
Report of the Group Auditors 80
Financial Statements 82
Income Statement 82
Balance Sheet 83
Statement of Changes in Equity 84
Statement of Recognized Income and Expense 85
Statement of Cash Flows 86

75
Notes to the Financial Statements 88
1 SummaryofSignificantAccountingPolicies 88
2a Segment Reporting by Business Group 105
2b Segment Reporting by Geographic Location 112
Income Statement 113
3 Net Interest and Trading Income 113
4 Net Fee and Commission Income 114
5 Other Income 115
6 PersonnelExpenses 115
7 GeneralandAdministrativeExpenses 115
8 EarningsperShare(EPS)andSharesOutstanding 116
Balance Sheet: Assets 117
9 FinancialAssetsDesignatedatFairValue 117
10a DuefromBanksandLoans 118
10b AllowancesandProvisionsforCreditLosses 119
10c ImpairedDuefromBanksandLoans 119
10d Non-PerformingDuefromBanksandLoans 120
11 Securities Borrowing, Securities Lending,
RepurchaseandReverseRepurchaseAgreements 120
12 TradingPortfolio 121
13 FinancialInvestmentsAvailable-for-Sale 122
14 InvestmentsinAssociates 124
15 PropertyandEquipment 125
16 GoodwillandOtherIntangibleAssets 126
17 OtherAssets 127

76
Balance Sheet: Liabilities 128
18 DuetoBanksandCustomers 128
19 FinancialLiabilitiesDesignatedatFairValueandDebtIssued 128
20 Other Liabilities 130
21 Provisions 130
22 Income Taxes 131
23 DerivativeInstrumentsandHedgeAccounting 133
Off-Balance Sheet Information 139
24 PledgeableOff-BalanceSheetSecurities 139
25 Fiduciary Transactions 139
26 Commitments and Contingent Liabilities 140
27 Operating Lease Commitments 142
Additional Information 143
28 PledgedAssets 143
29 FinancialInstrumentsRiskPosition 143
30 FairValueofFinancialInstrumentsand
ContinuedRecognitionofTransferredFinancialAssets 154
31 PensionandOtherPost-RetirementBenefitPlans 159
32 EquityParticipationandOtherCompensationPlans 165
33 RelatedParties 169
34 Post–BalanceSheetEvents 171
35 SignificantSubsidiariesandAssociates 172
36 InvestedAssetsandNetNewMoney 176
37 Business Combinations 177
38 DiscontinuedOperations 183
39 Currency Translation Rates 185
40 SwissBankingLawRequirements 186
41 ReconciliationtoUSGAAP 187
42 AdditionalDisclosuresRequiredunderUSGAAPandSECRules 201
Financial StatementsTable of Contents

77
Management’s report on internal control over financial reporting
TheBoardofDirectorsandmanagementofUBSAG(UBS)are responsible for establishing and maintaining adequate internalcontroloverfinancialreporting.UBS’sinternalcon-troloverfinancial reporting isdesigned toprovide reason-able assurance regarding the preparation and fair presenta-tion of published financial statements in accordancewithInternationalFinancialReportingStandards(IFRS)includingareconciliation of net profit and equity attributable to UBSshareholderstoUSGenerallyAcceptedAccountingPrinciples(USGAAP).UBS’s internal control over financial reporting includes
those policies and procedures that:– Pertaintothemaintenanceofrecordsthat,inreasonabledetail,accuratelyandfairlyreflecttransactionsanddispo-sitions of assets;
– Provide reasonable assurance that transactions are re-corded as necessary to permit preparation and fair pre-sentationoffinancial statements,and that receiptsandexpenditures of the company are being made only in ac-cordance with authorizations of UBS management; and
– Provide reasonable assurance regarding prevention ortimely detection of unauthorized acquisition, use or dis-positionofthecompany’sassetsthatcouldhaveamate-rialeffectonthefinancialstatements.
Becauseof its inherent limitations, internalcontroloverfi-nancialreportingmaynotpreventordetectmisstatements.Also,projectionsofanyevaluationofeffectivenesstofutureperiods are subject to the risk that controls may become inadequate because of changes in conditions, or that the
degree of compliance with the policies or procedures may deteriorate.UBS management assessed the effectiveness of UBS’s
internalcontroloverfinancialreportingasofDecember31,2006 based on the criteria set forth by the Committee of Sponsoring Organizations of the Treadway Commission (COSO)inInternalControl-IntegratedFramework.Basedonthis assessment,managementbelieves that, as ofDecem- ber31,2006,UBS’sinternalcontroloverfinancialreportingwaseffective.TheauditedconsolidatedfinancialstatementsofUBSin-
clude the results of BancoUBS Pactual S.A. but manage-ment’s assessment does not include an assessment of theinternalcontroloverfinancialreportingofthisentitybecauseitwasacquiredonDecember1,2006. This approach is con-sistent with published SEC guidance on the permissible scopeofmanagement’sinternalcontrolreport.Thefinancialstatementsforthisentityreflecttotalassetsandoperatingincome constituting less than 1% of the related consolidated financial statementamountsasofand for theyearendedDecember31,2006.Management’sassessmentof theeffectivenessofUBS’s
internalcontroloverfinancialreportingasofDecember31,2006hasbeenauditedbyErnst&YoungLtd,UBS’sindepen-dentregisteredpublicaccountingfirm,asstatedintheirre-port appearing on page 78, which expressed unqualifiedopinionsonmanagement’sassessmentandontheeffective-nessofUBS’sinternalcontroloverfinancialreportingasofDecember31,2006.
Financial StatementsManagement’sreportoninternalcontroloverfinancialreporting

78
Financial StatementsReportofIndependentRegisteredPublicAccounting Firm–InternalControloverFinancialReporting

79

80
Financial StatementsReportoftheGroupAuditors

81

82
Financial Statements
Financial Statements
Income Statement
For the year ended % change from
CHF million, except per share data Note 31.12.06 31.12.05 31.12.04 31.12.05
Continuing operations
Interest income 3 87,401 59,286 39,228 47
Interest expense 3 (80,880) (49,758) (27,484) 63
Net interest income 3 6,521 9,528 11,744 (32)
Credit loss (expense) / recovery 156 375 241 (58)
Net interest income after credit loss expense 6,677 9,903 11,985 (33)
Net fee and commission income 4 25,881 21,436 18,506 21
Net trading income 3 13,318 7,996 4,902 67
Other income 5 1,596 1,122 853 42
Revenues from industrial holdings 693 675 640 3
Total operating income 48,165 41,132 36,886 17
Personnel expenses 6 23,671 20,148 17,891 17
General and administrative expenses 7 8,116 6,632 6,563 22
Depreciation of property and equipment 15 1,263 1,261 1,284 0
Amortization of goodwill 16 0 0 673
Amortization of other intangible assets 16 153 131 170 17
Goods and materials purchased 295 283 263 4
Total operating expenses 33,498 28,455 26,844 18
Operating profit from continuing operations before tax 14,667 12,677 10,042 16
Tax expense 22 2,786 2,471 2,155 13
Net profit from continuing operations 11,881 10,206 7,887 16
Discontinued operations
Operating profit from discontinued operations before tax 38 856 5,060 781 (83)
Tax expense / (benefit) 22 (13) 576 198
Net profit from discontinued operations 869 4,484 583 (81)
Net profit 12,750 14,690 8,470 (13)
Net profit attributable to minority interests 493 661 454 (25)
from continuing operations 390 430 340 (9)
from discontinued operations 103 231 114 (55)
Net profit attributable to UBS shareholders 12,257 14,029 8,016 (13)
from continuing operations 11,491 9,776 7,547 18
from discontinued operations 766 4,253 469 (82)
Earnings per share
Basic earnings per share (CHF) 8 6.20 6.97 3.89 (11)
from continuing operations 5.81 4.85 3.66 20
from discontinued operations 0.39 2.12 0.23 (82)
Diluted earnings per share (CHF) 8 5.95 6.68 3.70 (11)
from continuing operations 5.58 4.66 3.49 20
from discontinued operations 0.37 2.02 0.21 (82)

83
Balance Sheet
% change from
CHF million Note 31.12.06 31.12.05 31.12.05
Assets
Cash and balances with central banks 3,495 5,359 (35)
Due from banks 10 50,426 33,644 50
Cash collateral on securities borrowed 11 351,590 288,435 22
Reverse repurchase agreements 11 405,834 404,432 0
Trading portfolio assets 12 627,036 499,297 26
Trading portfolio assets pledged as collateral 12 251,478 154,759 62
Positive replacement values 23 328,445 333,782 (2)
Financial assets designated at fair value 9 5,930 1,153 414
Loans 10 312,521 279,910 12
Financial investments available-for-sale 13 8,937 6,551 36
Accrued income and prepaid expenses 10,361 8,918 16
Investments in associates 14 1,523 2,956 (48)
Property and equipment 15 6,913 9,423 (27)
Goodwill and other intangible assets 16 14,773 13,486 10
Other assets 17, 22 17,249 16,243 6
Total assets 2,396,511 2,058,348 16
Liabilities
Due to banks 18 203,689 124,328 64
Cash collateral on securities lent 11 63,088 59,938 5
Repurchase agreements 11 545,480 478,508 14
Trading portfolio liabilities 12 204,773 188,631 9
Negative replacement values 23 332,533 337,663 (2)
Financial liabilities designated at fair value 19 145,687 117,401 24
Due to customers 18 570,565 466,907 22
Accrued expenses and deferred income 21,527 18,791 15
Debt issued 19 190,143 160,710 18
Other liabilities 20, 21, 22 63,251 53,837 17
Total liabilities 2,340,736 2,006,714 17
Equity
Share capital 211 871 (76)
Share premium 9,870 9,992 (1)
Net income recognized directly in equity, net of tax 815 (182)
Revaluation reserve from step acquisitions, net of tax 38 101 (62)
Retained earnings 49,151 44,105 11
Equity classified as obligation to purchase own shares (185) (133) (39)
Treasury shares (10,214) (10,739) 5
Equity attributable to UBS shareholders 49,686 44,015 13
Equity attributable to minority interests 6,089 7,619 (20)
Total equity 55,775 51,634 8
Total liabilities and equity 2,396,511 2,058,348 16

84
Financial Statements
Statement of Changes in Equity
For the year ended
CHF million 31.12.06 31.12.05 31.12.04
Share capitalBalance at the beginning of the year 871 901 946
Issue of share capital 1 2 2
Capital repayment by par value reduction (631)Cancellation of second trading line treasury shares (30) (32) (47)
Balance at the end of the year 211 871 901
Share premiumBalance at the beginning of the year 9,992 9,231 7,595
Premium on shares issued and warrants exercised 46 36 70
Net premium / (discount) on treasury share and own equity derivative activity (271) (309) (20)
Employee share and share options plans (508) 768 1,244
Tax benefits from exercise of employee share options 611 266 342
Balance at the end of the year 9,870 9,992 9,231
Net income recognized directly in equity, net of taxForeign currency translationBalance at the beginning of the year (432) (2,520) (1,694)
Movements during the year (1,186) 2,088 (826)
Subtotal – balance at the end of the year 1 (1,618) (432) (2,520)
Net unrealized gains / (losses) on financial investments available-for-sale, net of taxBalance at the beginning of the year 931 761 399
Net unrealized gains / (losses) on financial investments available-for-sale 2,574 463 501
Impairment charges reclassified to the income statement 19 96 192
Realized gains reclassified to the income statement (649) (396) (353)
Realized losses reclassified to the income statement 1 7 22
Subtotal – balance at the end of the year 2,876 931 761
Changes in fair value of derivative instruments designated as cash flow hedges, net of taxBalance at the beginning of the year (681) (322) (144)
Net unrealized gains / (losses) on the revaluation of cash flow hedges 1 (474) (223)
Net unrealized (gains) / losses reclassified to the income statement 237 115 45
Subtotal – balance at the end of the year (443) (681) (322)
Balance at the end of the year 815 (182) (2,081)
Revaluation reserve from step acquisitions, net of taxBalance at the beginning of the year 101 90
Movements during the year (63) 11 90
Balance at the end of the year 38 101 90
Retained earningsBalance at the beginning of the year 44,105 36,692 35,951
Net profit attributable to UBS shareholders for the year 12,257 14,029 8,016
Dividends paid 2 (3,214) (3,105) (2,806)
Cancellation of second trading line treasury shares (3,997) (3,511) (4,469)
Balance at the end of the year 49,151 44,105 36,692
Equity classified as obligation to purchase own sharesBalance at the beginning of the year (133) (96) (49)
Movements during the year (52) (37) (47)
Balance at the end of the year (185) (133) (96)
Treasury sharesBalance at the beginning of the year (10,739) (11,105) (9,654)
Acquisitions (8,314) (8,375) (9,368)
Disposals 4,812 5,198 3,401
Cancellation of second trading line treasury shares 4,027 3,543 4,516
Balance at the end of the year (10,214) (10,739) (11,105)
Equity attributable to UBS shareholders 49,686 44,015 33,6321 Net of CHF 83 million, CHF (292) million and CHF 236 million of related taxes for the years ended 2006, 2005 and 2004 respectively. 2 Dividends of CHF 1.60 per share, CHF 1.50 per share and CHF 1.30 per share were paid on 24 April 2006, 26 April 2005 and 20 April 2004, respectively.

85
Statement of Changes in Equity (continued)
For the year ended
CHF million 31.12.06 31.12.05 31.12.04
Equity attributable to minority interestsBalance at the beginning of the year 7,619 5,426 3,879
Issuance of preferred securities 1,219 1,539
Other increases 131 44 1,922
Decreases and dividend payments (3,191) (595) (523)
Foreign currency translation (182) 544 (306)
Minority interest in net profit 493 661 454
Balance at the end of the year 6,089 7,619 5,426
Total equity 55,775 51,634 39,058
Shares issuedFor the year ended % change from
Number of shares 31.12.06 31.12.05 31.12.04 31.12.05
Balance at the beginning of the year 2,177,265,044 2,253,716,354 2,366,093,528 (3)
Issue of share capital 2,208,242 3,418,878 6,586,826 (35)
Cancellation of second trading line treasury shares (74,200,000) (79,870,188) (118,964,000) 7
Balance at the end of the year 2,105,273,286 2,177,265,044 2,253,716,354 (3)
Treasury sharesFor the year ended % change from
Number of shares 31.12.06 31.12.05 31.12.04 31.12.05
Balance at the beginning of the year 208,519,748 249,326,620 273,482,454 (16)
Acquisitions 117,160,339 156,436,070 192,278,008 (25)
Disposals (87,004,388) (117,372,754) (97,469,842) 26
Cancellation of second trading line treasury shares (74,200,000) (79,870,188) (118,964,000) 7
Balance at the end of the year 164,475,699 208,519,748 249,326,620 (21)
InJuly2006,UBSmadeadistributionofCHF0.60persharetoshareholderswhichreducedtheparvalueofUBSsharesfromCHF0.80toCHF0.20pershare.Atthesametime,UBSsplit its share2-for-1, resulting inanewparvalueofCHF0.10pershare.During theyeara totalof74,200,000sharesacquired
underthesecondtradinglinebuybackprogram2005werecancelled.Outof the totalnumberof164,475,699 trea-sury shares, 22,600,000 shares (CHF 1,615million) havebeenrepurchasedforcancellation.TheBoardofDirectorswill propose to theAnnualGeneralMeeting on 18April2007 to reduce the outstanding number of shares and the
share capital by the number of shares purchased for cancel-lation.On31December2006,amaximumof1,437,410shares
can be issued against the future exercise of options from former PaineWebber employeeoptionplans. These sharesareshownasconditionalsharecapitalintheUBSAG(ParentBank)disclosure.Inaddition,during2006,shareholdersap-provedthecreationofconditionalcapitalofuptoamaxi-mum of 150 million shares to fund UBS's employee share optionprograms.Asof31December2006,noshareshavebeenissuedunderthisprogram.Allissuedsharesarefullypaid.
Statement of Recognized Income and Expense
For the year ended 31.12.06 31.12.05 31.12.04
Attributable to
Total
Attributable to
Total
Attributable to
TotalCHF million
UBS share-
holdersminority interests
UBS share-
holdersminority interests
UBS share-
holdersminority interests
Net unrealized gains / (losses) on financial investments available-for-sale, before tax 2,610 9 2,619 152 (58) 94 444 79 523
Change in fair value of derivative instruments designated as cash flow hedges, before tax 332 0 332 (479) 0 (479) (238) 0 (238)
Foreign currency translation (1,186) (21) (1,207) 2,088 62 2,150 (826) (184) (1,010)
Tax on items transferred to / (from) equity (759) 0 (759) 138 0 138 (50) 0 (50)
Net income recognized directly in equity 997 (12) 985 1,899 4 1,903 (670) (105) (775)
Net income recognized in the income statement 12,257 493 12,750 14,029 661 14,690 8,016 454 8,470
Total recognized income and expense 13,254 481 13,735 15,928 665 16,593 7,346 349 7,695

86
Financial Statements
Statement of Cash Flows
For the year ended
CHF million 31.12.06 31.12.05 31.12.04
Cash flow from / (used in) operating activities
Net profit 12,750 14,690 8,470
Adjustments to reconcile net profit to cash flow from / (used in) operating activities
Non-cash items included in net profit and other adjustments:
Depreciation of property and equipment 1,325 1,556 1,576
Amortization of goodwill and other intangible assets 196 340 1,066
Credit loss expense / (recovery) (156) (374) (241)
Equity in income of associates (117) (152) (67)
Deferred tax expense / (benefit) (517) (382) 171
Net loss / (gain) from investing activities (2,092) (5,062) (1,008)
Net loss / (gain) from financing activities 3,870 4,025 1,203
Net (increase) / decrease in operating assets:
Net due from / to banks 80,269 (1,690) (7,471)
Reverse repurchase agreements and cash collateral on securities borrowed (61,382) (125,097) (40,752)
Trading portfolio, net replacement values and financial assets designated at fair value (177,087) (74,799) (19,733)
Loans / due to customers 64,029 47,265 13,108
Accrued income, prepaid expenses and other assets (4,536) (1,227) (10,809)
Net increase / (decrease) in operating liabilities:
Repurchase agreements, cash collateral on securities lent 66,370 64,558 9,753
Accrued expenses and other liabilities 14,975 15,536 22,019
Income taxes paid (2,607) (2,394) (1,345)
Net cash flow from / (used in) operating activities (4,710) (63,207) (24,060)
Cash flow from / (used in) investing activities
Investments in subsidiaries and associates 2,856 (1,540) (2,511)
Disposal of subsidiaries and associates 1,154 3,240 1,277
Purchase of property and equipment (1,793) (1,892) (1,149)
Disposal of property and equipment 499 270 704
Net (investment in) / divestment of financial investments available-for-sale 1,723 (2,487) 703
Net cash flow from / (used in) investing activities 4,439 (2,409) (976)
Cash flow from / (used in) financing activities
Net money market paper issued / (repaid) 16,921 23,221 21,379
Net movements in treasury shares and own equity derivative activity (3,624) (2,416) (4,999)
Capital issuance 1 2 2
Capital repayment by par value reduction (631) 0 0
Dividends paid (3,214) (3,105) (2,806)
Issuance of long-term debt, including financial liabilities designated at fair value 97,675 76,307 51,211
Repayment of long-term debt, including financial liabilities designated at fair value (59,951) (30,457) (24,717)
Increase in minority interests 1 1,331 1,572 85
Dividend payments to / purchase from minority interests (1,072) (575) (332)
Net cash flow from / (used in) financing activities 47,436 64,549 39,823
Effects of exchange rate differences (2,117) 5,018 (1,052)
Net increase / (decrease) in cash and cash equivalents 45,048 3,951 13,735
Cash and cash equivalents, beginning of the year 91,042 87,091 73,356
Cash and cash equivalents, at the end of the year 136,090 91,042 87,091
Cash and cash equivalents comprise:
Cash and balances with central banks 3,495 5,359 6,036
Money market paper 2 87,144 57,826 45,523
Due from banks with original maturity of less than three months 45,451 27,857 35,532
Total 136,090 91,042 87,091
1 Includes issuance of preferred securities of CHF 1,219 million and CHF 1,539 million for the years ended 31 December 2006 and 31 December 2005, respectively. 2 Money market paper is included in the balance sheet under Trading portfolio assets and Financial investments available-for-sale. CHF 7,183 million, CHF 4,744 million and CHF 5,289 million were pledged at 31 December 2006, 31 December 2005 and 31 December 2004, respectively.

87
Statement of Cash Flows (continued)
For the year ended
CHF million 31.12.06 31.12.05 31.12.04
Additional information
Cash received as interest 79,805 53,117 36,063
Cash paid as interest 76,109 44,392 24,192
Cash received as dividends on equities (incl. Associates, see Note 14) 4,839 3,869 2,934
Significant non-cash investing and financing activities
Motor-Columbus, Baden, from valuation at equity to full consolidation
Financial investments available-for-sale 644
Investments in associates 261
Property and equipment 2,083
Goodwill and other intangible assets 1,194
Debt issued 727
Minority interests 1,742
Investment funds transferred to other liabilities according to IAS 32
Minority interests 336
Private Banks and GAM, deconsolidation
Financial investments available-for-sale 60
Property and equipment 180
Goodwill and other intangible assets 362
Debt issued 5
Private equity investments, deconsolidation
Property and equipment 264 248
Goodwill and other intangible assets 3
Minority interests 62 27
Acquisitions of businesses
Financial investments available-for-sale 35
Property and equipment 112
Goodwill and other intangible assets 377
Minority interests 6
Motor-Columbus, deconsolidation
Financial investments available-for-sale 178
Property and equipment 2,229
Goodwill and other intangible assets 951
Debt issued 718
Minority interests 2,057
Acquisition of ABN AMRO's Global Futures and Options Business
Property and equipment 13
Goodwill and other intangible assets 428
Acquisition of Banco Pactual
Financial investments available-for-sale 36
Property and equipment 9
Goodwill and other intangible assets 2,218
Debt issued 1,496
Acquisition of Piper Jaffray
Goodwill and other intangible assets 605

88
InvestmentsinassociatesinwhichUBShasasignificantinfluenceareaccountedforundertheequitymethodofac-counting.SignificantinfluenceisnormallyevidencedwhenUBSowns20%ormoreofacompany’svotingrights.Invest-ments in associates are initially recorded at cost, and the carrying amount is increased or decreased to recognize the Group’sshareofthe investee’snetprofitor loss (includingnetprofitorlossrecognizeddirectlyinequity)afterthedateofacquisition.Assets and liabilities of subsidiaries and investments in
associatesareclassifiedas“heldforsale”ifUBShasenteredinto an agreement for their disposal within a period of 12 months. Major lines of business and subsidiaries thatwereacquiredexclusivelywiththeintentforresalearepre-sented as discontinued operations in the income statement in the period where the sale occurred or it becomes clear thatasalewilloccurwithin12months.Discontinuedopera-tions are presented in the income statement as a single amountcomprisingthetotalofprofitorlossaftertaxfromoperationsandnetgainorlossonsale.
The Group sponsors the formation of entities, which may or may not be directly or indirectly owned subsidiaries, for the purpose of asset securitization transactions and structured debt issuance, and to accomplish certain narrow andwelldefinedobjectives.ThesecompaniesmayacquireassetsdirectlyorindirectlyfromUBSoritsaffiliates.Someofthesecompaniesarebankruptcy-remoteentitieswhoseassetsarenotavailabletosatisfytheclaimsofcreditorsoftheGroupor anyof its subsidiaries. Such companies areconsolidatedintheGroup’sFinancialStatementswhenthesubstance of the relationship between the Group and the company indicates that the company is controlled by the Group. Certain transactions of consolidated entitiesmeetthecriteriaforderecognitionoffinancialassets–seepart4).
4)RecognitionandderecognitionoffinancialinstrumentsUBS recognizes financial instruments on its balance sheetwhen, and only when, the Group becomes a party to the contractualprovisionsoftheinstrument.UBSentersintotransactionswhereittransfersfinancial
assets recognized on its balance sheet but retains either all risks and rewards of the transferred financial assets or aportionofthem.Ifallorsubstantiallyallrisksandrewardsareretained,thetransferredfinancialassetsarenotderec-ognized from the balance sheet. Transfers of financial
a) Significant Accounting Policies
1)BasisofaccountingUBSAGandsubsidiaries(“UBS”orthe“Group”)provideabroadrangeoffinancialservicesincludingadvisoryservices,underwriting,financing,marketmaking,assetmanagementand brokerage on a global level, and retail banking inSwitzerland.TheGroupwasformedon29June1998whenSwiss Bank Corporation and Union Bank of Switzerlandmerged.Themergerwasaccountedforusingtheunitingofinterestsmethodofaccounting.TheconsolidatedfinancialstatementsofUBS(the“Finan-
cial Statements”) are prepared in accordance with Inter-nationalFinancialReportingStandards(IFRS),issuedbytheInternationalAccountingStandardsBoard(IASB),andstatedinSwissfrancs(CHF),thecurrencyofthecountryinwhichUBSAG is incorporated.On 8March 2007, the Board ofDirectorsapprovedthemforissue.
2)Useofestimatesinthepreparationof Financial StatementsIn preparing the Financial Statements, management is required to make estimates and assumptions that affect reported income, expenses, assets, liabilities and disclosure ofcontingentassetsandliabilities.Useofavailableinforma-tionandapplicationofjudgmentareinherentintheforma-tion of estimates. Actual results in the future could differfrom such estimates, and the differences may be material to theFinancialStatements.
3)SubsidiariesandassociatesThe Financial Statements comprise those of the parent com-pany(UBSAG)anditssubsidiariesincludingcertainspecialpurposeentities,presentedasasingleeconomicentity.Theeffects of intra-group transactions are eliminated in prepar-ing theFinancial Statements. Subsidiaries including specialpurpose entities that are directly or indirectly controlled by theGroupareconsolidated.Subsidiariesacquiredarecon-solidatedfromthedatecontrolistransferredtotheGroup.Subsidiariestobedivestedareconsolidateduptothedateofdisposal(i.e.lossofcontrol).Assets held in an agency or fiduciary capacity are not
assets of the Group and are not reported in the Financial Statements.
Equity and net income attributable to minority interests are shownseparatelyinthebalancesheetandincomestatement.
Notes to the Financial Statements
Note 1 Summary of Significant Accounting Policies
Financial StatementsNotes to the Financial Statements

89
assets with retention of all or substantially all risks and rewards include, for example, securities lending and repur-chasetransactionsdescribedunderparts12)and13).Theyfurtherincludetransactionswherefinancialassetsaresoldto a third party with a concurrent total rate of return swap on the transferred assets to retain all their risks and rewards.Thesetypesoftransactionsareaccountedforassecured financing transactions similar to repurchaseagreements.In transactions where substantially all of the risks and
rewardsofownershipofafinancialassetareneitherretainednortransferred,UBSderecognizesthefinancialassetifcon-trolovertheassetislost.Therightsandobligationsretainedin the transfer are recognized separately as assets and liabili-tiesasappropriate.Intransferswherecontroloverthefinan-cial asset is retained, the Group continues to recognize the assettotheextentofitscontinuinginvolvement,determinedbytheextenttowhichitisexposedtochangesinthevalueofthetransferredasset.Examplesofsuchtransactionsaretransfersoffinancialassetsinvolvingguarantees,writingputoptions, acquiring call options, or specific types of swapslinkedtotheperformanceoftheasset.UBS removes a financial liability from its balance sheet
when,andonlywhen,itisextinguished,i.e.whentheobli-gationspecifiedinthecontractisdischargedorcancelledorexpires.
5)DeterminationoffairvalueForfinancial instrumentstradedinactivemarkets,thede-terminationof fair values of financial assets andfinancialliabilities isbasedonquotedmarketpricesordealerpricequotations.Forallotherfinancialinstruments,fairvalueisdetermined using valuation techniques. Valuation tech-niquesincludenetpresentvaluetechniques,thediscountedcash flowmethod, comparison to similar instruments forwhichmarketobservablepricesexistandvaluationmodels.UBSuseswidelyrecognizedvaluationmodelsfordetermin-ingfairvaluesofcommonandmoresimplefinancialinstru-mentslikeoptionsorinterestrateandcurrencyswaps.Forthesefinancialinstruments,inputsintomodelsaremarket-observable.Formorecomplexinstruments,UBSusesinternallydevel-
opedmodels,whichareusuallybasedonvaluationmethodsand techniques generally recognized as standard within the industry. Someof the inputs to thesemodelsmaynot bemarket-observableandarethereforeestimatedbasedonas-sumptions.Whenenteringintoatransactionwheremodelinputsareunobservable,thefinancial instrumentis initiallyrecognized at the transaction price, which is generally the best indicatorof fairvalue.Thismaydiffer fromthevalueobtainedfromthevaluationmodel.Thetimingoftherecog-nitioninincomeofthisinitialdifferenceinfairvaluedependsontheindividualfactsandcircumstancesofeachtransaction
but isnever later thanwhenthemarketdatabecomeob-servable.RefertoNote30FairValueofFinancialInstrumentsforfurtherdetails.
The output of a model is always an estimate or approxi-mationofavaluethatcannotbedeterminedwithcertainty,andvaluationtechniquesemployedmaynotfullyreflectallfactors relevant to thepositionsUBSholds.Valuationsarethereforeadjusted,whereappropriate,toallowforaddition-al factors includingmodel risks, liquidity risk and counter-party credit risk. Based on the established fair value andmodelgovernancepoliciesandrelatedcontrolsandproce-dures applied, management believes that these valuationadjustmentsarenecessaryandappropriatetofairlystatethevaluesoffinancial instruments carriedat fair valueon thebalancesheet.
6)TradingportfolioTrading portfolio assets consist of money market paper, other debt instruments, including traded loans, equity in-struments, precious metals and other commodities owned bytheGroup(“long”positions).Tradingportfolioliabilitiesconsistofobligationstodeliverfinancialinstrumentssuchasmoney market paper, other debt instruments and equity instruments which the Group has sold to third parties but doesnotown(“short”positions).The trading portfolio is carried at fair value. Gains
and losses realized on disposal or redemption and un-realizedgainsandlossesfromchangesinthefairvalueoftrading portfolio assets and liabilities are reported as Nettradingincome.Interestanddividendincomeandex-pense on trading portfolio assets or liabilities are included in Interest and dividend income or Interest and dividendexpense.
The Group uses settlement date accounting when record-ing tradingfinancial asset transactions. From thedate thetransactionisenteredinto(tradedate),UBSrecognizesanyunrealizedprofitsandlossesarisingfromrevaluingthatcon-tracttofairvalueinNettradingincome.Thecorrespondingreceivableorpayableispresentedonthebalancesheetasapositive or negative replacement value. When the trans-actionisconsummated(settlementdate),aresultingfinan-cial asset is recognized on or derecognized from the balance sheetatthefairvalueoftheconsiderationgivenorreceivedplusorminusthechangeinfairvalueofthecontractsincethetradedate.WhentheGroupbecomespartytoasalescontractofafinancialassetclassifiedinitstradingportfolio,it derecognizes the asset on the day of its transfer (settle-mentdate).
Trading portfolio assets transferred to external parties thatdonotqualifyforderecognition(seepart4) )arereclas-sifiedonUBS‘sbalancesheetfromTradingportfolioassetsto Trading portfolio assets pledged as collateral, if the trans-fereehasreceivedtherighttosellorrepledgethem.

90
7)FinancialassetsandFinancialliabilitiesdesignatedatfairvaluethroughprofitorloss(“FairValueOption”)InJune2005,theIASBissuedamendmentstoIAS39Finan-cial Instruments: Recognition and Measurement in relation to thefairvalueoption(“RevisedFairValueOption”).UBSadopted theRevisedFairValueOption forfinancial instru-ments on aprospectivebasison1January2006.Priorto1January2006, UBS designated almost all of its
issued hybrid debt instruments as Financial liabilities desig-natedatfairvaluethroughprofitorloss. These liabilities are presentedinaseparatelineonthefaceofthebalancesheet.AsmallamountoffinancialassetswasalsodesignatedasFinancial assets designated at fair value through profit orloss, and theyare likewisepresented ina separate line. Afinancial instrumentmay only be designated at fair valuethrough profit or loss at inception and this designationcannotsubsequentlybechanged.Undertherevisedaccountingstandard,UBScontinuesto
applythefairvalueoptionfortheseexistingfinancialinstru-ments.Theconditionsforsuchdesignationarestillmetei-ther on the basis that they are hybrid instruments which wouldotherwisehavetobebifurcatedintodebthostcon-tractsandembeddedderivativesorbecausetheyareitemsthatarepartofaportfoliowhichisriskmanagedonafairvaluebasisandreportedtoseniormanagementassuch.In2006,UBSstartedapplyingthefairvalueoptiontocertainnew loans and loan commitments which are substantially hedgedwithcreditderivatives,tocertainhybridinstrumentsresultingfromstructuredrepurchaseandreverserepurchaseagreementsandtoahedgefundinvestmentwhichispartofaportfoliomanagedonafairvaluebasis.Allfairvaluechangesrelatedtofinancial instrumentsdesignatedatfairvalue throughprofitor lossare recognized inNet tradingincome.Interestanddividendincomeandinterestexpenseonfi-
nancialassetsandliabilitiesdesignatedatfairvaluethroughprofitorlossareincludedinInterestincomeorInterestex-pense.
UBS applies the same recognition and derecognition principles to financial instruments designated at fair value asforfinancialinstrumentsheldfortrading(refertoparts4)and6)).
8)Financialinvestmentsavailable-for-saleFinancial investments available-for-sale are non-derivativefinancial assets that are not classified as held for trading,designatedatfairvaluethroughprofitorloss,orloansandreceivables.Theyarerecognizedonasettlementdatebasis.Financialinvestmentsavailable-for-saleareinstrumentsthat,inmanagement’sopinion,maybesoldinresponsetoorinanticipation of needs for liquidity or changes in interest rates, foreign exchange rates or equity prices. Financial invest-mentsavailable-for-saleconsistmainlyofequityinstruments,
includingcertainprivateequityinvestments.Inaddition,cer-taindebtinstrumentsareclassifiedasfinancialinvestmentsavailable-for-sale.Financialinvestmentsavailable-for-salearecarriedatfair
value.UnrealizedgainsorlossesarereportedinEquity,netofapplicableincometaxes,untilsuchinvestmentsaresold,collectedorotherwisedisposedof,oruntilanysuchinvest-mentisdeterminedtobeimpaired.Ondisposalofaninvest-ment, the accumulated unrealized gain or loss included in EquityistransferredtoNetprofitandlossfortheperiodandreportedinOtherincome.Gainsandlossesondisposalaredeterminedusingtheaveragecostmethod.Interest and dividend income on financial investments
available-for-sale are included in Interest and dividend in-comefromfinancialinvestmentsavailable-for-sale.Ifafinancial investmentavailable-for-sale isdetermined
to be impaired, the cumulative unrealized loss previouslyrecognizedinEquityisincludedinNetprofitandlossfortheperiodandreportedinOtherincome.UBSassessesateachbalancesheetdatewhetherthereisobjectiveevidencethatafinancialinvestmentavailable-for-saleisimpaired.Incaseofsuchevidence,itisconsideredimpairedifitscostexceedstherecoverableamount.Foraquotedfinancial investmentavailable-for-sale,therecoverableamountisdeterminedbyreference to themarket price. It is considered impaired ifobjectiveevidenceindicatesthatthedeclineinmarketpricehasreachedsuchalevelthatrecoveryofthecostvaluecan-notbe reasonably expectedwithin the foreseeable future.For non-quoted financial instruments (debt and equity in-struments),therecoverableamountisdeterminedbyapply-ingrecognizedvaluationtechniques.Thestandardmethodappliedfornon-quotedequityinvestmentsavailable-for-saleisbasedonthemultipleofearningsobservedinthemarketforcomparablecompanies.Managementmayadjustvalua-tionsdeterminedinthiswaybasedonitsjudgment.Fornon-quoted debt instruments, UBS typically determines the re-coverable amount by applying the discounted cash flowmethod.Aftertherecognitionofimpairmentonafinancialinvest-
ment available-for-sale, a) increases in fair value of equityinstruments are reported in Equity andb) increases in fairvalueofdebtinstrumentsuptooriginalcostarerecognizedinOtherincome,providedthefairvalueincreasehasbeentriggeredbyaspecificevent(asdefinedbyIFRS).
9)LoansLoans include loans originated by the Group where money is provided directly to the borrower, participation in a loanfrom another lender and purchased loans that are not quoted inanactivemarketandforwhichnointentionofimmediateorshort-termresaleexists.Originatedandpurchasedloansthat are intended to be sold in the short term are generally recordedasTradingportfolioassets.
Financial StatementsNotes to the Financial Statements

91
Loansarerecognizedwhencashisadvancedtoborrow-ers.Theyareinitiallyrecordedatfairvalue,whichisthecashgiventooriginatetheloan,plusanytransactioncosts,andare subsequently measured at amortized cost using the ef-fectiveinterestratemethod.
Interest on loans is included in Interest earned on loans and advances and is recognized on an accrual basis. Feesanddirectcostsrelatingto loanorigination,refinancingorrestructuring and to loan commitments are deferred and amortizedtoInterestearnedonloansandadvancesoverthelife of the loan using the straight-line method which approx-imatestheeffectiveinterestratemethod.Feesreceivedforcommitments that are not expected to result in a loan are included in Credit-related fees and commissions over thecommitmentperiod.LoansyndicationfeeswhereUBSdoesnot retain a portion of the syndicated loan are credited to commissionincome.
10)AllowanceandprovisionforcreditlossesAnallowanceorprovisionforcredit losses isestablished ifthereisobjectiveevidencethattheGroupwillbeunabletocollect all amounts due on a claim according to the original contractualtermsortheequivalentvalue.A‘claim’meansaloan carried at amortized cost, or a commitment such as a letter of credit, a guarantee, a commitment to extend credit orothercreditproducts.Anallowanceforcreditlossesisreportedasareduction
ofthecarryingvalueofaclaimonthebalancesheet.Foranoff-balancesheetitem,suchasacommitment,aprovisionforcreditlossisreportedinOtherliabilities.Additionstoal-lowancesandprovisionsforcreditlossesaremadethroughCreditlossexpense.Allowancesandprovisionsforcreditlossesareevaluated
atacounterparty-specificlevelandcollectivelybasedonthefollowing principles:
Counterparty-specific: A claim is considered impairedwhen management determines that it is probable that the Group will not be able to collect all amounts due according totheoriginalcontractualtermsortheequivalentvalue.Individual credit exposures are evaluated based on the
borrower’s character, overall financial condition, resourcesand payment record; the prospects for support from any financially responsible guarantors; and, where applicable,therealizablevalueofanycollateral.Theestimatedrecoverableamount is thepresentvalue,
usingtheloan’soriginaleffectiveinterestrate,ofexpectedfuturecashflows, includingamountsthatmayresult fromrestructuringor the liquidationof collateral. Impairment ismeasured and allowances for credit losses are established for the difference between the carrying amount and the esti-matedrecoverableamount.
Upon impairment, the accrual of interest income based on the original terms of the claim is discontinued, but the
increaseofthepresentvalueofimpairedclaimsduetothepassageoftimeisreportedasInterestincome.Allimpairedclaimsarereviewedandanalyzedatleastan-
nually.Anysubsequentchangestotheamountsandtimingoftheexpectedfuturecashflowscomparedwiththepriorestimates result in a change in the allowance for credit losses andarechargedorcreditedtoCreditlossexpense.Anallowancefor impairment isreversedonlywhenthe
creditqualityhas improvedtosuchanextentthatthere isreasonable assurance of timely collection of principal and interest in accordance with the original contractual terms of theclaimorequivalentvalue.Awrite-offismadewhenallorpartofaclaimisdeemed
uncollectibleorforgiven.Write-offsarechargedagainstpre-viouslyestablishedallowancesforcreditlossesordirectlytoCredit loss expense and reduce the principal amount of a claim. Recoveries in part or in full of amounts previouslywrittenoffarecreditedtoCreditlossexpense.Aloanisclassifiedasnon-performingwhenthepayment
ofinterest,principalorfeesisoverduebymorethan90daysandthereisnofirmevidencethatitwillbemadegoodbylater payments or the liquidation of collateral, or when insol-vency proceedings have commenced, orwhenobligationshavebeenrestructuredonconcessionaryterms.
Collectively:Allloansforwhichnoimpairmentisidenti-fiedonacounterparty-specific levelaregrouped intosub-portfolioswithsimilarcreditriskcharacteristicstocollectivelyassesswhetherimpairmentexistswithinaportfolio.Allow-ancesfromcollectiveassessmentof impairmentarerecog-nized as Credit loss expense and result in an offset to the aggregatedloanposition.Astheallowancecannotbeallo-catedtoindividualloans,theloansarenotconsideredtobeimpaired and interest is accrued on each loan according to itscontractualterms.
11)SecuritizationsUBSsecuritizesvariousconsumerandcommercialfinancialassets, which generally results in the sale of these assets to special purpose entities, which in turn issue securities to investors.Interestsinthesecuritizedfinancialassetsmayberetained in the form of senior or subordinated tranches, in-terest-onlystripsorotherresidual interests(‘retainedinter-ests’). Retained interests are primarily recorded in Tradingportfolioassetsandcarriedatfairvalue.GainsorlossesonsecuritizationarerecordedinNettradingincome.
12)SecuritiesborrowingandlendingSecurities borrowing and securities lending transactions are generallyenteredintoonacollateralizedbasis.Insuchtrans-actions, UBS typically lends or borrows securities in exchange for securities or cash collateral. Additionally, UBS borrowssecuritiesfromitsclients’custodyaccountsinexchangeforafee.Themajorityofsecuritieslendingandborrowingagree-

92
ments involve shares, and the remainder typically involvebonds and notes. The transactions are conducted understandardagreementsemployedbyfinancialmarketpartici-pants and are undertaken with counterparties subject toUBS’snormalcreditriskcontrolprocesses.UBSmonitorsthemarketvalueofthesecuritiesreceivedordeliveredonadai-ly basis and requests or provides additional collateral or returns or recalls surplus collateral in accordance with the underlyingagreements.Thesecuritieswhichhavebeentransferred,whetherina
borrowing / lending transaction or as collateral, are not rec-ognized on or derecognized from the balance sheet unless therisksandrewardsofownershiparealsotransferred. Insuch transactions where UBS transfers owned securities and where the borrower is granted the right to sell or re-pledge them, the securities are reclassified on the balance sheetfrom Trading portfolio assets to Trading portfolio assets pledgedascollateral.Cashcollateralreceivedisrecognizedwith a corresponding obligation to return it (Cash collateral onsecuritieslent).Cashcollateraldeliveredisderecognizedwith a corresponding receivable reflecting UBS’s right toreceive it back (Cash collateral on securities borrowed).Securitiesreceivedinalendingorborrowingtransactionaredisclosed as off-balance sheet items if UBS has the right to resell or re-pledge them, with securities that UBS has actually resold or repledged also disclosed separately (see Note 24). Additionally, the sale of securities received in a borrowing or lending transaction triggers the recognition of atradingliability(shortsale).Considerationexchanged(i.e.interestreceivedorpaid)is
recognized on an accrual basis and recorded as Interest in-comeorInterestexpense.
13)RepurchaseandreverserepurchasetransactionsSecuritiespurchasedunderagreementstoresell(Reversere-purchaseagreements)andsecuritiessoldunderagreementstorepurchase(Repurchaseagreements)aregenerallytreatedascollateralizedfinancingtransactions.Nearlyallrepurchaseand reverse repurchase agreements involve debt instru-ments, suchasbonds,notesormoneymarketpaper.Thetransactions are conducted under standard agreements em-ployedbyfinancialmarketparticipantsandareundertakenwithcounterpartiessubjecttoUBS’snormalcreditriskcon-trolprocesses.UBSmonitorsthemarketvalueofthesecuri-ties received or delivered on a daily basis and requests orprovidesadditionalcollateralorreturnsorrecallssurpluscol-lateralinaccordancewiththeunderlyingagreements.In reverse repurchase agreements, the cashdelivered is
derecognized and a corresponding receivable, including accrued interest, is recorded under the balance sheet line Reverse repurchaseagreements, recognizingUBS’s right toreceiveitback.InRepurchaseagreements,thecashreceived,including accrued interest, is recognized on the balance
sheet with a corresponding obligation to return it (Repur-chaseagreements).Securitiesreceivedunderreverserepur-chaseagreementsandsecuritiesdeliveredunderrepurchaseagreements are not recognized on or derecognized from the balancesheet,unlesstherisksandrewardsofownershipareobtainedor relinquished. In repurchaseagreementswhereUBS transfers owned securities and where the recipient is granted the right to resell or re-pledge them, the securities arereclassified inthebalancesheet fromTradingportfolioassetstoTradingportfolioassetspledgedascollateral.Secu-rities received in a reverse repurchase agreement are dis-closed as off-balance sheet items if UBS has the right to resell or repledge them, with securities that UBS has actually resoldorrepledgedalsodisclosedseparately(seeNote24).Additionally,thesaleofsecuritiesreceivedinreverserepur-chase transactions triggers the recognition of a trading liabil-ity(shortsale).Interest earned on reverse repurchase agreements and
interest incurred on repurchase agreements is recognized as interest income or interest expense over the life of eachagreement.The Group offsets reverse repurchase agreements and
repurchase agreements with the same counterparty for transactions coveredby legally enforceablemaster nettingagreements when net or simultaneous settlement is intended.
14)DerivativeinstrumentsandhedgeaccountingAllderivativeinstrumentsarecarriedatfairvalueonthebal-ancesheetandarereportedasPositivereplacementvaluesor Negative replacement values.Where the Group entersintoderivativesfortradingpurposes,realizedandunrealizedgainsandlossesarerecognizedinNettradingincome.TheGroupalsousesderivativeinstrumentsaspartofits
asset and liabilitymanagementactivities tomanageexpo-sures to interest rate, foreign currency and credit risks,includingexposuresarisingfromforecast transactions.TheGroupapplieseitherfairvalueorcashflowhedgeaccount-ingwhentransactionsmeetthespecifiedcriteriatoobtainhedgeaccountingtreatment.At the time a financial instrument is designated as a
hedge, the Group formally documents the relationship between the hedging instrument(s) and hedged item(s),including the riskmanagement objectives and strategy inundertaking the hedge transaction, together with themethodsthatwillbeusedtoassesstheeffectivenessofthehedgingrelationship.Accordingly,theGroupassesses,bothat the inception of the hedge and on an ongoing basis, whether the hedging derivatives have been “highly effec-tive”inoffsettingchangesinthefairvalueorcashflowsofthehedgeditems.UBSregardsahedgeashighlyeffectiveonlyifthefollowingcriteriaaremet:a)atinceptionofthehedge and throughout its life, the hedge is expected to be
Financial StatementsNotes to the Financial Statements

93
highlyeffectiveinachievingoffsettingchangesinfairvalueorcashflowsattributabletothehedgedrisk,andb)actualresultsofthehedgearewithinarangeof80%to125%.Inthe case of hedging a forecast transaction, the transaction musthaveahighprobabilityofoccurringandmustpresentanexposuretovariationsincashflowsthatcouldultimatelyaffectthereportedNetprofitorloss.TheGroupdiscontin-ueshedgeaccountingwhenitdeterminesthataderivativeisnot,orhasceasedtobe,highlyeffectiveasahedge;whenthe derivative expires or is sold, terminated or exercised;when the hedged item matures, is sold or repaid; or when a forecasttransactionisnolongerdeemedhighlyprobable.Hedge ineffectiveness represents the amount bywhich
thechangesinthefairvalueofthehedgingderivativedifferfromchanges in the fair valueof thehedged itemor theamountbywhichchangesinthepresentvalueofcashflowsofthehedgingderivativedifferfromchanges(orexpectedchanges) inthepresentvalueofcashflowsofthehedgeditem.Suchineffectivenessisrecordedincurrentperiodearn-ings in Net trading income, as are gains and losses on com-ponents of a hedging derivative that are excluded fromassessinghedgeeffectiveness.Forqualifyingfairvaluehedges,thechangeinfairvalue
ofthehedgingderivativeisrecognizedintheincomestate-ment.Thosechangesinfairvalueofthehedgeditemthatareattributable to the riskshedgedwith thederivative in-strumentarereflectedinanadjustmenttothecarryingvalueof the hedged item, which is also recognized in the income statement.The fair value changeof thehedged item inaportfoliohedgeof interest rate risks is reportedseparatelyfrom the hedged portfolio in Other assets or Other liabilities as appropriate. If the hedge relationship is terminated forreasons other than the derecognition of the hedged item, the difference between the carrying value of the hedgeditematthatpointandthevalueatwhichitwouldhavebeencarriedhadthehedgeneverexisted(the“unamortizedfairvalueadjustment”),is,inthecaseofinterest-bearinginstru-ments,amortizedtotheincomestatementovertheremain-ing term of the original hedge, while for non-interest bear-ing instruments that amount is immediately recognized in earnings.Ifthehedgeditemisderecognized,e.g.duetosaleor repayment, the unamortized fair value adjustment isrecognizedimmediatelyintheincomestatement.A fair value gain or loss associated with the effective
portionofaderivativedesignatedasacashflowhedge isrecognizedinitiallyinEquity.Whenthecashflowsthatthederivative is hedging materialize, resulting in income or expense, then the associated gain or loss on the hedging derivative is simultaneously transferred from Equity to thecorrespondingincomeorexpenselineitem.Ifacashflowhedgeforaforecasttransactionisdeemed
to be no longer effective, or if the hedge relationship isterminated, the cumulative gain or loss on the hedging
derivativepreviously reported inEquity remains thereuntilthe committed or forecast transaction occurs or is no longer expected to occur, at which point it is transferred to the incomestatement.Derivativeinstrumentswhicharetransactedaseconomic
hedges but do not qualify for hedge accounting are treated inthesamewayasderivativeinstrumentsusedfortradingpurposes, i.e. realizedandunrealizedgains and losses arerecognized in Net trading income except that, in certain cases, the forward points on short duration foreign exchange contractsarepresentedinNetinterestincome.Inparticular,theGrouphasenteredintoeconomichedgesofcreditriskwithin the loan portfolio using credit default swaps to which it cannot apply hedge accounting. In the event that theGroup recognizes an impairment on a loan that is economi-cally hedged in this way, the impairment is recognized in Credit loss expense, whereas any gain on the credit default swapisrecordedinNettradingincome.SeeNote23forad-ditionalinformation.WhereUBSdesignatesaneconomicallyhedgeditematfairvaluethroughprofitorloss,allfairvaluechanges, including impairments, on both the hedged item and the hedging instrument are reflected in Net tradingincome(refertopart7)).Aderivativemaybeembeddedina‘hostcontract’.Such
combinations are known as hybrid instruments and arisepredominantly from the issuance of certain structured debt instruments.Ifthehostcontractisnotcarriedatfairvaluewithchangesinfairvaluereportedintheincomestatement,the embeddedderivative is generally required tobe sepa-rated from the host contract and accounted for as a stand-alone derivative instrument at fair value if the economiccharacteristicsandrisksoftheembeddedderivativearenotclosely related to theeconomiccharacteristicsand risksofthe host contract and the embedded derivative actuallymeetsthedefinitionofaderivative.Typically,UBSappliesthefairvalueoptiontohybridinstruments(seepart7)),sothatbifurcation of an embedded derivative component is notrequired.
15)CashandcashequivalentsCashandcashequivalentsconsistofCashandbalanceswithcentral banks, balances included in Due from banks withoriginalmaturityoflessthanthreemonths,andMoneymar-ketpaperincludedinTradingportfolioassetsandFinancialinvestmentsavailable-for-sale.
16)PhysicalcommoditiesPhysicalcommodities(preciousmetals,basemetals,energyandothercommodities)heldbyUBSasaresultofitsbroker-traderactivitiesareaccountedforatfairvaluelesscoststosellandpresentedwithintheTradingportfolio.Changesinfair value less costs to sell are reflected in Net tradingincome.

94
17)PropertyandequipmentProperty andequipment includesown-usedproperties, in-vestment properties, leasehold improvements, IT, softwareand communication, plant and manufacturing equipment, andothermachinesandequipment.Own-used property is defined as property held by the
Groupforuseinthesupplyofservicesorforadministrativepurposes,whereasinvestmentpropertyisdefinedaspropertyheldtoearnrentalincomeand/orforcapitalappreciation.Ifa property of the Group includes a portion that is own-used and another portion that is held to earn rental income or for capitalappreciation,theclassificationisbasedonwhetherornottheseportionscanbesoldseparately.Iftheportionsofthe property can be sold separately, they are separately ac-countedforasown-usedpropertyandinvestmentproperty.If the portions cannot be sold separately, the whole property isclassifiedasown-usedpropertyunlesstheportionusedbytheGroupisminor.Theclassificationofpropertyisreviewedonaregularbasistoaccountformajorchangesinitsusage.Leasehold improvements are investmentsmade to cus-
tomizebuildingsandofficesoccupiedunderoperatingleasecontractstomakethemsuitablefortheintendedpurpose.Thepresentvalueofestimatedreinstatementcoststobringa leased property into its original condition at the end of the lease, if required, is capitalized as part of the total leasehold improvementscosts.Atthesametime,acorrespondinglia-bility is recognized to reflect theobligation incurred.Rein-statement costs are recognized in profit and loss throughdepreciationofthecapitalizedleaseholdimprovementsovertheirestimatedusefullife.Software development costs are capitalized when they
meetcertaincriteriarelatingtoidentifiability, it isprobablethat future economic benefits will flow to the enterprise,andthecostcanbemeasuredreliably.Internallydevelopedsoftware meeting these criteria and purchased software are classifiedwithinIT,softwareandcommunication.With the exception of investment properties, Property
and equipment is carried at cost less accumulated deprecia-tion and accumulated impairment losses, and is periodically reviewed for impairment. The useful life of property andequipment is estimated on the basis of the economic utiliza-tionoftheasset.Propertyandequipmentisdepreciatedonastraight-line
basisoveritsestimatedusefullifeasfollows:
Properties,excludingland Notexceeding50years
Leaseholdimprovements Residualleaseterm, but not exceeding 10 years
Other machines and equipment Not exceeding 10 years
IT, software and communication Not exceeding 5 years
Property formerly own-used or leased to third parties under an operating lease and equipment the Group has de-
cidedtosellareclassifiedasassetsheldforsaleandrecordedinOtherassets.Uponclassificationasheldforsale,theyarenolongerdepreciatedandarecarriedatthelowerofbookvalueorfairvaluelesscoststosell.Foreclosedpropertiesareincluded in Propertiesheld for sale and recorded inOtherassets.Theyarecarriedatthelowerofcostandnetrealiz-ablevalue.Investmentpropertyiscarriedatfairvaluewithchanges
in fair value recognized in the income statement in theperiodofchange.UBSemploysinternalrealestateexpertstodeterminethefairvalueofinvestmentpropertybyapplyingrecognized valuation techniques. In caseswhere prices ofrecent market transactions of comparable properties areavailable, fair value is determined by reference to thesetransactions.
18)GoodwillandotherintangibleassetsGoodwill represents the excess of the cost of an acquisition over the fairvalueof theGroup’s shareofnet identifiableassetsoftheacquiredentityatthedateofacquisition.Until31December2004,goodwillacquiredinbusinesscombina-tionsentered intoprior to31March2004wasamortizedover its estimated useful economic life, not exceeding 20years,usingthestraight-linemethod.Since31December2004, goodwill has not been amortized but is tested annu-allyforimpairment.TheimpairmenttestisconductedatthesegmentlevelasreportedinNote2a.Thesegmenthasbeendetermined as the cash generating unit for impairment test-ingpurposesasthisisthelevelatwhichtheperformanceofinvestmentsisreviewedandassessedbymanagement.Other intangible assets comprise separately identifiable
intangible items arising from acquisitions and certain pur-chasedtrademarksandsimilaritems.Otherintangibleassetsacquired in business combinations are recognized on the balancesheetwiththeirfairvalueatthedateofacquisitionand,iftheyhaveadefiniteusefullife,areamortizedusingthe straight-line method over their estimated useful eco-nomic life,generallynotexceeding20years.Ateachbal-ance sheet date, other intangible assets are reviewed for indications of impairment or changes in estimated future benefits. If such indicationsexist, the intangibleassetsareanalyzed to assess whether their carrying amount is fully recoverable.Awrite-down ismade if thecarryingamountexceedstherecoverableamount.Intangibleassetsareclassifiedintotwocategories:a)in-
frastructure, and b) customer relationships, contractualrightsandother.InfrastructureconsistsofanintangibleassetrecognizedinconnectionwiththeacquisitionofPaineWeb-ber Group, Inc. Customer relationships, contractual rightsand other includes mainly intangible assets for client rela-tionships, non-compete agreements, favorable contracts,proprietarysoftware,trademarksandtradenamesacquiredinbusinesscombinations.
Financial StatementsNotes to the Financial Statements

95
19)IncometaxesIncometaxpayableonprofits is recognizedasanexpensebasedontheapplicabletaxlawsineachjurisdictionintheperiodinwhichprofitsarise.Thetaxeffectsofincometaxlosses available for carry forward are recognized as a de-ferredtaxassetifitisprobablethatfuturetaxableprofitwillbeavailableagainstwhichthoselossescanbeutilized.Deferredtax liabilitiesarerecognizedfortemporarydif-
ferences between the carrying amounts of assets and liabili-ties in the balance sheet and their amounts as measured for tax purposes, which will result in taxable amounts in future periods. Deferred tax assets are recognized for temporarydifferences that will result in deductible amounts in future periods,butonlytotheextentitisprobablethatsufficienttaxableprofitswillbeavailableagainstwhich thesediffer-encescanbeutilized.Deferredtaxassetsandliabilitiesaremeasuredatthetax
rates that are expected to apply in the period in which the asset will be realized or the liability will be settled based on enactedrates.
Tax assets and liabilities of the same type (current or de-ferred)areoffsetwhentheyarisefromthesametaxreport-ing group, they relate to the same tax authority, the legal right to offset exists, and they are intended to be settled net orrealizedsimultaneously.
Current and deferred taxes are recognized as Income tax benefitorexpenseexceptfor(i)deferredtaxesrecognizedordisposed of upon the acquisition or disposal of a subsidiary, (ii)unrealizedgainsorlossesonfinancialinvestmentsavail-able-for-saleandchanges in fair valueofderivative instru-mentsdesignatedascashflowhedges,and(iii)certaintaxbenefitsondeferredcompensationawards.Items(ii)and(iii)arerecordedinNetincomerecognizeddirectlyinequity.
20)DebtissuedDebt issued is initiallymeasuredat fairvalue,which is theconsideration received, net of transaction costs incurred.Subsequent measurement is at amortized cost, using the ef-fectiveinterestratemethodtoamortizecostatinceptiontotheredemptionvalueoverthelifeofthedebt.Hybriddebtinstrumentsthatarerelatedtonon-UBSAG
equity instruments, foreign exchange, credit instruments or indicesareconsideredstructuredinstruments.Ifsuchinstru-mentshavenotbeendesignatedatfairvaluethroughprofitorloss,theembeddedderivativeisseparatedfromthehostcontractandaccountedforasastand-alonederivativeifthecriteria forseparationaremet.Thehostcontract is subse-quently measured at amortized cost. UBS has designatedmostofitsstructureddebtinstrumentsatfairvaluethroughprofitorloss–seepart7).Thefairvalueoptionisnotappliedtocertainhybridin-
strumentswhichcontainbifurcatableembeddedderivativeswith references to foreign exchange rates and precious met-
alpricesandwhicharenothedgedbyderivativeinstruments.Thosehybridsarestillsubjecttobifurcationoftheembed-dedderivative.Debt instruments with embedded derivatives that are
relatedtoUBSAGsharesortoaderivativeinstrumentthathasUBSAG shares as its underlyingare separated into a liability and an equity component at issue date if they require physical settlement.When thehybrid debt instru-ment is issued, a portion of the net proceeds is allocated to thedebtcomponentbasedonitsfairvalue.Thedetermina-tionoffairvalueisgenerallybasedonquotedmarketpricesforUBSdebtinstrumentswithcomparableterms.Thedebtcomponent is subsequently measured at amortized cost.The remaining amount of the net proceeds is allocated to theequitycomponentandreportedinSharepremium.Sub-sequentchangesinfairvalueoftheseparatedequitycom-ponentarenot recognized.However, if thehybrid instru-mentortheembeddedderivativerelatedtoUBSAGsharesistobecashsettledorifitcontainsasettlementalternative,thentheseparatedderivativeisaccountedforasatradinginstrument, with changes in fair value recorded in Net trading income unless the entire hybrid debt instrument is designatedatfairvaluethroughprofitorlosswithchangesinfairvalueoftheentirehybridinstrumentalsoreflectedinNettradingincome(seepart7)).ItistheGroup’spolicytohedgethefixedinterestraterisk
on debt issues (except for certain subordinated long-term note issues, see Note 23), and to apply fair value hedgeaccounting,ifthefairvalueoptionisnotappliedtosuchfi-nancialinstruments–seepart7).Whenhedgeaccountingisappliedtofixed-ratedebtinstruments,thecarryingvaluesofdebtissuesareadjustedforchangesinfairvaluerelatedtothe hedged exposure rather than carried at amortized cost – refer to part 14). Derivative instruments and hedge ac-countingforfurtherdiscussion.Bonds issuedbyUBSheldas a resultofmarketmaking
activitiesordeliberatepurchasesinthemarketaretreatedasaredemptionofdebt.Againorlossonredemptionisrecord-ed depending on whether the repurchase price of the bond is lowerorhigherthanitscarryingvalue.Asubsequentsaleofownbondsinthemarketistreatedasareissuanceofdebt.
Interest expense on debt instruments is included in Inter-estondebtissued.
21)RetirementbenefitsUBSsponsorsanumberofretirementbenefitplansfor itsemployees worldwide. These plans include both definedbenefit and defined contribution plans and various otherretirement benefits such as post-employment medicalbenefits. Contributions to defined contribution plans areexpensed when employees have rendered services in ex-change for such contributions, generally in the year of con-tribution.

96
TheGroupusestheprojectedunitcreditactuarialmethodtodeterminethepresentvalueofitsdefinedbenefitplansand the related service cost and, where applicable, pastservicecost.
The principal actuarial assumptions used by the actuary aresetoutinNote31.
The Group recognizes a portion of its actuarial gains and lossesasincomeorexpenseifthenetcumulativeunrecog-nizedactuarialgainsandlossesattheendofthepreviousreporting period are outside the corridor defined as thegreater of:
a)10%ofpresentvalueofthedefinedbenefitobligationatthatdatea)(beforedeductingplanassets);and
b)10%ofthefairvalueofanyplanassetsatthatdate.
The unrecognized actuarial gains and losses exceeding thegreaterofthesetwovaluesarerecognizedintheincomestatement over the expected average remaining workinglivesoftheemployeesparticipatingintheplans.Ifanexcessofthefairvalueoftheplanassetsoverthe
present value of the definedbenefit obligation cannot berecoveredfullythroughrefundsorreductionsinfuturecon-tributions, no gain is recognized solely as a result of deferral ofanactuariallossorpastservicecostinthecurrentperiod,and no loss is recognized solely as a result of deferral of an actuarialgaininthecurrentperiod.
22)EquityparticipationplansUBSprovidesvariousequityparticipationplansintheformofshareplansandshareoptionplans.UBSrecognizesthefairvalueofshareandshareoptionawardsdeterminedatthedateofgrantascompensationexpenseovertherequiredserviceperiod,whichgenerallyisequaltothevestingperiod.Thefairvalueofshareawardsisequaltothemarketpriceatthedateofgrant.Forshareoptions,fairvalueisdeterminedusingaMonteCarlovaluationmodelwhichtakes intoac-count the specific terms and conditions under which theshareoptionsaregranted.Equitysettledawardsareclassi-fiedasequity instrumentsandarenotre-measuredsubse-quenttothegrantdate,unlessanawardismodifiedsuchthatitsfairvalueimmediatelyaftermodificationexceedsitsfairvalueimmediatelypriortomodification.Anyincreaseinfairvalueresultingfromamodificationisrecognizedascom-pensationexpense,eitherovertheremainingserviceperiodorimmediatelyforvestedawards.Cash settled awards are classified as liabilities and re-
measuredtofairvalueateachbalancesheetdateaslongasthey are outstanding.Decreases in fair value reduce com-pensation expense, and no compensation expense, on a cu-mulativebasis, isrecognizedforawardsthatexpireworth-lessorremainunexercised.Uptoandincluding2004,certainplansgaveparticipants theability to roll their share-based
awardsintoalternativeinvestments.Theseplansaretreatedascash-settled.UBSnolongerprovidesthisroll-overoptiontoitsemployees.
23)Equity,treasurysharesandcontractsonUBSsharesUBSAGsharesheldbytheGroupareclassifiedinEquityasTreasurysharesandaccountedforatweightedaveragecost.The difference between the proceeds from sales of Treasury sharesandtheircost(netoftax,ifany)isclassifiedasSharepremium.Contracts that require physical settlement in UBS AG
sharesareclassifiedasEquityandreportedasSharepremi-um. Upon settlement of such contracts, the proceeds re-ceived–lesscost(netoftax,ifany)–arereportedasSharepremium.ContractsonUBSAGsharesthatrequirenetcashsettle-
ment or provide the counterpartywith a choice of settle-mentareclassifiedastradinginstruments,withchangesinfairvaluereportedintheincomestatement.Anexceptiontothistreatmentisphysicallysettledwritten
put options and forward share purchase contracts, including contracts where physical settlement is a settlement alter-native.Inbothcases,thepresentvalueoftheobligationtopurchase own shares in exchange for cash is transferred out of Equity and recognized as a liability at inception of a con-tract.Theliabilityissubsequentlyaccreted,usingtheeffec-tiveinterestratemethod,overthelifeofthecontracttothenominal purchase obligation by recognizing interest ex-pense.Uponsettlementofacontract,theliabilityisderecog-nized, and the amount of equity originally transferred to li-ability is reclassified within Equity to Treasury shares. Thepremiumreceivedforwritingputoptions is recognizeddi-rectlyinSharepremium.
UBS has issued trust preferred securities through consoli-dated preferred funding trusts, which hold debt issued by UBS.UBSAGhasfullyandunconditionallyguaranteedallofthese securities. UBS’s obligations under these guaranteesare subordinated to the prior payment in full of the deposit liabilitiesofUBSandallotherliabilitiesofUBS.Thetrustpre-ferred securities represent equity instruments which are ownedbythirdparties.Theyarepresentedasminorityinter-ests in UBS’s consolidated financial statements with divi-dends paid also reported under Equity attributable to minor-ityinterests.UBSbondsheldbypreferredfundingtrustsareeliminatedinconsolidation.
24)Discontinuedoperationsandnon-currentassets held for saleUBS classifies non-current non-financial assets (or disposalgroups) as held for sale, e.g. properties, if their carryingamountwillberecoveredprincipallythroughasaletransac-tionratherthanthroughcontinuinguse–seepart17).Suchassets(ordisposalgroups)areavailableforimmediatesalein
Financial StatementsNotes to the Financial Statements

97
their present condition subject to terms that are usual andcustomary for sales of such assets (or disposal groups) andtheirsaleisconsideredhighlyprobable.Theseassetsaremea-suredattheloweroftheircarryingamountandfairvaluelesscoststosell.
UBS presents discontinued operations under a separate line in the income statement if an entity or a component of anentityhasbeendisposedoforisclassifiedasheldforsaleanda)representsaseparatemajorlineofbusinessorgeo-graphicalareaofoperations,orb) isa subsidiaryacquiredexclusivelywithaviewtoresale(e.g.certainprivateequityinvestments). A component of an entity comprises opera-tionsandcashflowsthatcanbeclearlydistinguished,opera-tionallyandforfinancialreportingpurposes,fromtherestofUBS’soperationsandcashflows.Ifanentityoracomponentof an entity is classified as a discontinued operation,UBSrestatespriorperiodsintheincomestatement–seepart3).
25)LeasingUBS enters into lease contracts, predominately of premises andequipment,asalessoraswellasalessee.Thetermsandconditions of these contracts are assessed and the leases are classifiedasoperatingleasesorfinanceleasesaccordingtotheir economic substance. When making such an assess-ment,theGroupfocusesonthefollowingaspects:a)Isown-ership of the asset transferred to the lessee by the end of the leaseterm?;b)Isabargainpurchaseoptionheldbytheles-see?;c)Istheleasetermforthemajorpartoftheeconomiclifeoftheasset?;d)Doesthepresentvalueoftheminimumlease payments amount to at least substantially all of the fair valueoftheleasedassetatinceptionoftheleaseterm?Theexistenceofsuchconditions,individuallyorincombinationwithothers,normally leadstoa leasebeingclassifiedasafinance lease,while thenon-existencenormally leads toaleasebeingclassifiedasanoperatinglease.LeasecontractsclassifiedasoperatingleaseswhereUBS
is the lessee are disclosed in Note 27 Operating Lease Com-mitments. These contracts include non-cancellable long-termleasesofofficebuildingsinmostUBSlocations.LeasecontractsclassifiedasoperatingleaseswhereUBSistheles-sor,andfinanceleasecontractswhereUBSisthelessororthelessee,arenotmaterial.
26)FeeincomeUBSearnsfeeincomefromadiverserangeofservicesitpro-videstoitscustomers.Feeincomecanbedividedintotwobroadcategories:incomeearnedfromservicesthatarepro-videdoveracertainperiodoftime,forwhichcustomersaregenerally billed on an annual or semi-annual basis, and in-comeearnedfromprovidingtransaction-typeservices.Feesearnedfromservicesthatareprovidedoveracertainperiodoftimearerecognizedratablyovertheserviceperiod.Feesearned fromproviding transaction-type servicesare recog-
nizedwhentheservicehasbeencompleted.Performance-linked fees or fee components are recognized when therecognitioncriteriaarefulfilled.
The following fee income is predominantly earned from servicesthatareprovidedoveraperiodoftime:investmentfundfees,fiduciaryfees,custodianfees,portfolioandothermanagement and advisory fees, insurance-related fees,credit-relatedfeesandcommissionincome.Feespredomi-nantly earned fromproviding transaction-type services in-cludeunderwritingfees,corporatefinancefeesandbroker-agefees.
27)ForeigncurrencytranslationForeign currency transactions are recorded at the rate of exchange on the date of the transaction. At the balancesheet date, monetary assets and liabilities denominated in foreign currencies are reported using the closing exchange rate.Exchangedifferencesarisingonthesettlementoftrans-actions at rates different from those at the date of the trans-action, as well as unrealized foreign exchange differences on unsettled foreign currency monetary assets and liabilities, are recognizedintheincomestatement.Unrealizedexchangedifferencesonnon-monetaryfinan-
cial assets (investments in equity instruments) are a com-ponentof thechange intheirentire fairvalue.Foranon-monetary financial asset held for trading and for non- monetaryfinancial assetsdesignatedat fair value throughprofit or loss, unrealized exchange differences are recog-nizedintheincomestatement.Fornon-monetaryfinancialinvestments available-for-sale, unrealized exchange differ-ences are recorded directly in Equity until the asset is sold or becomesimpaired.When preparing consolidated financial statements, as-
sets and liabilities of foreign entities are translated at the exchange rates at the balance sheet date, while income andexpenseitemsaretranslatedatweightedaverageratesfortheperiod.Differencesresultingfromtheuseofclosingandweightedaverageexchangeratesandfromrevaluing aforeignentity’snetassetbalanceattheclosingratearerecognized directly in Foreign currency translation within Equity.
28)Earningspershare(EPS)BasicearningspersharearecalculatedbydividingtheNetprofitandlossfortheperiodattributabletoordinaryshare-holdersbytheweightedaveragenumberofordinarysharesoutstandingduringtheperiod.Dilutedearningspersharearecalculatedusingthesame
methodasforbasicEPS,butthedeterminantsareadjustedtoreflectthepotentialdilutionthatcouldoccurifoptions,warrants, convertible debt securities or other contracts toissueordinaryshareswereconvertedorexercisedintoordi-naryshares.

98
29)SegmentreportingUBS’s financial businesses are organized on a worldwidebasisintothreeBusinessGroupsandtheCorporateCenter.Global Wealth Management & Business Banking consists of three segments: Wealth Management International &Switzerland,WealthManagementUSandBusinessBankingSwitzerland. The Business Groups Investment Bank andGlobal Asset Management constitute one segment each.The Corporate Center represents one segment in 2006, as PrivateBanks&GAMwassoldon2December2005.Addi-tionally,theIndustrialHoldingssegmentholdsall industrialoperationscontrolledbytheGroup.Intotal,UBSreportssev-enbusinesssegments.
Segment income, segment expenses and segment per-formance include transfers between business segments and between geographical segments. Such transfers are con-ducted either at internally agreed transfer prices or, where possible,atarm’slength.
30)RevenuesfromIndustrialHoldingsandGoodsandmaterials purchasedRevenues from Industrial Holdings include sales of goodsandservicesfromthreeconsolidatedentitiesandarederivedfrom various businesses. Revenue is generally recognizedupon customer acceptance of goods delivered and whenservices have been rendered. Expenses from Goods and materials purchased include costs for raw materials, parts andfinishedgoodspurchasedfromthird-partysupplierstoproducethegoodsandservicessold.
b) Changes in accounting policies, comparability and other adjustments
Effectivein2006IAS 39 Financial Instruments: Recognition and Measure-ment – Amendment to the fair value option InJune2005,theIASBissuedamendmentstoIAS39Finan-cial Instruments: Recognition and Measurement in regard to the fair value option.UBS adopted the revised IAS 39 fairvalueoptionon1January2006.Undertheamendedguid-ance,theuseofthefairvalueoptionrequiresthatat leastoneofthreedefinedcriteriaissatisfied,whichismorerestric-tive than the previous guidance. All financial instrumentsdesignatedatfairvaluethroughprofitorlossat31Decem- ber2005continuedtoqualify for theuseof thefairvalueoptionundertherevisedfairvalueoption.Ontransitiondateoftherevisedstandard,1January2006,UBSdidnotapplythe fair valueoption toanypreviously recognizedfinancialassetorfinancialliability,forwhichthefairvalueoptionhadnotbeenusedunderthepreviousfairvalueoptionguidance.Therefore,theinitialadoptionoftherevisedstandarddidnothaveanimpactonUBS’sfinancialstatements.Seepart7)fordetailsontheuseoftherevisedfairvalueoptionduringthe
year2006.Inaddition,effective1January2006,thedisclo-surerequirementsforfinancialinstrumentsdesignatedatfairvaluethroughprofitorlosshavebeenamendedduetotherevisionofIAS32Financial Instruments: Presentation.
Prime BrokerageUBShasreclassifiedcertainreceivablesandpayablesresultingfromitsPrimeBrokeragebusinessfortheyearsended2002through 2006 to ensure consistent presentation of identical itemsthroughoutUBS.Seethenextpageforreclassificationsthathavebeenmadetopreviouslydisclosedamounts.TheadjustmentshadnoeffectonNetprofit,Basicearn-
ings per share andDiluted earnings per share in all yearspresented.UBS’s internalmeasuresof credit exposureandregulatorycapitalareunaffectedbythereclassification.
Cash collateral on securities borrowedCounterpartyinformationonreceivablesresultingfromcashpaid as collateral in securities borrowing transactions is disclosedinNote11.Forcomparabilityreasons,UBSreclas-sifiedCHF183billionfromreceivablesagainstbankstore-ceivablesagainstcustomerson31December2005.
Staff Accounting Bulletin (SAB) 108In response to the release of the Securities and Exchange Commission(SEC)StaffAccountingBulletin(SAB)108,Con-sidering the Effects of Prior Year Misstatements when Quan-tifying Misstatements in Current Year Financial Statements, UBSelectedtoadoptamodifiedquantitativeframeworkforassessingwhether the financial statement effect of amis-statementismaterialbecauseitrendersabetterevaluationofthoseeffects.Thenewmethod,whichUBSadoptedinDe-cember 2006, uses a dual approach for quantifying the effect ofamisstatement.Prior to2006,UBSappliedonlyoneofthosemethods, the“roll-over”method,which focusedonthecurrent-yearincome-statementimpactofamisstatement.Under the new policy, UBS applies a dual approach that con-sidersboththecarryoverandreversingeffectsofprioryearmisstatements.Asaresultofthenewpolicy,theopeningbal-anceofAccruedexpensesanddeferredincomeat1January2002was increasedbyCHF399million,RetainedearningswerereducedbyCHF309millionandDeferredtaxesofCHF90million were recognized on balance sheet. The adjust-ments relate to theunder-accrualofunusedvacation, sab-baticalleaveandserviceanniversaryawards.Therestatementimpact of adopting this new policy is immaterial to all quar-terly and annual income statements, earnings per share amounts,andbalancesheetssince1January2002.
Amendments to existing standards and new interpretationsMinoramendmentshavebeenmadetothefollowingexist-ing InternationalAccountingStandards,whichwereeffec-tiveandhavebeenadoptedbyUBSat1January2006.
Financial StatementsNotes to the Financial Statements

99
IAS 19 Employee Benefits has been amended to allow a choice of whether to recognize actuarial gains and losses in a definedpost-retirementbenefitplanimmediatelyinequityortoapplythecorridorapproach.UBSdecidedtocontinuetoapplythecorridorapproachasdescribedinparta21).OtheramendmentsmadetoIAS19havenoimpactonUBS.
IAS39Financial Instruments: Measurement and Recognition and IFRS 4 Insurance Contracts havebeenamendedinrela-tiontofinancialguaranteecontractstoclarifywhenafinan-cialguaranteeiswithinthescopeofIAS39andwhenitisconsideredaninsurancecontractwithinthescopeofIFRS4.This amendmentdidnothaveamaterial impactonUBS’sFinancialStatements.
IAS21The Effects of Changes in Foreign Exchange Rates has been amended to require that exchange differences arising inconsolidationonloanfinancingsthatformpartofanetinvestmentinaforeignoperationandaredenominatedinacurrency other than the functional currencies of both the
reportingentityandtheforeignoperation,arereclassifiedtoequityintheconsolidatedfinancialstatementsofthereport-ing entity. This amendment has no significant impact onUBS’sFinancialStatements.
IFRIC 4 Leases: Determining Whether an Arrangement Contains a LeaseIFRIC4wasissuedinDecember2004andprovidesguidanceona)howtodeterminewhetheranarrangementis,orcon-tains,aleaseasdefinedinIAS17;b)whentheassessmentor a reassessment of whether an arrangement is, or con-tains,aleaseshouldbemade;andc)ifanarrangementis,orcontains, a lease, how the payments for the lease should be separated from payments for any other elements in the ar-rangement.Ifanarrangementcontainsaleaseelement,theinterpretation requires that the payments for the lease ele-mentareaccountedfor inaccordancewith IAS17Leases.UBS adopted the interpretation on 1 January 2006, its effec-tivedate.TheinterpretationhadnomaterialeffectonUBS’sFinancialStatements.
Inaddition,thefollowingreclassificationshavebeenmadewithininterestincomeandexpense:
Income statement
CHF million 31.12.05 31.12.04 31.12.03 31.12.02
Interest income
Interest earned on loans and advances 290 313 30 120
Interest earned on securities borrowed and reverse repurchase agreements (279) (307) (25) (115)
Interest and dividend income from trading portfolio (11) (6) (5) (5)
Total 0 0 0 0
Interest expense
Interest on amounts due to banks and customers 146 108 (1) 92
Interest on securities lent and repurchase agreements (146) (108) 1 (92)
Total 0 0 0 0
Prime Brokerage Reclassification
Balance sheet
CHF million 31.12.05 31.12.04 31.12.03 31.12.02
Assets
Cash collateral on securities borrowed (11,896) (9,636) (7,413) 0
Loans 9,941 9,636 7,413 0
Total (1,955) 0 0 0
Liabilities
Cash collateral on securities lent (17,329) (10,244) (5,006) 0
Due to customers 15,374 10,244 5,006 0
Total (1,955) 0 0 0
Off-Balance Sheet
CHF million 31.12.05 31.12.04 31.12.03 31.12.02
Fair value of securities sold or repledged in connection with financing activities, disclosed in Note 24 20,769 14,338 0 0

100
Effectivein2005andearlierPrivate equity investmentsOn1 January 2005,UBS adopted revised IAS 27Consoli-dated and Separate Financial Statements andrevisedIAS28Investments in Associates.IAS 27was amended to eliminate the exemption from
consolidating a subsidiary where control is exercised tempo-rarily. UBS has several private equity investmentswhere itowns a controlling interest that used to be classified andaccounted for as Financial investments available-for-sale.UBSadoptedIAS27on1January2005retrospectivelyandrestatedcomparativeprioryears2004and2003.Theeffectoftheadoptionandconsolidatingtheseinvestmentswasasfollows: at 1 January 2003, equity including minority inter-estswasreducedbyCHF723million,representingthedif-ferencebetweenthecarryingvalueasFinancialinvestmentsavailable-for-sale and the book value on a consolidated basis.ConsolidationledtorecognitionoftotalassetsintheamountofCHF1.7billionandCHF2.9billionat31Decem-ber 2004 and 2003 respectively. Significant balance sheetline itemsaffected includePropertyandequipment, Intan-gibleassets,GoodwillandOtherassets.Theseinvestmentsgenerated additional operating income of CHF 2.5 billionandadditionalNetprofitattributabletoUBSshareholdersofCHF142millionin2004.IAS28waslikewiseamendedtoeliminatetheexemption
from equity method accounting for investments that areheld exclusively for disposal. Private equity investmentswhereUBShassignificantinfluencearenowaccountedforusing the equity method whereas they were previouslyclassified as Financial investments available-for-sale. Theadoptionwasmaderetrospectivelyfrom1January2003andpriorperiodswererestated.Applicationoftheequitymeth-odofaccounting for these investmentshad the followingeffects: on 1 January 2003, opening equity was debited by CHF266million, representing thedifferencebetween thecarryingvalueasFinancialinvestmentsavailable-for-saleandthe book value on an equity method basis. The carryingvalueoftheseequitymethodinvestmentswasCHF248mil-lionandCHF393millionat31December2004and2003respectively,whichincludesequityinlossesofCHF55millionrecognizedintheincomestatementin2004.Gainsonsalerecognizedin2004wereCHF1million.Whenaccountedforas Financial investments available-for-sale, gains on salerecognizedwereCHF70millionin2004.Theseentities,alongwithallotherinvestmentsmadeby
theprivateequitybusinessunit,werereclassifiedfromtheInvestment Bank segment to the Industrial Holdings seg-ment effective 1 January 2005. In addition, nine of the newlyconsolidatedinvestmentsheldat1January2003weresoldafterthatdate(butbefore1January2006)andarepre-sentedasDiscontinuedoperationsintherestatedcompara-tive prior periods in accordancewith IFRS 5,which is dis-
cussedonthenextpage.GainsonsaleofCHF90millionwerereportedin2004inconnectionwithprivateequityin-vestmentssold.Onarestatedbasis,theNetprofitfromdis-continuedoperationsrelatedtotheseentitieswasCHF145millionin2004.
IFRS 2 Share-based PaymentInFebruary2004,the IASBissuedIFRS2Share-based Pay-ment, which requires share-based payments made to em-ployeesandnon-employeestoberecognizedinthefinancialstatements based on the fair value of these awardsmea-suredatthedateofgrant.UBSadoptedthenewstandardon1January2005andfullyrestatedthetwocomparativeprioryears.InaccordancewithIFRS2,UBSappliedthenewrequirements of the standard to all prior period awards thataffectincomestatementscommencing1January2003.Thisincludesallunvestedequity-settledawardsandallout-standingcash-settledawardson1January2003.Theeffectsof restatement were as follows: the opening balance of retainedearnings at1 January2003was creditedbyCHF559million.Additionalcompensationexpenseofzerowasrecognizedin2004.Thechangeincompensationexpenseisattributable to the first-time recognition of compensationexpense for the fair valueof shareoptions,aswell as therecognition of expense for share awards over the vestingperiod. Previously, share awardswere recognized as com-pensation expense in the performance year, which is gener-allytheyearpriortogrant.Thereasonforthezeroimpactin2004wasthatasignificantlyhigheramountofbonuspay-ments were made in the form of share awards rather than cash.Thereversalofcompensationexpenseattributabletothese share payments offsets the effect from recognizing optionsatfairvalueandshareawardsmadepriorto2004overthevestingperiod.UBSintroducedanewvaluationmodeltodeterminethe
fairvalueofshareoptionsgrantedin2005andlater.Shareoptions granted in 2004 and earlier were not affected by this change invaluationmodel.Aspartofthe implementation of IFRS 2, UBS thoroughly reviewed the option valuationmodelemployedinthepastbycomparingitwithalternativemodels.As a result of this review, a valuationmodelwasidentified thatbetter reflects theexercisebehaviorof em-ployeesandthespecifictermsandconditionsunderwhichtheshareoptionsaregranted.Concurrentwiththeintroduc-tion of the new model, UBS is using implied and historical volatilityasinputs.UBS also has employee benefit trusts that are used in
connection with share-based payment arrangements and deferredcompensationschemes.Inconnectionwiththeis-suance of IFRS 2, the IFRIC amended SIC 12 Consolidation –Special Purpose Entities, aninterpretationofIAS27,toelim-inate the scope exclusion for equity compensation plans.Therefore, pursuant to the criteria set out in SIC 12, an en-
Financial StatementsNotes to the Financial Statements

101
titythatcontrolsanemployeebenefittrust(orsimilarentity)set up for the purpose of a share-based payment arrange-ment is required to consolidate that trust. Consolidatingthese trusts had the following effects: on 1 January 2003, no adjustmenttoopeningretainedearningswasmadeasassetsandliabilitiesofthetrustswereequal.ConsolidationledtorecognitionoftotalassetsintheamountofCHF1.1billionandCHF1.3billionandliabilitiesofCHF1.1billionandCHF1.3billionat31December2004and2003respectively.Theamountof treasury shares increasedbyCHF2,029millionand CHF 1,474 million at 31 December 2004 and 2003respectively. The weighted average number of treasuryshares held by these trusts was 45,991,908 in 2004, thus decreasing the denominator used to calculate basic earnings per share. The reduction inweighted average shares out-standing increased basic earnings per share, but had no im-pact on diluted earnings per share as the additional treasury shareswillbefullyaddedbackforcalculatingdilutedearn-ingspershare.
Goodwill and Intangible AssetsOn31March2004,theIASBissuedIFRS3Business Combi-nations, revised IAS36 Impairment of Assets and revisedIAS 38 Intangible Assets. UBS prospectively adopted thestandards for goodwill and intangible assets existing at 31March2004on1January2005,whereasgoodwillandintangible assets recognized from business combinations enteredintoafter31March2004wereaccountedforim-mediatelyinaccordancewithIFRS3.Goodwillisnolongeramortized,but insteadreviewedannuallyfor impairment.UBS recordedgoodwillamortizationexpenseofCHF722millionin2004.
Intangible assets acquired in a business combination must berecognizedseparatelyfromgoodwilliftheymeetdefinedrecognition criteria. Existing intangible assets that do notmeettherecognitioncriteriaunderthenewstandardshavetobereclassifiedtogoodwill.On1January2005,UBSre-classifiedthetrainedworkforceintangibleassetrecognizedin connectionwith theacquisitionof PaineWebberwithabookvalueofCHF1.0billiontogoodwill.
Insurance ContractsOn31March2004,theIASBissuedIFRS4 Insurance Con-tracts. The standard applies to all insurance contracts written andtoreinsurancecontractsheld.ThemajorityofinsuranceproductsissuedbyUBSisconsideredtobeinvestmentcon-tractsandisaccountedforasfinancialliabilitiesandnotasinsurancecontractsunderIFRS4.TherelatedassetsofCHF19billionwerereclassifiedfromOtherassetstoTradingport-folioassets in2004.UBSadoptedthenewstandardasof 1January2005andappliesittoitsinsurancecontracts.ThenewstandarddidnothaveamaterialeffectontheFinancialStatements.
Non-current Assets Held for Sale and Discontinued OperationsOn 31 March 2004, the IASB issued IFRS 5 Non-current Assets Held for Sale and Discontinued Operations. The stan-dard requires that non-current assets or disposal groups be classifiedasheldforsale if theircarryingamount is recov-ered principally through a sale transaction rather than through continuing use. Such assets aremeasured at thelowerofcarryingamountandfairvaluelesscoststosellandare classified separately from other assets in the balancesheet.Nettingofassetsandliabilitiesisnotpermitted.Dis-continued operations are presented on the face of the in-come statement as a single amount comprising the total of theNetprofitandlossfromdiscontinuedoperationsandthegain or loss after tax recognized on the sale or the measure-menttofairvaluelesscoststosellofthenetassetsconstitut-ingthediscontinuedoperations.Intheperiodwhereanop-eration ispresented for thefirst timeasdiscontinued, theincomestatementsforallcomparativepriorperiodspresent-edarerestatedtopresentthatoperationasdiscontinued.IFRS5providescertaincriteriatobemetforacomponent
of an entity to be defined as a discontinued operation.PrivateBanks&GAM,Motor-ColumbusandcertainprivateequityinvestmentsmeetthisdefinitionandwerereclassifiedtoDiscontinuedoperations.UBSadoptedthenewstandardon1January2005andrestatedthecomparativeprioryear2004.The incomestatement isnowdivided into twosec-tions:NetprofitfromcontinuingoperationsandNetprofitfromdiscontinuedoperations.Refer toNote38Discontin-uedOperationsfordetails.
Presentation of minority interests and earnings per shareWiththeadoptionofrevisedIAS1Presentation of Financial Statements on 1 January 2005, Net profit and Equity arepresentedincludingminorityinterests.NetprofitissplitintoNetprofitattributabletoUBSshareholdersandNetprofitat-tributabletominorityinterests.Earningspersharecontinueto be calculated based on Net profit attributable to UBSshareholders, but they are split into Earnings per share from continuing operations and from discontinued operations.Minority interestsandEarningspersharearepresentedonthefaceoftheincomestatement.
Financial Instruments On1 January2004,UBSadopted revised IAS32Financial Instruments: Disclosure and Presentation and revised IAS 39 Financial Instruments: Recognition and Measurement, which wereappliedretrospectively toallfinancial instrumentsaf-fected by the two standards, except the guidance relating to derecognitionoffinancialassetsandliabilitiesand,inpart,recognition of Day 1 profit and loss, which were appliedprospectively.Asaresultofadoptingtherevisedstandards,UBSrestatedpriorperiodcomparativeinformation.

102
RevisedIAS32amendedtheaccountingforcertainde-rivativecontractslinkedtoanentity’sownshares.Physicallysettled written put options and forward purchase contracts with UBS shares as their underlying are recorded as liabili- ties – see part a 23). UBS currently has physically settledwrittenputoptionslinkedtoownshares.Thepresentvalueof the contractual amount of these options is recorded as a liability,while the premium received is credited to Equity.LiabilitiesofCHF96millionat31December2004andCHF49millionat31December2003weredebitedtoEquityat-tributabletoUBSshareholdersduetowrittenputoptions.The impact on the income statement of all periods present-ed is insignificant. All other existing derivative contractslinkedtoownsharesareaccountedforasderivativeinstru-ments and are carried at fair value on the balance sheetunderPositivereplacementvaluesorNegativereplacementvalues.RevisedIAS39permitsanyfinancialinstrumenttobedes-
ignated at inception, or at adoptionof revised IAS39, ascarriedatfairvaluethroughprofitorloss.UponadoptionofrevisedIAS39,UBSmadethatdesignationforthemajorityof its compound instruments issued. Previously, UBSseparatedtheembeddedderivativefromthehostcontractand accounted for the separated derivative as a tradinginstrument.Theamountsarenowincludedonthebalancesheet within the line item Financial liabilities designated at fair value,withamountsofCHF117,401millionandCHF65,756million at 31December 2005 and2004being re-ported in that line.Also,at31December2005and2004assetsintheamountofCHF1,153millionandCHF653mil-lion are reported in the line Financial assets designated at fairvalue.Theguidancegoverningrecognitionandderecognitionof
afinancialassetisconsiderablymorecomplexunderrevisedIAS39thanpreviouslyandrequiresamulti-stepdecisionpro-cesstodeterminewhetherderecognitionisappropriate.Seeparta4)foradiscussionoftheaccountingpoliciesregardingderecognition.Asaresult,certaintransactionsarenowac-countedforassecuredfinancingtransactionsinsteadofpur-chases or sales of trading portfolio assets with an accompa-nyingswapderivative.Theprovisionsofthisguidancewereappliedprospectivelyfrom1January2004.
Credit losses incurred on OTC derivativesEffective 1 January 2004, the method of accounting forcreditlossesincurredonover-the-counter(OTC)derivativeswaschanged.AllsuchcreditlossesarenowreportedinNettrading income and are no longer reported in Credit loss expense.ThischangedidnotaffectNetprofitorEarningsper share. Itdid,however,affect segment reporting, sincelosses reportedasCredit loss expensewerepreviouslyde-ferredoverathree-yearperiod intheBusinessGroupseg-ment reporting, whereas, under the changed method of
accounting,lossesintradingincomearenotsubjecttosuchadeferral.Inthesegmentreport,therefore,lossesonOTCderivativesarenowreportedastheyareincurred.
Segment reportingOn 1 July 2005, UBS integrated its two wealth management businessesintooneBusinessGroup,GlobalWealthManage-ment & Business Banking. As part of the integration, themunicipalsecuritiesunitwithintheformerWealthManage-mentUSwastransferredintotheInvestmentBank.Theinte-gration had no effect on the presentation of segments in Note2a,andWealthManagementUScontinuestobere-portedasaseparatesegment.ThecomparativepriorperiodinformationfortheWealthManagementUSandInvestmentBanksegmentshasbeenrestatedtoreflectthetransferofthemunicipalsecuritiesunit.In2005and2004,themunici-pal securities unit contributed between 7% and 9% to WealthManagementUSrevenuesandasubstantialportiontoperformancebeforetax.
On 1 July 2004, UBS purchased an additional 20% inter-estinMotor-ColumbusAG,increasingitsoverallownershipstake to 55.6%. Motor-Columbus was consolidated on 1July2004,whenUBSgainedcontroloverthecompany.Duetoitssizeandthenatureofitsbusiness(production,distributionandtradingofelectricity)anewbusinessseg-ment,IndustrialHoldings,wasaddedinwhichMotor-Co-lumbuswas reported.Motor-Columbus is presentedas adiscontinued operation in these Financial Statements due tothesaleon23March2006.AlsoincludedintheIndus-trialHoldings segment are all private equity investments,which comprise businesses of a predominantly industrial nature.
c) International Financial Reporting Standards and Interpretations to be adopted in 2007 and later
IFRS 7 Financial Instruments: DisclosuresEffective1January2007,UBSwilladoptthedisclosurere-quirementsforfinancialinstrumentsunderIFRS7.Thenewstandard has no impact on recognition, measurement and presentation of financial instruments. Accordingly, it willhavenoeffectonNetprofitandEquity.Rather, it requiresentities to provide disclosures in their financial statementsthatenableuserstoevaluate:a)thesignificanceoffinancialinstruments for the entity’s financial position and perfor-mance;andb)thenatureandextentofthecredit,marketandliquidityrisksarisingfromfinancial instrumentsduringthe period and at the reporting date, and how the entity manages those risks.Theprinciplesof IFRS7complementthe principles for recognizing, measuring and presenting financial assets and financial liabilities in IAS 32 Financial Instruments: PresentationandIAS39Financial Instruments: Recognition and Measurement.
Financial StatementsNotes to the Financial Statements

103
UBShasenteredintotransactionsforwhichfairvalueisdeterminedusingvaluationmodelsforwhichnotall inputsaremarket-observablepricesorrates.Suchfinancial instru-mentsareinitiallyrecognizedinUBS’sFinancialStatementsatthe transaction price, which is generally the best indicator of fairvalue,althoughthevalueobtainedfromtherelevantval-uationmodelmaydiffer.Wheresuchdifferencesarise,UBSwillberequiredbyIFRS7todisclose,byclassoffinancialin-strument:(a)itsaccountingpolicyforrecognizingthatdiffer-enceinprofitorlosstoreflectachangeinfactors(includingtime) thatmarket participantswould consider in setting aprice,and(b)theaggregatedifferenceyettoberecognizedinprofitorlossatthebeginningandendoftheperiodandareconciliationofchangesinthebalanceofthisdifference.
IFRS 8 Operating Segments The new standard on segment reporting, IFRS 8 Operating Segments, comes into force on 1 January 2009, replacing IAS14Segment Reporting.Itsetsoutrequirementsfordis-closureofinformationaboutafirm’soperatingsegments,itsproducts and services, the geographical areas in which itoperates,anditsmajorcustomers.Thenewstandardintro-duceschangestopreviousrequirementsforidentificationofsegments, measurement of segment information and disclo-sures.Specifically,itrequiresafirmtoprovidefinancialanddescriptiveinformationaboutitsreportablesegments–theoperating segments or aggregations of operating segments based onwhich the seniormanagement of the firm (the“chiefoperatingdecisionmaker”)regularlyevaluatessepa-rate financial information in deciding how to allocate re-sources and how to assess performance.Generally, underIFRS 8, the information to be reported will be the same infor-mation that is used internally, which might differ from amountsreportedinthefinancialstatements.Thenewstan-dard therefore requires an explanation of the basis on which the segment information is prepared, and reconciliations to the amounts presented in the income statement and the bal-ancesheet.UBSiscurrentlyassessingtheimpactofIFRS8onthe structure and content of the segment reporting in its financialstatements,andwhether,aspermittedbythestan-dard,toapplyitfrom1January2008.
IFRIC 7 Applying the Restatement Approach under IAS 29 Financial Reporting in Hyperinflationary Economies will be appliedon1January2007.ThisInterpretationprovidesguid-anceonhowtoapplytherequirementsofIAS29inareport-ing period in which an entity (this could be a subsidiary)identifiestheexistenceofhyperinflationintheeconomyofits functional currency, when that economy was not hyperin-flationaryinthepriorperiod,andtheentitythereforerestatesitsfinancialstatementsinaccordancewithIAS29.Itisnotexpected that this guidancewill have an impact onUBS’sFinancialStatements.
IFRIC 8 Scope of IFRS 2IFRIC 8 was issued in January 2006. This IFRIC addresseswhether IFRS 2 applies to transactions in which the entity cannotidentifyspecificallysomeorallofthegoodsorser-vicesreceived.TheInterpretationrequiresthatIFRS2beap-pliedtotransactionsinwhichgoodsorservicesarereceived,suchastransactionsinwhichanentityreceivesgoodsorser-vicesas consideration forequity instrumentsof theentity.This includes transactions in which the entity cannot identify specificallysomeorallofthegoodsorservicesreceived.Theunidentifiablegoodsorservicesreceived(ortobereceived)shouldbemeasuredasthedifferencebetweenthefairvalueoftheshare-basedpaymentandthefairvalueofanyidenti-fiablegoodsor services received (or tobe received).Mea-surement of the unidentifiable goods or services receivedshould take place at the grant date. However, for cash- settled transactions, the liability should be re-measured at each reporting date until it is settled. UBSwill adopt theInterpretation on 1 January 2007. This Interpretation willhavenosignificantimpactonUBS’sFinancialStatements.
IFRIC 9 Reassessment of Embedded Derivatives TheInterpretationclarifiesthatanentityshouldnotreassesswhetheranembeddedderivativeneedstobeseparatedfromthe host contract after the initial hybrid contract is recog-nized, unless there is a change in the terms of the contract that significantly modifies the cash flows that otherwisewould be required under the contract, in which case reas-sessment is required. UBSwill adopt this Interpretation of IAS39on1January2007.ItisnotexpectedthatthisInter-pretationwill have a significant impact on UBS’s FinancialStatements.
IFRIC 10, Interim Financial Reporting and Impairment ThenewInterpretationof IAS39requiresthat impairmentlossesrecognizedinapreviousinterimperiodinrespectofgoodwilloraninvestmentineitheranequityinstrumentorafinancial asset carriedat costmustnotbe reversedatasubsequent balance sheet date. UBS will adopt this Inter-pretationfrom1January2007onwards.It isnotexpectedthatthisinterpretationwillhaveasignificantimpactonUBS’sFinancialStatements.
IFRIC 11, IFRS 2: Group and Treasury Share TransactionsIFRIC11wasissuedinNovember2006andprovidesguid-ance on (a) how to account for share-based payment ar-rangementsbetweenentitieswithinthesamegroup;(b)de-termining whether a transaction should be accounted for as equity-settled or cash-settled when an entity either chooses orisrequiredtobuyequityinstruments(i.e.treasuryshares)from another party, to satisfy its obligations to its employees; and (c) determining whether a transaction should be ac-countedforasequity-settledorcash-settledwhenanentity’s

104
employees are granted rights to equity instruments of the entity(e.g.shareoptions),eitherbytheentityitselforbyitsshareholders,andtheshareholdersoftheentityprovidetheequityinstrumentsneeded.TheInterpretationrequiresthatshare-basedpaymenttransactionsinwhichanentityreceivesservicesasconsiderationfor itsownequity instrumentsbeaccountedforasanequity-settledtransaction.Thisapplies
Financial StatementsNotes to the Financial Statements
regardless of whether the entity chooses or is required to buy those equity instruments from another party to satisfy its obligations to its employees under the share-based payment arrangement.UBSwilladopttheinterpretationon1January2007.ItisnotexpectedtohaveasignificantimpactonUBS’sFinancialStatements.

105
GlobalAssetManagementGlobal Asset Management provides investment productsandservicestoinstitutionalinvestorsandwholesaleinterme-diariesaroundtheglobe.Clientsincludecorporateandpub-licpensionplans,financialinstitutionsandadvisors,centralbanks,charities,foundationsandindividualinvestors.
InvestmentBankTheInvestmentBankoperatesgloballyasaclient-drivenin-vestment banking and securities firm providing innovativeproducts,research,adviceandcompleteaccesstotheworld’scapitalmarketsfor intermediaries,governments,corporateandinstitutionalclientsandotherpartsofUBS.
Corporate CenterCorporate Center ensures that the Business Groups operate asacoherentandeffectivewholewithacommonsetofval-ues and principles in such areas as riskmanagement andcontrol,financialreporting,marketingandcommunications,funding, capital and balance sheet management, manage-ment of foreign currency earnings, information technology infrastructure and service centers. Private Banks & GAM,which was shown as a separate segment within Corporate Centerinprioryears,wassoldon2December2005andispresentedasdiscontinuedoperations.
IndustrialHoldingsTheIndustrialHoldingssegmentcomprisesthenon-financialbusinesses of UBS, including the private equity businesswhichprimarilyinvestsUBSandthird-partyfundsinunlistedcompanies. Themost significantbusiness in this segment,Motor-Columbus,wassoldon23March2006and ispre-sented as discontinued operations. Additionally, certainprivateequityinvestmentssoldin2006andprioryearsarepresentedasdiscontinuedoperations.
UBS’s financial businesses are organized on aworldwidebasisintothreeBusinessGroupsandtheCorporateCenter.GlobalWealthManagement&BusinessBankingconsistsofthreesegments,WealthManagementInternational&Swit-zerland, Wealth Management US and Business BankingSwitzerland. The Business Groups Investment Bank andGlobalAssetManagement constitute one segment each.The Corporate Center is now comprised of only one seg-ment,afterthesaleofPrivateBanks&GAMon2Decem-ber2005.Priortothis,CorporateCenterconsistedoftwosegments,CorporateFunctionsandPrivateBanks&GAM.Inaddition,theIndustrialHoldingssegmentholdsallindus-trialoperationscontrolledbytheGroup.Intotal,UBSnowreportssevenbusinesssegments.
GlobalWealthManagement&BusinessBankingGlobalWealthManagement&BusinessBankingcomprisesthreesegments.WealthManagementInternational&Swit-zerland offers a comprehensive range of products andservices individually tailored to affluent international andSwissclientsandoperatesfromofficesaroundtheworld.WealthManagementUSisaUSfinancialservicesfirmpro-vidingsophisticatedwealthmanagementservicestoafflu-ent US clients through a highly trained financial advisornetwork.BusinessBankingSwitzerlandprovidesindividualand corporate clients in Switzerland with a complete port-folio of banking and securities services, focused on cus-tomerserviceexcellence,profitabilityandgrowth,usingamulti-channeldistribution.Thesegmentssharetechnologi-calandphysicalinfrastructure,andhavejointdepartmentssupportingmajorfunctionssuchase-commerce,financialplanningandwealthmanagement, investmentpolicyandstrategy.
Note 2a Segment Reporting by Business Group

106
Financial StatementsNotes to the Financial Statements
Note 2a Reporting by Business Group (continued)
For the year ended 31 December 2006
Financial BusinessesIndustrial Holdings UBS
Global Wealth Management & Business Banking
Global Asset Management
Investment Bank
Corporate Center
CHF million
Wealth Management International &
Switzerland
Wealth Management
USBusiness Banking
Switzerland
Internalchargesandtransferpricingadjustmentsarereflectedintheperformanceofeachbusiness.Revenue-sharingagreementsareusedtoallocateexternalcus-tomerrevenuestoaBusinessGrouponareasonablebasis.TransactionsbetweenBusiness Groups are conducted at internally agreed transfer prices or at arm’slength.
Income 1 10,827 5,863 5,085 3,220 21,726 294 994 48,009
Credit loss (expense) / recovery 1 (1) 109 0 47 0 0 156
Total operating income 10,828 5,862 5,194 3,220 21,773 294 994 48,165
Personnel expenses 3,137 3,800 2,412 1,503 11,353 1,264 202 23,671
General and administrative expenses 885 1,073 1,070 399 3,260 1,242 187 8,116
Services (to) / from other business units 1,479 281 (642) (105) 956 (1,978) 9 0
Depreciation of property and equipment 84 74 74 27 203 4 783 18 1,263
Amortization of intangible assets 2 10 53 0 4 72 9 5 153
Goods and materials purchased 295 295
Total operating expenses 5,595 5,281 2,914 1,828 15,844 1,320 716 33,498
Business Group performance from continuing operations before tax 5,233 581 2,280 1,392 5,929 (1,026) 278 14,667
Business Group performance from discontinued operations before tax 4 852 856
Business Group performance before tax 5,233 581 2,280 1,392 5,929 (1,022) 1,130 15,523
Tax expense on continuing operations 2,786
Tax expense on discontinued operations (13)
Net profit 12,750
Additional information 3
Total assets 286,241 63,249 211,123 48,616 2,108,828 (323,434) 1,888 2,396,511
Total liabilities 281,327 57,681 205,747 46,589 2,089,140 (343,152) 3,404 2,340,736
Capital expenditure 257 273 14 498 593 1,385 97 3,117
Management reporting based on expected credit loss
For internal management reporting purposes, credit loss is measured using an expectedlossconcept.ThistableshowsBusinessGroupperformanceconsistentwith the way the businesses are managed and the way Business Group perfor-manceismeasured.Expectedcreditlossreflectstheaverageannualcoststhatareexpectedtoarise frompositions in thecurrentportfolio thatbecome impaired.TheadjustedexpectedcreditlossreportedforeachBusinessGroupistheexpectedcredit loss on its portfolio plus the difference between credit loss expense and expectedcreditloss,amortizedoverathreeyearperiod.ThedifferencebetweentheseadjustedexpectedcreditlossfiguresandthecreditlossexpenserecordedatGroup level forreportingpurposes is reported inCorporateCenterasAdjustedexpectedcreditloss.
Income 1 10,827 5,863 5,085 3,220 21,726 294 994 48,009
Adjusted expected credit loss (29) 0 185 0 61 (61) 0 156
Total operating income 10,798 5,863 5,270 3,220 21,787 233 994 48,165
Personnel expenses 3,137 3,800 2,412 1,503 11,353 1,264 202 23,671
General and administrative expenses 885 1,073 1,070 399 3,260 1,242 187 8,116
Services (to) / from other business units 1,479 281 (642) (105) 956 (1,978) 9 0
Depreciation of property and equipment 84 74 74 27 203 4 783 18 1,263
Amortization of intangible assets 2 10 53 0 4 72 9 5 153
Goods and materials purchased 295 295
Total operating expenses 5,595 5,281 2,914 1,828 15,844 1,320 716 33,498
Business Group performance from continuing operations before tax 5,203 582 2,356 1,392 5,943 (1,087) 278 14,667
Business Group performance from discontinued operations before tax 4 852 856
Business Group performance before tax 5,203 582 2,356 1,392 5,943 (1,083) 1,130 15,523
Tax expense on continuing operations 2,786
Tax expense on discontinued operations (13)
Net profit 12,7501 Impairments of financial investments available-for-sale for the year ended 31 December 2006 were as follows: Global Wealth Management & Business Banking CHF 8 million; Global Asset Management CHF 1 million; Investment Bank CHF 5 million; Corporate Center CHF (2) million and Industrial Holdings CHF 23 million. 2 For further information regarding goodwill and other intangible assets by Business Group, please see Note 16: Goodwill and Other Intangible Assets. 3 The funding surplus or requirement is reflected in each Business Group and adjusted in Corporate Center. 4 Includes a CHF 34 million software impairment.

107
Note 2a Reporting by Business Group (continued)
For the year ended 31 December 2006
Financial BusinessesIndustrial Holdings UBS
Global Wealth Management & Business Banking
Global Asset Management
Investment Bank
Corporate Center
CHF million
Wealth Management International &
Switzerland
Wealth Management
USBusiness Banking
Switzerland
Internalchargesandtransferpricingadjustmentsarereflectedintheperformanceofeachbusiness.Revenue-sharingagreementsareusedtoallocateexternalcus-tomerrevenuestoaBusinessGrouponareasonablebasis.TransactionsbetweenBusiness Groups are conducted at internally agreed transfer prices or at arm’slength.
Income 1 10,827 5,863 5,085 3,220 21,726 294 994 48,009
Credit loss (expense) / recovery 1 (1) 109 0 47 0 0 156
Total operating income 10,828 5,862 5,194 3,220 21,773 294 994 48,165
Personnel expenses 3,137 3,800 2,412 1,503 11,353 1,264 202 23,671
General and administrative expenses 885 1,073 1,070 399 3,260 1,242 187 8,116
Services (to) / from other business units 1,479 281 (642) (105) 956 (1,978) 9 0
Depreciation of property and equipment 84 74 74 27 203 4 783 18 1,263
Amortization of intangible assets 2 10 53 0 4 72 9 5 153
Goods and materials purchased 295 295
Total operating expenses 5,595 5,281 2,914 1,828 15,844 1,320 716 33,498
Business Group performance from continuing operations before tax 5,233 581 2,280 1,392 5,929 (1,026) 278 14,667
Business Group performance from discontinued operations before tax 4 852 856
Business Group performance before tax 5,233 581 2,280 1,392 5,929 (1,022) 1,130 15,523
Tax expense on continuing operations 2,786
Tax expense on discontinued operations (13)
Net profit 12,750
Additional information 3
Total assets 286,241 63,249 211,123 48,616 2,108,828 (323,434) 1,888 2,396,511
Total liabilities 281,327 57,681 205,747 46,589 2,089,140 (343,152) 3,404 2,340,736
Capital expenditure 257 273 14 498 593 1,385 97 3,117
Management reporting based on expected credit loss
For internal management reporting purposes, credit loss is measured using an expectedlossconcept.ThistableshowsBusinessGroupperformanceconsistentwith the way the businesses are managed and the way Business Group perfor-manceismeasured.Expectedcreditlossreflectstheaverageannualcoststhatareexpectedtoarise frompositions in thecurrentportfolio thatbecome impaired.TheadjustedexpectedcreditlossreportedforeachBusinessGroupistheexpectedcredit loss on its portfolio plus the difference between credit loss expense and expectedcreditloss,amortizedoverathreeyearperiod.ThedifferencebetweentheseadjustedexpectedcreditlossfiguresandthecreditlossexpenserecordedatGroup level forreportingpurposes is reported inCorporateCenterasAdjustedexpectedcreditloss.
Income 1 10,827 5,863 5,085 3,220 21,726 294 994 48,009
Adjusted expected credit loss (29) 0 185 0 61 (61) 0 156
Total operating income 10,798 5,863 5,270 3,220 21,787 233 994 48,165
Personnel expenses 3,137 3,800 2,412 1,503 11,353 1,264 202 23,671
General and administrative expenses 885 1,073 1,070 399 3,260 1,242 187 8,116
Services (to) / from other business units 1,479 281 (642) (105) 956 (1,978) 9 0
Depreciation of property and equipment 84 74 74 27 203 4 783 18 1,263
Amortization of intangible assets 2 10 53 0 4 72 9 5 153
Goods and materials purchased 295 295
Total operating expenses 5,595 5,281 2,914 1,828 15,844 1,320 716 33,498
Business Group performance from continuing operations before tax 5,203 582 2,356 1,392 5,943 (1,087) 278 14,667
Business Group performance from discontinued operations before tax 4 852 856
Business Group performance before tax 5,203 582 2,356 1,392 5,943 (1,083) 1,130 15,523
Tax expense on continuing operations 2,786
Tax expense on discontinued operations (13)
Net profit 12,7501 Impairments of financial investments available-for-sale for the year ended 31 December 2006 were as follows: Global Wealth Management & Business Banking CHF 8 million; Global Asset Management CHF 1 million; Investment Bank CHF 5 million; Corporate Center CHF (2) million and Industrial Holdings CHF 23 million. 2 For further information regarding goodwill and other intangible assets by Business Group, please see Note 16: Goodwill and Other Intangible Assets. 3 The funding surplus or requirement is reflected in each Business Group and adjusted in Corporate Center. 4 Includes a CHF 34 million software impairment.

108
Financial StatementsNotes to the Financial Statements
Note 2a Reporting by Business Group (continued)
For the year ended 31 December 2005
Financial BusinessesIndustrial Holdings UBS
Global Wealth Management & Business Banking
Global Asset Management
Investment Bank
Corporate Center
CHF million
Wealth Management International &
Switzerland
Wealth Management
USBusiness Banking
SwitzerlandPrivate Banks
& GAMCorporate Functions
Internalchargesandtransferpricingadjustmentsarereflectedintheperformanceofeachbusiness.Revenue-sharingagreementsareusedtoallocateexternalcus-tomerrevenuestoaBusinessGrouponareasonablebasis.TransactionsbetweenBusiness Groups are conducted at internally agreed transfer prices or at arm’slength.
Income 1 9,024 5,158 4,949 2,487 17,448 455 1,236 40,757
Credit loss (expense) / recovery (8) 0 231 0 152 0 0 375
Total operating income 9,016 5,158 5,180 2,487 17,600 455 1,236 41,132
Personnel expenses 2,579 3,460 2,450 988 9,259 1,167 245 20,148
General and administrative expenses 804 1,047 994 304 2,215 1,084 184 6,632
Services (to) / from other business units 1,371 223 (634) 116 640 (1,730) 14 0
Depreciation of property and equipment 89 65 72 21 136 857 21 1,261
Amortization of intangible assets 2 7 49 0 1 53 17 4 131
Goods and materials purchased 283 283
Total operating expenses 4,850 4,844 2,882 1,430 12,303 1,395 751 28,455
Business Group performance from continuing operations before tax 4,166 314 2,298 1,057 5,297 (940) 485 12,677
Business Group performance from discontinued operations before tax 4,556 8 496 5,060
Business Group performance before tax 4,166 314 2,298 1,057 5,297 4,556 (932) 981 17,737
Tax expense on continuing operations 2,471
Tax expense on discontinued operations 576
Net profit 14,690
Additional information 3
Total assets 223,790 64,896 176,837 40,782 1,766,563 (226,069) 11,549 2,058,348
Total liabilities 219,140 59,567 170,668 39,191 1,748,934 (242,600) 11,814 2,006,714
Capital expenditure 81 84 58 16 138 25 1,264 299 1,965
Management reporting based on expected credit loss
For internal management reporting purposes, credit loss is measured using an expectedlossconcept.ThistableshowsBusinessGroupperformanceconsistentwith the way the businesses are managed and the way Business Group perfor-manceismeasured.Expectedcreditlossreflectstheaverageannualcoststhatareexpectedtoarise frompositions in thecurrentportfolio thatbecome impaired.TheadjustedexpectedcreditlossreportedforeachBusinessGroupistheexpectedcredit loss on its portfolio plus the difference between credit loss expense and expectedcreditloss,amortizedoverathreeyearperiod.ThedifferencebetweentheseadjustedexpectedcreditlossfiguresandthecreditlossexpenserecordedatGrouplevelforreportingpurposesisreportedinCorporateFunctionsasAdjustedexpectedcreditloss.
Income 1 9,024 5,158 4,949 2,487 17,448 455 1,236 40,757
Adjusted expected credit loss (13) (2) 122 0 36 232 0 375
Total operating income 9,011 5,156 5,071 2,487 17,484 687 1,236 41,132
Personnel expenses 2,579 3,460 2,450 988 9,259 1,167 245 20,148
General and administrative expenses 804 1,047 994 304 2,215 1,084 184 6,632
Services (to) / from other business units 1,371 223 (634) 116 640 (1,730) 14 0
Depreciation of property and equipment 89 65 72 21 136 857 21 1,261
Amortization of intangible assets 2 7 49 0 1 53 17 4 131
Goods and materials purchased 283 283
Total operating expenses 4,850 4,844 2,882 1,430 12,303 1,395 751 28,455
Business Group performance from continuing operations before tax 4,161 312 2,189 1,057 5,181 (708) 485 12,677
Business Group performance from discontinued operations before tax 4,508 56 496 5,060
Business Group performance before tax 4,161 312 2,189 1,057 5,181 4,508 (652) 981 17,737
Tax expense on continuing operations 2,471
Tax expense on discontinued operations 576
Net profit 14,6901 Impairments of financial investments available-for-sale for the year ended 31 December 2005 were as follows: Global Wealth Management & Business Banking CHF 10 million; Global Asset Manage-ment CHF 0 million; Investment Bank CHF 0 million; Corporate Center CHF 16 million and Industrial Holdings CHF 81 million. 2 For further information regarding goodwill and other intangible assets by Business Group, please see Note 16: Goodwill and Other Intangible Assets. 3 The funding surplus or requirement is reflected in each Business Group and adjusted in Corporate Center.

109
Note 2a Reporting by Business Group (continued)
For the year ended 31 December 2005
Financial BusinessesIndustrial Holdings UBS
Global Wealth Management & Business Banking
Global Asset Management
Investment Bank
Corporate Center
CHF million
Wealth Management International &
Switzerland
Wealth Management
USBusiness Banking
SwitzerlandPrivate Banks
& GAMCorporate Functions
Internalchargesandtransferpricingadjustmentsarereflectedintheperformanceofeachbusiness.Revenue-sharingagreementsareusedtoallocateexternalcus-tomerrevenuestoaBusinessGrouponareasonablebasis.TransactionsbetweenBusiness Groups are conducted at internally agreed transfer prices or at arm’slength.
Income 1 9,024 5,158 4,949 2,487 17,448 455 1,236 40,757
Credit loss (expense) / recovery (8) 0 231 0 152 0 0 375
Total operating income 9,016 5,158 5,180 2,487 17,600 455 1,236 41,132
Personnel expenses 2,579 3,460 2,450 988 9,259 1,167 245 20,148
General and administrative expenses 804 1,047 994 304 2,215 1,084 184 6,632
Services (to) / from other business units 1,371 223 (634) 116 640 (1,730) 14 0
Depreciation of property and equipment 89 65 72 21 136 857 21 1,261
Amortization of intangible assets 2 7 49 0 1 53 17 4 131
Goods and materials purchased 283 283
Total operating expenses 4,850 4,844 2,882 1,430 12,303 1,395 751 28,455
Business Group performance from continuing operations before tax 4,166 314 2,298 1,057 5,297 (940) 485 12,677
Business Group performance from discontinued operations before tax 4,556 8 496 5,060
Business Group performance before tax 4,166 314 2,298 1,057 5,297 4,556 (932) 981 17,737
Tax expense on continuing operations 2,471
Tax expense on discontinued operations 576
Net profit 14,690
Additional information 3
Total assets 223,790 64,896 176,837 40,782 1,766,563 (226,069) 11,549 2,058,348
Total liabilities 219,140 59,567 170,668 39,191 1,748,934 (242,600) 11,814 2,006,714
Capital expenditure 81 84 58 16 138 25 1,264 299 1,965
Management reporting based on expected credit loss
For internal management reporting purposes, credit loss is measured using an expectedlossconcept.ThistableshowsBusinessGroupperformanceconsistentwith the way the businesses are managed and the way Business Group perfor-manceismeasured.Expectedcreditlossreflectstheaverageannualcoststhatareexpectedtoarise frompositions in thecurrentportfolio thatbecome impaired.TheadjustedexpectedcreditlossreportedforeachBusinessGroupistheexpectedcredit loss on its portfolio plus the difference between credit loss expense and expectedcreditloss,amortizedoverathreeyearperiod.ThedifferencebetweentheseadjustedexpectedcreditlossfiguresandthecreditlossexpenserecordedatGrouplevelforreportingpurposesisreportedinCorporateFunctionsasAdjustedexpectedcreditloss.
Income 1 9,024 5,158 4,949 2,487 17,448 455 1,236 40,757
Adjusted expected credit loss (13) (2) 122 0 36 232 0 375
Total operating income 9,011 5,156 5,071 2,487 17,484 687 1,236 41,132
Personnel expenses 2,579 3,460 2,450 988 9,259 1,167 245 20,148
General and administrative expenses 804 1,047 994 304 2,215 1,084 184 6,632
Services (to) / from other business units 1,371 223 (634) 116 640 (1,730) 14 0
Depreciation of property and equipment 89 65 72 21 136 857 21 1,261
Amortization of intangible assets 2 7 49 0 1 53 17 4 131
Goods and materials purchased 283 283
Total operating expenses 4,850 4,844 2,882 1,430 12,303 1,395 751 28,455
Business Group performance from continuing operations before tax 4,161 312 2,189 1,057 5,181 (708) 485 12,677
Business Group performance from discontinued operations before tax 4,508 56 496 5,060
Business Group performance before tax 4,161 312 2,189 1,057 5,181 4,508 (652) 981 17,737
Tax expense on continuing operations 2,471
Tax expense on discontinued operations 576
Net profit 14,6901 Impairments of financial investments available-for-sale for the year ended 31 December 2005 were as follows: Global Wealth Management & Business Banking CHF 10 million; Global Asset Manage-ment CHF 0 million; Investment Bank CHF 0 million; Corporate Center CHF 16 million and Industrial Holdings CHF 81 million. 2 For further information regarding goodwill and other intangible assets by Business Group, please see Note 16: Goodwill and Other Intangible Assets. 3 The funding surplus or requirement is reflected in each Business Group and adjusted in Corporate Center.

110
Financial StatementsNotes to the Financial Statements
Note 2a Reporting by Business Group (continued)
For the year ended 31 December 2004
Financial BusinessesIndustrial Holdings 1 UBS
Global Wealth Management & Business BankingGlobal Asset
ManagementInvestment
BankCorporate
Center
CHF million
Wealth Management International &
Switzerland
Wealth Management
USBusiness Banking
SwitzerlandPrivate Banks
& GAMCorporate Functions
Internalchargesandtransferpricingadjustmentsarereflectedintheperformanceofeachbusiness.Revenue-sharingagreementsareusedtoallocateexternalcus-tomerrevenuestoaBusinessGrouponareasonablebasis.TransactionsbetweenBusiness Groups are conducted at internally agreed transfer prices or at arm’slength.
Income 2 7,701 4,741 5,064 2,022 16,090 112 915 36,645
Credit loss (expense) / recovery (1) 3 92 0 147 0 0 241
Total operating income 7,700 4,744 5,156 2,022 16,237 112 915 36,886
Personnel expenses 2,119 3,320 2,426 893 8,152 796 185 17,891
General and administrative expenses 642 767 1,064 299 2,538 1,077 176 6,563
Services (to) / from other business units 1,395 275 (533) 126 226 (1,509) 20 0
Depreciation of property and equipment 66 67 69 23 243 794 22 1,284
Amortization of goodwill 3 67 171 0 129 278 1 27 673
Amortization of intangible assets 3 8 107 0 0 36 17 2 170
Goods and materials purchased 263 263
Total operating expenses 4,297 4,707 3,026 1,470 11,473 1,176 695 26,844
Business Group performance from continuing operations before tax 3,403 37 2,130 552 4,764 (1,064) 220 10,042
Business Group performance from discontinued operations before tax 386 10 385 781
Business Group performance before tax 3,403 37 2,130 552 4,764 386 (1,054) 605 10,823
Tax expense on continuing operations 2,155
Tax expense on discontinued operations 198
Net profit 8,470
Additional information 4
Total assets 164,716 48,058 210,223 29,698 1,477,402 8,043 (210,363) 9,394 1,737,171
Total liabilities 161,042 43,879 204,569 28,311 1,463,596 7,480 (220,730) 9,966 1,698,113
Capital expenditure 304 48 212 8 415 19 599 1,484 3,089
Management reporting based on expected credit loss
For internal management reporting purposes, credit loss is measured using an expectedlossconcept.ThistableshowsBusinessGroupperformanceconsistentwith the way the businesses are managed and the way Business Group perfor-manceismeasured.Expectedcreditlossreflectstheaverageannualcoststhatareexpectedtoarise frompositions in thecurrentportfolio thatbecome impaired.TheadjustedexpectedcreditlossreportedforeachBusinessGroupistheexpectedcredit loss on its portfolio plus the difference between credit loss expense and expectedcreditloss,amortizedoverathreeyearperiod.ThedifferencebetweentheseadjustedexpectedcreditlossfiguresandthecreditlossexpenserecordedatGrouplevelforreportingpurposesisreportedinCorporateFunctionsasAdjustedexpectedcreditloss.
Income 2 7,701 4,741 5,064 2,022 16,090 112 915 36,645
Adjusted expected credit loss (8) (5) (25) 0 (7) 286 0 241
Total operating income 7,693 4,736 5,039 2,022 16,083 398 915 36,886
Personnel expenses 2,119 3,320 2,426 893 8,152 796 185 17,891
General and administrative expenses 642 767 1,064 299 2,538 1,077 176 6,563
Services (to) / from other business units 1,395 275 (533) 126 226 (1,509) 20 0
Depreciation of property and equipment 66 67 69 23 243 794 22 1,284
Amortization of goodwill 3 67 171 0 129 278 1 27 673
Amortization of intangible assets 3 8 107 0 0 36 17 2 170
Goods and materials purchased 263 263
Total operating expenses 4,297 4,707 3,026 1,470 11,473 1,176 695 26,844
Business Group performance from continuing operations before tax 3,396 29 2,013 552 4,610 (778) 220 10,042
Business Group performance from discontinued operations before tax 438 (42) 385 781
Business Group performance before tax 3,396 29 2,013 552 4,610 438 (820) 605 10,823
Tax expense on continuing operations 2,155
Tax expense on discontinued operations 198
Net profit 8,4701 Results for Motor-Columbus include the six month period beginning on 1 July 2004. 2 Impairments of financial investments available-for-sale for the year ended 31 December 2004 were as follows: Global Wealth Management & Business Banking CHF 47 million; Global Asset Management CHF 4 million; Investment Bank CHF (17) million; Corporate Center CHF 0 million and Industrial Holdings CHF 57 million. 3 For further information regarding goodwill and other intangible assets by Business Group, please see Note 16: Goodwill and Other Intangible Assets. 4 The funding surplus or requirement is reflected in each Business Group and adjusted in Corporate Center.

111
Note 2a Reporting by Business Group (continued)
For the year ended 31 December 2004
Financial BusinessesIndustrial Holdings 1 UBS
Global Wealth Management & Business BankingGlobal Asset
ManagementInvestment
BankCorporate
Center
CHF million
Wealth Management International &
Switzerland
Wealth Management
USBusiness Banking
SwitzerlandPrivate Banks
& GAMCorporate Functions
Internalchargesandtransferpricingadjustmentsarereflectedintheperformanceofeachbusiness.Revenue-sharingagreementsareusedtoallocateexternalcus-tomerrevenuestoaBusinessGrouponareasonablebasis.TransactionsbetweenBusiness Groups are conducted at internally agreed transfer prices or at arm’slength.
Income 2 7,701 4,741 5,064 2,022 16,090 112 915 36,645
Credit loss (expense) / recovery (1) 3 92 0 147 0 0 241
Total operating income 7,700 4,744 5,156 2,022 16,237 112 915 36,886
Personnel expenses 2,119 3,320 2,426 893 8,152 796 185 17,891
General and administrative expenses 642 767 1,064 299 2,538 1,077 176 6,563
Services (to) / from other business units 1,395 275 (533) 126 226 (1,509) 20 0
Depreciation of property and equipment 66 67 69 23 243 794 22 1,284
Amortization of goodwill 3 67 171 0 129 278 1 27 673
Amortization of intangible assets 3 8 107 0 0 36 17 2 170
Goods and materials purchased 263 263
Total operating expenses 4,297 4,707 3,026 1,470 11,473 1,176 695 26,844
Business Group performance from continuing operations before tax 3,403 37 2,130 552 4,764 (1,064) 220 10,042
Business Group performance from discontinued operations before tax 386 10 385 781
Business Group performance before tax 3,403 37 2,130 552 4,764 386 (1,054) 605 10,823
Tax expense on continuing operations 2,155
Tax expense on discontinued operations 198
Net profit 8,470
Additional information 4
Total assets 164,716 48,058 210,223 29,698 1,477,402 8,043 (210,363) 9,394 1,737,171
Total liabilities 161,042 43,879 204,569 28,311 1,463,596 7,480 (220,730) 9,966 1,698,113
Capital expenditure 304 48 212 8 415 19 599 1,484 3,089
Management reporting based on expected credit loss
For internal management reporting purposes, credit loss is measured using an expectedlossconcept.ThistableshowsBusinessGroupperformanceconsistentwith the way the businesses are managed and the way Business Group perfor-manceismeasured.Expectedcreditlossreflectstheaverageannualcoststhatareexpectedtoarise frompositions in thecurrentportfolio thatbecome impaired.TheadjustedexpectedcreditlossreportedforeachBusinessGroupistheexpectedcredit loss on its portfolio plus the difference between credit loss expense and expectedcreditloss,amortizedoverathreeyearperiod.ThedifferencebetweentheseadjustedexpectedcreditlossfiguresandthecreditlossexpenserecordedatGrouplevelforreportingpurposesisreportedinCorporateFunctionsasAdjustedexpectedcreditloss.
Income 2 7,701 4,741 5,064 2,022 16,090 112 915 36,645
Adjusted expected credit loss (8) (5) (25) 0 (7) 286 0 241
Total operating income 7,693 4,736 5,039 2,022 16,083 398 915 36,886
Personnel expenses 2,119 3,320 2,426 893 8,152 796 185 17,891
General and administrative expenses 642 767 1,064 299 2,538 1,077 176 6,563
Services (to) / from other business units 1,395 275 (533) 126 226 (1,509) 20 0
Depreciation of property and equipment 66 67 69 23 243 794 22 1,284
Amortization of goodwill 3 67 171 0 129 278 1 27 673
Amortization of intangible assets 3 8 107 0 0 36 17 2 170
Goods and materials purchased 263 263
Total operating expenses 4,297 4,707 3,026 1,470 11,473 1,176 695 26,844
Business Group performance from continuing operations before tax 3,396 29 2,013 552 4,610 (778) 220 10,042
Business Group performance from discontinued operations before tax 438 (42) 385 781
Business Group performance before tax 3,396 29 2,013 552 4,610 438 (820) 605 10,823
Tax expense on continuing operations 2,155
Tax expense on discontinued operations 198
Net profit 8,4701 Results for Motor-Columbus include the six month period beginning on 1 July 2004. 2 Impairments of financial investments available-for-sale for the year ended 31 December 2004 were as follows: Global Wealth Management & Business Banking CHF 47 million; Global Asset Management CHF 4 million; Investment Bank CHF (17) million; Corporate Center CHF 0 million and Industrial Holdings CHF 57 million. 3 For further information regarding goodwill and other intangible assets by Business Group, please see Note 16: Goodwill and Other Intangible Assets. 4 The funding surplus or requirement is reflected in each Business Group and adjusted in Corporate Center.

112
For the year ended 31 December 2006
Total operating income Total assets Capital expenditure
CHF million Share % CHF million Share % CHF million Share %
Switzerland 12,987 27 211,565 9 650 21
Rest of Europe / Middle East / Africa 12,771 27 734,986 31 385 12
Americas 18,367 38 1,243,933 51 1,754 56
Asia Pacific 4,040 8 206,027 9 328 11
Total 48,165 100 2,396,511 100 3,117 100
For the year ended 31 December 2005
Total operating income Total assets Capital expenditure
CHF million Share % CHF million Share % CHF million Share %
Switzerland 13,793 34 203,907 10 973 49
Rest of Europe / Middle East / Africa 9,236 22 687,963 33 467 24
Americas 15,293 37 1,004,230 49 386 20
Asia Pacific 2,810 7 162,248 8 139 7
Total 41,132 100 2,058,348 100 1,965 100
For the year ended 31 December 2004
Total operating income Total assets Capital expenditure
CHF million Share % CHF million Share % CHF million Share %
Switzerland 13,438 37 193,464 11 1,993 65
Rest of Europe / Middle East / Africa 7,535 20 561,390 32 556 18
Americas 13,787 37 830,350 48 376 12
Asia Pacific 2,126 6 151,967 9 164 5
Total 36,886 100 1,737,171 100 3,089 100
The geographic analysis of total assets is based on customer domicile, whereas operating income and capital expenditure arebasedonthelocationoftheofficeinwhichthetransac-tionsandassetsarerecorded.Becauseoftheglobalnatureoffinancialmarkets,theGroup’sbusinessismanagedonanintegratedbasisworldwide,witha view toprofitabilityby
Note 2b Segment Reporting by Geographic Location
productline.Thegeographicalanalysisofoperatingincome,totalassetsandcapitalexpenditure isprovided inordertocomplywithIFRSanddoesnotreflectthewaytheGroupismanaged.Management believes that analysis by BusinessGroup, as shown in Note 2a, is a more meaningful represen-tationofthewayinwhichtheGroupismanaged.
Financial StatementsNotes to the Financial Statements

113
Income Statement
Net interest and trading income
For the year ended % change fromCHF million 31.12.06 31.12.05 31.12.04 31.12.05Net interest income 6,521 9,528 11,744 (32)Net trading income 13,318 7,996 4,902 67Total net interest and trading income 19,839 17,524 16,646 13
Breakdown by business activityFor the year ended % change from
CHF million 31.12.06 31.12.05 31.12.04 31.12.05Equities 4,759 3,928 3,098 21Fixed income 6,204 5,741 6,264 8Foreign exchange 1,745 1,458 1,467 20Other 411 292 203 41
Net income from trading activities 13,119 11,419 11,032 15Net income from interest margin products 5,829 5,355 5,070 9Net income from treasury and other activities 891 750 544 19Total net interest and trading income 19,839 17,524 16,646 13
Net interest income 1
For the year ended % change fromCHF million 31.12.06 31.12.05 31.12.04 31.12.05Interest incomeInterest earned on loans and advances 2 15,266 11,678 9,220 31Interest earned on securities borrowed and reverse repurchase agreements 39,771 23,362 10,699 70Interest and dividend income from trading portfolio 32,211 24,134 19,271 33Interest income on financial assets designated at fair value 25 26 0 (4)Interest and dividend income from financial investments available-for-sale 128 86 38 49Total 87,401 59,286 39,228 47Interest expenseInterest on amounts due to banks and customers 20,024 11,226 5,583 78Interest on securities lent and repurchase agreements 34,021 20,480 9,906 66Interest and dividend expense from trading portfolio 14,533 10,736 7,993 35Interest on financial liabilities designated at fair value 4,757 2,390 1,168 99Interest on debt issued 7,545 4,926 2,834 53Total 80,880 49,758 27,484 63
Net interest income 6,521 9,528 11,744 (32)1 Figures in comparative periods reflect the prime brokerage reclassification as explained in Note 1. 2 Includes interest income on impaired loans and advances of CHF 158 million for 2006, CHF 123 million for 2005 and CHF 172 million for 2004.
Note 3 Net Interest and Trading Income
Accountingstandardsrequireseparatedisclosureofnetinter-est income and net trading income (see the tables below and onthenextpage).Thisrequireddisclosure,however,doesnottake into account that net interest and trading income aregeneratedbyarangeofdifferentbusinessactivities.Inmanycases,aparticularbusinessactivitycangeneratebothnetin-terestandtrading income.Fixed incometradingactivity, forexample,generatesbothtradingprofitsandcouponincome.UBS management therefore analyzes net interest and trading
incomeaccording to thebusinessactivitygenerating it.Thesecondtablebelow(labeledBreakdownbybusinessactivity)provides information that corresponds to thismanagementview.Forexample,netincomefromtradingactivitiesisfurtherbrokendownintothefoursub-componentsofEquities,Fixedincome,ForeignexchangeandOther.Theseactivitiesgeneratebothtypesofincome(interestandtradingrevenue)andthere-forethisanalysisisnotcomparablewiththebreakdownpro-videdinthethirdtablebelowandthetableonthenextpage.
Interestincludesforwardpointsonforeignexchangeswapsusedtomanageshort-terminterestrateriskonforeigncurrencyloansanddeposits.

114
Note 3 Net Interest and Trading Income (continued)
Net trading income 1
For the year ended % change from
CHF million 31.12.06 31.12.05 31.12.04 31.12.05
Equities 7,064 3,900 2,254 81
Fixed income 2 2,945 1,256 131 134
Foreign exchange and other 3,309 2,840 2,517 17
Net trading income 13,318 7,996 4,902 67
Thereof:
Net gains / (losses) from financial assets designated at fair value (397) 70 0
Net gains / (losses) from financial liabilities designated at fair value (3,869) (4,024) (1,203)
1 Refer to the table “Net interest and trading income” on the previous page for the Equities, Fixed income, Foreign exchange and Other business results (for an explanation, read the corresponding introductory comment). 2 Includes commodities trading income.
FinancialliabilitiesdesignatedatfairvalueincludetheimpactofUBS’sowncreditwheremarketinformationindicatesthatitisreflectedinthepriceatwhichUBStransactswiththirdpar-ties. Products with UBS’s own credit as a valuation input include certain structured debt instruments where either at
inceptionorovertheirlife,UBSreceivescashflowsthatpro-vide funding and thereby expose the counterparty to UBScreditrisk.Inallperiodspresented,forcounterpartiesenteringintoproductswhicharefinancialliabilitiesfromUBS’sperspec-tive,theperceptionofUBS’screditriskhasremainedstable.
Note 4 Net Fee and Commission Income
For the year ended % change from
CHF million 31.12.06 31.12.05 31.12.04 31.12.05
Equity underwriting fees 1,834 1,341 1,417 37
Debt underwriting fees 1,704 1,516 1,114 12
Total underwriting fees 3,538 2,857 2,531 24
Corporate finance fees 1,852 1,460 1,078 27
Brokerage fees 8,053 6,718 5,794 20
Investment fund fees 5,858 4,750 3,948 23
Fiduciary fees 252 212 197 19
Custodian fees 1,266 1,176 1,143 8
Portfolio and other management and advisory fees 6,622 5,310 4,488 25
Insurance-related and other fees 449 372 343 21
Total securities trading and investment activity fees 27,890 22,855 19,522 22
Credit-related fees and commissions 269 306 264 (12)
Commission income from other services 1,064 1,027 977 4
Total fee and commission income 29,223 24,188 20,763 21
Brokerage fees paid 1,904 1,631 1,387 17
Other 1,438 1,121 870 28
Total fee and commission expense 3,342 2,752 2,257 21
Net fee and commission income 25,881 21,436 18,506 21
Financial StatementsNotes to the Financial Statements

115
Note 5 Other Income
For the year ended % change from
CHF million 31.12.06 31.12.05 31.12.04 31.12.05
Associates and subsidiaries
Net gains / (losses) from disposals of consolidated subsidiaries (11) 1 83
Net gains from disposals of investments in associates 21 26 1 (19)
Total 10 27 84 (63)
Financial investments available-for-sale
Net gains from disposals 921 231 132 299
Impairment charges (12) (26) (34) 54
Total 909 205 98 343
Net income from investments in property 1 61 42 65 45
Equity in income of associates 106 57 43 86
Net gains / (losses) from investment properties 2 5 12 11 (58)
Other 204 218 277 (6)
Total other income from Financial Businesses 1,295 561 578 131
Other income from Industrial Holdings 301 561 275 (46)
Total other income 1,596 1,122 853 42
1 Includes net rent received from third parties and net operating expenses. 2 Includes unrealized and realized gains from investment properties at fair value.
Note 6 Personnel Expenses
For the year ended % change from
CHF million 31.12.06 31.12.05 31.12.04 31.12.05
Salaries and bonuses 19,076 15,930 14,254 20
Contractors 822 823 567 0
Insurance and social security contributions 1,376 1,257 1,025 9
Contribution to retirement plans 802 713 652 12
Other personnel expenses 1,595 1,425 1,393 12
Total personnel expenses 23,671 20,148 17,891 17
Note 7 General and Administrative Expenses
For the year ended % change from
CHF million 31.12.06 31.12.05 31.12.04 31.12.05
Occupancy 1,435 1,278 1,256 12
Rent and maintenance of IT and other equipment 653 602 653 8
Telecommunications and postage 907 840 812 8
Administration 861 758 634 14
Marketing and public relations 653 576 488 13
Travel and entertainment 937 737 614 27
Professional fees 924 625 683 48
Outsourcing of IT and other services 1,095 871 919 26
Other 651 345 504 89
Total general and administrative expenses 8,116 6,632 6,563 22

116
Note 8 Earnings per Share (EPS) and Shares Outstanding
For the year ended % change from
31.12.06 31.12.05 31.12.04 31.12.05
Basic earnings (CHF million)
Net profit attributable to UBS shareholders 12,257 14,029 8,016 (13)
from continuing operations 11,491 9,776 7,547 18
from discontinued operations 766 4,253 469 (82)
Diluted earnings (CHF million)
Net profit attributable to UBS shareholders 12,257 14,029 8,016 (13)
Less: (Profit) / loss on equity derivative contracts (8) (22) (5) 64
Net profit attributable to UBS shareholders for diluted EPS 12,249 14,007 8,011 (13)
from continuing operations 11,483 9,777 7,550 17
from discontinued operations 766 4,230 461 (82)
Weighted average shares outstanding
Weighted average shares outstanding 1 1,976,405,800 2,013,987,754 2,059,836,926 (2)
Potentially dilutive ordinary shares resulting from unvested exchangeable shares, options and warrants outstanding 2 82,429,012 83,203,786 104,085,794 (1)
Weighted average shares outstanding for diluted EPS 2,058,834,812 2,097,191,540 2,163,922,720 (2)
Earnings per share (CHF)
Basic 6.20 6.97 3.89 (11)
from continuing operations 5.81 4.85 3.66 20
from discontinued operations 0.39 2.12 0.23 (82)
Diluted 5.95 6.68 3.70 (11)
from continuing operations 5.58 4.66 3.49 20
from discontinued operations 0.37 2.02 0.21 (82)
1 Includes an average of 143,809 exchangeable shares for the year ended 31 December 2006 that can be exchanged into the same number of UBS shares. 2 Total equivalent shares outstanding on options that were not dilutive for the respective periods but could potentially dilute earnings per share in the future were 37,229,136; 29,117,750; and 37,956,398 for the years ended 31 Decem- ber 2006, 31 December 2005 and 31 December 2004 respectively.
Shares outstanding
As of % change from
31.12.06 31.12.05 31.12.04 31.12.05
Total ordinary shares issued 2,105,273,286 2,177,265,044 2,253,716,354 (3)
Second trading line treasury shares
2004 program 79,870,188
2005 program 67,770,000
2006 program 22,600,000
Other treasury shares 141,875,699 140,749,748 169,456,432 1
Total treasury shares 164,475,699 208,519,748 249,326,620 (21)
Shares outstanding 1,940,797,587 1,968,745,296 2,004,389,734 (1)
Allsharesandearningspersharefiguresreflectthe2-for-1sharesplitmadeon10July2006.
Financial StatementsNotes to the Financial Statements

117
Balance Sheet: Assets
Note 9 Financial Assets Designated at Fair Value
CHF million 31.12.06 31.12.05
Loans 2,104 737
Structured loans 148 229
Reverse repurchase agreements
Banks 2,942 0
Customers 307 0
Other financial assets 429 187
Total financial assets designated at fair value 5,930 1,153
CHF million 31.12.06
Notional amount of loans and structured loans 2,348
Credit derivatives related to loans and structured loans – notional amounts1 663
Credit derivatives related to loans and structured loans – fair value1 2
Additional information
For the year ended 2
CHF million 31.12.06 2
Change in fair value of loans and structured loans designated at fair value, attributable to changes in credit risk3 (8)
Change in fair value of credit derivatives and similar instruments which mitigate the maximum exposure to credit loss of loans and structured loans designated at fair value3 21 Credit derivatives and similar instruments include credit default swaps, credit linked notes, total return swaps, put options, and similar instruments. These are generally used to manage credit risk when UBS has a direct credit exposure to the counterparty, which has not otherwise been collateralized. 2 Also equals the cumulative amount from inception for the year ended 31 December 2006. 3 Current and cumulative changes in the fair value of loans attributable to changes in their credit risk are only calculated for those loans oustanding at balance sheet date. Current and cumulative changes in the fair value of credit derivatives hedging such loans include all the derivatives which have been used to mitigate credit risk of these loans since designation at fair value. For loans reported under the fair value option, changes in fair value due to changes in the credit standing of the borrower are calculated using counterparty credit information obtained from independent market sources.
The maximum exposure to credit loss of all items in the abovetableexceptforOtherfinancialassetsisequaltothefairvalue(CHF5,501millionat31December2006).Otherfinancial assets are generally comprised of equity invest-mentsandarenotdirectlyexposedtocreditrisk.Themaxi-
mumexposuretocredit lossat31December2006ismiti-gatedbycollateralofCHF3,712million.Theamountbywhichcreditderivativesorsimilarinstru-
ments mitigate the maximum exposure to credit loss of loans andstructuredloansdesignatedatfairvalueisasfollows:

118
Note 10a Due from Banks and Loans (Held at Amortized Cost)
By type of exposure
CHF million 31.12.06 31.12.05
Banks 1 50,456 33,689
Allowance for credit losses (30) (45)
Net due from banks 50,426 33,644
Loans 1
Residential mortgages 124,548 127,990
Commercial mortgages 19,989 18,509
Other loans 169,210 135,022
Subtotal 313,747 281,521
Allowance for credit losses (1,226) (1,611)
Net loans 312,521 279,910
Net due from banks and loans (held at amortized cost) 362,947 313,554
1 Includes due from banks and loans from Industrial Holdings in the amount of CHF 93 and CHF 728 million for 2006 and 2005 respectively.
Additional information about due from banks, loans (held at amortized cost) and loans designated at fair value
CHF million 31.12.06 31.12.05
Net due from banks and loans (held at amortized cost) 362,947 313,554
Loans designated at fair value 2 2,252 966
Total 365,199 314,5202 Equals the sum of Loans and Structured loans in Note 9.
By geographical region (based on the location of the borrower)
CHF million 31.12.06 31.12.05
Switzerland 163,090 158,465
Rest of Europe / Middle East / Africa 67,584 50,898
Americas 117,447 94,192
Asia Pacific 18,334 12,621
Subtotal 366,455 316,176
Allowance for credit losses (1,256) (1,656)
Net due from banks, loans (held at amortized cost) and loans designated at fair value 365,199 314,520
By type of collateral
CHF million 31.12.06 31.12.05
Secured by real estate 146,518 148,412
Collateralized by securities 99,879 55,334
Guarantees and other collateral 27,000 24,567
Unsecured 93,058 87,863
Subtotal 366,455 316,176
Allowance for credit losses (1,256) (1,656)
Net due from banks, loans (held at amortized cost) and loans designated at fair value 365,199 314,520
Financial StatementsNotes to the Financial Statements

119
Note 10b Allowances and Provisions for Credit Losses
CHF millionSpecific allowances
and provisions
Collective loan loss allowances and provisions Total 31.12.06 Total 31.12.05
Balance at the beginning of the year 1,690 86 1,776 2,802
Write-offs (363) 0 (363) (651)
Recoveries 62 0 62 63
Increase / (decrease) in credit loss allowances and provisions (108) (48) (156) (374)
Acquisitions 3 0 3 (61)
Foreign currency translation and other adjustments 10 0 10 (3)
Balance at the end of the year 1 1,294 38 1,332 1,776
1 Includes country provisions of CHF 65 million at 31 December 2005. During 2006, all country provisions were released.
CHF millionSpecific allowances
and provisions
Collective loan loss allowances and provisions Total 31.12.06 Total 31.12.05
As a reduction of Due from banks 30 0 30 45
As a reduction of Loans 1,188 38 1,226 1,611
As a reduction of other balance sheet positions 0 0 0 11
Subtotal 1,218 38 1,256 1,667
Included in Other liabilities related to provisions for contingent claims 76 0 76 109
Total allowances and provisions for credit losses 1,294 38 1,332 1,776
Note 10c Impaired Due from Banks and Loans
CHF million 31.12.06 31.12.05
Total gross impaired due from banks and loans 1 2,628 3,434
Allowance for impaired due from banks 30 32
Allowance for impaired loans 1,188 1,561
Total allowances for credit losses related to impaired due from banks and loans 1,218 1,593
Average total gross impaired due from banks and loans 2 3,003 4,089
1 All impaired due from banks and loans have a specific allowance for credit losses. 2 Average balances are calculated from quarterly data.
CHF million 31.12.06 31.12.05
Total gross impaired due from banks and loans 2,628 3,434
Estimated liquidation proceeds of collateral (1,059) (1,366)
Net impaired due from banks and loans 1,569 2,068
Total allowances for credit losses related to impaired due from banks and loans 1,218 1,593

120
CHF million 31.12.06 31.12.05
Total gross non-performing due from banks and loans 1,918 2,363
Total allowances for credit losses related to non-performing due from banks and loans 1,112 1,393
Average total gross non-performing due from banks and loans 1 2,135 3,082
1 Average balances are calculated from quarterly data.
CHF million 31.12.06 31.12.05
Non-performing due from banks and loans at the beginning of the year 2,363 3,555
Net additions / (reductions) (157) (515)
Write-offs and disposals (288) (677)
Non-performing due from banks and loans at the end of the year 1,918 2,363
By type of exposure
CHF million 31.12.06 31.12.05
Banks 29 27
Loans
Secured by real estate 561 621
Other 1,328 1,715
Total loans 1,889 2,336
Total non-performing due from banks and loans 1,918 2,363
By geographical region (based on the location of borrower)
CHF million 31.12.06 31.12.05
Switzerland 1,744 2,106
Rest of Europe / Middle East / Africa 106 155
Americas 62 94
Asia Pacific 6 8
Total non-performing due from banks and loans 1,918 2,363
Note 10d Non-Performing Due from Banks and Loans
Aloan(includedinDuefrombanksorLoans)isclassifiedasnon-performing:1)whenthepaymentofinterest,principalorfeesisoverduebymorethan90daysandthereisnofirmevidencethatitwillbemadegoodbylaterpaymentsorthe
liquidationofcollateral;or2)wheninsolvencyproceedingshavecommenced;or3)whenobligationshavebeenrestruc-turedonconcessionaryterms.
Balance sheet assets
CHF million
Cash collateral on securities borrowed
31.12.06
Reverse repurchase agreements
31.12.06
Cash collateral on securities borrowed
31.12.05
Reverse repurchase agreements
31.12.05
By counterparty
Banks 53,538 209,606 52,814 259,608
Customers 298,052 196,228 235,621 144,824
Total 351,590 405,834 288,435 404,432
Note 11 Securities Borrowing, Securities Lending, Repurchase and Reverse Repurchase Agreements
TheGroupentersintocollateralizedreverserepurchaseandrepurchase agreements and securities borrowing and securi-ties lending transactions that may result in credit exposure in theeventthatthecounterpartytothetransactionisunabletofulfillitscontractualobligations.TheGroupcontrolscred-
itriskassociatedwiththeseactivitiesbymonitoringcounter-partycreditexposureandcollateralvaluesonadailybasisand requiring additional collateral to be deposited with or returnedtotheGroupwhendeemednecessary.
Financial StatementsNotes to the Financial Statements

121
Note 11 Securities Borrowing, Securities Lending, Repurchase and Reverse Repurchase Agreements (continued)
Balance sheet liabilities
CHF million
Cash collateral on securities lent
31.12.06
Repurchase agreements
31.12.06
Cash collateral on securities lent
31.12.05
Repurchase agreements
31.12.05
By counterparty
Banks 44,118 274,910 46,766 278,287
Customers 18,970 270,570 13,172 200,221
Total 63,088 545,480 59,938 478,508
CHF million 31.12.06 31.12.05
Trading portfolio assets
Money market paper 86,790 57,685
thereof pledged as collateral with central banks 1 20,053 11,717
thereof pledged as collateral (excluding central banks) 1 45,356 16,307
thereof pledged as collateral and can be repledged or resold by counterparty 2 38,173 11,563
Debt instruments
Swiss government and government agencies 340 589
US Treasury and government agencies 114,714 77,569
Other government agencies 71,170 64,823
Corporate listed 214,129 169,841
Other – unlisted 111,001 74,253
Total 511,354 387,075
thereof pledged as collateral 1 190,153 170,917
thereof can be repledged or resold by counterparty 2 158,549 110,857
Equity instruments
Listed 183,731 139,101
Unlisted 27,938 20,958
Total 211,669 160,059
thereof pledged as collateral 1 56,760 33,559
thereof can be repledged or resold by counterparty 2 54,756 32,339
Traded loans 47,630 36,212
Precious metals and other commodities 3 21,071 13,025
Total trading portfolio assets 878,514 654,056
Trading portfolio liabilities
Debt instruments
Swiss government and government agencies 129 407
US Treasury and government agencies 81,385 74,758
Other government agencies 58,538 52,833
Corporate listed 21,788 19,885
Other – unlisted 2,101 1,224
Total 163,941 149,107
Equity instruments 40,832 39,524
Total trading portfolio liabilities 204,773 188,631
1 Financial assets pledged to third parties for liabilities with and without the right of rehypothecation are CHF 312 billion at 31 December 2006 and CHF 233 billion at 31 December 2005. 2 Financial assets pledged to third parties with right of rehypothecation of CHF 251 billion at 31 December 2006 and CHF 155 billion at 31 December 2005 are presented on the balance sheet in the line Trading portfolio assets pledged as collateral. 3 Other commodities predominantly consist of energy.
Note 12 Trading Portfolio
The Group trades in debt instruments (including money mar-ketpaperandtradableloans),equityinstruments,preciousmetals, other commodities andderivatives tomeet the fi-
nancial needs of its customers and to generate revenue.Note23providesadescriptionofthevariousclassesofde-rivativeinstruments.

122
Note 13 Financial Investments Available-for-Sale
CHF million 31.12.06 31.12.05
Money market paper 354 141
Other debt instruments
Listed 260 587
Unlisted 261 91
Total 521 678
Equity instruments
Listed 5,880 2,548
Unlisted 819 1,738
Total 6,699 4,286
Private equity investments 1,363 1,446
Total financial investments available-for-sale 8,937 6,551
thereof eligible for discount at central banks 41 40
The following tables show the unrealized gains and losses recognized directly in Equity in 2006 and 2005:
Unrealized gains / (losses) recognized directly in Equity
CHF million Fair value Gross gains Gross lossesNet,
before tax Tax effectNet,
after tax
31 December 2006
Money market paper 354 0 0 0 0 0
Debt securities issued by Swiss national government and agencies 3 0 0 0 0 0
Debt securities issued by Swiss local governments 0 0 0 0 0 0
Debt securities issued by US Treasury and agencies 0 0 0 0 0 0
Debt securities issued by foreign governments and official institutions 97 0 0 0 0 0
Corporate debt securities 28 0 0 0 0 0
Mortgage-backed securities 160 0 (3) (3) 0 (3)
Other debt instruments 233 5 0 5 0 5
Equity instruments 6,699 3,102 (2) 3,100 (636) 2,464
Private equity investments 1,363 634 (13) 621 (182) 439
Total 8,937 3,741 (18) 3,723 (818) 2,905
Unrealized gains / (losses) recognized directly in Equity
CHF million Fair value Gross gains Gross lossesNet,
before tax Tax effectNet,
after tax
31 December 2005
Money market paper 141 0 0 0 0 0
Debt securities issued by Swiss national government and agencies 3 0 0 0 0 0
Debt securities issued by Swiss local governments 0 0 0 0 0 0
Debt securities issued by US Treasury and agencies 64 0 (1) (1) 0 (1)
Debt securities issued by foreign governments and official institutions 47 0 0 0 0 0
Corporate debt securities 421 7 (11) (4) 0 (4)
Mortgage-backed securities 143 0 (3) (3) 0 (3)
Other debt instruments 0 0 0 0 0 0
Equity instruments 4,286 738 (16) 722 (133) 589
Private equity investments 1,446 405 (15) 390 (31) 359
Total 6,551 1,150 (46) 1,104 (164) 940
Financial StatementsNotes to the Financial Statements

123
Fair value Unrealized losses
CHF million
Investments with unrealized
loss less than 12 months
Investments with unrealized loss more than
12 months Total
Investments with unrealized
loss less than 12 months
Investments with unrealized loss more than
12 months Total
31 December 2006
Money market paper 0 0 0 0 0 0
Debt securities issued by Swiss national government and agencies 0 0 0 0 0 0
Debt securities issued by Swiss local governments 0 0 0 0 0 0
Debt securities issued by US Treasury and agencies 0 0 0 0 0 0
Debt securities issued by foreign governments and official institutions 0 0 0 0 0 0
Corporate debt securities 0 0 0 0 0 0
Mortgage-backed securities 28 132 160 0 (3) (3)
Other debt instruments 0 0 0 0 0 0
Equity instruments 2 25 27 0 (2) (2)
Private equity investments 74 123 197 (3) (10) (13)
Total 104 280 384 (3) (15) (18)
Note 13 Financial Investments Available-for-Sale (continued)
The unrealized losses recognized directly in Equity are con-sideredtobetemporaryonthebasis that the investmentsareintendedtobeheldforaperiodoftimesufficienttore-covertheircost,andUBSbelievesthattheevidenceindicat-ingthatthecostoftheinvestmentsshouldberecoverablewithinareasonableperiodoftimeoutweighstheevidencetothecontrary.Factorsconsideredincludethenatureofthe
investments, valuations and research undertaken by UBS,thecurrentoutlookforeachinvestment,offersundernego-tiationatfavorablepricesandthedurationoftheunrealizedlosses.
The following table shows the duration of unrealized losses recognized directly in Equity in 2006 and 2005:
Fair value Unrealized losses
CHF million
Investments with unrealized
loss less than 12 months
Investments with unrealized loss more than
12 months Total
Investments with unrealized
loss less than 12 months
Investments with unrealized loss more than
12 months Total
31 December 2005
Money market paper 0 0 0 0 0 0
Debt securities issued by Swiss national government and agencies 0 0 0 0 0 0
Debt securities issued by Swiss local governments 0 0 0 0 0 0
Debt securities issued by US Treasury and agencies 55 0 55 (1) 0 (1)
Debt securities issued by foreign governments and official institutions 0 0 0 0 0 0
Corporate debt securities 272 0 272 (11) 0 (11)
Mortgage-backed securities 0 143 143 0 (3) (3)
Other debt instruments 0 0 0 0 0 0
Equity instruments 2,032 16 2,048 (13) (3) (16)
Private equity investments 117 34 151 (10) (5) (15)
Total 2,476 193 2,669 (35) (11) (46)

124
Note 13 Financial Investments Available-for-Sale (continued)
Contractual maturities of the investments in debt instruments1
Within 1 year 1-5 years 5-10 years Over 10 years
CHF million, except percentages Amount Yield (%) Amount Yield (%) Amount Yield (%) Amount Yield (%)
31 December 2006
Swiss national government and agencies 2 2.22 0 0.00 0 0.00 1 4.00
Swiss local governments 0 0.00 0 0.00 0 0.00 0 0.00
US Treasury and agencies 0 0.00 0 0.00 0 0.00 0 0.00
Foreign governments and official institutions 38 1.48 2 1.89 57 4.47 0 0.00
Corporate debt securities 26 7.00 0 0.00 2 0.00 0 0.00
Mortgage-backed securities 0 0.00 0 0.00 10 4.48 150 5.10
Other debt instruments 0 0.00 233 9.28 0 0.00 0 0.00
Total fair value 66 235 69 1511 Money market paper has a contractual maturity of less than one year.
ProceedsfromsalesofFinancialinvestmentsavailable-for-sale,excludingprivateequity,wereasfollows:
CHF million 31.12.06 31.12.05
Proceeds 1,380 298
Gross realized gains 832 60
Gross realized losses 5 1
Note 14 Investments in Associates
CHF million 31.12.06 31.12.05
Carrying amount at the beginning of the year 2,956 2,675
Additions 542 938
Disposals (2,043) (935)
Transfers 13 (13)
Income 1 156 156
Impairments 2 (27) (4)
Dividend paid (33) (59)
Foreign currency translation (41) 198
Carrying amount at the end of the year 1,523 2,956
1 Income of CHF 50 million and CHF 99 million is related to Industrial Holdings for 2006 and 2005 respectively, of which CHF 11 million and CHF 70 million is related to discontinued operations for 2006 and 2005 respectively. 2 Impairments of CHF 27 million and CHF 4 million are related to Industrial Holdings for 2006 and 2005 respectively.
At31December2006,significantassociatedcompaniesofthe Group had the following balance sheet and income statement totalsonanaggregatedbasis,not adjusted forthe Group’s proportionate interest: assets CHF 27 billion;
liabilitiesCHF23billion; revenuesCHF1.9billion;andnetprofitCHF318million.SeeNote35foralistofsignificantassociates.
Financial StatementsNotes to the Financial Statements

125
Note 15 Property and Equipment
At historical cost less accumulated depreciation
CHF millionOwn-used properties
Leasehold improve-
ments
IT, software and com-
munication
Other machines
and equipment
Plant and manu-
facturing equipment
Projects in progress 31.12.06 31.12.05
Historical cost
Balance at the beginning of the year 9,446 3,050 4,261 1,596 2,904 413 21,670 21,428
Additions 140 206 662 240 36 509 1,793 1,865
Additions from acquired companies 0 5 19 4 1 0 29 116
Disposals / write-offs 1 (407) (110) (539) (817) (2,960) (82) (4,915) (2,363)
Reclassifications 102 119 116 (97) 18 (284) (26) 50
Foreign currency translation 5 (60) (42) (33) 54 2 (74) 574
Balance at the end of the year 9,286 3,210 4,477 893 53 558 18,477 21,670
Accumulated depreciation
Balance at the beginning of the year 4,781 1,999 3,474 1,349 672 0 12,275 11,998
Depreciation 2 244 237 676 4 103 65 0 1,325 1,556
Disposals / write-offs 1 (108) (86) (225) (807) (716) 0 (1,942) (1,702)
Reclassifications 11 (18) 0 (3) 0 0 (10) 32
Foreign currency translation 2 (36) (38) (19) 21 0 (70) 391
Balance at the end of the year 4,930 2,096 3,887 623 42 0 11,578 12,275
Net book value at the end of the year 3 4,356 1,114 590 270 11 558 6,899 9,395
1 Includes write-offs of fully depreciated assets. 2 Depreciation expense of CHF 62 million and CHF 295 million is related to discontinued operations for 2006 and 2005 respectively. 3 Fire insurance value of property and equipment is CHF 13,596 million (2005: CHF 16,050 million). 4 Includes a CHF 34 million software impairment.
At fair value
CHF million 31.12.06 31.12.05
Balance at the beginning of the year 28 80
Additions 0 26
Sales (14) (25)
Revaluations 0 0
Reclassifications 0 (55)
Foreign currency translation 0 2
Balance at the end of the year 14 28

126
Goodwill Other intangible assets
CHF million Total Infrastructure
Customer relationships,
contractual rights and other Total 31.12.06 31.12.05
Historical cost
Balance at the beginning of the year 11,313 1,016 2,056 3,072 14,385 13,096
Additions and reallocations 2,015 0 1,321 1,321 3,336 92
Disposals (142) 0 (1,231) (1,231) (1,373) (395)
Write-offs 1 0 0 (28) (28) (28) (112)
Foreign currency translation (722) (74) (31) (105) (827) 1,704
Balance at the end of the year 12,464 942 2,087 3,029 15,493 14,385
Accumulated amortization
Balance at the beginning of the year 263 636 899 899 895
Amortization 2 48 148 196 196 340
Reallocations 0 0 0 0 (307)
Disposals 0 (301) (301) (301) (30)
Write-offs 1 0 (28) (28) (28) (112)
Foreign currency translation (20) (26) (46) (46) 113
Balance at the end of the year 291 429 720 720 899
Net book value at the end of the year 12,464 651 1,658 2,309 14,773 13,486
1 Represents write-offs of fully amortized other intangible assets. 2 Amortization expense of CHF 43 million and CHF 209 million is related to discontinued operations for 2006 and 2005, respectively.
Note 16 Goodwill and Other Intangible Assets
Atyear-end2006,fiveoutofsevensegmentscarrygoodwill,ofwhich IndustrialHoldingshas less than1%ofthetotalbalance.BusinessBankingSwitzerlandandCorporateCen-tercarrynogoodwill.Forthepurposeoftestinggoodwillforimpairment,UBSdeterminestherecoverableamountofitssegmentsonthebasisofvalueinuse.Therecoverableamountisdeterminedusingaproprietary
modelbasedon thediscountedcashflowmethod,whichhasbeenadaptedtogiveeffecttothespecialfeaturesofthebankingbusinessanditsregulatoryenvironment.Therecov-erable amount is determined by estimating streams of earn-ingsavailabletoshareholdersinthenextfourquartersbasedonarollingforecastprocess,discountedtotheirpresentval-ues.Theterminalvaluereflectingallperiodsbeyondthefirstyear is calculated on the basis of the estimated individualreturnonequityforeachsegment,whichisderivedfromtheforecastfirst-yearprofit, theunderlyingequity, thecostofequity and the long-term growth rate. The recoverable
amountofthesegmentsisthesumofearningsavailabletoshareholdersfromthefirstyearandtheterminalvalue.Themodelismostsensitivetochangesintheforecastearningsavailabletoshareholders inyearone,theestimatedreturnon equity, the underlying equity, the cost of equity and to changes in the long-term growth rate. The applied long-term growth rate is based on long-term risk free interestrates.Earningsavailabletoshareholdersareestimatedbasedon forecast results,business initiativesandplannedcapitalinvestmentsandreturnstoshareholders.Validationparam-eters used within the Group’s impairment test model arelinkedtoexternalmarketinformation,whereapplicable.Dis-countratesappliedrangefrom8%forWealthManagementInternational&SwitzerlandandforBusinessBankingSwit-zerlandto10.5%forInvestmentBank.Managementbelievesthatreasonablechangesinkeyas-
sumptions used to determine the recoverable amounts ofsegmentswillnotresultinanimpairmentsituation.
Financial StatementsNotes to the Financial Statements

127
The following table presents the disclosure of goodwill and other intangible assets by business segment for the year ended 31December2006.
CHF million
Balance at the beginning
of the yearAdditions and reallocations Disposals Amortization
Foreign currency translation
Balance at the end
of the year
Goodwill
Wealth Management International & Switzerland 1,566 116 0 (37) 1,645
Wealth Management US 3,841 444 0 (279) 4,006
Business Banking Switzerland 0 0 0 0 0
Global Asset Management 1,438 190 0 (97) 1,531
Investment Bank 4,309 1,260 0 (307) 5,262
Corporate Center 0 0 0 0 0
Industrial Holdings 159 5 (142) (2) 20
UBS 11,313 2,015 (142) (722) 12,464
Other intangible assets
Wealth Management International & Switzerland 141 184 0 (10) 10 325
Wealth Management US 753 148 0 (53) (55) 793
Business Banking Switzerland 0 0 0 0 0 0
Global Asset Management 8 488 0 (4) 6 498
Investment Bank 296 483 0 (72) (19) 688
Corporate Center 9 0 0 (9) 0 0
Industrial Holdings 966 18 (930) (48) (1) 5
UBS 2,173 1,321 (930) (196) (59) 2,309
The estimated, aggregated amortization expenses for other intangible assets are as follows:
CHF million Other intangible assets
Estimated, aggregated amortization expenses for:
2007 334
2008 238
2009 238
2010 219
2011 187
2012 and thereafter 1,093
Total 2,309
Note 16 Goodwill and Other Intangible Assets (continued)
Note 17 Other Assets
CHF million Note 31.12.06 31.12.05
Deferred tax assets 22 3,686 2,811
Settlement and clearing accounts 3,159 3,528
VAT and other tax receivables 318 312
Prepaid pension costs 814 832
Properties held for sale 1,254 578
Accounts receivable trade 114 364
Inventory – Industrial Holdings 68 2,007
Other receivables 7,836 5,811
Total other assets 17,249 16,243

128
Financial StatementsNotes to the Financial Statements
Balance Sheet: Liabilities
Note 18 Due to Banks and Customers
CHF million 31.12.06 31.12.05
Due to banks 203,689 124,328
Due to customers in savings and investment accounts 114,264 113,889
Other amounts due to customers 456,301 353,018
Total due to customers 570,565 466,907
Total due to banks and customers 774,254 591,235
Note 19 Financial Liabilities Designated at Fair Value and Debt Issued
The Group issues both CHF and non-CHF denominatedfixed-rateandfloating-ratedebt.
Subordinated debt securities are unsecured obligations of the Group that are subordinated in right of payment to all present and future senior indebtedness and certain otherobligationsoftheGroup.At31December2006and31December2005,theGrouphadCHF14,774millionandCHF10,001million,respectively,insubordinateddebt.Sub-ordinateddebtusuallypaysfixedinterestannuallyorfloat-ing rate interest based on three-month or six-month London InterbankOfferedRate(LIBOR)andprovidesforsingleprin-cipalpaymentsuponmaturity.At 31 December 2006 and 31 December 2005, the
GrouphadCHF191,431millionandCHF157,771million,respectively,inunsubordinateddebt(excludingmoneymar-ket paper, compound debt instruments – OTC and loancommitmentsdesignatedatfairvalue).
In addition, the Group uses interest rate and foreign ex-changederivatives tomanage the risks inherent in certaindebtissues(heldatamortizedcost). Inthecaseofinterestrateriskmanagement,theGroupapplieshedgeaccountingasdiscussedinNote1a14)andNote23–DerivativeInstru-mentsandHedgeAccounting.Asaresultofapplyinghedgeaccounting,at31December2006and31December2005,thecarryingvalueofdebtissuedwasCHF256millionhigherandCHF294millionhigher,respectively,reflectingchangesinfairvalueduetointerestratemovements.
The contractual redemption amount at maturity of Finan-cial liabilitiesdesignatedatfairvaluethroughprofitorlossapproximatesthecarryingvalueat31December2006and31December2005.

129
Note 19 Financial Liabilities Designated at Fair Value and Debt Issued (continued)
Financial liabilities designated at fair value
CHF million 31.12.06 31.12.05
Bonds and compound debt instruments issued 135,646 109,724
Compound debt instruments – OTC 9,967 7,677
Loan commitments 1 74 0
Total 145,687 117,401
1 Loan commitments recognized as Financial liabilities designated at fair value, until drawn down and recognized as loans. See Note 1 a7) for additional information.
Debt issued (held at amortized cost)
CHF million 31.12.06 31.12.05
Short-term debt: Money market paper issued 119,584 102,662
Long-term debt:
Bonds
Senior 53,509 46,545
Subordinated 14,774 10,001
Shares in bond issues of the Swiss regional or cantonal banks’ central bond institutions 38 38
Medium-term notes 2,238 1,464
Subtotal long-term debt 70,559 58,048
Total 190,143 160,710
Contractual maturity dates1
CHF million, except where indicated 2007 2008 2009 2010 2011 2012–2016 ThereafterTotal
31.12.06Total
31.12.05
UBS AG (Parent Bank)
Senior debt
Fixed rate 64,379 8,307 9,279 6,173 6,277 7,391 1,894 103,700 128,504
Interest rates (range in %) 0–27 0–20 0–13.5 0–13.25 0–10.25 0–12 0–10
Floating rate 38,947 17,589 6,717 4,835 2,444 6,139 14,513 91,184 25,300
Subordinated debt
Fixed rate 1,402 0 511 0 0 4,946 2,555 9,414 7,658
Interest rates (range in %) 0–8 5.875 0–7.375 4.125–8.75
Floating rate 0 0 0 0 0 5,360 0 5,360 2,326
Subtotal 104,728 25,896 16,507 11,008 8,721 23,836 18,962 209,658 163,788
Subsidiaries
Senior debt
Fixed rate 48,728 1,265 1,696 1,946 494 2,037 29,662 85,828 93,332
Interest rates (range in %) 0–15 0–8.5 0–18.5 0–8 0–20 0–35 0–35
Floating rate 2,666 3,655 3,785 5,822 4,449 4,745 5,181 30,303 13,297
Subordinated debt
Fixed rate 0 0 0 0 0 0 0 0 17
Interest rates (range in %)
Subtotal 51,394 4,920 5,481 7,768 4,943 6,782 34,843 116,131 106,646
Total 156,122 30,816 21,988 18,776 13,664 30,618 53,805 325,789 270,434
1 Compound debt instruments – OTC designated at fair value and loan commitments designated at fair value are excluded from the table.
Thefollowingtableshowsthesplitbetweenfixed-rateandfloating-rate debt issues based on the contractual terms.However, it should be noted that theGroup uses interest
rate swaps to hedge many of the fixed-rate debt issues,which changes their re-pricing characteristics into those of floating-ratedebt.
The table above indicates fixed interest rate couponsrangingfrom0upto35%ontheGroup’sbonds.Thehighor low coupons generally relate to structured debt issues pri-or to the separationofembeddedderivatives.Asa result,the stated interest rate on such debt issues generally does
notreflecttheeffectiveinterestratetheGroupispayingtoserviceitsdebtaftertheembeddedderivativehasbeensep-arated and, where applicable, the application of hedge ac-counting.

130
Note 20 Other Liabilities
CHF million Note 31.12.06 31.12.05
Provisions 21 1,672 2,072
Provisions for contingent claims 10b 76 109
Current tax liabilities 4,258 3,592
Deferred tax liabilities 22 2,674 2,596
VAT and other tax payables 931 712
Settlement and clearing accounts 3,715 2,707
Amounts due under unit-linked investment contracts 33,645 30,224
Accounts payable 91 1,425
Other payables 16,189 10,400
Total other liabilities 63,251 53,837
Note 21 Provisions
CHF million Operational Litigation Other 1Total
31.12.06Total
31.12.05 2
Balance at the beginning of the year 334 592 1,146 2,072 2,020
Additions from acquired companies 0 25 1 26 1
New provisions charged to income (7) 404 233 630 520
Capitalized reinstatement costs 0 0 22 22 3
Recoveries 3 2 0 5 25
Provisions applied (63) (290) (113) (466) (588)
Disposal of subsidiaries 0 0 (607) 2 (607) (11)
Reclassifications (72) 0 108 36 0
Foreign currency translation (10) (34) (2) (46) 102
Balance at the end of the year 185 699 788 1,672 2,072
1 In 2006, in connection, with a strategy review of its business and a review of its office space planning, Wealth Management US decided not to use office space rented by UBS under a long-term contract in a new building in New Jersey. Senior management approved a proposal to enter into a 10-year sublease contract with an external party for the unused office space. Under the terms of this contract, the sublease income is not sufficient to cover the rent UBS pays under its original contract and costs incurred for arranging the sublease. UBS recorded a provision to cover the shortfall of this onerous lease contract which amounted to CHF 185 million on 31 December 2006. 2 Comprises provisions mainly for annual cost liabilities related to power purchases from joint venture companies where production costs exceed market prices; reinstatement costs; subleases.
LegalProceedingsUBSGroupoperatesinalegalandregulatoryenvironmentthatexposesittopotentiallysignificantlitigationrisks.Asaresult,UBSisinvolvedinvariousdisputesandlegalproceed-ings, including litigation, arbitration, and regulatory and criminalinvestigations.Suchcasesaresubjecttomanyun-certainties, and their outcome is often difficult to predict,particularlyintheearlierstagesofacase.Incertaincircum-stances, toavoidtheexpenseanddistractionof legalpro-ceedings,UBSmay,basedonacostbenefitanalysis,enterasettlement even thoughUBSdenies anywrongdoing. TheGroupmakes provisions for cases brought against it onlywhenafterseekinglegaladvice,intheopinionofmanage-ment, it is probable that a liability exists, and the amount can be reasonablyestimated (see tableabove).Noprovision ismade for claims asserted against the Group that in the opin-ion of management are without merit and where it is not likelythatUBSwillbefoundliable.At31December2006,UBSis involvedinthefollowing
legal proceedings which could be material to the Group in a givenreportingperiod:
(a) InsightOne: In December 2006, the New York StateAttorneyGeneral(NYAG)filedacivilcomplaintregard-ingInsightOne,theFirm’sfee-basedbrokerageprogramforprivateclients in theUnitedStates.The InsightOneprogram is a fee-based brokerage program, in whichclientspayanasset-basedfeefortradingactivityratherthan commissions on a per trade basis and was designed toalignmore closely the interestsoffinancial advisorsandclients.UBSdeniesthattheprogramwaspartofascheme to disadvantage clients and intends to defenditselfvigorouslyinthismatter.
(b) TaxShelter: Inconnectionwithacriminal investigationof tax shelters, theUnitedStatesAttorney’sOffice fortheSouthernDistrictofNewYork (U.S.Attorney’sOf-fice) is examiningUBS’s conduct in relation to certaintax-oriented transactions in which UBS and others en-gaged during the years 1996–2000. Some of thesetransactionswereasubjectoftheDeferredProsecutionAgreementwhich the accounting firm KPMG LLP en-tered into with the U.S. Attorney’s Office in August2005,andareatissueinUnitedStatesv.Stein,S105Cr.
Financial StatementsNotes to the Financial Statements

131
Note 22 Income Taxes
For the year ended
CHF million 31.12.06 31.12.05 31.12.04
Tax expense from continuing operations
Domestic
Current 1,758 1,403 1,184
Deferred (87) 87 5
Foreign
Current 1,545 1,428 815
Deferred (430) (447) 151
Total income tax expense from continuing operations 2,786 2,471 2,155
Tax expense from discontinued operations
Domestic (12) 554 156
Foreign (1) 22 42
Total income tax expense from discontinued operations (13) 576 198
Total income tax expense 2,773 3,047 2,353
TheGroupmadenettaxpayments, includingdomesticandforeigntaxes,ofCHF2,607million,CHF2,394millionand CHF1,345millionforthefullyears2006,2005and2004respectively.
888 (LAK). UBS is cooperatingwith the government’sinvestigation.
(c) MunicipalBonds:InNovember2006,UBSandothersre-ceivedsubpoenasfromtheU.S.DepartmentofJustice,AntitrustDivision,andtheU.S.SecuritiesandExchangeCommission. ThesesubpoenasconcernUBS’sconductrelatingtoderivativetransactionsenteredintowithmu-nicipalbondissuers,andtotheinvestmentofproceedsofmunicipal bond issuances. UBS is cooperatingwiththeseinvestigations.
(d) HealthSouth:UBS is defending itself in two purportedsecuritiesclassactionsbroughtintheU.S.DistrictCourtoftheNorthernDistrictofAlabamabyholdersofstockandbondsinHealthSouthCorp.UBSalsoisadefendantin HealthSouth derivative litigation in Alabama statecourtandhasrespondedtoanSECinvestigationrelatingtoUBS’sroleasabankerforHealthSouth.
(e) BankruptcyEstateofEnron: InNovember2003,EnronbroughtadversarialproceedingsagainstUBSandothersintheU.S.BankruptcyCourtfortheSouthernDistrictof
NewYorkseekingavoidanceandrecoveryofpaymentsthatEnronmadepriortofilingforbankruptcyinconnec-tion with equity forward and swap transactions The BankruptcyCourtdismissedUBS’smotionforsummaryjudgmentinAugust2005.Discoveryisongoing.
(f) Parmalat:UBSisinvolvedinanumberofproceedingsinItaly related to thebankruptcyofParmalat.Thesepro-ceedingsinclude,interalia,clawbackproceedingsagainstUBS Limited in connection with a structured financetransaction.Further,UBSisadefendantintwocivildam-agesclaimsbroughtbyParmalat,ofwhichonerelatestothesamestructuredfinancetransactionagainstUBSLim-ited,whiletheotheragainstUBSAGrelatestocertainderivativetransactions.Inaddition,UBSLimitedandtwoUBSemployeesarethesubjectofcriminalproceedingsinMilan.Finally,UBSisadefendantincivilactionsbroughtbyindividualinvestorsinthosecriminalproceedings.Allproceedingsstillareinanearlystage.UBSdeniestheal-legations made against itself and against its employees inthesematters,andisdefendingitselfvigorously.
Note 21 Provisions (continued)

132
Note 22 Income Taxes (continued)
Thecomponentsofoperatingprofitbeforetax,andthedifferencesbetweenincometaxexpensereflectedintheFinancialStatements and the amounts calculated at the Swiss statutory rate, are as follows:
For the year ended
CHF million 31.12.06 31.12.05 31.12.04
Operating profit from continuing operations before tax 14,667 12,677 10,042
Domestic 5,564 5,854 5,675
Foreign 9,103 6,823 4,367
Income taxes at Swiss statutory rate of 22% for 2006 and 2005 and 24% for 2004 3,227 2,789 2,410
Increase / (decrease) resulting from:
Applicable tax rates differing from Swiss statutory rate 829 388 128
Tax losses not recognized 21 71 103
Previously unrecorded tax losses now recognized (680) (97) (249)
Lower taxed income (941) (555) (657)
Non-deductible goodwill and other intangible asset amortization 21 22 262
Other non-deductible expenses 183 212 215
Adjustments related to prior years 316 (283) (98)
Change in deferred tax valuation allowance (548) (156) 239
Other items 358 80 (198)
Income tax expense from continuing operations 2,786 2,471 2,155
SignificantcomponentsoftheGroup’sgrossdeferredincometaxassetsandliabilitiesareasfollows:
CHF million 31.12.06 31.12.05
Deferred tax assets
Compensation and benefits 2,611 1,904
Net operating loss carry-forwards 1,508 2,235
Trading assets 768 586
Other 598 804
Total 5,485 5,529
Valuation allowance (1,799) (2,718)
Net deferred tax assets 3,686 2,811
Deferred tax liabilities
Compensation and benefits 122 55
Property and equipment 201 515
Financial investments and associates 1,221 633
Trading assets 684 448
Intangible assets 55 264
Other 391 681
Total deferred tax liabilities 2,674 2,596
The change in the balance of net deferred tax assets and deferred tax liabilities does not equal the deferred tax expense in thoseyears.Thisismainlyduetotheeffectsofexchangeratechangesontaxassetsandliabilitiesdenominatedincurren-ciesotherthanCHFandthebookingofsomeofthetaxbenefitsrelatedtodeferredcompensationthroughEquity.Fortheabovepurposes,thevaluationallowancerepresentsamountsthatarenotexpectedtoprovidefuturebenefits,eitherbe-causetheyareoffsetagainsttaxcontingenciesorduetoinsufficiencyoffuturetaxableincome.
Financial StatementsNotes to the Financial Statements

133
Aderivativeisafinancial instrument,thevalueofwhichisderived from thevalueofanother (“underlying”)financialinstrument, an indexor someother variable. Typically, theunderlying is a share, commodity or bond price, an index valueoranexchangeorinterestrate.Themajorityofderivativecontractsarenegotiatedasto
amount(“notional”),tenorandpricebetweenUBSanditscounterparties, whether other professionals or customers (over-the-counterorOTCcontracts).
The rest are standardized in terms of their amounts and settlement dates and are bought and sold on organized mar-kets(exchange-tradedcontracts).Thenotionalamountofaderivativeisgenerallythequan-
tity of the underlying instrument on which the derivativecontract is based and is the basis upon which changes in the valueofthecontractaremeasured.Itprovidesanindicationof the underlying volume of business transacted by theGroupbutdoesnotprovideanymeasureofrisk.Derivativeinstrumentsarecarriedatfairvalue,shownin
thebalancesheetasseparatetotalsofPositivereplacementvalues(assets)andNegativereplacementvalues(liabilities).PositivereplacementvaluesrepresentthecosttotheGroupofreplacingalltransactionswithafairvalueintheGroup’sfavorifalltherelevantcounterpartiesoftheGroupweretodefault at the same time, assuming transactions could be replacedinstantaneously.Negativereplacementvaluesrep-resentthecosttotheGroup’scounterpartiesofreplacingalltheir transactionswiththeGroupwithafairvalue intheirfavoriftheGroupweretodefault.Positiveandnegativere-
Note 23 Derivative Instruments and Hedge Accounting
placementvaluesondifferenttransactionsareonlynettedifthe transactions are with the same counterparty and the cashflowswillbesettledonanetbasis.Changesinreplace-mentvaluesofderivativeinstrumentsarerecognizedintheincome statement unless they meet the criteria for certain hedgeaccountingrelationships,asexplainedinNote1a14)Derivativeinstrumentsandhedgeaccounting.
TypesofderivativeinstrumentsThe Group uses the following derivative financial instru-mentsforbothtradingandhedgingpurposes.
Forwards and futures are contractual obligations to buy orsellfinancialinstrumentsorcommoditiesonafuturedateataspecifiedprice.Forwardcontractsaretailor-madeagree-ments that are transacted between counterparties on the OTC market, whereas futures are standardized contractstransactedonregulatedexchanges.
Swaps are transactions in which two parties exchange cashflowsonaspecifiednotionalamountforapredeter-minedperiod.MostswapsaretradedOTC.Themajortypesof swap transactions undertaken by the Group are as follows:– Interestrateswapcontractsgenerallyentailthecontrac-tualexchangeoffixed-rateandfloating-rateinterestpay-ments in a single currency, based on a notional amount andareferenceinterestrate,e.g.LIBOR.
– Cross currency swaps involve the exchange of interestpayments based on two different currency principal bal-ances and reference interest rates and generally also
The carry-forwards expire as follows: 31.12.06
Within 1 year 3
From 2 to 4 years 181
After 4 years 3,956
Total 4,140
Note 22 Income Taxes (continued)
Certain branches and subsidiaries of the Group have de-ferred tax assets related to net operating loss carry-forwards andotheritems.Becauserealizationoftheseassetsisuncer-tain,theGrouphasestablishedvaluationallowancesofCHF1,799 million (CHF 2,718 million at 31 December 2005). For companies that suffered tax losses in either the cur- rentorprecedingyears,anamountofCHF212million(CHF442millionat31December2005)hasbeenrecognizedasdeferredtaxassetsbasedonexpectationsthatsufficienttax-able income will be generated in future years to utilize the taxlosscarry-forwards.
TheGroupprovidesdeferredincometaxesonundistrib-uted earnings of non-Swiss subsidiaries except to the extent thatsuchearningsareindefinitelyinvested.Intheeventthatthese earnings were distributed, additional taxes of approxi-matelyCHF18millionwouldbedue.At31December2006,netoperatinglosscarry-forwards
totalingCHF4,140million(notrecognizedasadeferredtaxasset)areavailabletobeoffsetagainsttaxcontingenciesorfuturetaxableincome.

134
entail exchange of principal amounts at the start and / or endofthecontract.
– Creditdefaultswaps(CDSs)arethemostcommonformofcreditderivative,underwhichthepartybuyingpro-tectionmakesoneormorepaymentstothepartysellingprotectioninexchangeforanundertakingbythesellertomakeapaymenttothebuyerfollowingacreditevent(asdefinedinthecontract)withrespecttoathird-partycredit entity (as defined in the contract). Settlementfollowingacrediteventmaybeanetcashamountorcashinreturnforphysicaldeliveryofoneormoreobli-gations of the credit entity and is made regardless of whether the protection buyer has actually suffered a loss.Afteracrediteventandsettlement,thecontractisterminated.
– Total rateof return swapsgive the total return receiverexposuretoallofthecashflowsandeconomicbenefitsandrisksofanunderlyingasset,withouthavingtoownthe asset, in exchange for a series of payments, often basedonareferenceinterestrate,e.g.LIBOR.Thetotalreturnpayerhasanequalandoppositeposition.
– Options are contractual agreements underwhich, typi-cally,theseller(writer)grantsthepurchasertheright,butnot theobligation, either tobuy (call option) or to sell(putoption)byoratasetdate,aspecifiedquantityofafinancial instrument or commodity at a predeterminedprice.Thepurchaserpaysapremiumtothesellerforthisright. Options involving more complex payment struc-turesarealsotransacted.OptionsmaybetradedOTCoron a regulated exchange and may be traded in the form ofasecurity(warrant).
DerivativestransactedfortradingpurposesMost of theGroup’s derivative transactions relate to salesandtradingactivities.Salesactivitiesincludethestructuringandmarketingofderivativeproductstocustomerstoenablethemtotake,transfer,modifyorreducecurrentorexpectedrisks.Tradingincludesmarketmaking,positioningandarbi-trageactivities.Marketmakinginvolvesquotingbidandof-ferpricestoothermarketparticipantswiththeintentionofgeneratingrevenuesbasedonspreadandvolume.Position-ingmeansmanagingmarketriskpositionswiththeexpecta-tionofprofitingfromfavorablemovementsinprices,ratesorindices.Arbitrageactivitiesinvolveidentifyingandprofit-ing from price differentials between the same product in dif-ferent markets or the same economic factor in differentproducts.
DerivativestransactedforhedgingpurposesTheGroup enters into derivative transactions for the pur-poses of hedging assets, liabilities, forecast transactions, cashflowsandcreditexposures.Theaccountingtreatment
ofhedgetransactionsvariesaccordingtothenatureoftheinstrumenthedgedandwhetherthehedgequalifiesassuchforaccountingpurposes.Derivativetransactionsmayqualifyashedgesforaccount-
ingpurposes.Thesearedescribedunderthecorrespondingheadingsinthisnote.TheGroup’saccountingpoliciesforde-rivatives designated and accounted for as hedging instru-ments are explained in Note 1a14) Derivative instrumentsand hedge accounting, where terms used in the following sectionsareexplained.TheGroupalsoentersintoCDSsthatprovideeconomic
hedgesforcreditriskexposuresintheloanandtradedprod-uct portfolios but do not meet the requirements for hedge accountingtreatment.
Starting in fourth quarter 2005, the Group also entered into interest rate swaps for day-to-day economic interest rateriskmanagementpurposes,butwithoutapplyinghedgeaccounting.Thefairvaluechangesofsuchswapsarebookedto Net trading income. TheGroup limits the resultant in-come volatility by selecting short- tomedium-term swapsonly. Longer termswapscontinue tobe supportedby thecashflowhedgingmodelexplainedinasubsequentsectionofthisnote.
FairvaluehedgesTheGroup’sfairvaluehedgesprincipallyconsistofinterestrate swaps that are used to protect against changes in the fair value of fixed-rate instruments due to movements inmarketinterestrates.Fortheyearended31December2006,theGrouprecognizedanetlossofCHF18million,fortheyearended31December2005anetlossofCHF22millionandfortheyearended31December2004anetgainofCHF22million,representingtheineffectiveportions,asdefinedinNote1a14),offairvaluehedges.Thefairvaluesofout-standingderivativesdesignatedasfairvaluehedgeswereaCHF222millionnetpositive replacement value at31De-cember 2006 and aCHF380millionnet positive replace-mentvalueat31December2005.Inaddition,theGrouphasenteredintoafairvaluehedge
accountingrelationshiptoprotectacertainportionofavail-able-for-saleequityinvestmentsfromforeigncurrencyexpo-sureusingFXderivatives.Fortheyearended31December2006,theGrouprecognizedanetgainofCHF5millionashedge ineffectiveness. The time value associatedwith the FXderivativesisexcludedfromtheevaluationofhedgeinef-fectiveness.ThefairvalueofoutstandingFXderivativesdes-ignatedasfairvaluehedgeswasaCHF1millionnetpositivereplacementvalueat31December2006.
FairvaluehedgeofportfolioofinterestrateriskTheGrouphasappliedfairvaluehedgeaccountingofport-folio interest rate risk sinceSeptember2005. For the year
Note 23 Derivative Instruments and Hedge Accounting (continued)
Financial StatementsNotes to the Financial Statements

135
ended31December2006,theGrouprecognizedanetlossofCHF8millionandfortheyearended31December2005anetlossofCHF22million,representingtheineffectivepor-tionsof fair valuehedges.Thechange in fairvalueof thehedged items is recorded separately from the hedged item onthebalancesheet.Thefairvalueofderivativesdesignatedforthishedgemethodat31December2006wasaCHF8millionnetpositivereplacementvalue.Therewerenoderiva-tive contracts designated as hedges under thismethod at31December2005,asallthehedgeshadbecomeineffec-tiveandthehedgerelationshipswerede-designatedattheendofDecember2005.
CashflowhedgesofforecasttransactionsTheGroup is exposed to variability in future interest cashflowsonnon-tradingassetsandliabilitiesthatbearinterest
atvariableratesorareexpectedtoberefundedorreinvestedinthefuture.Theamountsandtimingoffuturecashflows,representingbothprincipalandinterestflows,areprojectedforeachportfoliooffinancialassetsandliabilities,basedoncontractualtermsandotherrelevantfactors includingesti-matesofprepaymentsanddefaults.Theaggregateprincipalbalances and interest cash flows across all portfolios overtime form the basis for identifying the non-trading interest rate riskof theGroup,which ishedgedwith interest rateswaps,themaximummaturityofwhichis22years.
The schedule of forecast principal balances on which the expectedinterestcashflowsariseasof31December2006isshownbelow.
CHF billion < 1 year 1–3 years 3–5 years 5–10 years over 10 years
Cash inflows (assets) 228 420 294 267 7
Cash outflows (liabilities) 88 156 109 151 41
Net cash flows 140 264 185 116 (34)
Note 23 Derivative Instruments and Hedge Accounting (continued)
Gainsandlossesontheeffectiveportionsofderivativesdes-ignatedascashflowhedgesofforecasttransactionsareini-tially recorded in Equity as Net income recognized directly in equity and are transferred to current period earnings when the forecast cashflowsaffectnetprofitor loss.Thegainsandlossesonineffectiveportionsofsuchderivativesarerec-ognized immediately in the income statement. A CHF 36millionloss,CHF35milliongainandaCHF13milliongainwererecognizedin2006,2005and2004,respectively,duetohedgeineffectiveness.As of 31December 2006 and 2005, the fair values of
outstandingderivativesdesignatedascashflowhedgesofforecast transactionswereaCHF462millionnetnegativereplacement value and a CHF 1,124 million net negativereplacementvalue,respectively.Swissfranchedginginterestrate swaps terminated during 2006 and 2005 had a replace-mentvalueofCHF0millionandapositivereplacementval-ueofCHF80million,respectively.Attheendof2006and2005, unrecognized income of CHF 214million and CHF346 million associated with terminated swaps remained deferredinEquity.ItwillberemovedfromEquitywhenthehedged cash flows have an impact on net profit or loss.AmountsreclassifiedfromNetincomerecognizeddirectlyinEquity to current period earnings due to discontinuation of hedgeaccountingwereaCHF132millionnetgainin2006,aCHF243millionnetgainin2005andaCHF304millionnet gain in 2004. These amounts were recorded in Netinterestincome.
RisksofderivativeinstrumentsDerivativeinstrumentsaretransactedinmanytradingport-folios,whichgenerallyincludeseveraltypesofinstruments,not justderivatives. Themarket riskofderivatives isman-agedandcontrolledasanintegralpartofthemarketriskoftheseportfolios.TheGroup’sapproachtomarketriskisde-scribedinNote29,FinancialInstrumentsRiskPosition,partb)MarketRisk.Derivative instrumentsare transactedwithmanydiffer-
ent counterparties, most of whom are also counterparties forothertypesofbusiness.ThecreditriskofderivativesismanagedandcontrolledinthecontextoftheGroup’sover-all credit exposure to each counterparty. TheGroup’s ap-proachtocreditriskisdescribedinNote29,FinancialInstru-mentsRiskPosition,partc)CreditRisk.Itshouldbenotedthat, although the positive replacement values shown onthe balance sheet can be an important component of the Group’screditexposure,thepositivereplacementvaluesforanyonecounterpartyare rarelyanadequate reflectionoftheGroup’screditexposureonitsderivativesbusinesswiththat counterparty. This is because, on the one hand,replacement values can increaseover time (“potential fu-tureexposure”),whileontheotherhand,exposuremaybemitigated by entering into master netting agreements and bilateralcollateralarrangementswithcounterparties.Boththe exposure measures used by the Group internally to con-trolcreditriskandthecapitalrequirementsimposedbyreg-ulatorsreflecttheseadditionalfactors.Thereareadditional

136
Financial StatementsNotes to the Financial Statements
capitalrequirementsshowninNote29e)CapitalAdequacyunder Off-balance sheet and other positions as Forward and swap contracts and Purchased options, which reflect theadditional potential future exposure. InNote29 c)CreditRisk,theDerivativespositivereplacementvaluesshownun-derTradedproducts,andinNote29parte)CapitalAdequa-cy, the Positive replacement values shown under balancesheet assets are lower than those shown in the balance sheetbecausetheyreflectclose-outnettingarrangementsacceptedbytheSwissFederalBankingCommission(SFBC)asbeingenforceableininsolvency.Theimpactofsuchnet-
tingagreementsonthegrossreplacementvaluesshowninthetablesonthenexttwopagesistoreducebothpositiveand negative replacement values byCHF 219,820millionandCHF252,192millionat31December2006and2005respectively.As a result, positive replacement values afternettingforUBSGroupwereCHF108,625millionat31De-cember 2006 and CHF 81,590 million at 31 December2005.ThesefiguresdifferfromthoseshowninNote29e)becausetheycoverthewholeUBSGroup,whereastherel-evanttablesinNote29coveronlythoseentitieswhicharesubjecttoconsolidationforregulatorycapitalpurposes.

137
Note 23 Derivative Instruments and Hedge Accounting (continued)
As of 31 December 2006 Term to maturity
Total PRV
Total NRV
Total notional CHF bn
within 3 months 3-12 months 1-5 years over 5 years
CHF million PRV 1 NRV 2 PRV NRV PRV NRV PRV NRV
Interest rate contracts
Over-the-counter (OTC) contracts
Forward contracts 1,001 764 172 177 38 34 1,211 975 1,848.0
Swaps 5,629 4,784 9,891 10,134 46,690 47,128 87,079 81,719 149,289 143,765 22,643.4
Options 273 308 127 440 2,252 3,563 13,529 15,148 16,181 19,459 1,432.5
Exchange-traded contracts 3
Futures 2,904.4
Options 406 438 474 485 96 96 976 1,019 34.7
Total 7,309 6,294 10,664 11,236 49,076 50,821 100,608 96,867 167,657 165,218 28,863.0
Credit derivative contracts
Over-the-counter (OTC) contracts
Credit default swaps 35 54 363 673 12,874 14,035 7,425 7,953 20,697 22,715 2,536.6
Total rate of return swaps 54 63 100 74 583 1,606 4,284 3,512 5,021 5,255 103.0
Total 89 117 463 747 13,457 15,641 11,709 11,465 25,718 27,970 2,639.6
Foreign exchange contracts
Over-the-counter (OTC) contracts
Forward contracts 4,565 4,322 1,765 1,968 827 531 17 103 7,174 6,924 784.0
Interest and currency swaps 24,724 22,977 10,363 10,599 14,641 12,366 12,821 11,831 62,549 57,773 4,064.6
Options 2,877 2,624 2,987 3,042 828 1,041 51 49 6,743 6,756 1,276.2
Exchange-traded contracts 3
Futures 20.8
Options 12 16 2 2 14 18 0.1
Total 32,178 29,939 15,117 15,611 16,296 13,938 12,889 11,983 76,480 71,471 6,145.7
Precious metals contracts
Over-the-counter (OTC) contracts
Forward contracts 348 339 573 355 757 371 37 48 1,715 1,113 25.6
Options 293 580 676 784 1,554 1,281 118 68 2,641 2,713 70.6
Exchange-traded contracts 3
Futures 1.0
Options 333 400 427 381 1,050 1,087 1,810 1,868 23.9
Total 974 1,319 1,676 1,520 3,361 2,739 155 116 6,166 5,694 121.1
Equity / index contracts
Over-the-counter (OTC) contracts
Forward contracts 1,179 1,464 386 1,217 506 8 14 103 2,085 2,792 107.8
Options 1,073 3,485 3,702 5,655 6,121 8,821 1,605 2,795 12,501 20,756 258.0
Exchange-traded contracts 3
Futures 72.4
Options 4,277 4,602 8,238 8,396 9,978 10,458 453 433 22,946 23,889 270.7
Total 6,529 9,551 12,326 15,268 16,605 19,287 2,072 3,331 37,532 47,437 708.9
Commodities contracts, excluding precious metals contracts
Over-the-counter (OTC) contracts
Forward contracts 3,254 3,223 2,894 3,155 1,724 1,579 766 840 8,638 8,797 86.3
Options 221 236 447 368 595 654 1 27 1,264 1,285 13.0
Exchange-traded contracts 3
Futures 236.7
Options 1,626 1,637 2,164 1,967 1,200 1,057 4,990 4,661 67.1
Total 5,101 5,096 5,505 5,490 3,519 3,290 767 867 14,892 14,743 403.1
Total derivative instruments 52,180 52,316 45,751 49,872 102,314 105,716 128,200 124,629 328,4454 332,5335
1 PRV: Positive replacement value. 2 NRV: Negative replacement value. 3 Exchange-traded products include own account trades only. 4 The impact of netting agreements accepted by the Swiss Federal Banking Commission (SFBC) for capital adequacy calculations is to reduce positive replacement values to CHF 108,625 million. 5 The impact of netting agreements accepted by the SFBC for capital adequacy calculations is to reduce negative replacement values to CHF 112,713 million.

138
Note 23 Derivative Instruments and Hedge Accounting (continued)
As of 31 December 2005 Term to maturity
Total PRV
Total NRV
Total notional amount CHF bn
within 3 months 3–12 months 1–5 years over 5 years
CHF million PRV 1 NRV 2 PRV NRV PRV NRV PRV NRV
Interest rate contracts
Over-the-counter (OTC) contracts
Forward contracts 652 607 154 96 97 32 86 179 989 914 1,345.7
Swaps 5,953 4,701 12,630 13,156 77,445 75,523 105,029 101,256 201,057 194,636 15,680.4
Options 832 690 1,750 2,163 9,600 10,701 6,738 9,247 18,920 22,801 1,273.1
Exchange-traded contracts 3
Futures 2,418.3
Options 59 55 118 123 6 6 183 184 26.6
Total 7,496 6,053 14,652 15,538 87,148 86,262 111,853 110,682 221,149 218,535 20,744.1
Credit derivative contracts
Over-the-counter (OTC) contracts
Credit default swaps 13 21 290 195 7,911 10,691 4,247 2,472 12,461 13,379 1,481.0
Total rate of return swaps 50 74 30 143 757 778 713 820 1,550 1,815 44.4
Total 63 95 320 338 8,668 11,469 4,960 3,292 14,011 15,194 1,525.4
Foreign exchange contracts
Over-the-counter (OTC) contracts
Forward contracts 2,905 2,470 962 806 643 499 54 96 4,564 3,871 502.9
Interest and currency swaps 20,162 22,092 10,239 9,256 12,102 12,252 5,875 6,242 48,378 49,842 3,592.6
Options 1,910 1,800 1,855 1,600 386 637 5 2 4,156 4,039 659.6
Exchange-traded contracts 3
Futures 4.7
Options 6 6 1 1 7 7 0.1
Total 24,983 26,368 13,057 11,663 13,131 13,388 5,934 6,340 57,105 57,759 4,759.9
Precious metals contracts
Over-the-counter (OTC) contracts
Forward contracts 444 365 407 366 558 284 85 91 1,494 1,106 17.4
Options 276 431 607 521 1,128 1,050 99 55 2,110 2,057 56.9
Exchange-traded contracts 3
Futures 1.6
Options 1,179 1,143 1,498 1,512 1,288 1,312 3,965 3,967 4.4
Total 1,899 1,939 2,512 2,399 2,974 2,646 184 146 7,569 7,130 80.3
Equity / index contracts
Over-the-counter (OTC) contracts
Forward contracts 859 627 747 769 1,410 499 2 13 3,018 1,908 101.8
Options 270 1,058 3,017 4,621 7,154 8,635 2,237 4,487 12,678 18,801 204.7
Exchange-traded contracts 3
Futures 59.5
Options 1,997 1,827 2,396 2,473 3,787 4,277 178 206 8,358 8,783 345.3
Total 3,126 3,512 6,160 7,863 12,351 13,411 2,417 4,706 24,054 29,492 711.3
Commodities contracts, excluding precious metals contracts
Over-the-counter (OTC) contracts
Forward contracts 2,146 2,099 4,208 3,908 2,301 2,488 3 0 8,658 8,495 70.7
Options 164 185 354 300 599 457 1 4 1,118 946 6.8
Exchange-traded contracts 3
Futures 105.4
Options 28 42 64 47 26 23 118 112 12.2
Total 2,338 2,326 4,626 4,255 2,926 2,968 4 4 9,894 9,553 195.1
Total derivative instruments 39,905 40,293 41,327 42,056 127,198 130,144 125,352 125,170 333,7824 337,6635
1 PRV: Positive replacement value. 2 NRV: Negative replacement value. 3 Exchange-traded products include own account trades only. 4 The impact of netting agreements accepted by the Swiss Federal Banking Commission (SFBC) for capital adequacy calculations is to reduce positive replacement values to CHF 81,590 million. 5 The impact of netting agreements accepted by the SFBC for capital adequacy calculations is to reduce negative replacement values to CHF 85,471 million.
Financial StatementsNotes to the Financial Statements
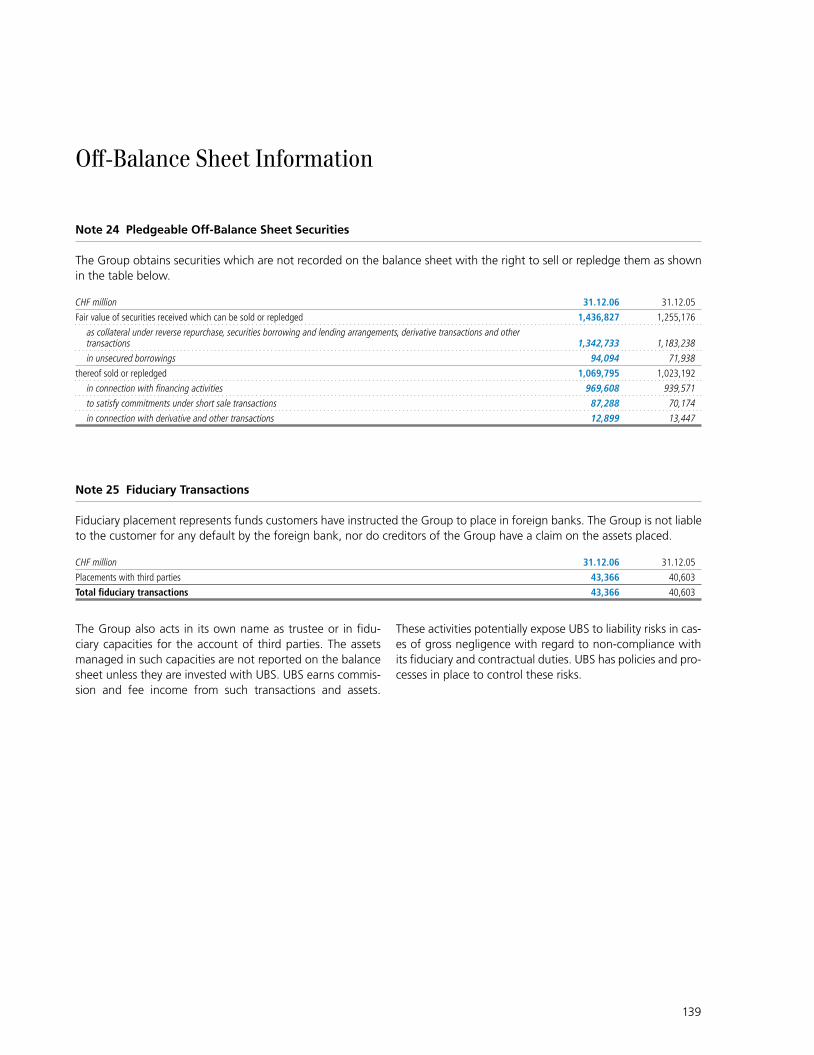
139
Off-Balance Sheet Information
Note 24 Pledgeable Off-Balance Sheet Securities
The Group obtains securities which are not recorded on the balance sheet with the right to sell or repledge them as shown inthetablebelow.
CHF million 31.12.06 31.12.05
Fair value of securities received which can be sold or repledged 1,436,827 1,255,176
as collateral under reverse repurchase, securities borrowing and lending arrangements, derivative transactions and other transactions 1,342,733 1,183,238
in unsecured borrowings 94,094 71,938
thereof sold or repledged 1,069,795 1,023,192
in connection with financing activities 969,608 939,571
to satisfy commitments under short sale transactions 87,288 70,174
in connection with derivative and other transactions 12,899 13,447
Note 25 Fiduciary Transactions
FiduciaryplacementrepresentsfundscustomershaveinstructedtheGrouptoplaceinforeignbanks.TheGroupisnotliabletothecustomerforanydefaultbytheforeignbank,nordocreditorsoftheGrouphaveaclaimontheassetsplaced.
CHF million 31.12.06 31.12.05
Placements with third parties 43,366 40,603
Total fiduciary transactions 43,366 40,603
TheGroupalsoacts in itsownnameastrusteeor infidu-ciarycapacities for theaccountof thirdparties.Theassetsmanaged in such capacities are not reported on the balance sheetunlesstheyareinvestedwithUBS.UBSearnscommis-sion and fee income from such transactions and assets.
TheseactivitiespotentiallyexposeUBStoliabilityrisksincas-es of gross negligence with regard to non-compliance with itsfiduciaryandcontractualduties.UBShaspoliciesandpro-cessesinplacetocontroltheserisks.

140
Note 26 Commitments and Contingent Liabilities
TheGroup utilizes various lending-related financial instru-mentsinordertomeetthefinancialneedsofitscustomers.The Group issues commitments to extend credit, standby and other letters of credit, guarantees, commitments to enter into repurchase agreements, note issuance facilities and revolvingunderwriting facilities.Guarantees representirrevocableassurances,subjecttothesatisfactionofcertainconditions,thattheGroupwillmakepaymentintheeventthatcustomersfailtofulfilltheirobligationstothirdparties.The Group also enters into commitments to extend credit in theformofcreditlinesthatareavailabletosecuretheliquid-ityneedsofcustomersbuthavenotyetbeendrawnonbythem, the majority of which range in maturity from onemonthtofiveyears.Themaximumamountat risk for theGroup if customers fail to meet their obligations is the con-tractualamountoftheseinstruments.Therisk issimilartotheriskinvolvedinextendingloanfacilitiesandissubjecttothesameriskmanagementandcontrolframework.Fortheyearsended31December2006,2005and2004theGrouprecognizednetcreditlossrecoveriesofCHF10million,CHF 39millionandCHF31millionrespectively,relatedtoobliga-tions incurred for contingencies and commitments. Provi-sions recognized for guarantees, documentary credits and similar instruments were CHF 76million at 31 December2006andCHF109millionat31December2005.SeealsoNote21Provisions.
The Group generally enters into sub-participations to mitigatetherisksfromcommitmentsandcontingencies.Asub-participationisanagreementbyanotherpartytotakeashare of the loss in the event that the obligation is notfulfilledbytheobligorand,whereapplicable,tofundapartofthecreditfacility.TheGroupretainsthecontractualrela-tionship with the obligor, and the sub-participant has only anindirectrelationship.TheGroupwillonlyenterintosub-participationagreementswithbankstowhichUBSascribesacreditratingequaltoorbetterthanthatoftheobligor.Effective 1 January 2006, Swiss Banking Law and the
newly established deposit insurance system require Swiss banksandsecuritiesdealerstojointlyguaranteeanamountofup toCHF4billion forprivileged clientdeposits in theeventthatanotherSwissbankorsecuritiesdealerbecomes
insolvent. For theperiod from1 January2006 to30 June2007, the Swiss Federal Banking Commission estimatesUBS´sshareinthedepositinsurancesystemtobeCHF953million. Thedeposit insurance is aguarantee andexposesUBStoadditionalcreditriskwhichisnotreflectedintheta-bleonthenextpage.UBSconsiderstheprobabilityofalossduetothiscontingencytoberemote.
UBS is a member of numerous securities and futures ex-changes and clearinghouses. Associated with some ofthose memberships, UBS may be required to pay a share of thefinancialobligationsof,orotherwisebeexposedtoad-ditionalfinancialobligationsasaresultof,anothermem-berwhodefaults.Whilethemembershiprulesvary,obliga-tions generally would arise only if the exchange or clearinghousehadexhausted itsresources.Themaximumexposuretocreditlossisnotreflectedinthetableonthenextpage.UBSconsiderstheprobabilityofamateriallossduetosuchobligationstoberemote.Aspartofitstradingandmarketmakingactivities,UBS
writes put options on a broad range of underlyings. ThewritingofputoptionsissubjecttoUBS‘sriskcontrolframe-work.Forwritingputoptions,UBSreceivesapremium,re-presentingthefairvalueoftheoptionatinception,whichisrecognized as negative replacement value on the balancesheet. A written put option is considered a market priceguarantee issued, because the option holder is entitled to make UBS purchase the underlying at the stated exerciseprice.Thecontractvolume,whichisthenumberofunitsofthe underlying multiplied by the exercise price per unit, therefore represents the maximum potential payment UBS couldbe required tomakeuponexerciseof theputs.Thetotal negative replacement valueofwrittenputoptions issignificantly lower than the underlying total contract vol-ume.Itchangesovertimewithchangesinmarketparame-ters.Accordingly,neithertheunderlyingtotalcontractvol-umenorthenegativereplacementvalueisindicativeoftheactual risk exposure arising fromwritten put options. Themarketvalueofguaranteesintheformofwrittenputop-tionsandotherformsofmarketvalueguaranteesamountedto CHF 481,656 million at 31 December 2006 and CHF317,973millionat31December2005.
Financial StatementsNotes to the Financial Statements

141
CHF million 31.12.06 31.12.05
Contingent liabilities
Guaranteed amounts
Credit guarantees and similar instruments 1 12,142 11,526
Sub-participations (813) (719)
Total 11,329 10,807
Performance guarantees and similar instruments 2 3,199 2,805
Sub-participations (333) (335)
Total 2,866 2,470
Documentary credits 2,567 2,235
Sub-participations (238) (207)
Total 2,329 2,028
Gross contingent liabilities 17,908 16,566
Sub-participations (1,384) (1,261)
Net contingent liabilities 16,524 15,305
Irrevocable commitments
Committed amounts
Undrawn irrevocable credit facilities 97,287 72,905
Sub-participations (2) (2)
Total 97,285 72,903
Liabilities for calls on shares and other equities 20 20
Gross irrevocable commitments 97,307 72,925
Sub-participations (2) (2)
Net irrevocable commitments 97,305 72,923
Contingent liabilities and irrevocable commitments
Gross contingent liabilities and irrevocable commitments 115,215 89,491
Sub-participations (1,386) (1,263)
Net contingent liabilities and irrevocable commitments 113,829 3 88,228
1 Credit guarantees in the form of bills of exchange and other guarantees, including guarantees in the form of irrevocable letters of credit, endorsement liabilities from bills rediscounted, advance payment guarantees and similar facilities. 2 Bid bonds, performance bonds, builders’ guarantees, letters of indemnity, other performance guarantees in the form of irrevocable letters of credit and similar facilities. 3 Includes CHF 11,816 million of loan commitments designated at fair value. The fair value of CHF 74 million is shown as Financial liabilities designated at fair value until drawn down. See Note 19 for details.
Note 26 Commitments and Contingent Liabilities (continued)
CHF million Mortgage collateral Other collateral Unsecured Total
Overview of collateral
Gross contingent liabilities 318 10,257 7,333 17,908
Gross irrevocable commitments 6,817 43,412 47,058 97,287
Liabilities for calls on shares and other equities 0 0 20 20
Total 31.12.06 7,135 53,669 54,411 115,215
Total 31.12.05 3,688 43,280 42,523 89,491
Other commitments TheGroupentersintocommitmentstofundexternalprivateequityfundsandinvestments,whichtypicallyexpirewithinfive years. The commitments themselves do not involvecreditormarket riskas thefundspurchase investmentsat
marketvalueatthetimethecommitmentsaredrawn.Themaximum amount committed to fund these investments at 31 December 2006 and 31 December 2005 was CHF 766millionandCHF884millionrespectively.

142
At31December2006,UBSwasobligatedunderanumberof non-cancellable operating leases for premises and equip-ment used primarily for banking purposes. The significantpremises leases usually include renewal options and escala-tionclausesinlinewithgeneralofficerentalmarketcondi-tions as well as rent adjustments based on price indices.However, the leaseagreementsdonotcontaincontingent
Note 27 Operating Lease Commitments
rentpaymentclausesandpurchaseoptions.Theleasesalsodonot imposeanyrestrictionsonUBS’sabilitytopaydivi-dends,engageindebtfinancingtransactionsorenter intofurtherleaseagreements.
The minimum commitments for non-cancellable leases of premises and equipment are presented as follows:
CHF million 31.12.06
Operating leases due
2007 1,003
2008 995
2009 924
2010 839
2011 722
2012 and thereafter 4,280
Subtotal commitments for minimum payments under operating leases 8,763
Less: Sublease rentals under non-cancellable leases 849
Net commitments for minimum payments under operating leases 7,914
CHF million 31.12.06 31.12.05 31.12.04
Gross operating lease expense 1,178 1,232 1,309
from continuing operations 1,165 1,092 1,197
from discontinued operations 13 140 112
Sublease rental income from continuing operations 56 51 43
Net operating lease expense 1,122 1,181 1,266
from continuing operations 1,109 1,041 1,154
from discontinued operations 13 140 112
Operating lease contracts include non-cancellable long-term leasesofofficebuildingsinmostUBSlocations.At31De-cember 2006, the minimum lease commitments for sixteen officelocationseachexceededCHF100million.Non-cancel-
lableminimumleasecommitmentsforfourofficelocationsinNewJersey,London,ZurichandNewYorkeachexceededCHF500million.
Financial StatementsNotes to the Financial Statements

143
Additional Information
Note 28 Pledged Assets
Financial assets are pledged in securities borrowing and lending transactions, in repurchase and reverse repurchase transac-tions, under collateralized credit lines with central banks, against loans from mortgage institutions and for security deposits relating to stock exchange and clearinghouse memberships.
Carrying amount
CHF million 31.12.06 31.12.05
Financial assets pledged 1
Mortgage loans 81 64
Other financial assets 0 474
Total financial assets pledged 81 538
Other assets pledged
Property and equipment 0 520
1 Securities pledged to third parties with and without the right of rehypothecation are disclosed in footnote 1 of Note 12 and are not included in the table above.
Note 29 Financial Instruments Risk Position
This Note presents information about UBS’s management and control of risks from financial instruments.
Part a) presents an overview of UBS’s risk management and control objectives.
Parts b) to d) provide more detailed explanations of the pri-mary risks associated with UBS’s use of financial instruments:– market risk – part b) – is exposure to market variables in-
cluding general market risk factors such as interest rates, exchange rates, equity market indices and commodity prices, and factors specific to individual names affecting the values of securities and other obligations in tradable form, and derivatives referenced to these names
– credit risk – part c) – is the risk of loss as a result of failure by a client or counterparty to meet its contractual obliga-tions
– liquidity risk – part d) – is the risk that UBS is unable to meet its payment obligations when due.Part e) presents and explains the Group’s regulatory capi-
tal position.This Note generally refers only to UBS’s Financial Business-
es, and those tables which are based on risk information in-clude only the Financial Businesses of the Group. Those which present an analysis of the whole balance sheet also cover the positions of the Industrial Holdings segment which, for the 2005 tables, includes Motor-Columbus.
Any representation of risk at a specific date offers only a snapshot of the risks taken, since both trading and non-trading positions can vary significantly on a daily basis, for a variety of reasons, including active risk management. As such, it may not be representative of the level of risk at other times.
a) Risk Management & Control Objectives
Taking risk is core to a financial services business. UBS’s risk management and control objective is not, therefore, to elim-inate all risks but to achieve an appropriate balance between risk and return. In day-to-day business and in the strategic management of the balance sheet and capital position, UBS seeks, through its risk management and control framework, to limit the scope for adverse variations in earnings and ex-posure to “stress” events.
The underlying objective is the creation and protection of shareholder value and the framework is built around the following principles:
– business management is accountable for all risks assumed and is responsible for their continuous and active man-agement
– an independent control process is implemented to pro-vide an objective check on risk-taking activities when re-quired by the nature of the risks, in particular to balance short term profit incentives and the long term interests of UBS. All exposures are independently monitored and re-viewed and, depending on the nature of the risks, may also require pre-approval

144
Financial StatementsNotes to the Financial Statements
– comprehensive, transparent and objective risk disclosure to senior management, the Board of Directors, share-holders, regulators, rating agencies and other stake-holders is the cornerstone of the risk control process
– risks are controlled at the level of individual exposures, at a portfolio level, and in aggregate across all businesses and risk types to protect the Group’s earnings
– managing and controlling risks, and in particular avoiding undue concentrations of exposure, limiting potential losses from stress events, and restricting significant posi-tions in less quantifiable risk areas, are essential elements
Note 29 Financial Instruments Risk Position (continued)a) Risk Management & Control Objectives (continued)
of the risk management and control framework and the protection of UBS’s reputation.Excellence in risk management is fundamentally based
upon a management team that makes risk identification and control critical components of its processes and plans.
The Group Chief Risk Officer (CRO) has overall responsi-bility for the development and implementation of the Group’s risk control principles, frameworks, limits and processes, in-cluding formulation of risk policies and risk measurement and assessment methodologies.
b) Market Risk
(i) OverviewMarket risk is exposure to market variables including general market risk factors such as interest rates, exchange rates, equity indices, and commodity prices, and factors specific to individual names affecting the values of securities and other obligations in tradable form, and derivatives referenced to those names (“issuer risk”).
Market risk arises primarily in UBS’s trading activities, which are mainly in the Investment Bank, with limited activity in wealth management to facilitate private client business, and in asset management in support of the alternative and quantitative investments area. Additionally the Treasury department (part of Corporate Center) assumes market risk through its balance sheet and capital management activi-ties.
The trading activities of the Investment Bank include mar-ket making, facilitation of client business and proprietary position taking. UBS is active in cash and derivatives markets for equities, fixed income and interest rate products, and for foreign exchange, energy, metals and commodities. Treasury assumes non-trading market risks. Interest rate risk arises from the funding of non-business items such as property and investments and from long-term interest rate risk trans-ferred from other Business Groups. Foreign exchange risk arises from the management of foreign currency profits and losses. Treasury also manages the Group’s consolidated equity in such a way as to protect UBS’s capital ratios and to generate a stable interest income flow. Other market risks from non-trading activities, predominantly interest rate risk, arise in all Business Groups, but they are not significant.
The Group Head of Market Risk, reporting to the Group CRO, has overall responsibility for formulating the Group’s market risk control framework. There is a CRO in each Busi-ness Group and a designated CRO for Treasury. The Group Head of Market Risk, the Business Group CROs and their teams are responsible for the independent control of market
risk. They ensure that all market risks are identified and cap-tured in risk systems. They establish the necessary controls, including limits, and monitor positions and exposures. An important element of the CRO’s role is the assessment of market risk in new businesses and products, and in struc-tured transactions.
Market risk authority is vested in the Chairman’s Office and is further delegated to the GEB and ad personam to the Group CRO, the Group Head of Market Risk and CROs and market risk officers in the Business Groups.
Market risk measures and controls are applied at the port-folio level, and concentration limits and other controls are applied where necessary to individual risk types, to particular books and to specific exposures. Portfolio risk measures are common to all market risks, but concentration limits and other controls are tailored to the nature of the activities and the risks they create.
The principal portfolio risk measures and limits on market risk are Value at Risk (VaR) and stress loss.
VaR is a statistically based estimate of the potential loss on the current portfolio from adverse market movements. The VaR measure captures both “general” and “idiosyncratic” market risks. General market risk factors are variables which are driven by macroeconomic, geopolitical and other market-wide considerations, independent of any instrument or single name. They include movements in interest rates, widening or tightening of general spread levels and directional move-ments in equity market indices, exchange rates, and energy, metal and commodity prices. Changes in associated volatili-ties, and correlations between these risk factors – some of which may be unobservable or only indirectly observable – are also general market risks. Idiosyncratic components are those that cannot be explained by general market moves – broadly, changes in the prices of debt and equity instruments and derivatives linked to them, resulting from factors and events specific to individual names.

145
VaR expresses potential loss, but only to a certain level of confidence (99%), and there is therefore a specified statisti-cal probability (1%) that actual loss could be greater than the VaR estimate. UBS’s VaR model measures risk over a 10-day time horizon and it assumes that market moves occurring over this horizon will follow a similar pattern to those that have occurred over 10-day periods in the past. For general market risk, the assessment of past movements is based on data for the past five years, and these are applied directly to current positions, a method known as historical simulation. For idio-syncratic risk, including event risk, the methods and time hori-zons are adjusted to most appropriately capture the risks.
Stress loss measures are run daily. They quantify exposure to more extreme market movements than are normally reflected in VaR, under a variety of scenarios, and are an essential complement to VaR.
Controls and restrictions are placed on risk concentra-tions in trading books, taking into account variations in price
volatility and market liquidity. They include measures of exposure to individual market risk variables, such as the exchange rates and interest rates of particular currencies (“market risk factors”), and on positions in the securities and other tradable obligations of individual names or groups, or derivatives referenced to such names (“issuer risk” – see section b)(v)).
(ii) Interest rate risk Interest rate risk is the risk of loss resulting from changes in interest rates, including changes in the shape of yield curves. It is controlled primarily through the limit structure described in section b)(i). Interest rate sensitivity is one of the key inputs to VaR. One way of expressing this sensitivity for all interest rate sensitive positions, whether marked to market or subject to amortized cost accounting, is the impact on their fair values of a one basis point (0.01%) change in interest rates. This sensi-tivity, analyzed by time band, is set out in the table below.
Interest rate sensitivity position1
Interest rate sensitivity by time band at 31.12.06
CHF thousand, gain / (loss) per basis point increasewithin 1
month1 to 3
months3 to 12 months 1 to 5 years over 5 years Total
CHF Trading 183 (256) (377) 202 (116) (364)
Non-trading (47) (16) (206) (3,677) (3,524) (7,470)
USD Trading 13 (202) (716) (602) (1,663) (3,170)
Non-trading 68 30 (208) (2,896) (5,452) (8,458)
EUR Trading (261) 648 (409) (6,707) 5,756 (973)
Non-trading (16) (5) (31) (359) (333) (744)
GBP Trading 123 (93) (272) (194) 141 (295)
Non-trading 0 (7) (142) (266) 256 (159)
JPY Trading 46 386 (117) (118) 4 201
Non-trading 1 1 2 (7) 0 (3)
Other Trading 47 469 (209) (708) (10) (411)
Non-trading (3) 1 1 (1) (4) (6)
Interest rate sensitivity by time band at 31.12.05
CHF thousand, gain / (loss) per basis point increasewithin 1
month1 to 3
months3 to 12 months 1 to 5 years over 5 years Total
CHF Trading 167 (526) 120 213 (322) (349)
Non-trading (258) (57) (883) (6,514) (287) (7,998)
USD Trading (306) (103) 122 (3,238) 3,329 (196)
Non-trading 70 (159) (546) (7,847) 35 (8,447)
EUR Trading 536 (344) (302) (2,792) 2,725 (178)
Non-trading (2) (33) (18) (271) 1,174 850
GBP Trading 169 (653) 131 (310) (9) (672)
Non-trading (1) (8) (78) (437) 536 12
JPY Trading 194 367 (435) 406 (704) (172)
Non-trading (0) (0) (3) (4) 0 (7)
Other Trading 2 (48) 69 (125) (371) (473)
Non-trading (3) (1) (0) (1) (3) (8)1 Positions in Industrial Holdings are excluded.
Note 29 Financial Instruments Risk Position (continued)b) Market Risk (continued)

146
Financial StatementsNotes to the Financial Statements
The table sets out the extent to which UBS was exposed to interest rate risk at 31 December 2006 and 2005. It shows the net impact of a one basis point (0.01%) increase in mar-ket interest rates across all time bands on the fair values of interest rate sensitive positions, both on- and off-balance sheet. The impact of such an increase in interest rates de-pends on UBS’s net asset or net liability position in each category, currency and time band in the table. A negative amount in the table reflects a potential reduction in fair value, while a positive amount reflects a potential increase in fair value.
Positions shown as “trading” are those which contribute to market risk regulatory capital, i. e. those considered “trading book” for regulatory capital purposes – see part e). “Non-trading” includes all other interest rate sensitive as-sets and liabilities including derivatives designated as hedg-es for accounting purposes (as explained in Note 23) and off-balance sheet commitments on which an interest rate has been fixed. The regulatory capital definition of the trad-ing book is broadly consistent with, but not identical to, the accounting definition of the trading portfolio. Most notably, loans originated by UBS for distribution in the cash markets are classified as held for trading for accounting purposes, but are risk controlled under the credit risk framework – see part c) – and are not eligible for trading book regulatory capital treatment.
Information about money market paper and debt instru-ments classified as trading portfolio for accounting purposes is included in Note 12 and of debt instruments defined as financial investments available-for-sale for accounting purpos-es in Note 13. Information about derivatives is shown in Note 23. It should be noted that interest rate risk arises not only on interest rate contracts but also on other forwards, swaps and options, in particular on forward foreign exchange contracts. Off-balance sheet commitments on which an interest rate has been fixed are primarily forward starting fixed-term loans.
TradingThe major part of this risk arises in the Investment Bank in par-ticular in the Fixed Income, Rates and Currencies business area, which includes the Cash and Collateral Trading unit (CCT).
Non-tradingInterest rate risk is inherent in many of UBS’s businesses and arises from factors such as differences in timing between contractual maturity or re-pricing of assets, liabilities and de-rivative instruments. Most material non-trading interest rate risks are transferred from the originating business units to one of the two core interest rate risk management units – Treasury and CCT. The risks are then managed within the market risk limits and controls described in section b)(i).
The largest non-trading interest rate exposures arise in the Global Wealth Management & Business Banking Busi-ness Group. Many of their retail banking products have no contractual maturity date or directly market-linked rate. Their interest rate risk is transferred on a pooled basis through “replicating” portfolios. A replicating portfolio is a series of loans or deposits at market rates and fixed terms between the originating business unit and Treasury, struc-tured to approximate – on average – the interest rate cash flow and re-pricing behaviour of the pooled client transac-tions. The portfolios are rebalanced monthly. Their structure and parameters are based on long-term market observations and client behavior, and are reviewed periodically. Product margin remains with, and is subject to additional analysis and control by the originating business units.
Interest rate risk also arises from non-business related balance sheet items such as the financing of bank property and equity investments in associated companies. The risk on these items is transferred to Treasury through replicating portfolios which, in this case, are designed to approximate the mandated funding profile.
The Group’s consolidated equity is managed in accor-dance with strategic targets set by senior management and is placed at fixed interest rates in Swiss franc, US dollar, euro and UK sterling with an average duration of between three and four years. These positions account for CHF 17.1 million of the non-trading interest rate sensitivity shown in the table on the previous page, with CHF 7.4 million arising in Swiss franc, CHF 8.4 million in US dollar and the remainder in euro and UK sterling. The interest rate sensitivity of the positions is directly related to the chosen duration, and although adopting significantly shorter maturities would lead to a re-duction in apparent interest rate sensitivity, it would lead to higher volatility in interest earnings.
The economic value sensitivity of non-trading interest rate positions is defined as the impact of a large (100 basis point) instantaneous rise in interest rates across all curren-cies, on the net present value of all future cashflows from these positions. At 31 December 2006 the economic value sensitivity was a loss of CHF 1,771 million.
(iii) Currency risk Currency risk is the risk of loss resulting from changes in exchange rates.
Trading UBS is an active participant in currency markets and carries currency risk from these trading activities, conducted primar-ily in the Investment Bank. These trading exposures are sub-ject to the VaR, stress and concentration limits described in section b)(i). Information about foreign exchange contracts,
Note 29 Financial Instruments Risk Position (continued)b) Market Risk (continued)

147
most of which arise from trading activities and contribute to currency risk, is provided in Note 23.
Non-trading UBS’s reporting currency is the Swiss franc, but its assets, li-abilities, income and expense are denominated in many cur-rencies, with significant amounts in US dollar, euro and UK sterling, as well as Swiss franc.
Reported profits or losses are exchanged monthly, and in some cases more frequently, into Swiss francs, reducing volatil-ity in the Group’s earnings from subsequent changes in ex-change rates. Treasury also, from time to time, proactively hedges significant expected foreign currency earnings/costs (mainly US dollar, euro and UK sterling) in accordance with the instructions of the Group Executive Board. Economic hedging strategies employed include a cost-efficient options purchase program, which provides protection against unfavorable cur-rency fluctuations while preserving some upside potential. Al-though these positions are intended to economically hedge future earnings, they can cause volatility in financial results be-cause they are marked to market. Within clearly defined toler-ances, such fluctuations are accepted. The positions are, how-ever, treated as currency exposure, are subject to Treasury’s VaR limit and are included in VaR for regulatory capital pur-poses. The hedge program has a time horizon of up to twelve months and is not restricted to the current financial year.
The Group’s consolidated equity is managed – as de-scribed in section b)(ii) – in such a way as to protect UBS’s capital ratios from exchange rate movements, based on a tar-get profile that broadly reflects the currency distribution of its risk-weighted assets. This creates structural foreign currency exposures. Exchange rate movements lead to increases or de-creases in the Swiss franc value of the Group’s risk-weighted assets. They also generate translation gains or losses on the structural foreign currency exposures. These are recorded in Equity in the Group’s Financial Statements, thereby protect-ing the BIS Tier 1 capital ratio – see part e).
At 31 December 2006, the largest combined trading and non-trading currency exposures against the Swiss franc were short USD 436 million, short EUR 195 million and long AUD 128 million. At 31 December 2005, the largest exposures were short USD 695 million, short EUR 36 million and long GBP 6 million.
(iv) Equity risk Equity risk is the risk of loss resulting from changes in the
levels of equity indices and values of individual stocks.The Investment Bank is a significant player in major equity
markets and is increasingly active in the newer markets. It carries equity risk from these activities. These exposures are subject to the VaR, stress and concentration limits described
Note 29 Financial Instruments Risk Position (continued)b) Market Risk (continued)
in section b)(i) and, in the case of individual stocks, to the issuer risk controls described in section b)(v).
Information about equities held for trading for account-ing purposes is given in Note 12. Information about equity derivatives contracts (on indices and individual equities), which arise primarily from the Investment Bank’s trading ac-tivities, is provided in Note 23.
(v) Issuer risk Issuer risk is the risk of loss on securities and other obliga-
tions in tradable form (including traded loans), and on de-rivatives based on such assets. It arises from credit-related and other events and, ultimately, default of the issuer, obli-gor or reference name.
As an active trader and market maker, the Investment Bank holds positions in these instruments, which are includ-ed in VaR and are also subject to controls on concentrated exposure to individual names and groups.
Exposures arising from security underwriting commit-ments are, additionally, subject to targeted processes prior to commitment, generally including review by a commitment committee with representation from both business manage-ment and the control functions. All commitments are ap-proved under specific delegated authorities.
(vi) Investment positions UBS makes equity investments for a variety of purposes. Some are made for revenue generation or as part of strate-gic initiatives, while others, such as exchange and clearing-house memberships, are held in support of other business activities. Private equity positions were, in the past, the ma-jor component of equity investments but the portfolio is be-ing managed down. UBS made an investment in Bank of China as part of a major strategy initiative, and acquired a stake in Julius Baer when Private Banks & GAM was sold to them in December 2005. Most seed money and co-invest-ments in UBS funds are considered investment positions.
Many equity investments are unlisted and therefore illiquid. Others are intended to be held medium- or long-term. The fair values are often driven more by factors spe-cific to the individual companies than movements in general equity markets. For these reasons, equity investments are controlled outside the market risk measures and controls de-scribed in sections b)(iv) and b)(v). Instead they are subject to control and reporting processes, including pre-approval of new investments by business management and risk control. Where investments are made as part of an ongoing business they are also subject to portfolio and concentration limits.
Debt investments, including money market paper, are not significant in amount. They are included in the measures of interest rate risk described in section b)(ii).

148
Financial StatementsNotes to the Financial Statements
mitigation – by recognizing its existence in determining the exposure UBS is prepared to carry or by reflecting its risk- reducing effect in the reported credit exposure.
In the table, the amounts shown as credit exposure for banking products are based on accounting classification and include some items which are not considered to be credit exposures for internal purposes, notably cash collateral post-ed by UBS with market counterparties against negative re-placement values on derivatives. Credit risk mitigation is recognized only to the extent that assets are derecog-nized for accounting purposes, as explained in Note 1a4). The amounts shown in the table for traded products are based on regulatory capital treatment, as shown in the table in part e). It should be noted that, for regulatory capital pur-poses, netting of positive and negative replacement values on derivatives is permitted for counterparties with whom UBS has a master netting agreement that is enforceable in insolvency, but netting is not permitted for accounting pur-poses unless the cash flows will actually be settled net, which is not generally the case – for details see Note 23. The regu-latory capital treatment of securities borrowing and lending transactions and repo and reverse repo transactions is based on the net positive value of cash or securities given by UBS to the counterparty. These values are included in the table in part e) in Due from banks and other collateralized lendings. They are only a small percentage of the balance sheet amounts which are based on the full value of transactions – for details see Note 11. The amounts shown in the table for traded products do not include any estimate of the potential future exposure which is included in the internal credit risk control view.
UBS manages, limits and controls concentrations of cred-it risk wherever they are identified, in particular to individual counterparties and groups, and to industries and countries where appropriate. Concentrations of credit risk exist if cli-ents are engaged in similar activities, or are located in the same geographic region or have comparable economic char-acteristics such that their ability to meet contractual obliga-tions would be similarly affected by changes in economic, political or other conditions. UBS sets limits on its credit ex-posure to both individual counterparties and counterparty groups.
UBS’s credit portfolio is heterogeneous, varying signifi-cantly in terms of client type, sector, geographical diversity and the size of exposures. Limits take a variety of forms such as nominal values, statistical measures and scenario-based stress loss. They are applied to individual portfolios or sectors where appropriate, to restrict credit risk concentrations or areas of higher risk, or to control the rate of portfolio growth. Stress loss limits are applied to exposures to all but the best-rated countries.
Note 29 Financial Instruments Risk Position (continued)c) Credit Risk
Credit risk is the risk of loss to UBS as a result of failure by a client or counterparty to meet its contractual obligations. It is inherent in traditional banking products – loans, commit-ments to lend and contingent liabilities, such as letters of credit – and in traded products – derivative contracts such as forwards, swaps and options, repurchase agreements (repos and reverse repos) and securities borrowing and lending transactions. Some of these products are accounted for on an amortized cost basis, while others are recorded in the Fi-nancial Statements at fair value. Banking products are gen-erally carried at amortized cost, but loans are carried at fair value if they have been originated by the Group for subse-quent syndication or distribution through the cash markets or (with effect from June 2006) are to be substantially hedged. OTC derivatives are carried at fair value. Repos and securities borrowing and lending transactions are accounted for on an amortized cost basis. All banking and traded prod-ucts are governed by the same credit risk management and control framework, regardless of accounting treatment.
The Group Chief Credit Officer (CCO), reporting to the Group CRO, has overall responsibility for formulating the Group’s credit risk control framework. Global Wealth Man-agement & Business Banking and the Investment Bank, which take material credit risk, have independent credit risk control units, headed by CCOs reporting functionally to the Group CCO. They are responsible for the rating of counter-parties, for credit risk assessment and for the continuous monitoring of counterparty and portfolio credit exposures. Credit risk authority, including authority to establish allow-ances, provisions and credit valuation adjustments for im-paired claims, is vested in the Chairman’s Office and is fur-ther delegated to the GEB and ad personam to the Group CCO and to the Business Group CCOs and credit officers.
For credit risk control purposes, credit exposure is mea-sured for banking products as the nominal amount. For trad-ed products, credit exposure is based on the replacement value of contracts, taking account of master netting agree-ments with individual counterparties where they are consid-ered enforceable in insolvency. The potential replacement value is projected over the life of the contracts (or over a shorter time frame where UBS has the ability to reduce expo-sure or close out, for example by calling or liquidating col-lateral) reflecting changes in credit exposure resulting from market movements and from maturing contracts. UBS ac-tively uses credit risk mitigation techniques to manage credit exposure. These include risk transfers and participations, hedging with credit derivatives, taking of security in the form of financial collateral (cash or marketable securities) or other assets such as real estate, and guarantees and other third party support. For internal credit risk control, credit risk miti-gation is reflected – depending on the product and type of

149
Aggregate risk across portfolios is measured using a pro-prietary statistical methodology which provides an indication of risk in the portfolio and the way it changes over time. Stress loss measures are applied to all significant portfolios to assess the impact of variations in default rates and asset val-ues, taking into account risk concentrations in each portfo-lio. These measures include an analysis of contribution by industry and geography.
The Group's gross lending portfolio of CHF 364 billion is widely diversified across industry sectors with no significant concentrations of credit risk. CHF 153 billion (42% of the total) consists of loans to thousands of private households, predominantly in Switzerland, and mostly secured by mort-gages, financial collateral or other assets. Exposure to banks and financial institutions amounted to CHF 138 billion (38% of the total). This includes cash posted as collateral by UBS against negative replacement values on derivatives or other positions, which, from a risk perspective is not considered lending but is a key component of the measurement of counterparty risk taken in connection with the underlying products. Exposure to banks includes money market depos-its with highly rated institutions. Excluding financial institu-tions, the largest industry sector exposure is CHF 25 billion (7% of the total) to the services sector.
Impaired claimsUBS classifies a claim as impaired if it considers it likely that it will suffer a loss on that claim as a result of the obligor’s inability to meet its commitments (including interest pay-ments, principal repayments or other payments due, for ex-ample on a derivative product or under a guarantee) accord-ing to the contractual terms, and after realization of any
Note 29 Financial Instruments Risk Position (continued)c) Credit Risk (continued)
available collateral. Loans carried at amortized cost are classified as non-performing where payment of interest, principal or fees is overdue by more than 90 days and there is no firm evidence that they will be made good by later pay-ments or the liquidation of collateral, or where insolvency proceedings have commenced or obligations have been restructured on concessionary terms.
The recognition of impairment in the Financial Statements depends on the accounting treatment of the claim. For prod-ucts accounted for on an amortized cost basis or off-balance sheet items, impairment is recognized through the creation of an allowance or a provision respectively which is charged to the income statement as Credit loss expense. Allowances or provisions are determined such that the carrying values of impaired claims are consistent with the principles of IAS 39. For products recorded at fair value, impairment is recognized through a credit valuation adjustment, which is charged to the income statement through the Net trading income line.
For products carried at amortized cost, UBS also assesses portfolios of claims with similar credit risk characteristics for collective impairment in accordance with IAS 39. A portfolio is considered impaired on a collective basis if there is objective evidence to suggest that it contains impaired obligations but the individual impaired items cannot yet be identified.
For further information about accounting policy for al-lowances and provisions for credit losses, see Note 1 a10). For the amounts of allowance and provision for credit losses and amounts of impaired and non-performing loans, see Note 10 b), c) and d). It should be noted that allowances and provisions for collective impairment are included in the total of allowances and provisions in the table below, and in
Breakdown of credit exposure 1
Amounts for each product type are shown gross before allowances and provisions.
CHF million 31.12.06 31.12.05
Banking products
Due from banks and loans 2 364,110 314,482
Contingent liabilities (gross – before participations) 3 17,908 16,566
Undrawn irrevocable credit facilities (gross – before participations) 3 97,287 72,905
Traded products 4
Derivatives positive replacement values (before collateral but after netting) 5 110,732 86,950
Securities borrowing and lending, repos and reverse repos 6, 7 47,870 40,765
Allowances and provisions 8 (1,332) (1,776)
Total credit exposure net of allowances and provisions 636,575 529,892
1 Positions in Industrial Holdings are excluded. 2 See Note 10a – Due from Banks and Loans for further information. 3 See Note 26 – Commitments and Contingent Liabilities for further information. 4 Does not include potential future credit exposure arising from changes in value of products with variable value. Potential future credit exposure is, however, included in internal measures of credit exposure for risk management and control purposes. 5 Replacement values are shown net where netting is permitted for regulatory capital purposes. See also Note 29e) – Capital Adequacy. 6 This figure represents the difference in value between the cash or securities lent or given as collateral to counterparties, and the value of cash or securities borrowed or taken as collateral from the same counterparties under securities borrowing / lending and repo / reverse repo transactions. 7 See Note 11 – Securities Borrowing, Securities Lending, Repurchase and Reverse Repurchase Agreements for further information about these types of transactions. 8 See Note 10b - Allowances and Provisions for Credit Losses for further information.

150
Financial StatementsNotes to the Financial Statements
UBS’s approach to liquidity management is to ensure, as far as possible, that it will always have sufficient liquidity to meet its liabilities when due, under both normal and stressed conditions, without incurring unacceptable losses or risking sustained damage to business franchises. Treasury, which is part of Corporate Center, is responsible for the liquidity con-trol framework while the Investment Bank Cash and Collat-eral Trading unit is responsible for day-to-day operations. The approach is based on a comprehensive assessment of all material known and expected cash flows of the Group and the availability of high-grade collateral which could be used
Notes 10a) and b), but that portfolios against which collective loan loss provisions have been established are not included in the totals of impaired loans in Note 10c).
The occurrence of credit losses is erratic in both timing and amount and those that arise usually relate to trans-actions entered into in previous accounting periods. In order to reflect the fact that future credit losses are implicit in the current portfolio, and to encourage risk-adjusted pricing for products carried at amortized cost, UBS uses the concept of “expected credit loss” for management purposes. Expected credit loss is a statistically based concept which is used to estimate the annual costs that will arise, on average, from positions in the current portfolio that become impaired. It is
derived from the probability of default (given by the counter-party rating), current and likely future exposure to the coun-terparty and the likely severity of the loss should default occur. Note 2a) includes two tables: the first shows Credit loss expense, as recorded in the Financial Statements, for each Business Group; the second reflects an “Adjusted ex-pected credit loss” for each Business Group, which is the expected credit loss on its portfolio, plus the difference be-tween Credit loss expense and expected credit loss, amor-tized over a three-year period. The difference between the total of these Adjusted expected credit loss figures and the Credit loss expense recorded at Group level for financial re-porting is reported in Corporate Center.
Note 29 Financial Instruments Risk Position (continued)c) Credit Risk (continued)
d) Liquidity Risk
to secure additional funding if required. The framework en-tails careful monitoring and control of the daily liquidity posi-tion, and regular liquidity stress testing under a variety of scenarios. Scenarios encompass both normal and stressed market conditions, including general market crises and the possibility that access to markets could be impacted by a stress event affecting some part of UBS’s business or, in the extreme case, if UBS suffered a severe rating downgrade.
The breakdown by contractual maturity of assets and lia-bilities at 31 December 2006, which is the starting point for the liquidity analyses, is shown in the table on the next page.

151
Note 29 Financial Instruments Risk Position (continued)d) Liquidity Risk (continued)
Maturity analysis of assets and liabilities
CHF billionOn
demandSubject
to notice 1
Due within
3 months
Due between
3 and 12 months
Due between
1 and 5 years
Due after 5 years Total
Assets
Cash and balances with central banks 3.5 0.0 0.0 0.0 0.0 0.0 3.5
Due from banks 27.2 0.0 19.5 1.2 2.3 0.2 50.4
Cash collateral on securities borrowed 0.0 239.6 102.7 9.3 0.0 0.0 351.6
Reverse repurchase agreements 0.0 67.1 278.5 49.2 10.9 0.1 405.8
Trading portfolio assets 2 627.0 0.0 0.0 0.0 0.0 0.0 627.0
Trading portfolio assets pledged as collateral 2 251.5 0.0 0.0 0.0 0.0 0.0 251.5
Positive replacement values 2 328.4 0.0 0.0 0.0 0.0 0.0 328.4
Financial assets designated at fair value 5.9 0.0 0.0 0.0 0.0 0.0 5.9
Loans 42.9 44.7 89.0 32.2 79.5 24.2 312.5
Financial investments available-for-sale 8.1 0.0 0.3 0.1 0.2 0.2 8.9
Accrued income and prepaid expenses 10.4 0.0 0.0 0.0 0.0 0.0 10.4
Investments in associates 0.0 0.0 0.0 0.0 0.0 1.5 1.5
Property and equipment 0.0 0.0 0.0 0.0 0.0 6.9 6.9
Goodwill and other intangible assets 0.0 0.0 0.0 0.0 0.0 14.8 14.8
Other assets 17.4 0.0 0.0 0.0 0.0 0.0 17.4
Total 31.12.06 1,322.3 351.4 490.0 92.0 92.9 47.9 2,396.5
Total 31.12.05 1084.2 289.8 452.6 98.2 87.9 45.6 2,058.3
Liabilities
Due to banks 41.4 4.4 151.9 5.2 0.3 0.5 203.7
Cash collateral on securities lent 0.0 55.5 7.6 0.0 0.0 0.0 63.1
Repurchase agreements 0.0 30.9 425.1 81.8 7.7 0.0 545.5
Trading portfolio liabilities 2 204.8 0.0 0.0 0.0 0.0 0.0 204.8
Negative replacement values 2 332.5 0.0 0.0 0.0 0.0 0.0 332.5
Financial liabilities designated at fair value 0.0 0.0 7.8 28.0 79.2 30.7 145.7
Due to customers 157.0 130.2 268.5 13.7 1.0 0.2 570.6
Accrued expenses and deferred income 21.5 0.0 0.0 0.0 0.0 0.0 21.5
Debt issued 0.0 0.0 101.1 21.9 9.3 57.9 190.1
Other liabilities 29.6 33.6 0.0 0.0 0.0 0.0 63.2
Total 31.12.06 786.8 254.6 962.0 150.6 97.5 89.3 2,340.7
Total 31.12.05 732.7 244.7 791.5 90.1 74.8 72.9 2,006.7
1 Deposits without a fixed term, on which notice of withdrawal or termination has not been given (such funds may be withdrawn by the depositor or repaid by the borrower subject to an agreed period of notice). 2 Trading and derivative positions are shown within ‘On demand’ which management believes most accurately reflects the short-term nature of trading activities. The contractual maturity of the instruments may however extend over significantly longer periods.

152
Financial StatementsNotes to the Financial Statements
Note 29 Financial Instruments Risk Position (continued)e) Capital Adequacy
The adequacy of UBS’s capital is monitored using, among other measures, the framework established by the Basel Committee on Banking Supervision (“BIS rules / ratios”). The BIS ratios compare the amount of eligible capital (in total and Tier 1) with the total of risk-weighted assets (RWAs).
While UBS monitors and reports BIS capital ratios, it is the rules established by the Swiss regulator, the Swiss Federal Banking Commission (SFBC), which ultimately determine the regulatory capital required to underpin its business. On bal-ance, this results in higher RWAs than under the BIS rules and UBS’s ratios are lower when calculated under the SFBC regulations than under the BIS framework.
UBS’s capital requirements are based on its consolidated Financial Statements prepared under IFRS. Adjustments are made to exclude IFRS consolidated entities that are not ac-tive in the areas of banking, finance or real estate – mainly securitization and collective investment vehicles and indus-trial holdings (including Motor-Columbus in 2005). Adjust-ments are also made to IFRS-based profit and reserves, in line with BIS recommendations, as prescribed by the SFBC, pri-marily in relation to gains and losses recognized under the fair value option and unrealized gains on available-for-sale financial investments.
BIS eligible capital BIS eligible capital consists of two parts. Tier 1 capital com-prises share capital, share premium, retained earnings in-cluding current year profit, foreign currency translation dif-ferences not recognized in the income statement and hybrid Tier 1 capital (part of Equity attributable to minority inter-ests) less accrued expected dividend, net long positions in own shares, and goodwill. Tier 2 capital includes subordi-nated long-term debt. Additionally certain non-trading ex-posures to other financial institutions are required to be de-ducted from capital. Tier 1 capital is required to be at least 4% and Total eligible capital at least 8% of RWAs.
BIS risk-weighted assets (RWAs) Total RWAs are made up of three elements – credit risk, mar-ket risk, and other risk, each of which is described below.
The credit risk component consists of on- and off-balance sheet claims, measured according to regulatory formulas outlined below, and weighted according to type of counter-party and collateral. The least risky claims, such as claims on OECD governments and claims collateralized by cash, are weighted at 0%, meaning that no regulatory capital support is required, while the claims deemed most risky, including unsecured claims on corporates and private customers, are weighted at 100%, meaning that 8% capital support is re-quired.
Securities not held for trading are included as claims, based on the net long position in the securities of each is-suer, including both physical holdings and positions derived from other transactions such as options. UBS’s investments in IFRS consolidated industrial holdings (which for 2005 in-cludes Motor-Columbus) are treated for regulatory capital purposes as positions in securities not held for trading.
Claims arising from derivatives transactions include two components – the current positive replacement values, and “add-ons” to reflect their potential future exposure. Where UBS has entered into a master netting agreement which is accepted by the SFBC as being legally enforceable in insol-vency, positive and negative replacement values with indi-vidual counterparties can be netted and therefore the on-balance sheet component of RWAs for derivatives trans- actions shown in the table on the next page (Positive replacement values) is less than the balance sheet value of Positive replacement values. The add-ons component of the RWAs is shown in the table under Off-balance sheet expo-sures and other positions – Forward and swap contracts, and Purchased options.
Claims arising from contingent commitments and irrevo-cable facilities granted are converted to credit equivalent amounts based on percentages of nominal value specified by the regulators.
Regulatory capital is required to support market risk aris-ing on all foreign exchange, and energy, metals and com-modity positions, and on all positions held for trading, and meeting the regulatory definition of trading book, in interest rate instruments and equities, including risks on individual equities and traded debt obligations such as bonds. For most market risk positions, UBS derives its regulatory capital re-quirement from its internal Value at Risk (VaR) model – see section b)(i) – which is approved by the SFBC. For some small positions market risk regulatory capital is computed using the standardized method defined by the regulators. Unlike the calculations for credit risk and other risks, this produces the capital requirement itself rather than the RWA amount. In order to compute a total capital ratio, the total market risk capital requirement is converted to an “RWA equivalent” (shown in the table as Market risk positions) such that the capital requirement is 8% of this RWA equivalent, i.e. the total market risk capital requirement is multiplied by 12.5.Other risks consist of other types of asset, most notably property and equipment, and intangibles (included in the table on the next page within Other assets). These assets are not subject to credit or market risk, but they represent a risk to the Group in respect of their potential for write-down and impairment and therefore require capital underpinning in ac-cordance with regulatory formulas.

153
Note 29 Financial Instruments Risk Position (continued)e) Capital Adequacy (continued)
Risk-weighted assets (BIS)
CHF millionExposure31.12.06
Risk-weighted amount
31.12.06Exposure31.12.05
Risk-weighted amount
31.12.05
Balance sheet exposures
Due from banks and other collateralized lendings 1 452,821 10,438 665,932 6,991
Net positions in securities 2 10,262 8,447 8,079 6,849
Positive replacement values 3 110,732 24,161 86,950 20,546
Loans, net of allowances for credit losses and other collateralized lendings 1 887,694 206,359 540,051 196,091
Accrued income and prepaid expenses 9,302 4,920 9,081 4,815
Property and equipment 8,436 8,436 7,957 7,957
Other assets 15,976 10,827 13,292 9,115
Off-balance sheet exposures
Contingent liabilities 17,908 7,842 16,595 7,474
Irrevocable commitments 98,439 23,592 73,220 18,487
Forward and swap contracts 4 31,522,982 16,599 22,365,432 10,738
Purchased options 4 1,913,971 411 1,629,260 311
Market risk positions 5 19,860 21,035
Total risk-weighted assets 341,892 310,409
1 Includes gross securities borrowing and reverse repo exposures, and those traded loans in trading portfolio assets originated by the Group for syndication or distribution. These financial instruments are excluded from the Market risk positions. 2 Includes industrial holdings, which are not consolidated for capital adequacy. Excludes positions in the trading book, which are included in Market risk positions. 3 Represents the mark to market values of Forward and swap contracts and Purchased options, where positive but after netting, where applicable. 4 Represents the add-ons for these contracts. 5 Regulatory capital adequacy requirements for market risk, calculated using the approved Value at Risk model, or the standardized method, multiplied by 12.5. This results in the risk-weighted asset equivalent.
BIS capital ratios
CapitalCHF million
31.12.06
Ratio%
31.12.06
CapitalCHF million
31.12.05
Ratio%
31.12.05
Tier 1 40,528 11.9 39,834 12.8
of which hybrid Tier 1 5,633 1.6 4,975 1.6
Tier 2 9,836 2.9 3,974 1.3
Total BIS 50,364 14.7 43,808 14.1
The Tier 1 capital includes preferred securities of CHF 5,633 million (USD 3,300 million and EUR 1,000 million) at 31 Decem-ber 2006 and CHF 4,975 million (USD 2,600 million and EUR 1,000 million) at 31 December 2005.

154
Financial StatementsNotes to the Financial Statements
CHF billion
Carrying value
31.12.06Fair value31.12.06
Unrealized gain / (loss)
31.12.06
Carrying value
31.12.05Fair value31.12.05
Unrealized gain / (loss)
31.12.05
Assets
Cash and balances with central banks 3.5 3.5 0.0 5.4 5.4 0.0
Due from banks 50.4 50.4 0.0 33.6 33.6 0.0
Cash collateral on securities borrowed 351.6 351.6 0.0 288.4 288.3 (0.1)
Reverse repurchase agreements 405.8 405.7 (0.1) 404.4 404.5 0.1
Trading portfolio assets 627.0 627.0 0.0 499.3 499.3 0.0
Trading portfolio assets pledged as collateral 251.5 251.5 0.0 154.8 154.8 0.0
Positive replacement values 328.4 328.4 0.0 333.8 333.8 0.0
Financial assets designated at fair value 5.9 5.9 0.0 1.2 1.2 0.0
Loans 312.5 311.3 (1.2) 279.9 280.5 0.6
Financial investments available-for-sale 8.9 8.9 0.0 6.6 6.6 0.0
Liabilities
Due to banks 203.7 203.7 0.0 124.3 124.3 0.0
Cash collateral on securities lent 63.1 63.1 0.0 59.9 59.9 0.0
Repurchase agreements 545.5 545.5 0.0 478.5 478.5 0.0
Trading portfolio liabilities 204.8 204.8 0.0 188.6 188.6 0.0
Negative replacement values 332.5 332.5 0.0 337.7 337.7 0.0
Financial liabilities designated at fair value 145.7 145.7 0.0 117.4 117.4 0.0
Due to customers 570.6 570.6 0.0 466.9 466.9 0.0
Debt issued 190.1 191.1 (1.0) 160.7 162.0 (1.3)
Subtotal (2.3) (0.7)
Unrealized gains and losses recorded in equity before tax on:
Financial investments available-for-sale 3.7 1.1
Derivative instruments designated as cash flow hedges (0.6) (0.9)
Net unrealized gains and losses recognized directly in equity 0.8 (0.5)
Note 30 Fair Value of Financial Instruments and Continued Recognition of Transferred Financial Assetsa) Fair Value of Financial Instruments
The following table presents the fair value of financial instruments, including those not reflected in the financial statements at fair value. It is accompanied by a discussion of the methods used to determine fair value for financial instruments.
Fair value is the amount for which an asset could be ex-changed, or a liability settled, between knowledgeable, will-ing parties in an arm’s length transaction. For financial in-struments carried at fair value, market prices or rates are used to determine fair value where an active market exists (such as a recognized stock exchange), as it is the best evi-dence of the fair value of a financial instrument.
Market prices and rates are not, however, available for certain financial assets and liabilities held and issued by UBS. In these cases, fair values are estimated using present value or other valuation techniques, using inputs based on market conditions existing at the balance sheet dates.
Valuation techniques are generally applied to OTC deriva-tives and financial assets and liabilities held for trading and designated at fair value. The most frequently applied pricing models and valuation techniques include forward pricing and swap models using present value calculations, option
models such as the Black-Scholes model or generalizations of it, and credit models such as default rate models or credit spread models.
The values derived from applying these techniques are significantly affected by the choice of valuation model used and the underlying assumptions made concerning factors such as the amounts and timing of future cash flows, dis-count rates, volatility, and credit risk.
The following methods and significant assumptions have been applied in determining the fair values of financial in-struments presented in the table for both financial instru-ments carried at fair value and those carried at cost (for which fair values are provided as a comparison): (a) trading portfolio assets and liabilities, trading portfolio
assets pledged as collateral, financial assets and liabilities designated at fair value through profit or loss, deriva-tives, and other transactions undertaken for trading

155
purposes are measured at fair value by reference to quot-ed market prices when available. If quoted market prices are not available, then fair values are estimated on the basis of pricing models, or other recognized valuation techniques. Fair value is equal to the carrying amount for these items;
(b) financial investments available-for-sale are measured at fair value by reference to quoted market prices when available. If quoted market prices are not available, then fair values are estimated on the basis of pricing models or other recognized valuation techniques. Fair value is equal to the carrying amount for these items, and un-realized gains and losses, excluding impairment write-downs, are recorded in Equity until an asset is sold, col-lected or otherwise disposed of;
(c) the fair value of demand deposits and savings accounts with no specific maturity is assumed to be the amount payable on demand at the balance sheet date;
(d) the fair value of variable rate financial instruments is as-sumed to be approximated by their carrying amounts and, in the case of loans, does not, therefore, reflect changes in their credit quality, as the impact of impair-ment is recognized separately by deducting the amount of the allowance for credit losses from both carrying and fair values;
(e) the fair value of fixed-rate loans and mortgages carried at amortized cost is estimated by comparing market interest rates when the loans were granted with current market rates offered on similar loans. Changes in the credit quality of loans within the portfolio are not taken into account in determining gross fair values, as the impact of impairment is recognized separately by deducting the amount of the allowance for credit losses from both carrying and fair values.Where applicable, the interest accrued to date on finan-
cial instruments is included in the carrying value of the finan-cial instruments mentioned in the table.
Note 30 Fair Value of Financial Instruments and Continued Recognition of Transferred Financial Assets (cont.)a) Fair Value of Financial Instruments (continued)
These valuation techniques and assumptions provide a consistent measurement of fair value for UBS’s assets and liabilities as shown in the table. However, because other in-stitutions may use different methods and assumptions when estimating fair value using a valuation technique, and when estimating the fair value of financial instruments not carried at fair value, such fair value disclosures cannot necessarily be compared from one financial institution to another.
The table does not reflect the fair values of non-financial assets and liabilities such as property, equipment, goodwill, prepayments and non-interest accruals. Fair values of physi-cal commodities are reflected in the table under trading portfolio assets.
Substantially all of UBS’s undrawn commitments to ex-tend credit are at variable rates. Accordingly, UBS has no significant exposure to fair value fluctuations resulting from interest rate movements related to these commitments.
The fair values of UBS’s fixed-rate loans, long- and medi-um-term notes and bonds issued are predominantly hedged by derivative instruments, mainly interest rate swaps, as ex-plained in Note 23. The interest rate risk inherent in balance sheet positions with no specific maturity is also hedged with derivative instruments based on management’s view of their average cash flow and re-pricing behavior.
Derivative instruments used for hedging are carried on the balance sheet at fair values, which are included in the Positive or Negative replacement values in the table. When the interest rate risk on a fixed-rate financial instrument is hedged with a derivative in a fair value hedge, the fixed-rate financial instrument (or hedged portion thereof) is reflected in the table at fair value only in relation to the interest rate risk, not the credit risk, as explained in (e). Fair value changes are recorded in Net profit. The treatment of derivatives des-ignated as cash flow hedges is explained in Note 1 a14). The amount shown in the table as Derivative instruments desig-nated as cash flow hedges is the net change in fair values on such derivatives that is recorded in Equity and not yet trans-ferred to income or expense.

156
Financial StatementsNotes to the Financial Statements
Note 30 Fair Value of Financial Instruments and Continued Recognition of Transferred Financial Assets (cont.)b) Determination of Fair Values from Quoted Market Prices or Valuation Techniques
For trading portfolio assets and liabilities, financial assets and liabilities designated at fair value and financial investments available-for-sale which are listed or otherwise traded in an active market, for exchange traded derivatives, and for other financial instruments for which quoted prices in an active market are available, fair value is determined directly from those quoted market prices.
For financial instruments which do not have quoted market prices directly available, fair values are estimated using valua-tion techniques or models, based wherever possible on as-sumptions supported by observable market prices or rates pre-vailing at the balance sheet date. This is the case for the majority of OTC derivatives, and for many unlisted instruments and other items which are not traded in active markets.
For a small portion of financial instruments, fair values cannot be obtained directly from quoted market prices, or indirectly using valuation techniques or models sup-ported by observable market prices or rates. This is gener-ally the case for private equity investments in unlisted secu-rities, and for certain complex or structured financial instruments. In these cases, fair value is estimated indirect- ly using valuation techniques or models for which the in-puts are reasonable assumptions, based on market con-ditions.
The following table presents the valuation methods used to determine fair values of financial instruments carried at fair value:
31.12.06 31.12.05
CHF billion
Quoted market
price
Valuation technique –
market- observable
inputs
Valuation technique – non-market observable
inputs Total
Quoted market
price
Valuation technique –
market- observable
inputs
Valuation technique – non-market observable
inputs Total
Trading portfolio assets 215.1 411.8 0.1 627.0 273.2 225.2 0.9 499.3
Trading portfolio assets pledged as collateral 243.5 8.0 0.0 251.5 147.6 7.2 0.0 154.8
Positive replacement values 31.3 285.6 11.5 328.4 13.6 313.4 6.8 333.8
Financial assets designated at fair value 0.0 5.1 0.8 5.9 0.2 1.0 0.0 1.2
Financial investments available-for-sale 2.5 4.6 1.8 8.9 3.0 1.1 2.5 6.6
Total assets 492.4 715.1 14.2 1,221.7 437.6 547.9 10.2 995.7
Trading portfolio liabilities 169.9 34.9 0.0 204.8 171.2 17.4 0.0 188.6
Negative replacement values 32.7 290.6 9.2 332.5 15.9 311.1 10.7 337.7
Financial liabilities designated at fair value 0.0 80.0 65.7 145.7 0.0 92.5 24.9 117.4
Total liabilities 202.6 405.5 74.9 683.0 187.1 421.0 35.6 643.7

157
Included in the fair value of financial instruments carried at fair value on the balance sheet are those estimated in full or in part using valuation techniques based on assumptions that are not supported by market-observable prices or rates. All models used for valuation undergo an internal validation process before they are certified for use.
There may be uncertainty about a valuation, resulting from the choice of model used, the deep-in-the-model pa-rameters it employs, and the extent to which inputs are not market observable, or as a result of other elements affecting the valuation. Valuation adjustments are made to reflect such uncertainty and deducted from the fair values produced by the models or other valuation techniques.
Based on UBS’s established fair value and model gover-nance policies and the related controls and procedural safe-guards the Group employs, management believes the result-ing estimated fair values recorded in the balance sheet and the changes in fair values recorded in the income statement are reasonable and are the most appropriate at the balance sheet date.
The potential effect of using reasonably possible alter-native assumptions as inputs to valuation techniques from which the fair values of these financial instruments are deter-mined has been quantified as a reduction of approximately CHF 1,038 million using less favorable assumptions and an increase of approximately CHF 955 million using more favor-able assumptions at 31 December 2006; and a reduction of approximately CHF 1,094 million using less favorable assump-tions and an increase of approximately CHF 1,176 million us-ing more favorable assumptions at 31 December 2005.
The determination of reasonably possible alternative as-sumptions is itself subject to considerable judgment. For val-uations based on models, reasonably possible alternatives have been estimated using the same techniques as are used to determine model valuation adjustments, by increasing (for less favorable assumptions) and decreasing (for more favorable assumptions) the confidence level applied. In changing the assumptions, it is assumed that the impact of correlation between different financial instruments and models is minimal. A similar approach is used for valuation techniques other than those based on models.
Note 30 Fair Value of Financial Instruments and Continued Recognition of Transferred Financial Assets (cont.)c) Sensitivity of Fair Values to Changing Significant Assumptions to Reasonably Possible Alternatives
d) Changes in Fair Value Recognized in Profit or Loss during the Period which were Estimated using Valuation Techniques
Total Net trading income for the years ended 31 December 2006 and 31 December 2005 was CHF 13,318 million and CHF 7,996 million, respectively, which represents the net re-sult from a range of products traded across different busi-ness activities, including the effect of the foreign currency translation of monetary assets and liabilities and including both realized and unrealized income. Unrealized income is determined from changes in fair values, using quoted prices in active markets when available, and otherwise estimated using valuation techniques.
Included in the unrealized portion of Net trading income are net losses from changes in fair value of CHF 8,284 mil-lion and CHF 2,286 million for the years ended 31 December 2006 and 31 December 2005, respectively, on financial in-struments for which fair values were estimated using valuation techniques. These valuation techniques include models such as those described in previous sections, which range from relatively simple models with market-observable inputs, to those which are more complex and require the use of assumptions or estimates based on market conditions.
Net trading income is often generated from transactions involving several financial instruments or subject to hedging or other risk management techniques. This may result in
different portions of the transaction being priced using dif-ferent methods. In many cases, the amounts estimated using valuation techniques were offset by changes in fair value of other financial instruments or transactions, for which quoted market prices or rates were available, or on which the gain or loss has been realized. Consequently, the changes in fair value which were estimated using valuation techniques and have been recognized in profit or loss during the period rep-resent only a portion of Net trading income.
The amount of realized income and unrealized income from changes in fair values estimated using quoted market prices, including the effect of foreign currency translation on unrealized gains or losses, was a gain of CHF 21,602 million, CHF 10,282 million and CHF 12,025 million for the years end-ed 31 December 2006, 31 December 2005 and 31 December 2004, respectively.
Changes in fair value estimated using valuation techniques are also recognized in net profit in situations of unrealized impairments on financial investments available-for-sale. The total of such impairment amounts recognized in Net profit was CHF 10 million for the year ended 31 December 2006, CHF 3 million for the year ended 31 December 2005 and CHF 218 million for the year ended 31 December 2004.

158
Financial StatementsNotes to the Financial Statements
Note 30 Fair Value of Financial Instruments and Continued Recognition of Transferred Financial Assets (cont.)e) Transferred Financial Assets which do not Qualify for Derecognition
The following table presents details of financial assets which have been sold or otherwise transferred, but which do not qualify for derecognition. Criteria for derecognition are discussed in Note 1 a4).
Continued asset recognition in full – Total assets
CHF billion 31.12.06 31.12.05
Nature of transaction
Securities lending agreements 98.9 50.5
Repurchase agreements 146.5 100.0
Other financial asset transfers 69.8 85.0
Total 315.2 235.5
The transactions are mostly conducted under standard agreements employed by financial market participants and are undertaken with counterparties subject to UBS’s normal credit risk control processes. The resulting credit exposures are controlled by daily monitoring and collateralization of the positions. The financial assets which continue to be rec-ognized are typically transferred in exchange for cash or oth-er financial assets. The associated liabilities can therefore be assumed to be approximately the carrying amount of the transferred financial assets.
UBS retains substantially all risks and rewards of the trans-ferred assets in each situation of continued recognition in
full. These include credit risk, settlement risk, country risk and market risk.
Repurchase agreements and securities lending agree-ments are discussed in Notes 1 a12) and 1 a13). Other financial asset transfers include sales of financial assets while concurrently entering into a total rate of return swap with the same counterparty and sales of financial assets involving guarantees.
Transferred financial assets which are subject to partial continued recognition were immaterial in 2006 and 2005. The carrying amounts of the partially recognized transferred financial assets are included in the table.

159
Note 31 Pension and Other Post-Retirement Benefit Plans
a) Defined benefit plans The Group has established various pension plans inside and outside of Switzerland. The major plans are located in Switzerland, the UK, the US and Germany. Independent ac-tuarial valuations are performed for the plans in these loca-tions. The measurement date of these plans is 31 December for each year presented.
The pension funds of Atel Ltd. and some of its group companies in Switzerland and Germany are included in the disclosure up to 31 December 2005 but are not included in the 31 December 2006 disclosure since these companies were sold on 23 March 2006.
The overall investment policy and strategy for the Group’s defined benefit pension plans is guided by the objective of achieving an investment return which, together with the contributions paid, is sufficient to maintain reasonable con-trol over the various funding risks of the plans. The invest-ment advisors appointed by plan trustees are responsible for determining the mix of asset types and target allocations which are reviewed by the plan trustees on an ongoing basis. Actual asset allocation is determined by a variety of current economic and market conditions and in consideration of specific asset class risk.
The expected long-term rates of return on plan assets are based on long-term expected inflation, interest rates, risk premiums and targeted asset class allocations. These esti-mates take into consideration historical asset class returns and are determined together with the plans’ investment and actuarial advisors.
Swiss pension plans The pension plan of UBS covers practically all UBS em- ployees in Switzerland and exceeds the minimum benefit requirements under Swiss law. The Swiss plan was amended on 1 January 2007 to change the definition of retirement benefits from a final covered salary to a retirement savings approach. The pension plan provides benefits which are based on annual contributions as a percentage of salary and accrue at an interest rate that is defined annually by the plan trustees.
Contributions to the pension plan of UBS are paid by em-ployees and the employer. The employee contributions are calculated as a percentage of covered salary and are deduct-ed monthly. The percentages deducted from salary for full benefit coverage (including risk benefits) depend on age and vary between 1% and 10% of covered base salary and 3%
and 8% of covered bonus. The employer pays a contribution that ranges between 100% and 350%, or approximately 230%, on average, of the sum of employees’ contributions. The benefits covered include retirement benefits, disability, death and survivor pensions, and employment termination benefits.
The employer contributions expected to be made in 2007 to the Swiss pension plan are CHF 520 million. The accumu-lated benefit obligation (which is the current value of ac-crued benefits without allowance for future salary increases) for the Swiss pension plan was CHF 19,094 million as of 31 December 2006 (2005: CHF 18,863 million, 2004: CHF 18,566 million).
Foreign pension plans The foreign locations of UBS operate various pension plans in accordance with local regulations and practices. Among these plans are defined contribution plans as well as defined benefit plans. The locations with defined benefit plans of a material nature are in the UK, the US and Germany. The UK and the US defined benefit plans are closed to new entrants who are covered by defined contribution plans. The amounts shown for foreign plans reflect the net funded positions of the major foreign plans.
The retirement plans provide benefits in the event of re-tirement, death, disability or employment termination. The plans’ retirement benefits depend on age, contributions and level of compensation. The principal plans are financed in full by the Group. The employer contributions expected to be made in 2007 to these pension plans are CHF 76 million. The funding policy for these plans is consistent with local government and tax requirements.
The assumptions used in foreign plans take into account local economic conditions. The accumulated benefit obli-gation for these pension plans was CHF 5,142 million as of 31 December 2006 (2005: CHF 4,992 million, 2004: CHF 4,118 million). For pension plans with an accumulated ben-efit obligation in excess of plan assets, the aggregate pro-jected benefit obligation and accumulated benefit obligation was CHF 4,710 million and CHF 4,683 million as of 31 De-cember 2006 (2005: CHF 4,521 million and CHF 4,497 mil-lion, 2004: CHF 3,755 million and CHF 3,735 million). The fair value of plan assets for these plans was CHF 4,092 mil-lion as of 31 December 2006 (2005: CHF 3,789 million, 2004: CHF 3,166 million).

160
Financial StatementsNotes to the Financial Statements
Note 31 Pension and Other Post-Retirement Benefit Plans (continued)
a) Defined benefit plans
CHF million Swiss Foreign
For the year ended 31.12.06 31.12.05 31.12.04 31.12.06 31.12.05 31.12.04
Defined benefit obligation at the beginning of the year (20,972) (20,225) (18,216) (5,020) (4,142) (3,663)
Service cost (347) (353) (345) (76) (82) (83)
Interest cost (611) (660) (672) (242) (236) (212)
Plan participant contributions (221) (219) (203)
Amendments (125)
Actuarial gain / (loss) (265) (713) (1,392) (120) (416) (296)
Foreign currency translation (84) (280) 146
Benefits paid 723 866 910 149 144 125
Special termination benefits (17) (37) (35) (2)
Acquisitions (272) (6) (159)
Settlements 329 369 186
Defined benefit obligation at the end of the year (21,506) (20,972) (20,225) (5,207) (5,020) (4,142)
Fair value of plan assets at the beginning of the year 20,229 18,575 17,619 4,288 3,580 3,402
Expected return on plan assets 998 925 878 283 263 248
Actuarial gain / (loss) 447 1,284 102 40 247 122
Foreign currency translation 74 253 (132)
Employer contributions 492 468 411 66 89 65
Plan participant contributions 221 219 203
Benefits paid (723) (866) (910) (149) (144) (125)
Acquisitions 272
Settlements (328) (376)
Fair value of plan assets at the end of the year 21,336 20,229 18,575 4,602 4,288 3,580
Funded status (170) (743) (1,650) (605) (732) (562)
Unrecognized net actuarial (gains) / losses 2,123 2,334 3,006 1,237 1,222 1,046
Unrecognized past service cost 1 1 1
Unrecognized asset (1,953) (1,591) (1,356)
(Accrued) / prepaid pension cost 0 0 0 633 491 485
Movement in the net (liability) or asset
(Accrued) / prepaid pension cost at the beginning of the year 491 485 710
Net periodic pension cost (492) (468) (411) (103) (125) (105)
Employer contributions 492 468 411 66 89 65
Acquisitions (6) (159)
Settlement 170
Foreign currency translation 9 48 (26)
(Accrued) / prepaid pension cost 0 0 0 633 491 485
Amounts recognized in the balance sheet
Prepaid pension cost 815 832 805
Accrued pension liability (182) (341) (320)
(Accrued) / prepaid pension cost 0 0 0 633 491 485

161
Note 31 Pension and Other Post-Retirement Benefit Plans (continued)
a) Defined benefit plans (continued)
CHF million Swiss Foreign
For the year ended 31.12.06 31.12.05 31.12.04 31.12.06 31.12.05 31.12.04
Components of net periodic pension cost
Service cost 347 353 345 76 82 83
Interest cost 611 660 672 242 236 212
Expected return on plan assets (998) (925) (878) (283) (263) (248)
Amortization of unrecognized past service cost 125 (3)
Amortization of unrecognized net (gains) / losses 25 101 68 68 58
Special termination benefits 17 37 35 2
Settlements 10
Increase / (decrease) of unrecognized asset 365 235 237
Net periodic pension cost 492 468 411 103 125 105
Funded and unfunded plans Swiss
CHF million 31.12.06 31.12.05 31.12.04 31.12.03 31.12.02
Defined benefit obligation from funded plans (21,506) (20,972) (20,225) (18,216) (19,204)
Plan assets 21,336 20,229 18,575 17,619 16,566
Surplus / (deficit) (170) (743) (1,650) (597) (2,638)
Experience gains / (losses) on plan liabilities (265) (77)
Experience gains / (losses) on plan assets 447 1,284
Foreign
CHF million 31.12.06 31.12.05 31.12.04 31.12.03 31.12.02
Defined benefit obligation from funded plans (5,002) (4,635) (3,815) (3,509) (3,295)
Defined benefit obligation from unfunded plans (205) (385) (327) (154) (141)
Plan assets 4,602 4,288 3,580 3,402 2,382
Surplus / (deficit) (605) (732) (562) (261) (1,054)
Experience gains / (losses) on plan liabilities (11) 7
Experience gains / (losses) on plan assets 40 247
Swiss Foreign
31.12.06 31.12.05 31.12.04 31.12.06 31.12.05 31.12.04
Principal weighted average actuarial assumptions used (%)
Assumptions used to determine defined benefit obligations at the end of the year
Discount rate 3.0 3.0 3.3 5.2 5.0 5.5
Expected rate of salary increase 2.5 2.5 2.5 4.6 4.4 4.4
Rate of pension increase 0.8 0.8 1.0 2.1 1.9 1.9
Assumptions used to determine net periodic pension cost for the year ended
Discount rate 3.0 3.3 3.8 5.0 5.5 5.7
Expected rate of return on plan assets 5.0 5.0 5.0 6.7 7.0 7.2
Expected rate of salary increase 2.5 2.5 2.5 4.4 4.4 4.6
Rate of pension increase 0.8 1.0 1.0 1.9 1.9 1.9

162
Financial StatementsNotes to the Financial Statements
Note 31 Pension and Other Post-Retirement Benefit Plans (continued)
a) Defined benefit plans (continued)
Swiss Foreign
CHF million, exept where indicated 31.12.06 31.12.05 31.12.04 31.12.06 31.12.05 31.12.04
Expected future benefit payments
2007 976 157
2008 992 150
2009 1,013 160
2010 1,008 171
2011 1,022 183
2012–2016 5,307 1197
Plan assets (weighted average)
Actual plan asset allocation (%)
Equity instruments 41 43 43 53 52 54
Debt instruments 45 43 41 38 39 41
Real estate 11 12 12 4 4 2
Other 3 2 4 5 5 3
Total 100 100 100 100 100 100
Long-term target plan asset allocation (%)
Equity instruments 33–51 34–46 34–49 49–53 52–55 49–55
Debt instruments 31–50 30–53 30–53 37–44 44–45 44–47
Real estate 10–19 11–19 12–19 4–6 0–3 1–2
Other 0 0 0 1–5 1–2 0–6
Actual return on plan assets (%) 7.2 12.0 5.5 7.8 13.6 10.8
Additional details to fair value of plan assets
UBS financial instruments and UBS bank accounts 684 613 1,239
UBS AG shares 1 193 225 238
Securities lent to UBS included in plan assets 7,169 2,222 3,778
Other assets used by UBS included in plan assets 69 69 73
1 The number of UBS AG shares was 2,600,417; 3,589,152; and 4,986,346 as of 31 December 2006, 31 December 2005 and 31 December 2004, respectively.

163
b) Post-retirement medical and life plans In the US and the UK, the Group offers retiree medical ben-efits that contribute to the health care coverage of employ-ees and beneficiaries after retirement. In addition to retiree medical benefits, the Group in the US also provides retiree life insurance benefits. The UK plan is closed to new en-trants.
The benefit obligation in excess of fair value of plan assets for those plans amounts to CHF 219 million as of 31 Decem-ber 2006 (2005: CHF 216 million, 2004: CHF 166 million) and the total accrued post-retirement cost amounts to CHF
176 million as of 31 December 2006 (2005: CHF 168 million, 2004: CHF 136 million). The net periodic post-retirement costs for the years ended 31 December 2006, 31 December 2005 and 31 December 2004 were CHF 24 million, CHF 21 million and CHF 16 million, respectively.
The employer contributions expected to be made in 2007 to the post-retirement medical and life plans are CHF 9 mil-lion. The expected future benefit payments are CHF 9 mil- lion for the years 2007 and 2008, CHF 10 million for the years 2009 and 2010, CHF 11 million for the year 2011, CHF 64 million in total for the years 2012 to 2016.
Note 31 Pension and Other Post-Retirement Benefit Plans (continued)
b) Post-retirement medical and life plans
CHF million 31.12.06 31.12.05 31.12.04
Post-retirement benefit obligation at the beginning of the year (216) (166) (179)
Service cost (10) (8) (6)
Interest cost (11) (11) (9)
Plan participant contribution (1) 0 0
Actuarial gain / (loss) 1 (17) 8
Foreign currency translation 10 (22) 12
Amendments (1) 0 0
Benefits paid 9 8 8
Post-retirement benefit obligation at the end of the year (219) (216) (166)
Fair value of plan assets at the beginning of the year 0 0 0
Employer contributions 8 8 8
Plan participant contribution 1 0 0
Benefits paid (9) (8) (8)
Fair value of plan assets at the end of the year 0 0 0
31.12.06 31.12.05 31.12.04 31.12.03 31.12.02
Defined benefit obligation (219) (216) (166) (179) (166)
Plan asset 0 0 0 0 2
Surplus / (deficit) (219) (216) (166) (179) (164)
Experience gains / (losses) on plan liabilities 1 (3) 0 0 0
The assumed average health care cost trend rate used in determining post-retirement benefit expense is assumed to be 11% for 2006 and to decrease to an ultimate trend rate of 5% in 2013. On a country-by-country basis, the same discount rate is used for the calculation of the post-retire-ment benefit obligation from medical and life plans as for the defined benefit obligations arising from pension plans.
CHF million 1% increase 1% decrease
Effect on total service and interest cost 4 (3)
Effect on the post-retirement benefit obligation 28 (19)
Assumed health care cost trend rates have a significant ef-fect on the amounts reported for health care plans. A one percentage point change in the assumed health care cost trend rates would change the US post-retirement benefit obligation and the service and interest cost components of the net periodic post-retirement benefit costs as follows:

164
Financial StatementsNotes to the Financial Statements
Note 31 Pension and Other Post-Retirement Benefit Plans (continued)
c) Defined contribution plans The Group also sponsors a number of defined contribution plans primarily in the UK and the US. Certain plans permit em-ployees to make contributions and earn matching or other contributions from the Group. The contributions to these plans recognized as expense for the years ended 31 December 2006, 31 December 2005 and 31 December 2004 were CHF 229 million, CHF 184 million and CHF 187 million, respectively.
d) Related party disclosure UBS is the principal bank for the pension fund of UBS in Switzerland. In this function, UBS is engaged to execute most of the pension fund’s banking activities. These activities also include, but are not limited to, trading and securities lending and borrowing. All transactions have been executed at arm’s length conditions.
The foreign UBS pension funds do not have a similar banking relationship with UBS, but they may hold and trade UBS shares and / or securities.
The following fees and interest have been received or paid by UBS:
For the year ended
CHF million 31.12.06 31.12.05 31.12.04
Received by UBS
Fees 53 48 42
Paid by UBS
Interest 2 4 4
Dividends and capital repayments 33 7 7
For the year ended
31.12.06 31.12.05 31.12.04
Financial instruments bought by pension funds
UBS AG shares (in thousands of shares) 1,793 2,774 5,644
UBS financial instruments (nominal values in CHF million) 8 0 47
Financial instruments sold by pension funds or matured
UBS AG shares (in thousands of shares) 2,752 4,526 7,426
UBS financial instruments (nominal values in CHF million) 14 45 18
The transaction volumes in UBS shares and other UBS securities are as follows:
UBS has also leased buildings from its pension funds. The rent paid by UBS under these leases amounted to CHF 4 mil-lion in 2006, CHF 4 million in 2005 and CHF 5 million in 2004.
There were financial instruments in the amount of CHF 120 million due from UBS pension plans outstanding as of 31 December 2006 (2005: CHF 163 million, 2004: CHF 0
million). The amounts due to UBS defined benefit pension plans are contained in the additional details to the fair value of plan assets. Furthermore, UBS defined contribution plans hold 14,158,961 UBS shares with a market value of CHF 1,043 million as of 31 December 2006 (2005: 14,128,558 shares with a market value of CHF 885 million, 2004: 14,460,628 shares with a market value of CHF 691 million).

165
Note 32 Equity Participation and Other Compensation Plans a) Plans offered
UBS has established several equity participation plans to further align the long-term interests of executives, managers and staff with the interests of shareholders. The plans are offered to eligible employees in approximately 50 countries and are designed to meet the complex legal, tax and regula-tory requirements of each country in which they are offered. The explanations below describe the most significant plans in general, but specific plan rules may vary by country.
Equity Plus Plan (Equity Plus): This voluntary plan gives eligible employees the opportunity to purchase UBS shares at fair market value on the purchase date and generally re-ceive at no additional cost two UBS options for each share purchased, up to a maximum annual limit. The options have a strike price equal to the fair market value of the shares on the date the option is granted and are forfeitable in certain circumstances. Share purchases can be made annually from bonus compensation and/or quarterly based on regular de-ductions from salary. Shares purchased under Equity Plus are restricted from sale for two years from the time of purchase, and the options granted have a two-year vesting period and generally expire ten years from the date of grant.
Discounted purchase plan: Up to and including 2005, selected employees in Switzerland were entitled to purchase a specified number of UBS shares, which must be held for a specified period of time, at a predetermined discounted price each year. No new awards are made under this plan.
Equity Ownership Plan (EOP): Selected employees receive between 10% and 45% of their performance-related com-pensation in UBS shares or notional UBS shares instead of cash, on a mandatory basis. Up to and including 2004, cer-tain employees were eligible to receive a portion of their EOP award in Alternative Investment Vehicles (AIVs) or UBS op-tions. Since 2005, options are not granted as part of EOP and awards are generally made in UBS shares, with less than
5% being made in AIVs to selected employee groups. EOP awards vest in one-third increments over a three-year vesting period. In certain circumstances, these awards are forfeit-able.
Key Employee Stock Option Plan (KESOP): Key and high potential employees are granted UBS options with a strike price not less than the fair market value of the shares on the date the option is granted. One option gives the right to ac-quire one registered UBS share at the option’s strike price. Options generally vest in one-third increments over a three-year vesting period and generally expire ten years from the grant date. In certain circumstances, these awards are for-feitable.
Other plans: UBS sponsors a deferred compensation plan for selected eligible employees. Generally, contributions are made on a voluntary and tax deferred basis, and participants are allowed to notionally invest in AIVs (generally money market funds, UBS and non-UBS mutual funds and other UBS sponsored funds). No additional company match is granted, and the awards are generally not forfeitable. In ad-dition, UBS also grants other compensation awards to new recruits and key employees, generally in the form of UBS shares or options.
UBS satisfies share delivery obligations under its option- based participation plans either by purchasing UBS shares in the market on grant date or shortly thereafter or through the issuance of new shares. At exercise, shares held in trea-sury or newly issued shares are delivered to the employee against receipt of the strike price. As of 31 December 2006, UBS was holding approximately 115 million shares in trea-sury and an additional 150 million unissued shares in condi-tional share capital which are available and can be used for future employee option exercises. The shares available cover all vested (i.e. exercisable) employee options.

166
Financial StatementsNotes to the Financial Statements
Note 32 Equity Participation and Other Compensation Plans (Continued)b) UBS share awards
Movements in shares granted under various equity participation plans described in Note 32a) are as follows:
Number of shares
31.12.06
Weighted average
grant date fair value
(CHF)
Number of shares
31.12.05
Weighted average
grant date fair value
(CHF)
Number of shares
31.12.04
Weighted average
grant date fair value
(CHF)
Unvested, at the beginning of the year 53,725,186 46 49,273,638 40 62,767,780 38
Shares awarded during the year 26,652,070 69 27,252,100 51 23,426,812 48
Vested during the year (22,712,566) 43 (21,991,760) 39 (35,992,996) 40
Forfeited during the year (1,523,588) 56 (808,792) 45 (927,958) 39
Unvested, at the end of the year 56,141,102 58 53,725,186 46 49,273,638 40
UBS estimates the grant date fair value of shares awarded during the year by using the average UBS share price on the grant date as quoted on the virtX. The market value of shares
c) UBS option awards
Movements in options granted under various equity participation plans described in Note 32a) are as follows:
Number of options
31.12.06
Weighted 1 average1
exercise price1 (CHF) 1
Number of options
31.12.05
Weighted1 average1
exercise price1 (CHF) 1
Number of options
31.12.04
Weighted1 average1
exercise price1 (CHF) 1
Outstanding, at the beginning of the year 181,765,090 42 201,814,708 35 218,080,052 32
Granted during the year 45,517,013 71 45,202,854 55 48,226,504 46
Exercised during the year (47,179,386) 36 (61,303,418) 34 (58,793,918) 29
Forfeited during the year (3,303,002) 55 (3,810,106) 45 (5,385,648) 33
Expired unexercised (20,628) 40 (138,948) 34 (312,282) 38
Outstanding, at the end of the year 176,779,087 50 181,765,090 42 201,814,708 35
Exercisable, at the end of the year 80,312,503 36 74,788,838 35 75,882,560 33
1 Some of the options in this table have exercise prices denominated in USD which have been converted into CHF at the year-end spot exchange rate for the purposes of this table.
31.12.06 31.12.05 31.12.04
Intrinsic value of options exercised during the year (CHF million) 1,660 1,224 960
Weighted average grant date fair value of options granted (CHF) 12 8 13
The weighted average share price at the time when the op-tions were exercised during the year was CHF 71, CHF 53 and CHF 46 for the years ended 31 December 2006, 31 De-
In addition, UBS received cash of CHF 1,698 million and CHF 2,018 million and an income tax benefit of CHF 153 million and CHF 217 million from the exercise of share options for the years ended 31 December 2006 and 31 December 2005, respectively.
vested was CHF 1,587 million, CHF 1,083 million and CHF 1,922 million for the years ended 31 December 2006, 31 December 2005 and 31 December 2004, respectively.
cember 2005 and 31 December 2004, respectively. The following table provides additional information about option awards:
The intrinsic value of share-based liabilities (shares and options) paid for the years ended 31 December 2006, 31 December 2005 and 31 December 2004 was CHF 177 million, CHF 87 million and CHF 669 million, respectively.

167
Note 32 Equity Participation and Other Compensation Plans (continued)c) UBS option awards (continued)
Options outstanding Options exercisable
Range of exercise price per share
Number of options
outstanding
Weighted average exercise
price (CHF / USD)
Aggregate intrinsic
value (CHF / USD million)
Weighted average
remaining contractual
term (years)
Number of options
exercisable
Weighted average exercise
price (CHF / USD)
Aggregate intrinsic
value (CHF /USD million)
Weighted average
remaining contractual
term (years)
CHF
26.69–40.00 22,771,326 34.56 899 5.7 22,446,861 34.56 886 5.7
40.01–50.00 18,173,910 46.86 494 6.5 11,928,252 46.74 326 6.1
50.01–60.00 25,666,234 51.96 567 8.1 3,412,867 50.72 80 8.2
60.01–70.00 3,100,770 65.95 25 9.4 5,812 63.23 0 8.9
70.01–77.33 41,726,240 71.56 127 9.2 0
26.69–77.33 111,438,480 55.30 2,112 7.8 37,793,792 39.87 1,292 6.1
USD
2.25–20.00 1,196,068 13.75 56 0.6 1,196,068 13.75 56 0.6
20.01–30.00 28,759,581 23.32 1,064 4.6 28,759,581 23.32 1,064 4.6
30.01–40.00 14,070,241 36.38 337 7.3 9,199,687 35.89 225 7.2
40.01–53.50 21,314,717 43.76 353 8.1 3,363,375 42.72 59 8.1
2.25–53.50 65,340,607 32.63 1,810 6.2 42,518,711 27.31 1,404 5.3
The following table summarizes additional information about options outstanding and options exercisable at 31 Decem- ber 2006:
d) Valuation
The fair value of options granted from 1 January 2005 has been determined by means of a Monte Carlo simulation. The simulation technique uses a mix of implied and historic vola-tility and specific employee exercise behavior patterns based on statistical data, taking into account the specific terms and conditions under which the options are granted such as the vesting period, forced exercises during the lifetime, and gain- and time-dependent exercise behavior. The expected term of each option is calculated as the probability-weighted
average period of the time between grant and exercise. The term structure of volatility is derived from the implied vola-tilities of traded UBS options in combination with the ob-served long-term historic share price volatility. Dividends are assumed to grow at a 10% yearly rate over the term of the option.
The fair value of options granted during 2006 and 2005 was determined using the following assumptions:
31.12.06
CHF awards 1 range low range high
Expected volatility (%) 25.38 22.51 27.18
Risk-free interest rate (%) 2.15 1.96 2.68
Expected dividend (CHF) 2.26 1.76 2.83
Strike price (CHF) 71.19 65.13 77.33
Share price (CHF) 70.16 65.13 76.25
1 Less than 1% of awards in 2006 were granted in USD. These have been combined with CHF awards for purposes of this disclosure.

168
Financial StatementsNotes to the Financial Statements
The fair value of options granted during 2004 was determined using a proprietary option pricing model, similar to an American-style binomial model, using the following assumptions:
Note 32 Equity Participation and Other Compensation Plans (Continued)d) Valuation (continued)
31.12.05
CHF awards range low range high USD awards range low range high
Expected volatility (%) 23.20 12.39 27.03 23.36 15.21 27.21
Risk-free interest rate (%) 2.00 0.62 2.34 4.11 1.91 4.63
Expected dividend (CHF / USD) 2.30 1.50 3.89 1.89 1.22 4.12
Strike price (CHF / USD) 52.08 48.23 63.23 44.11 39.25 48.26
Share price (CHF / USD) 51.33 48.23 63.23 43.40 39.25 48.26
The expected life was estimated on the basis of observed employee option exercise patterns. Volatility was derived from the observed long-term historic share price volatility aligned to the expected life of the option. Dividends were assumed to grow at a 10% yearly rate over the expected life of the option.
31.12.04
CHF awards USD awards
Expected volatility (%) 33.66 33.45
Risk-free interest rate (%) 2.03 3.70
Expected dividend rate (%) 3.86 3.88
Strike price (CHF/USD) 47.80 37.56
Share price (CHF/USD) 47.09 37.03
Expected life (years) 5.6 5.6
Generally, under IFRS, for all employee share and option awards for which the underlying is UBS shares, UBS recog-nizes compensation expense over the requisite service period which is generally equal to the vesting period. Share and op-tion awards typically have a three-year tiered vesting struc-ture which means awards vest in one-third increments over that period. The total share-based compensation expense recognized for the years ended 31 December 2006, 31 De-cember 2005 and 31 December 2004 was CHF 2,188 mil-lion, CHF 1,662 million and CHF 1,406 million, respectively. The total income taxes recognized in the income statement in relation to these expenses were a benefit of CHF 491 mil-
lion, CHF 431 million and CHF 64 million for the years ended 31 December 2006, 31 December 2005 and 31 December 2004, respectively. For the years ended 31 December 2006, 31 December 2005 and 31 December 2004, the compensa-tion expense recognized for share-based payments was pri-marily related to equity settled plans.
At 31 December 2006, total compensation expense re-lated to nonvested awards not yet recognized in the income statement is CHF 1,679 million, which is expected to be rec-ognized in Personnel expenses over a weighted average pe-riod of 1.7 years.
e) Compensation expense

169
The Group defines related parties as associated companies, post-employment benefit plans for the benefit of UBS em-ployees, key management personnel, close family members of key management personnel and enterprises which are, directly or indirectly, controlled by, jointly controlled by or significantly influenced by or in which significant voting power resides with key management personnel or their close
family members. Key management personnel is defined as members of the Board of Directors (BoD) and Group Execu-tive Board (GEB). This definition is based on the requirements of IAS 24 Related Party Disclosures and the “Directive on Information Relating to Corporate Governance” issued by the SWX Swiss Exchange.
Note 33 Related Parties
a) Remuneration of key management personnel
The executive members of the BoD have top management employment contracts and receive pension benefits upon retire-ment. Total remuneration of the executive members of the BoD and GEB is as follows:
For the year ended
CHF million 31.12.06 31.12.05 31.12.04
Base salaries and other cash payments 16 15 15
Incentive awards – cash 107 90 70
Employer’s contributions to retirement benefit plans 1 1 1
Benefits in kind, fringe benefits (at market value) 2 3 2
The non-executive members of the BoD do not have employment or service contracts with UBS, and thus are not entitled to benefits upon termination of their service on the BoD. Payments to these individuals for their services as external board members amounted to CHF 5.9 million in 2006, CHF 6.1 million in 2005 and CHF 5.7 million in 2004.
b) Equity holdings
31.12.06 31.12.05 31.12.04
Number of stock options from equity participation plans held by executive members of the BoD and the GEB 10,886,798 10,862,250 12,009,994
Number of shares held by members of the BoD, GEB and parties closely linked to them 7,974,724 8,713,984 7,013,220
Of the share totals above, at 31 December 2006 and 31 De-cember 2005, respectively, 7,146 shares and 6,538 shares were held by close family members of key management per-sonnel and 2,200,000 shares and 2,486,060 shares were held by enterprises which are directly or indirectly controlled by, jointly controlled by or significantly influenced by or in
which significant voting power resides with key manage-ment personnel or their close family members. Further infor-mation about UBS’s equity participation plans can be found in Note 32. No member of the BoD or GEB is the beneficial owner of more than 1% of the Group’s shares at 31 Decem-ber 2006.

170
Financial StatementsNotes to the Financial Statements
c) Loans, advances and mortgages to key management personnel Executive members of the BoD and GEB members have been granted loans, fixed advances and mortgages on the same terms and conditions that are available to other employees, based on terms and conditions granted to third parties adjusted for reduced credit risk. Non-executive BoD members are granted loans and mortgages at general market conditions.
Movements in the loan, advances and mortgage balances are as follows:
CHF million 31.12.06 31.12.06
Balance at the beginning of the year 21 16
Additions 1 7
Reductions (3) (2)
Balance at the end of the year 19 21
Note 33 Related Parties (continued)
No unsecured loans were granted to key management personnel as of 31 December 2006 and 31 December 2005.
d) Associated companies Movements in loans to associated companies are as follows:
CHF million 31.12.06 31.12.05
Balance at the beginning of the year 321 83
Additions 116 267
Reductions (48) (26)
Credit loss (expense) / recovery 1 (3)
Foreign currency translation (15) 0
Balance at the end of the year 375 321
All loans to associated companies are transacted at arm’s length. Of the balances above, the amount of unsecured loans amounted to CHF 177 million and CHF 82 million at 31 December 2006 and 31 December 2005, respectively.
Other transactions with associated companies transacted at arm’s length are as follows:
For the year ended or as of
CHF million 31.12.06 31.12.05 31.12.04
Payments to associates for goods and services received 58 397 248
Fees received for services provided to associates 79 258 180
Commitments and contingent liabilities to associates 32 39
Note 35 provides a list of significant associates.

171
Note 33 Related Parties (continued)
e) Other related party transactions During 2006 and 2005, UBS entered into transactions at arm’s length with enterprises which are directly or indirectly con-trolled by, jointly controlled by or significantly influenced by or in which significant voting power resides with key management personnel or their close family members. In 2006 and 2005 these companies included BMW Group (Germany), Kedge Capital Funds Ltd. (Jersey), Löwenfeld AG (Switzerland), Royal Dutch Shell plc (UK), Seromer Biotech SA (Switzerland, previously Ber-tarelli Biotech SA), Serono Group (Switzerland), Stadler Rail Group (Switzerland), Team Alinghi (Switzerland), and Unisys Cor-poration (USA). Related parties in 2006 also included Aebi + Co. AG (Switzerland), Bertarelli Family (Switzerland), DKSH Hold-ing AG (Switzerland), Kedge Capital Selected Funds Ltd. (Jersey), Lista AG (Switzerland), Martown Trading Ltd. (Isle of Man) and Team Alinghi (Spain).
Movements in loans to other related parties are as follows:
CHF million 31.12.06 31.12.05
Balance at the beginning of the year 919 294
Additions 34 628
Reductions 81 3
Loan at the end of the year 1 872 919
1 In 2006 includes loans, guarantees and contingent liabilities of CHF 128 million and unused committed facilities of CHF 744 million but excludes unused uncommitted working capital facilities and unused guarantees of CHF 173 million. In 2005 includes loans, guarantees and contingent liabilities of CHF 116 million and unused committed facilities of CHF 804 million but excludes unused uncom-mitted working capital facilities and unused guarantees of CHF 52 million.
Other transactions with these related parties include:
For the year ended
CHF million 31.12.06 31.12.05 31.12.04
Goods sold and services provided to UBS 8 15 34
Fees received for services provided by UBS 8 1 10
As part of its sponsorship of Team Alinghi, defender for the “America’s Cup 2007”, UBS paid CHF 8.7 million (EUR 5.4 mil-lion) in sponsoring fees for 2006. Team Alinghi’s controlling shareholder is UBS board member Ernesto Bertarelli.
f) Additional information UBS also engages in trading and risk management activities (e.g. swaps, options, forwards) with various related parties men-tioned in previous sections. These transactions may give rise to credit risk either for UBS or for a related party towards UBS. As part of its normal course of business, UBS is also a market maker in equity and debt instruments and at times may hold positions in instruments of related parties.
Note 34 Post-Balance Sheet Events
There have been no material post-balance sheet events which would require disclosure or adjustment to the 31 Decem- ber 2006 Financial Statements.
The closing of the acquisition of McDonald Investments’ Branch Network and the announcement of the acquisition of Standard Chartered’s mutual funds management business in 2007 are discussed in Note 37.
On 8 March 2007, the Board of Directors reviewed the Financial Statements and authorized them for issue. These Financial Statements will be submitted to the Annual General Meeting of Shareholders to be held on 18 April 2007 for approval.

172
Financial StatementsNotes to the Financial Statements
Significant subsidiaries
CompanyJurisdiction of incorporation Business Group 1
Share capital
in millions
Equity interest
accumulated in %
Banco UBS Pactual S.A. Rio de Janeiro, Brazil IB BRL 296.7 100.0
Banco UBS S.A. Rio de Janeiro, Brazil IB BRL 52.9 100.0
Crédit Industriel Société Anonyme in Liquidation Zurich, Switzerland Global WM&BB CHF 0.1 100.0
Dillon Read Capital Management (Singapore) Pte. Ltd. Singapore, Singapore Global AM USD 8.6 100.0
Dillon Read Capital Management (UK) Ltd London, Great Britain Global AM GBP 18.0 100.0
Dillon Read Capital Management LLC Delaware, USA Global AM USD 12.5 100.0
Dillon Read Solutions Pte. Ltd. Singapore, Singapore Global AM USD 1.1 100.0
Noriba Bank BSC Manama, Bahrain Global WM&BB USD 10.0 100.0
OOO UBS Bank Moscow, Russia IB RUB 1,250.0 100.0
PT UBS Securities Indonesia Jakarta, Indonesia IB IDR 100,000.0 98.4
Thesaurus Continentale Effekten Zurich, Switzerland Global WM&BB CHF 0.1 100.0
UBS (Bahamas) Ltd. Nassau, Bahamas Global WM&BB USD 4.0 100.0
UBS (France) S.A. Paris, France Global WM&BB EUR 25.7 100.0
UBS (Grand Cayman) Limited George Town, Cayman Islands IB USD 25.0 100.0
UBS (Italia) S.p.A. Milan, Italy Global WM&BB EUR 60.0 100.0
UBS (Luxembourg) S.A. Luxembourg, Luxembourg Global WM&BB CHF 150.0 100.0
UBS (Monaco) S.A. Monte Carlo, Monaco Global WM&BB EUR 9.2 100.0
UBS Advisory and Capital Markets Australia Ltd Sydney, Australia IB AUD 580.8 2 100.0
UBS Alternative and Quantitative Investments LLC Delaware, USA Global AM USD 0.1 100.0
UBS Americas Inc Delaware, USA IB USD 0.0 100.0
UBS Asesores SA Panama, Panama Global WM&BB USD 0.0 100.0
UBS Bank (Canada) Toronto, Canada Global WM&BB CAD 8.5 100.0
UBS Bank USA Utah, USA Global WM&BB USD 1,700.0 100.0
UBS Belgium SA/NV Brussels, Belgium Global WM&BB EUR 23.0 100.0
UBS Capital (Jersey) Ltd St. Helier, Jersey IB GBP 181.0 100.0
UBS Capital AG Zurich, Switzerland IB CHF 5.0 100.0
UBS Capital B.V. Amsterdam, the Netherlands IB EUR 78.8 2 100.0
UBS Card Center AG Glattbrugg, Switzerland Global WM&BB CHF 0.1 100.0
UBS Clearing and Execution Services Limited London, Great Britain IB USD 50.0 100.0
UBS Commodities Canada Ltd. Toronto, Canada IB USD 11.3 100.0
UBS Corporate Finance Italia SpA Milan, Italy IB EUR 1.9 100.0
UBS Derivatives Hong Kong Limited Hong Kong, China IB HKD 60.0 100.0
UBS Deutschland AG Frankfurt am Main, Germany Global WM&BB EUR 176.0 100.0
UBS Employee Benefits Trust Limited St. Helier, Jersey CC GBP 0.0 100.0
UBS Energy LLC Delaware, USA IB USD 0.0 100.0
UBS España, S.A. Madrid, Spain Global WM&BB EUR 72.2 100.0
UBS Factoring AG Zurich, Switzerland Global WM&BB CHF 5.0 100.0
1 Global WM&BB: Global Wealth Management & Business Banking, Global AM: Global Asset Management, IB: Investment Bank, CC: Corporate Center. 2 Share capital and share premium.
The legal entity group structure of UBS is designed to support the Group’s businesses within an efficient legal, tax, regula-tory and funding framework. Neither the Business Groups of UBS (namely Investment Bank, Global Wealth Manage-ment & Business Banking and Global Asset Management) nor Corporate Center are replicated in their own individual legal entities, but rather they generally operate out of UBS AG (Parent Bank) through its Swiss and foreign branches.
The parent bank structure allows UBS to capitalize on the advantages offered by the use of one legal platform by all
Note 35 Significant Subsidiaries and Associates
the Business Groups. It provides for the most cost-efficient and flexible structure and facilitates efficient allocation and use of capital, comprehensive risk management and control and straightforward funding processes.
Where, usually due to local legal, tax or regulatory rules or due to additional legal entities joining the UBS Group via acquisition, it is either not possible or not efficient to operate out of the Parent Bank, then local subsidiary companies host the businesses. The significant operating subsidiary compa-nies in the Group are listed below:

173
Note 35 Significant Subsidiaries and Associates (continued)
Significant subsidiaries (continued)
CompanyJurisdiction of incorporation Business Group 1
Share capital
in millions
Equity interest
accumulated in %
UBS Fiduciaria S.p.A. Milan, Italy Global WM&BB EUR 0.2 100.0
UBS Fiduciary Trust Company New Jersey, USA Global WM&BB USD 4.4 2 100.0
UBS Finance (Cayman Islands) Ltd. George Town, Cayman Islands CC USD 0.5 100.0
UBS Finance (Curação) N.V. Willemstad, Netherlands Antilles CC USD 0.1 100.0
UBS Finance (Delaware) LLC Delaware, USA IB USD 37.3 2 100.0
UBS Financial Services Inc. Delaware, USA Global WM&BB USD 2,005.8 2 100.0
UBS Financial Services Incorporated of Puerto Rico Hato Rey, Puerto Rico Global WM&BB USD 31.0 2 100.0
UBS Fund Advisor, L.L.C. Delaware, USA Global WM&BB USD 0.0 100.0
UBS Fund Holding (Luxembourg) S.A. Luxembourg, Luxembourg Global AM CHF 42.0 100.0
UBS Fund Holding (Switzerland) AG Basel, Switzerland Global AM CHF 18.0 100.0
UBS Fund Management (Switzerland) AG Basel, Switzerland Global AM CHF 1.0 100.0
UBS Fund Services (Cayman) Ltd George Town, Cayman Islands Global AM USD 5.6 100.0
UBS Fund Services (Ireland) Limited Dublin, Ireland Global AM EUR 1.3 100.0
UBS Fund Services (Luxembourg) SA Luxembourg, Luxembourg Global AM CHF 2.5 100.0
UBS Futures Singapore Ltd. Singapore, Singapore IB USD 39.8 2 100.0
UBS Global Asset Management (Americas) Inc Delaware, USA Global AM USD 0.0 100.0
UBS Global Asset Management (Australia) Ltd Sydney, Australia Global AM AUD 8.0 100.0
UBS Global Asset Management (Canada) Co Toronto, Canada Global AM CAD 117.0 100.0
UBS Global Asset Management (Deutschland) GmbH Frankfurt am Main, Germany Global AM EUR 7.7 100.0
UBS Global Asset Management (France) S.A. Paris, France Global WM&BB EUR 2.1 100.0
UBS Global Asset Management (Hong Kong) Limited Hong Kong, China Global AM HKD 25.0 100.0
UBS Global Asset Management (Italia) SIM SpA Milan, Italy Global AM EUR 2.0 100.0
UBS Global Asset Management (Japan) Ltd Tokyo, Japan Global AM JPY 2,200.0 100.0
UBS Global Asset Management (Singapore) Ltd Singapore, Singapore Global AM SGD 4.0 100.0
UBS Global Asset Management (Taiwan) Ltd Taipei, Taiwan Global AM TWD 340.0 100.0
UBS Global Asset Management (US) Inc Delaware, USA Global AM USD 35.2 2 100.0
UBS Global Asset Management Holding Ltd London, Great Britain Global AM GBP 48.0 100.0
UBS Global Life AG Vaduz, Liechtenstein Global WM&BB CHF 5.0 100.0
UBS Global Trust Corporation St. John, Canada Global WM&BB CAD 0.1 100.0
UBS International Holdings B.V. Amsterdam, the Netherlands CC EUR 6.8 100.0
UBS International Inc. New York, USA Global WM&BB USD 44.3 2 100.0
UBS International Life Limited Dublin, Ireland Global WM&BB EUR 1.0 100.0
UBS Investment Management Canada Inc. Toronto, Canada Global WM&BB CAD 0.0 100.0
UBS Italia SIM SpA Milan, Italy IB EUR 15.1 100.0
UBS Leasing AG Zurich, Switzerland Global WM&BB CHF 10.0 100.0
UBS Life AG Zurich, Switzerland Global WM&BB CHF 25.0 100.0
UBS Life Insurance Company USA California, USA Global WM&BB USD 39.3 2 100.0
UBS Limited London, Great Britain IB GBP 29.4 100.0
UBS Loan Finance LLC Delaware, USA IB USD 16.7 100.0
UBS Menkul Degerler AS Istanbul, Turkey IB TRY 0.4 100.0
UBS Mortgage Holdings LLC Delaware, USA Global WM&BB USD 0.0 100.0
UBS New Zealand Limited Auckland, New Zealand IB NZD 7.5 100.0
UBS O’Connor LLC Delaware, USA Global AM USD 1.0 100.0
UBS Pactual Asset Management S.A. DTVM Rio de Janeiro, Brazil Global AM BRL 53.9 100.0
UBS Portfolio LLC Delaware, USA IB USD 0.1 100.0
UBS Preferred Funding Company LLC I Delaware, USA CC USD 0.0 100.0
UBS Preferred Funding Company LLC II Delaware, USA CC USD 0.0 100.0
UBS Preferred Funding Company LLC IV Delaware, USA CC USD 0.0 100.0
1 Global WM&BB: Global Wealth Management & Business Banking, Global AM: Global Asset Management, IB: Investment Bank, CC: Corporate Center. 2 Share capital and share premium.

174
Financial StatementsNotes to the Financial Statements
Note 35 Significant Subsidiaries and Associates (continued)
Significant subsidiaries (continued)
CompanyJurisdiction of incorporation Business Group 1
Share capital
in millions
Equity interest
accumulated in %
UBS Principal Finance LLC Delaware, USA IB USD 0.1 100.0
UBS Real Estate Investments Inc Delaware, USA Global AM USD 0.0 100.0
UBS Real Estate Kapitalanlagegesellschaft mbH Munich, Germany Global AM EUR 7.5 51.0
UBS Real Estate Securities Inc Delaware, USA IB USD 0.4 2 100.0
UBS Realty Investors LLC Massachusetts, USA Global AM USD 9.3 100.0
UBS Sauerborn Private Equity Komplementär GmbH Bad Homburg, Germany Global WM&BB EUR 0.0 100.0
UBS Securities (Thailand) Ltd Bangkok, Thailand IB THB 400.0 100.0
UBS Securities Asia Limited Hong Kong, China IB HKD 20.0 100.0
UBS Securities Australia Ltd Sydney, Australia IB AUD 209.8 2 100.0
UBS Securities Canada Inc Toronto, Canada IB CAD 10.0 100.0
UBS Securities España Sociedad de Valores SA Madrid, Spain IB EUR 15.0 100.0
UBS Securities France S.A. Paris, France IB EUR 22.9 100.0
UBS Securities Hong Kong Limited Hong Kong, China IB HKD 230.0 100.0
UBS Securities India Private Limited Mumbai, India IB INR 237.8 75.0
UBS Securities International Limited London, Great Britain IB GBP 18.0 100.0
UBS Securities Japan Ltd George Town, Cayman Islands IB JPY 60,000.0 100.0
UBS Securities Limited London, Great Britain IB GBP 140.0 100.0
UBS Securities LLC Delaware, USA IB USD 2,455.6 2 100.0
UBS Securities Malaysia Sdn. Bhd. Kuala Lumpur, Malaysia IB MYR 75.0 100.0
UBS Securities Philippines Inc Makati City, Philippines IB PHP 190.0 100.0
UBS Securities Pte. Ltd. Singapore, Singapore IB SGD 311.5 100.0
UBS Securities Pte. Ltd. Seoul Branch Seoul, South Korea IB KRW 150,000.0 100.0
UBS Services USA LLC Delaware, USA Global WM&BB USD 0.0 100.0
UBS South Africa (Proprietary) Limited Sandton, South Africa IB ZAR 87.1 2 100.0
UBS Swiss Financial Advisers AG Zurich, Switzerland Global WM&BB CHF 1.5 100.0
UBS Trust Company National Association New York, USA Global WM&BB USD 5.0 2 100.0
UBS Trustees (Bahamas) Ltd Nassau, Bahamas Global WM&BB USD 2.0 100.0
UBS Trustees (Cayman) Ltd George Town, Cayman Islands Global WM&BB USD 2.0 100.0
UBS Trustees (Jersey) Ltd. St. Helier, Jersey Global WM&BB GBP 0.0 100.0
UBS Trustees (Singapore) Ltd Singapore, Singapore Global WM&BB SGD 3.3 100.0
UBS UK Holding Limited London, Great Britain IB GBP 5.0 100.0
UBS UK Properties Limited London, Great Britain IB GBP 100.0 100.0
UBS Wealth Management (UK) Ltd London, Great Britain Global WM&BB GBP 2.5 100.0
UBS Wealth Management Australia Ltd Melbourne, Australia Global WM&BB AUD 53.9 100.0
1 Global WM&BB: Global Wealth Management & Business Banking, Global AM: Global Asset Management, IB: Investment Bank, CC: Corporate Center. 2 Share capital and share premium.

175
Consolidated companies: changes in 2006
Significant new companies
Banco UBS Pactual S.A. – Rio de Janeiro, Brazil
Dillon Read Capital Management (Singapore) Pte. Ltd. – Singapore, Singapore
Dillon Read Capital Management (UK) Ltd – London, Great Britain
Dillon Read Capital Management LLC – Delaware, USA
Dillon Read Solutions Pte. Ltd. – Singapore, Singapore
OOO UBS Bank – Moscow, Russia
UBS Clearing and Execution Services Limited – London Great Britain
UBS Futures Singapore Ltd. – Singapore, Singapore
UBS Menkul Degerler AS – Instanbul, Turkey
UBS Pactual Asset Management S.A. DTVM – Rio de Janeiro, Brazil
UBS Sauerborn Private Equity Komplementär GmbH – Bad Homburg, Germany
Note 35 Significant Subsidiaries and Associates (continued)
Deconsolidated companies
Significant deconsolidated companies Reason for deconsolidation
Aare-Tessin AG für Elektrizität – Olten, Switzerland Sold
Atel Energia S.r.l. – Milan, Italy Sold
Atel Installationstechnik AG – Olten, Switzerland Sold
Entrade GmbH – Schaffhausen, Switzerland Sold
Etra SIM SpA – Milan, Italy Merged
GAH Beteiligungs AG – Heidelberg, Germany Sold
Motor-Columbus AG – Baden, Switzerland Sold
Società Elettrica Sopracenerina SA – Locarno, Switzerland Sold
UBS (Trust and Banking) Limited – Tokyo, Japan Liquidated
UBS Capital II LLC – Delaware, USA Liquidated
UBS Preferred Funding Company LLC III – Delaware, USA Liquidated
Significant associates
Company IndustryEquity interest
in %Share capital
in millions
SIS Swiss Financial Services Group AG – Zurich, Switzerland Financial 32.9 CHF 26
Telekurs Holding AG – Zurich, Switzerland Financial 33.3 CHF 45
UBS Alpha Select – George Town, Cayman Islands Private Investment Company 37.4 USD 896 1
UBS Alpha Hedge Fund – George Town, Cayman Islands Private Investment Company 21.8 USD 427 1
UBS Currency Portfolio Ltd – George Town, Cayman Islands Private Investment Company 29.9 USD 517 1
ATR Acquisition LLC – Texas, USA Manufacturing 24.2 USD 314
Waterside Plaza Holdings LLC – Delaware, USA Real Estate 50.0 USD 119
A&Q Select Funds – Euro Limited – George Town, Cayman Islands Private Investment Company 22.0 USD 3161
Williamsburg Edge LLC – Delaware, USA Real Estate 50.0 USD 78
Dillon Read Financial Products Trading Ltd – George Town, Cayman Islands Private Investment Company 7.1 2 USD 542
1 For hedge funds net asset value instead of share capital. 2 UBS has significant influence even though it holds less than 20% of the voting power of the entity.

176
Financial StatementsNotes to the Financial Statements
Invested assets include all client assets managed by or de-posited with UBS for investment purposes. Invested assets include, for example, managed fund assets, managed insti-tutional assets, discretionary and advisory wealth manage-ment portfolios, fiduciary deposits, time deposits, savings accounts and wealth management securities or brokerage accounts. All assets held for purely transactional purposes and custody-only assets, including corporate client assets held for cash management and transactional purposes, are excluded from invested assets as the Group only administers the assets and does not offer advice on how the assets should be invested. Also excluded are non-bankable assets (e.g. art collections) and deposits from third-party banks for funding or trading purposes.
Discretionary assets are defined as those where UBS de-cides how a client’s assets are invested. Other invested assets are those where the client ultimately decides how the assets are invested. When a single product is created in one Busi-ness Group and sold in another, it is counted in both the Business Group that manages the investment and the one
that distributes it. This results in double counting within UBS total invested assets, as both Business Groups are providing a service independently to their respective clients, and both add value and generate revenue.
Net new money in a period is the net amount of invested assets that are entrusted to UBS by new and existing clients less those withdrawn by existing clients and clients who ter-minate their relationship with UBS. Net new money is calcu-lated using the direct method, by which in and outflows to/from invested assets are determined at the client level based on transactions. Interest expenses paid by clients on their loans are treated as net new money outflows. Interest and dividend income from invested assets is not counted as net new money inflow. Market and currency movements as well as fees and commissions are excluded from net new money, as are the effects resulting from any acquisition or divestment of a UBS subsidiary or business. Reclassifications between invested assets and client assets as a result of a change in the service level delivered are treated as net new money flows.
Note 36 Invested Assets and Net New Money
As of or for the year ended
CHF billion 31.12.06 31.12.05
Fund assets managed by UBS 439 390
Discretionary assets 849 716
Other invested assets 1,701 1,546
Total invested assets (double counts included) 2,989 2,652
thereof double count 371 332
thereof acquisitions (divestments) 81.1 (93.9)
Net new money (double counts included) 151.7 148.5

177
Note 37 Business Combinations
Business combinations completed in 2006During 2006, UBS completed several acquisitions that were accounted for as business combinations. The acquisition of Banco Pactual S.A. was individually significant to the Finan-cial Statements and is therefore presented separately in this note. The other acquisitions are presented in aggregate per business group.
Banco Pactual S.A.On 1 December 2006, UBS completed the acquisition of Bra-zilian bank Banco Pactual S.A. The bank was merged with UBS's Brazilian business, and both are now operating under the name UBS Pactual. The cost of the business combination is estimated at USD 2,194 million (CHF 2,677 million) but is still subject to final determination. Of the total consideration, USD 971 million (CHF 1,164 million) was paid on 1 Decem-ber 2006 in cash. The residual payment of up to USD 1.6 billion (CHF 1.9 billion) is subject to certain performance
conditions and is due on 30 June 2011. The purchase price allocation is preliminary and will be finalized in 2007. The preliminary allocation shows the booking of net assets of USD 376 million (CHF 459 million), intangible assets of USD 830 million (CHF 1,013 million) and goodwill of USD 988 million (CHF 1,205 million). Identified intangible assets in-clude client relationships, non-compete agreements, favor-able contracts, investment banking pipeline, proprietary software, trademarks and trade names, with an economic useful life from 1 to 20 years. UBS Pactual offers a broad range of services in investment banking, asset management and wealth management. It has offices in São Paolo, Rio de Janeiro, Belo Horizonte and Recife.
The residual payment obligation is reflected on UBS’s bal-ance sheet in Other liabilities and is measured at its present value (USD 1,223 million on acquisition date). It had no ef-fect on the Statement of Cash Flows for the year ended 31 December 2006.
CHF million Book valueStep-up to fair value Fair value
Assets
Intangible assets 0 1,013 1,013
Property and equipment 9 0 9
Deferred tax assets 16 0 16
Goodwill 0 1,205 1,205
All other assets 11,877 0 11,877
Total assets 11,902 2,218 14,120
Liabilities
Provisions 52 0 52
Deferred tax liabilities 28 0 28
All other liabilities 11,363 0 11,363
Total liabilities 11,443 0 11,443
Net assets 459 2,218 2,677
Total liabilities and equity 11,902 2,218 14,120
CHF million
Global Wealth Management &
Business BankingInvestment
BankGlobal Asset
Management Total
Assets
Intangible assets 176 349 488 1,013
Goodwill 50 962 193 1,205
On the acquisition date, intangible assets and goodwill were allocated to the Business Groups as follows:
Since the acquisition date, UBS Pactual contributed revenues of CHF 102 million to UBS’s results, and an after-tax profit of CHF 28 million after acquisition costs (retention payments and amortization of intangible assets) but excluding finance costs.

178
Financial StatementsNotes to the Financial Statements
Investment BankABN AMRO’s Global Futures and Options BusinessOn 30 September 2006, UBS acquired the global futures and options business of ABN AMRO for USD 704 million (CHF 880 million) in cash. The ABN AMRO futures and options business provides clearing and execution services on a global basis. The acquired business has been integrated into the Prime Services business within the Equities business of the
Investment Bank. The purchase price was allocated to net assets of USD 362 million (CHF 452 million) and intangible assets of USD 108 million (CHF 134 million). The difference of USD 234 million (CHF 294 million) from the purchase price was recognized as goodwill. The acquired business contributed CHF 7 million to UBS’s net profit since the date of acquisition.
Note 37 Business Combinations (continued)
CHF million Book valueStep-up to fair value Fair value
Assets
Intangible assets 0 134 134
Property and equipment 13 0 13
Financial investments available-for-sale 26 54 80
Goodwill 0 294 294
All other assets 11,942 0 11,942
Total assets 11,981 482 12,463
Liabilities
Provisions 0 9 9
All other liabilities 11,574 0 11,574
Total liabilities 11,574 9 11,583
Net assets 407 473 880
Total liabilities and equity 11,981 482 12,463

179
Global Wealth Management & Business Banking
Piper Jaffray Companies’ Private Client Services Branch NetworkOn 11 August 2006, UBS completed the acquisition of Pip-er Jaffray Companies’ Private Client Services branch net-work. The cost of the business combination consisted of USD 500 million (CHF 616 million) for the business opera-tions and of USD 227 million (CHF 280 million) for the loans to customers portfolio, resulting in a total cash con-sideration paid of USD 727 million (CHF 896 million). The purchase price was allocated to net assets of USD 236 mil-lion (CHF 291 million) and intangible assets of USD 120 million (CHF 148 million) representing client relationships. The difference of USD 371 million (CHF 457 million) from the purchase price was recognized as goodwill. The pur-chase price allocation and cost of the business combination is in the process of being finalized. Approximately 90 Piper
Jaffray wealth management offices, mainly located in the Midwest and Western United States, serving 190,000 households, will be renamed and integrated into Wealth Management US. UBS has retained approximately 700 of Piper Jaffray’s financial advisors, which corresponds to ap-proximately 80% of the advisors before the acquisition. The acquisition is expected to benefit Wealth Management US’s existing business by expanding the presence in the re-gions where the acquired branches are located.
DolfiOn 2 March 2006, UBS acquired Dolfi Finance SAS, a small wealth management firm based in Strasbourg, France, as well as certain assets from Mr Dolfi. The company, estab-lished 18 years ago, serves clients in the North Eastern part of France and had more than EUR 600 million of invested assets on the acquisition date. The acquisition complements UBS’s existing wealth management business in France.
Note 37 Business Combinations (continued)
CHF million Book valueStep-up to fair value Fair value
Assets
Intangible assets 0 158 158
Property and equipment 16 (4) 12
Financial investments available-for-sale 1 0 1
Goodwill 0 479 479
All other assets 291 0 291
Total assets 308 633 941
Liabilities
Provisions 0 8 8
Deferred tax liabilities 0 3 3
All other liabilities 2 4 6
Total liabilities 2 15 17
Net assets 306 618 924
Total liabilities and equity 308 633 941

180
Financial StatementsNotes to the Financial Statements
Note 37 Business Combinations (continued)
Acquisitions of minority interests of subsidiaries in 2006
UBS Bunting Limited On 28 March 2006, UBS acquired the 50% minority interest in its Canadian institutional securities subsidiary, UBS Bun-ting Limited. The purchase price consists of a combination of cash and UBS shares and has been estimated at CAD 163 million (approximately CHF 182 million). Approximately CAD 23 million (CHF 26 million) of the consideration is linked to the performance of the acquired business in 2006 and 2007 and may be reduced if agreed revenue targets are not achieved. The difference between the purchase price and the carrying value of the acquired minority interest of CAD 116 million (CHF 129 million) was reflected in Equity. Through this transaction UBS now wholly owns the Investment Bank’s operations in Canada, which continue to operate under the same leadership team as before this transaction.
Business combinations announced but not yet completed
Beijing Securities Ltd.In April 2006 UBS entered into a commitment to acquire the restructured activities of Beijing Securities, a Chinese broker-age and securities firm. Under the terms of the transaction, a new company, UBS Securities Co. Limited emerges, in which UBS is expected to have a 20% capital stake and ob-tain management and operational control. The cost of the business combination including capital contributions and transaction costs is expected to be approximately CHF 278 million (RMB 1.8 billion).
UBS Securities Co. Limited will operate in China on the basis of a comprehensive set of domestic securities licences offering corporate finance, equities, fixed income, wealth management and asset management service.
On 11 December 2006, UBS Securities Co. Limited was of-ficially established following the registration of the business. The closing of the transaction, which is subject to final regula-tory approval, is expected during first half 2007.
Business combinations completed in 2005 During 2005, UBS completed several acquisitions that were accounted for as business combinations. None of the acqui-sitions was individually significant to the Financial State-ments, and therefore they are presented in aggregate by Business Group for Financial Businesses and Industrial Holdings.
Financial Businesses In 2005, Wealth Management completed the acquisitions of Julius Baer North America, Etra SIM S.p.A. (Etra) and Dresd-ner Bank Lateinamerika (DBLA).
Julius Baer North America On 1 April 2005, UBS acquired the assets of Julius Baer’s wealth management operations in North America, which also include certain related assets in Switzerland, for an ag-gregate consideration of approximately CHF 76 million. The business manages over USD 4 billion of client assets, in-cluding custodial assets, and employs approximately 50 staff in four locations. These operations have been inte-grated to further strengthen UBS’s wealth management operations.
Etra Effective 31 May 2005, UBS acquired Etra, an independent Italian financial intermediary firm, for an aggregate consider-ation of approximately CHF 26 million. Etra serves wealthy private and institutional clients in Italy and manages approx-imately EUR 400 million of client assets with 20 staff. The operations were subsequently integrated into UBS’s Italian wealth management unit.
Dresdner Bank Lateinamerika On 29 April 2005, UBS acquired wealth management opera-tions from Dresdner Bank Lateinamerika (DBLA) located in Hamburg, New York, Miami, Zurich and the Bahamas. The Hamburg activities represent approximately two thirds of DBLA’s acquired business, while the remainder is spread over the other four locations. On 31 December 2005, the cost of the acquisition was approximately CHF 136 million, and re-sulted in the recognition of goodwill of approximately CHF 133 million. In 2006, additional goodwill of CHF 39 mil-lion resulted from an adjustment to the purchase price. The acquired business covers all important Latin American mar-kets and strengthens UBS’s position as a provider of wealth management services for clients in that region.
Global Asset Management – Siemens Real Estate Funds Effective 1 April 2005, UBS expanded its asset manage-ment activities in Germany by acquiring a 51% stake in the real estate investment management business of Siemens Kapitalanlagegesellschaft mbH (SKAG), a subsidiary of Sie-mens AG, the German engineering conglomerate. The purchase price was CHF 67 million, allocated to identified net assets at fair value of approximately CHF 10 million and goodwill of approximately CHF 57 million. The busi-ness comprises three open-end real estate funds with a total fund volume of approximately EUR 2 billion (as of 31 December 2004) and has been integrated into the global real estate business, giving it access to Global Asset Management’s established distribution network. The business was renamed UBS Real Estate Kapitalanlagege-sellschaft mbH.

181
Note 37 Business Combinations (continued)
Investment Bank – Prediction On 11 November 2005, UBS acquired the remaining 68.3% of Prediction LLC (Prediction), a financial engineering and trading software company located in Santa Fe, New Mexico, USA. UBS has owned a 31.7% minority stake in the company since 2000. The purchase is in line with UBS’s focus on tech-nology and allows continuous operation and development of Prediction’s automated trading systems. Furthermore, UBS
secures the know-how available at Prediction and the oppor-tunity to leverage it across UBS. The purchase price of ap-proximately CHF 84 million was primarily allocated to intan-gible assets valued at approximately CHF 26 million and goodwill of approximately CHF 51 million. Details of assets and liabilities recognized from the acquisitions made by the Financial Businesses in 2005 are as follows:
CHF million Book valueStep-up to fair value Fair value
Assets
Intangible assets 2 43 45
Property and equipment 2 0 2
Financial investments 35 0 35
Goodwill 0 327 327
All other assets 1,092 0 1,092
Total assets 1,131 370 1,501
Liabilities
Provisions 18 0 18
Deferred tax liabilities 0 6 6
All other liabilities 1,022 2 1,024
Total liabilities 1,040 8 1,048
Net assets 91 362 453
Total liabilities and equity 1,131 370 1,501
Industrial Holdings On 1 July 2005, Motor-Columbus acquired Elektroline a.s., a service company active in the electricity business in the Czech Republic.
On 20 December 2005, Motor-Columbus also acquired Moravske Teplarny a.s., a power generator in the Czech Re-public, for approximately CHF 108 million. The purchase
price was predominantly allocated to the power station and fair value of net assets acquired was equal to the purchase price. No goodwill was recognized in this acquisition. Motor-Columbus was sold on 23 March 2006. See Note 38 Discon-tinued Operations for details.
Details of assets and liabilities recognized from these two acquisitions in 2005 are as follows (on the next page):

182
Financial StatementsNotes to the Financial Statements
Note 37 Business Combinations (continued)
CHF million Book valueStep-up to fair
value Fair value
Assets
Property and equipment 97 14 111
Deferred tax assets 0 2 2
Goodwill 0 4 4
All other assets 15 0 15
Total assets 112 20 132
Liabilities
Provisions 1 0 1
Deferred tax liabilities 6 5 11
All other liabilities 6 (4) 2
Total liabilities 13 1 14
Net assets 99 19 118
Total liabilities and equity 112 20 132
Business combinations completed in 2007
McDonald Investments’ Branch NetworkOn 9 February 2007, UBS announced the completion of the acquisition of the branch network of McDonald Investments, a unit of KeyCorp. The cost of the business combination consisted of USD 219 million (CHF 267 million) for the busi-ness operations and of USD 57 million (CHF 70 million) for certain assets of McDonald investments, resulting in a total cash consideration paid of USD 276 million (CHF 337 mil-lion). The total consideration paid remains subject to adjust-ment. Based in Cleveland, Ohio, US, McDonald Investments comprised 51 branch offices throughout the Northeast, Mid-west, Rocky Mountain and Northwest states, including the offices of Gradison and Gradison Asset Management, which
will be integrated into Wealth Management US. The unit provides comprehensive wealth management services to af-fluent and high net worth individuals, including estate plan-ning, retirement planning and asset management.
Business combinations announced in 2007
Standard Chartered’s mutual funds management business in IndiaOn 26 January 2007, UBS announced the acquisition of Standard Chartered’s mutual funds management business in India. The cost of the business combination is estimated to be USD 126 million, and the business will be integrated into Global Asset Management. The transaction is expected to close in third quarter 2007.
Pro-forma information (unaudited) The following pro-forma information shows UBS’s total op-erating income, net profit and basic earnings per share as if all of the acquisitions completed in 2006 had been made as of 1 January 2005 and all acquisitions completed in 2005,
had been made as of 1 January 2004. Adjustments have been made to reflect additional amortization and deprecia-tion of assets and liabilities, which have been assigned fair values different from their carryover basis in purchase accounting.
For the year ended
CHF million, except where indicated 31.12.06 31.12.05 31.12.04
Total operating income 49,408 42,021 37,341
Net profit 12,556 14,070 8,006
Basic earnings per share (CHF) 6.35 6.99 7.77

183
Note 38 Discontinued Operations
2006Motor-ColumbusOn 23 March 2006, UBS sold its 55.6% stake in Motor-Co-lumbus to a consortium representing Atel’s Swiss minority shareholders (EBM, EBL, the Canton of Solothurn, IB Aarau, AIL Lugano and WWZ Zug), EOS Holding and Atel, as well as to the French utility Electricité de France (EDF) following the receipt of relevant regulatory approvals by the Swiss and in-ternational authorities. Motor-Columbus is presented as a discontinued operation in these Financial Statements. The income statements for the comparative prior periods have been restated to reflect that presentation. In total, UBS sold 281,535 Motor-Columbus shares, at a price of CHF 4,600 per share, resulting in a sale price of approximately CHF 1,295 million, which was fully paid in cash. A pre-tax gain on sale of CHF 364 million is reported in the Industrial Holdings segment. From 1 January to 23 March 2006, Motor-Colum-bus had a Net profit from operations of CHF 71 million. To-gether with the after-tax gain on sale of CHF 387 million, the Net profit from discontinued operations is CHF 458 million in 2006. For the years ended 31 December 2005 and 31 De-cember 2004, Motor-Columbus had a Net profit from opera-tions of CHF 323 million and CHF 159 million, respectively.
Industrial Holdings In 2006, private equity investments contributed CHF 407 mil-lion to UBS´s Net profit from discontinued operations, which includes after-tax gains on sale of CHF 425 million and an after-tax operating loss of CHF 18 million. In 2005, UBS sold four of its consolidated private equity investments for an ag-gregate cash consideration of CHF 179 million, and the sales of these investments had a positive impact on Net profit from discontinued operations of CHF 86 million. In 2004, five con-solidated private equity investments were sold for an aggre-gate cash consideration of CHF 141 million, and the sales of these investments had a positive impact on Net profit from discontinued operations of CHF 125 million. These private equity investments were all held within the Industrial Hold-ings segment and were sold in line with UBS’s strategy to exit the private equity business. These investments are presented as discontinued operations in these Financial Statements.
2005Private Banks & GAM On 2 December 2005, UBS sold its Private Banks & GAM unit to Julius Baer for an aggregate consideration of CHF 5,683 million, of which CHF 3,375 million was received in cash, CHF 225 million in the form of hybrid Tier 1 instruments, and the remaining CHF 2,083 million representing a 21.5% stake in the enlarged Julius Baer. As part of the sales agree-ment, CHF 200 million of cash was retained within UBS. The gain on sale after taxes from this transaction amounts to CHF 3,705 million on 31 December 2005. In 2006, UBS re-ported an additional after-tax gain on sale of CHF 4 million due to an adjustment to the purchase price.
As part of the agreement, UBS agreed to a lock-up period of 18 months for 19.9% of the stake and of three months for the remaining 1.6%. The value of the Julius Baer stake is based on a price of CHF 86.20 per share at the date of clos-ing, which is a discount of 8.4% to the market price to take into account the 18-month lock-up period to which 19.9% of the stake is subject. Shortly after closing, UBS reduced its 21.5% stake to approximately 20.7% by settling call options that were outstanding on the shares of the former holding company of the Private Banks & GAM businesses.
UBS has agreed not to take a seat on Julius Baer’s board of directors or exercise any control or influence on its strat-egy or on its operational business decisions, and has no right to register its shares with voting rights for a period of 3 years, unless specifically defined events occur that could materially dilute or otherwise affect UBS’s position as an in-vestor in Julius Baer. In such an event, UBS has the option to register its shares with voting rights and thus obtain the possibility to vote them at shareholders’ meetings. Given the fact that the shares are not entered into Julius Baer’s share register with voting rights, UBS classified the stake as a financial investment available-for-sale. Private Banks & GAM is presented as a discontinued operation in these financial statements.
Private Banks & GAM comprised the three private banks Banco di Lugano, Ehinger & Armand von Ernst and Ferrier Lullin as well as specialist asset manager GAM and was pre-sented as a separate business segment.

184
Financial StatementsNotes to the Financial Statements
Note 38 Discontinued Operations (continued)
For the year ended 31.12.06
CHF million Motor-ColumbusOther 1
Industrial Holdings 1
Operating income 2,494 312
Operating expenses 2,412 331
Operating profit / (loss) from discontinued operations before tax 82 (19)
Pre-tax gain / (loss) on sale 364 429
Profit from discontinued operations before tax 446 410
Tax expense / (benefit) on operating profit from discontinued operations before tax 11 (1)
Tax expense / (benefit) on gain on sale (23) 0
Tax expense / (benefit) from discontinued operations (12) (1)
Net profit / (loss) from discontinued operations 458 411
Net cash flows from
operating activities 1 (7)
investing activities (52) 76
financing activities (22) (88)
1 Pre-tax gain on sale includes CHF 4 million related to Private Banks & GAM, which is included in Corporate Center in Note 2a.
For the year ended 31.12.05
CHF million Private Banks & GAM Motor-ColumbusOther
Industrial Holdings
Operating income 1,102 8,711 2,111
Operating expenses 633 8,323 2,116
Operating profit / (loss) from discontinued operations before tax 469 388 (5)
Pre-tax gain / (loss) on sale 4,095 0 113
Profit from discontinued operations before tax 4,564 388 108
Tax expense on operating profit from discontinued operations before tax 99 65 22
Tax expense on gain on sale 390 0 0
Tax expense / (benefit) from discontinued operations 489 65 22
Net profit / (loss) from discontinued operations 4,075 323 86
Net cash flows from
operating activities (143) 252 68
investing activities (22) (326) (43)
financing activities 0 163 28
For the year ended 31.12.04
CHF million Private Banks & GAM Motor-ColumbusOther
Industrial Holdings
Operating income 1,086 3,668 3,748
Operating expenses 690 3,460 3,639
Operating profit / (loss) from discontinued operations before tax 396 208 109
Pre-tax gain / (loss) on sale 0 0 68
Profit from discontinued operations before tax 396 208 177
Tax expense on operating profit from discontinued operations before tax 97 49 52
Tax expense on gain on sale 0 0 0
Tax expense / (benefit) from discontinued operations 97 49 52
Net profit / (loss) from discontinued operations 299 159 125
Net cash flows from
operating activities (725) 75 (288)
investing activities 30 (71) 124
financing activities 3 112 34

185
Note 39 Currency Translation Rates
The following table shows the principal rates used to translate the financial statements of foreign entities into Swiss francs:
Spot rateAs of
Average rateYear ended
31.12.06 31.12.05 31.12.06 31.12.05 31.12.04
1 USD 1.22 1.31 1.25 1.25 1.24
1 EUR 1.61 1.56 1.58 1.55 1.54
1 GBP 2.39 2.26 2.31 2.27 2.27
100 JPY 1.02 1.11 1.08 1.13 1.15

186
Financial StatementsNotes to the Financial Statements
Note 40 Swiss Banking Law Requirements
The consolidated Financial Statements of UBS are prepared in accordance with International Financial Reporting Stan-dards. Included in this note are the significant differences in regard to recognition and measurement between IFRS and the provisions of the Banking Ordinance and the Guidelines of the Swiss Banking Commission governing financial state-ment reporting pursuant to Article 23 through Article 27 of the Banking Ordinance.
1. Consolidation Under IFRS, all entities which are controlled by the Group are consolidated.
Under Swiss law, only entities that are active in the field of banking and finance and real estate entities are subject to consolidation. Entities which are held temporarily are gener-ally recorded as Financial investments available-for-sale.
2. Financial investments available-for-saleUnder IFRS, Financial investments available-for-sale are car-ried at fair value. Changes in fair value are recorded directly in Equity until an investment is sold, collected or otherwise disposed of, or until an investment is determined to be im-paired. At the time an available-for-sale investment is deter-mined to be impaired, the cumulative unrealized loss previ-ously recognized in Equity is included in net profit or loss for the period. On disposal of a financial investment available-for-sale, the cumulative gain or loss previously recognized in Equity is recognized in the income statement.
Under Swiss law, financial investments are carried at the lower of cost or market value. Reductions to market value below cost and reversals of such reductions up to original cost as well as gains and losses on disposal are included in Other income.
3. Cash flow hedges The Group uses derivative instruments to hedge the expo-sure from varying cash flows. Under IFRS, when hedge ac-counting is applied the unrealized gain or loss on the effec-tive portion of the derivatives is recorded in Equity until the hedged cash flows occur, at which time the accumulated gain or loss is realized and released to income.
Under Swiss law, the unrealized gains or losses on the ef-fective portion of the derivative instruments used to hedge cash flow exposures are deferred on the balance sheet as as-sets or liabilities. The deferred amounts are released to in-come when the hedged cash flows occur.
4. Investment property Under IFRS, investment properties are carried at fair value, with fair value changes reflected in profit or loss.
Under Swiss law, investment properties are carried at am-ortized cost less impairment unless the investment proper-ties are held for sale. Investment properties held for sale are recorded at the lower of cost or market value.
5. Fair value option Under IFRS, the Group applies the fair value option to cer-tain financial assets and financial liabilities, mainly to hybrid debt instruments. As a result the entire hybrid instrument is accounted for at fair value with changes in fair value re-flected in net trading income. Furthermore, UBS designated certain loans, loan commitments and fund investments as financial investments designated at fair value through profit and loss.
Under Swiss law, the fair value option is not available. Hybrid instruments are bifurcated: while the embedded de-rivative is marked to market through net trading income, the host contract is accounted for on an accrued cost basis. Gen-erally, loans are accounted for at amortized cost less impair-ment, loan commitments stay off-balance sheet and fund investments are accounted for as financial investments.
6. Goodwill and intangible assets Under IFRS, goodwill acquired in business combinations is not amortized, but tested annually for impairment. Intangi-ble assets acquired in business combinations with an indefi-nite useful life are also not amortized but tested annually for impairment.
Under Swiss law, goodwill and intangible assets with in-definite useful lives must be amortized over a period not ex-ceeding five years, unless a longer useful life, which may not exceed twenty years, can be justified.
7. Discontinued operations Under certain conditions, IFRS requires that non-current as-sets or disposal groups are classified as held for sale. Dis-posal groups that meet the criteria of discontinued opera-tions are presented in the income statement in a single line as net income from discontinued operations.
Under Swiss law, no such reclassifications take place.

187
Note 41 Reconciliation of International Financial Reporting Standards (IFRS) to United States Generally Accepted Accounting Principles (US GAAP)
Note 41.1 Valuation and Income Recognition Differences between IFRS and US GAAP
The consolidated financial statements of UBS have been pre-pared in accordance with IFRS. The principles of IFRS differ in certain respects from United States Generally Accepted Accounting Principles (“US GAAP”). The following is a sum-mary of the relevant significant accounting and valuation differences between IFRS and US GAAP.
a. Purchase accounting (merger of Union Bank of Switzerland and Swiss Bank Corporation)
Under IFRS, the 1998 merger of Union Bank of Switzerland and Swiss Bank Corporation was accounted for under the uniting of interests method. The balance sheets and income statements of the banks were combined, and no adjust-ments were made to the carrying values of the assets and liabilities. Under US GAAP, the business combination creat-ing UBS AG is accounted for under the purchase method with Union Bank of Switzerland being considered the ac-quirer. Under the purchase method, the cost of acquisition is measured at fair value and the acquirer’s interests in identifi-able tangible assets and liabilities of the acquiree are restat-ed to fair values at the date of acquisition. Any excess con-sideration paid over the fair value of net tangible assets acquired is allocated, first to identifiable intangible assets based on their fair values, if determinable, with the remain-der allocated to goodwill.
Goodwill and intangible assetsFor US GAAP purposes, the excess of the consideration paid for Swiss Bank Corporation over the fair value of the net tan-gible assets received has been recorded as goodwill and was amortized on a straight-line basis using a weighted average life of 13 years from 29 June 1998 to 31 December 2001.
On 1 January 2002, UBS adopted SFAS 141, Business Combinations and SFAS 142, Goodwill and Other Intangible Assets. SFAS 141 requires reclassification of intangible assets to goodwill which no longer meet the recognition criteria under the new standard. SFAS 142 requires that goodwill and intangible assets with indefinite lives no longer be amor-tized but be tested annually for impairment. Identifiable in-tangible assets with finite lives continue to be amortized. Upon adoption, the amortization charges related to the 1998 business combination of Union Bank of Switzerland and Swiss Bank Corporation ceased to be recorded under US GAAP.
In 2006 and 2005, goodwill recorded under US GAAP was reduced by CHF 18 million and CHF 67 million respec-tively, due to recognition of deferred tax assets of Swiss Bank Corporation which had previously been subject to valuation reserves.
Other purchase accounting adjustmentsThe restatement of Swiss Bank Corporation’s net assets to fair value in 1998 resulted in decreasing net tangible assets by CHF 1,077 million for US GAAP. This amount is being am-ortized over periods ranging from two years to 20 years.
b. Goodwill
With the adoption of IFRS 3 Business Combinations on 31 March 2004, UBS ceased amortizing goodwill on 1 Janu-ary 2005 for all goodwill existing before 31 March 2004. Goodwill is now subject to an annual impairment test as it is under US GAAP and is no longer amortized under both sets of standards. Goodwill from business combinations entered into on or after 31 March 2004 was already accounted for under the provisions of IFRS 3, and no goodwill amortization was recorded for these transactions under IFRS or US GAAP. An IFRS to US GAAP difference remains on the balance sheet due to the fact that US GAAP goodwill amortization ceased on 31 December 2001 and IFRS goodwill amortization ceased on 31 December 2004. This difference was reduced during 2005 due to the sale of GAM on 2 December 2005.
In addition on 31 March 2004, UBS adopted revised IAS 38 Intangible Assets. Under the revised standard, intan-gible assets acquired in a business combination must be recognized separately from goodwill if they meet defined recognition criteria. Existing intangible assets that do not meet the recognition criteria have to be reclassified to good-will. On 1 January 2005, UBS reclassified the trained work-force intangible asset recognized in connection with the acquisition of PaineWebber with a book value of CHF 1.0 billion to Goodwill. Under US GAAP, this asset was re-classified from Intangible assets to Goodwill on 1 January 2002 with the adoption of SFAS 142 Goodwill and Other Intangible Assets.
Under IFRS, the cost of the business combination of Banco Pactual is estimated at USD 2,194 million (CHF 2,677 million) on 31 December 2006 but is still subject to final determi-nation. Of the total consideration, USD 971 million (CHF 1,164 million) was paid on 1 December 2006 in cash. The residual payment of up to USD 1.6 billion (CHF 1.9 billion) is subject to certain performance conditions and is due on 30 June 2011. 50% (USD 800 million) of the deferred re-sidual payment is contingent upon achieving a specified cumulative net income before tax of the acquired business during the period from 1 December 2006 to 30 June 2011. Under US GAAP, contingent consideration which depends on the achievement of a specified earnings level in future periods is not recognized as a cost of the business combina-tion at its present value until the contingency is resolved. For

188
Financial StatementsNotes to the Financial Statements
Note 41 Reconciliation of International Financial Reporting Standards (IFRS) to United States Generally Accepted Accounting Principles (US GAAP) (continued)
Note 41.1 Valuation and Income Recognition Differences between IFRS and US GAAP (continued)
that reason, Goodwill and Other liabilities recognized under US GAAP are reduced by the present value of the contingent consideration of CHF 746 million to CHF 459 million. Ac-cordingly, the addition of accrued interest on the present value of the contingent consideration recognized under IFRS is reversed under US GAAP, which resulted in a decrease of Interest expense and Other liabilities of CHF 3 million.
c. Purchase accounting under IFRS 3 and FAS 141
With the adoption of IFRS 3 on 31 March 2004, the ac-counting for business combinations generally converged with US GAAP except for the differences described below.
Under IFRS, minority interests are recognized at the per-centage of fair value of identifiable net assets acquired at the acquisition date whereas under US GAAP they are recog-nized at the percentage of book value of identifiable net as-sets acquired at the acquisition date. In most cases, minority interests would tend to have a higher measurement value under IFRS than under US GAAP.
The accounting treatment of purchased minority interests of a subsidiary differs between IFRS and US GAAP. Under IFRS, UBS records the difference between the purchase price and the carrying value of the acquired minority interest di-rectly in Equity whereas the acquisition of the minority inter-ests is treated as a business combination under US GAAP. In 2006, goodwill of CAD 35 million (CHF 40 million) and in-tangible assets of CAD 71 million (CHF 79 million) under US GAAP resulted from the purchase of the then outstanding 50% minority interest in a consolidated subsidiary, UBS Bun-ting. See Note 37 Business Combinations for the IFRS treat-ment of this acquisition.
Furthermore, IFRS requires that in a step acquisition the existing ownership interest in an entity be revalued to the new valuation basis established at the time of acquisition. The increase in value is recorded directly in equity as a re-valuation reserve. Under US GAAP, the existing ownership interest remains at its original valuation.
d. Hedge accounting
Under IAS 39, UBS hedges interest rate risk based on fore-cast cash inflows and outflows on a Group basis. For this purpose, UBS accumulates information about non-trading financial assets and financial liabilities, which is then used to estimate and aggregate cash flows and to schedule the fu-ture periods in which these cash flows are expected to occur. Appropriate derivative instruments are then used to hedge the estimated future cash flows against repricing risk. SFAS 133 does not permit hedge accounting for hedges of
future cash flows determined by this methodology. Accord-ingly, for US GAAP such hedging instruments continue to be carried at fair value with changes in fair value recognized in Net trading income.
In addition, a new hedging methodology, fair value hedge of portfolio interest rate risk, was implemented in 2005 for a specific portfolio of mortgage loans. This new hedging method is not recognized under US GAAP and therefore, the fair value change of hedged items recognized under IFRS is reversed to Net trading income under US GAAP.
Amounts deferred under hedging relationships prior to the adoption of IAS 39 on 1 January 2001 that do not qual-ify as hedges under current requirements under IFRS are am-ortized to income over the remaining life of the hedging re-lationship. Such amounts have been reversed for US GAAP as they have never been treated as hedges.
e. Financial investments available-for-sale
For UBS, the following differences exist between IFRS and US GAAP in accounting for financial investments available-for-sale: 1) Under US GAAP, instruments which are not securities or equity securities with no readily determinable fair value (excluding private equity investments discussed in the next part) are not classified as available-for-sale investments. They are classified as Other assets and measured at cost less im-pairment. Under IFRS, these instruments are measured at fair value with changes in fair value reflected directly in equity. 2) Under IFRS, restricted stock is classified as a financial in-vestment available-for-sale. Under US GAAP, restricted stock (with a restriction period of more than one year) is classified as Other assets and measured at cost less impairment.
f. Private equity investments
On 1 January 2005, UBS adopted revised IAS 27 Consoli-dated and Separate Financial Statements and revised IAS 28 Investments in Associates. The comparative periods for 2004 and 2003 were restated. The adoption of these standards had an impact on the accounting for private equity invest-ments. Previously under IFRS, such investments were classi-fied as Financial investments available-for-sale with changes in fair value recorded directly in Equity. The effect of adopt-ing these standards is that private equity investments in which UBS owns a controlling interest are now consolidated and those where UBS has significant influence are account-ed for as associated companies using the equity method of accounting. The remaining private equity investments con-tinue to be accounted for as Financial investments available-for-sale.

189
Note 41 Reconciliation of International Financial Reporting Standards (IFRS) to United States Generally Accepted Accounting Principles (US GAAP) (continued)
Note 41.1 Valuation and Income Recognition Differences between IFRS and US GAAP (continued)
Under US GAAP, private equity investments held within separate investment subsidiaries are accounted for in accor-dance with the AICPA Audit and Accounting Guide, Audits of Investment Companies. They are accounted for at fair val-ue with changes in fair value recorded in other income. The remaining private equity investments held by UBS are ac-counted for at cost less “other than temporary” impairment. All private equity investments are presented in the balance sheet line Private equity investments under US GAAP.
g. Pension and other post-retirement benefit plans
Under IFRS, UBS recognizes post-retirement benefit expense based on a specific method of actuarial valuation used to determine the projected plan liabilities for accrued service, including future expected salary increases, and expected re-turn on plan assets. Plan assets are recorded at fair value and are held in a separate trust to satisfy plan liabilities. Under IFRS, the recognition of a prepaid asset is subject to certain limitations, and any unrecognized prepaid asset is recorded as pension expense. US GAAP does not allow a limitation on the recognition of prepaid assets recorded in the balance sheet.
Under US GAAP, post-retirement benefit expense is based on the same actuarial method of valuation of liabilities and assets as under IFRS. Differences in the amounts of expense and liabilities (or prepaid assets) exist due to different transi-tion date rules, stricter provisions for recognition of prepaid assets under IFRS, and the treatment of the 1998 merger of Union Bank of Switzerland and Swiss Bank Corporation.
In addition, under US GAAP, if the fair value of plan assets falls below the accumulated benefit obligation (which is the current value of accrued benefits without allowance for fu-ture salary increases), an additional minimum liability must be shown in the balance sheet. If an additional minimum li-ability is recognized, an equal amount will be recognized as an intangible asset up to the amount of any unrecognized prior service cost. Any amount not recognized as an intan-gible asset is reported in other comprehensive income (OCI). This amount was removed from OCI when SFAS 158 Em-ployers’ Accounting for Defined Benefit Pension and Other Postretirement Plans was first applied at 31 December 2006. See Note 41.2 for details.
In accordance with SFAS 158, the US GAAP balance sheet at 31 December 2006 shows the funded status of all post-retirement benefit plans under Other liabilities. All amounts not recognized in US GAAP Net profit are recognized in Oth-er comprehensive income (OCI) as an adjustment to the end-ing balance as of 31 December 2006. The recorded amounts in OCI are subsequently reclassified from OCI on a straight-
line basis as those amounts are recognized in the income statement.
Under IFRS, the amount recognized on the balance sheet as a net pension asset or liability is comprised of the funded status of the plans as adjusted for unrecognized actuarial gains and losses and prior service costs and the unrecog-nized prepaid pension asset. Unrecognized net actuarial gains and losses and prior service costs are subsequently rec-ognized in the income statement on a straight line basis.
h. Equity participation plans
On 1 January 2005, UBS adopted IFRS 2 Share-based pay-ment which requires that the fair value of all share-based payments made to employees be recognized as compensa-tion expense from the date of grant over the service period, which is generally equal to the vesting period. UBS applied IFRS 2 on a retrospective application basis and restated its 2003 and 2004 comparative prior periods for all awards that impact income statements commencing 2003. UBS recorded an opening retained earnings adjustment on 1 January 2003 to reflect the cumulative income statement effects of prior periods. See Note 1b) for details. Previously under IFRS, op-tion awards were expensed at their intrinsic value which is generally zero as options are normally granted at or out of the money. Shares were recognized as compensation ex-pense in full in the performance year, which is generally the year prior to grant.
On 1 January 2005, UBS also adopted SFAS 123 (revised 2004), Share-Based Payment, (SFAS 123-R). SFAS 123-R, like IFRS 2, also requires that share-based payments to employees be recognized in the income statement over the requisite ser-vice period based on their fair values at the date of grant. The requisite service period is defined as the period that the em-ployee is required to provide active employment in order to earn their award. This may be different from the service peri-od under IFRS, which is generally equal to the vesting period.
UBS adopted SFAS 123-R using the modified prospective method. Prior periods were not restated. Under this method, compensation cost for the portion of awards for which the service period has not been rendered and that are outstand-ing (unvested) as of the effective date shall be recognized as the service is rendered on or after the effective date. As such, to the extent that the grant date fair value of shares or op-tions has been previously recognized in the income state-ment or disclosed in the notes to the financial statements, it should not be re-recognized upon adoption of SFAS 123-R. Prior to the adoption of SFAS 123-R, UBS recognized the fair value of share awards granted as part of annual bonuses in the year of corresponding performance, in alignment with

190
Financial StatementsNotes to the Financial Statements
Note 41 Reconciliation of International Financial Reporting Standards (IFRS) to United States Generally Accepted Accounting Principles (US GAAP) (continued)
Note 41.1 Valuation and Income Recognition Differences between IFRS and US GAAP (continued)
the revenue produced. For disclosure purposes, UBS recog-nized the fair value of option awards on the date of grant. Thus, for recognition and disclosure purposes, expense for share and option awards issued prior to but outstanding at the date of adoption of SFAS 123-R has been fully attributed to prior periods.
Prior to 1 January 2005, UBS applied the intrinsic value method under APB 25, which was similar to the previous IFRS treatment except that certain share and option plans were deemed variable under US GAAP. Changes in intrinsic value for these variable plans were recorded in US GAAP Net prof-it. Due to the fact that IFRS 2 was applied on a retrospective basis and SFAS 123-R was applied on a modified prospective basis, for the IFRS to US GAAP reconciliation, the opening IFRS retained earnings adjustment on 1 January 2003 and subsequent IFRS 2 restatement adjustments were reversed and only the awards required to be expensed were recorded in the 2005 US GAAP Financial Statements. Subsequent awards have been recognized over the requisite service peri-ods, which are determined by the terms of the award.
In addition, under the transition provisions of SFAS 123-R, a cumulative adjustment of CHF 38 million expense reversal, net of tax, was recorded in US GAAP Net profit on 1 January 2005. The adjustment mainly relates to the required recogni-tion of estimated forfeitures of share-based compensation awards under SFAS 123-R. The standard requires that ex-pense be recognized only for those instruments where the requisite service is performed. During the service period, compensation cost recognized is based on the estimated number of instruments for which the requisite service is ex-pected to be rendered. That estimate is revised if subsequent information indicates that the actual number is likely to dif-fer from previous estimates.
Under SFAS 123-R, entities are required to continue to provide pro-forma disclosures for the periods in which the fair value method of accounting for share-based compensa-tion was not applied. See Note 42.7 for further information.
Certain UBS awards contain provisions that permit the employee to leave the bank and continue to vest in the award provided they do not perform certain harmful acts against the bank. These are generally referred to as non-compete provisions. Under SFAS 123-R, awards with non-compete provisions generally do not impose a requisite ser-vice period, and therefore expense should not be recognized over a future period. UBS has determined that the appropri-ate expense recognition period for such awards is the perfor-mance year, which is generally the period prior to grant. This is consistent with the approach applied under APB 25. Com-pensation expense for awards with non-compete provisions is generally recognized over the vesting period under IFRS.
Certain UBS awards contain provisions that permit the em-ployee to retire, provided they meet certain eligibility condi-tions and continue to vest in their award. Under US GAAP, compensation expense for such awards must be recognized over the period from grant until the employee reaches retire-ment eligibility. Under IFRS 2 such awards are generally rec-ognized over the vesting period, with an acceleration of ex-pense at the actual retirement date.
UBS also has employee benefit trusts that are used in con-nection with share-based payment arrangements and de-ferred compensation plans. In connection with the issuance of IFRS 2, the IFRIC amended SIC 12 Consolidation – Special Purpose Entities, an interpretation of IAS 27, to eliminate the scope exclusion for equity compensation plans. Therefore, pursuant to the criteria set out in SIC 12, an entity that con-trols an employee benefit trust (or similar entity) set up for the purposes of share-based payment arrangements will be required to consolidate that trust. UBS consolidated such employee benefit trusts retrospectively to 1 January 2003. For further details on the restatement, see Note 1b). Under US GAAP prior to 1 January 2004, certain equity compensa-tion trusts were already consolidated under US GAAP under the provisions of EITF-97-14, Accounting for Deferred Com-pensation Arrangements Where Amounts Earned Are Held in a Rabbi Trust and Invested. With the adoption of FASB Interpretation No. 46 Consolidation of Variable Interest Enti-ties (revised December 2003), an interpretation of Account-ing Research Bulletin No. 51 (FIN 46-R), on 1 January 2004, the remaining unconsolidated employee equity compensa-tion trusts formed before 1 February 2003 were consolidat-ed for US GAAP purposes for the first time. Thus, from 1 January 2004 onwards, there is no difference between IFRS and US GAAP in regard to these trust consolidations.
With the consolidation of the additional trusts under FIN 46-R from 1 January 2004, UBS re-evaluated its accounting for share-based compensation plans under APB 25 by taking into consideration the settlement methods and activities of the trusts. Based on this review, most share plans issued prior to 2001 were treated as variable awards under APB 25. There were no changes to the accounting for option plans. On 1 January 2004, a CHF 6 million expense reduction was recorded as a cumulative adjustment due to a change in accounting.
Under IFRS, UBS recognizes an obligation and related ex-pense for payroll taxes related to share-based payment trans-actions over the period that the related compensation ex-pense is recognized. This is generally the vesting period. US GAAP requires recognition of the liability on the date that the measurement of any payment of the tax to the taxing authority is triggered. This is generally the distribution date for share awards and the exercise date of options.

191
Note 41 Reconciliation of International Financial Reporting Standards (IFRS) to United States Generally Accepted Accounting Principles (US GAAP) (continued)
Note 41.1 Valuation and Income Recognition Differences between IFRS and US GAAP (continued)
In addition, CHF 1,450 million has been reclassified from Other liabilities to Shareholders' equity in the 31 December 2005 US GAAP balance sheet. The reclassification relates to equity-settled awards which were recorded in Other liabilities.
i. Variable interest entities (VIEs), limited partnerships and entities issuing preferred securities
IFRS and US GAAP generally require consolidation of entities on the basis of controlling a majority of voting rights. How-ever, in certain situations, there are no voting rights, or con-trol of a majority of voting rights is not a reliable indicator of the need to consolidate, such as when voting rights are sig-nificantly disproportionate to risks and rewards. There are differences in the approach of IFRS and US GAAP to those situations.
Under IFRS, when control is exercised through means oth-er than controlling a majority of voting rights, the consolida-tion assessment is based on the substance of the relation-ship. Indicators of control in these situations include: predetermination of the entity’s activities; the entity’s activi-ties being conducted on behalf of the enterprise; decision-making powers being held by the enterprise; the right to obtain the majority of the benefits or be exposed to the risks inherent in the activities of the entity; or retaining the major-ity of the residual or ownership risks related to the entity’s assets in order to obtain benefits from its activities.
In most other cases, US GAAP requires that control over an entity be assessed first based on voting interests. If voting interests do not exist, or differ significantly from economic interests, the entity is considered a variable interest entity (VIE) under FASB interpretation No. 46 (revised December 2003) Consolidation of Variable Interest Entities, an interpre-tation of Accounting Research Bulletin No. 51 (FIN 46-R), and control is assessed based on its variable interests. A dis-cussion of FIN 46-R requirements is set out in Note 42.1.
In most instances, limited partnerships are not consoli-dated under IFRS because UBS`s legal and contractual rights and obligations do not indicate that UBS has the power to govern the financial and operating policies of these entities and concurrently has the objective to obtain benefits form its activities through this power. Under US GAAP, UBS applies EITF 04-05, Determining Whether a General Partner, or the General Partners as a Group, Controls a Limited Partnership or Similar Entity When the Limited Partners Have Certain Rights (EITF 04-5), provided an entity is not considered a VIE under FIN 46-R. As a result, UBS consolidates some limited partnerships which are not consolidated under IFRS. Under EITF 04-05, a general partner in a limited partnership is pre-sumed to control that limited partnership regardless of the
extent of the general partners' ownership interest in the lim-ited partnership. The assessment of whether the rights of the limited partners should overcome the presumption of control by the general partner is a matter of judgment that depends on facts and circumstances. If the limited partners have either (a) the substantive ability to dissolve (liquidate) the limited partnership or otherwise remove the general partner without cause or (b) substantive participating rights, the general partner does not control the limited partnership and therefore does not consolidate the entity.
The entities consolidated for US GAAP purposes at 31 December 2006, which were not otherwise consolidated in UBS’s primary consolidated Financial Statements under IFRS, are mostly investment fund products and securitization VIEs. These are discussed in more detail in Note 42.1.
The entities not consolidated for US GAAP purposes at 31 December 2006, which UBS consolidates under IFRS, are certain entities which have issued preferred securities. Under IFRS such securities are equity instruments held by third par-ties and are treated as minority interests, with dividends paid also reported in Equity attributable to minority interests; the UBS-issued debt held by these entities and the respective interest amounts are eliminated in the Group Financial State-ments. Under US GAAP, these entities are not consolidated, and the UBS-issued debt is recognized as a liability in the Group Financial Statements, with interest paid reported in Interest expense.
A discussion of FIN 46-R measurement requirements and disclosures is set out in Note 42.1.
j. Financial assets and liabilities designated at fair value through profit or loss
IFRS provides, under certain circumstances, the option to designate at initial recognition a financial asset or financial liability at fair value through profit or loss (see Notes 1, 9 and 19). This option is not available under US GAAP as UBS did not early adopt SFAS 155 Accounting for Certain Hybrid In-struments, an amendment of FASB Statements No. 133 and 140 (see Note 41.2). SFAS 155 will allow a fair value designa-tion for certain hybrid instruments from 1 January 2007 on-wards. Additionally, beginning 1 January 2008, Statement of Financial Accounting Standards No. 159, The Fair Value Op-tion for Financial Assets and Liabilities (Statement 159) will become effective. Statement 159 provides a fair value op-tion that is broader than that provided in Statement 155 and is similar to the fair value option provided by IFRS. In 2006, as in prior periods, UBS reversed all IFRS fair value desig-nations of financial assets and financial liabilities under US GAAP.

192
Financial StatementsNotes to the Financial Statements
Note 41 Reconciliation of International Financial Reporting Standards (IFRS) to United States Generally Accepted Accounting Principles (US GAAP) (continued)
Note 41.1 Valuation and Income Recognition Differences between IFRS and US GAAP (continued)
UBS applies the fair value option to a significant portion of its issued debt under IFRS. Many debt issues are in the form of hybrid instruments, consisting of a debt host with an embedded derivative. These hybrid instruments are carried in their entirety at fair value with all changes in fair value recorded in Net trading income. Under US GAAP, the debt host contracts of these hybrid instruments are recognized at amortized cost while the embedded derivatives are recog-nized at fair value with changes in fair value recognized in Net profit. Although separately measured, the positive and negative replacement values of the embedded derivatives are classified with the debt host contract.
k. Physically settled written puts on UBS shares
Under IFRS, the accounting for physically settled written put options on UBS shares is as follows: the present value of the contractual amount is recorded as a financial liability, while
the premium received is credited to equity. Subsequently, the liability is accreted over the life of the put option to its con-tractual amount recognizing interest expense in accordance with the effective interest method. Under US GAAP, physi-cally settled written put options on UBS shares are account-ed for as derivative instruments. All other outstanding de-rivative contracts, except written put options with the UBS share as underlying, are treated as derivative instruments un-der both sets of accounting standards.
l. Investment properties
In the IFRS Financial Statements, investment properties are accounted for under the fair value method. Under this meth-od, changes in fair value are recognized in the income state-ment, and depreciation is no longer recognized. Under US GAAP, investment properties continue to be carried at cost less accumulated depreciation.

193
Note 41 Reconciliation of International Financial Reporting Standards (IFRS) to United States Generally Accepted Accounting Principles (US GAAP) (continued)
Note 41.2 Recently Issued US Accounting Standards
In June 2005, the FASB ratified the consensus on EITF Issue No. 04-5, Determining Whether a General Partner, or the General Partners as a Group, Controls a Limited Partnership or Similar Entity When the Limited Partners Have Certain Rights (EITF 04-5), which provides guidance in determining whether a general partner controls a limited partnership. EITF 04-5 stipulates that the general partner in a limited part-nership is presumed to control that limited partnership un-less the limited partners have either substantive kick-out rights or substantive participating rights. EITF 04-5 is effec-tive after 29 June 2005 for new limited partnership agree-ments and for pre-existing limited partnership agreements that are modified; otherwise, the guidance was effective as of 1 January 2006 for existing unmodified partnerships. Adoption of EITF 04-05 did not have a material impact on UBS’s Financial Statements.
As part of its convergence efforts with the IASB, the FASB issued Statement No. 154, Accounting Changes and Error Corrections – a Replacement of APB Opinion No. 20 and FASB Statement No. 3 (Statement 154) in May 2005. State-ment 154 changes the requirements for the accounting and reporting of a change in accounting principle and applies to all voluntary changes in accounting principle as well as to changes required by an accounting pronouncement that does not include specific transition provisions. Statement 154 requires retrospective application to prior periods’ finan-cial statements of a voluntary change in accounting principle unless it is impracticable, whereas Opinion 20 previously re-quired that the cumulative effect of most voluntary changes in accounting principle be recognized in the net income of the period of the change. Statement 154 was effective for accounting changes and corrections of errors made in fiscal years beginning after 15 December 2005. Adoption of State-ment 154 did not have a material impact on UBS’s Financial Statements.
In April 2006, the FASB issued FASB Staff Position FIN 46(R)-6, Determining the Variability to Be Considered in Ap-plying FASB Interpretation No. 46(R) (FSP FIN 46(R)-6). FSP FIN 46(R)-6 addresses the application of FIN 46(R), Consoli-dation of Variable Interest Entities, in determining whether certain contracts or arrangements with a variable interest entity (VIE) are variable interests by requiring companies to base its evaluation on an analysis of the VIE’s purpose and design, rather than on its legal form or accounting classifica-tion. FSP FIN 46(R)-6 was effective for all newly created VIEs or for those that must be re-analyzed under FIN 46(R) as of 1 July 2006. Adoption of FSP FIN 46(R)-6 did not have a ma-terial impact on UBS’s Financial Statements.
In September 2006, the FASB issued Statement No. 158, Employers’ Accounting for Defined Benefit Pension and Oth-
er Postretirement Plans (Statement 158). Statement 158 re-quires: (1) recognition of the over- or under-funded status of a defined benefit post-retirement plan as an asset or liability in the balance sheet; (2) recognition within shareholders eq-uity (net of tax) of gains or losses and prior service costs or credits arising during the period that are not recognized as components of the period's net periodic benefit cost; and (3) measurement of the defined benefit plan assets and obliga-tions as of the date of the employer’s fiscal year-end balance sheet. The recognition requirements of Statement 158 (re-quirements (1) and (2), above) are effective as of the end of the fiscal year ending after 15 December 2006. See Note 42.5 for the incremental effect of the first time application of these requirements. The requirement to measure plan as-sets and benefit obligations as of the date of the employer’s fiscal year end is effective for fiscal years ending after 15 De-cember 2008. Adoption of this requirement will not have an impact on UBS's Financial Statements as plan assets and benefit obligations are currently measured as of the balance sheet date.
Recently issued US accounting standards not yet adoptedIn February 2006, the FASB issued Statement of Financial Ac-counting Standard No. 155, Accounting for Certain Hybrid Instruments, an amendment of FASB Statements No. 133 and 140 (Statement 155). Statement 155 permits UBS to elect to measure any hybrid financial instrument at fair val-ue, with changes in fair value recognized in net profit, if the hybrid instrument contains an embedded derivative that would otherwise require bifurcation under Statement 133. The election to measure the hybrid instrument at fair value is made on an instrument-by-instrument basis and is irrevers-ible. Statement 155 is effective after the beginning of an entity’s first fiscal year that begins after 15 September 2006, with early adoption permitted in certain circumstances. At adoption of Statement 155, any difference between the to-tal carrying amount of the individual components of an ex-isting hybrid instrument and the fair value of the combined hybrid financial instrument is recognized as a cumulative-ef-fect adjustment to beginning retained earnings. UBS did not elect to early adopt Statement 155 and, therefore, will adopt the new standard as of 1 January 2007. On a US GAAP basis, it is anticipated that the cumulative-effect adjustment to be-ginning retained earnings resulting from the adoption of Statement 155 will be a decrease to retained earnings of ap-proximately CHF 414 million (before tax). Financial assets designated at fair value and Financial liabilities designated at fair value are estimated to be approximately CHF 4,125 mil-lion and CHF 151,440 million on a US GAAP basis on 1 Janu-ary 2007.

194
Financial StatementsNotes to the Financial Statements
Note 41 Reconciliation of International Financial Reporting Standards (IFRS) to United States Generally Accepted Accounting Principles (US GAAP) (continued)
Note 41.2 Recently Issued US Accounting Standards (continued)
In March 2006, the FASB issued Statement of Financial Accounting Standard No. 156, Accounting for Servicing of Financial Assets, (Statement 156). Statement 156 addresses the accounting for recognized servicing assets and servicing liabilities related to certain transfers of the servicer’s financial assets and for acquisitions or assumptions of obligations to service financial assets that do not relate to the financial as-sets of the servicer and its related parties. Statement 156 requires that all recognized servicing assets and servicing li-abilities are initially measured at fair value and subsequently measured at either fair value or by applying an amortization method for each class of recognized servicing assets and ser-vicing liabilities. Statement 156 is effective in fiscal years be-ginning after 15 September 2006. The adoption of SFAS 156 is not expected to have a material impact on UBS's Financial Statements.
In June 2006, the FASB issued FIN 48, Accounting for Un-certainty in Income Taxes – an interpretation of SFAS 109, which prescribes a recognition threshold and measurement attribute for financial statement recognition and measure-ment of a tax position. FIN 48 is effective for years com-mencing after 15 December 2006. UBS is continuing to evaluate the impact of FIN 48 on its Financial Statements. However, UBS does not expect FIN 48 to have a material ef-fect on its financial position or results of operations.
On 15 September 2006, the FASB issued Statement of Financial Accounting Standards No. 157, Fair Value Mea-surements (Statement 157). Statement 157 defines fair val-ue, establishes a framework for measuring fair value, and expands the required disclosures about an entity's fair value
measurements. Additionally, Statement 157 eliminates the requirement to defer calculated profit or loss on transaction values that include unobservable inputs (“Day 1 profit and loss”) and eliminates the use of block discounts for securities traded in an active market. Statement 157 is effective for fi-nancial statements issued for fiscal years beginning after 15 November 2007. The provisions of Statement 157 should be applied prospectively upon initial adoption, except for the provisions that eliminate prior measurement guidance re-garding block discounts and Day 1 profit or loss. Those changes should be applied retrospectively as an adjustment to the opening balance of retained earnings in the period of adoption. UBS is still assessing the impact Statement 157 will have on its Financial Statements.
In February 2007, the FASB issued Statement of Financial Accounting Standards No. 159, The Fair Value Option for Financial Assets and Liabilities (Statement 159). This new standard permits entities to irrevocably choose to measure many financial instruments and certain other items at fair value. Unrealized gains and losses on items for which the fair value option has been elected are recognized in net profit at each subsequent reporting date. The election in Statement 159 is similar, but not identical, to the fair value option in IAS 39. The fair value option in IAS 39 is subject to certain quali-fying criteria not included in this standard, and it applies to a slightly different set of instruments. Statement 159 is effec-tive for fiscal years beginning after 15 November 2007. Early adoption is permitted only if the provisions of Statement 157 are also applied. UBS is currently assessing the impact Statement 159 will have on its Financial Statements.

195
Note 41.3 Reconciliation of IFRS Equity Attributable to UBS Shareholders to US GAAP Shareholders’ Equity and IFRS Net Profit Attributable to UBS Shareholders to US GAAP Net Profit
Note 41.1
Equity attributable to UBS shareholders
(IFRS) / Shareholders’ equity (US GAAP)
as of
Net profit attributable to UBS shareholders (IFRS) /
Net profit (US GAAP) for the year ended
CHF million Reference 31.12.06 31.12.05 31.12.06 31.12.05 31.12.04
Amounts determined in accordance with IFRS 49,686 44,015 12,257 14,029 8,016
Adjustments in respect of:
SBC purchase accounting goodwill and other purchase accounting adjustments a 15,091 15,116 (25) (36) (44)
Goodwill b 2,366 2,373 3 0 778
Purchase accounting under IFRS 3 and FAS 141 c 85 (86) (6) 35 3
Hedge accounting d (5) (40) 372 (455) (217)
Financial investments available-for-sale e (1,670) (384) 171 0 0
Private equity investments f 337 709 (278) (486) 217
Pension and other post-retirement benefit plans g (1,452) 229 165 (18) (110)
Equity participation plans h 815 658 (475) 358 62
Variable interest entities (VIEs), limited partnerships and entities issuing preferred securities i (1) (98) (2) 0 18
Financial assets and liabilities designated at fair value through profit or loss j (994) (197) (682) (436) 100
Physically settled written puts on UBS shares k 184 131 6 8 9
Investment properties l (12) (8) (4) 0 14
Other adjustments 317 74 130 (118) (50)
Tax adjustments (224) (876) (146) (529) 22
Total adjustments 14,837 17,601 (771) (1,677) 802
Amounts determined in accordance with US GAAP 64,523 61,616 11,486 12,352 8,818
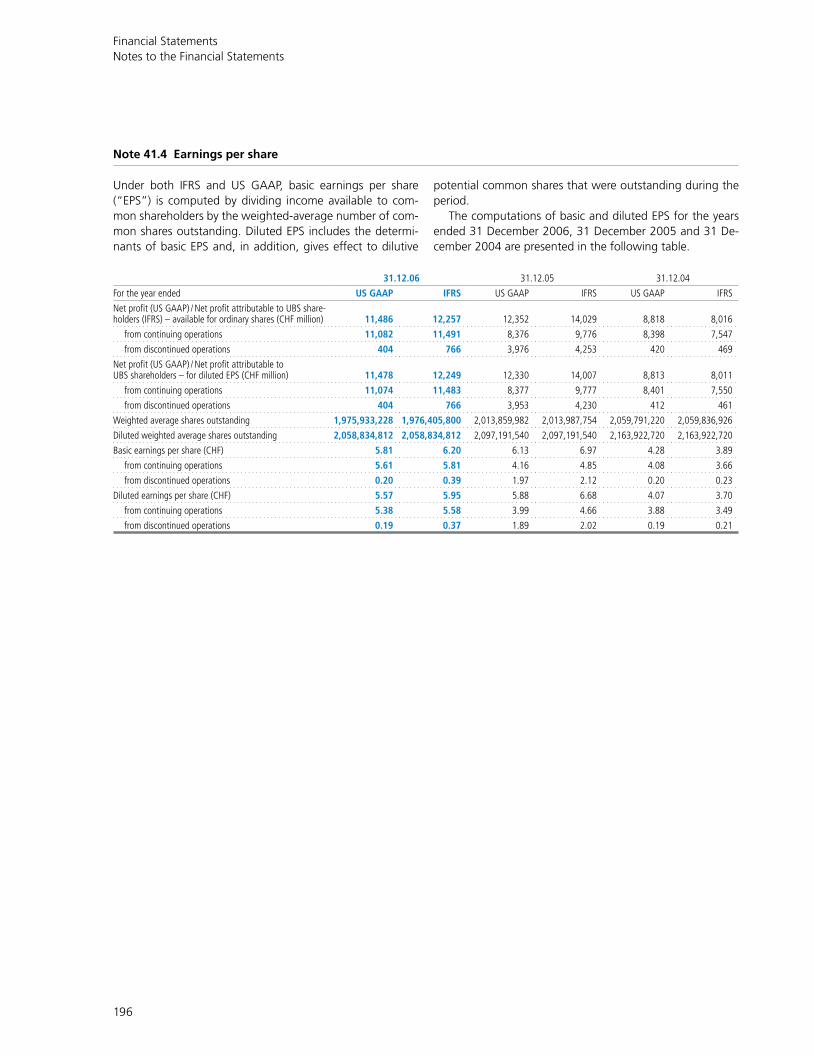
196
Financial StatementsNotes to the Financial Statements
Note 41.4 Earnings per share
Under both IFRS and US GAAP, basic earnings per share (“EPS”) is computed by dividing income available to com-mon shareholders by the weighted-average number of com-mon shares outstanding. Diluted EPS includes the determi-nants of basic EPS and, in addition, gives effect to dilutive
potential common shares that were outstanding during the period.
The computations of basic and diluted EPS for the years ended 31 December 2006, 31 December 2005 and 31 De-cember 2004 are presented in the following table.
31.12.06 31.12.05 31.12.04
For the year ended US GAAP IFRS US GAAP IFRS US GAAP IFRS
Net profit (US GAAP) / Net profit attributable to UBS share- holders (IFRS) – available for ordinary shares (CHF million) 11,486 12,257 12,352 14,029 8,818 8,016
from continuing operations 11,082 11,491 8,376 9,776 8,398 7,547
from discontinued operations 404 766 3,976 4,253 420 469
Net profit (US GAAP) / Net profit attributable to UBS shareholders – for diluted EPS (CHF million) 11,478 12,249 12,330 14,007 8,813 8,011
from continuing operations 11,074 11,483 8,377 9,777 8,401 7,550
from discontinued operations 404 766 3,953 4,230 412 461
Weighted average shares outstanding 1,975,933,228 1,976,405,800 2,013,859,982 2,013,987,754 2,059,791,220 2,059,836,926
Diluted weighted average shares outstanding 2,058,834,812 2,058,834,812 2,097,191,540 2,097,191,540 2,163,922,720 2,163,922,720
Basic earnings per share (CHF) 5.81 6.20 6.13 6.97 4.28 3.89
from continuing operations 5.61 5.81 4.16 4.85 4.08 3.66
from discontinued operations 0.20 0.39 1.97 2.12 0.20 0.23
Diluted earnings per share (CHF) 5.57 5.95 5.88 6.68 4.07 3.70
from continuing operations 5.38 5.58 3.99 4.66 3.88 3.49
from discontinued operations 0.19 0.37 1.89 2.02 0.19 0.21

197
Note 41.5 Presentation Differences between IFRS and US GAAP
In addition to the differences in valuation and income recog-nition, other differences exist between IFRS and US GAAP which generally have an impact solely on balance sheet and/or Income statement presentation, although in certain cases, these presentation differences may result in an immaterial impact on US GAAP Shareholders’ equity and Net profit. In such cases, these differences are aggregated in the Other differences line in the table in Note 41.3. The following is a summary of these differences.
1. Settlement date vs. trade date accountingUBS’s transactions from securities activities are recorded un-der IFRS on the settlement date. This results in recording a forward transaction during the period between the trade date and the settlement date. Forward positions relating to trading activities are revalued to fair value, presented as re-placement value on balance sheet and any unrealized profits and losses are recognized in Net profit.
Under US GAAP, trade date accounting is required for spot purchases and spot sales of securities. Therefore, all such transactions with a trade date on or before the balance sheet date and with a settlement date after the balance sheet date have been recorded at trade date for US GAAP. This has resulted in receivables and payables to broker-deal-ers and clearing organizations recorded in Other assets and Other liabilities in the US GAAP balance sheet.
2. Securities received as collateral in a securities-for-securities lending transactionWhen UBS acts as the lender in a securities lending agree-ment and receives securities as collateral that can be pledged or sold, it recognizes the securities received and a correspond-ing obligation to return them. These securities are reflected on the US GAAP balance sheet in the asset line Securities re-ceived as collateral. The offsetting liability is presented in the line Obligation to return securities received as collateral.
3. Reverse repurchase, repurchase, securities borrowing and securities lending transactionsUBS enters into certain types of reverse repurchase, repur-chase, securities borrowing and securities lending transac-tions that result in a difference between IFRS and US GAAP. Under IFRS, they are considered financing transactions which do not result in the recognition of the borrowed financial as-sets or derecognition of the financial assets lent. The cash collateral received or delivered in such transactions is reflect-ed in the balance sheet with a corresponding receivable or obligation to return it. Under US GAAP, however, certain transactions are considered purchase and sale transactions due to the fact that the contracts do not meet specific re-
quirements, including those related to collateral or margin-ing or the repurchase of the transferred securities is not be-fore maturity of these securities. Due to the different treatment of these transactions under IFRS and US GAAP, interest income and expense recorded under IFRS is reclassi-fied to Net trading income for US GAAP. Additionally under US GAAP, the securities received are recognized on the bal-ance sheet as a spot purchase (Trading portfolio assets or Trading portfolio assets pledged as collateral) with a corre-sponding forward sale transaction (Replacement values) and a receivable (Cash collateral on securities borrowed) is reclas-sified, as applicable. The securities delivered are recorded as a spot sale, which means that the securities are derecog-nized if they are on-balance sheet securities or recorded as a short sale if the delivered securities are off-balance sheet se-curities (Trading portfolio liabilities). Additionally, a corre-sponding forward repurchase transaction (Replacement val-ues) and a liability (Cash collateral on securities lent) is reclassified, as applicable.
Securities borrowing transactions with the clients' pool are generally done without providing collateral. UBS pays a fee to the client in such transactions. Under IFRS, the bor-rowed securities are not recognized on balance sheet but disclosed in a separate line in Note 24 Pledgeable Off-Bal-ance Sheet Securities. Under US GAAP, the borrowed securi-ties are recognized in Trading portfolio assets and Trading portfolio assets pledged as collateral, as applicable, and the obligation to return the securities, which represents a hybrid instrument, is included in Negative replacement values. Ef-fects on net profit which arise from derecognition/ recogni-tion of financial assets and related recognition of forward transactions are reflected in the Net trading income.
4. Recognition / derecognition of financial assetsThe guidance governing recognition and derecognition of a financial asset requires a multi-step decision process to de-termine whether recognition or derecognition of transferred financial assets is appropriate. UBS derecognizes financial as-sets for which it transfers the contractual rights to the cash flows and no longer retains any risk or reward coming from them nor maintains control over the financial assets. As a result of these requirements, certain transactions are ac-counted for as secured financing transactions instead of pur-chases or sales of trading portfolio assets with an accompa-nying swap derivative. Under US GAAP, these transactions typically continue to be shown as purchases and sales of trading portfolio assets and were reclassified accordingly. Ef-fects on net profit which arise from derecognition / recogni-tion of financial assets and related recognition of forward transactions are reflected in Net trading income.

198
Financial StatementsNotes to the Financial Statements
CHF million, for the year ended 31.12.06 31.12.05 31.12.04
Reference US GAAP IFRS US GAAP IFRS US GAAP IFRS
Operating income
Interest income a, d, e, f, i, j, 3, 4 87,380 87,401 58,791 59,286 38,991 39,228
Interest expense a, b, d, f, i, j, k,3, 4 (80,463) (80,880) (49,488) (49,758) (27,245) (27,484)
Net interest income 6,917 6,521 9,303 9,528 11,746 11,744
Credit loss (expense) / recovery f 156 156 375 375 334 241
Net interest income after credit loss (expense) / recovery 7,073 6,677 9,678 9,903 12,080 11,985
Net fee and commission income 25,881 25,881 21,436 21,436 18,435 18,506
Net trading income d, e, f, h, i, j, k,3, 4 12,548 13,318 7,012 7,996 4,795 4,902
Other income c, e, f, i, j, l 1,742 1,596 747 1,122 1,158 853
Revenues from Industrial Holdings f 0 693 0 675 0 640
Total operating income 47,244 48,165 38,873 41,132 36,468 36,886
Operating expenses
Personnel expenses f, g, h 23,771 23,671 19,542 20,148 17,970 17,891
General and administrative expenses f, i 7,944 8,116 6,469 6,632 6,420 6,563
Depreciation of property and equipment a, f, i 1,277 1,263 1,272 1,261 1,295 1,284
Amortization of goodwill b 0 0 0 0 0 673
Amortization of other intangible assets c, f 143 153 119 131 103 170
Goods and materials purchased f 0 295 0 283 0 263
Total operating expenses 33,135 33,498 27,402 28,455 25,788 26,844
Operating profit from continuing operations before tax 14,109 14,667 11,471 12,677 10,680 10,042
Tax expense / (benefit) 2,932 2,786 2,995 2,471 1,966 2,155
Minority interests (US GAAP) f, i (95) (138) (322)
Net profit/(loss) from continuing operations 11,082 11,881 8,338 10,206 8,392 7,887
Net profit / (loss) from discontinued operations 404 869 3,976 4,484 420 583
Net profit (IFRS) 12,750 14,690 8,470
Net profit attributable to minority interests (IFRS) c, f, i (493) (661) (454)
Cumulative adjustment due to the adoption of SFAS 123 (revised 2004), “Share Based Payment” on 1 January 2005, net of tax h 38
Cumulative adjustment of accounting for certain equity based compensation plans as cash settled, net of tax h 6
Net profit (US GAAP) / Net profit attributable to UBS shareholders (IFRS) 11,486 12,257 12,352 14,029 8,818 8,016
Note: References above coincide with the discussions in Note 41.1 and Note 41.5. These references indicate which IFRS to US GAAP differences affect an individual financial statement caption.
Note 41.6 Consolidated Income Statement
The following is a Consolidated Income Statement of the Group, for the years ended 31 December 2006, 31 December 2005 and 31 December 2004, restated to reflect the impact of valuation and income recognition differences and presentation dif-ferences between IFRS and US GAAP.

199
31.12.06 31.12.05
CHF million Reference US GAAP IFRS US GAAP IFRS
Assets
Cash and balances with central banks 3,495 3,495 5,359 5,359
Due from banks f, i, j,1,3, 4 51,416 50,426 33,427 33,644
Cash collateral on securities borrowed 3 351,461 351,590 288,304 288,435
Reverse repurchase agreements j, 3 44 44 361,571 405,834 359,883 404,432
Trading portfolio assets f, h, i, j,1, 4 627,160 627,036 505,717 499,297
Trading portfolio assets pledged as collateral 3, 4 401,176 251,478 272,494 154,759
Positive replacement values i, j,1, 3, 4 332,128 328,445 337,105 333,782
Financial assets designated at fair value j 5,930 1,153
Loans a, f, i, j,1, 4 316,141 312,521 277,471 279,910
Financial investments available-for-sale e, f, i, j,1, 4 4,535 8,937 3,407 6,551
Securities received as collateral 2 49,088 67,430
Accrued income and prepaid expenses f, j 10,335 10,361 8,853 8,918
Investments in associates c, e, f 1,823 1,523 2,554 2,956
Property and equipment a, c, f, l 7,207 6,913 9,282 9,423
Goodwill a, b, c, f 28,530 12,464 28,104 11,313
Other intangible assets b, c, f 2,340 2,309 1,665 2,173
Private equity investments f 2,195 2,210
Other assets c, d, e, f, g, h, i, j, k, l,1 84,027 17,249 75,992 16,243
Total assets 2,634,628 2,396,511 2,279,257 2,058,348
Liabilities
Due to banks f, i, j,1, 4 206,985 203,689 127,252 124,328
Cash collateral on securities lent 3 60,878 63,088 59,897 59,938
Repurchase agreements i, j, 3 520,351 545,480 464,957 478,508
Trading portfolio liabilities i, j,1, 3, 4 236,929 204,773 201,212 188,631
Obligation to return securities received as collateral 2 49,088 67,430
Negative replacement values i, j, k,1, 3, 4 439,495 332,533 432,290 337,663
Financial liabilities designated at fair value i, j,1 145,687 117,401
Due to customers f, i, j,1, 4 597,139 570,565 481,784 466,907
Accrued expenses and deferred income f, i, j 22,131 21,527 19,106 18,791
Debt issued a, c, f, i, j, 1 306,994 190,143 240,212 160,710
Other liabilities b, c, d, f, g, h, i, j, k, l,1 129,239 63,251 121,493 53,837
Total liabilities 2,569,229 2,340,736 2,215,633 2,006,714
Minority interests c, f, i 876 6,089 2,008 7,619
Total shareholders’ equity (US GAAP) / Equity attributable to UBS shareholders (IFRS) 64,523 49,686 61,616 44,015
Total equity (IFRS) 55,775 51,634
Total liabilities, minority interests and shareholders’ equity 2,634,628 2,396,511 2,279,257 2,058,348
Note: References above coincide with the discussions in Note 41.1 and Note 41.5. These references indicate which IFRS to US GAAP differences affect an individual financial statement caption. Certain prior year US GAAP amounts have been reclas-sified to conform to the current year’s presentation.
Note 41.7 Condensed Consolidated Balance Sheet
The following is a Condensed Consolidated Balance Sheet of the Group, as of 31 December 2006 and 31 December 2005, restated to reflect the impact of valuation and income recognition principles and presentation differences between IFRS and US GAAP.

200
Financial StatementsNotes to the Financial Statements
CHF million
Foreign currency
translation
Unrealized gains /
(losses) on available-
for-sale investments
Pension and Other Post-Retirement
Benefit PlansDeferred
income taxes
Accumulated other compre-
hensive income /
(loss)
Comprehen-sive income /
(loss)Balance at 1 January 2004 (1,815) 175 (306) 211 (1,735)Net profit 8,818Other comprehensive income:Foreign currency translation (1,062) 236 (826) (826)Net unrealized gains / (losses) on available-for-sale investments 32 (15) 17 17Impairment charges reclassified to the income statement 10 (2) 8 8Reclassification of (gains) / losses on available-for-sale investments realized in net profit (5) 1 (4) (4)Additional minimum pension liability (819) 21 (798) (798)Other comprehensive income / (loss) (1,062) 37 (819) 241 (1,603) (1,603)Comprehensive income 7,215Balance at 31 December 2004 (2,877) 212 (1,125) 452 (3,338)
Net profit 12,352Other comprehensive income:Foreign currency translation 2,380 (292) 2,088 2,088Net unrealized gains / (losses) on available-for-sale investments 130 (6) 124 124Impairment charges reclassified to the income statement 19 (3) 16 16Reclassification of (gains) / losses on available-for-sale investments realized in net profit (19) 3 (16) (16)Additional minimum pension liability (127) 18 (109) (109)Other comprehensive income / (loss) 2,380 130 (127) (280) 2,103 2,103Comprehensive income 14,455Balance at 31 December 2005 (497) 342 (1,252) 172 (1,235)
Net profit 11,486Other comprehensive income:Foreign currency translation (1,269) 83 (1,186) (1,186)Net unrealized gains / (losses) on available-for-sale investments 1,506 (323) 1,183 1,183Impairment charges reclassified to the income statement 5 (1) 4 4Reclassification of (gains) / losses on available-for-sale investments realized in net profit (460) 97 (363) (363)Additional minimum pension liability (38) 4 (34) (34)Other comprehensive income / (loss) (1,269) 1,051 (38) (140) (396) (396)Comprehensive income 11,090Pension and other post-retirement benefit plans – initial adoption of SFAS 158 1 (1,815) 475 (1,340)Balance at 31 December 2006 (1,766) 1,393 (3,105) 507 (2,971)1 Represents the incremental effect of transferring amounts not recognized in the income statement to Accumulated other comprehensive income.
Note 41.8 Comprehensive Income
Comprehensive income under US GAAP is defined as the change in shareholders’ equity excluding transactions with shareholders. Comprehensive income has two major com-ponents: Net profit, as reported in the income statement, and Other comprehensive income (OCI). OCI includes for-eign currency translation adjustments and changes in unre-alized gains / losses on available-for-sale securities. In addi-tion, up to 31 December 2006, OCI included adjustments to the additional minimum pension liability, which as of 31 December 2006 has been eliminated to reflect that a
minimum pension liability is no longer recognized under US GAAP. However, as a result of the adoption of SFAS 158 as discussed in Note 41.1.g, OCI now includes changes in gains or losses and prior service costs or credits relating to post-retirement benefit plans that have not been recog-nized as components of net periodic pension costs. The components and Accumulated other comprehensive in-come amounts on a US GAAP basis for the years ended 31 December 2006, 31 December 2005 and 31 December 2004 are as follows:

201
Note 42 Additional Disclosures Required under US GAAP and SEC Rules
In addition to the differences in valuation, income recogni-tion and presentation, disclosure differences exist between IFRS and US GAAP. The following are additional disclosures
that relate to the basic Financial Statements required under US GAAP. Unless otherwise indicated in the note, all amounts are shown on an IFRS basis.
Note 42.1 Variable Interest Entities
IntroductionSince 1 January 2004, UBS has applied FASB Interpretation No. 46, Consolidation of Variable Interest Entities (revised December 2003), an interpretation of Accounting Research Bulletin No. 51 (FIN 46-R). Until 31 December 2003, the pre-decessor standard, FIN 46, had application to UBS only with respect to transitional disclosure requirements, and consoli-dation requirements for certain variable interest entities (VIEs) created after 31 January 2003. All amounts in Note 42.1 are reported on a US GAAP basis.
Identification of variable interest entities (VIEs) and mea-surement of variable interestsQualifying special purpose entities (QSPEs) per FASB State-ment No. 140 Accounting for Transfers and Servicing of Fi-nancial Assets and Extinguishments of Liabilities are exclud-ed from the scope of FIN 46-R. In most other cases, US GAAP requires that control over an entity be assessed first based on voting interests; if voting interests do not exist, or differ sig-nificantly from economic interests, the entity is considered a VIE under FIN 46-R, and control is assessed based on its vari-able interests. Specifically, VIEs are legal entities in which no equity investors exist, or the equity investors:– do not have sufficient equity at risk for the entity to fi-
nance its activities without additional subordinated finan-cial support from other parties; or
– do not have the characteristics of a controlling financial interest; or
– have voting rights that are not proportionate to their eco-nomic interests, and the activities of the entity involve or are conducted on behalf of investors with disproportion-ately small or no voting interests.VIEs are evaluated for consolidation based on all contrac-
tual, ownership, or other interests that expose their holders to the risks and rewards of the entity. These interests are termed variable interests and include only investments or contractual interests whose value changes with changes in the fair value of a VIE’s net assets, exclusive of variable inter-ests. Interests of related parties (including management, em-ployees, affiliates and agents) are included in the evaluation as if owned directly by the enterprise.
The holder of a variable interest that receives a majority of a VIE’s expected losses, expected residual returns, or both, is the VIE's primary beneficiary and must consolidate the VIE
and provide certain disclosures. The holder of a significant variable interest in a VIE is required to make disclosures only. UBS treats variable interests of more than 20% of a VIE’s expected losses, expected residual returns, or both, as sig-nificant.
The FASB Emerging Issues Task Force (EITF) has summa-rized four different general approaches to the application of FIN 46-R in EITF issue No. 04-7. In applying FIN 46-R, UBS has adopted a quantitative approach, particularly for derivatives, based on variability in the fair value of the net assets in the VIE, exclusive of variable interests.
Under this approach, investments or derivatives in a VIE either create (increase), or absorb (decrease) variability in the fair value of a VIE’s net assets. The VIE counterparty is a risk creator (risk maker), or risk absorber (risk taker), respectively. Only risk absorption (risk taker) positions are assessed; risk creation interests are deemed not to be variable interests.
VIEs often contain multiple risk factors, such as credit, equity, foreign currency and interest rate risks, which require quantification by variable interest holders. UBS analyzes these risks into components, identifies the parties absorbing them, and uses models to quantify and compare them. These models are based on internally approved valuation models and in some cases require the use of Monte Carlo simulation techniques.
They are applied when UBS first becomes involved with a VIE, or after a major restructuring.
Measurement of maximum exposure to lossMaximum exposure to loss is disclosed for VIEs in which UBS has a significant variable interest.
UBS’s maximum exposure to loss is generally measured as its net investment in the VIE, plus any additional amounts it may be obligated to invest. If UBS receives credit protection from credit derivatives it is measured as any positive replace-ment value of the derivatives. If UBS has provided guaran-tees or other types of credit protection to a VIE it is measured as the notional amount of the credit protection instruments or credit derivatives. In other derivative transactions expos-ing UBS to potential losses, there is no theoretical limit to the maximum loss which could be incurred before considering offsetting positions or hedges entered into outside of the VIE. However, UBS’s general risk management process in-volves the hedging of risk exposures for VIEs, on the same

202
Financial StatementsNotes to the Financial Statements
Note 42 Additional Disclosures Required under US GAAP and SEC Rules (continued)
Note 42.1 Variable Interest Entities (continued)
basis as for non-VIE counterparties. See Note 29 for a further discussion of UBS’s risk mitigation strategies.
VIEs in which UBS is the primary beneficiaryVIEs in which UBS is the primary beneficiary require consoli-dation, which may increase both total assets and liabilities of the US GAAP Financial Statements, or in other cases may result in a reclassification of existing assets or liabilities.
In certain cases, an entity not consolidated under IFRS is consolidated under FIN 46-R because UBS is the primary beneficiary. Significant groups of these include CHF 2.5 bil-lion of investment fund products, and CHF 1.1 billion of se-curitization VIEs, which includes some third-party VIEs men-tioned below.
UBS has reviewed the population of potential third-party VIEs it is involved with. Those identified in which UBS is the primary beneficiary, and which are consolidated for US GAAP
purposes, have combined assets of approximately CHF 3.4 billion and are included in the table below.
Many entities consolidated under US GAAP due to FIN 46-R are already consolidated under IFRS, based on the de-termination of exercise of control under IFRS. The total size of this population is approximately CHF 7.5 billion, mostly comprising investment funds managed by UBS, other invest-ment fund products, employee equity compensation trusts mentioned previously, and private equity investments.
Certain VIEs in which UBS is the primary beneficiary, but for which UBS also holds a majority voting interest, are con-solidated, but do not require disclosure in the table below. In most cases such VIEs, or their financial position and perfor-mance, are already consolidated under IFRS.
The creditors or beneficial interest holders of VIEs in which UBS is the primary beneficiary do not have any recourse to the general credit of UBS.
VIEs in which UBS is the primary beneficiary
CHF millionNature, purpose and activities of VIEs Total assets
Consolidated assets that are collateral for the VIEs’ obligationsClassification Amount
Securitizations 1,085 Loan receivables, government debt securities, corporate debt securities 1,085
Investment fund products 3,898 Investment funds 3,898
Investment funds managed by UBS 1,027 Debt, Equity 984
Passive intermediary to a derivative transaction 1,260 Loan receivables, corporate debt securities 1,260
Trust vehicles for awards to UBS employees 1,829 UBS shares and derivatives thereon 1,829
Private equity investments 397 Private equity investments 272
Other miscellaneous structures 1,600 Equity, derivatives, investment funds 615
Total 31.12.06 11,096 9,943
Entities which are de-consolidated for US GAAP purposesIn certain cases, an entity consolidated under IFRS is not con-solidated under FIN 46-R. UBS consolidates under IFRS sev-eral entities that have issued preferred securities amounting to CHF 4.5 billion, which are de-consolidated for US GAAP purposes. Under IFRS the preferred securities are equity in-struments held by third parties and are treated as minority
interests, with dividends paid also reported in minority inter-ests; the UBS issued debt held by these entities and the re-spective interest amounts are eliminated in consolidation. Under US GAAP, these entities are not consolidated and the UBS-issued debt is recognized as a liability in the UBS Group Financial Statements, with interest paid reported in Interest expense.

203
Note 42 Additional Disclosures Required under US GAAP and SEC Rules (continued)
Note 42.1 Variable Interest Entities (continued)
VIEs in which UBS holds a significant variable interestVIEs in which UBS holds a significant variable interest but does not consolidate the VIE are mostly used in securitiza-tions, or as investment fund products, including funds man-aged by UBS.
UBS has reviewed the population of potential third-party VIEs it is involved with. Those identified in which UBS holds a significant variable interest have combined assets of ap-proximately CHF 4.6 billion, for which UBS has a maximum exposure to loss of approximately CHF 2.4 billion. Disclo-sures for these are included in the table below.
VIEs in which UBS holds a significant variable interest
CHF millionNature, purpose and activities of VIEs Total assets Nature of involvement
Maximum exposure to loss
Securitizations 61 UBS holds beneficial interests 0
Investment fund products 5,707 UBS holds notes or units 1,975
Investment funds managed by UBS 23,870 UBS acts as investment manager 17,772
Credit protection vehicles 1,200SPE used for credit protection – UBS sells credit risk on portfolios to investors 894
Other miscellaneous structures 1,181 UBS acts as swap counterparty 301
Total 31.12.06 32,019 20,942
Third-party VIEs not otherwise classifiedFIN 46-R requires UBS to consider all VIEs for consolidation, including VIEs which UBS has not created, but in which it holds variable interests as a third-party counterparty, either through direct or indirect investment, or through derivative transactions.
UBS has identified that it holds variable interests in 81 third party VIEs that in some cases could result in UBS being considered the primary beneficiary, but the information nec-essary to make this determination, or perform the account-ing required to consolidate the VIE was held by third parties, and was not available to UBS. Additional disclosures for these VIEs are provided in the table below.
VIEs not originated by UBS – information determining VIE status unavailable from third parties
CHF millionNature, purpose and activities of VIEs Total assets Nature of involvement
Net income from VIE in
current period
Maximum exposure
to loss
Investment fund products 5,204 UBS acts as swap counterparty 441 4,483
Total 31.12.06 5,204 441 4,483

204
Financial StatementsNotes to the Financial Statements
Note 42 Additional Disclosures Required under US GAAP and SEC Rules (continued)
Note 42.2 Securitizations
UBS records a securitization of financial assets when the transfer of financial assets to the special purpose entity meets the accounting criteria to be accounted for as a sale. These criteria include: (1) the assets are legally isolated from UBS’s creditors; (2) the entity can pledge or exchange the fi-nancial assets, or if the entity is a qualifying special purpose entity, its investors can pledge or exchange their beneficial interests; and (3) UBS does not maintain effective control over the transferred assets through an agreement to repur-chase the assets before their maturity or have the ability to unilaterally cause the holder to return the assets.
During the years ended 31 December 2006, 2005 and 2004, UBS securitized residential mortgage loans and securi-ties, commercial mortgage loans and other financial assets, acting as lead or co-manager. UBS’s continuing involvement in these transactions was primarily limited to the temporary retention of various security interests. All amounts are shown on a US GAAP basis. Prior period amounts have been ad-justed to conform to the current year’s presentation.
Proceeds received at the time of securitization were as follows:
Proceeds Received
CHF billion 31.12.06 31.12.05 31.12.04
Residential mortgage securitizations 38 58 91
Commercial mortgage securitizations 6 5 3
Other financial asset securitizations 18 9 9
Pre-tax gains / (losses) recognized
CHF million 31.12.06 31.12.05 31.12.04
Residential mortgage securitizations 128 102 197
Commercial mortgage securitizations 143 125 141
Other financial asset securitizations (49) 17 21
Related pre-tax gains (losses) recognized, including unrealized gains (losses) on retained interests, at the time of securitiza-tion were as follows:
At 31 December 2006 and 2005, UBS retained CHF 3.5 bil-lion and CHF 1.7 billion, respectively, in agency residential mortgage securities, backed by the Government National Mortgage Association (GNMA), the Federal National Mort-gage Association (FNMA) and the Federal Home Loan Mort-gage Corporation (FHLMC). The retained interests in invest-ment-grade non-residential and other asset-backed securities
amounted to CHF 1,618 million at 31 December 2006 and CHF 713 million at 31 December 2005. The fair value of in-vestment-grade retained interests is generally determined using observable market prices. Retained interests in non-investment-grade securities were not material at 31 Decem-ber 2006 and 2005.

205
After the acquisition of an additional 20% stake in Motor-Columbus, a Swiss holding company whose most significant asset is a 59.3% interest in Atel, a Swiss-based European energy provider, UBS held a majority ownership interest in the company, and as a result, consolidated Motor-Columbus in its Financial Statements since 1 July 2004. The investment in Motor-Columbus is presented as a discontinued operation in the income statements for the years ended 31 December 2006, 31 December 2005 and 31 December 2004 due to its
Note 42 Additional Disclosures Required under US GAAP and SEC Rules (continued)
Note 42.3 Industrial Holdings’ Income Statement
sale on 23 March 2006 (refer to Note 38 Discontinued Op-erations). In addition, due to the adoption of IAS 27 Con-solidated and Separate Financial Statements which is further described in Note 1b), UBS retrospectively consolidated certain private equity investments to 1 January 2003. The following table provides information required by Regulation S-X for commercial and industrial companies, including a condensed income statement and certain additional balance sheet information.
Industrial Holdings’ Income Statement
As of or for the year ended
CHF million 31.12.06 31.12.05 31.12.04
Operating income
Net sales 693 675 640
Operating expenses
Cost of products sold 469 457 425
Marketing expenses 52 61 64
General and administrative expenses 135 124 111
Amortization of goodwill 0 0 27
Amortization of other intangible assets 5 4 2
Other operating expenses 55 105 66
Total operating expenses 716 751 695
Operating profit / (loss) (23) (76) (55)
Non-operating profit
Interest income 0 5 37
Interest expense (44) (54) (101)
Other non-operating income, net 334 585 334
Non-operating profit / (loss) 290 536 270
Net profit / (loss) from continuing operations before tax 267 460 215
Tax expense 35 175 51
Equity in income of associates, net of tax 11 25 5
Net profit / (loss) from continuing operations 243 310 169
Net profit from discontinued operations 865 409 284
Net profit / (loss) 1,108 719 453
Net profit / (loss) attributable to minority interests 104 207 93
Net profit / (loss) attributable to UBS shareholders 1,004 512 360
Accounts receivable trade, gross 103 2,068
Allowance for doubtful receivables (7) (62)
Accounts receivables trade, net 96 2,006

206
Financial StatementsNotes to the Financial Statements
Note 42 Additional Disclosures Required under US GAAP and SEC Rules (continued)
Note 42.4 Indemnifications
In the normal course of business, UBS provides representa-tions, warranties and indemnifications to counterparties in connection with numerous transactions. These provisions are generally ancillary to the business purposes of the con-tracts in which they are embedded. Indemnification clauses are generally standard contractual terms related to the Group’s own performance under a contract and are entered into based on an assessment that the risk of loss is remote. Indemnifications may also protect counterparties in the event that additional taxes are owed due either to a change in applicable tax laws or to adverse interpretations of tax laws. The purpose of these clauses is to ensure that the terms of a contract are met at inception.
The most significant business where UBS provides repre-sentations and warranties is asset securitizations. UBS gen-erally represents that certain securitized assets meet specific requirements, for example documentary attributes. UBS may be required to repurchase the assets and/or indemnify the purchaser of the assets against losses due to any breaches of
such representations or warranties. Generally, the maximum amount of future payments the Group would be required to make under such repurchase and/or indemnification provi-sions would be equal to the current amount of assets held by such securitization-related SPEs as of 31 December 2006, plus, in certain circumstances, accrued and unpaid interest on such assets and certain expenses. The potential loss due to such repurchase and/or indemnity is mitigated by the due diligence UBS performs to ensure that the assets comply with the requirements set forth in the representations and warranties. UBS receives no compensation for representa-tions and warranties, and it is not possible to determine their fair value because they rarely, if ever, result in a pay-ment. Historically, losses incurred on such repurchases and / or indemnifications have been insignificant. Management expects the risk of material loss to be remote. No liabilities related to such representations, warranties, and indemnifi-cations are included in the balance sheet at 31 December 2006 and 2005.

207
Note 42.5 Pension and Other Post-Retirement Benefit Plans
All amounts in Note 42.5 are on a US GAAP basis. The additional minimum liability required amounts to CHF 1,290 million, CHF 1,252 million and CHF 1,125 million as of 31 December 2006, 2005 and 2004, respectively.
Incremental Effect of First Time Application of SFAS 158
The incremental effects on individual line items in the 31 December 2006 Financial Statements due to the adoption of SFAS 158 Employers’ Accounting for Defined Benefit Pension and Other Post-Retirement Plans (see Note 41.2 for details) are as follows:
31.12.06
CHF million
Before application of
SFAS 158 Adjustment
After application of
SFAS 158
Other assets 86,008 (1,981) 84,027
Total assets 86,008 (1,981) 84,027
Other liabilities 129,880 (641) 129,239
Total liabilities 129,880 (641) 129,239
Total shareholder’ equity 65,863 (1,340) 64,523
Amounts Included in Accumulated Other Comprehensive Income (AOCI)
31.12.06
CHF million Swiss plans Foreign plans
Post-retirement medical and
life plans Total
Net gains or losses (564) (1,386) (25) (1,975)
Net prior service costs or credits (1,153) 41 (15) (1,127)
Transition assets 0 0 (3) (3)
Ending balance in AOCI (1,717) (1,345) (43) (3,105)
Amounts in AOCI expected to be recognized as components of net periodic benefit cost in 2007
Net gains or losses 0 73 0 73
Net prior service costs or credits 347 (7) 1 341
Transition assets 0 0 0 0
Total 347 66 1 414
No plan assets are expected to be returned to the Group during 2007.
For more details on the pension and other post-retirement benefit plans on an IFRS basis, see Note 31.

208
Financial StatementsNotes to the Financial Statements
Note 42 Additional Disclosures Required under US GAAP and SEC Rules (continued)
Note 42.6 Supplemental Guarantor Information
Guarantee of PaineWebber securitiesFollowing the acquisition of Paine Webber Group Inc., UBS AG made a full and unconditional guarantee of the senior and subordinated notes and trust preferred securities (“Debt Securities”) of PaineWebber. Prior to the acquisition, PaineWebber was an SEC Registrant. Upon the acquisition, PaineWebber was merged into UBS Americas Inc., a wholly owned subsidiary of UBS.
Under the guarantee, if UBS Americas Inc. fails to make any timely payment under the Debt Securities agreements, the holders of the Debt Securities or the Debt Securities trustee may demand payment from UBS without first pro-ceeding against UBS Americas Inc. UBS’s obligations under
the subordinated note guarantee are subordinated to the prior payment in full of the deposit liabilities of UBS and all other liabilities of UBS. At 31 December 2006, the amount of senior liabilities of UBS to which the holders of the subor-dinated debt securities would be subordinated is approxi-mately CHF 2,324 billion.
The information presented in this note is prepared in ac-cordance with IFRS and should be read in conjunction with the Consolidated Financial Statements of UBS of which this information is a part. At the bottom of each column, Net prof-it and Shareholders’ equity have been reconciled to US GAAP. See Note 41 for a detailed reconciliation of the IFRS Financial Statements to US GAAP for UBS on a consolidated basis.
Supplemental Guarantor Consolidating Income Statement
CHF millionFor the year ended 31 December 2006
UBS AG 1 Parent Bank 1
UBS Americas Inc. Subsidiaries
Consolidating entries UBS Group
Operating income
Interest income 60,057 42,667 39,269 (54,592) 87,401
Interest expense (56,020) (41,049) (38,403) 54,592 (80,880)
Net interest income 4,037 1,618 866 0 6,521
Credit loss (expense) / recovery 167 (6) (5) 0 156
Net interest income after credit loss expense 4,204 1,612 861 0 6,677
Net fee and commission income 11,646 8,590 5,645 0 25,881
Net trading income 10,306 1,634 1,378 0 13,318
Income from subsidiaries 3,760 0 0 (3,760) 0
Other income (450) 1,637 409 0 1,596
Revenues from industrial holdings 0 0 693 0 693
Total operating income 29,466 13,473 8,986 (3,760) 48,165
Operating expenses
Personnel expenses 12,208 8,040 3,423 0 23,671
General and administrative expenses 2,805 3,362 1,949 0 8,116
Depreciation of property and equipment 979 133 151 0 1,263
Amortization of other intangible assets 14 83 56 0 153
Goods and materials purchased 0 0 295 0 295
Total operating expenses 16,006 11,618 5,874 0 33,498
Operating profit from continuing operations before tax 13,460 1,855 3,112 (3,760) 14,667
Tax expense / (benefit) 1,715 585 486 0 2,786
Net profit / (loss) from continuing operations 11,745 1,270 2,626 (3,760) 11,881
Net profit / (loss) from discontinued operations 512 0 357 0 869
Net profit / (loss) 12,257 1,270 2,983 (3,760) 12,750
Net profit / (loss) attributable to minority interests 0 527 (34) 0 493
Net profit / (loss) attributable to UBS shareholders 12,257 743 3,017 (3,760) 12,257
Net profit / (loss) US GAAP 2 8,748 259 2,479 0 11,486
1 UBS AG Parent Bank prepares its financial statements in accordance with Swiss banking law requirements. For the purpose of this disclosure, the accounts have been adjusted to IFRS. 2 Refer to Note 41 for a description of the differences between IFRS and US GAAP.

209
Note 42 Additional Disclosures Required under US GAAP and SEC Rules (continued)
Note 42.6 Supplemental Guarantor Information (continued)
Supplemental Guarantor Consolidating Balance Sheet
CHF millionAs of 31 December 2006
UBS AG 1 Parent Bank 1
UBS Americas Inc. Subsidiaries
Consolidating entries UBS Group
Assets
Cash and balances with central banks 2,660 78 757 0 3,495
Due from banks 121,404 16,884 182,850 (270,712) 50,426
Cash collateral on securities borrowed 99,829 303,607 156,083 (207,929) 351,590
Reverse repurchase agreements 270,814 167,222 300,862 (333,064) 405,834
Trading portfolio assets 294,590 188,710 143,736 0 627,036
Trading portfolio assets pledged as collateral 162,722 51,834 36,922 0 251,478
Positive replacement values 318,936 13,168 173,243 (176,902) 328,445
Financial assets designated at fair value 2,902 4,147 7,146 (8,265) 5,930
Loans 414,031 40,279 38,644 (180,433) 312,521
Financial investments available-for-sale 5,843 862 2,232 0 8,937
Accrued income and prepaid expenses 6,598 4,029 4,809 (5,075) 10,361
Investments in associates 34,887 179 237 (33,780) 1,523
Property and equipment 5,432 637 844 0 6,913
Goodwill and other intangible assets 258 11,128 3,387 0 14,773
Other assets 10,709 5,524 5,587 (4,571) 17,249
Total assets 1,751,615 808,288 1,057,339 (1,220,731) 2,396,511
Liabilities
Due to banks 228,992 114,782 130,627 (270,712) 203,689
Cash collateral on securities lent 106,019 57,937 107,061 (207,929) 63,088
Repurchase agreements 167,166 419,427 291,951 (333,064) 545,480
Trading portfolio liabilities 107,747 71,165 25,861 0 204,773
Negative replacement values 326,216 13,629 169,590 (176,902) 332,533
Financial liabilities designated at fair value 121,074 49 32,829 (8,265) 145,687
Due to customers 504,502 80,936 165,560 (180,433) 570,565
Accrued expenses and deferred income 12,336 8,406 5,860 (5,075) 21,527
Debt issued 110,020 29,149 50,974 0 190,143
Other liabilities 16,488 4,284 47,050 (4,571) 63,251
Total liabilities 1,700,560 799,764 1,027,363 (1,186,951) 2,340,736
Equity attributable to UBS shareholders 51,055 5,539 26,872 (33,780) 49,686
Minority interests 0 2,985 3,104 0 6,089
Total equity 51,055 8,524 29,976 (33,780) 55,775
Total liabilities and equity 1,751,615 808,288 1,057,339 (1,220,731) 2,396,511
Total shareholders’ equity – US GAAP 2 29,738 7,287 27,498 0 64,523
1 UBS AG Parent Bank prepares its financial statements in accordance with Swiss banking law requirements. For the purpose of this disclosure, the accounts have been adjusted to IFRS. 2 Refer to Note 41 for a description of the differences between IFRS and US GAAP.

210
Financial StatementsNotes to the Financial Statements
Note 42 Additional Disclosures Required under US GAAP and SEC Rules (continued)
Note 42.6 Supplemental Guarantor Information (continued)
Note 42.6 Supplemental Guarantor Consolidating Cash Flow Statement
CHF millionFor the year ended 31 December 2006
UBS AG 1 Parent Bank 1
UBS Americas Inc. Subsidiaries UBS Group
Net cash flow from / (used in) operating activities (1,705) (14,810) 11,805 (4,710)
Cash flow from / (used in) investing activities
Investments in subsidiaries and associates 2,856 0 0 2,856
Disposal of subsidiaries and associates 1,154 0 0 1,154
Purchase of property and equipment (1,292) (255) (246) (1,793)
Disposal of property and equipment 298 47 154 499
Net (investment in) / divestment of financial investments available-for-sale 90 433 1,200 1,723
Net cash flow from / (used in) investing activities 3,106 225 1,108 4,439
Cash flow from / (used in) financing activities
Net money market paper issued / (repaid) 17,526 1,039 (1,644) 16,921
Net movements in treasury shares and own equity derivative activity (3,624) 0 0 (3,624)
Capital issuance 1 0 0 1
Capital repayment by par value reduction (631) 0 0 (631)
Dividends paid (3,214) 0 0 (3,214)
Issuance of long-term debt, including financial liabilities designated at fair value 79,358 10,881 7,436 97,675
Repayment of long-term debt, including financial liabilities designated at fair value (48,959) (447) (10,545) (59,951)
Increase in minority interests 0 85 1,246 1,331
Dividend payments to / purchase from minority interests 0 2,441 (3,513) (1,072)
Net activity in investments in subsidiaries (8,246) 3,055 5,191 0
Net cash flow from / (used in) financing activities 32,211 17,054 (1,829) 47,436
Effects of exchange rate differences 388 (1,871) (634) (2,117)
Net increase / (decrease) in cash equivalents 34,000 598 10,450 45,048
Cash and cash equivalents, beginning of the year 68,548 13,531 8,963 91,042
Cash and cash equivalents, end of the year 102,548 14,129 19,413 136,090
Cash and cash equivalents comprise:
Cash and balances with central banks 2,660 78 757 3,495
Money market paper 2 73,431 11,488 2,225 87,144
Due from banks with original maturity of less than three months 26,457 2,563 16,431 45,451
Total 102,548 14,129 19,413 136,090
1 UBS AG Parent Bank prepares its financial statements in accordance with Swiss banking law requirements. For the purpose of this disclosure, the accounts have been adjusted to IFRS. 2 Money market paper is included in the Balance sheet under Trading portfolio assets and Financial investments available-for-sale. CHF 7,183 million was pledged at 31 December 2006.

211
Note 42 Additional Disclosures Required under US GAAP and SEC Rules (continued)
Note 42.6 Supplemental Guarantor Information (continued)
42.6 Supplemental Guarantor Consolidating Income StatementCHF millionFor the year ended 31 December 2005
UBS AGParent Bank 1
UBSAmericas Inc. Subsidiaries
Consolidatingentries UBS Group
Operating income
Interest income 39,779 27,782 20,729 (29,004) 59,286
Interest expense (33,892) (24,803) (20,067) 29,004 (49,758)
Net interest income 5,887 2,979 662 0 9,528
Credit loss (expense) / recovery 370 (3) 8 0 375
Net interest income after credit loss expense 6,257 2,976 670 0 9,903
Net fee and commission income 9,670 7,420 4,346 0 21,436
Net trading income 7,453 (123) 666 0 7,996
Income from subsidiaries (675) 0 0 675 0
Other income 2,635 476 (1,989) 0 1,122
Revenues from industrial holdings 0 0 675 0 675
Total operating income 25,340 10,749 4,368 675 41,132
Operating expenses
Personnel expenses 9,962 6,587 3,599 0 20,148
General and administrative expenses 2,330 2,667 1,635 0 6,632
Depreciation of property and equipment 988 140 133 0 1,261
Amortization of other intangible assets 24 70 37 0 131
Goods and materials purchased 0 0 283 0 283
Total operating expenses 13,304 9,464 5,687 0 28,455
Operating profit from continuing operations before tax 12,036 1,285 (1,319) 675 12,677
Tax expense / (benefit) 1,712 1,079 (320) 0 2,471
Net profit / (loss) from continuing operations 10,324 206 (999) 675 10,206
Net profit / (loss) from discontinued operations 3,705 0 779 0 4,484
Net profit / (loss) 14,029 206 (220) 675 14,690
Net profit / (loss) attributable to minority interests 0 122 539 0 661
Net profit / (loss) attributable to UBS shareholders 14,029 84 (759) 675 14,029
Net profit / (loss) US GAAP 2 14,490 (891) (1,247) 0 12,352
1 UBS AG Parent Bank prepares its financial statements in accordance with Swiss banking law requirements. For the purpose of this disclosure, the accounts have been adjusted to IFRS. 2 Refer to Note 41 for a description of the differences between IFRS and US GAAP.

212
Financial StatementsNotes to the Financial Statements
Supplemental Guarantor Consolidating Balance Sheet
CHF millionAs of 31 December 2005
UBS AG 1 Parent Bank 1
UBS Americas Inc. Subsidiaries
Consolidating entries UBS Group
Assets
Cash and balances with central banks 2,712 5 2,642 0 5,359
Due from banks 127,321 14,684 156,999 (265,360) 33,644
Cash collateral on securities borrowed 98,105 257,943 118,415 (186,028) 288,435
Reverse repurchase agreements 240,762 162,069 284,360 (282,759) 404,432
Trading portfolio assets 299,750 174,707 24,840 0 499,297
Trading portfolio assets pledged as collateral 79,333 36,956 38,470 0 154,759
Positive replacement values 330,894 6,656 158,514 (162,282) 333,782
Financial assets designated at fair value 2,186 737 (1,770) 0 1,153
Loans 299,518 41,901 33,987 (95,496) 279,910
Financial investments available-for-sale 3,198 910 2,443 0 6,551
Accrued income and prepaid expenses 5,720 3,135 4,877 (4,814) 8,918
Investments in associates 31,250 173 1,974 (30,441) 2,956
Property and equipment 5,462 592 3,369 0 9,423
Goodwill and other intangible assets 641 11,095 1,750 0 13,486
Other assets 7,509 3,758 7,468 (2,492) 16,243
Total assets 1,534,361 715,321 838,338 (1,029,672) 2,058,348
Liabilities
Due to banks 181,592 126,834 81,262 (265,360) 124,328
Cash collateral on securities lent 85,369 50,395 110,202 (186,028) 59,938
Repurchase agreements 132,073 360,932 268,262 (282,759) 478,508
Trading portfolio liabilities 113,171 69,460 6,000 0 188,631
Negative replacement values 337,172 7,274 155,499 (162,282) 337,663
Financial liabilities designated at fair value 93,207 0 24,194 0 117,401
Due to customers 434,675 63,243 64,485 (95,496) 466,907
Accrued expenses and deferred income 10,439 7,494 5,672 (4,814) 18,791
Debt issued 87,267 19,496 53,947 0 160,710
Other liabilities 10,409 3,594 42,326 (2,492) 53,837
Total liabilities 1,485,374 708,722 811,849 (999,231) 2,006,714
Equity attributable to UBS shareholders 48,987 6,485 18,984 (30,441) 44,015
Minority interests 0 114 7,505 0 7,619
Total equity 48,987 6,599 26,489 (30,441) 51,634
Total liabilities and equity 1,534,361 715,321 838,338 (1,029,672) 2,058,348
Total shareholders’ equity – US GAAP 2 33,028 8,415 20,173 0 61,616
1 UBS AG Parent Bank prepares its financial statements in accordance with Swiss banking law requirements. For the purpose of this disclosure, the accounts have been adjusted to IFRS. 2 Refer to Note 41 for a description of the differences between IFRS and US GAAP.
Note 42 Additional Disclosures Required under US GAAP and SEC Rules (continued)
Note 42.6 Supplemental Guarantor Information (continued)

213
Note 42 Additional Disclosures Required under US GAAP and SEC Rules (continued)
Note 42.6 Supplemental Guarantor Information (continued)
Note 42.6 Supplemental Guarantor Consolidating Cash Flow StatementCHF millionFor the year ended 31 December 2005
UBS AGParent Bank 1
UBSAmericas Inc. Subsidiaries UBS Group
Net cash flow from / (used in) operating activities (29,118) (15,771) (18,318) (63,207)
Cash flow from / (used in) investing activities
Investments in subsidiaries and associates (1,540) 0 0 (1,540)
Disposal of subsidiaries and associates 3,240 0 0 3,240
Purchase of property and equipment (1,153) (155) (584) (1,892)
Disposal of property and equipment 71 6 193 270
Net (investment in) / divestment of financial investments available-for-sale (4,667) (40) 2,220 (2,487)
Net cash flow from / (used in) investing activities (4,049) (189) 1,829 (2,409)
Cash flow from / (used in) financing activities
Net money market paper issued / (repaid) 22,698 615 (92) 23,221
Net movements in treasury shares and own equity derivative activity (2,416) 0 0 (2,416)
Capital issuance 2 0 0 2
Dividends paid (3,105) 0 0 (3,105)
Issuance of long-term debt, including financial liabilities designated at fair value 50,587 14,635 11,085 76,307
Repayment of long-term debt, including financial liabilities designated at fair value (17,780) (753) (11,924) (30,457)
Increase in minority interests 0 8 1,564 1,572
Dividend payments to / purchase from minority interests 0 (175) (400) (575)
Net activity in investments in subsidiaries (1,591) (214) 1,805 0
Net cash flow from / (used in) financing activities 48,395 14,116 2,038 64,549
Effects of exchange rate differences 3,283 (720) 2,455 5,018
Net increase / (decrease) in cash equivalents 18,511 (2,564) (11,996) 3,951
Cash and cash equivalents, beginning of the year 50,037 16,095 20,959 87,091
Cash and cash equivalents, end of the year 68,548 13,531 8,963 91,042
Cash and cash equivalents comprise:
Cash and balances with central banks 2,712 5 2,642 5,359
Money market paper 2 47,838 8,991 997 57,826
Due from banks with original maturity of less than three months 17,998 4,535 5,324 27,857
Total 68,548 13,531 8,963 91,042
1 UBS AG Parent Bank prepares its financial statements in accordance with Swiss banking law requirements. For the purpose of this disclosure, the accounts have been adjusted to IFRS. 2 Money market paper is included in the Balance sheet under Trading portfolio assets and Financial investments available-for-sale. CHF 4,744 million was pledged at 31 December 2005.
Guarantee of other securitiesUBS AG, acting through a wholly owned finance subsidiaries, issued the following trust preferred securities:
USD billion, unless otherwise indicated Outstanding as of 31.12.06
Issuing entity Type of security Date issued Interest (%) Amount
UBS Preferred Funding Trust I Trust preferred securities October 2000 8.622 1.5
UBS Preferred Funding Trust II Trust preferred securities 1 June 2001 7.247 0.5
UBS Preferred Funding Trust IVFloating rate noncumulative trust preferred securities May 2003
one-month LIBOR + 0.7% 0.3
UBS Preferred Funding Trust V Trust preferred securities May 2006 6.243 1.0
1 In June 2006, USD 300 million (at 7.25%) of Trust preferred securities also issued in June 2001 were redeemed.
UBS AG has fully and unconditionally guaranteed these se-curities. UBS’s obligations under the trust preferred securities guarantee are subordinated to the prior payment in full of the deposit liabilities of UBS and all other liabilities of UBS. At
31 December 2006, the amount of senior liabilities of UBS to which the holders of the subordinated debt securities would be subordinated is approximately CHF 2,324 billion.

214
Note 42 Additional Disclosures Required under US GAAP and SEC Rules (continued)
Note 42.7 Pro-Forma Effect of the Fair Value Method of Accounting on US GAAP Net Profit
The following table presents US GAAP Net profit and earn-ings per share for the year ended 31 December 2004 as if UBS had applied the fair value method of accounting for its share-based compensation plans in that period. With the
adoption of SFAS 123-R on 1 January 2005, UBS adopted the fair value method of accounting for its share-based com-pensation plans using the modified prospective method. See Note 41.1h) for details.
CHF million, except per share data 31.12.04
Net profit under US GAAP, as reported 8,818
Add: Equity-based employee compensation expense included in reported net income, net of tax 1,209
Deduct: Total equity-based employee compensation expense determined under the fair-value-based method for all awards, net of tax (1,717)
Net profit, pro-forma 8,310
Earnings per share
Basic, as reported 4.28
Basic, pro-forma 4.03
Diluted, as reported 4.07
Diluted, pro-forma 3.84
Financial StatementsNotes to the Financial Statements

UBS AG (Parent Bank)

216
UBS AG (Parent Bank) Table of Contents
UBS AG (Parent Bank)Table of Contents
Parent Bank Review 217
Financial Statements 218
Income Statement 218
Balance Sheet 219
Statement of Appropriation of Retained Earnings 220
Notes to the Financial Statements 221
Additional Income Statement Information 222
Net Trading Income 222
Extraordinary Income and Expenses 222
Additional Balance Sheet Information 223
Allowances and Provisions 223
Statement of Shareholders’ Equity 223
Share Capital 223
Off-Balance Sheet and Other Information 224
Assets Pledged or Assigned as Security for Own Obligations,
Assets Subject to Reservation of Title 224
Commitments and Contingent Liabilities 224
Derivative Instruments 224
Fiduciary Transactions 225
Due to UBS Pension Plans, Loans to Corporate Bodies / Related Parties 225
Personnel 225
Report of the Statutory Auditors 226
Report of the Auditors of the Conditional Capital Increase 227

217
Income Statement
The Parent Bank UBS AG Net profit decreased by CHF 6,939 million from CHF 13,497 million to CHF 6,558 million. In-come from investments in associated companies decreased to CHF 1,910 million from CHF 3,943 million in 2005 mainly due to lower dividend distributions received. The decrease in Extraordinary income and increase in Extraordinary expenses are explained on page 222.
Balance Sheet
Total assets increased by CHF 226 billion to CHF 1,586 billion at 31 December 2006. This movement is mainly caused by increased positions in Money market paper of CHF 26 billi-on, Due from banks of CHF 8 billion and Due from custo-mers of CHF 131 billion (of which CHF 88 billion relates to Dillon Read Capital Management and the remaining amount mainly relates to current and margin accounts). A consider-able increase resulted as well in Trading balances in securities and precious metals of CHF 53 billion (thereof debt instru-ments CHF 12 billion, equities CHF 33 billion and precious metals CHF 8 billion). The investments in associated compa-nies expanded by CHF 5 billion which is mainly due to new investments or additional financing of subsidiaries abroad of Banco Pactual S.A., UBS VIII Wilmington (as “funding unit”), Dillon Read Capital Management and Global Futures and Options Business of ABN AMRO but also includes the reduc-tion of investments in associated companies due to the sale of Motor-Columbus.
Parent Bank Review
UBS AG (Parent Bank) Table of Contents
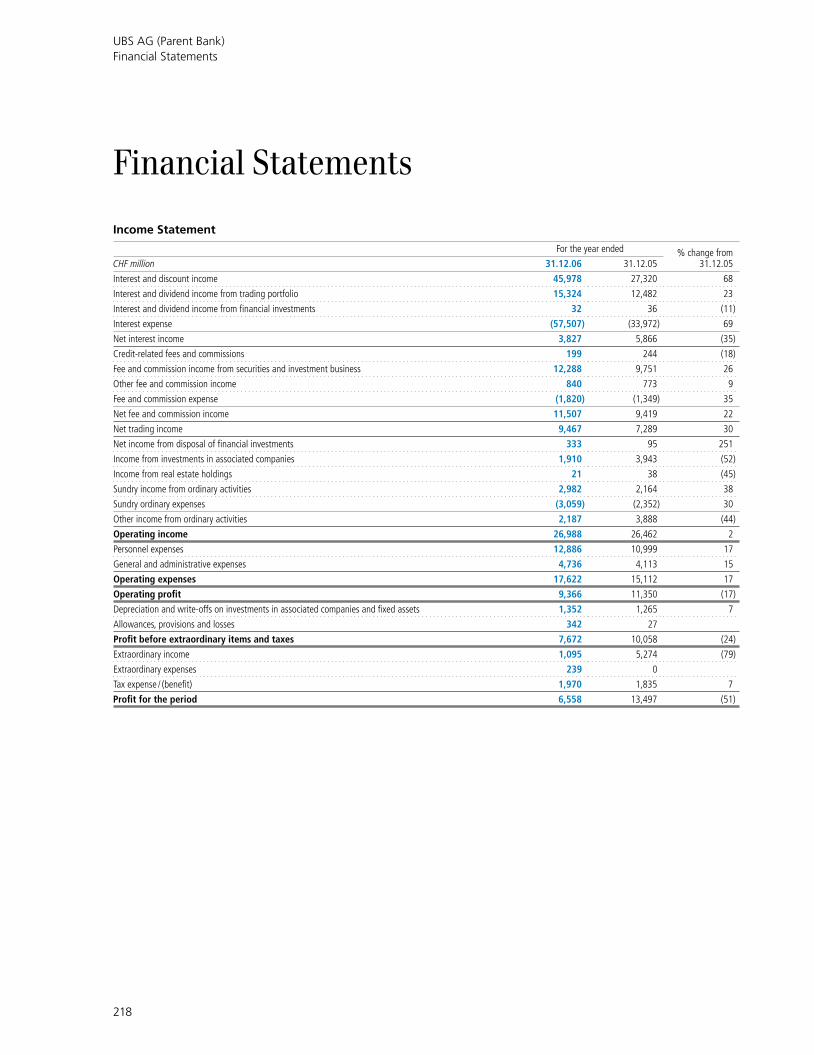
218
Income Statement
For the year ended % change from31.12.05CHF million 31.12.06 31.12.05
Interest and discount income 45,978 27,320 68
Interest and dividend income from trading portfolio 15,324 12,482 23
Interest and dividend income from financial investments 32 36 (11)
Interest expense (57,507) (33,972) 69
Net interest income 3,827 5,866 (35)
Credit-related fees and commissions 199 244 (18)
Fee and commission income from securities and investment business 12,288 9,751 26
Other fee and commission income 840 773 9
Fee and commission expense (1,820) (1,349) 35
Net fee and commission income 11,507 9,419 22
Net trading income 9,467 7,289 30
Net income from disposal of financial investments 333 95 251
Income from investments in associated companies 1,910 3,943 (52)
Income from real estate holdings 21 38 (45)
Sundry income from ordinary activities 2,982 2,164 38
Sundry ordinary expenses (3,059) (2,352) 30
Other income from ordinary activities 2,187 3,888 (44)
Operating income 26,988 26,462 2
Personnel expenses 12,886 10,999 17
General and administrative expenses 4,736 4,113 15
Operating expenses 17,622 15,112 17
Operating profit 9,366 11,350 (17)
Depreciation and write-offs on investments in associated companies and fixed assets 1,352 1,265 7
Allowances, provisions and losses 342 27
Profit before extraordinary items and taxes 7,672 10,058 (24)
Extraordinary income 1,095 5,274 (79)
Extraordinary expenses 239 0
Tax expense / (benefit) 1,970 1,835 7
Profit for the period 6,558 13,497 (51)
Financial Statements
UBS AG (Parent Bank) Financial Statements

219
Balance She et
CHF million 31.12.06 31.12.05% change from
31.12.05
Assets
Liquid assets 2,660 2,712 (2)
Money market paper 73,430 47,840 53
Due from banks 439,098 431,071 2
Due from customers 316,241 185,331 71
Mortgage loans 153,114 153,387 0
Trading balances in securities and precious metals 411,981 358,600 15
Financial investments 2,844 4,216 (33)
Investments in associated companies 27,076 22,016 23
Fixed assets 4,527 4,527 0
Accrued income and prepaid expenses 6,573 5,359 23
Positive replacement values 138,222 136,503 1
Other assets 9,975 7,980 25
Total assets 1,585,741 1,359,542 17
Total subordinated assets 5,852 6,094 (4)
Total amounts receivable from Group companies 657,919 557,355 18
Liabilities
Money market paper issued 69,861 52,335 33
Due to banks 556,136 482,134 15
Due to customers on savings and deposit accounts 80,883 86,997 (7)
Other amounts due to customers 508,609 406,724 25
Medium-term bonds 2,238 1,464 53
Bond issues and loans from central mortgage institutions 143,779 102,386 40
Accruals and deferred income 16,672 13,543 23
Negative replacement values 149,879 160,002 (6)
Other liabilities 10,471 5,648 85
Allowances and provisions 2,305 2,157 7
Share capital 211 871 (76)
General statutory reserve 8,295 7,927 5
Reserve for own shares 9,114 10,562 (14)
Other reserves 20,730 13,295 56
Profit for the period 6,558 13,497 (51)
Total liabilities 1,585,741 1,359,542 17
Total subordinated liabilities 21,907 16,022 37
Total amounts payable to Group companies 450,093 404,108 11

220
Statement of Appropriation of Retained Earnings
CHF million
The Board of Directors proposes to the Annual General Meeting the following appropriation:
Profit for the financial year 2006 as per the Parent Bank’s Income Statement 6,558
Appropriation to general statutory reserve 457
Appropriation to other reserves 1,519
Proposed dividends 4,582
Total appropriation 6,558
Dividend Distribution
The Board of Directors will recommend to the Annual General Meeting on 18 April 2007 that UBS should pay a dividend of CHF 2.20 per share of CHF 0.10 par value. If the dividend is
approved, the payment of CHF 2.20 per share, after deduction of 35% Swiss withholding tax, would be made on 23 April 2007 for shareholders who hold UBS shares on 18 April 2007.
UBS AG (Parent Bank) Financial Statements

221
Accounting Principles
The Parent Bank’s accounting policies are in compliance with Swiss banking law. The accounting policies are principally the same as for the Group Financial Statements outlined in Note 1, Summary of Significant Accounting Policies. Major differences between the Swiss banking law requirements and International Financial Reporting Standards are described in Note 40 to the Group Financial Statements. In addition, the following principles are applied for the Parent Bank:
Treasury sharesTreasury shares is the term used to describe when an enter-prise holds its own equity instruments. Under IFRS, treasury shares are presented in the balance sheet as a deduction from equity. No gain or loss is recognized in the income statement on the sale, issuance, acquisition, or cancellation of those shares. Consideration received or paid is presented in the Financial Statement as a change in equity.
Under Swiss law, treasury shares are classified in the ba-lance sheet as trading balances or as financial investments. Short positions are included in due to banks. Realized gains and losses on the sale, issuance or acquisition of treasury shares, and unrealized gains or losses from re-measurement of treasury shares in the trading portfolio to market value are included in the income statement. Treasury shares included in financial investments are carried at the lower of cost and market value.
Foreign currency translationAssets and liabilities of foreign branches are translated into CHF at the exchange rates at the balance sheet date, while income and expense items are translated at weighted average rates for the period. Exchange differences arising on the trans-lation of each of these foreign branches are credited to a pro-vision account (other liabilities) in case of a gain, while any losses are debited first to that provision account until such provision is fully utilized, and secondly to profit and loss.
Investments in associated companiesInvestments in associated companies are equity interests which are held for the purpose of the Parent Bank’s business activities or for strategic reasons. They are carried at cost less impairment, if applicable.
Property and equipmentBank buildings and other real estate are carried at cost less accumulated depreciation. Depreciation of computer and
telecommunications equipment, other office equipment, fix-tures and fittings is recognized on a straight-line basis over the estimated useful lives of the related assets. The useful lives of Property and equipment are summarized in Note 1, Summary of Significant Accounting Policies, of the Group Financial Statements.
Extraordinary income and expensesCertain items of income and expense appear as extraordina-ry within the Parent Bank Financial Statements, whereas in the Group Financial Statements they are considered to be operating income or expenses and appear within the ap-propriate income or expense category, or they are included in net profit from discontinued operations, if required.
Equity participation plansUnder IFRS, UBS recognizes the fair value of stock and stock option awards determined at the grant date as compensati-on expense over the required service period. Equity-settled awards are classified as equity instruments and are generally not re-measured subsequently. Cash settled awards are clas-sified as liabilities and re-measured to fair value at each ba-lance sheet date.
Under Swiss law, employee stock awards are accrued over the performance period, while employee stock option awards are recognized in the year of grant. Equity- and cash-settled awards are classified as liabilities. Stock option awards are re-measured at their intrinsic value.
ComparabilityFor 2005, current income taxes of CHF 2,092 million have been reclassified from Allowances and provisions to Accruals and deferred income and CHF 2,118 million of intra-group revenue transfers has been reclassified from Sundry income from ordinary activities to Sundry ordinary expenses to con-cur with the current year‘s gross presentation of revenue transfers within subsidiaries.
UBS holds investments in financial assets in order to economically hedge fair value movements on certain liabi-lities. These financial assets are included in Trading balan-ces in securities and precious metals. Where such invest-ments were consolidated entities under IFRS, they were measured at the lower of cost or market until 2005. Net trading income includes gains of CHF 346 million related to prior years‘ fair value movements on those invest-ments.
Notes to the Financial Statements
UBS AG (Parent Bank) Notes to the Financial Statements

222
Net Trading Income
For the year ended % change from
CHF million 31.12.06 31.12.05 31.12.05
Equities 5,761 3,068 88
Fixed income 1 1,629 1,540 6
Foreign exchange and other 2,077 2,681 (23)
Total 9,467 7,289 30
1 Includes commodities trading income.
Additional Income Statement Information
Extraordinary Income and Expenses
Extraordinary income includes a CHF 678 million gain on the sale of Motor-Columbus compared to a gain on the sale of Private Banks & GAM of CHF 3,183 million in 2005. In addi-tion, amounts in 2006 include a write-up of investments in associated companies of CHF 223 million (2005: CHF 1,263 million), releases of provisions of CHF 167 million (2005:
CHF 452 million). Amounts in 2005 include a gain of CHF 370 million resulting from a merger with a subsidiary.
Extraordinary expenses include CHF 202 million related to the under-accrual of unused vacation, sabbatical leave and service anniversary awards in prior years and a CHF 37 milli-on loss related to the merger with a subsidiary.
UBS AG (Parent Bank) Notes to the Financial Statements

223
Additional Balance Sheet Information
Allowances and Provisions
CHF millionBalance at31.12.05
Provisions applied in
accordance with their
specified purpose
Recoveries, doubtful interest,
currency translation differences
Provisions released
to income
New provisions
charged to income
Balance at31.12.06
Default risks (credit and country risk) 1,836 (439) 67 (513) 347 1,298
Trading portfolio risks 3,880 (225) (811) 2,844
Litigation risks 328 (135) (124) (32) 256 293
Operational risks 1,662 (47) 97 (348) 537 1,901
Deferred taxes 19 (17) 32 34
Total allowances and provisions 7,725 (621) (202) (1,704) 1,172 6,370
Allowances deducted from assets 5,568 4,065
Total provisions as per balance sheet 2,157 2,305
Statement of Shareholders’ Equity
CHF million Share capital
General statutory reserves:
Share premium
General statutory reserves:
Retained earningsReserves for own shares Other reserves
Total shareholders’
equity (before distribution
of profit)
As of 31.12.04 and 1.1.05 901 6,213 1,359 9,056 21,739 39,268
Cancellation of own shares (32) (3,511) (3,543)
Capital increase 2 33 35
Increase in reserves 322 (322)
Prior year dividend (3,105) (3,105)
Profit for the period 13,497 13,497
Changes in reserves for own shares 1,506 (1,506)
As of 31.12.05 and 1.1.06 871 6,246 1,681 10,562 26,792 46,152
Par value reduction (631) 35 (596)
Cancellation of own shares (30) (3,997) (4,027)
Capital increase 1 34 35
Increase in reserves 334 (334)
Prior year dividend (3,214) (3,214)
Profit for the period 6,558 6,558
Changes in reserves for own shares (1,448) 1,448
As of 31.12.06 211 6,280 2,015 9,114 27,288 44,908
Share Capital
Par value Ranking for dividends
No. of shares Capital in CHF No. of shares Capital in CHF
As of 31.12.06
Issued and paid up 2,105,273,286 210,527,329 2,082,673,286 208,267,329
Conditional share capital 151,437,410 15,143,741
As of 31.12.05
Issued and paid up 2,177,265,044 870,906,018 2,109,495,044 843,798,018
Conditional share capital 3,647,002 1,458,801
On 31 December 2006, a maximum of 1,437,410 shares can be issued against the future exercise of options from former PaineWebber employee option plans. These shares are shown as conditional share capital in the table above. In addition, during 2006, shareholders approved the creation of conditional capital of up to a maximum of 150 million shares to fund UBS‘s employee share option programs. As of 31 December 2006, no shares have been issued under this program.

224
Off-Balance Sheet and Other Information
Assets Pledged or Assigned as Security for Own Obligations, Assets Subject to Reservation of Title
31.12.06 31.12.05 Change in %
CHF million Book value Effective liability Book value Effective liability Book value Effective liability
Money market paper 37,471 9,035 26,513 6,120 41 48
Mortgage loans 81 38 64 38 27
Securities 89,869 41,306 102,330 48,580 (12) (15)
Total 127,421 50,379 128,907 54,738 (1) (8)
Financial assets are pledged in securities borrowing and lending transactions, in repurchase and reverse repurchase trans-actions, under collateralized credit lines with central banks, against loans from mortgage institutions and for security deposits relating to stock exchange and clearinghouse memberships.
Commitments and Contingent Liabilities
CHF million 31.12.06 31.12.05% change from
31.12.05
Contingent liabilities 189,627 184,665 3
Irrevocable commitments 115,364 68,071 69
Liabilities for calls on shares and other equities 125 130 (4)
Confirmed credits 2,133 2,004 6
Derivative Instruments
31.12.06 31.12.05
CHF million PRV 1 NRV 2
Notional amountCHF bn PRV NRV
Notional amountCHF bn
Interest rate contracts 176,765 175,394 29,558 222,508 221,437 20,656
Credit derivative contracts 29,026 31,781 2,824 15,811 16,427 1,557
Foreign exchange contracts 76,459 70,899 6,134 57,705 58,600 4,757
Precious metal contracts 4,472 4,168 121 3,616 3,444 82
Equity / Index contracts 22,437 39,016 745 25,663 49,924 706
Commodities contracts, excluding precious metals contracts 11,459 11,017 359 10,677 9,647 194
Total derivative instruments 320,618 332,275 39,741 335,980 359,479 27,952
Replacement value netting 182,396 182,396 199,477 199,477
Replacement values after netting 138,222 149,879 136,503 160,002
1 PRV: Positive replacement value. 2 NRV: Negative replacement value.
UBS AG (Parent Bank) Notes to the Financial Statements

225
Fiduciary Transactions
CHF million 31.12.06 31.12.05% change from
31.12.05
Deposits:
with other banks 41,075 37,171 11
with Group banks 1,650 1,382 19
Total 42,725 38,553 11
Due to UBS Pension Plans, Loans to Corporate Bodies / Related Parties
CHF million 31.12.06 31.12.05% change from
31.12.05
Due to UBS pension plans and UBS debt instruments held by pension plans 790 719 10
Securities borrowed from pension plans 7,169 2,222 223
Loans to directors, senior executives and auditors 1 19 21 (10)
1 Loans to directors, senior executives and auditors are loans to members of the Board of Directors, the Group Executive Board and the Group’s official auditors under Swiss company law. This also includes loans to companies which are controlled by these natural or legal persons. There are no loans to the auditors.
Personnel
Parent Bank personnel was 42,443 on 31 December 2006 and 38,189 on 31 December 2005.

226
UBS AG (Parent Bank) Report of the Statutory Auditors

227
UBS AG (Parent Bank) Report of the Auditors of the Conditional Capital Increase

228

Additional Disclosure Required under SEC Regulations

230
Additional Disclosure Required under SEC Regulations Table of Contents
Additional Disclosure Required under SEC RegulationsTable of Contents
A – Introduction 231
B – Selected Financial Data 231
Balance Sheet Data 233
US GAAP Income Statement Data 234
US GAAP Balance Sheet Data 235
Ratio of Earnings to Fixed Charges 235
C – Information on the Company 235
Property, Plant and Equipment 235
D – Information Required by Industry Guide 3 236
Selected Statistical Information 236
Average Balances and Interest Rates 236
Analysis of Changes in Interest Income and Expense 238
Deposits 240
Short-term Borrowings 241
Contractual Maturities of the Investments in Debt Instruments 242
Due from Banks and Loans (gross) 243
Due from Banks and Loan Maturities (gross) 244
Impaired and Non-Performing Loans 245
Cross-border Outstandings 246
Summary of Movements in Allowances and Provisions for Credit Losses 247
Allocation of the Allowances and Provisions for Credit Losses 249
Due from Banks and Loans by Industry Sector (gross) 250
Loss History Statistics 251

231
A – Introduction
The following pages contain additional disclosure about UBS Group which is required under SEC regulations.
Unless otherwise stated, UBS’s Financial Statements have been prepared in accordance with International Financial Reporting Standards (IFRS) and are denominated in Swiss
francs, or CHF, the reporting currency of the Group. Certain financial information has also been presented in accordance with United States Generally Accepted Accounting Principles (US GAAP).
Year ended 31 December High LowAverage rate 1
(USD per 1 CHF) At period end
2002 0.7229 0.5817 0.6453 0.7229
2003 0.8189 0.7048 0.7493 0.8069
2004 0.8843 0.7601 0.8059 0.8712
2005 0.8721 0.7544 0.8039 0.7606
2006 0.8396 0.7575 0.8034 0.8200
Month High Low
September 2006 0.8125 0.7949
October 2006 0.8049 0.7842
November 2006 0.8357 0.7958
December 2006 0.8396 0.8161
January 2007 0.8247 0.7978
February 2007 0.8204 0.7980
1 The average of the noon buying rates on the last business day of each full month during the relevant period.
B – Selected Financial Data
The tables below set forth, for the periods and dates indica-ted, information concerning the noon buying rate for the Swiss franc, expressed in United States dollars, or USD, per one Swiss franc. The noon buying rate is the rate in New York City for cable transfers in foreign currencies as certified
for customs purposes by the Federal Reserve Bank of New York.
On 28 February 2007 the noon buying rate was 0.8204 USD per 1 CHF.

232
B – Selected Financial Data (continued)
For the year ended
CHF million, except where indicated 31.12.06 31.12.05 31.12.04 31.12.03 31.12.02
Income statement data
Interest income 87,401 59,286 39,228 40,045 39,896
Interest expense (80,880) (49,758) (27,484) (27,784) (29,417)
Net interest income 6,521 9,528 11,744 12,261 10,479
Credit loss (expense) / recovery 156 375 241 (102) (112)
Net interest income after credit loss (expense) / recovery 6,677 9,903 11,985 12,159 10,367
Net fee and commission income 25,881 21,436 18,506 16,673 17,481
Net trading income 13,318 7,996 4,902 3,670 5,381
Other income 1,596 1,122 853 280 13
Income from Industrial Holdings 693 675 640 535 335
Total operating income 48,165 41,132 36,886 33,317 33,577
Total operating expenses 33,498 28,455 26,844 26,000 30,135
Operating profit from continuing operations before tax 14,667 12,677 10,042 7,317 3,442
Tax expense 2,786 2,471 2,155 1,403 566
Net profit from continuing operations 11,881 10,206 7,887 5,914 2,876
Net profit from discontinued operations 869 4,484 583 339 489
Net profit 12,750 14,690 8,470 6,253 3,365
Net profit attributable to minority interests 493 661 454 349 348
Net profit attributable to UBS shareholders 12,257 14,029 8,016 5,904 3,017
Cost / income ratio (%) 1 69.7 70.1 73.2 76.8 84.7
Per share data (CHF)
Basic earnings per share 2 6.20 6.97 3.89 2.72 1.30
Diluted earnings per share 2 5.95 6.68 3.70 2.59 1.27
Operating profit before tax per share 7.42 6.29 4.88 3.37 1.48
Cash dividends declared per share (CHF) 3 2.20 1.60 1.50 1.30 1.00
Cash dividend equivalent in USD 3 1.26 1.27 1.00 0.73
Dividend payout ratio (%) 3 35.5 23.0 38.6 47.8 76.9
Rates of return (%)
Return on equity attributable to UBS shareholders 4 28.2 39.7 25.8 18.0 8.3
Return on average equity 26.3 37.2 23.8 16.9 7.7
Return on average assets 0.51 0.67 0.44 0.38 0.20
1 Operating expenses / operating income before credit loss expense for Financial Businesses. 2 For EPS calculation, see Note 8 to the Financial Statements. 3 In July 2006, a par value reduction of CHF 0.60 per share was distributed, after which the UBS share was split 2-for-1. Dividends are normally declared and paid in the year subsequent to the reporting period. On a post-split basis, a dividend of CHF 1.60 per share was paid on 24 April 2006, CHF 1.50 on 26 April 2005, CHF 1.30 on 20 April 2004 and CHF 1.00 on 23 April 2003. A dividend of CHF 2.20 per share will be paid on 23 April 2007, subject to approval by shareholders at the Annual General Meeting. The USD amount per share will be determined on 19 April 2007. 4 Net profit attributable to UBS shareholders / average equity attributable to UBS shareholders less distributions.
Additional Disclosure Required under SEC Regulations

233
B – Selected Financial Data (continued)
CHF million, except where indicated 31.12.06 31.12.05 31.12.04 31.12.03 31.12.02
Balance sheet data
Total assets 2,396,511 2,058,348 1,737,171 1,554,032 1,350,905
Equity attributable to UBS shareholders 49,686 44,015 33,632 33,350 35,701
Average equity to average assets (%) 1.93 1.79 1.84 2.23 2.65
Market capitalization 154,222 131,949 103,638 95,401 79,448
Shares
Registered ordinary shares 2,105,273,286 2,177,265,044 2,253,716,354 2,366,093,528 2,512,595,356
Treasury shares 164,475,699 208,519,748 249,326,620 273,482,454 282,461,382
BIS capital ratios
Tier 1 (%) 11.9 12.8 11.8 11.8 11.2
Total BIS (%) 14.7 14.1 13.6 13.4 13.7
Risk-weighted assets 341,892 310,409 264,832 252,398 238,790
Invested assets (CHF billion) 2,989 2,652 2,217 2,098 1,959
Personnel Financial Businesses (full-time equivalents)
Switzerland 27,018 26,028 25,990 26,662 27,972
Europe (excluding Switzerland) 12,687 11,007 10,764 9,906 10,009
Americas 30,819 27,136 26,232 25,511 27,350
Asia Pacific 7,616 5,398 4,438 3,850 3,730
Total 78,140 69,569 67,424 65,929 69,061
Long-term ratings 1
Fitch, London AA+ AA+ AA+ AA+ AAA
Moody’s, New York Aa2 Aa2 Aa2 Aa2 Aa2
Standard & Poor’s, New York AA+ AA+ AA+ AA+ AA+
1 See the Handbook 2006/2007 for information about the nature of these ratings.
Balance Sheet Data
CHF million 31.12.06 31.12.05 31.12.04 31.12.03 31.12.02
Assets
Total assets 2,396,511 2,058,348 1,737,171 1,554,032 1,350,905
Due from banks 50,426 33,644 35,419 31,959 32,777
Cash collateral on securities borrowed 351,590 288,435 210,606 206,519 139,049
Reverse repurchase agreements 405,834 404,432 357,164 320,499 294,067
Trading portfolio assets 627,036 499,297 389,487 354,558 261,080
Trading portfolio assets pledged as collateral 251,478 154,759 159,115 120,759 110,365
Positive replacement values 328,445 333,782 284,577 248,206 247,421
Loans 312,521 279,910 241,803 220,083 211,707
Liabilities
Due to banks 203,689 124,328 120,026 129,084 83,561
Cash collateral on securities lent 63,088 59,938 51,301 48,272 36,870
Repurchase agreements 545,480 478,508 422,587 415,863 366,858
Trading portfolio liabilities 204,773 188,631 171,033 143,957 106,453
Negative replacement values 332,533 337,663 303,712 254,768 247,206
Financial liabilities designated at fair value 145,687 117,401 65,756 35,286 14,516
Due to customers 570,565 466,907 386,320 351,583 306,876
Debt issued 190,143 160,710 117,856 88,874 115,798
Equity attributable to UBS shareholders 49,686 44,015 33,632 33,350 35,701

234
B – Selected Financial Data (continued)
US GAAP Income Statement Data
For the year ended
CHF million 31.12.06 31.12.05 31.12.04 31.12.03 31.12.02
Operating income
Interest income 87,380 58,791 38,991 39,802 39,612
Interest (expense) (80,463) (49,488) (27,245) (27,628) (29,334)
Net interest income 6,917 9,303 11,746 12,174 10,278
Credit loss (expense) / recovery 156 375 334 (74) (112)
Net interest income after credit loss (expense) / recovery 7,073 9,678 12,080 12,100 10,166
Net fee and commission income 25,881 21,436 18,435 16,606 17,481
Net trading income 12,548 7,012 4,795 3,944 5,870
Other income 1,742 747 1,158 382 (65)
Total operating income 47,244 38,873 36,468 33,032 33,452
Operating expenses
Personnel expenses 23,771 19,542 17,970 17,234 18,224
General and administrative expenses 7,944 6,469 6,420 5,917 6,953
Depreciation of property and equipment 1,277 1,272 1,295 1,368 1,573
Amortization of other intangible assets 143 119 103 110 1,443
Total operating expenses 33,135 27,402 25,788 24,629 28,193
Operating profit from continuing operations before tax 14,109 11,471 10,680 8,403 5,259
Tax expense 2,932 2,995 1,966 1,790 456
Minority interests (95) (138) (322) (350) (331)
Net profit from continuing operations 11,082 8,338 8,392 6,263 4,472
Net profit from discontinued operations 404 3,976 420 250 435
Change in accounting principle: cumulative effect of adoption of “AICPA Audit and Accounting Guide, Audits of Investment Companies” on certain financial investments, net of tax 639
Cumulative adjustment of accounting for certain equity-based compensation plans as cash settled, net of tax 6
Cumulative adjustment due to the adoption of SFAS 123 (revised 2004), “Share-Based Payment” on 1 January 2005, net of tax 38
Net profit / (loss) 11,486 12,352 8,818 6,513 5,546
Additional Disclosure Required under SEC Regulations

235
B – Selected Financial Data (continued)
US GAAP Balance Sheet Data
CHF million 31.12.06 31.12.05 31.12.04 31.12.03 31.12.02
Assets
Total assets 2,634,628 2,279,257 1,903,239 1,699,060 1,296,991
Due from banks 51,416 33,427 35,286 31,758 32,481
Cash collateral on securities borrowed 351,461 288,304 208,778 203,645 139,073
Reverse repurchase agreements 361,571 359,883 357,164 320,499 294,086
Trading portfolio assets 627,160 505,717 378,281 349,023 268,263
Trading portfolio assets pledged as collateral 401,176 272,494 230,223 195,469 173,582
Positive replacement values 1 332,128 337,105 284,468 248,924 83,757
Loans 316,141 277,471 238,604 220,142 211,755
Goodwill 28,530 28,104 26,977 26,775 28,127
Other intangible assets 2,340 1,665 1,722 1,174 1,222
Other assets 84,027 75,992 101,121 64,434 21,367
Liabilities
Due to banks 206,985 127,252 119,021 127,385 83,178
Cash collateral on securities lent 60,878 59,897 47,548 46,151 36,870
Repurchase agreements 520,351 464,957 423,513 415,863 366,858
Trading portfolio liabilities 236,929 201,212 190,907 149,380 117,721
Obligation to return securities received as collateral 49,088 67,430 12,950 13,071 16,308
Negative replacement values 1 439,495 432,290 360,345 326,136 132,354
Due to customers 597,139 481,784 397,157 352,364 306,872
Accrued expenses and deferred income 22,131 19,106 15,229 14,072 15,729
Debt issued 306,994 240,212 164,744 123,259 129,527
Shareholders’ equity 64,523 61,616 52,359 52,865 55,267
1 Positive and negative replacement values represent the fair values of derivative instruments. From 2003 onwards they are presented on a gross basis under US GAAP.
Certain prior year US GAAP amounts have been reclassified to conform to the current year’s presentation.
Ratio of Earnings to Fixed Charges
The following table sets forth UBS’s ratio of earnings to fixed charges on a IFRS basis for the periods indicated. The ratios are calculated based on earnings from continuing operations. Ratios of earnings to combined fixed charges and preferred stock dividend requirements are not presented as there were no preferred share dividends in any of the periods indicated. The ratios are calculated on a US GAAP basis and are not materially different from the IFRS ratios for the periods presented.
For the year ended
31.12.06 31.12.05 31.12.04 31.12.03 31.12.02
IFRS 1.17 1.24 1.34 1.24 1.10
C – Information on the Company
Property, Plant and EquipmentAt 31 December 2006, UBS Financial Businesses operated about 1,135 business and banking locations worldwide, of which about 37% were in Switzerland, 49% in the Americas, 10% in the rest of Europe, Middle East and Africa and 4% in Asia-Pacific. 15% of the business and banking locations in Switzerland were owned directly by UBS, with the remainder, along with most of UBS’s offices outside Switzerland, being held under commercial leases.
At 31 December 2006, the Industrial Holdings segment operated about 42 business locations worldwide, of which 0% were in Switzerland, 55% in the rest of Europe, Middle East and Africa, 43% in the Americas and 2% in Asia-Pacific. 98% of the business locations worldwide were held under commercial leases.
These premises are subject to continuous maintenance and upgrading and are considered suitable and adequate for current and anticipated operations.

236
D – Information Required by Industry Guide 3
Selected Statistical InformationThe tables below set forth selected statistical information re-garding the Group’s banking operations extracted from the Financial Statements. Unless otherwise indicated, average balances for the years ended 31 December 2006, 31 Decem-
ber 2005 and 31 December 2004 are calculated from month-ly data. The distinction between domestic and foreign is ge-nerally based on the booking location. For loans, this method is not significantly different from an analysis based on the domicile of the borrower.
Average Balances and Interest Rates
The following table sets forth average interest-earning assets and average interest-bearing liabilities, along with the average rates, for the years ended 31 December 2006, 2005 and 2004.
31.12.06 31.12.05 31.12.04
CHF million, except where indicatedAveragebalance Interest
Averagerate (%)
Averagebalance Interest
Averagerate (%)
Averagebalance Interest
Averagerate (%)
Assets
Due from banks
Domestic 10,800 587 5.4 15,467 270 1.7 12,463 154 1.2
Foreign 29,814 1,490 5.0 25,497 1,334 5.2 23,843 397 1.7
Cash collateral on securities borrowed and reverse repurchase agreements
Domestic 27,147 1,333 4.9 33,012 1,079 3.3 17,969 457 2.5
Foreign 926,575 38,393 4.1 776,972 22,283 2.9 701,817 10,242 1.5
Trading portfolio assets
Domestic 17,976 651 3.6 15,545 457 2.9 10,122 336 3.3
Foreign taxable 707,432 31,433 4.4 580,763 23,619 4.1 513,922 18,908 3.7
Foreign non-taxable 4,438 127 2.9 3,390 58 1.7 2,309 27 1.2
Foreign total 711,870 31,560 4.4 584,153 23,677 4.1 516,231 18,935 3.7
Financial assets designated at fair value
Domestic 42 0 616 0 196 0
Foreign 2,325 70 3.0 691 26 3.8 0 0
Loans
Domestic 181,186 5,784 3.2 174,299 5,424 3.1 168,456 5,308 3.2
Foreign 106,491 6,284 5.9 91,290 3,531 3.9 68,393 2,126 3.1
Financial investments available-for-sale
Domestic 4,126 28 0.7 1,036 3 0.3 1,132 17 1.5
Foreign taxable 3,171 100 3.2 3,546 83 2.3 3,000 21 0.7
Foreign non-taxable 0 0 0 0 0 0
Foreign total 3,171 100 3.2 3,546 83 2.3 3,000 21 0.7
Total interest-earning assets 2,021,523 86,280 4.3 1,722,124 58,167 3.4 1,523,622 37,993 2.5
Net interest on swaps 1,121 1,119 1,235
Interest income and average interest-earning assets 2,021,523 87,401 4.3 1,722,124 59,286 3.4 1,523,622 39,228 2.6
Non-interest-earning assets
Positive replacement values 320,596 319,698 246,952
Fixed assets 7,445 9,308 8,808
Other 66,362 55,178 53,140
Total average assets 2,415,926 2,106,308 1,832,522
Additional Disclosure Required under SEC Regulations

237
D – Information Required by Industry Guide 3 (continued)
31.12.06 31.12.05 31.12.04
CHF million, except where indicatedAveragebalance Interest
Averagerate (%)
Averagebalance Interest
Averagerate (%)
Averagebalance Interest
Averagerate (%)
Liabilities and Equity
Due to banks
Domestic 46,544 1,583 3.4 35,713 897 2.5 31,129 385 1.2
Foreign 108,885 5,261 4.8 92,431 3,321 3.6 96,335 1,582 1.6
Cash collateral on securities lent and repurchase agreements
Domestic 46,224 1,589 3.4 40,772 881 2.2 33,846 489 1.4
Foreign 751,617 32,432 4.3 647,998 19,599 3.0 606,623 9,417 1.6
Trading portfolio liabilities
Domestic 4,408 283 6.4 3,632 145 4.0 3,717 180 4.8
Foreign 202,263 14,250 7.0 173,394 10,591 6.1 161,286 7,813 4.8
Financial liabilities designated at fair value
Domestic 1,864 58 3.1 638 5 0.8 85 1 1.2
Foreign 127,458 4,699 3.7 86,688 2,385 2.8 49,234 1,167 2.4
Due to customers
Domestic demand deposits 70,981 534 0.8 67,987 292 0.4 67,005 167 0.2
Domestic savings deposits 86,631 392 0.5 86,373 404 0.5 84,112 414 0.5
Domestic time deposits 28,876 639 2.2 24,245 386 1.6 19,052 250 1.3
Domestic total 186,488 1,565 0.8 178,605 1,082 0.6 170,169 831 0.5
Foreign 1 315,917 11,500 3.6 249,561 5,906 2.4 200,664 2,785 1.4
Short-term debt
Domestic 1,973 115 5.8 1,584 20 1.3 246 0
Foreign 110,418 4,939 4.4 96,767 2,905 3.0 79,902 1,338 1.7
Long-term debt
Domestic 3,957 82 2.1 4,250 117 2.8 10,358 168 1.6
Foreign 57,899 2,524 4.4 43,035 1,904 4.4 28,259 1,328 4.7
Total interest-bearing liabilities 1,965,915 80,880 4.1 1,655,068 49,758 3.0 1,471,853 27,484 1.9
Non-interest-bearing liabilities
Negative replacement values 320,766 335,992 260,629
Other 76,270 70,654 60,844
Total liabilities 2,362,951 2,061,714 1,793,326
Total equity 52,975 44,594 39,196
Total average liabilities and equity 2,415,926 2,106,308 1,832,522
Net interest income 6,521 9,528 11,744
Net yield on interest-earning assets 0.3 0.6 0.8
1 Due to customers in foreign offices consists mainly of time deposits.
The percentage of total average interest-earning assets attri-butable to foreign activities was 88% for 2006 (86% for 2005 and 86% for 2004). The percentage of total average interest-bearing liabilities attributable to foreign activities was 85% for 2006 (84% for 2005 and 83% for 2004). All assets and liabilities are translated into CHF at uniform month-end rates. Interest income and expense are transla-ted at monthly average rates.
Average rates earned and paid on assets and liabilities can change from period to period based on the changes in interest rates in general, but are also affected by changes in the curren-cy mix included in the assets and liabilities. This is especially true for foreign assets and liabilities. Tax-exempt income is not recorded on a tax-equivalent basis. For all three years presen-ted, tax-exempt income is considered to be insignificant and the impact from such income is therefore negligible.

238
2006 compared with 2005 2005 compared with 2004
Increase / (decrease)due to changes in
Netchange
Increase / (decrease)due to changes in
NetchangeCHF million
Averagevolume
Averagerate
Averagevolume
Averagerate
Interest income from interest-earning assets
Due from banks
Domestic (79) 396 317 36 80 116
Foreign 224 (68) 156 28 909 937
Cash collateral on securities borrowed and reverse repurchase agreements
Domestic (194) 448 254 376 246 622
Foreign 4,338 11,772 16,110 1,127 10,914 12,041
Trading portfolio assets
Domestic 70 124 194 179 (58) 121
Foreign taxable 5,193 2,621 7,814 2,473 2,238 4,711
Foreign non-taxable 18 51 69 13 18 31
Foreign total 5,211 2,672 7,883 2,486 2,256 4,742
Financial assets designated at fair value
Domestic 0 0 0 0 0 0
Foreign 62 (18) 44 26 0 26
Loans
Domestic 213 147 360 187 (71) 116
Foreign 593 2,160 2,753 710 695 1,405
Financial investments
Domestic 9 16 25 (1) (13) (14)
Foreign taxable (9) 26 17 4 58 62
Foreign non-taxable 0 0 0 0 0 0
Foreign total (9) 26 17 4 58 62
Interest income
Domestic 19 1,131 1,150 777 184 961
Foreign 10,419 16,544 26,963 4,381 14,832 19,213
Total interest income from interest-earning assets 10,438 17,675 28,113 5,158 15,016 20,174
Net interest on swaps 2 (116)
Total interest income 28,115 20,058
D – Information Required by Industry Guide 3 (continued)
Analysis of Changes in Interest Income and Expense
The following tables allocate, by categories of interest-ear-ning assets and interest-bearing liabilities, the changes in in-terest income and expense due to changes in volume and interest rates for the year ended 31 December 2006 com-pared with the year ended 31 December 2005, and for the year ended 31 December 2005 compared with the year
ended 31 December 2004. Volume and rate variances have been calculated on movements in average balances and changes in interest rates. Changes due to a combination of volume and rates have been allocated proportionally. Refer to page 245 of Industry Guide 3 for a discussion of the treat-ment of impaired, non-performing and restructured loans.
Additional Disclosure Required under SEC Regulations

239
D – Information Required by Industry Guide 3 (continued)
Analysis of Changes in Interest Income and Expense (continued)
2006 compared with 2005 2005 compared with 2004
Increase / (decrease)due to changes in
Increase / (decrease)due to changes in
CHF millionAveragevolume
Averagerate
Netchange
Averagevolume
Averagerate
Netchange
Interest expense on interest-bearing liabilities
Due to banks
Domestic 271 415 686 55 457 512
Foreign 592 1,348 1,940 (62) 1,801 1,739
Cash collateral on securities lent and repurchase agreements
Domestic 120 588 708 97 295 392
Foreign 3,109 9,724 12,833 662 9,520 10,182
Trading portfolio liabilities
Domestic 31 107 138 (4) (31) (35)
Foreign 1,761 1,898 3,659 581 2,197 2,778
Financial liabilities designated at fair value
Domestic 10 43 53 7 (3) 4
Foreign 1,142 1,172 2,314 899 319 1,218
Due to customers
Domestic demand deposits 12 230 242 2 123 125
Domestic savings deposits 1 (13) (12) 11 (21) (10)
Domestic time deposits 74 179 253 68 68 136
Domestic total 87 396 483 81 170 251
Foreign 1,593 4,001 5,594 685 2,436 3,121
Short-term debt
Domestic 5 90 95 20 0 20
Foreign 410 1,624 2,034 287 1,280 1,567
Long-term debt
Domestic (8) (27) (35) (98) 47 (51)
Foreign 654 (34) 620 694 (118) 576
Interest expense
Domestic 516 1,612 2,128 158 935 1,093
Foreign 9,261 19,733 28,994 3,746 17,435 21,181
Total interest expense 9,777 21,345 31,122 3,904 18,370 22,274

240
31.12.06 31.12.05 31.12.04
CHF million, except where indicatedAveragedeposit
Averagerate (%)
Averagedeposit
Averagerate (%)
Averagedeposit
Averagerate (%)
Banks
Domestic offices
Demand deposits 2,024 0.2 8,491 0.1 7,770 0.1
Time deposits 8,776 4.5 6,976 3.3 4,693 1.7
Total domestic offices 10,800 3.7 15,467 1.5 12,463 0.7
Foreign offices
Interest-bearing deposits 1 29,814 4.8 25,497 3.6 23,843 1.6
Total due to banks 40,614 4.5 40,964 2.8 36,306 1.3
Customer accounts
Domestic offices
Demand deposits 70,981 0.8 67,987 0.4 67,005 0.2
Savings deposits 86,631 0.5 86,373 0.5 84,112 0.5
Time deposits 28,876 2.2 24,245 1.6 19,052 1.3
Total domestic offices 186,488 0.8 178,605 0.6 170,169 0.5
Foreign offices
Interest-bearing deposits 1 315,917 3.6 249,561 2.4 200,664 1.4
Total due to customers 502,405 2.6 428,166 1.6 370,833 1.0
1 Mainly time deposits.
At 31 December 2006, the maturity of time deposits exceeding CHF 150,000, or an equivalent amount in other currencies, was as follows:
CHF million Domestic Foreign
Within 3 months 45,236 256,610
3 to 6 months 5,676 4,253
6 to 12 months 2,764 2,224
1 to 5 years 310 5,134
Over 5 years 254 90
Total time deposits 54,240 268,311
D – Information Required by Industry Guide 3 (continued)
DepositsThe following table analyzes average deposits and the ave-rage rates on each deposit category listed below for the years ended 31 December 2006, 2005 and 2004. The geo-graphic allocation is based on the location of the office or
branch where the deposit is made. Deposits by foreign de-positors in domestic offices were CHF 78,234 million, CHF 54,968 million and CHF 49,699 million at 31 December 2006, 31 December 2005 and 31 December 2004, respec-tively.
Additional Disclosure Required under SEC Regulations

241
D – Information Required by Industry Guide 3 (continued)
Short-term Borrowings
The following table presents the period-end, average and maximum month-end outstanding amounts for short-term borro-wings, along with the average rates and period-end rates at and for the years ended 31 December 2006, 2005 and 2004.
Money market paper issued Due to banks Repurchase agreements 1
CHF million, except where indicated 31.12.06 31.12.05 31.12.04 31.12.06 31.12.05 31.12.04 31.12.06 31.12.05 31.12.04
Period-end balance 119,584 102,662 79,442 153,231 90,651 84,351 754,623 667,317 557,892
Average balance 112,391 98,351 80,148 114,815 114,701 91,158 717,542 628,362 587,988
Maximum month-end balance 123,108 112,217 94,366 153,231 101,178 115,880 777,010 719,208 637,594
Average interest rate during the period (%) 4.5 3.0 1.7 4.4 3.3 1.6 4.4 3.0 1.5
Average interest rate at period-end (%) 4.0 4.0 2.1 4.1 3.0 2.0 5.0 2.6 2.0
1 For the purpose of this disclosure, balances are presented on a gross basis.

242
D – Information Required by Industry Guide 3 (continued)
Contractual Maturities of Investments in Debt Instruments 1,2
Within 1 year 1–5 years 5–10 years Over 10 years
CHF million, except percentages Amount Yield (%) Amount Yield (%) Amount Yield (%) Amount Yield (%)
31 December 2006
Swiss national government and agencies 2 2.22 0 0.00 0 0.00 1 4.00
Swiss local governments 0 0.00 0 0.00 0 0.00 0 0.00
US Treasury and agencies 0 0.00 0 0.00 0 0.00 0 0.00
Foreign governments and official institutions 38 1.48 2 1.89 57 4.47 0 0.00
Corporate debt securities 26 7.00 0 0.00 2 0.00 0 0.00
Mortgage-backed securities 0 0.00 0 0.00 10 4.48 150 5.10
Other debt instruments 0 0.00 233 9.28 0 0.00 0 0.00
Total fair value 66 235 69 151
Within 1 year 1–5 years 5–10 years Over 10 years
CHF million, except percentages Amount Yield (%) Amount Yield (%) Amount Yield (%) Amount Yield (%)
31 December 2005
Swiss national government and agencies 0 0.00 2 4.36 0 0.00 1 4.00
Swiss local governments 0 0.00 0 0.00 0 0.00 0 0.00
US Treasury and agencies 0 0.00 42 5.51 10 5.77 12 6.03
Foreign governments and official institutions 38 1.91 2 1.90 5 5.64 2 6.17
Corporate debt securities 13 3.20 239 4.25 66 5.38 103 5.66
Mortgage-backed securities 0 0.00 0 0.00 14 3.92 129 4.80
Other debt instruments 0 0.00 0 0.00 0 0.00 0 0.00
Total fair value 51 285 95 247
Within 1 year 1–5 years 5–10 years Over 10 years
CHF million, except percentages Amount Yield (%) Amount Yield (%) Amount Yield (%) Amount Yield (%)
31 December 2004
Swiss national government and agencies 1 5.50 2 4.29 6 3.80 1 4.00
Swiss local governments 10 3.97 10 4.14 0 0.00 0 0.00
Foreign governments and official institutions 36 2.13 4 1.25 0 0.00 0 0.00
Corporate debt securities 57 2.74 50 2.92 0 0.00 33 0.00
Mortgage-backed securities 3 2.50 0 0.00 5 3.21 64 4.36
Other debt instruments 0 0.00 0 0.00 0 0.00 0 0.00
Total fair value 107 66 11 981 Money market paper has a contractual maturity of less than one year. 2 Average yields are calculated on an amortized cost basis.
Additional Disclosure Required under SEC Regulations

243
CHF million 31.12.06 31.12.05 31.12.04 31.12.03 31.12.02
Domestic
Banks 1 561 1,407 1,406 619 1,029
Construction 1,535 1,816 1,943 2,175 2,838
Financial institutions 5,542 4,213 4,332 4,009 4,301
Hotels and restaurants 1,957 2,044 2,269 2,440 2,655
Manufacturing 2 4,439 5,038 5,485 6,478 7,237
Private households 117,852 111,549 105,160 102,180 95,295
Public authorities 4,972 5,494 5,460 5,251 5,529
Real estate and rentals 11,356 11,792 11,466 12,449 13,573
Retail and wholesale 4,569 4,808 4,908 6,062 7,172
Services 3 9,159 9,300 9,110 9,493 10,237
Other 4 1,127 1,004 591 1,014 1,722
Total domestic 163,069 158,465 152,130 152,170 151,588
Foreign
Banks 1 49,895 32,282 34,269 31,405 31,882
Chemicals 1,296 2,716 366 245 519
Construction 483 295 122 84 153
Electricity, gas and water supply 892 1,637 745 249 1,105
Financial institutions 82,064 62,306 45,095 30,906 18,378
Manufacturing 5 2,964 3,899 2,758 2,421 2,300
Mining 2,756 2,694 1,695 1,114 868
Private households 35,029 38,280 30,237 21,195 33,063
Public authorities 2,038 1,501 1,228 1,224 2,628
Real estate and rentals 4,238 2,707 940 473 616
Retail and wholesale 1,750 1,257 1,102 1,880 1,367
Services 16,231 5,596 8,002 7,983 1,654
Transport, storage and communication 1,038 1,419 762 3,658 676
Other 6 460 156 318 432 2,314
Total foreign 201,134 156,745 127,639 103,269 97,523
Total gross 364,203 315,210 279,769 255,439 249,111
1 Includes Due from banks and Loans from Industrial Holdings of CHF 93 million at 31 December 2006, CHF 728 million at 31 December 2005, CHF 909 million at 31 December 2004 and CHF 220 million at 31 December 2003. 2 Includes chemicals, food and beverages. 3 Includes transportation, communication, health and social work, education and other social and personal service activities. 4 Includes mining and electricity, gas and water supply. 5 Includes food and beverages. 6 Includes hotels and restaurants.
D – Information Required by Industry Guide 3 (continued)
Due from Banks and Loans (gross)
The Group’s lending portfolio is widely diversified across industry sectors with no significant concentrations of credit risk. CHF 152.9 billion (42% of the total) consists of loans to thousands of private households, predominantly in Switzerland, and mostly secured by mortgages, financial collateral or other assets. Exposure to Banks and Financial institutions amounted to CHF 138 billion (38% of the total). This includes cash posted as collateral by UBS against nega-tive replacement values on derivatives or other positions, which, from a risk perspective, is not considered lending but is a key component of the measurement of counterpar-ty risk taken in connection with the underlying products.
Exposure to banks includes money market deposits with highly rated institutions. Excluding financial institutions, the largest industry sector exposure is CHF 25 billion (7% of the total) to the Services sector. For further discussion of the lending portfolio, see the Risk Management chapter of the Handbook 2006/2007. The following table illustrates diver-sification of the lending portfolio among industry sectors at 31 December 2006, 2005, 2004, 2003 and 2002. The in-dustry categories presented are consistent with the classifi-cation of loans for reporting to the Swiss Federal Banking Commission and Swiss National Bank. The table below does not include loans designated at fair value.

244
D – Information Required by Industry Guide 3 (continued)
Due from Banks and Loans (gross) (continued)
The following table analyzes the Group's mortgage portfolio by geographic origin of the client and type of mortgage at 31 December 2006, 2005, 2004, 2003 and 2002. Mortgages are included in the industry categories mentioned on the previous page.
CHF million 31.12.06 31.12.05 31.12.04 31.12.03 31.12.02
Mortgages
Domestic 134,468 130,880 124,496 122,069 116,359
Foreign 10,069 15,619 12,185 7,073 11,510
Total gross mortgages 144,537 146,499 136,681 129,142 127,869
Mortgages
Residential 124,548 127,990 117,731 109,980 108,779
Commercial 19,989 18,509 18,950 19,162 19,090
Total gross mortgages 144,537 146,499 136,681 129,142 127,869
Due from Banks and Loan Maturities (gross)
CHF million Within 1 year 1 to 5 years Over 5 years Total
Domestic
Banks 558 3 0 561
Mortgages 54,752 60,051 19,665 134,468
Other loans 21,068 5,493 1,479 28,040
Total domestic 76,378 65,547 21,144 163,069
Foreign
Banks 47,391 2,323 181 49,895
Mortgages 8,451 1,219 399 10,069
Other loans 125,334 13,150 2,686 141,170
Total foreign 181,176 16,692 3,266 201,134
Total gross 1 257,554 82,239 24,410 364,2031 Includes Due from banks from Industrial Holdings of CHF 93 million at 31 December 2006.
At 31 December 2006, the total amount of due from banks and loans due after one year granted at fixed and floating rates are as follows:
CHF million 1 to 5 years Over 5 years Total
Fixed-rate loans 75,549 22,918 98,467
Adjustable or floating-rate loans 6,690 1,492 8,182
Total 82,239 24,410 106,649
Additional Disclosure Required under SEC Regulations

245
D – Information Required by Industry Guide 3 (continued)
Impaired and Non-performing Loans
A loan (included in Due from banks or Loans) is classified as non-performing: 1) when the payment of interest, principal or fees is overdue by more than 90 days and there is no firm evidence that they will be made good by later payments or the liquidation of collateral; or 2) when insolvency proceedings have commenced; or 3) when obligations have been restructured on concessionary terms.
CHF million 31.12.06 31.12.05 31.12.04 31.12.03 31.12.02
Gross interest income that would have been recorded on non-performing loans:
Domestic 50 81 107 171 148
Foreign 10 8 17 23 53
Interest income included in net profit for non-performing loans:
Domestic 56 72 106 163 152
Foreign 8 9 8 8 22
The table below provides an analysis of the Group's non-performing loans. For further information, see the Risk Manage-ment chapter of the Handbook 2006 / 2007.
CHF million 31.12.06 31.12.05 31.12.04 31.12.03 31.12.02
Non-performing loans:
Domestic 1,744 2,106 2,772 4,012 4,609
Foreign 174 257 783 746 1,170
Total non-performing loans 1,918 2,363 3,555 4,758 5,779
UBS does not, as a matter of policy, typically restructure loa-ns to accrue interest at rates different from the original con-tractual terms or reduce the principal amount of loans. In-stead, specific loan allowances are established as necessary. Unrecognized interest related to restructured loans was not material to the results of operations in 2006, 2005, 2004, 2003 or 2002.
In addition to the non-performing loans shown above, the Group had CHF 710 million, CHF 1,071 million, CHF 1,144 million, CHF 2,241 million and CHF 3,875 million in “other impaired loans” for the years ended 31 December 2006, 2005, 2004, 2003 and 2002, respectively.
Other impaired loans are loans where the Group’s credit officers have expressed doubts as to the ability of the bor-rowers to repay the loans. For the years ended 31 December 2006, 2005 and 2004, they are loans not considered “non-performing” in accordance with Swiss regulatory guidelines, and for the years ended 31 December 2003 and 2002, they are loans that were current or less than 90 days in arrears with respect to payment of principal or interest. As of 31 December 2006, 31 December 2005 and 31 December 2004, specific allowances of CHF 106 million, CHF 200 milli-on, CHF 241 million, respectively, had been established against these loans.

246
31.12.06
CHF million Banks Private sector Public sector Total % of total assets
United States 7,692 208,200 22,574 238,466 10.0
Japan 2,283 8,263 30,158 40,704 1.7
United Kingdom 11,149 16,098 559 27,806 1.2
Germany 15,240 8,080 1,574 24,894 1.0
31.12.05
CHF million Banks Private sector Public sector Total % of total assets
United States 6,700 133,561 23,297 163,558 7.9
Germany 16,985 4,525 1,265 22,775 1.1
Japan 2,044 7,582 10,824 20,450 1.0
United Kingdom 6,384 11,423 555 18,362 0.9
Italy 3,343 2,509 11,324 17,176 0.8
31.12.04
CHF million Banks Private sector Public sector Total % of total assets
United States 8,550 109,131 8,859 126,540 7.3
Germany 18,478 2,882 7,348 28,708 1.7
Italy 4,362 2,207 16,803 23,372 1.3
United Kingdom 8,131 10,760 259 19,150 1.1
Cross-border outstandings consist of general banking pro-ducts such as loans and deposits with third parties, credit equivalents of over-the-counter (OTC) derivatives and securi-ties financing, and the market value of the inventory of debt securities. Outstandings are monitored and reported on an ongoing basis by the credit risk control organization with a dedicated country risk information system. With the excepti-on of the 32 most developed economies, these exposures are rigorously limited. The following analysis excludes Due from banks and Loans from Industrial Holdings. Prior periods have been adjusted to conform to the current year’s presen-tation.
Claims that are secured by third-party guarantees are recorded against the guarantor's country of domicile. Out-
D – Information Required by Industry Guide 3 (continued)
Cross-border Outstandings
standings that are secured by collateral are recorded against the country where the asset could be liquidated. This follows the “Guidelines for the Management of Country Risk”, which are applicable to all banks that are supervised by the Swiss Federal Banking Commission.
The following tables list those countries for which cross-border outstandings exceeded 0.75% of total assets at 31 December 2006, 2005 and 2004. At 31 December 2006, there were no outstandings that exceeded 0.75% of total assets in any country currently facing liquidity problems that the Group expects would materially affect the country's abi-lity to service its obligations.
For more information on cross-border exposure, see the Handbook 2006 / 2007.
Additional Disclosure Required under SEC Regulations

247
CHF million 31.12.06 31.12.05 31.12.04 31.12.03 31.12.02
Balance at beginning of year 1,776 2,802 3,775 5,015 7,992
Domestic
Write-offs
Banks 0 0 0 0 0
Construction (14) (16) (49) (73) (148)
Financial institutions (11) (14) (24) (37) (103)
Hotels and restaurants (16) (26) (101) (57) (48)
Manufacturing 1 (40) (39) (77) (121) (275)
Private households (89) (131) (208) (262) (536)
Public authorities 0 0 0 (18) 0
Real estate and rentals (44) (56) (109) (206) (357)
Retail and wholesale (20) (25) (68) (67) (101)
Services 2 (47) (35) (83) (111) (155)
Other 3 (2) (4) (9) (43) (49)
Total domestic write-offs (283) (346) (728) (995) (1,772)
Foreign
Write-offs
Banks (3) (164) (21) (17) (49)
Chemicals 0 0 (1) 0 0
Construction 0 0 (3) 0 0
Electricity, gas and water supply 0 0 0 0 (36)
Financial institutions 0 (50) (34) (112) (228)
Manufacturing 4 (11) (8) (23) (77) (70)
Mining (1) (23) (8) (15) (1)
Private households (7) (21) (8) (11) (65)
Public authorities (58) (22) (2) 0 (1)
Real estate and rentals 0 (3) 0 (1) (2)
Retail and wholesale 0 (9) 0 (76) (10)
Services 0 0 (7) (25) (39)
Transport, storage and communication 0 0 0 (24) (74)
Other 5 0 (5) (21) (83) (189)
Total foreign write-offs (80) (305) (128) (441) (764)
Total write-offs (363) (651) (856) (1,436) (2,536)
1 Includes chemicals, food and beverages. 2 Includes transportation, communication, health and social work, education and other social and personal service activities. 3 Includes mining and electri-city, gas and water supply. 4 Includes food and beverages. 5 Includes hotels and restaurants.
D – Information Required by Industry Guide 3 (continued)
Summary of Movements in Allowances and Provisions for Credit Losses
The following table provides an analysis of movements in allowances and provisions for credit losses. The following analysis includes Due from banks from Industrial Holdings.
UBS writes off loans against allowances only on final settlement of bankruptcy proceedings, the sale of the under-
lying assets and / or due to of debt forgiveness. Under Swiss law, a creditor can continue to collect from a debtor who has emerged from bankruptcy, unless the debt has been forgiven through a formal agreement.

248
D – Information Required by Industry Guide 3 (continued)
Summary of Movements in Allowances and Provisions for Credit Losses (continued)
CHF million 31.12.06 31.12.05 31.12.04 31.12.03 31.12.02
Recoveries
Domestic 51 53 54 49 43
Foreign 11 10 5 38 27
Total recoveries 62 63 59 87 70
Net write-offs (301) (588) (797) (1,349) (2,466)
Increase / (decrease) in credit loss allowance and provision (108) (298) (216) 102 115
Collective loan loss provisions (48) (76) (25)
Other adjustments 1 13 (64) 65 7 (626)
Balance at end of year 1,332 1,776 2,802 3,775 5,015
1 See the table below for details.
CHF million 31.12.06 31.12.05 31.12.04 31.12.03 31.12.02
Net foreign exchange 10 50 2 (57) (269)
Subsidiaries sold and other adjustments 3 (114) 63 64 (357)
Total adjustments 13 (64) 65 7 (626)
Additional Disclosure Required under SEC Regulations

249
D – Information Required by Industry Guide 3 (continued)
Allocation of the Allowances and Provisions for Credit Losses
The following table provides an analysis of the allocation of the allowances and provisions for credit loss by industry sector and geographic location at 31 December 2006, 2005, 2004, 2003 and 2002. For a description of procedures with respect to allowances and provisions for credit losses, see the Handbook 2006 / 2007. The following analysis includes Due from banks from Industrial Holdings.
CHF million 31.12.06 31.12.05 31.12.04 31.12.03 31.12.02
Domestic
Banks 10 10 10 10 10
Construction 72 91 112 158 265
Financial institutions 61 75 82 137 89
Hotels and restaurants 27 49 98 214 286
Manufacturing 1 155 174 224 327 458
Private households 187 262 333 511 750
Public authorities 3 8 9 9 39
Real estate and rentals 99 168 250 383 577
Retail and wholesale 311 330 363 201 315
Services 2 113 196 222 549 470
Other 3 107 61 188 150 225
Total domestic 1,145 1,425 1,891 2,649 3,484
Foreign
Banks 4 20 35 246 256 24
Chemicals 4 5 4 5 5
Construction 2 2 1 0 6
Electricity, gas and water supply 8 16 15 0 96
Financial institutions 9 8 140 168 153
Manufacturing 5 37 57 112 359 314
Mining 0 1 14 19 148
Private households 26 30 48 48 58
Public authorities 21 72 66 69 0
Real estate and rentals 4 3 5 7 6
Retail and wholesale 4 1 95 51 13
Services 7 27 32 32 262
Transport, storage and communication 1 0 1 195 144
Other 6 6 8 (75) (345) (394)
Total foreign 149 265 704 864 835
Collective loan loss provisions 7 38 86 207 262 696
Total allowances and provisions for credit losses 8 1,332 1,776 2,802 3,775 5,015
1 Includes chemicals, food and beverages. 2 Includes transportation, communication, health and social work, education and other social and personal service activities. 3 Includes mining, electricity, gas and water supply. 4 Counterparty allowances and provisions only. Country provisions with banking counterparties amounting to CHF 0 million, CHF 37 million and CHF 17 million are disclosed under Collective loan loss provisions for 2006, 2005 and 2004, respectively. 5 Includes food and beverages. 6 Includes hotels and restaurants. 7 The 2006, 2005, 2004, 2003 and 2002 amounts include CHF 0 miilion, CHF 48 million, CHF 161 million, CHF 262 million and CHF 696 million , respectively, of country provisions. 8 The 2006, 2005, 2004, 2003 and 2002 amounts include CHF 76 million, CHF 109 million, CHF 214 million, CHF 290 million and CHF 366 million , respectively, of provisions for unused commitments and contingent liabilities.

250
D – Information Required by Industry Guide 3 (continued)
Due from Banks and Loans by Industry Sector (gross)
The following table presents the percentage of loans in each industry sector and geographic location to total loans. This table can be read in conjunction with the preceding table showing the breakdown of the allowances and provisions for cre-dit losses by industry sectors to evaluate the credit risks in each of the categories. The table below does not include loans designated at fair value.
in % 31.12.06 31.12.05 31.12.04 31.12.03 31.12.02
Domestic
Banks 1 0.2 0.5 0.5 0.2 0.4
Construction 0.4 0.6 0.7 0.8 1.1
Financial institutions 1.5 1.3 1.5 1.6 1.7
Hotels and restaurants 0.5 0.7 0.8 1.0 1.1
Manufacturing 2 1.2 1.6 2.0 2.5 2.9
Private households 32.4 35.4 37.6 40.0 38.3
Public authorities 1.4 1.7 2.0 2.1 2.2
Real estate and rentals 3.1 3.7 4.1 4.9 5.4
Retail and wholesale 1.3 1.5 1.7 2.4 2.9
Services 3 2.5 3.0 3.3 3.7 4.1
Other 4 0.3 0.3 0.2 0.4 0.8
Total domestic 44.8 50.3 54.4 59.6 60.9
Foreign
Banks 1 13.7 10.2 12.3 12.3 12.8
Chemicals 0.4 0.9 0.1 0.1 0.2
Construction 0.1 0.1 0.0 0.0 0.1
Electricity, gas and water supply 0.2 0.5 0.3 0.1 0.4
Financial institutions 22.5 19.8 16.1 12.1 7.4
Manufacturing 5 0.8 1.2 1.0 1.0 0.9
Mining 0.8 0.9 0.6 0.4 0.3
Private households 9.6 12.1 10.8 8.3 13.3
Public authorities 0.6 0.5 0.4 0.5 1.1
Real estate and rentals 1.2 0.9 0.3 0.2 0.2
Retail and wholesale 0.5 0.4 0.4 0.7 0.5
Services 4.4 1.8 2.9 3.1 0.7
Transport, storage and communication 0.3 0.4 0.3 1.4 0.3
Other 6 0.1 0.0 0.1 0.2 0.9
Total foreign 55.2 49.7 45.6 40.4 39.1
Total gross 100.0 100.0 100.0 100.0 100.0
1 Includes Due from banks and Loans from Industrial Holdings in the amount of CHF 93 for 2006, CHF 728 million for 2005, CHF 909 million for 2004 and CHF 220 million for 2003. 2 Includes che-micals, food and beverages. 3 Includes transportation, communication, health and social work, education and other social and personal service activities. 4 Includes mining and electricity, gas and water supply. 5 Includes food and beverages. 6 Includes hotels and restaurants.
Additional Disclosure Required under SEC Regulations

251
D – Information Required by Industry Guide 3 (continued)
Loss History Statistics
The following is a summary of the Group's loan loss history (relating to Due from banks and Loans). The table below does not include loans designated at fair value.
CHF million, except where indicated 31.12.06 31.12.05 31.12.04 31.12.03 31.12.02
Gross loans 1 364,203 315,210 279,769 255,439 249,111
Impaired loans 2,628 3,434 4,699 6,999 9,654
Non-performing loans 1,918 2,363 3,555 4,758 5,779
Allowances and provisions for credit losses 2 1,332 1,776 2,802 3,775 5,015
Net write-offs 301 588 797 1,349 2,466
Credit loss (expense) / recovery 156 375 241 (102) (115)
Ratios
Impaired loans as a percentage of gross loans 0.7 1.1 1.7 2.8 3.9
Non-performing loans as a percentage of gross loans 0.5 0.8 1.3 1.9 2.3
Allowances and provisions for credit losses as a percentage of:
Gross loans 0.4 0.6 1.0 1.5 2.0
Impaired loans 50.7 51.7 59.6 53.9 52.7
Non-performing loans 69.4 75.2 78.8 79.3 86.8
Allocated allowances as a percentage of impaired loans 3 46.3 46.4 51.6 46.8 44.8
Allocated allowances as a percentage of non-performing loans 4 58.0 59.0 61.4 55.1 56.0
Net write-offs as a percentage of:
Gross loans 0.1 0.2 0.3 0.5 1.0
Average loans outstanding during the period 0.1 0.2 0.3 0.5 1.0
Allowances and provisions for credit losses 22.6 33.1 28.5 35.7 49.2
Allowances and provisions for credit losses as a multiple of net write-offs 4.43 3.02 3.51 2.80 2.03
1 Includes Due from banks and Loans from Industrial Holdings in the amount of CHF 93 million 2006, CHF 728 million for 2005, CHF 909 million for 2004 and CHF 220 million for 2003. 2 Includes Collective loan loss provisions. 3 Allowances relating to impaired loans only. 4 Allowances relating to non-performing loans only.

252

Cautionary statement regarding forward-looking statements | This communication contains statements that constitute “forward-looking statements”, including, but not limited to, statements relating to the implementation of strategic initiatives and other statements relating to our future business development and economic performance. While these forward-looking statements represent our judgments and future expectations concerning the development of our business, a number of risks, uncertainties and other important factors could cause actual developments and results to differ materially from our expectations. These factors include, but are not limited to, (1) general market and macro-economic trends, (2) legislative developments, governmental and regulatory trends, (3) movements in local and international securities markets, currency exchange rates and interest rates, (4) competitive pressures, (5) technological developments, (6) changes in the financial position or creditworthiness of our customers, obligors and counterparties and developments in the markets in which they operate, (7) management changes and changes to our Business Group structure and (8) other key factors that we have indicated could adversely affect our business and financial performance which are contained in other parts of this document and in our past and future filings and reports, including those filed with the SEC. More detailed information about those factors is set forth elsewhere in this document and in documents furnished by UBS and filings made by UBS with the SEC, including UBS’s Annual Report on Form 20-F for the year ended 31 December 2006. UBS is not under any obligation to (and expressly disclaims any such obligation to) update or alter its forward-looking statements whether as a result of new information, future events, or otherwise.
Imprint | Publisher/Copyright: UBS AG, Switzerland | Languages: English, German | SAP-No. 80531E-0701

UBS AGP.O. Box, CH-8098 ZurichP.O. Box, CH-4002 Basel
www.ubs.com
![Pfizer Inc. 2006 Financial Report - AnnualReports.co.uk€¦ · Pfizer Inc. 2006 Financial Report [This Page Intentionally Left Blank] Introduction Our Financial Review is provided](https://static.fdocuments.net/doc/165x107/5fc1aa9f3f796629567527cb/pfizer-inc-2006-financial-report-pfizer-inc-2006-financial-report-this-page.jpg)


