
Financial reform and the adequacy of deposit insurance ...
21
Financial reform and the adequacy of deposit insurance fund: Lessons from Taiwanese experience Chia-Ling Ho a,1 , Gene C. Lai b,2 , Jin-Ping Lee c, ⁎ a Department of Insurance, Tamkang University, New Taipei City, Taiwan, No. 151, Yingzhuan Rd., Tamsui Dist., New Taipei City 25137, Taiwan, ROC b Safeco Distinguished Professor of Insurance, Department of Finance and Management Science, Washington State University, P.O. Box 644746, Pullman, WA 99164-4746, United States c Department of Finance, Feng Chia University, Taichung, Taiwan, No. 100, Wenhwa Rd., Seatwen, Taichung 40724, Taiwan, ROC article info abstract Article history: Received 15 December 2011 Received in revised form 8 October 2013 Accepted 13 October 2013 Available online 8 November 2013 Financial reforms and capital adequacy are probably the most critical issues for the banking industry in the world. This study examines the effectiveness of financial reforms carried out in Taiwan recently and measures the adequacy of the deposit insurance fund (DIF), including financial restructuring fund and Designated Reserve Ratio (DRR) strategy in Taiwan. We have improved on the methodology of Episcopoc (2004) and report estimates of the cost of deposit insurance and implied reserves for each bank or financial holding company. Estimates of the implicit cost of government guaranty of the DIF are also included. To stabilize its financial environment in 2000, the Taiwanese government amended many bank regulations, including the enactment of the Financial Holding Company Act (FHC Act) of 2001 and the Financial Restructuring Fund Statute. Our evidence shows lower volatilities and average unit cost of deposit insurance for seven sampled FHCs compared to sixteen sampled banks, even though the FHCs are larger. These results indicate the effectiveness of the financial reforms put forward by the Taiwanese government. When implied reserves are compared with the Designated Reserve Ratio (DRR) strategy of 2%, imposed by the Central Deposit Insurance Corporation (CDIC) in 2007, we find that the DIF would have been sufficient in 2006, but not in 2000. The results imply that the fixed target ratio for the DIF may not be appropriate. In addition, the details of financial reforms in Taiwan starting in 2001 are provided and demonstrate resolve in implementing financial reforms. Finally, financial reforms of Taiwan and the calculations of DRR and estimates of the implicit cost of government guaranty of the DIF can be used as lessons for other countries. © 2013 Elsevier Inc. All rights reserved. JEL classification: G21 G28 Keywords: Banks Fair premiums Implied reserves Deposit Insurance Fund Financial Restructuring Fund 1. Introduction Financial reforms and capital adequacy are probably the most critical issues for the banking industry in the world. Using Taiwan as an example, this study examines the effect of certain financial reforms, provides improved methods of calculating estimates of the cost of deposit insurance and implied reserve, and discusses the strategy of Designated Reserve Ratio. In order to integrate the financial market and stabilize the financial environment, the Taiwanese government implemented a series of financial reforms in the early 2000s. Among these, an important one is the enactment of the Financial Holding Company Act in 2001. The act provided the basis for the mergers of financial institutions and accelerates the process of financial consolidation. This enhances the strength and competitiveness of financial institutions in Taiwan. International Review of Economics and Finance 30 (2014) 57–77 ⁎ Corresponding author. Tel.: +886 424517250x4160. E-mail addresses: [email protected] (C.-L. Ho), [email protected] (G.C. Lai), [email protected] (J.-P. Lee). 1 Tel.: +886 226215656x2865. 2 Tel.: +1 509 335 7197. 1059-0560/$ – see front matter © 2013 Elsevier Inc. All rights reserved. http://dx.doi.org/10.1016/j.iref.2013.10.002 Contents lists available at ScienceDirect International Review of Economics and Finance journal homepage: www.elsevier.com/locate/iref
Transcript of Financial reform and the adequacy of deposit insurance ...
International Review of Economics and Finance 30 (2014) 57–77
Contents lists available at ScienceDirect
International Review of Economics and Finance
j ourna l homepage: www.e lsev ie r .com/ locate / i re f
Financial reform and the adequacy of deposit insurance fund:Lessons from Taiwanese experience
Chia-Ling Ho a,1, Gene C. Lai b,2, Jin-Ping Lee c,⁎a Department of Insurance, Tamkang University, New Taipei City, Taiwan, No. 151, Yingzhuan Rd., Tamsui Dist., New Taipei City 25137, Taiwan, ROCb Safeco Distinguished Professor of Insurance, Department of Finance and Management Science, Washington State University, P.O. Box 644746, Pullman,WA 99164-4746, United Statesc Department of Finance, Feng Chia University, Taichung, Taiwan, No. 100, Wenhwa Rd., Seatwen, Taichung 40724, Taiwan, ROC
a r t i c l e i n f o
⁎ Corresponding author. Tel.: +886 424517250x41E-mail addresses: [email protected] (C.-L. Ho)
1 Tel.: +886 226215656x2865.2 Tel.: +1 509 335 7197.
1059-0560/$ – see front matter © 2013 Elsevier Inc. Ahttp://dx.doi.org/10.1016/j.iref.2013.10.002
a b s t r a c t
Article history:Received 15 December 2011Received in revised form 8 October 2013Accepted 13 October 2013Available online 8 November 2013
Financial reforms and capital adequacy are probably the most critical issues for the bankingindustry in the world. This study examines the effectiveness of financial reforms carried out inTaiwan recently and measures the adequacy of the deposit insurance fund (DIF), includingfinancial restructuring fund and Designated Reserve Ratio (DRR) strategy in Taiwan. We haveimproved on the methodology of Episcopoc (2004) and report estimates of the cost of depositinsurance and implied reserves for each bank or financial holding company. Estimates of theimplicit cost of government guaranty of the DIF are also included. To stabilize its financialenvironment in 2000, the Taiwanese government amended many bank regulations, includingthe enactment of the Financial Holding Company Act (FHC Act) of 2001 and the FinancialRestructuring Fund Statute. Our evidence shows lower volatilities and average unit cost ofdeposit insurance for seven sampled FHCs compared to sixteen sampled banks, even thoughthe FHCs are larger. These results indicate the effectiveness of the financial reforms putforward by the Taiwanese government. When implied reserves are compared with theDesignated Reserve Ratio (DRR) strategy of 2%, imposed by the Central Deposit InsuranceCorporation (CDIC) in 2007, we find that the DIF would have been sufficient in 2006, but not in2000. The results imply that the fixed target ratio for the DIF may not be appropriate. Inaddition, the details of financial reforms in Taiwan starting in 2001 are provided anddemonstrate resolve in implementing financial reforms. Finally, financial reforms of Taiwanand the calculations of DRR and estimates of the implicit cost of government guaranty of theDIF can be used as lessons for other countries.
© 2013 Elsevier Inc. All rights reserved.
JEL classification:G21G28
Keywords:BanksFair premiumsImplied reservesDeposit Insurance FundFinancial Restructuring Fund
1. Introduction
Financial reforms and capital adequacy are probably the most critical issues for the banking industry in the world. UsingTaiwan as an example, this study examines the effect of certain financial reforms, provides improved methods of calculatingestimates of the cost of deposit insurance and implied reserve, and discusses the strategy of Designated Reserve Ratio. In order tointegrate the financial market and stabilize the financial environment, the Taiwanese government implemented a series offinancial reforms in the early 2000s. Among these, an important one is the enactment of the Financial Holding Company Act in2001. The act provided the basis for the mergers of financial institutions and accelerates the process of financial consolidation.This enhances the strength and competitiveness of financial institutions in Taiwan.
60., [email protected] (G.C. Lai), [email protected] (J.-P. Lee).
ll rights reserved.

58 C.-L. Ho et al. / International Review of Economics and Finance 30 (2014) 57–77
Another reform was the adoption of the Financial Restructuring Fund Statute in June 27, 2001. The Financial RestructuringFund is funded by a special budget of the Taiwanese government and supports the Central Deposit Insurance Corporation (CDIC)to deal with problem financial institutions. Due to the financial reforms, the number of insured institutions decreased from 456 in2000 to 392 in 2011 (see Appendix A). Moreover, in order to improve the quality of bank assets, the Taiwanese governmentreduced the bank business tax rate from 5% to 2% in 1999. The tax savings resulted from the lower tax rate were required to writeoff non-performing loan (NPL). The average NPL ratio decreased from 6.2% in 2000 to 0.43% at the end of 2011 (see Appendix B).At the same time, the average NPL coverage ratio rose from 15.34% to 251.83%. This indicates that there has been a significantimprovement in the quality of bank assets in Taiwan.
Five failing financial institutions were taken over by the CDIC in 2006 and 2007.3 In the wake of these five failed banks, theTaiwanese government revised the Deposit Insurance Act in 2007 to ensure the adequacy of the Deposit Insurance Fund (DIF).Among the amendments in the Deposit Insurance Act the most important one sets up a target ratio (i.e. Designated Reserve Ratio,DRR) for the DIF at the fixed ratio of 2% of insured deposits. Low DRR will increase the possibility of serious shortage on the DIFwhen the CDIC faces a large financial institution failure or systemic collapse. The DIF is implicitly guaranteed by the government;however, its shortage will be transferred to the government and eventually born by the ordinary taxpayers. On the other hand,high DRR can alleviate the spillover problem, but high DRR may increase bank's cost of capital and hence loan rates, which willshrink the investment of firms and disturb overall economic growth. How to set up an adequate DRR level becomes an importantissue for bank managers, regulators and depositors. In this study, we examine the relationship between the levels of DRR and theimplicit cost to the Taiwanese government to insure financial institutions. We also examine the effectiveness of these financialreforms and its effects on the adequacy of the DIF.
A fairly large body of literature focuses on the valuation of deposit insurance including Merton (1977, 1978), Marcus andShaked (1984), McCulloch (1985), Pyle (1986), Ronn and Verma (1986), Pennacchi (1987), Allen and Saunders (1993), Duan andYu (1994, 1999), and Duan, Moreau, and Sealey (1995).4 Merton (1977) and other researchers propose actuarially fair premiumsbased on the option-pricing model and suggest that premiums should depend on the size of insured deposits and the bank's assetrisk. Because the deposit insurance is implicitly fully guaranteed by the government in most countries, these studies did notconsider the effect of the insolvency of the DIF on the deposit insurance valuation. However, a series of studies, such as Kane(1989, 2000), Hovakimian and Kane (1996), and Demirguc-Kunt and Kane (2002) points out the relations among a failed DIF,government regulators, and insured banks, in terms of risk-taking incentives. 5 In addition, the forbearance of authority mayencourage financially deteriorating banks to take higher risks, leading to increased losses for the deposit insurance agent. Underthe political pressure the government may be forced to supply unlimited DIF in the case of bank failures. The shortage of the DIFeventually will be transferred to the taxpayers. Episcopos (2004) addresses the shortage of the DIF and tries to incorporate theeffect of the reserve of the DIF on the deposit insurance valuation.
There are two implications to be drawn from this stream of the literature. First, if governments do not guarantee the solvencyof the DIF, then there are more incentives for depositors to monitor banks. Second, if governments guarantee the DIF, they take onthe role of reinsurer, and adequacy of the DIF remains an important issue due to the cost of reinsurance. When a governmentguarantees the DIF, the insolvency risk may be shifted from the troubled banks to the deposit insurance agent, then to thegovernment, and finally to taxpayers. Taxpayers would like to know the cost of the guaranty. It is obvious that a guaranty is costlywhen the DIF is insolvent. Even when the DIF remains solvent, a guaranty is still costly, ex ante, so it is important to estimate itsimplied costs. One example is the U.S. Government guarantee of Chrysler's debt in 1979. Even though Chrysler survived, and itcost the government nothing, there was an ex ante implied cost of guaranty.
In this study, we apply the model of Episcopos (2004) to measure the coverage ratio provided by the current level of DIF, andthe implicit costs of government to guarantee the DIF. We measure the effectiveness of financial reforms put forward mainlyduring the period from 2001 to 2005 in Taiwan, in particular, the enactment of the FHC Act and the establishment of FinancialRestructuring Fund.6
Our results show that the average premium for the FHCs in 2006 is lower than that for the corresponding individual banks in2000 even though the FHCs are larger. This suggests that the FHC Act has achieved its objectives. Moreover, the average impliedreserves in 2006 are lower than in 2000. This indicates that the financial reforms improved the quality of financial institutions andthe financial environment in Taiwan. When implied reserves are compared with the Designated Reserve Ratio (DRR) strategy of2%, imposed by the Central Deposit Insurance Corporation (CDIC) in 2007, we find that the DIF would have been sufficient in2006, but not in 2000. The results imply that the fixed target ratio for the DIF may not be appropriate.
3 See Appendix C for details.4 In contrast to the studies focused on the valuation of deposit insurance, there is a series of studies contributed to empirically examine the effect of deposit
insurance on the bank's risk-taking behavior and the probability of bank failure. For example, Gueyie and Lai (2003) examined the effect of the introduction offlat-rate deposit insurance on the bank risk-taking behavior in Canada. Hwang, Lee, and Liaw (1997) examined the factors that can be used to detect the bankfailure and estimated the costs of insuring the U.S. banks.
5 Kupiec (2004) developed a model to value deposit insurance while incorporating the interaction effect of the endogenous Internal-Model-Based capitalrequirement recommended by Basel II and bank risk-taking incentives.
6 In order to improve the competiveness and capital status of financial institutions in Taiwan, the FHC Act was passed in 2001. Moreover, in order to deal withthe problem financial institutions and stabilize the financial environment, the Taiwanese government established the Financial Restructuring Fund in 2001. TheFinancial Restructuring Fund which is independent of the DIF provided a temporary blanket guarantee from July 2001 to July 2005.

59C.-L. Ho et al. / International Review of Economics and Finance 30 (2014) 57–77
Our results of the effect of Taiwan financial reforms, improved methods of calculating estimates of the cost of depositinsurance and implied reserve, and discussion of the strategy of DRR can be used as lessons for other countries. For example, somecountries (e.g., Korea and Thailand) provided blanket guarantee deposit insurance (full coverage) during 2007 financial crisis.Using our methods, each country can calculate the implicit costs of government guaranty of the DIF. The evidence in Taiwan that afixed target ratio for DIF may not be appropriate can be a lesson for other counties.
This study is outlined as follows. Section 2 briefly presents the background to financial system and the main financial reforms inTaiwan and other countries. The methodology of options models in deposit insurance pricing for the value of coverage with/withoutthe government guaranty are presented in Section 3. Section 4 describes the data and summary statistics. Section 5 provides theresults. We discuss the solvency issue of the DIF in Section 6. Section 7 is a conclusion.
2. Background to financial system and financial reforms in Taiwan and other countries
This section first provides a history in the financial environment in Taiwan and then discusses deposit insurance premiumassessments and the role of the CDIC. We also provide a history of financial reforms and discuss issues related to deposit insurancepremium assessments and the role of deposit insurance agent for four countries. We select two developed countries (Japan and U.S.)and two developing countries (Korea and Thailand) for the purpose of discussions.
2.1. Changes in the financial environment and financial reforms
Most financial institutions were owned by the Taiwanese government before 1990. Under strict regulation and conservativelending, commercial banks were profitable and healthy. Around 1990, during a period of financial liberalization and globalization,the government approved the establishment of 16 new private banks. Liberalization increased competition and contributed tooversaturation in the market. This narrowed profit margins as well as lowered the growth of financial institutions. The Asianfinancial crisis in 1997 and the following global economic recession also resulted in a rapid increase in non-performing loan(NPL). Bad loans continued to soar through 2000. In 2000, the total NPL amount for all financial institutions was NT$1021 billion(approximately US$310 million). The NPL ratio was 6.2% (compared to a 3.0% value before 1995).
To stabilize the financial environment, the Taiwanese government put forward a series of financial reforms.7 Among thesereforms the enactment of the FHC Act in 2001 and the establishment of the Financial Restructuring Fund are the two mostimportant ones. The FHC Act was intended to enhance synergies in financial institutions, to consolidate supervision of thecross-financial industries, to promote the sound development of financial markets, and to protect the public interest. Under theFHC Act, some banks became subsidiary banks of FHCs. Thus the FHC Act speeded up the process of integration across industries,as it established a mechanism to deal with the bad debts of financial institutions.8
The FHC Act also gave the CDIC greater authority to supervise all financial institutions and their merger and acquisitionactivities. To increase the effectiveness of supervision and to protect financial institutions from insolvency, the CDIC revised the“Financial Examination Rating System” and “Financial Early-Warning System”.9 These revisions were intended to encouragebetter reporting from financial institutions, allowing for the earliest possible discovery of problems. According to the revisedBanking Law, banks' capital adequacy ratios must achieve at least 8%. If the ratio falls below 8%, banks are required to recapitalize.An amendment in the Bank Law that authorizes the CDIC to take over a bank within 90 days when its capital adequacy ratio fallsbelow 2% was passed by the Legislative Yuan in 2008.10
On June 27, 2001 the Legislature approved the Statute for Establishment and Management of the Executive Yuan's FinancialRestructuring Fund to rescue potentially insolvent banks.11 Independent of the DIF, the Financial Restructuring Fund provided atemporary blanket guarantee, on domestic financial institutions (from July 2001 through July 2005). This was aimed at preventinga regional banking crisis, closing problem financial institutions smoothly, strengthening the environment for financial operations,and safeguarding depositors. The resources of the Financial Restructuring Fund included government financial business taxrevenue and deposit insurance premium income from the financial sector.12 The Financial Restructuring Fund entrusts the CDICwith the full amount required to settle both deposit and non-deposit-related claims on troubled financial institutions withunsound operations.13 The Fund has overseen the graceful departure of 56 troubled financial institutions from the market and has
7 The amended laws and regulations include the Banking Law, Financial Institutions Merger Law, FHC Act, six Financial Regulations, and a Statute for theEstablishment and Management of the Executive Yuan Financial Restructuring Fund.
8 Four holding companies were formed in December 2001, and sixteen have been established since then.9 Other revised system includes Quarterly Analysis Reporting System, Internet Transmission Surveillance System, Call Report Percentile Ranking System, and
Financial Holding Company Call Report System.10 The Legislative Yuan is equivalent to a parliament in other countries.11 Executive Yuan is an executive branch of the Taiwanese government.12 The financial business tax revenue for 2002–2005 was estimated to be about NT$120 billion. The CDIC's incremental insurance premium income for the ten-year period starting January 2002 has risen as a result of the increase in the insurance assessment rate that took effect on January 1, 2000, and was expected toamount to approximately NT$20 billion.13 Originally, the Financial Restructuring Fund amounted to NT$140 billion. In June 2005, the legislature increased the fund by NT$110 billion. The totalresources of the Financial Restructuring Fund amounted to about NT$250 billion in 2005 and about NT$2992 million in August 2008.
60 C.-L. Ho et al. / International Review of Economics and Finance 30 (2014) 57–77
paid out claims amounting to NT$206.8 billion since July 2001.14 Five private problem financial institutions have been taken overby the CDIC, with the prescribed repayment by the Financial Restructuring Fund and the DIF in 2006 and 2007 (see Appendix C).The Financial Restructuring Fund paid NT$1157.62 million and the DIF paid NT$3761.64 million to rescue Enterprise Bank ofHualien, for example. During the period from 2001 through its termination on December 31, 2011, the Financial RestructuringFund successfully enabled problem financial institutions to withdraw from Taiwan financial market.
After the enactment of a series of financial reforms (see Appendix D), the asset qualities of financial institutions have improvedsignificantly. The average non-performing loan (NPL) ratio declined from 6.2% in 2000 to 0.61% in 2010. In 2010, we find theaverage NPL ratio in Taiwan was much lower than others countries, e.g., the US (4.96%), Japan (2.5%), Korea (1.88%) and Thailand(3.89%) (see Appendix E).
While the purposes are different from Taiwan FHC Act, U.S. Financial Services Modernization Act replaced Glass–Steagallbarriers of 1933 between commercial banks and investment banks in 1999. Financial Services Modernization Act like FHC Act ofTaiwan also allowed for the creation of a financial services holding company that engaged in banking activities, securitiesunderwriting and any other financial activities. After the Financial Services Modernization Act, there were 26 deposit institutionsfailed in 2008 and 140 additional failures occurred in U.S.
In order to stabilize financial market and to resolve failing enterprises, the U.S. government implements some acts. Forexample, Temporary Liquidity Guarantee Program (including Debt Guarantee Program and Transaction Account GuaranteeProgram) and Term Asset-Backed Securities Loan Facility were created by Federal Deposit Insurance Corporation (FDIC).Emergency Economic Stabilization Act of 2008 (EESA) was passed by U.S. Congress in 2008. In 2010, the congress passed theWallStreet Reform and Consumer Protection Act to prevent a similar crisis from ever recurring and repeating of the market meltdownof 2008.15
While most of countries do not enact acts similar to FHC Act in Taiwan, many countries also provide funds that are similar toFinancial Restructuring Fund in Taiwan. For example, Japanese government created the Resolution and Collection Corporation(RCC) to handle the disposal of bad loans in 1991. In particular, Japan banks had written off over US$650 billion innon-performing loan during period from 1992 to 2002. During the 1997 Asian financial crisis, Korea government sets up theDeposit Insurance Fund (DIF) and Non-Performing Asset Management Fund (NPAF) to resolve insolvent financial institutions.Following the Asia financial crisis, Thailand began its financial system reform. The Thailand government established the FinancialRestructuring Authority (FRA) and Asset Management Corporation (AMC) in 1997 to resolve insolvent financial institutions. Jeon(2010), Shimada and Yang (2010), and Yam (2009), pointed out the implementation of a series of financial reforms contributed tothe fast recovery of the Asian countries from the effect of the 2008 global financial crisis.
In summary, the lessons learned from the experiences from the reforms of Taiwan and other countries are stated below. First,FHC Act was successfully implemented in Taiwan because the FHC speeded up the process of integration across industries andpromoted the sound development of financial markets. Once evidence of the success of FHC Act was successful is the NPL ratio inTaiwan was the lowest in 2010 after the global financial crisis. On the other hand, Financial Services Modernization Act in U.S.cannot be deemed as successful. In fact some have claimed that Financial Services Modernization Act caused the global financialcrisis. It seems that the concept of holding company structure is appropriate as long as the regulator can effectively regulate firmssuch that firms would not misuse their new found power such as the misuses of derivatives. Second, some types of restructuringfunds such as Financial Restructuring Fund in Taiwan, Resolution and Collection Corporation in Japan, or Non-Performing AssetManagement Fund to resolve insolvent financial institutions are critical to the stability of financial markets.
2.2. Background of the deposit insurance premium assessment
Taiwan founded its deposit insurance system and adopted a flat premium rate in 1985. There was much discussion over thefairness of the flat rate system with its tendency to cause an ethical hazard and its inability to differentiate various risk levels. Tofacilitate legislative objectives, the Deposit Insurance Act vests the CDIC with managing deposit insurance, assisting and disposingof problem institutions. The goals of deposit insurance are to safeguard the benefits of depositors, enhance the sounddevelopment of financial operations, and maintain an orderly credit system.
The CDIC adopted a Deposit Insurance Risk-Based Premium System on July 1, 1999, making Taiwan the first Asian country toimplement such a system.16 The CDIC also required participation in the deposit insurance system. Previously, the system wasvoluntary, with theworld's lowest premium rates. However, the DIF accumulated too slowly to be sufficient. Thus, on January 1, 2000,the CDIC raised the three-tiered deposit insurance assessment rates from the previous rates of 0.015%, 0.0175%, and 0.02% of insureddeposits to 0.05%, 0.055%, and 0.06%. On October 15, 2007, the CDIC raised the rates again. For domestic banks, local branches offoreign banks and credit cooperatives, the premium rates became 3, 4, 5, 6, and 7 basis points of insured deposits according to arisk-based rate system. Revised in November 2010, the assessment rates are based on five different levels of risk and effective from
14 The restructuring fund handled claims for 38 credit departments of Farmers and Fishermen's Associations, with total payments of NT$49.5 billion (24%); ninecredit cooperatives, with total payments of about NT$43.3 billion (21%); and nine banks (including trust and investment companies), with total payments ofabout NT$114.8 billion (55%) as of December 31, 2011.15 Saunders and Cornett (2011), Financial institutions management — A risk management approach, seventh international edition (New York: McGraw-Hill), page54.16 Pennacchi (2000) discusses the relative merits of a targeting policy and a flat-rate insurance policy.
61C.-L. Ho et al. / International Review of Economics and Finance 30 (2014) 57–77
January 1, 2011. For domestic banks and local branches of foreign banks, the premium rates are 0.05%, 0.06%, 0.08%, 0.11%, and 0.15%,and the flat premium rate for insured deposits in excess of coverage limit is 0.005%. For credit cooperatives, the premium rates are0.04%, 0.05%, 0.07%, 0.10% and 0.14%, and the flat premium rate for insured deposits in excess of coverage limit is 0.005%. For creditdepartments of farmers' and fishermen's associations, they are 0.02%, 0.03%, 0.04%, 0.05%, and 0.06% of covered deposits and the flatpremium rate for insured deposits in excess of coverage limit is 0.0025% (see Appendix F).
Taiwan adopted the risk-based premium systemwas similar to that of U.S., Japan, and Korea. These countries adopted both flatpremium rate and special premium rate system (e.g., Japan and Korea). However, Thailand uses the flat premium rate for insureddeposits. Based on the experiences of various countries, it seems risk-based premium system in Taiwan and, U.S., and Japan is anappropriate system. Thailand may need to rethink its flat premium rate for insured deposits.
2.3. Deposit insurance funds (DIF)
In the wake of the bank failures, the Deposit Insurance Act was revised in January 12, 2007. Amendments in the act mainlyfocused on enhancing deposit insurance mechanisms, including “replenishing and reforming the DIF”, “tightening controls overrisk taking behavior”, “strengthening the mechanism for handling failed institutions”, “protecting the interests of depositors”,“effectively assisting insured institutions in reducing operating risk”, and “maintaining financial stability”.17 Authorized withrights of ex ante prevention and ex post resolution, the CDIC can fulfill its mission more effectively. Major amendments to theDeposit Insurance Act that are most relevant to this study are: setting a target ratio of the DIF at 2% of insured deposits to ensurethe adequacy of the DIF, increasing the confidence of depositors, and changing the method for calculating the assessment base fordeposit insurance.18
Table 1 shows annual DIF reserve ratios for Taiwan from 1986 to 2010. The actual reserve ratios of the DIF and the target levelof DRR are graphed in Fig. 1. The target level was set at 2% in 2007. It can be seen that the level of the reserve was far below thetarget level. In fact, the DIF was negative (about — NT$403 million) at the end of 2007. The DIF was used to share some of thecompensation to the deposits of failed financial institutions in line with the mechanism for the combined utilization of thefinancial restructuring fund since September 2007. In October 2008, the government announced that deposits in all financialinstitutions would receive full coverage until December 31, 2009.19 It is safe to assume that the Taiwanese government will stepin and provide additional financing when a bank fails.
U.S. Congress addressed the insolvent Bank Insurance Fund (BIF) by enacting the Federal Deposit Insurance CorporationImprovement Act (FDICIA) in 1991.20 FDICIA required the FDIC to have an assessment system in place by 1994 wherein eachbank's assessment would be reflective of the risks it posed to its insurance fund. The Deposit Insurance Funds Act of 1996 set theDRR at 1.25% of total insured deposits for the BIF and SAIF (Saving Associations Insurance Fund). The requirement of DRR alsoimplicitly demanded the FDIC to set assessment rates of premiums at a level that maintains the DRR.
The DIF of the U.S. was established on March 31, 2006 as a result of a BIF-SAIF merger pursuant to the enacted depositinsurance reform legislation. The Reform Act (February 2006) and its regulations (published in November 2006) established arange for the DRR (1.15 to 1.50% of estimated insured deposits) and nullified a fixed rate of 1.25%. This legislation provided theFDIC with greater discretion to charge insurance assessments and imposed sensitive risk-based pricing. The legislation alsorequired declaration and payment of dividends from DIF, if reserve ratio equaled or exceeded 1.35% of estimated insured depositsat the end of any calendar year. The FDIC Board reset the DRR at 1.25% in 2007. During the period of global financial crisis, due tothe large payment on resolving trouble financial institutions, the DIF had a deficit of 8.2 billion in 2009. In order to address thefalling balance in the fund, the FDIC was levied one special assessment in early 2009 and a second in the fall of 2009. In addition,the FDIC charged the raising premium rate for banks and required banks to prepay premiums by the end of 2009.21 Currently, themaximum level of deposit insurance protection is set at $250,000 per depositor per bank. The FDIC announced the depositcoverage will be adjusted according to the CPI index every five years from January 2011.
In Korea, there are three DRR (i.e. DIF target fund) ranges for financial institutions. For banks, investment traders and brokers,and non-life insurance companies, the target value is set at 0.825% to 1.1% of insured deposits. For life insurers, it is set at 0.66% to0.935%; and for mutual savings banks, it is set at 1.65% to 1.925%.22 From 1997 to 2001, Korea government resolved about 487financial institutions. In 2001, Korea Deposit Insurance Corporation (KDIC) changed deposit coverage from the blanket depositcoverage to limited coverage. The limited coverage is KRW 50 million (US$44,986) per depositor.
17 See page 11 of the 2007 CDIC annual report.18 The amended Act does not include methods for reviewing the insurance premium system once the target DRR of DIF at 2% has been achieved.19 In October 2009, the Taiwanese government announced that the deposit insurance system of temporary full coverage extended to December 31, 2010. OnAugust 12, 2010, the Taiwanese government announced that the limited coverage was increased from NT$1.5 million (US$51,168) on July 1, 2007 to NT$3 million(US$102,340) starting from January 1, 2011.20 Federal Deposit Insurance Corporation (FDIC), 1998.21 Saunders and Cornett (2011), Financial institutions management — A risk management approach, seventh international edition (New York: McGraw-Hill),pages 585–586.22 KDIC, Management of Deposit Insurance Funds; available from http://www.kdic.or.kr/english/major/sub1_2.jsp.
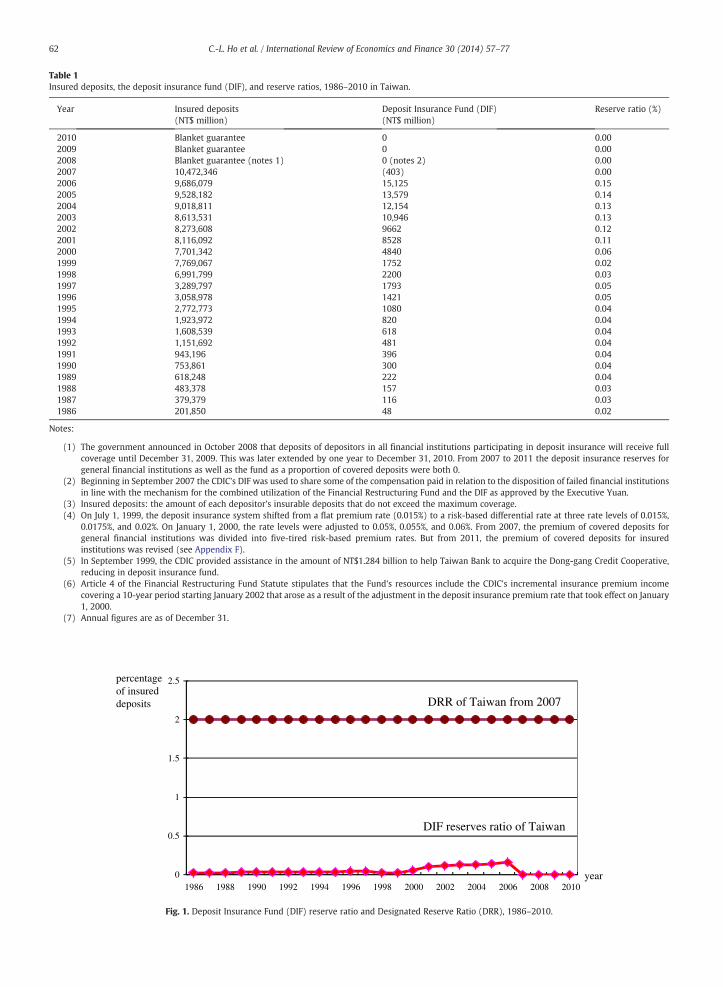
Table 1Insured deposits, the deposit insurance fund (DIF), and reserve ratios, 1986–2010 in Taiwan.
Year Insured deposits(NT$ million)
Deposit Insurance Fund (DIF)(NT$ million)
Reserve ratio (%)
2010 Blanket guarantee 0 0.002009 Blanket guarantee 0 0.002008 Blanket guarantee (notes 1) 0 (notes 2) 0.002007 10,472,346 (403) 0.002006 9,686,079 15,125 0.152005 9,528,182 13,579 0.142004 9,018,811 12,154 0.132003 8,613,531 10,946 0.132002 8,273,608 9662 0.122001 8,116,092 8528 0.112000 7,701,342 4840 0.061999 7,769,067 1752 0.021998 6,991,799 2200 0.031997 3,289,797 1793 0.051996 3,058,978 1421 0.051995 2,772,773 1080 0.041994 1,923,972 820 0.041993 1,608,539 618 0.041992 1,151,692 481 0.041991 943,196 396 0.041990 753,861 300 0.041989 618,248 222 0.041988 483,378 157 0.031987 379,379 116 0.031986 201,850 48 0.02
Notes:
(1) The government announced in October 2008 that deposits of depositors in all financial institutions participating in deposit insurance will receive fullcoverage until December 31, 2009. This was later extended by one year to December 31, 2010. From 2007 to 2011 the deposit insurance reserves forgeneral financial institutions as well as the fund as a proportion of covered deposits were both 0.
(2) Beginning in September 2007 the CDIC's DIF was used to share some of the compensation paid in relation to the disposition of failed financial institutionsin line with the mechanism for the combined utilization of the Financial Restructuring Fund and the DIF as approved by the Executive Yuan.
(3) Insured deposits: the amount of each depositor's insurable deposits that do not exceed the maximum coverage.(4) On July 1, 1999, the deposit insurance system shifted from a flat premium rate (0.015%) to a risk-based differential rate at three rate levels of 0.015%,
0.0175%, and 0.02%. On January 1, 2000, the rate levels were adjusted to 0.05%, 0.055%, and 0.06%. From 2007, the premium of covered deposits forgeneral financial institutions was divided into five-tired risk-based premium rates. But from 2011, the premium of covered deposits for insuredinstitutions was revised (see Appendix F).
(5) In September 1999, the CDIC provided assistance in the amount of NT$1.284 billion to help Taiwan Bank to acquire the Dong-gang Credit Cooperative,reducing in deposit insurance fund.
(6) Article 4 of the Financial Restructuring Fund Statute stipulates that the Fund's resources include the CDIC's incremental insurance premium incomecovering a 10-year period starting January 2002 that arose as a result of the adjustment in the deposit insurance premium rate that took effect on January1, 2000.
(7) Annual figures are as of December 31.
0
0.5
1
1.5
2
2.5
1986 1988 1990 1992 1994 1996 1998 2000 2002 2004 2006 2008 2010
percentageof insured deposits
year
DRR of Taiwan from 2007
DIF reserves ratio of Taiwan
Fig. 1. Deposit Insurance Fund (DIF) reserve ratio and Designated Reserve Ratio (DRR), 1986–2010.
62 C.-L. Ho et al. / International Review of Economics and Finance 30 (2014) 57–77
63C.-L. Ho et al. / International Review of Economics and Finance 30 (2014) 57–77
However, some countries (e.g., Japan and Thailand) lacked any setting of DIF target level.23 In order to lessen the effect of theAsian financial crisis, the Japan government provided a blanket deposit guarantee from1996 to 2005.24 The Deposit InsuranceFund (DIF) was rapidly declining during the Asian financial crisis. Currently, the general deposits were insured up to 10 million(US$128,220) in Japan. In Thailand, during the 2008 global financial crisis, the government extended the blanket depositguarantee for two more years, until 10 August 2011. Due to the economic and financial recovery, the deposit coverage wasdecreased to Baht 50 million (US$1.6 million) in August 2012 and to Baht 1 million (US$32,431) per depositor per bank currently.
The DIF is implicitly guaranteed by the government. It is debatable whether the need to set a DIF target level. However, asmentioned previously, an adequate level of DIF can alleviate the spillover problem experienced in financial crisis. It can also builda merit to form a practical bank's cost of capital and loan rate. In this study, we examine the relationship between the levels ofDRR and the implicit cost to Taiwanese government to insure the DIF. The result not only can shed a light on examining theeffectiveness for setting a fixed target ratio for the DIF and can be used as lessons for other counties.
3. Methodology
There is not much research on measuring the adequacy of a deposit insurance fund in the options-based literature. Episcopos(2004) provides a model to estimate the implied reserves of a DIF under an exogenous coverage ratio set by the insuring agent. Inthis study, we first follow Merton (1977) and Ronn and Verma (1986) to estimate the values of deposit insurance for individualbanks when insolvency of the DIF is not considered. We then follow Episcopos (2004) to estimate the implied reserves of the DIFunder alternative targeted coverage ratios when insolvency is considered. Finally, we examine the adequacy of the DIF held by theCDIC. It should be noted that there are limitations with respect to option-based models of deposit insurance. For example, themodels include an exogenous asset return-generating process that is unchanged in the face of losses when banks face an elevatedprobability of closure. This assumption is highly unrealistic, since when banks face impending insolvency many incentives entertheir investment decision thinking.
3.1. Implied reserves and coverage ratio
Episcopos (2004) extends a framework from Johnson and Stulz (1987) to value deposit insurance while incorporating theeffect of the insolvency of the DIF. We follow Episcopos (2004) to consider banks are insured by the CDIC with an initial level ofthe DIF. The initial DIF, along with the premiums received, is invested at a risk-free rate until the deposit insurance contractmatures. When the government guarantee is not taken into account, the value of the coverage provided by the CDIC depends onthe adequacy of the DIF. Following Episcopos (2004), the coverage ratio is defined as follows:
23 InteSystems24 The2005, dmeasur
α ¼ p V ; θð ÞP
ð1Þ
P denotes the value of deposit insurance computed without considering the insufficiency of the DIF. That is, the CDIC is
whereassumed to provide full coverage of bank deposits under the government guaranty. With a government guaranty, α is set at 100%,and the value of deposit insurance a single bank, P, can be directly estimated following Ronn and Verma (1986). p(V, θ) denotesthe value of deposit insurance for partial coverage, where the government's guaranty is not taken into account. In the case ofpartial coverage, where α is set to be less than 100%, the value of p(V, θ) will depend on the level of DIF reserves, V, and a set ofparameters, θ, including bank asset volatility. When α is set below 100%, there is a probability that the CDIC cannot fulfill itspromises without the government's subsidy. For an exogenous targeted coverage ratio, the value of deposit insurance for partialcoverage, p(V, θ), can be derived from Eq. (1).In the case of a government guaranty, the value of deposit insurance, P, can be assessed by discounting the expected payoffs ofthe CDIC as follows:
P ¼ e−rTE1 Max DT−STk;0ð Þf g ð2Þ
E1 denotes the risk-neutral expectation over bank assets; DT is the value of a bank's insured domestic deposits at maturity
where(time T); ST is the value of bank assets at maturity; and k is the proportion of a bank's insured deposits to its total liabilities.Deposit insurance can be valued as a put option written on the bank asset value with a strike price equaling the value of theinsured deposits.Because the market value of the bank's assets and its volatility are not observable, we follow the framework of Ronn andVerma (1986) to estimate the value of a bank's assets and its volatility by solving Eqs. (3) and (4) simultaneously:
E ¼ SN xð Þ−LN x−σ s
ffiffiffiT
p� �ð3Þ
rnational Association of Deposit Insurers, the Research Subcommittee of the Asia-Pacific Regional Committee, Funding Mechanisms of Deposit Insurancein the Asia-Pacific Region (International Association of Deposit Insurers, the Research Subcommittee of the Asia-Pacific Regional Committee, 2011).Deposit Insurance Corporation of Japan (DICJ) gradually modified deposit insurance coverage from blanket guarantee coverage to limited coverage. Ineposits under full coverage have been limited to only two conditions: payment and settlement services deposits were fully protected as a permanente.

where
25 Undthat the26 See27 We
64 C.-L. Ho et al. / International Review of Economics and Finance 30 (2014) 57–77
σ s ¼σEESN xð Þ ð4Þ
x ¼ ln S=Lð Þ þ σ2s T=2
σ s
ffiffiffiT
p :
E denotes the market value of the bank's equity; S is the market value of the bank's assets; N(·) is the standard normalcumulative distribution function; L is the total liability of the bank; σs is the unobserved asset volatility; T is the time to the nextaudit date; and σE is the instantaneous standard deviation of the return on the bank's equity.
Once the values of the bank's assets and its volatility have been estimated, any value of deposit insurance under full coveragecan be computed using Eq. (5):
P ¼ e−rT
σ s
ffiffiffiT
pZ DT =k
0
DT−sks
f sds� �
ð5Þ
r denotes the risk-free rate. fS is the probability density function (pdf) of the return on the bank's assets, assumed to be
wherenormally distributed.25 The variables DT, σS, L, k, and T are described previously. Definitions of all variables are also provided in theAppendix G.When a bank fails, the CDIC pays depositor losses from the DIF first because deposit insurance is implicitly guaranteed by thegovernment. If the amount to be paid by the CDIC is higher than the DIF, the government needs to cover the shortage from generaltax revenues. Therefore, the implied value of the government guaranty can be estimated as the difference in the values of thedeposit insurance with and without the government guaranty.
We follow Episcopos (2004) to incorporate the impact of the adequacy of the DIF and value deposit insurance without thegovernment guaranty as a “vulnerable option”.26 At a certain level of the DIF reserve, the value of deposit insurance under partialcoverage can be described as follows:
p ¼ e−rTE1 Min VT;Max DT−STk;0ð Þ� �n o
ð6Þ
VT denotes the DIF available at time T.
whereUnder the assumption that the bank asset value is log normally distributed, and by analogy with Eq. (5), the value of depositinsurance computed without considering the government guaranty, p, can be described as follows:
p ¼ e−rT
σ s
ffiffiffiT
pZ ∞
0
Min VT;Max DT−sk;0ð Þ� �
sf sds
24
35: ð7Þ
Recall that p is the value of deposit insurance computed as though the government guaranty is not considered. P is the value ofdeposit insurance of full coverage. In general, given a targeted coverage ratio, p(V, θ) can be determined, and the implied reservesassociated with the targeted coverage ratio can be computed using Eq. (7).
3.2. Correlation among banks
Since the CDIC insures the deposits of a large number of banks, it faces the same portfolio risk as insured banks. To simplify theanalysis, Episcopos (2004) uses the average of correlation coefficients of the sample for all banks (0.54). We apply the estimatedcorrelation coefficients among the banks to estimate the implied reserves.27 We find the average correlation coefficient of the 36banks in 2000 is 0.59, which is similar to Episcopos' average correlation coefficient in 2000. In 2006, the average correlationcoefficients of 7 financial holding companies are 0.46 and of 16 individual banks is 0.32.
There is a close relation among banks in Taiwan; thus, one bank's failure may likely accompany another bank's failure. This isof particular concern, as five insured financial institutions have recently been taken over by the CDIC.
er the traditional assumption of option pricing models, the value of bank assets is assumed to be governed by a geometric Brownian motion. This impliesreturn on the bank assets at the next audit date will be normally distributed.Johnson and Stulz (1987) for the valuation of “vulnerable options”.include the true correlation coefficients of the banks and use Mathematica software to compute the implied reserves by a numerical approach.
65C.-L. Ho et al. / International Review of Economics and Finance 30 (2014) 57–77
The aggregate premiums for insuring Nmultiple banks in the cases with and without a government guaranty can be describedas follows:
28 To a29 In 2Supervi30 Sixt
P ¼ e−rT
ΠN
i¼1σ si
� TN2
Z ∞
0⋯Z ∞
0
XNi¼1
Max DiT−siki;0ð Þ
s1⋯sNf N s1; ⋯; sNð Þds1⋯dsN
266664
377775 ð8Þ
p ¼ e−rT
∏N
i¼Iðσ si
TN2
Þ
Z ∞
0⋯Z ∞
0
Min VT;
XΝi¼I
Max DiT−siki;0ð Þ !
SΙ⋯SΝf Ν si; ⋯; sΝð Þds1⋯dsΝ
266664
377775: ð9Þ
We estimate the aggregate premium under the government guaranty using Eq. (8). By analogy with the case of an individualbank, the aggregate premium under partial coverage, p(V, θ) can be derived under a targeted coverage ratio, α, and the impliedreserves of the DIF associated with the targeted coverage ratio, V, can be calculated using Eq. (9).
4. Data and summary statistics
The sample consists of 7 financial holding companies (FHCs) and 16 banks in 2006 and 36 banks in 2000.28 To investigate theeffectiveness of the passage of FHC Act and the implementation of Financial Restructuring Fund, we compare the costs for insuringfinancial institutions in 2000 with the costs in 2006. This is because the main financial reforms were set up and implementedduring the period from 2001 to 2005. For example, the FHC Act was enacted in 2001, and the Financial Restructuring Fundprovides blanket coverage from 2001 to 2005.
It should be noted, following the FHC Act, 7 banks merged with other financial institutions to become 7 new FHCs in 2001.Only publicly traded companies are included in our sample. Market equity value and total liabilities are extracted from the TaiwanEconomic Journal. The market value of equity is computed by the price per share times the number of common shares outstandingon December 31, 1999, and December 31, 2005. The volatility of equity is calculated as the annualized standard deviation of rateof return on equity from the daily return time series for the years 2000 and 2006. The risk-free rate (Taiwan bank's term depositinterest) for 1 year is 5.00% in 2000 and 2.33% in 2006. The percentages of insured deposits and domestic deposits are provided bythe CDIC. Insured deposits are equal to the maximum insurance coverage, which is set at NT$1 million and is limited to theprincipal of deposit. Domestic deposits are defined as the sum of checking accounts, passbook deposits, passbook savingsdeposits, time deposits, time savings deposits, and trust funds in New Taiwan dollars.29
FHCs consist of various types of subsidiaries, so we cannot identify the particular volatility of equity of a bank that is part of anFHC. To be included in our sample, we require that the ratio of the subsidiary banks' assets to total assets of the FHC be higher than50%. This narrows the sample to 7 FHCs.30 Among these 7 banks the lowest ratio of the bank assets to total assets of the FHC ratiois 55%. In 2006, the sum of the domestic deposits for 7 FHCs and 16 banks accounted for 50% of total deposits and 55% of all banks.In 2000, the sum of the domestic deposits for 36 domestic banks in our sample is accounted for 88% of total domestic deposits.
A special notemust bemade onMega FHC because of its uniqueness.Mega FHC as one of the 7 FHCs has two subsidiary banks.Weexamine only the International Commercial Bank of China (ICBC)whose asset size is twice as large as the other bank subsidiary, ChiaoTung Bank (CTB). ICBC and CTB formally merged into one bank under the name of Mega International Commercial Bank Co., Ltd., onAugust 21, 2006. At present, the ICBC and CTB conglomerate are subsidiaries of Mega FHC.
5. Results
Table 2 reports the basic information and the estimated asset values and asset volatilities for FHCs and banks in 2000 and 2006.Panels A and B report the descriptive statistics for 7 FHCs and 16 banks in 2006, respectively. Panel C shows descriptive statisticsfor 36 banks in 2000. We divide the data into FHCs and banks to highlight the difference between the financial institutions withdifferent organize structures. Panel A shows that the 7 FHCs had higher average market values of equity, total liabilities, domesticdeposits, and market values of assets than 16 banks in 2006. Panel B also shows huge differences in market values of equity, totalliabilities, domestic deposits, and market values of assets between the largest and smallest bank. For example, the market value ofequity of the largest bank (Bank 2) is NT$78,868 million and that of the smallest bank (Bank 16) is NT$2453 million.
void the bias during the period of financial crisis, we stop our period in 2006.007, domestic deposits were redefined as the sum of checking accounts, passbook deposits, time deposits, and other deposits that the Financialsory Commission has approved as insurable. All deposits are restricted to those denominated in New Taiwan Dollars.een FHCs were established after passage of the FHC Act in June 2001.
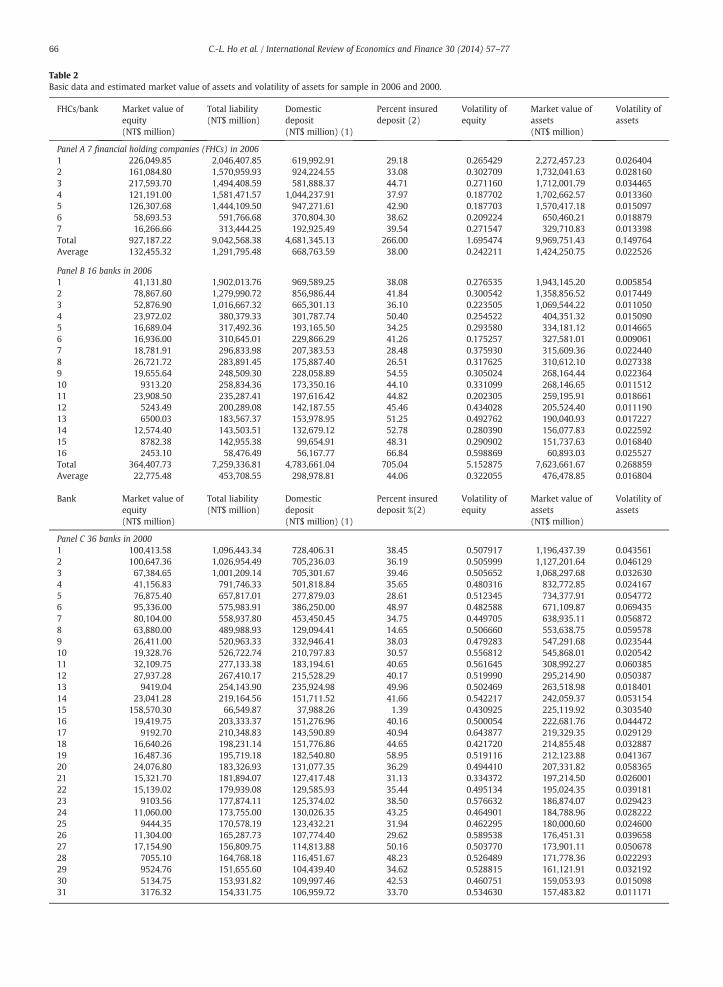
Table 2Basic data and estimated market value of assets and volatility of assets for sample in 2006 and 2000.
FHCs/bank Market value ofequity(NT$ million)
Total liability(NT$ million)
Domesticdeposit(NT$ million) (1)
Percent insureddeposit (2)
Volatility ofequity
Market value ofassets(NT$ million)
Volatility ofassets
Panel A 7 financial holding companies (FHCs) in 20061 226,049.85 2,046,407.85 619,992.91 29.18 0.265429 2,272,457.23 0.0264042 161,084.80 1,570,959.93 924,224.55 33.08 0.302709 1,732,041.63 0.0281603 217,593.70 1,494,408.59 581,888.37 44.71 0.271160 1,712,001.79 0.0344654 121,191.00 1,581,471.57 1,044,237.91 37.97 0.187702 1,702,662.57 0.0133605 126,307.68 1,444,109.50 947,271.61 42.90 0.187703 1,570,417.18 0.0150976 58,693.53 591,766.68 370,804.30 38.62 0.209224 650,460.21 0.0188797 16,266.66 313,444.25 192,925.49 39.54 0.271547 329,710.83 0.013398Total 927,187.22 9,042,568.38 4,681,345.13 266.00 1.695474 9,969,751.43 0.149764Average 132,455.32 1,291,795.48 668,763.59 38.00 0.242211 1,424,250.75 0.022526
Panel B 16 banks in 20061 41,131.80 1,902,013.76 969,589.25 38.08 0.276535 1,943,145.20 0.0058542 78,867.60 1,279,990.72 856,986.44 41.84 0.300542 1,358,856.52 0.0174493 52,876.90 1,016,667.32 665,301.13 36.10 0.223505 1,069,544.22 0.0110504 23,972.02 380,379.33 301,787.74 50.40 0.254522 404,351.32 0.0150905 16,689.04 317,492.36 193,165.50 34.25 0.293580 334,181.12 0.0146656 16,936.00 310,645.01 229,866.29 41.26 0.175257 327,581.01 0.0090617 18,781.91 296,833.98 207,383.53 28.48 0.375930 315,609.36 0.0224408 26,721.72 283,891.45 175,887.40 26.51 0.317625 310,612.10 0.0273389 19,655.64 248,509.30 228,058.89 54.55 0.305024 268,164.44 0.02236410 9313.20 258,834.36 173,350.16 44.10 0.331099 268,146.65 0.01151211 23,908.50 235,287.41 197,616.42 44.82 0.202305 259,195.91 0.01866112 5243.49 200,289.08 142,187.55 45.46 0.434028 205,524.40 0.01119013 6500.03 183,567.37 153,978.95 51.25 0.492762 190,040.93 0.01722714 12,574.40 143,503.51 132,679.12 52.78 0.280390 156,077.83 0.02259215 8782.38 142,955.38 99,654.91 48.31 0.290902 151,737.63 0.01684016 2453.10 58,476.49 56,167.77 66.84 0.598869 60,893.03 0.025527Total 364,407.73 7,259,336.81 4,783,661.04 705.04 5.152875 7,623,661.67 0.268859Average 22,775.48 453,708.55 298,978.81 44.06 0.322055 476,478.85 0.016804
Bank Market value ofequity(NT$ million)
Total liability(NT$ million)
Domesticdeposit(NT$ million) (1)
Percent insureddeposit %(2)
Volatility ofequity
Market value ofassets(NT$ million)
Volatility ofassets
Panel C 36 banks in 20001 100,413.58 1,096,443.34 728,406.31 38.45 0.507917 1,196,437.39 0.0435612 100,647.36 1,026,954.49 705,236.03 36.19 0.505999 1,127,201.64 0.0461293 67,384.65 1,001,209.14 705,301.67 39.46 0.505652 1,068,297.68 0.0326304 41,156.83 791,746.33 501,818.84 35.65 0.480316 832,772.85 0.0241675 76,875.40 657,817.01 277,879.03 28.61 0.512345 734,377.91 0.0547726 95,336.00 575,983.91 386,250.00 48.97 0.482588 671,109.87 0.0694357 80,104.00 558,937.80 453,450.45 34.75 0.449705 638,935.11 0.0568728 63,880.00 489,988.93 129,094.41 14.65 0.506660 553,638.75 0.0595789 26,411.00 520,963.33 332,946.41 38.03 0.479283 547,291.68 0.02354410 19,328.76 526,722.74 210,797.83 30.57 0.556812 545,868.01 0.02054211 32,109.75 277,133.38 183,194.61 40.65 0.561645 308,992.27 0.06038512 27,937.28 267,410.17 215,528.29 40.17 0.519990 295,214.90 0.05038713 9419.04 254,143.90 235,924.98 49.96 0.502469 263,518.98 0.01840114 23,041.28 219,164.56 151,711.52 41.66 0.542217 242,059.37 0.05315415 158,570.30 66,549.87 37,988.26 1.39 0.430925 225,119.92 0.30354016 19,419.75 203,333.37 151,276.96 40.16 0.500054 222,681.76 0.04447217 9192.70 210,348.83 143,590.89 40.94 0.643877 219,329.35 0.02912918 16,640.26 198,231.14 151,776.86 44.65 0.421720 214,855.48 0.03288719 16,487.36 195,719.18 182,540.80 58.95 0.519116 212,123.88 0.04136720 24,076.80 183,326.93 131,077.35 36.29 0.494410 207,331.82 0.05836521 15,321.70 181,894.07 127,417.48 31.13 0.334372 197,214.50 0.02600122 15,139.02 179,939.08 129,585.93 35.44 0.495134 195,024.35 0.03918123 9103.56 177,874.11 125,374.02 38.50 0.576632 186,874.07 0.02942324 11,060.00 173,755.00 130,026.35 43.25 0.464901 184,788.96 0.02822225 9444.35 170,578.19 123,432.21 31.94 0.462295 180,000.60 0.02460026 11,304.00 165,287.73 107,774.40 29.62 0.589538 176,451.31 0.03965827 17,154.90 156,809.75 114,813.88 50.16 0.503770 173,901.11 0.05067828 7055.10 164,768.18 116,451.67 48.23 0.526489 171,778.36 0.02229329 9524.76 151,655.60 104,439.40 34.62 0.528815 161,121.91 0.03219230 5134.75 153,931.82 109,997.46 42.53 0.460751 159,053.93 0.01509831 3176.32 154,331.75 106,959.72 33.70 0.534630 157,483.82 0.011171
66 C.-L. Ho et al. / International Review of Economics and Finance 30 (2014) 57–77
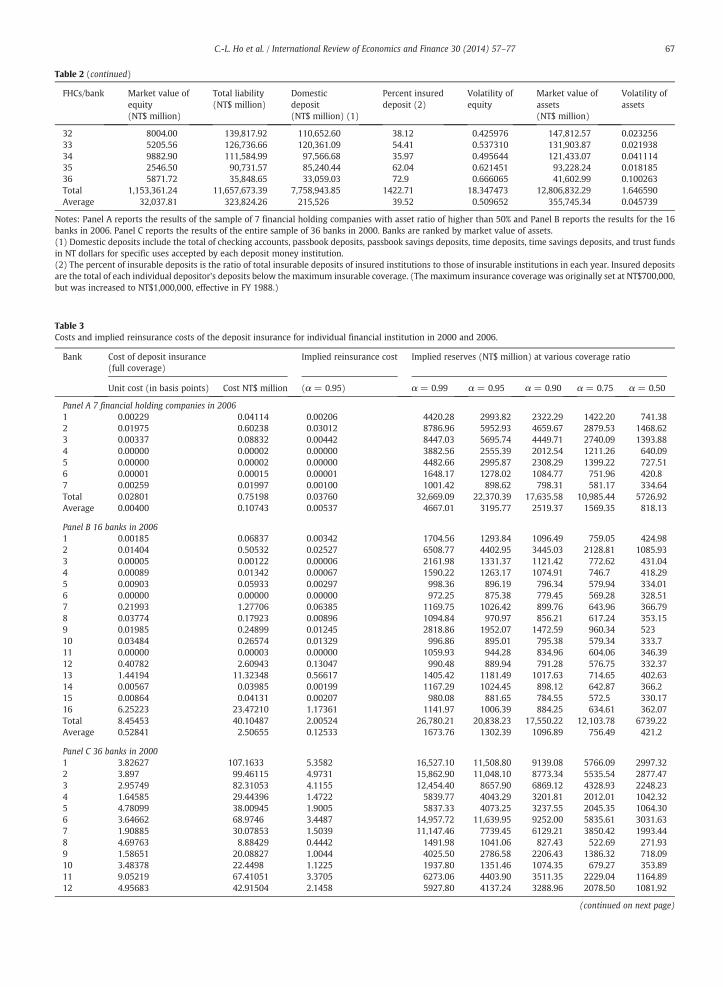
Table 2 (continued)
FHCs/bank Market value ofequity(NT$ million)
Total liability(NT$ million)
Domesticdeposit(NT$ million) (1)
Percent insureddeposit (2)
Volatility ofequity
Market value ofassets(NT$ million)
Volatility ofassets
32 8004.00 139,817.92 110,652.60 38.12 0.425976 147,812.57 0.02325633 5205.56 126,736.66 120,361.09 54.41 0.537310 131,903.87 0.02193834 9882.90 111,584.99 97,566.68 35.97 0.495644 121,433.07 0.04111435 2546.50 90,731.57 85,240.44 62.04 0.621451 93,228.24 0.01818536 5871.72 35,848.65 33,059.03 72.9 0.666065 41,602.99 0.100263Total 1,153,361.24 11,657,673.39 7,758,943.85 1422.71 18.347473 12,806,832.29 1.646590Average 32,037.81 323,824.26 215,526 39.52 0.509652 355,745.34 0.045739
Notes: Panel A reports the results of the sample of 7 financial holding companies with asset ratio of higher than 50% and Panel B reports the results for the 16banks in 2006. Panel C reports the results of the entire sample of 36 banks in 2000. Banks are ranked by market value of assets.(1) Domestic deposits include the total of checking accounts, passbook deposits, passbook savings deposits, time deposits, time savings deposits, and trust fundsin NT dollars for specific uses accepted by each deposit money institution.(2) The percent of insurable deposits is the ratio of total insurable deposits of insured institutions to those of insurable institutions in each year. Insured depositsare the total of each individual depositor's deposits below the maximum insurable coverage. (The maximum insurance coverage was originally set at NT$700,000,but was increased to NT$1,000,000, effective in FY 1988.)
Table 3Costs and implied reinsurance costs of the deposit insurance for individual financial institution in 2000 and 2006.
Bank Cost of deposit insurance(full coverage)
Implied reinsurance cost Implied reserves (NT$ million) at various coverage ratio
Unit cost (in basis points) Cost NT$ million (α = 0.95) α = 0.99 α = 0.95 α = 0.90 α = 0.75 α = 0.50
Panel A 7 financial holding companies in 20061 0.00229 0.04114 0.00206 4420.28 2993.82 2322.29 1422.20 741.382 0.01975 0.60238 0.03012 8786.96 5952.93 4659.67 2879.53 1468.623 0.00337 0.08832 0.00442 8447.03 5695.74 4449.71 2740.09 1393.884 0.00000 0.00002 0.00000 3882.56 2555.39 2012.54 1211.26 640.095 0.00000 0.00002 0.00000 4482.66 2995.87 2308.29 1399.22 727.516 0.00001 0.00015 0.00001 1648.17 1278.02 1084.77 751.96 420.87 0.00259 0.01997 0.00100 1001.42 898.62 798.31 581.17 334.64Total 0.02801 0.75198 0.03760 32,669.09 22,370.39 17,635.58 10,985.44 5726.92Average 0.00400 0.10743 0.00537 4667.01 3195.77 2519.37 1569.35 818.13
Panel B 16 banks in 20061 0.00185 0.06837 0.00342 1704.56 1293.84 1096.49 759.05 424.982 0.01404 0.50532 0.02527 6508.77 4402.95 3445.03 2128.81 1085.933 0.00005 0.00122 0.00006 2161.98 1331.37 1121.42 772.62 431.044 0.00089 0.01342 0.00067 1590.22 1263.17 1074.91 746.7 418.295 0.00903 0.05933 0.00297 998.36 896.19 796.34 579.94 334.016 0.00000 0.00000 0.00000 972.25 875.38 779.45 569.28 328.517 0.21993 1.27706 0.06385 1169.75 1026.42 899.76 643.96 366.798 0.03774 0.17923 0.00896 1094.84 970.97 856.21 617.24 353.159 0.01985 0.24899 0.01245 2818.86 1952.07 1472.59 960.34 52310 0.03484 0.26574 0.01329 996.86 895.01 795.38 579.34 333.711 0.00000 0.00003 0.00000 1059.93 944.28 834.96 604.06 346.3912 0.40782 2.60943 0.13047 990.48 889.94 791.28 576.75 332.3713 1.44194 11.32348 0.56617 1405.42 1181.49 1017.63 714.65 402.6314 0.00567 0.03985 0.00199 1167.29 1024.45 898.12 642.87 366.215 0.00864 0.04131 0.00207 980.08 881.65 784.55 572.5 330.1716 6.25223 23.47210 1.17361 1141.97 1006.39 884.25 634.61 362.07Total 8.45453 40.10487 2.00524 26,780.21 20,838.23 17,550.22 12,103.78 6739.22Average 0.52841 2.50655 0.12533 1673.76 1302.39 1096.89 756.49 421.2
Panel C 36 banks in 20001 3.82627 107.1633 5.3582 16,527.10 11,508.80 9139.08 5766.09 2997.322 3.897 99.46115 4.9731 15,862.90 11,048.10 8773.34 5535.54 2877.473 2.95749 82.31053 4.1155 12,454.40 8657.90 6869.12 4328.93 2248.234 1.64585 29.44396 1.4722 5839.77 4043.29 3201.81 2012.01 1042.325 4.78099 38.00945 1.9005 5837.33 4073.25 3237.55 2045.35 1064.306 3.64662 68.9746 3.4487 14,957.72 11,639.95 9252.00 5835.61 3031.637 1.90885 30.07853 1.5039 11,147.46 7739.45 6129.21 3850.42 1993.448 4.69763 8.88429 0.4442 1491.98 1041.06 827.43 522.69 271.939 1.58651 20.08827 1.0044 4025.50 2786.58 2206.43 1386.32 718.0910 3.48378 22.4498 1.1225 1937.80 1351.46 1074.35 679.27 353.8911 9.05219 67.41051 3.3705 6273.06 4403.90 3511.35 2229.04 1164.8912 4.95683 42.91504 2.1458 5927.80 4137.24 3288.96 2078.50 1081.92
(continued on next page)
67C.-L. Ho et al. / International Review of Economics and Finance 30 (2014) 57–77
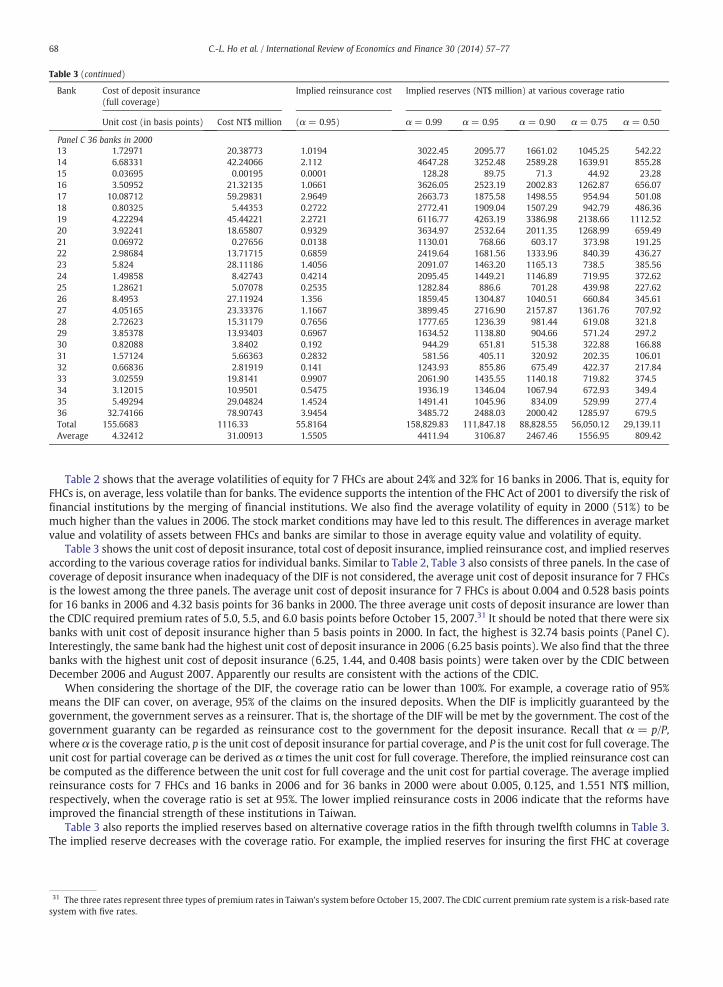
Table 3 (continued)
Bank Cost of deposit insurance(full coverage)
Implied reinsurance cost Implied reserves (NT$ million) at various coverage ratio
Unit cost (in basis points) Cost NT$ million (α = 0.95) α = 0.99 α = 0.95 α = 0.90 α = 0.75 α = 0.50
13 1.72971 20.38773 1.0194 3022.45 2095.77 1661.02 1045.25 542.2214 6.68331 42.24066 2.112 4647.28 3252.48 2589.28 1639.91 855.2815 0.03695 0.00195 0.0001 128.28 89.75 71.3 44.92 23.2816 3.50952 21.32135 1.0661 3626.05 2523.19 2002.83 1262.87 656.0717 10.08712 59.29831 2.9649 2663.73 1875.58 1498.55 954.94 501.0818 0.80325 5.44353 0.2722 2772.41 1909.04 1507.29 942.79 486.3619 4.22294 45.44221 2.2721 6116.77 4263.19 3386.98 2138.66 1112.5220 3.92241 18.65807 0.9329 3634.97 2532.64 2011.35 1268.99 659.4921 0.06972 0.27656 0.0138 1130.01 768.66 603.17 373.98 191.2522 2.98684 13.71715 0.6859 2419.64 1681.56 1333.96 840.39 436.2723 5.824 28.11186 1.4056 2091.07 1463.20 1165.13 738.5 385.5624 1.49858 8.42743 0.4214 2095.45 1449.21 1146.89 719.95 372.6225 1.28621 5.07078 0.2535 1282.84 886.6 701.28 439.98 227.6226 8.4953 27.11924 1.356 1859.45 1304.87 1040.51 660.84 345.6127 4.05165 23.33376 1.1667 3899.45 2716.90 2157.87 1361.76 707.9228 2.72623 15.31179 0.7656 1777.65 1236.39 981.44 619.08 321.829 3.85378 13.93403 0.6967 1634.52 1138.80 904.66 571.24 297.230 0.82088 3.8402 0.192 944.29 651.81 515.38 322.88 166.8831 1.57124 5.66363 0.2832 581.56 405.11 320.92 202.35 106.0132 0.66836 2.81919 0.141 1243.93 855.86 675.49 422.37 217.8433 3.02559 19.8141 0.9907 2061.90 1435.55 1140.18 719.82 374.534 3.12015 10.9501 0.5475 1936.19 1346.04 1067.94 672.93 349.435 5.49294 29.04824 1.4524 1491.41 1045.96 834.09 529.99 277.436 32.74166 78.90743 3.9454 3485.72 2488.03 2000.42 1285.97 679.5Total 155.6683 1116.33 55.8164 158,829.83 111,847.18 88,828.55 56,050.12 29,139.11Average 4.32412 31.00913 1.5505 4411.94 3106.87 2467.46 1556.95 809.42
Panel C 36 banks in 2000
68 C.-L. Ho et al. / International Review of Economics and Finance 30 (2014) 57–77
Table 2 shows that the average volatilities of equity for 7 FHCs are about 24% and 32% for 16 banks in 2006. That is, equity forFHCs is, on average, less volatile than for banks. The evidence supports the intention of the FHC Act of 2001 to diversify the risk offinancial institutions by the merging of financial institutions. We also find the average volatility of equity in 2000 (51%) to bemuch higher than the values in 2006. The stock market conditions may have led to this result. The differences in average marketvalue and volatility of assets between FHCs and banks are similar to those in average equity value and volatility of equity.
Table 3 shows the unit cost of deposit insurance, total cost of deposit insurance, implied reinsurance cost, and implied reservesaccording to the various coverage ratios for individual banks. Similar to Table 2, Table 3 also consists of three panels. In the case ofcoverage of deposit insurance when inadequacy of the DIF is not considered, the average unit cost of deposit insurance for 7 FHCsis the lowest among the three panels. The average unit cost of deposit insurance for 7 FHCs is about 0.004 and 0.528 basis pointsfor 16 banks in 2006 and 4.32 basis points for 36 banks in 2000. The three average unit costs of deposit insurance are lower thanthe CDIC required premium rates of 5.0, 5.5, and 6.0 basis points before October 15, 2007.31 It should be noted that there were sixbanks with unit cost of deposit insurance higher than 5 basis points in 2000. In fact, the highest is 32.74 basis points (Panel C).Interestingly, the same bank had the highest unit cost of deposit insurance in 2006 (6.25 basis points). We also find that the threebanks with the highest unit cost of deposit insurance (6.25, 1.44, and 0.408 basis points) were taken over by the CDIC betweenDecember 2006 and August 2007. Apparently our results are consistent with the actions of the CDIC.
When considering the shortage of the DIF, the coverage ratio can be lower than 100%. For example, a coverage ratio of 95%means the DIF can cover, on average, 95% of the claims on the insured deposits. When the DIF is implicitly guaranteed by thegovernment, the government serves as a reinsurer. That is, the shortage of the DIF will be met by the government. The cost of thegovernment guaranty can be regarded as reinsurance cost to the government for the deposit insurance. Recall that α = p/P,where α is the coverage ratio, p is the unit cost of deposit insurance for partial coverage, and P is the unit cost for full coverage. Theunit cost for partial coverage can be derived as α times the unit cost for full coverage. Therefore, the implied reinsurance cost canbe computed as the difference between the unit cost for full coverage and the unit cost for partial coverage. The average impliedreinsurance costs for 7 FHCs and 16 banks in 2006 and for 36 banks in 2000 were about 0.005, 0.125, and 1.551 NT$ million,respectively, when the coverage ratio is set at 95%. The lower implied reinsurance costs in 2006 indicate that the reforms haveimproved the financial strength of these institutions in Taiwan.
Table 3 also reports the implied reserves based on alternative coverage ratios in the fifth through twelfth columns in Table 3.The implied reserve decreases with the coverage ratio. For example, the implied reserves for insuring the first FHC at coverage
31 The three rates represent three types of premium rates in Taiwan's system before October 15, 2007. The CDIC current premium rate system is a risk-based ratesystem with five rates.
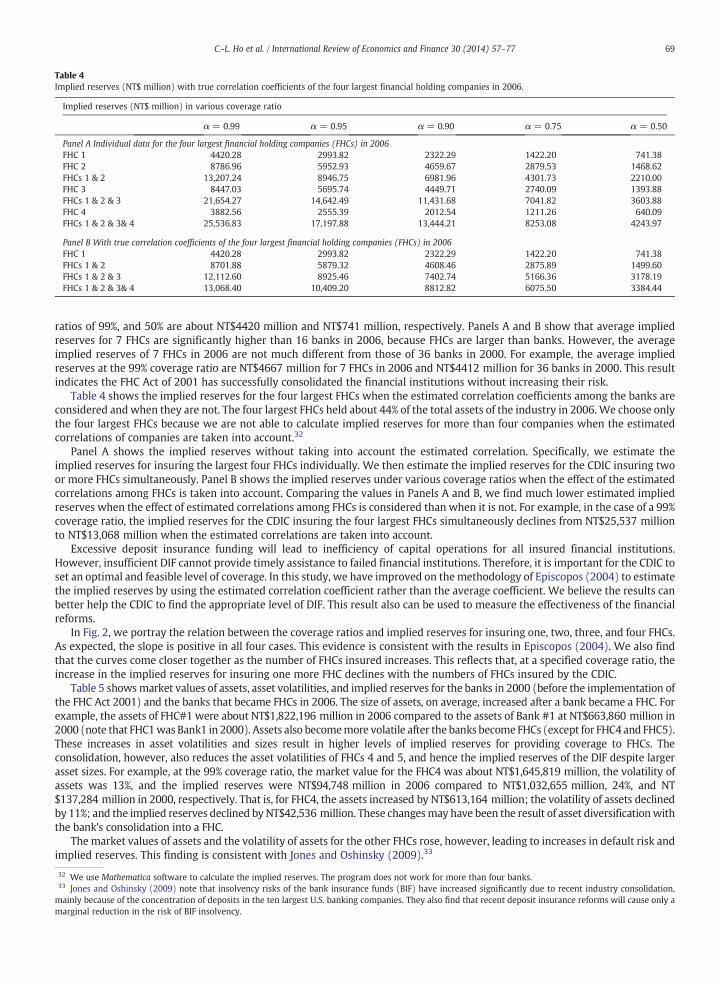
Table 4Implied reserves (NT$ million) with true correlation coefficients of the four largest financial holding companies in 2006.
Implied reserves (NT$ million) in various coverage ratio
α = 0.99 α = 0.95 α = 0.90 α = 0.75 α = 0.50
Panel A Individual data for the four largest financial holding companies (FHCs) in 2006FHC 1 4420.28 2993.82 2322.29 1422.20 741.38FHC 2 8786.96 5952.93 4659.67 2879.53 1468.62FHCs 1 & 2 13,207.24 8946.75 6981.96 4301.73 2210.00FHC 3 8447.03 5695.74 4449.71 2740.09 1393.88FHCs 1 & 2 & 3 21,654.27 14,642.49 11,431.68 7041.82 3603.88FHC 4 3882.56 2555.39 2012.54 1211.26 640.09FHCs 1 & 2 & 3& 4 25,536.83 17,197.88 13,444.21 8253.08 4243.97
Panel B With true correlation coefficients of the four largest financial holding companies (FHCs) in 2006FHC 1 4420.28 2993.82 2322.29 1422.20 741.38FHCs 1 & 2 8701.88 5879.32 4608.46 2875.89 1499.60FHCs 1 & 2 & 3 12,112.60 8925.46 7402.74 5166.36 3178.19FHCs 1 & 2 & 3& 4 13,068.40 10,409.20 8812.82 6075.50 3384.44
69C.-L. Ho et al. / International Review of Economics and Finance 30 (2014) 57–77
ratios of 99%, and 50% are about NT$4420 million and NT$741 million, respectively. Panels A and B show that average impliedreserves for 7 FHCs are significantly higher than 16 banks in 2006, because FHCs are larger than banks. However, the averageimplied reserves of 7 FHCs in 2006 are not much different from those of 36 banks in 2000. For example, the average impliedreserves at the 99% coverage ratio are NT$4667 million for 7 FHCs in 2006 and NT$4412 million for 36 banks in 2000. This resultindicates the FHC Act of 2001 has successfully consolidated the financial institutions without increasing their risk.
Table 4 shows the implied reserves for the four largest FHCs when the estimated correlation coefficients among the banks areconsidered and when they are not. The four largest FHCs held about 44% of the total assets of the industry in 2006. We choose onlythe four largest FHCs because we are not able to calculate implied reserves for more than four companies when the estimatedcorrelations of companies are taken into account.32
Panel A shows the implied reserves without taking into account the estimated correlation. Specifically, we estimate theimplied reserves for insuring the largest four FHCs individually. We then estimate the implied reserves for the CDIC insuring twoor more FHCs simultaneously. Panel B shows the implied reserves under various coverage ratios when the effect of the estimatedcorrelations among FHCs is taken into account. Comparing the values in Panels A and B, we find much lower estimated impliedreserves when the effect of estimated correlations among FHCs is considered than when it is not. For example, in the case of a 99%coverage ratio, the implied reserves for the CDIC insuring the four largest FHCs simultaneously declines from NT$25,537 millionto NT$13,068 million when the estimated correlations are taken into account.
Excessive deposit insurance funding will lead to inefficiency of capital operations for all insured financial institutions.However, insufficient DIF cannot provide timely assistance to failed financial institutions. Therefore, it is important for the CDIC toset an optimal and feasible level of coverage. In this study, we have improved on the methodology of Episcopos (2004) to estimatethe implied reserves by using the estimated correlation coefficient rather than the average coefficient. We believe the results canbetter help the CDIC to find the appropriate level of DIF. This result also can be used to measure the effectiveness of the financialreforms.
In Fig. 2, we portray the relation between the coverage ratios and implied reserves for insuring one, two, three, and four FHCs.As expected, the slope is positive in all four cases. This evidence is consistent with the results in Episcopos (2004). We also findthat the curves come closer together as the number of FHCs insured increases. This reflects that, at a specified coverage ratio, theincrease in the implied reserves for insuring one more FHC declines with the numbers of FHCs insured by the CDIC.
Table 5 showsmarket values of assets, asset volatilities, and implied reserves for the banks in 2000 (before the implementation ofthe FHC Act 2001) and the banks that became FHCs in 2006. The size of assets, on average, increased after a bank became a FHC. Forexample, the assets of FHC#1 were about NT$1,822,196 million in 2006 compared to the assets of Bank #1 at NT$663,860 million in2000 (note that FHC1was Bank1 in 2000). Assets also becomemore volatile after the banks becomeFHCs (except for FHC4 and FHC5).These increases in asset volatilities and sizes result in higher levels of implied reserves for providing coverage to FHCs. Theconsolidation, however, also reduces the asset volatilities of FHCs 4 and 5, and hence the implied reserves of the DIF despite largerasset sizes. For example, at the 99% coverage ratio, the market value for the FHC4 was about NT$1,645,819 million, the volatility ofassets was 13%, and the implied reserves were NT$94,748 million in 2006 compared to NT$1,032,655 million, 24%, and NT$137,284 million in 2000, respectively. That is, for FHC4, the assets increased by NT$613,164 million; the volatility of assets declinedby 11%; and the implied reserves declined by NT$42,536 million. These changesmay have been the result of asset diversificationwiththe bank's consolidation into a FHC.
The market values of assets and the volatility of assets for the other FHCs rose, however, leading to increases in default risk andimplied reserves. This finding is consistent with Jones and Oshinsky (2009).33
32 We use Mathematica software to calculate the implied reserves. The program does not work for more than four banks.33 Jones and Oshinsky (2009) note that insolvency risks of the bank insurance funds (BIF) have increased significantly due to recent industry consolidation,mainly because of the concentration of deposits in the ten largest U.S. banking companies. They also find that recent deposit insurance reforms will cause only amarginal reduction in the risk of BIF insolvency.
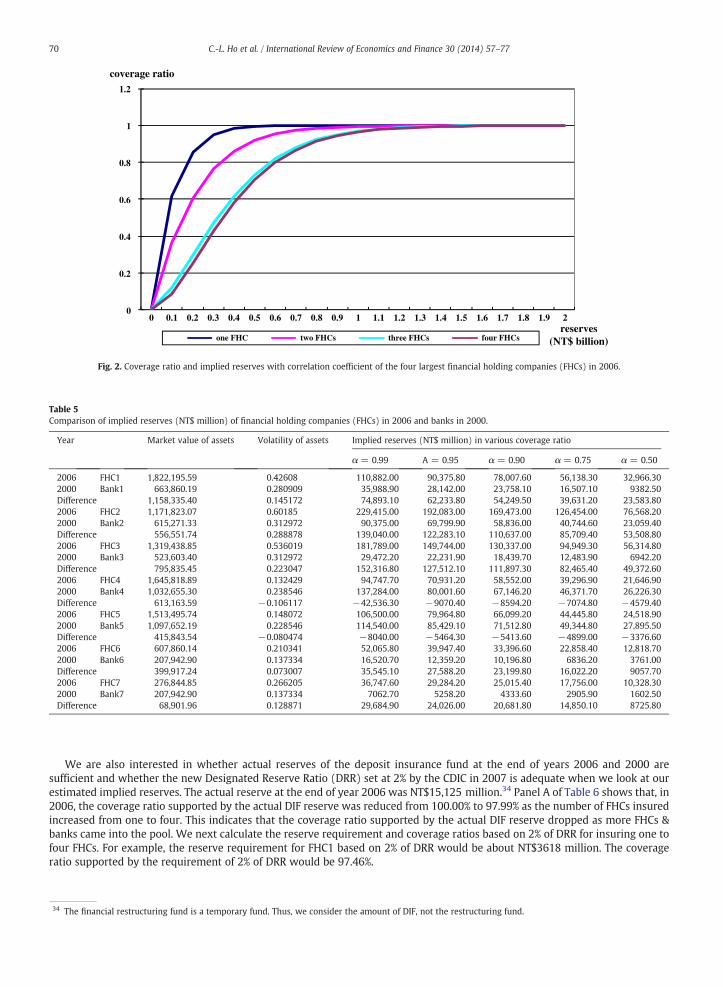
Table 5Comparison of implied reserves (NT$ million) of financial holding companies (FHCs) in 2006 and banks in 2000.
Year Market value of assets Volatility of assets Implied reserves (NT$ million) in various coverage ratio
α = 0.99 Α = 0.95 α = 0.90 α = 0.75 α = 0.50
2006 FHC1 1,822,195.59 0.42608 110,882.00 90,375.80 78,007.60 56,138.30 32,966.302000 Bank1 663,860.19 0.280909 35,988.90 28,142.00 23,758.10 16,507.10 9382.50Difference 1,158,335.40 0.145172 74,893.10 62,233.80 54,249.50 39,631.20 23,583.802006 FHC2 1,171,823.07 0.60185 229,415.00 192,083.00 169,473.00 126,454.00 76,568.202000 Bank2 615,271.33 0.312972 90,375.00 69,799.90 58,836.00 40,744.60 23,059.40Difference 556,551.74 0.288878 139,040.00 122,283.10 110,637.00 85,709.40 53,508.802006 FHC3 1,319,438.85 0.536019 181,789.00 149,744.00 130,337.00 94,949.30 56,314.802000 Bank3 523,603.40 0.312972 29,472.20 22,231.90 18,439.70 12,483.90 6942.20Difference 795,835.45 0.223047 152,316.80 127,512.10 111,897.30 82,465.40 49,372.602006 FHC4 1,645,818.89 0.132429 94,747.70 70,931.20 58,552.00 39,296.90 21,646.902000 Bank4 1,032,655.30 0.238546 137,284.00 80,001.60 67,146.20 46,371.70 26,226.30Difference 613,163.59 −0.106117 −42,536.30 −9070.40 −8594.20 −7074.80 −4579.402006 FHC5 1,513,495.74 0.148072 106,500.00 79,964.80 66,099.20 44,445.80 24,518.902000 Bank5 1,097,652.19 0.228546 114,540.00 85,429.10 71,512.80 49,344.80 27,895.50Difference 415,843.54 −0.080474 −8040.00 −5464.30 −5413.60 −4899.00 −3376.602006 FHC6 607,860.14 0.210341 52,065.80 39,947.40 33,396.60 22,858.40 12,818.702000 Bank6 207,942.90 0.137334 16,520.70 12,359.20 10,196.80 6836.20 3761.00Difference 399,917.24 0.073007 35,545.10 27,588.20 23,199.80 16,022.20 9057.702006 FHC7 276,844.85 0.266205 36,747.60 29,284.20 25,015.40 17,756.00 10,328.302000 Bank7 207,942.90 0.137334 7062.70 5258.20 4333.60 2905.90 1602.50Difference 68,901.96 0.128871 29,684.90 24,026.00 20,681.80 14,850.10 8725.80
0
0.2
0.4
0.6
0.8
1
1.2
0 0.1 0.2 0.3 0.4 0.5 0.6 0.7 0.8 0.9 1 1.1 1.2 1.3 1.4 1.5 1.6 1.7 1.8 1.9 2reserves
(NT$ billion)one FHC two FHCs three FHCs four FHCs
coverage ratio
Fig. 2. Coverage ratio and implied reserves with correlation coefficient of the four largest financial holding companies (FHCs) in 2006.
70 C.-L. Ho et al. / International Review of Economics and Finance 30 (2014) 57–77
We are also interested in whether actual reserves of the deposit insurance fund at the end of years 2006 and 2000 aresufficient and whether the new Designated Reserve Ratio (DRR) set at 2% by the CDIC in 2007 is adequate when we look at ourestimated implied reserves. The actual reserve at the end of year 2006 was NT$15,125 million.34 Panel A of Table 6 shows that, in2006, the coverage ratio supported by the actual DIF reserve was reduced from 100.00% to 97.99% as the number of FHCs insuredincreased from one to four. This indicates that the coverage ratio supported by the actual DIF reserve dropped as more FHCs &banks came into the pool. We next calculate the reserve requirement and coverage ratios based on 2% of DRR for insuring one tofour FHCs. For example, the reserve requirement for FHC1 based on 2% of DRR would be about NT$3618 million. The coverageratio supported by the requirement of 2% of DRR would be 97.46%.
34 The financial restructuring fund is a temporary fund. Thus, we consider the amount of DIF, not the restructuring fund.

Table 6Coverage ratio for the 4 largest financial holding companies (FHCs) in 2006 and 4 banks in 2000.
FHCs FHC 1 FHCs 1–2 FHCs 1–3 FHCs 1–4
Panel A: DIF, DRR, and coverage ratio in 2006Actual DIF reserve (NT$ million) $15,125 $15,125 $15,125 $15,125Coverage ratio based on actual DIF reserve 100% 99.95% 99.53% 97.99%Reserves based on 2% DRR (NT$ million) $3617.72 $9732.58 $14,935.53 $22,866.30Coverage ratio based on 2% DRR 97.46% 99.45% 99.78% 100%
Banks Bank 1 Banks 1–2 Banks 1–3 Banks 1–4
Panel B DIF, DRR, and coverage ratio in 2000Actual DIF reserve (NT$ million) $4840 $4840 $4840 $4840Coverage ratio based on actual DIF reserve 68.29% 38.11% 35.82% 27.28%Reserves based on 2% DRR (NT$ million) $5602.00 $10,706.76 $16,273.64 $19,851.50Coverage ratio based on 2% DRR 73.91% 80.46% 78.34% 81.37%
71C.-L. Ho et al. / International Review of Economics and Finance 30 (2014) 57–77
The second row in Panel B shows that the actual DIF reserve of NT$4840 million at the end of 2000 could provide only 68% ofthe necessary coverage. That is a 32% default risk for the DIF just for insuring one bank. The coverage ratio was as low as 27.28% forinsuring four banks. If the reserve of the DIF is set at 2%, then the coverage ratio ranges from 73.91% to 81.37%. Thus, the actual DIFreserve or a DIF based on 2% of DRR is not sufficient to cover potential bank failures, given our calculation of implied reserves.
The results in Table 6 do not purport to say that 2% of DRR is sufficient for the entire banking industry. Rather, the resultsdemonstrate two main points. First, the actual DIF reserve of NT$4840 million was severely insufficient in 2000. Second, 2% ofDRR may have been sufficient in 2006 but might not have been adequate in 2000.
In Table 6, our analysis is based on four FHCs and four banks. We extend the analysis to include all FHCs and banks in thesample and report the results in Table 7. Column 1 of Table 7 shows the sum of insured deposits, and column 2 shows the reservesbased on 2% of DRR. Column 3 shows our estimates of the sum of implied reserves for all FHCs and banks in the sample. Forexample, the reserves based on 2% of DRR would be NT$35,384 million, while the sum of implied reserves (coverage ratio 99%)is NT$32,669 million for the 7 FHCs in 2006. This means that a 2% DRR is sufficient. On the other hand, Panel C of Table 7shows the reserves based on 2% of DRR would be NT$60,555 million, while the sum of implied reserves (coverage ratio 99%) is NT$158,830 million for the 36 banks in 2000. In other words, 2% of a DRR requirement is not sufficient. Another way to look atthe issue is to examine how high a DRR is sufficient. For coverage ratio at 99%, we find that DRRs of 1.85%, 1.36%, and 5.25%were adequate for 7 FHCs in 2006, 16 banks in 2006, and 36 banks in 2000, respectively. The evidence shows that while 2% of DRRwas adequate for 2006, it was not sufficient for 2000. The results imply that the fixed target ratio for the DIF set by the CDIC maynot be appropriate in various financial market environments. Pennacchi (2000) shows that target policy may lead to distortions inbanks' cost of deposit financing. There are fewer distortions if premiums are adjusted and the fund/deposit ratio is targetedslowly.
6. Discussion and recommendations on the adequacy of the deposit insurance fund
Our result shows that 2% of DRR was not adequate for the condition in 2000.35 To ensure that the DIF in Taiwan should havebeen adequate in 2000, one alternative, according to our calculations, is to increase the DRR to 5.25%. Although adding to the DIFmay ensure stability of the financial system, there are also additional costs involved. A higher DIF results in a higher cost of capitalfor banks, thereby reducing competitiveness. It also means too much money stays unused for other purposes (e.g., defense, healthcare for the poor, and other government programs).
The U.S. FDIC provides some interesting points for discussion.36 The FDIC proposes consideration of statutory factors insetting the DRR, such as risk of losses to the DIF, economic conditions affecting FDIC-insured institutions, and prevention of sharpswings in assessment rates, among others. Specifically, when the risk of losses to the DIF is high, the DRR should be high. As weconsider the U.S. experience, the CDIC in Taiwan may want to consider economic stress events and their impact on losses to theDIF.
Some have argued that the FDIC should reduce DRR when the economy and banking industry is in good health. The FDICcurrent practice is that the DIF is allowed to increase when economic conditions are good and decline when conditions are bad.Thus, the FDIC need not raise assessments sharply when economic conditions are bad. In other words, the FDIC should chargepremiums on a countercyclical basis; apparently the FDIC believes that favorable economic conditions and strong banking
35 Please see Section 5.36 Please refer to the FDIC website http://www.fdic.gov/deposit/insurance/initiative/designated.pdf.

Table 7Reserves based on 2% DRR and DRR required at coverage ratio of 99% for all financial holding companies (FHCs) and banks.
Sum of insured deposits(NT$ million)
Reserves based on 2% DRR(NT$ million)
Sum of implied reserves for FHCs orbanks based on coverage ratio = 0.99(NT$ million)
DRR required at coverage ratio = 0.99(NT$ million)
Panel A 7 FHCs in 2006$1,769,177 $35,384 $32,669.09 1.85%
Panel B 16 banks in 2006$1,975,462 $39,509 $26,780.21 1.36%
Panel C 36 banks in 2000$3,027,760 $60,555 $158,829.83 5.25%
72 C.-L. Ho et al. / International Review of Economics and Finance 30 (2014) 57–77
industry conditions are not necessarily a justification for lowering the DRR. The CDIC in Taiwan should benefit from theexperience of the FDIC in U.S. and consider the cost of the capital invested in a bank insurance fund.
7. Conclusion
To stabilize its financial environment, the Taiwanese government has put forward a series of financial reforms. Among thesereforms, the enactment of Financial Holding Company Act and the establishment of Financial Restructuring Fund are importantones. The FHC Act of 2001 was enacted to increase the synergies among financial institutions, to stabilize the financial market, andto protect the public interest. The result shows that the implied reserves for insuring the whole sample of financial institutionswere lower in 2006 than in 2000. The evidence supports the objective of the FHC Act. The Financial Restructuring Fund wasestablished in 2001 to provide blanket coverage to financial institutions from 2001 to 2005. In this study, we have examined theeffectiveness of these financial reforms and their effects on the adequacy of deposit insurance fund (DIF). We also have assessedthe adequacy of the Designated Reserve Ratio (DRR) strategy imposed by the CDIC in 2007.
Our results show that FHCs, on average, are less volatile than banks despite higher average equity (asset) for FHCs than banksin 2006, and also show lower unit cost of deposit insurance for insuring 7 FHCs than for insuring banks despite the FHCs havelarger size than the banks. Furthermore, we find the implied reserves estimated when incorporating the estimated correlationsamong FHCs are much lower than the implied reserves estimated when the average coefficient is used. We also find that theassets are less volatile and implied reserves are smaller for two out of 7 FHCs despite their having become larger. These results areconsistent with the objectives of the FHC Act and the Financial Restructuring Fund Statute.
Finally, when comparing the estimated implied reserves with the actual reserve of DIF, we also conclude that the DIF was quiteinsufficient in 2000. Nor would the DIF have been sufficient in 2000 according to the new Designated Reserve Ratio (DRR)strategy of 2% imposed by the CDIC in 2007. On the other hand, the DIF might have been sufficient in 2006 at a 2% DRR. Wetherefore recommend that, rather than use a fixed rate, the CDIC alter the DRR over time according to economic conditions andinsured deposit growth. Excess lending by banks in Europe might be one of the reasons that caused European financial crisis.Apparently, DIFs for countries such as Greece and Spain were not sufficient. For example, Spain spent more than 22 billion euro tobailout Bankia. On June 6, 2010 the European Commission proposed that each financial institution would need to 1% of thedeposits for a special fund to finance the resolution for future banking crisis starting in 2018. The concept of 1% fixed rate may notbe appropriate. We believe that a flexible rate based on economic conditions and insured deposit growth may be better based onthe experience from Taiwan.
Our results of the effect of Taiwan financial reforms, improved methods of calculating estimates of the cost of depositinsurance and implied reserve, and the discussion of the strategy of DRR can be used as lessons for other countries. For example,some countries (e.g., Korea and Thailand) provided blanket guarantee deposit insurance (full coverage) during 2007 financialcrisis. Using our methods, each country can calculate the implicit costs of government guaranty of the DIF. The evidence in Taiwanshows that a fixed target ratio for DIF may not be appropriate. Instead, altering the DRR over time according to economicconditions and insured deposit growth may be more appropriate. This type of strategy can be a lesson for other countries.
Other lessons learned from the experiences from the reforms of Taiwan and other countries are stated below. First, FHC Actwas successfully implemented in Taiwan and reduces the volatilities of the financial market. It is worthwhile for other countriesto consider this approach as long as the regulators are careful the negative effects of holding company structure such as themisuse of derivatives. Finally, some types of restructuring funds such as Financial Restructuring Fund in Taiwan. Resolution andCollection Corporation in Japan, or Non-Performing Asset Management Fund in Korea to resolve issues related to insolventfinancial institutions are critical to the stability of financial markets.
Acknowledgments
We thank the editor and referees for helpful suggestions.
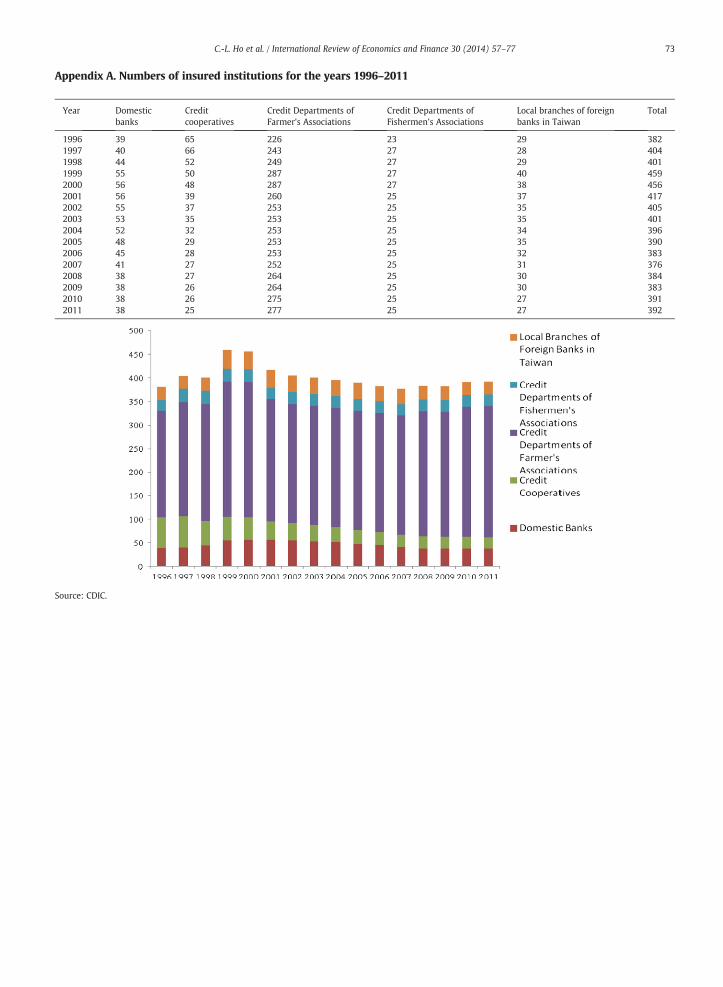
73C.-L. Ho et al. / International Review of Economics and Finance 30 (2014) 57–77
Appendix A. Numbers of insured institutions for the years 1996–2011
Year Domesticbanks
Creditcooperatives
Credit Departments ofFarmer's Associations
Credit Departments ofFishermen's Associations
Local branches of foreignbanks in Taiwan
Total
1996 39 65 226 23 29 3821997 40 66 243 27 28 4041998 44 52 249 27 29 4011999 55 50 287 27 40 4592000 56 48 287 27 38 4562001 56 39 260 25 37 4172002 55 37 253 25 35 4052003 53 35 253 25 35 4012004 52 32 253 25 34 3962005 48 29 253 25 35 3902006 45 28 253 25 32 3832007 41 27 252 25 31 3762008 38 27 264 25 30 3842009 38 26 264 25 30 3832010 38 26 275 25 27 3912011 38 25 277 25 27 392
Source: CDIC.

74 C.-L. Ho et al. / International Review of Economics and Finance 30 (2014) 57–77
Appendix B. NPL ratios (non-performing loan ratio) in Taiwan from 2000 to 2011
Appendix C. Financial institutions taken over by the CDIC in 2006 and 2007
Private financial institutions Date of take-overby CDIC
Financial RestructuringFund (NT$ million)
DIF of CDIC(NT$ million)
Total(NT$ million)
Enterprise Bank of Hualien 2006/12/15 −1157.62 −3761.64 −4919.26Taitung Business Bank 2007/01/05 −1175.62 −4632.85 −5808.47Chinese Bank 2007/01/06 −1708.85 −6081.74 −7790.59China Hina United Trust & Investment Group 2007/03/30 −19,900.62 −29,652.05 −49,552.67Bowa Bank 2007/08/10 −16,676.01 −25,014.01 −41,690.02Total −40,618.72 −69,142.29 −109,761.01
Notes: The Executive Yuan, an executive branch of Taiwan government approved the combined DIF and Financial Restructuring Fund on November 15, 2006.
Appendix D. Financial reforms in Taiwan from 2001 to 2011
Year Financial reforms Purpose
2001 Financial Holding Company Act To strength and competitiveness of financial institutions in Taiwan.2001 Financial Restructuring Fund To deal with problem financial institutions to withdraw from Taiwan
financial market.2007 Taiwanese government revised the Deposit Insurance Act in 2007.
The CIDC raised the three-tiered deposit insurance premium rateand set up a target ratio (i.e. DRR) for theDeposit Insurance Fund at the fixed ratio of 2% of insured deposits.
To ensure the adequacy of Deposit Insurance Fund.
2008–2009 Taiwanese government announced that the deposit insurancesystem of temporary full coverage extended to December 31, 2010.
To protect all depositors during the period of global financial crisis.
2010 On August 12, 2010, the Taiwanese government announced thatthe limited coverage was increased from NT$1.5 million on July 1,2007 to NT$3 million starting from January 1, 2011.
To avoid moral hazard for financial institutions.
2011 CDIC again revised the premium rate system (see Appendix F).Financial restructuring fund terminated on December 31, 2011.
Financial restructuring fund successfully enabled problem financialinstitutions.
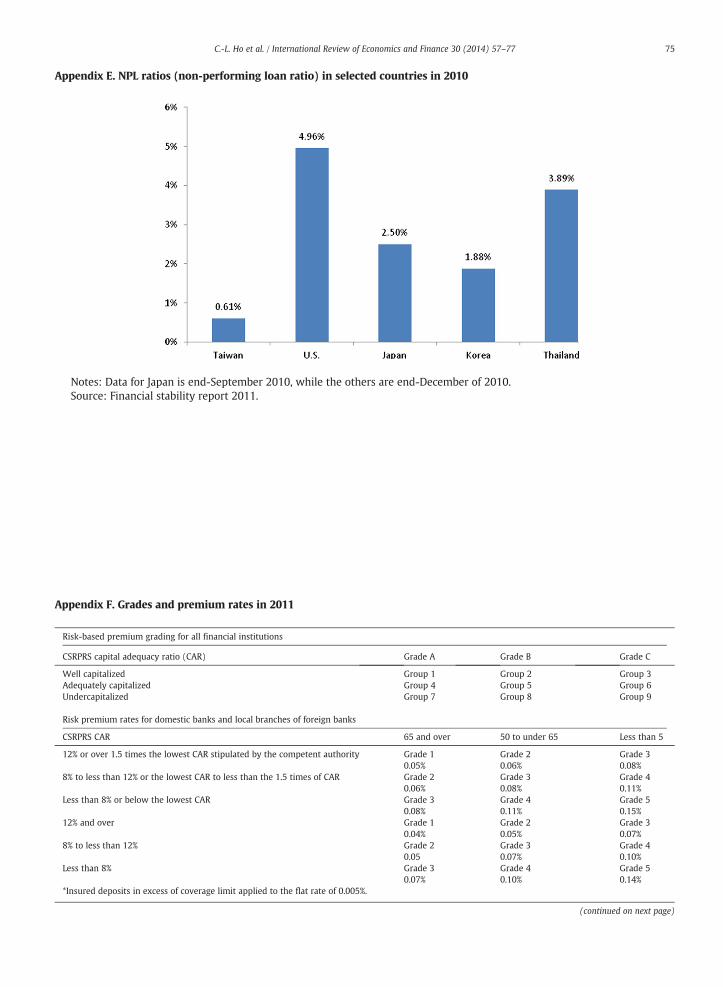
75C.-L. Ho et al. / International Review of Economics and Finance 30 (2014) 57–77
Appendix E. NPL ratios (non-performing loan ratio) in selected countries in 2010
Notes: Data for Japan is end-September 2010, while the others are end-December of 2010.Source: Financial stability report 2011.
Appendix F. Grades and premium rates in 2011
Risk-based premium grading for all financial institutions
CSRPRS capital adequacy ratio (CAR) Grade A Grade B Grade C
Well capitalized Group 1 Group 2 Group 3Adequately capitalized Group 4 Group 5 Group 6Undercapitalized Group 7 Group 8 Group 9
Risk premium rates for domestic banks and local branches of foreign banks
CSRPRS CAR 65 and over 50 to under 65 Less than 5
12% or over 1.5 times the lowest CAR stipulated by the competent authority Grade 10.05%
Grade 20.06%
Grade 30.08%
8% to less than 12% or the lowest CAR to less than the 1.5 times of CAR Grade 20.06%
Grade 30.08%
Grade 40.11%
Less than 8% or below the lowest CAR Grade 30.08%
Grade 40.11%
Grade 50.15%
12% and over Grade 10.04%
Grade 20.05%
Grade 30.07%
8% to less than 12% Grade 20.05
Grade 30.07%
Grade 40.10%
Less than 8% Grade 30.07%
Grade 40.10%
Grade 50.14%
*Insured deposits in excess of coverage limit applied to the flat rate of 0.005%.
(continued on next page)
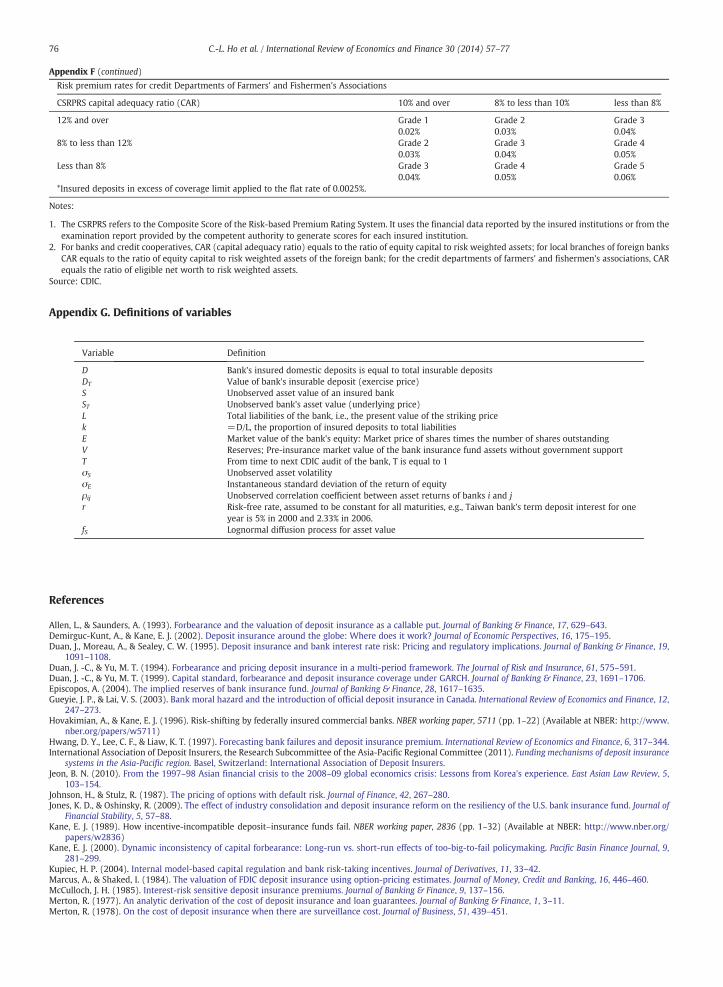
Risk premium rates for credit Departments of Farmers' and Fishermen's Associations
CSRPRS capital adequacy ratio (CAR) 10% and over 8% to less than 10% less than 8%
12% and over Grade 10.02%
Grade 20.03%
Grade 30.04%
8% to less than 12% Grade 20.03%
Grade 30.04%
Grade 40.05%
Less than 8% Grade 30.04%
Grade 40.05%
Grade 50.06%
*Insured deposits in excess of coverage limit applied to the flat rate of 0.0025%.
Notes:
1. The CSRPRS refers to the Composite Score of the Risk-based Premium Rating System. It uses the financial data reported by the insured institutions or from theexamination report provided by the competent authority to generate scores for each insured institution.
2. For banks and credit cooperatives, CAR (capital adequacy ratio) equals to the ratio of equity capital to risk weighted assets; for local branches of foreign banksCAR equals to the ratio of equity capital to risk weighted assets of the foreign bank; for the credit departments of farmers' and fishermen's associations, CARequals the ratio of eligible net worth to risk weighted assets.
Source: CDIC.
Appendix F (continued)
76 C.-L. Ho et al. / International Review of Economics and Finance 30 (2014) 57–77
Appendix G. Definitions of variables
Variable Definition
D Bank's insured domestic deposits is equal to total insurable depositsDT Value of bank's insurable deposit (exercise price)S Unobserved asset value of an insured bankST Unobserved bank's asset value (underlying price)L Total liabilities of the bank, i.e., the present value of the striking pricek =D/L, the proportion of insured deposits to total liabilitiesE Market value of the bank's equity: Market price of shares times the number of shares outstandingV Reserves; Pre-insurance market value of the bank insurance fund assets without government supportT From time to next CDIC audit of the bank, T is equal to 1σS Unobserved asset volatilityσE Instantaneous standard deviation of the return of equityρij Unobserved correlation coefficient between asset returns of banks i and jr Risk-free rate, assumed to be constant for all maturities, e.g., Taiwan bank's term deposit interest for one
year is 5% in 2000 and 2.33% in 2006.fS Lognormal diffusion process for asset value
References
Allen, L., & Saunders, A. (1993). Forbearance and the valuation of deposit insurance as a callable put. Journal of Banking & Finance, 17, 629–643.Demirguc-Kunt, A., & Kane, E. J. (2002). Deposit insurance around the globe: Where does it work? Journal of Economic Perspectives, 16, 175–195.Duan, J., Moreau, A., & Sealey, C. W. (1995). Deposit insurance and bank interest rate risk: Pricing and regulatory implications. Journal of Banking & Finance, 19,
1091–1108.Duan, J. -C., & Yu, M. T. (1994). Forbearance and pricing deposit insurance in a multi-period framework. The Journal of Risk and Insurance, 61, 575–591.Duan, J. -C., & Yu, M. T. (1999). Capital standard, forbearance and deposit insurance coverage under GARCH. Journal of Banking & Finance, 23, 1691–1706.Episcopos, A. (2004). The implied reserves of bank insurance fund. Journal of Banking & Finance, 28, 1617–1635.Gueyie, J. P., & Lai, V. S. (2003). Bank moral hazard and the introduction of official deposit insurance in Canada. International Review of Economics and Finance, 12,
247–273.Hovakimian, A., & Kane, E. J. (1996). Risk-shifting by federally insured commercial banks. NBER working paper, 5711 (pp. 1–22) (Available at NBER: http://www.
nber.org/papers/w5711)Hwang, D. Y., Lee, C. F., & Liaw, K. T. (1997). Forecasting bank failures and deposit insurance premium. International Review of Economics and Finance, 6, 317–344.International Association of Deposit Insurers, the Research Subcommittee of the Asia-Pacific Regional Committee (2011). Funding mechanisms of deposit insurance
systems in the Asia-Pacific region. Basel, Switzerland: International Association of Deposit Insurers.Jeon, B. N. (2010). From the 1997–98 Asian financial crisis to the 2008–09 global economics crisis: Lessons from Korea's experience. East Asian Law Review, 5,
103–154.Johnson, H., & Stulz, R. (1987). The pricing of options with default risk. Journal of Finance, 42, 267–280.Jones, K. D., & Oshinsky, R. (2009). The effect of industry consolidation and deposit insurance reform on the resiliency of the U.S. bank insurance fund. Journal of
Financial Stability, 5, 57–88.Kane, E. J. (1989). How incentive-incompatible deposit–insurance funds fail. NBER working paper, 2836 (pp. 1–32) (Available at NBER: http://www.nber.org/
papers/w2836)Kane, E. J. (2000). Dynamic inconsistency of capital forbearance: Long-run vs. short-run effects of too-big-to-fail policymaking. Pacific Basin Finance Journal, 9,
281–299.Kupiec, H. P. (2004). Internal model-based capital regulation and bank risk-taking incentives. Journal of Derivatives, 11, 33–42.Marcus, A., & Shaked, I. (1984). The valuation of FDIC deposit insurance using option-pricing estimates. Journal of Money, Credit and Banking, 16, 446–460.McCulloch, J. H. (1985). Interest-risk sensitive deposit insurance premiums. Journal of Banking & Finance, 9, 137–156.Merton, R. (1977). An analytic derivation of the cost of deposit insurance and loan guarantees. Journal of Banking & Finance, 1, 3–11.Merton, R. (1978). On the cost of deposit insurance when there are surveillance cost. Journal of Business, 51, 439–451.

77C.-L. Ho et al. / International Review of Economics and Finance 30 (2014) 57–77
Pennacchi, G. G. (1987). Alternative forms of deposit insurance: Pricing and bank incentive issues. Journal of Banking & Finance, 11, 291–312.Pennacchi, G. G. (2000). The effects of setting deposit insurance premiums to target insurance fund reserves. Journal of Financial Services Research, 17, 153–180.Pyle, D. (1986). Capital regulation and deposit insurance. Journal of Banking & Finance, 10, 189–202.Ronn, E., & Verma, A. (1986). Pricing risk-adjusted deposit insurance: An options-based model. Journal of Finance, 41, 871–895.Saunders, A., & Cornett, M. M. (2011). Financial institutions management: A risk management approach (international ed.)New York: McGraw-Hill.Shimada, T., & Yang, T. (2010). Challenges and developments in the financial systems of southeast Asian economics. OECD Journal: Financial market Trends,
2010(2), 137–159.Yam, T. K. (2009). The global financial tsunami: An implication for East Asian economics. In H. Y. Sng, & W. M. Chia (Eds.), Singapore and Asia: Impact of the global
financial tsunami and other economics issues. River Edge, NJ, USA: World Scientific Publication Co.


