Financial R 2015
82
Comprehensive Annual Financial Report for the year ended September 30, 2015 2015 F INANCIAL R EPORT
Transcript of Financial R 2015

Comprehensive Annual Financial Report for the year ended September 30, 2015
2015Financial RepoRt

Aub
urn U
nive
rsity
201
5
2
This page is intentionally left blank.

Aub
urn U
nive
rsity
201
5
3
INTRODUCTORY SECTION
PRESIDENT’S LETTER .......................................................................................................................................................6
FINANCIAL SECTION
INDEPENDENT AUDITOR’S REPORT ................................................................................................................................8
MANAGEMENT’S DISCUSSION AND ANALYSIS .............................................................................................................12
AUBURN UNIVERSITY FINANCIAL STATEMENTS
STATEMENTS OF NET POSITION ....................................................................................................................................22
STATEMENTS OF REVENUES, EXPENSES AND CHANGES IN NET POSITION ..........................................................23
STATEMENTS OF CASH FLOWS......................................................................................................................................24
COMPONENT UNITS’ FINANCIAL STATEMENTS
AUBURN UNIVERSITY FOUNDATION AND AUBURN ALUMNI ASSOCIATION ..............................................................26
TIGERS UNLIMITED FOUNDATION ..................................................................................................................................28
AUBURN RESEARCH AND TECHNOLOGY FOUNDATION .............................................................................................30
NOTES TO FINANCIAL STATEMENTS ....................................................................................................................................32
DIVISIONAL FINANCIAL STATEMENTS (UNAUDITED)
AUBURN UNIVERSITY MAIN CAMPUS ............................................................................................................................66
AUBURN UNIVERSITY AT MONTGOMERY ......................................................................................................................68
ALABAMA AGRICULTURAL EXPERIMENT STATION ......................................................................................................70
ALABAMA COOPERATIVE EXTENSION SYSTEM ...........................................................................................................72
REQUIRED SUPPLEMENTAL INFORMATION ........................................................................................................................75
AUBURN UNIVERSITY BOARD OF TRUSTEES .....................................................................................................................81
TABLE OF CONTENTS
2015Financial RepoRt

Aub
urn U
nive
rsity
201
5
4

Aub
urn U
nive
rsity
201
5
5
intRoductoRy Section
2015Financial RepoRt

Aub
urn U
nive
rsity
201
5
6
January 20, 2016
Dear Members of the Auburn Community and Alabama Citizens:
It’s a good time to be an Auburn Tiger. Here are a few highlights: Top ranking
The Business Journals examined universities across the country to determine who offers the best educational experience. Auburn came out on top in the state based on such criteria as retention and graduation rates, reputation, admissions, and housing.
Leader in global skills & engagement Auburn is fast becoming a thought leader in global engagement. In addition to augmenting
opportunities for study abroad and international skills development, in the past year we’ve held two standing-room-only forums where government and military leaders have addressed current world issues. Learn more at #AUWorldAffairs.
Record number of prestigious scholarships Auburn helps students reach their fullest potential, and for some that means competing for
prestigious scholarships to further their intellectual development. In just one example, four spring graduates won Fulbright Scholarships, bringing the total to a record 14 in the past six years. Fulbright is the flagship international exchange program, and these students serve as excellent ambassadors for Auburn and the U.S.
First UAS flight school Unmanned aerial systems offer tremendous economic potential in fields as diverse as
agriculture and construction. Auburn is one of the nation’s oldest aviation programs, and it’s now the youngest UAS flight school after earning the federal government’s first certification to train commercial drone pilots.
This report summarizes our financial position and activity for the fiscal year ending September 30, 2015. We invite you to learn more at www.auburn.edu.
O F F I C E O F T H E P R E S I D E N T
Sincerely,
Jay Gogue President

Aub
urn U
nive
rsity
201
5
7
Financial Section
2015Financial RepoRt

Aub
urn U
nive
rsity
201
5
8
PricewaterhouseCoopers LLP, 569 Brookwood Village, Suite 851, Birmingham, AL 35209 T: (205) 414 4000, F: (205) 414 4001, www.pwc.com/us
Independent Auditor's Report
To the Board of Trustees of Auburn University:
We have audited the accompanying financial statements of Auburn University (the “University”), a component unit of the State of Alabama, as of and for the years ended September 30, 2015 and 2014, and the related notes to the financial statements, which consist of the statements of net position and the related statements of revenues, expenses and changes in net position and statements of cash flows of Auburn University and the statements of financial position and of activities and changes in net assets of the University’s discretely presented component units. We have audited the statements of financial position and of activities and changes in net assets, for Auburn Research and Technology Foundation (“ARTF”), one of the University’s discreetly presented component units, as of and for the year ended September 30, 2015 and 2014.
Management's Responsibility for the Financial Statements
Management is responsible for the preparation and fair presentation of the financial statements in accordance with accounting principles generally accepted in the United States of America; this includes the design, implementation, and maintenance of internal control relevant to the preparation and fair presentation of financial statements that are free from material misstatement, whether due to fraud or error.
Auditor's Responsibility
Our responsibility is to express opinions on the financial statements based on our audits. We did not audit the financial statements of Auburn Alumni Association (the “Association”) and Auburn University Foundation (the “Foundation”), two of the University’s discretely presented component units, as of and for the years ended September 30, 2015 and 2014. We did not audit the financial statements of Tigers Unlimited Foundation (“TUF”), one of the University’s discretely presented component units, as of and for the years ended June 30, 2015 and 2014. Those statements were audited by other auditors whose reports have been furnished to us, and our opinion, insofar as it relates to the amounts included for the above mentioned discretely presented component units of the University, is based solely on the reports of the other auditors. We conducted our audits in accordance with auditing standards generally accepted in the United States of America. Those standards require that we plan and perform the audit to obtain reasonable assurance about whether the financial statements are free from material misstatement.
An audit involves performing procedures to obtain audit evidence about the amounts and disclosures in the financial statements. The procedures selected depend on our judgment, including the assessment of the risks of material misstatement of the financial statements, whether due to fraud or error. In making those risk assessments, we consider internal control relevant to the University’s preparation and fair presentation of the financial statements in order to design audit procedures that are appropriate in the circumstances, but not for the purpose of expressing an opinion on the effectiveness of the University’s internal control. Accordingly, we express no such opinion. An audit also includes evaluating the appropriateness of accounting policies used and the reasonableness of significant accounting estimates made by management, as well as evaluating the

Aub
urn U
nive
rsity
201
5
9
2
overall presentation of the financial statements. We believe that the audit evidence we haveobtained is sufficient and appropriate to provide a basis for our audit opinions.
Opinions
In our opinion, based on our audits and the reports of the other auditors, the financial statements referred to above present fairly, in all material respects, the financial position of the University andits discretely presented component units at September 30, 2015 and 2014, or at June 30, 2015 and 2014, as applicable, and the changes in financial position and, where applicable, cash flows thereof for the years then ended in accordance with accounting principles generally accepted in the United States of America.
Emphasis of Matter
As discussed in Note 1 and 11 to the basic financial statements, in the year ended September 30, 2015, the University adopted new accounting guidance related to the manner in which it accounts for pensions. As described within the notes to the financial statements, the University adopted Governmental Accounting Standards Board (“GASB”) Statement No. 68, Accounting and Financial Reporting for Pensions, an Amendment of GASB Statement No. 27, and GASB Statement No. 71,Pension Transition for Contributions Made Subsequent to the Measurement Date, an amendmentof GASB Statement No. 68, effective October 1, 2014. Our opinion is not modified with respect to this matter.
Other Matters
The accompanying management's discussion and analysis and the required supplemental information for the year ended September 30, 2015 on pages 12 through 21 and 75 through 80, respectively, are required by accounting principles generally accepted in the United States of America to supplement the basic financial statements. Such information, although not a part of the basic financial statements, is required by the Governmental Accounting Standards Board who considers it to be an essential part of financial reporting for placing the basic financial statements in the appropriate operational, economic, or historical context. We applied certain limited proceduresto the required supplementary information in accordance with auditing standards generally accepted in the United States of America, which consisted of inquiries of management about themethods of preparing the information and comparing the information for consistency with management's responses to our inquiries, the basic financial statements, and other knowledge we obtained during our audit of the basic financial statements. We do not express an opinion or provide any assurance on the information because the limited procedures do not provide us with sufficient evidence to express an opinion or provide any assurance.
The University has omitted the management's discussion and analysis for the year ended September 30, 2014 that accounting principles generally accepted in the United States of America require to be presented to supplement the basic financial statements. Such missing information, although not a part of the basic financial statements, is required by the Governmental Accounting Standards Board who considers it to be an essential part of financial reporting for placing the basic financial statements in the appropriate operational, economic, or historical context. Our opinions on the basic financial statements are not affected by this missing information.

Aub
urn U
nive
rsity
201
5
10
3
Our audits were conducted for the purpose of forming opinions on the financial statements that collectively comprise the University’s basic financial statements. The introductory information on pages 5 to 6 and the supplemental divisional financial statements on pages 66 to 73 are presented for purposes of additional analysis and are not a required part of the basic financial statements.Such information has not been subjected to the auditing procedures applied in the audit of the basic financial statements by us or other auditors, and accordingly, we express no opinion nor provide any assurance on them.
January 20, 2016

Aub
urn U
nive
rsity
201
5
11
This page is intentionally left blank.

Aub
urn U
nive
rsity
201
5
12
The following discussion and analysis provides an overview of the financial position and activities of Auburn University (the University) for the year ended September 30, 2015, with a comparison to the year ended September 30, 2014. This discussion has been prepared by management and should be read in conjunction with the financial statements and the notes thereto, which follow this section. The financial statements, footnotes, and this discussion are the responsibility of University management.
The University is a land-grant institution with two campuses, Auburn (main campus) and Montgomery (AUM). Main campus is classified by the Carnegie Foundation as “Doctoral/Research-Extensive,” while AUM is classified as “Master’s I.” Fall 2015 enrollment totaled 32,206 students at main campus and AUM. The University offers a diverse range of degree programs in 12 colleges and schools and has 5,406 full-time employees, including 1,397 faculty members, who contribute to the University’s mission of serving the citizens of the State of Alabama through its instructional, research, and outreach programs.
Using the Annual ReportThe University’s financial statements are prepared in accordance with Governmental Accounting Standards Board (GASB) principles, which establish standards for external financial reporting for public colleges and universities. The financial report includes three financial statements: the Statement of Net Position; the Statement of Revenues, Expenses, and Changes in Net Position; and the Statement of Cash Flows. All references to “2015,” “2014,” or another year refer to the fiscal year ended September 30, unless otherwise noted.
The University’s financial statements are summarized as follows:
The Statement of Net Position presents entity-wide assets, deferred outflows of resources, liabilities, deferred inflows of resources, and net position (assets and deferred outflows of resources minus liabilities and deferred inflows of resources) on the last day of the fiscal year. Distinctions are made in current and noncurrent assets and liabilities. Net position is segregated into unrestricted, restricted (expendable and nonexpendable), and net investment in capital assets. The University’s net position is one indicator of the University’s financial health. From the data presented, readers of the Statement of Net Position have the information to determine the assets available to continue the operations of the University. They may also determine how much the University owes vendors, investors, and lending institutions. Finally, the Statement of Net Position outlines the net resources available to the University.
The Statement of Revenues, Expenses and Changes in Net Position presents the revenues earned and expenses incurred during the year. Activities are reported as either operating or nonoperating. Governmental accounting standards require state appropriations, gifts, and investment earnings to be classified as nonoperating revenues. As a result, the University will typically realize a significant operating loss. The utilization of capital assets is reflected in the Statement of Revenues, Expenses and Changes in Net Position as depreciation expense, which reflects the amortization of the cost of an asset over its expected useful life.
The Statement of Cash Flows reports the major sources and uses of cash and reveals further information for assessing the University’s ability to meet financial obligations as they become due. Inflows and outflows of cash are summarized by operating, noncapital financing, capital and related financing, and investing activities.
In addition to the University’s financial statements, related component unit Statements of Financial Position and Statements of Activities and Changes in Net Assets have been included in this annual report.
GASB Statement No. 39, Determining Whether Certain Organizations Are Component Units-an amendment of GASB Statement No. 14, provides criteria for determining which related organizations should be reported as component units based on the nature and significance of their relationship with the primary government, which is the University. GASB Statement No. 39 also clarifies financial reporting requirements for those organizations as amendments to GASB Statement No. 14, The Financial Reporting Entity. The University also evaluated GASB Statement No. 61, The Financial Reporting Entity: Omnibus-an amendment of GASB Statements No. 14 and No. 34 to ensure proper disclosure. The component units report financial results under principles prescribed by the Financial Accounting Standards Board (FASB) and are subject to standards under the Accounting Standards Codification and the Hierarchy of Generally Accepted Accounting Principles and present net assets in three classes: unrestricted, temporarily restricted, and permanently restricted. The four component units of the University reported herein are as follows:
(1) Auburn University Foundation (AUF) - AUF was organized on February 9, 1960, and is the fundraising foundation for the University. As of September 30, 2015, AUF holds endowments and distributes earnings from those endowments to the University. AUF is incorporated as a legally separate, tax-exempt nonprofit organization established to solicit individual and corporate donations for the direct benefit of the University. The Auburn University Real Estate Foundation, Inc. (AUREFI) has been consolidated into AUF’s financial statements.
(2) Auburn Alumni Association (the Association) - The Association is a nonprofit corporation organized on April 14, 1945, which was created to promote mutually beneficial relationships between the University and its alumni, to encourage loyalty among alumni, and to undertake various other actions for the benefit of the University, its alumni, and the State of Alabama. Membership is comprised of alumni, friends, and students of the University. The Association provides monetary support to the University in the form of faculty awards and student scholarships.
(3) Tigers Unlimited Foundation (TUF) - TUF is a legally separate nonprofit organization incorporated in December 2002, which began operations on April 21, 2004. TUF was organized exclusively for charitable purposes, pursuant to Sections 501(a) and 501(c)(3) of the Internal Revenue Code to support athletic fundraising and athletic programs. TUF has a June 30 fiscal year end. TUF provides economic resources to the University for athletic scholarships, athletic building maintenance or new construction, and for athletic department programs.
(4) Auburn Research and Technology Foundation (ARTF) - ARTF was organized on August 24, 2004, as a separate nonprofit organization to develop and operate the Auburn Research Park and to assist the University with the attraction, development, and commercialization of technology. The vision of ARTF is to establish an entrepreneurial atmosphere for businesses to foster economic diversification and vitality of the local community, state, and region.
During the year, the University implemented GASB Statement No. 68, Accounting and Financial Reporting for Pensions and GASB Statement No. 71, Pension Transition for Contributions Made Subsequent to the Measurement Date. GASB Statement No. 68 revises existing standards for employer financial statements and requires the recognition of a liability equal to the net pension obligation for pension plans provided by the University to its employees. The net pension obligation is measured as the total pension liability, less the amount of the pension plan’s fiduciary net position. The total pension liability is determined based upon
MANAGEMENT’S DISCUSSION AND ANALYSIS (UNAUDITED)

Aub
urn U
nive
rsity
201
5
13
Financial Highlights Statement of Net PositionA summary of assets, deferred outflows of resources, liabilities, deferred inflows of resources, and net position as of September 30, 2015 and 2014, is as follows:
2015 2014
AssetsCurrent assets $ 236,697,624 $ 301,408,817 Capital assets 1,560,193,650 1,550,144,298 Other noncurrent assets 995,824,011 861,390,142 Total assets 2,792,715,285 2,712,943,257
Deferred Outflows of Resources 80,183,723 14,442,185
LiabilitiesCurrent liabilities 345,166,861 333,782,202 Noncurrent liabilities 1,309,624,581 751,013,602 Total liabilities 1,654,791,442 1,084,795,804
Deferred Inflows of Resources 39,513,489 435,203
Net PositionNet investment in capital assets 855,698,812 821,520,355 Restricted-nonexpendable 28,537,859 28,176,521 Restricted-expendable 177,483,201 162,165,880 Unrestricted 116,874,205 630,291,679 Total net position $ 1,178,594,077 $ 1,642,154,435
MANAGEMENT’S DISCUSSION AND ANALYSIS (UNAUDITED)
term maturities. The University saw increases in capital assets, net of depreciation, shown as “Investment in plant, net” on the Statement of Net Position, of $10.0 million from 2014 to 2015. Capital assets generally represent the historical cost of land, land improvements, buildings, construction in progress, infrastructure, equipment, library books, art and collectibles, software system implementation, and livestock, less applicable accumulated depreciation, with buildings comprising approximately 76.8% of the total net capital asset value. The increase, offset by disposal activity, depreciation, and transfers, was the result of $86.8 million of new additions to property, plant, and equipment, net of construction in progress transfers. The University expended $69.5 million in new construction during fiscal year 2015.
The following building construction projects totaling $37.5 million were either completed and placed into service or additional work was performed on a previously completed project during the current fiscal year:
Jordan Hare Stadium New Score and Video Board System $ 13.2 million Cambridge Apartments $ 5.2 million East Glenn Administrative Support Facility $ 3.4 million Bailey Small Animal Teaching Hospital $ 2.6 million Dudley Envelope and Windows $ 2.0 million South Donahue Residence Halls $ 1.5 million Lowder East Hall Courtyard Student Lounge $ 1.3 million War Hawk Residence Hall $ 1.3 millionPathological Waste Incinerator and Building Improvements $ 1.2 million Jordan Hare Stadium Power System Improvement $ 1.1 million Other Small Projects $ 4.7 million
The University’s AssetsCurrent assets consist of cash and cash equivalents, operating investments (those investments that are expected to be liquidated during the course of normal operations), net accounts receivable (primarily amounts due from the federal and state governments and other agencies as reimbursements for sponsored programs), net student accounts receivable (including amounts due from third parties on behalf of the students), current portion of loans receivable, accrued interest receivable, inventories, and prepaid expenses. The University’s current assets decreased $64.7 million from 2014 to 2015. Of this decrease, cash and cash equivalents and operating investments decreased by $78.4 million. During the year, the University decreased the amount of deposits on hold with banks based on revised federal bank regulations. These funds were invested in longer term maturities. Accounts receivable (including loans receivable and interest receivable) increased $8.7 million. The majority of the accounts receivable increase was due to increased spending prior to year end on federal, state and other sponsored projects, which generated receivables. Student accounts receivable increased $3.9 million, which was due to the tuition increase approved by the Board of Trustees and changes in enrollment and scholarship strategies. The remaining changes were due to increases in inventories and prepaid expenses of $1.1 million.
The University’s long-term investments, shown in other noncurrent assets, increased by $134.5 million from 2014 to 2015. As discussed above, this was due partially to changes in federal bank regulations as well as investing the University’s increases in net position in longer
discounting projected benefit payments based on the benefit terms and legal agreements existing at the pension plan’s fiscal year end. Projected benefit payments are required to be discounted using a single rate that reflects the expected rate of return on investments, to the extent that plan assets are available to pay benefits, and a tax-exempt, high-quality municipal bond rate when plan assets are not available. This Statement requires that most changes in the net pension liability be included in pension expense in the period of the change. GASB Statement No. 71 is a clarification to GASB Statement No. 68 requiring recognition of a beginning deferred outflow of resources for its pension contributions, if any, made subsequent to the measurement date of the beginning
net pension liability. These statements also enhance accountability and transparency through revised note disclosures and required supplementary information (RSI). September 30, 2014 amounts have not been restated to reflect the impact of GASB Statement No. 68 because the information is not available to calculate the impact on pension expense for the fiscal year ending September 30, 2014. In accordance with the Statement, the University has reported a net pension liability (net of deferred outflows of resources) in the amount of $558,573,898 as a change in accounting principle adjustment to unrestricted net position as of October 1, 2014.

Aub
urn U
nive
rsity
201
5
14
The University’s Deferred Inflows of ResourcesDeferred inflows of resources are an acquisition of net assets that are applicable to a future reporting period. The University engages in certain voluntary nonexchange transactions (grants). Grant funds received for which all eligibility requirements have been met, other than time requirements, are presented as deferred inflows of resources in accordance with GASB Statements No. 63 and No. 65. In 2015, the University implemented GASB Statement No. 68 which required the reporting of deferred inflows of resources relating to the accounting and reporting of pensions.
The University's deferred inflows of resources had an increase of $39.1 million from 2014 to 2015. This increase was the result of the accounting and reporting of pension activity, in accordance with GASB Statement No. 68 (see Note 11).
The University’s Net Position The three major net position categories are discussed below:
Net investment in capital assets represents the University’s capital assets, net of accumulated depreciation and outstanding principal balances of debt as well as any deferred inflows or outflows of resources, attributable to the acquisition, construction, or improvement of those assets. Net investment in capital assets increased 4.2% from 2014 to 2015. This increase was due to capitalization of assets as previously described and payments made on outstanding debt.
Restricted (nonexpendable and expendable) net position:
Restricted-nonexpendable net position is subject to external restrictions governing its use and consists of the University’s permanent endowment funds. This net position increased 1.3% from 2014 to 2015. This increase was the result of additional gifts to permanently endowed funds as well as investment earnings that were added back to current permanent endowments.
Restricted-expendable net position is also subject to external restrictions governing its use. Items of this nature include gifts, contracts, and grants restricted by federal, state, local governments, or private sources for purposes as determined by donors and/or external entities that have placed time or purpose restrictions on the use of the assets. Restricted funds functioning as endowments, restricted funds available for student loans, and funds restricted for construction purposes are also included in this category. Restricted-expendable net position increased 9.4% from 2014 to 2015. This majority of the increase was due to additional gift receipts in fiscal year 2015.
Unrestricted net position is the third major class of net position, and it is not subject to externally imposed stipulations; however, the majority of the University’s unrestricted net position has been internally designated for various mission-related purposes. This category includes funds for general operations of the University, auxiliary operations (including athletics, housing, and the bookstores), unrestricted quasi-endowments, and capital projects. Unrestricted net position decreased 81.5% from 2014 to 2015. The decrease in unrestricted net position was due to the implementation of GASB Statement No. 68. Otherwise, the University would have shown an increase in unrestricted net position of $45.2 million.
The University’s Deferred Outflows of ResourcesDeferred outflows of resources are a consumption of net assets that are applicable to a future reporting period. In 2010, 2012, 2014, and 2015, the University defeased certain outstanding bonds. These refundings resulted in losses (the difference between the acquisition price of the new debt and the net carrying amount of the old debt). In accordance with GASB Statements No. 63 and No. 65, these losses are presented as deferred outflows of resources. In 2015, the University implemented GASB Statement No. 68 which required the reporting of deferred outflows of resources relating to the accounting and reporting of pensions.
Deferred outflows of resources increased $65.7 million, which is made up of loss on refunding of bonds and pension activity. During the year, the University partially defeased certain bonds and issued 2015A and 2015B General Fee Bonds. The losses on refunding of these defeasances, which totaled $15.7 million, were amortized with prior years’ losses. The amortized amount of $3.2 million netted with the current year losses to account for $12.5 million of the increase. The loss on refunding is amortized over the life of the old or new bonds, whichever is shorter. The University is amortizing over the life of the defeased bonds (see Note 8). In addition, deferred outflows of resources increased $53.2 million relating to pension activity in accordance with the implementation of GASB Statement No. 68 (see Note 11).
The University’s LiabilitiesCurrent liabilities consist of accounts payable, accrued salaries and wages, the current portion of compensation-related liabilities, accrued interest payable, other accrued liabilities, student and other deposits (including Perkins and Health Professions loan liability), unearned revenues, and the current portion of noncurrent liabilities. Current liabilities increased $11.4 million from 2014 to 2015. While the University accrued $3.0 million less in payables at year end, unearned revenues increased $15.2 million. Unearned revenue is comprised of tuition, room and board revenue that relates to fiscal year 2016, contracts and grants funding received prior to expenditure as well as athletic revenue related to games played subsequent to September 30. For Fall 2015, the Board of Trustees approved approximately a 2.5% and 3.2% tuition increase for main campus and AUM, respectively. Sixty percent of fall tuition is reported as unearned revenue due to the fiscal year end of September 30. The remaining changes were due to a decrease in the pollution remediation liability of $2.9 million, which was determined to be due subsequent to fiscal year 2016 and an increase of $1.4 million in the University's current portion of long term liabilities. This increase was the result of the University’s debt repayment strategies. Bonds issued in 2012 were structured to begin principal repayments in 2016, aligning payments with generation of corresponding pledged revenue.
Noncurrent liabilities include principal amounts due on University bonds payable, accrued compensated absences and other compensation-related liabilities that are payable beyond September 30, 2016. Noncurrent liabilities increased $558.6 million from 2014 to 2015. The majority of the increase was due to the implementation of GASB Statement No. 68 which requires the recognition of a liability equal to the net pension obligation for pension plans provided by the University to its employees. Based on actuarial data, the University’s pension obligation was $570.4 million. An additional $1.8 million was accrued for the University's post-employment medical plan, in accordance with GASB Statement No. 45. These increases were offset with debt payments and amortization of bond premium and discounts in the amount of $16.3 million. The remaining increase was due to the University’s pollution remediation liability, which did not change significantly in total from 2014; however, it is now determined it will be due subsequent to fiscal year 2016.
MANAGEMENT’S DISCUSSION AND ANALYSIS (UNAUDITED)

Aub
urn U
nive
rsity
201
5
15
MANAGEMENT’S DISCUSSION AND ANALYSIS (UNAUDITED)
Statement of Revenues, Expenses and Changes in Net Position Changes in total net position are the result of activity presented in the Statement of Revenues, Expenses and Changes in Net Position. The purpose of this statement is to present operating and nonoperating
2015 2014
Operating revenues $ 718,514,949 $ 663,909,152 Operating expenses 949,522,278 928,297,437 Operating loss (231,007,329) (264,388,285)
Net nonoperating revenues and other changes in net position 326,020,869 329,276,547
Increase in net position 95,013,540 64,888,262
Net position - beginning of year 1,642,154,435 1,577,266,173 Cumulative effect of change in accounting principle (558,573,898)
Net position, October 1, 2014, as restated 1,083,580,537
Net position - end of year $ 1,178,594,077 $ 1,642,154,435
The 2015 Statement of Revenues, Expenses, and Changes in Net Position reflects an increase in net position at the end of the year of $95.0 million. Operating revenues increased 8.2% from 2014 to 2015. The majority of this increase is attributable to the increase in student tuition and fee revenue, net of discounts. The $29.7 million tuition and fee increase over 2014 was the result of the Board-approved increase in tuition for both main campus and AUM and changes to the University's enrollment and scholarship strategies. The University also saw increases in other operating revenue of $6.8 million. The majority of the increase was due to revenue recognized on a fixed price contract, of which the revenue was previously deferred. The University saw a net increase in federal appropriations, federal, state, and nongovernmental contract and grant revenues of $2.9 million, which was primarily the result of an increase in spending of federal grant funds appropriated and awarded for research. Auxiliary revenue increased $12.9 million. The majority of this increase was due to increased athletic ticket sales, radio and television revenues. In addition, the University saw increases in housing revenue at main campus and at AUM.
Operating expenses increased $21.2 million from 2014 to 2015. Multiple factors contributed to this net increase. Compensation and benefit costs increased 3.5%. This was the result of Board-approved salary increases and one-time supplement payments. Scholarship and fellowship
revenues, operating and nonoperating expenses, other revenues, expenses, gains, losses, and changes in net position.A condensed statement is provided below:
expense decreased $1.9 million, while other supplies and services expenses had a modest increase of $2.0 million. Depreciation expense increased 3.5% in 2015. This increase was the result of recording depreciation beginning in fiscal year 2015 on projects completed in 2014. The biggest addition in fiscal year 2014 was the Bailey Small Animal Teaching Hospital.
Net nonoperating revenues and other changes in net position decreased $3.3 million from 2014 to 2015. The University’s net investment income decreased from $38.8 million in fiscal year 2014 to $27.4 million in fiscal year 2015. During fiscal year 2015, there were several factors that contributed to this decrease. The University experienced one-year losses of (4.0)%, compared to one-year returns of 10.8% in 2014; this caused a decrease in unrealized gains/losses of $7.2 million. During fiscal year 2014, the University recognized a gain of approximately $5.0 million which did not occur in fiscal year 2015. Therefore, the realized gain/losses on investments decreased $4.0 million. In addition, the University’s interest expense increased $3.2 million. These changes were offset by an increase in appropriations from the State of Alabama of $2.5 million, additional revenue recognized on Pell grants awarded to students in fiscal year 2015 of $0.5 million or 2.6%, and an increase in gifts and capital gifts and grants of $8.3 million.
$0
$200
$400
$600
$800
$1,000
$1,200
$1,400
$1,600
$1,800
$2,000
$2,200
2011 2012 2013 2014 2015b* 2015a*
Am
ou
nt
in M
illio
ns
Fiscal Year
TOTAL NET POSITION
Unrestricted
Restricted Expendable
Restricted Nonexpendable
Net Investment of Capital Assets
$1,435
$1, 737
$1,518 $1,577 $1,642
$1,179
*Note: For illustrative purposes only, 2015* is the net position excluding the cumulative effect of the adoption of GASB Statement No. 68, which reduced the University’s October 1, 2014 net position by $558,573,898. 2015 is the net position including the adoption of GASB Statement No. 68.
TOTAL NET POSITION
Am
ount
in M
illio
ns
Fiscal Year
$0
$200
$400
$600
$800
$1,000
$1,200
$1,400
$1,600
$1,800
$2,000
$2,200
2011 2012 2013 2014 2015b* 2015a*
Am
ou
nt
in M
illio
ns
Fiscal Year
TOTAL NET POSITION
Unrestricted
Restricted Expendable
Restricted Nonexpendable
Net Investment of Capital Assets
$1,435
$1, 737
$1,518 $1,577 $1,642
$1,179
$0
$200
$400
$600
$800
$1,000
$1,200
$1,400
$1,600
$1,800
$2,000
$2,200
2011 2012 2013 2014 2015b* 2015a*
Am
ou
nt
in M
illio
ns
Fiscal Year
TOTAL NET POSITION
Unrestricted
Restricted Expendable
Restricted Nonexpendable
Net Investment of Capital Assets
$1,435
$1, 737
$1,518 $1,577 $1,642
$1,179
$0
$200
$400
$600
$800
$1,000
$1,200
$1,400
$1,600
$1,800
$2,000
$2,200
2011 2012 2013 2014 2015b* 2015a*
Am
ou
nt
in M
illio
ns
Fiscal Year
TOTAL NET POSITION
Unrestricted
Restricted Expendable
Restricted Nonexpendable
Net Investment of Capital Assets
$1,435
$1, 737
$1,518 $1,577 $1,642
$1,179

Aub
urn U
nive
rsity
201
5
16
OPERATING EXPENSES BY NATURAL CLASSIFICATIONFor the year ended September 30, 2015
MANAGEMENT’S DISCUSSION AND ANALYSIS (UNAUDITED)
OPERATING EXPENSES BY FUNCTIONFor the year ended September 30, 2015
OPERATING REVENUES SUPPORTING CORE ACTIVITIESFor the year ended September 30, 2015
Instruction 27%
Research 10%
Public Service 11%
Academic Support 6%
Library 1%
Student Services 4%
Institutional Support 8%
Operations & Maintenance 8%
Scholarships & Fellowships
4% Auxiliaries 13%
Depreciation 8%
OPERATING EXPENSES BY FUNCTION For the year ended September 30, 2015
Compensation & Benefits 63%
Other Supplies & Services 24% Depreciation
8%
Utilities 3%
Scholarships & Fellowships
2%
OPERATING EXPENSES BY NATURAL CLASSIFICATION For the year ended September 30, 2015
Other Operating Revenue 4%
Sales & Services 6%
Grants & Contracts 14%
Federal Appropriations 2%
Student Tuition & Fees, 55%
Auxiliaries, net 19%
OPERATING REVENUES SUPPORTING CORE ACTIVITIES For the year ended September 30, 2015
Other Operating Revenue 3%
Sales & Services 6%
Grants & Contracts 15%
Federal Appropriations 2%
Student Tuition & Fees, Net 55%
Auxiliaries, Net 19%
OPERATING REVENUES SUPPORTING CORE ACTIVITIES For the year ended September 30, 2014
Other Operating Revenue 3%
Sales & Services 6%
Grants & Contracts 15%
Federal Appropriations 2%
Student Tuition & Fees, Net 55%
Auxiliaries, Net 19%
OPERATING REVENUES SUPPORTING CORE ACTIVITIES For the year ended September 30, 2014
Other Operating Revenue 3%
Sales & Services 6%
Grants & Contracts 15%
Federal Appropriations 2%
Student Tuition & Fees, Net 55%
Auxiliaries, Net 19%
OPERATING REVENUES SUPPORTING CORE ACTIVITIES For the year ended September 30, 2014

Aub
urn U
nive
rsity
201
5
17
Net cash used in operating activities decreased from 2014 to 2015 by 6.5%. The majority of this decrease was the result of additional cash provided from tuition and fees of $28.0 million, auxiliary enterprises of $23.3 million, other operating revenues of $7.0 million, and federal appropriations of $1.6 million. These increases in cash were offset by payments for employee compensation and benefits of an additional $21.9 million, as a result of Board-approved salary increases and one-time supplement payments, and additional payments to suppliers of $11.0 million. Although the University received fewer funds from grants and contracts of $19.3 million, payments for utilities and scholarship & fellowships decreased $1.5 million and $1.2 million, respectively.
Net cash provided by noncapital financing activities increased $11.8 million. This was primarily due to additional gifts of $7.7 million and additional allocation of state appropriations of $2.5 million over the allocation in fiscal year 2014. The remaining increase of $1.6 million was the difference between direct and other loan receipts and disbursements in fiscal year 2015.
The University saw an increase in net cash used in capital and related financing activities of $1.8 million. During fiscal year 2015, the University received $2.1 million less than in fiscal year 2014 related to capital gifts and grants. The University completed several projects funded by bond issuances, which caused funds expended related to those issuances to decrease by $10.4 million. During the fiscal year, the University partially refunded two bond issuances causing a net increase in cash flows provided by capital and related financing activity of $8.8 million. In contrast, payments for interest expense increased $13.9 million. This increase was a direct result of the completion of the previously mentioned construction projects. In prior years, some payments relating to interest expense were capitalized. These same costs are now shown as interest expense. In addition, the University increased the principal payments on debt by $5.3 million. This increase was the result of the University’s debt repayment strategies. Bonds issued in 2012 were structured to begin principal repayments in 2016, aligning payments with generation of corresponding pledged revenue.
Net cash used in investing activities increased by $149.6 million. Although the University received an additional $237.5 million from the proceeds from the sale and maturities of investments, the University utilized $388.6 million in the purchasing of new investments. The remaining increase of $1.5 million was attributable to investment income receipts. Economic factors that will affect the futureWhile the University is impacted by the general economic conditions, management believes the University will continue its high level of excellence in service to students, sponsors, the State of Alabama, and
Statement of Cash FlowsThe Statement of Cash Flows presents information about changes in the University’s cash position using the direct method of reporting sources and uses of cash. The direct method reports all major gross cash inflows and outflows, differentiating these activities into operating activities; noncapital financing, such as nonexchange grants and
contributions; capital and related financing, including bond proceeds from debt issued to purchase or construct buildings; and investing activities. Operating activity uses of cash significantly exceed operating activity sources of cash due to classification of state appropriations and gifts as noncapital financing activities.
The University’s cash flows are summarized below:
2015 2014
Net cash provided by (used in): Operating activities $ (156,592,736) $ (167,488,580) Noncapital financing activities 313,173,218 301,397,720 Capital and related financing activities (127,591,944) (125,797,480) Investing activities (91,707,514) 57,846,593
Net (decrease) increase in cash (62,718,976) 65,958,253 Cash and cash equivalents - beginning of year 137,388,965 71,430,712
Cash and cash equivalents - end of year $ 74,669,989 $ 137,388,965
other constituents. The University’s strong financial position and internal planning processes provide the University some protection against funding reductions and adverse economic conditions. Nonetheless, future reductions in state support must be anticipated and managed carefully to maintain excellence. Neither external nor internal efforts to mitigate the impact, however, are intended to eliminate the effects of future proration or decrease in state funding. As a labor intensive organization, the University faces competitive pressures related to attracting and retaining faculty and staff. The rising cost of health care remains a concern, particularly in light of the post-retirement health care benefits offered to retirees.
The University continues to address aging facilities with significant new construction, as well as modernization and renovation of existing facilities. Although funding of these projects through gifts, federal and state funds, and deferred maintenance budget allocations continues, the costs of operating the new and renovated facilities will continue to place additional resource demands on the operating budget of the institution.
The University continues to take steps to enhance student recruitment, both in marketing efforts and in providing additional scholarship funding. Applications, acceptances, and retention are monitored closely to assess the potential impact of general economic conditions on future enrollment. Management is cautiously optimistic that demand will remain strong.
The University will continue to employ its long-term investment strategy to maximize total returns at an appropriate level of risk, while utilizing a spending rate policy to insulate the University’s operations from temporary market volatility. Preservation of capital is regarded as the highest priority in the investing of the cash pool. Diversification through asset allocation is utilized as a fundamental risk strategy for endowed funds.
Cautionary note regarding forward-looking statements Certain information provided by the University, including written, as outlined above, or oral statements made by its representatives, may contain forward-looking statements as defined in the Private Securities Litigation Reform Act of 1995. All statements, other than statements of historical fact, which address activities, events, or developments that the University expects or anticipates will or may occur in the future, contain forward-looking information.
In reviewing such information, it should be kept in mind that actual results may differ materially from those projected or suggested in such forward looking information. This forward-looking information is based upon various factors and was derived using various assumptions.
MANAGEMENT’S DISCUSSION AND ANALYSIS (UNAUDITED)

Aub
urn U
nive
rsity
201
5
18
UNDERGRADUATE TUITION FOR THE ACADEMIC YEAR2011-12 2012-13 2013-14 2014-15 2015-16
Auburn Main Campus/Auburn University at Montgomery
Full Time Students: In-State $8,698/$7,580 $9,446/$8,115 $9,852/$8,750 $10,200/$9,080 $10,424/$9,350
Out-of-State $23,290/$21,440 $25,190/$23,115 $26,364/$24,950 $27,384/$19,640 $28,040/$20,210
FALL STUDENT ENROLLMENT2011 2012 2013 2014 2015
Auburn Main Campus andAuburn University at Montgomery
Undergraduate and Professional 24,849 24,400 24,133 25,006 26,043
Graduate 5,925 5,723 5,827 5,963 6,163
MANAGEMENT’S DISCUSSION AND ANALYSIS (UNAUDITED)
DEGREES AWARDED FOR THE ACADEMIC YEAR2010-11 2011-12 2012-13 2013-14 2014-15
Auburn Main Campus andAuburn University at Montgomery
Bachelor 4,800 4,833 4,834 5,090 5,115
Advanced 1,809 1,922 1,835 1,869 1,905
506 498 499 498
485
437
467 471 473 453
316 310 294 294
317
109 112 111 130 125
11 7 9 16 17
0
100
200
300
400
500
600
FALL 2011 FALL 2012 FALL 2013 FALL 2014 FALL 2015
Nu
mb
er o
f F
acu
lty
Term
AUBURN UNIVERSITY MAIN CAMPUS AND AUBURN UNIVERSITY AT MONTGOMERY
FULL-TIME FACULTY BY RANK
Professor Associate Professor Assistant Professor Instructor Visiting
AUBURN UNIVERSITY MAIN CAMPUS AND AUBURN UNIVERSITY AT MONTGOMERYFULL-TIME FACULTY BY RANK

Aub
urn U
nive
rsity
201
5
19
AUBURN UNIVERSITY MAIN CAMPUS FRESHMENENROLLMENT BY ALABAMA COUNTIES
SUMMER/FALL TERMS 2015
SOURCES OF ENTERING FRESHMEN BY STATEMAIN CAMPUS SUMMER/FALL TERMS 2015
AUBURN UNIVERSITY MAIN CAMPUS TOTAL STUDENT CREDIT HOURS BY COLLEGE/SCHOOL 2014-15
MANAGEMENT’S DISCUSSION AND ANALYSIS (UNAUDITED)
80,410
64,282
81,999
74,960
60,261
26,832
26,106
20,616
21,498
17,789
16,484
11,964
4,823
115,929
83,774
1,236
369
0 50,000 100,000 150,000 200,000 250,000
Liberal Arts
Sciences & Mathematics
Business
Engineering
Education
Human Sciences
Architecture, Design & Construction
Pharmacy
Veterinary Medicine
Agriculture
Other
Nursing
Forestry & Wildlife Sciences
Number of Credit Hours
College/School
AUBURN UNIVERSITY MAIN CAMPUS TOTAL STUDENT CREDIT HOURS BY COLLEGE/SCHOOL 2014-15
Other Courses
Core Courses
Alabama 59%
Georgia 14%
Florida 6%
Tennessee 3%
Texas 3%
North Carolina 2%
Other Locations 13%
Sources of Entering Freshmen by State Main Campus Summer/Fall Terms 2015
Jefferson 18%
Madison 15%
Shelby 11%
Lee 9%
Montgomery 5%
Mobile 5%
Baldwin 5%
Other 32%
Auburn University Main Campus Freshmen Enrollment by Alabama Counties
Summer/Fall Terms 2015

Aub
urn U
nive
rsity
201
5
20
AUBURN UNIVERSITYFIVE YEAR HIGHLIGHTS (MILLIONS OF DOLLARS)FOR THE FISCAL YEARS ENDED SEPTEMBER 30
2011 2012 2013 2014 2015
Revenues by Source Tuition and fees $ 294.7 $ 323.1 $ 349.2 $ 365.9 $ 395.6 Federal appropriations 38.8* 11.8 13.0 12.9 14.3 State appropriations 235.7 247.8 238.6 243.0 245.5 Grants and contracts, net 136.6 134.5 121.1 118.4 120.5 Gifts 32.3 36.6 35.4 36.6 43.9 Capital gifts and grants 48.2 17.2 28.2 3.8 4.8 Sales and services, investments and other income, net of interest expense
58.8 72.8 60.7 89.2 83.6
Sales and services of auxiliary enterprises 106.2 101.5 104.8 123.4 136.3 Total Revenues by Source $ 951.3 $ 945.3 $ 951.0 $ 993.2 $ 1,044.5
Expenditures by Function Instruction $ 230.4 $ 239.5 $ 242.6 $ 249.0 $ 254.6 Research 102.8 102.6 97.4 99.2 97.3 Public service 106.0 107.4 104.7 102.5 106.7 Academic support 38.8 38.8 43.7 53.3 55.4 Library 8.3 10.1 8.3 9.7 9.0 Student services 23.6 24.9 27.6 30.2 33.0 Institutional support 74.1 73.3 70.0 70.5 78.5 Operation and maintenance 77.8 66.3 84.5 78.8 78.8 Scholarships and fellowships 33.7 35.0 39.5 40.2 39.3 Auxiliary enterprises 102.5 99.1 106.9 123.1 122.6 Depreciation 53.8 61.1 66.1 71.8 74.3
Total Expenditures by Function $ 851.8 $ 858.1 $ 891.3 $ 928.3 $ 949.5
Expenditures by Natural Classification Compensation & benefits $ 536.6 $ 539.2 $ 558.0 $ 578.2 $ 598.4 Scholarships & fellowships 17.3 18.4 21.6 22.7 20.7 Utilities 23.3 23.2 22.8 26.0 24.5 Other supplies and services 220.8 216.2 222.8 229.6 231.6 Depreciation 53.8 61.1 66.1 71.8 74.3
Total Expenditures by Natural Classification $ 851.8 $ 858.1 $ 891.3 $ 928.3 $ 949.5
*Includes appropriation from The American Recovery and Reinvestment Act of 2009.
MANAGEMENT’S DISCUSSION AND ANALYSIS (UNAUDITED)
Aub
urn U
nive
rsity
201
5
21
AUBURN UNIVERSITYFINANCIAL RATIOS**
FOR THE FISCAL YEARS ENDED SEPTEMBER 30
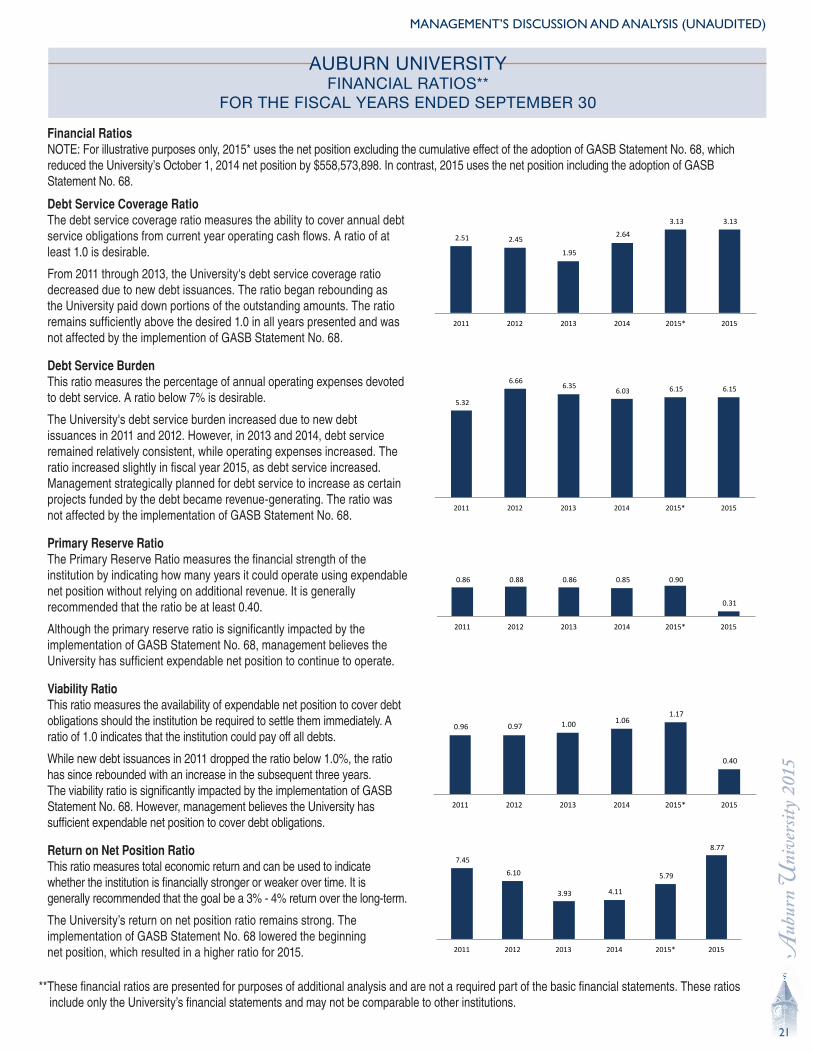
Debt Service Coverage Ratio The debt service coverage ratio measures the ability to cover annual debt service obligations from current year operating cash flows. A ratio of at least 1.0 is desirable.
From 2011 through 2013, the University's debt service coverage ratio decreased due to new debt issuances. The ratio began rebounding as the University paid down portions of the outstanding amounts. The ratio remains sufficiently above the desired 1.0 in all years presented and was not affected by the implemention of GASB Statement No. 68.
Debt Service Burden This ratio measures the percentage of annual operating expenses devoted to debt service. A ratio below 7% is desirable.
The University's debt service burden increased due to new debt issuances in 2011 and 2012. However, in 2013 and 2014, debt service remained relatively consistent, while operating expenses increased. The ratio increased slightly in fiscal year 2015, as debt service increased. Management strategically planned for debt service to increase as certain projects funded by the debt became revenue-generating. The ratio was not affected by the implementation of GASB Statement No. 68.
Primary Reserve Ratio The Primary Reserve Ratio measures the financial strength of the institution by indicating how many years it could operate using expendable net position without relying on additional revenue. It is generally recommended that the ratio be at least 0.40.
Although the primary reserve ratio is significantly impacted by the implementation of GASB Statement No. 68, management believes the University has sufficient expendable net position to continue to operate.
Viability Ratio This ratio measures the availability of expendable net position to cover debt obligations should the institution be required to settle them immediately. A ratio of 1.0 indicates that the institution could pay off all debts.
While new debt issuances in 2011 dropped the ratio below 1.0%, the ratio has since rebounded with an increase in the subsequent three years. The viability ratio is significantly impacted by the implementation of GASB Statement No. 68. However, management believes the University has sufficient expendable net position to cover debt obligations.
Return on Net Position Ratio This ratio measures total economic return and can be used to indicate whether the institution is financially stronger or weaker over time. It is generally recommended that the goal be a 3% - 4% return over the long-term.
The University’s return on net position ratio remains strong. The implementation of GASB Statement No. 68 lowered the beginning net position, which resulted in a higher ratio for 2015.
Financial Ratios NOTE: For illustrative purposes only, 2015* uses the net position excluding the cumulative effect of the adoption of GASB Statement No. 68, which reduced the University’s October 1, 2014 net position by $558,573,898. In contrast, 2015 uses the net position including the adoption of GASB Statement No. 68.
**These financial ratios are presented for purposes of additional analysis and are not a required part of the basic financial statements. These ratios include only the University’s financial statements and may not be comparable to other institutions.
2.51 2.45
1.95
2.64
3.13 3.13
2011 2012 2013 2014 2015* 2015
5.32
6.66 6.35
6.03 6.15 6.15
2011 2012 2013 2014 2015* 2015
0.86 0.88 0.86 0.85 0.90
0.31
2011 2012 2013 2014 2015* 2015
0.96 0.97 1.00 1.06 1.17
0.40
2011 2012 2013 2014 2015* 2015
7.45
6.10
3.93 4.11
5.79
8.77
2011 2012 2013 2014 2015* 2015
MANAGEMENT’S DISCUSSION AND ANALYSIS (UNAUDITED)

Aub
urn U
nive
rsity
201
5
22
AUBURN UNIVERSITYSTATEMENTS OF NET POSITIONSEPTEMBER 30, 2015 AND 2014
2015 2014ASSETS Current assets Cash and cash equivalents $ 74,669,989 $ 137,388,965 Operating investments 29,488,110 45,171,928 Accounts receivable, net 45,263,204 37,295,056 Student accounts receivable, net 41,267,044 37,346,662 Loans receivable, net 2,969,077 2,555,991 Accrued interest receivable 2,138,158 1,814,348 Inventories 4,861,123 4,599,906 Prepaid expenses 36,040,919 35,235,961 Total current assets 236,697,624 301,408,817
Noncurrent assets Investments 978,782,993 844,273,591 Loans receivable, net 17,041,018 17,116,551 Investment in plant, net 1,560,193,650 1,550,144,298 Total noncurrent assets 2,556,017,661 2,411,534,440 Total assets 2,792,715,285 2,712,943,257
DEFERRED OUTFLOWS OF RESOURCES Loss on refunding of bonds 26,953,797 14,442,185 Pension 53,229,926 - Total deferred outflows 80,183,723 14,442,185
LIABILITIES Current liabilities Accounts payable 52,709,497 55,670,506 Accrued salaries and wages 3,501,872 3,025,472 Accrued compensated absences 19,023,576 18,347,365 Accrued interest payable 11,677,978 12,298,575 Other accrued liabilities 5,449,261 8,344,327 Student deposits 2,866,239 3,068,492 Deposits held in custody 20,133,089 19,900,249 Unearned revenues 199,551,845 184,309,364 Noncurrent liabilities-current portion 30,253,504 28,817,852 Total current liabilities 345,166,861 333,782,202
Noncurrent liabilities Bonds and notes payable 699,839,916 716,188,582 Pension and OPEB 588,439,539 16,232,518 Other noncurrent liabilities 21,345,126 18,592,502 Total noncurrent liabilities 1,309,624,581 751,013,602 Total liabilities 1,654,791,442 1,084,795,804
DEFERRED INFLOWS OF RESOURCES Nonexchange transactions 206,159 435,203 Pension 39,307,330 - Total deferred inflows 39,513,489 435,203
NET POSITION Net investment in capital assets 855,698,812 821,520,355 Restricted Nonexpendable 28,537,859 28,176,521 Expendable: Scholarships, research, instruction, other 167,933,215 151,931,724 Loans 5,171,064 5,013,550 Capital projects 4,378,922 5,220,606 Unrestricted 116,874,205 630,291,679 Total net position $ 1,178,594,077 $ 1,642,154,435
See accompanying notes to financial statements.

Aub
urn U
nive
rsity
201
5
23
AUBURN UNIVERSITYSTATEMENTS OF REVENUES, EXPENSES AND CHANGES IN NET POSITION
FOR THE YEARS ENDED SEPTEMBER 30, 2015 AND 2014
2015 2014OPERATING REVENUES Tuition & fees, net of scholarship allowances of $104,855,468 and $107,695,483, respectively $ 395,612,498 $ 365,946,812 Federal appropriations 14,304,014 12,888,064 Federal grants & contracts, net 65,197,789 65,480,729 State & local grants & contracts, net 18,137,344 16,025,884 Nongovernmental grants & contracts, net 14,533,400 14,871,312 Sales & services of educational departments 44,393,576 42,072,042 Auxiliary revenue, net of scholarship allowances of $8,113,771 and $7,041,111, respectively 136,309,769 123,401,308 Other operating revenues 30,026,559 23,223,001 Total operating revenues 718,514,949 663,909,152
OPERATING EXPENSES Compensation & benefits 598,404,935 578,242,854 Scholarships & fellowships 20,739,919 22,651,077 Utilities 24,520,336 26,003,836 Other supplies & services 231,559,648 229,604,057 Depreciation 74,297,440 71,795,613 Total operating expenses 949,522,278 928,297,437
Operating loss (231,007,329) (264,388,285)
NONOPERATING REVENUES (EXPENSES) State appropriations 245,502,175 242,982,031 Gifts 43,862,924 36,622,346 Grants 22,620,365 22,037,644 Net investment income 27,441,880 38,843,549 Interest expense on capital debt (18,597,132) (15,435,498) Nonoperating revenues, net 320,830,212 325,050,072
Income before other changes in net position 89,822,883 60,661,787
OTHER CHANGES IN NET POSITION Capital appropriations - 16,585 Capital gifts & grants 4,829,319 3,729,932 Additions to permanent endowments 361,338 479,958 Net increase in net position 95,013,540 64,888,262
Net position - beginning of year 1,642,154,435 1,577,266,173 Cumulative effect of accounting change (558,573,898)Net position October 1, 2014, as restated 1,083,580,537Net position - end of year $ 1,178,594,077 $ 1,642,154,435
See accompanying notes to financial statements.

Aub
urn U
nive
rsity
201
5
24
AUBURN UNIVERSITYSTATEMENTS OF CASH FLOWS
FOR THE YEARS ENDED SEPTEMBER 30, 2015 AND 2014
2015 2014CASH FLOWS FROM OPERATING ACTIVITIES Tuition & fees $ 401,863,262 $ 373,885,655 Federal appropriations 13,398,839 11,822,841 Grants & contracts 88,102,237 107,445,031 Sales & services of educational departments 42,390,578 41,765,348 Auxiliary revenue 144,934,497 119,881,121 Other operating revenues 30,698,728 23,686,105 Payments to suppliers (234,889,869) (222,067,887) Payments for utilities (24,520,336) (26,003,836) Payments for employee compensation & benefits (596,775,639) (574,905,901) Payments for scholarships & fellowships (21,286,355) (22,507,092) Student loans issued (3,872,655) (3,397,962) Student loans collected 3,363,977 2,907,997 Net cash used in operating activities (156,592,736) (167,488,580)
CASH FLOWS FROM NONCAPITAL FINANCING ACTIVITIES State appropriations 245,502,175 242,982,031 Gifts and grants for other than capital purposes 66,738,081 59,170,269 Direct and other loan receipts 198,010,171 177,467,924 Direct and other loan disbursements (197,077,209) (178,222,504) Net cash provided by noncapital financing activities 313,173,218 301,397,720
CASH FLOWS FROM CAPITAL AND RELATED FINANCING ACTIVITIES Proceeds from advanced refunding of debt, net of issuance cost 171,240,220 75,346,556 Capital appropriations - 16,585 Capital grants & gifts received 2,544,239 4,611,200 Purchases of capital assets (82,628,205) (93,052,995) Proceeds received from sale of capital assets 308,735 81,250 Principal paid on debt & capital leases (24,863,361) (19,596,314) Interest paid on debt & capital leases (39,373,572) (25,503,762) Payment to escrow on advanced refunding of debt (154,820,000) (67,700,000) Net cash used in capital and related financing activities (127,591,944) (125,797,480)
CASH FLOWS FROM INVESTING ACTIVITIES Proceeds from sales and maturities of investments and reinvestments 600,620,269 363,116,309 Investment income 20,924,830 19,419,490 Purchases of investments (713,252,613) (324,689,206) Net cash (used in) provided by investing activities (91,707,514) 57,846,593
Net (decrease) increase in cash and cash equivalents (62,718,976) 65,958,253
Cash and cash equivalents - beginning of year 137,388,965 71,430,712
Cash and cash equivalents - end of year $ 74,669,989 $ 137,388,965
See accompanying notes to financial statements.

Aub
urn U
nive
rsity
201
5
25
AUBURN UNIVERSITYSTATEMENTS OF CASH FLOWS (CONTINUED)
FOR THE YEARS ENDED SEPTEMBER 30, 2015 AND 2014
2015 2014RECONCILIATION OF OPERATING LOSS TO NET CASH USED IN OPERATING ACTIVITIES:
Operating loss $ (231,007,329) $ (264,388,285) Adjustments to reconcile operating loss to net cash used in operating activities: Depreciation and amortization 74,297,440 71,795,613 Reserve for recovery of loans receivable 171,125 224,464 Loss on sale of capital assets 2,160,182 1,894,750 Changes in assets and liabilities: Accounts receivable (8,326,852) 6,747,315 Student accounts receivable (3,920,382) (2,986,486) Inventories (261,217) (82,414) Unearned revenues 15,242,481 10,445,588 Accounts payable (4,400,835) 4,791,721 Prepaid expenses (804,958) 17,492 Accrued salaries, wages and compensated absences 1,152,611 1,203,266 Student deposits and deposits held in custody (902,375) 24,548 Loans to students (508,678) (489,965) Other accrued liabilities (2,895,066) 644,363 Nonexchange transactions (229,044) 88,209 Pension obligation (2,062,054) - Other noncurrent liabilities 5,702,215 2,581,241 Net cash used in operating activities $ (156,592,736) $ (167,488,580)
SUPPLEMENTAL NONCASH ACTIVITIES INFORMATION
Capital assets acquired with a liability at year-end $ 4,674,497 $ 3,234,671 Gifts of capital assets 2,750,330 2,385,618 Capitalized interest 12,535,730 18,485,556
See accompanying notes to financial statements.

Aub
urn U
nive
rsity
201
5
26
AUBURN UNIVERSITY COMPONENT UNITSSTATEMENTS OF FINANCIAL POSITION
SEPTEMBER 30, 2015 AND 2014
Auburn University Foundation Auburn Alumni Association2015 2014 2015 2014
ASSETS Cash and cash equivalents $ 10,226,894 $ 3,349,824 $ 20,729 $ 72,071 Investments 421,516,863 418,046,081 4,357,167 4,776,518 Investment in Auburn University Foundation Securities Pool - - 8,210,325 8,989,525 Accrued interest receivable 107,808 79,593 17,423 20,431 Contributions receivable, net 105,082,407 68,585,013 297,820 357,720 Other assets 27,773 6,467 - 34 Investment in real estate 3,200,304 4,074,251 674,799 674,799 Cash surrender value of life insurance 5,588,166 5,082,046 - - Beneficial interest in outside trusts 5,205,119 5,405,637 - - Property and equipment, net 189,941 218,706 1,885,632 1,943,453 Prepaid items - - 270 5,025 Due from Auburn University 545,454 260,860 - - Due from Auburn University Foundation - - 379 - Due from Auburn Alumni Association 639,500 - - - Total assets $ 552,330,229 $ 505,108,478 $ 15,464,544 $ 16,839,576
LIABILITIES Accounts payable and accrued liabilities $ 500,357 $ 423,320 $ 63,839 $ 102,396 Annuities payable 9,424,128 8,637,277 - - Due to Auburn University 109,533 168,834 75,559 - Due to Auburn University Foundation - - 641,043 452,369 Due to Auburn Alumni Association 8,210,325 8,989,525 - - Due to Tigers Unlimited Foundation 8,047,688 8,606,643 - - Deferred revenue 94,151 1,126 8,476,549 8,391,185 Total liabilities 26,386,182 26,826,725 9,256,990 8,945,950
NET ASSETS Unrestricted 19,619,387 23,015,641 6,207,554 7,893,626 Temporarily restricted 144,144,939 123,459,727 - - Permanently restricted 362,179,721 331,806,385 - - Total net assets 525,944,047 478,281,753 6,207,554 7,893,626 Total liabilities and net assets $ 552,330,229 $ 505,108,478 $ 15,464,544 $ 16,839,576
See accompanying notes to financial statements.

Aub
urn U
nive
rsity
201
5
27
AUBURN UNIVERSITY COMPONENT UNITSSTATEMENTS OF ACTIVITIES AND CHANGES IN NET ASSETS
FOR THE YEARS ENDED SEPTEMBER 30, 2015 AND 2014
Auburn University Foundation Auburn Alumni Association2015 2014 2015 2014
REVENUES AND OTHER SUPPORT Public support - contributions $ 108,542,846 $ 65,670,616 $ 1,578,527 $ 2,374,133 Investment income 1,768,469 2,511,539 369,014 352,191 Other revenues 2,345,413 2,037,897 897,123 881,262 Total operating revenues 112,656,728 70,220,052 2,844,664 3,607,586
EXPENSES AND LOSSES Program services Contributions to and support for Auburn University 36,885,661 31,503,530 - - Other program services 3,264,551 3,403,546 2,140,300 1,778,184 Total program services 40,150,212 34,907,076 2,140,300 1,778,184
Support services General and administrative 1,675,940 1,505,924 1,466,443 1,439,651 Fund raising 3,291,330 2,890,611 202,302 259,264 Total support services 4,967,270 4,396,535 1,668,745 1,698,915 Total expenses 45,117,482 39,303,611 3,809,045 3,477,099
Unrealized losses (gains) on investments 23,590,805 (17,822,794) 721,691 (568,822) Realized gains on investments (5,481,835) (16,003,747) - - Change in valuation of split-interest agreements 1,742,862 (1,602,085) - - Impairment in real estate 25,120 23,234 - - Total expenses, (gains) and losses 64,994,434 3,898,219 4,530,736 2,908,277
*Change in net assets 47,662,294 66,321,833 (1,686,072) 699,309
Net assets - beginning of year 478,281,753 411,959,920 7,893,626 7,194,317
Net assets - end of year $ 525,944,047 $ 478,281,753 $ 6,207,554 $ 7,893,626
*Change in net assets Unrestricted $ (3,396,254) $ 2,491,520 $ (1,686,072) $ 699,309 Temporarily restricted 20,685,212 29,700,243 - - Permanently restricted 30,373,336 34,130,070 - - Total change in net assets $ 47,662,294 $ 66,321,833 $ (1,686,072) $ 699,309
See accompanying notes to financial statements.

Aub
urn U
nive
rsity
201
5
28
AUBURN UNIVERSITY COMPONENT UNITSSTATEMENTS OF FINANCIAL POSITION
JUNE 30, 2015 AND 2014
Tigers Unlimited FoundationTigers Unlimited FoundationTigers Unlimited Foundation Tigers Unlimited Foundation2015 2014
ASSETS
Cash and cash equivalents $ 1,412,961 $ 756,174 Investments 39,440,159 36,013,989 Investment in Auburn University Foundation Securities Pool 8,542,039 8,629,832 Due from Auburn University 36,800 - Accrued interest receivable 105,043 95,311 Contributions receivable, net 10,833,485 10,726,457 Other receivables 412,063 614,125 Other assets 195,459 175,967 Property and equipment, net 17,617 91,129 Total assets $ 60,995,626 $ 57,102,984
LIABILITIES Accounts payable and accrued liabilities $ 462,449 $ 665,088 Contracts payable, net 5,467,368 6,719,759 Deferred revenue 2,379,824 1,872,870 Due to Auburn University 5,693,143 2,943,300 Due to Auburn University Foundation 165,000 - Total liabilities 14,167,784 12,201,017
NET ASSETS Unrestricted 23,614,005 22,862,847 Temporarily restricted 16,060,965 14,919,083 Permanently restricted 7,152,872 7,120,037 Total net assets 46,827,842 44,901,967 Total liabilities and net assets $ 60,995,626 $ 57,102,984
See accompanying notes to financial statements.

Aub
urn U
nive
rsity
201
5
29
AUBURN UNIVERSITY COMPONENT UNITSSTATEMENTS OF ACTIVITIES AND CHANGES IN NET ASSETS
FOR THE YEARS ENDED JUNE 30, 2015 AND 2014
Tigers Unlimited FoundationTigers Unlimited FoundationTigers Unlimited Foundation Tigers Unlimited Foundation2015 2014
REVENUES AND OTHER SUPPORT Public support - contributions $ 40,117,708 $ 37,870,989 Investment income 765,225 714,044 Other revenues 6,080,997 5,823,499 Total operating revenues 46,963,930 44,408,532
EXPENSES AND LOSSES Program services Contributions to and support for Auburn University 16,756,982 17,217,019 Other program services 17,644,565 17,531,732 Total program services 34,401,547 34,748,751
Support services General and administrative 1,645,433 1,235,573 Fund raising 8,064,233 7,847,297 Total support services 9,709,666 9,082,870 Total expenses 44,111,213 43,831,621
Unrealized gains on investments, net (109,901) (1,319,406) Realized losses on investments, net 641 228 Loss on write-off of contribution receivable 1,036,102 1,969,702 Total expenses, (gains) and losses 45,038,055 44,482,145
*Change in net assets 1,925,875 (73,613)
Net assets - beginning of year 44,901,967 44,975,580
Net assets - end of year $ 46,827,842 $ 44,901,967
*Change in net assets Unrestricted $ 751,158 $ (151,084) Temporarily restricted 1,141,882 (70,480) Permanently restricted 32,835 147,951 Total change in net assets $ 1,925,875 $ (73,613)
See accompanying notes to financial statements.

Aub
urn U
nive
rsity
201
5
30
AUBURN UNIVERSITY COMPONENT UNITSSTATEMENTS OF FINANCIAL POSITION
SEPTEMBER 30, 2015 AND 2014
Tigers Unlimited FoundationTigers Unlimited FoundationAuburn Research and Technology Foundation2015 2014
ASSETS
Cash and cash equivalents $ 898,777 $ 731,782 Deposits 40,836 42,143 Other assets 22,051 26,886 Accounts receivable 788,789 349,836 Contributions receivable, net 1,015,948 1,070,336 Property and equipment, net 8,242,346 8,549,672 Total assets $ 11,008,747 $ 10,770,655
LIABILITIES Accounts payable $ 134,590 $ 68,353 Deferred revenue 201,375 184,955 Deposits held in custody 40,836 42,143 Interest payable 34,972 36,478 Loan payable to Auburn University 841,305 877,548 Other payable to Auburn University 225,705 110,102 Total liabilities 1,478,783 1,319,579
NET ASSETS Unrestricted 8,513,975 8,380,699 Temporarily restricted 1,015,989 1,070,377 Total net assets 9,529,964 9,451,076 Total liabilities and net assets $ 11,008,747 $ 10,770,655
See accompanying notes to financial statements.

Aub
urn U
nive
rsity
201
5
31
AUBURN UNIVERSITY COMPONENT UNITSSTATEMENTS OF ACTIVITIES AND CHANGES IN NET ASSETS
FOR THE YEARS ENDED SEPTEMBER 30, 2015 AND 2014
Auburn Research and Technology Foundation2015 2014
REVENUES AND OTHER SUPPORT Rental income $ 1,044,682 $ 982,030 Interest income 20,855 - Other contracts 536,735 266,654 Contributions 27,639 24,702 Total operating revenues 1,629,911 1,273,386
EXPENSES Support services General and administrative 1,133,438 838,562 Amortization 65,026 65,026 Depreciation 316,769 317,894 Interest 35,790 37,328 Total support services 1,551,023 1,258,810 Total expenses 1,551,023 1,258,810
*Change in net assets 78,888 14,576
Net assets - beginning of year 9,451,076 9,436,500
Net assets - end of year $ 9,529,964 $ 9,451,076
*Change in net assets Unrestricted $ 133,276 $ 71,683 Temporarily restricted (54,388) (57,107) Total change in net assets $ 78,888 $ 14,576
See accompanying notes to financial statements.

Aub
urn U
nive
rsity
201
5
32
NOTES TO FINANCIAL STATEMENTS (1) NATURE OF OPERATIONSAuburn University (the University) is a land grant university originally chartered on February 1, 1856, as the East Alabama Male College. The Federal Land Grant Act of 1862, by which the University was established as a land grant university, donated public lands to several states and territories with the intent that the states would use these properties for the benefit of agriculture and the mechanical arts. Several pertinent laws dictate specific purposes for which the land may be used. In 1960, the Alabama State Legislature officially changed the name to Auburn University. The University has two campuses, Auburn and Montgomery, with a combined enrollment of 32,206 students for Fall semester 2015. The University serves the State of Alabama, the nation and international business communities through instruction of students and the advancement of research and outreach programs. By statutory laws of the State of Alabama, the University is governed by the Board of Trustees (the Board) who are appointed by the Governor of Alabama, a committee consisting of two trustees and two Alumni Association board members and approved by the Alabama State Senate.
The accompanying financial statements of the University have been prepared in accordance with accounting principles generally accepted in the United States of America, as prescribed by the Governmental Accounting Standards Board (GASB). The accompanying financial statements include the following four divisions of the University:
Auburn University Main CampusAuburn University at MontgomeryAlabama Agricultural Experiment StationAlabama Cooperative Extension System
The University, a publicly supported, state funded institution, is a component unit of the State of Alabama and is included in the Comprehensive Annual Financial Report of the State. However, the University is considered a separate reporting entity for financial statement purposes.
The University, as a public corporation and instrumentality of the State of Alabama, is exempt from federal income taxes under Section 115 of the Internal Revenue Code. Certain transactions may be taxable as unrelated business income under Internal Revenue Code Sections 511 to 514.
Contributions intended for the University’s benefit are primarily received through the University’s component units and are deductible by donors as provided under Section 170 of the Internal Revenue Code, consistent with the provisions under Section 501(c)(3) and corresponding state law.
Component UnitsThe University adheres to GASB Statement No. 39, Determining Whether Certain Organizations Are Component Units-an amendment of GASB Statement No. 14. This statement clarifies GASB Statement No. 14, The Financial Reporting Entity, which provides criteria for determining whether such organizations for which a government is not financially accountable should be reported as component units. In accordance with GASB Statement No. 61, The Financial Reporting Entity: Omnibus –an Amendment of GASB Statements No. 14 and No. 34, the University has included statements for Auburn University Foundation, Auburn Alumni Association, Tigers Unlimited Foundation and Auburn Research and Technology Foundation in these financial statements, as exclusion
of such organizations would render the entity’s financial statements misleading or incomplete. Auburn University Real Estate Foundation, Inc. has been consolidated into Auburn University Foundation’s financial statements, as an affiliated supporting organization. The University’s component units’ financial statements are presented following the University’s statements. The component units are not GASB entities; therefore, their respective financial statements adhere to accounting principles under the Financial Accounting Standards Board (FASB) Accounting Standards Codification (ASC).
Auburn University Foundation (AUF) is a qualified charitable organization established in 1960, existing solely for the purpose of receiving and administering funds for the benefit of the University. AUF is exempt from federal income taxes pursuant to Section 501(c)(3) of the Internal Revenue Code. Therefore, no provision has been made for income taxes in their respective financial statements. AUF’s activities are governed by its own Board of Directors.
Auburn Alumni Association (the Association) is an independent corporation organized on April 14, 1945, which was created to promote mutually beneficial relationships between the University and its alumni, to encourage loyalty among alumni and to undertake various other actions for the benefit of the University, its alumni and the State of Alabama. Membership is comprised of alumni, friends and students of the University. The Association is exempt from federal income taxes pursuant to Section 501(c)(3) of the Internal Revenue Code. Therefore, no provision has been made for income taxes in their respective financial statements. The Association’s activities are governed by its own Board of Directors.
Tigers Unlimited Foundation (TUF) is an independent corporation that began operations on April 21, 2004. It was formed for the sole purpose of obtaining and disbursing funds for the University’s Intercollegiate Athletics Department. TUF is exempt from federal income taxes under Section 501(a) as an organization described in Section 501(c)(3).Therefore, no provision has been made for income taxes in their respective financial statements. TUF’s activities are governed by its own Board of Directors with transactions being maintained using a June 30 fiscal year end date.
Auburn Research and Technology Foundation (ARTF) is an independent corporation organized on August 24, 2004, to facilitate the acquisition, construction and equipping of a technology and research park on the University’s campus. ARTF was organized under Internal Revenue Code 501(a)(3). ARTF is exempt from federal income taxes under Section 501(c)(3) of the Internal Revenue Code. ARTF’s activities are governed by its own Board of Directors.
Auburn University Real Estate Foundation, Inc. (AUREFI) is a qualified charitable organization created on July 5, 2005, solely for the purpose of receiving and administering real estate gifts. AUREFI was organized under Internal Revenue Code 170(b)(1)(A)(vi). This real estate holding corporation is a tax-exempt organization under Section 501(c)(3) of the Internal Revenue Code. AUREFI is owned and controlled by AUF, and its financial statements are consolidated with AUF’s financial statements. AUREFI’s activities are governed by its own Board of Directors.

Aub
urn U
nive
rsity
201
5
33
The financial statements of the component units have been prepared on the accrual basis of accounting. Net assets, revenues, expenses, gains and losses are classified based on the existence or absence of donor-imposed restrictions. Accordingly, net assets of the component units and changes therein are classified and reported as unrestricted, temporarily restricted or permanently restricted.
Investments in debt securities, equity securities and mutual funds with readily determinable market values are reported at their fair values based on published market prices.
Contributions received, including unconditional promises to give, are recognized as revenues at their fair values in the period received. For financial reporting purposes, the component units distinguish between contributions of unrestricted assets, temporarily restricted assets and permanently restricted assets. Contributions for which donors have imposed restrictions which limit the use of the donated assets, are reported as restricted support if the restrictions are not met in the same reporting period. When such donor-imposed restrictions are met in subsequent reporting periods, temporarily restricted net assets are reclassified to unrestricted net assets and reported as net assets released from restrictions when the purpose or time restrictions are met. Contributions of assets which donors have stipulated must be maintained permanently, with only the income earned thereon available for current use, are classified as permanently restricted assets. Contributions for which donors have not stipulated restrictions are reported as unrestricted support.
Financial statements for AUF and the Association may be obtained by writing to the applicable entity at 317 South College Street, Auburn University, Alabama 36849. Financial statements for TUF may be obtained by writing to Athletic Complex, 392 South Donahue Drive, Auburn University, Alabama 36849. Financial statements for ARTF may be obtained by writing to 570 Devall Drive, Suite 101, Auburn, Alabama 36832.
Financial Statement PresentationFor financial reporting purposes, the University adheres to the provisions of GASB Statement No. 34, Basic Financial Statements and Management’s Discussion and Analysis-for State and Local Governments and GASB Statement No. 35, Basic Financial Statements and Management’s Discussion and Analysis-for Public Colleges and Universities-an amendment of GASB Statement No. 34, GASB Statement No. 63, Financial Reporting of Deferred Outflows of Resources, Deferred Inflows of Resources, and Net Position and GASB Statement No. 65, Items Previously Reported and Assets and Liabilities. These statements establish standards for external financial reporting for public colleges and universities on an entity-wide perspective and require that resources be classified in three net position categories.
• Net investment in capital assets: This category is defined as capital assets, net of accumulated depreciation, reduced by the outstanding balances of bonds, mortgages, notes, or other borrowings that are attributable to the acquisition, construction, or improvement of those assets. Deferred inflows and outflows of resources attributable to the acquisition, construction, or improvement of those assets or related debt also would be included in this component of net position. Unexpended related debt proceeds and the related debt attributable to the unspent amount as well as deferred inflows of resources, if applicable, are not reported in net investment in capital assets, but in restricted or unrestricted net position.
• Restricted net position: The restricted component of net position consists of Nonexpendable and Expendable elements. Nonexpendable – Nonexpendable restricted net position is the net amount of the assets, deferred outflows of resources, liabilities and deferred inflows of resources subject to externally imposed stipulations that they be maintained permanently by the University. This element includes the University’s permanent endowment funds. Expendable – Expendable restricted net position is the net amount of the assets, deferred outflows of resources, liabilities and deferred inflows of resources whose use by the University are subject to externally imposed stipulations that can be fulfilled by actions of the University pursuant to those stipulations, or that expire by the passage of time.
• Unrestricted net position: This category is defined as the net amount of the assets, deferred outflows of resources, liabilities, and deferred inflows of resources that are not subject to externally imposed stipulations or included in the determination of net investment in capital assets. Unrestricted net position may be designated for specific purposes by action of management or the Board. Substantially all unrestricted net position is designated for academic and research programs and initiatives, capital projects, and auxiliary units.
GASB Statements No. 35 and No. 63 also require three statements: the Statement of Net Position; the Statement of Revenues, Expenses and Changes in Net Position; and the Statement of Cash Flows.
During fiscal year 2015, the University implemented GASB Statement No. 68, Accounting and Financial Reporting for Pensions and GASB Statement No. 71, Pension Transition for Contributions Made Subsequent to the Measurement Date. GASB Statement No. 68 revises existing standards for employer financial statements and requires the recognition of a liability equal to the net pension obligation for pension plans provided by the University to its employees. The net pension obligation is measured as the total pension liability, less the amount of the pension plan’s fiduciary net position. The total pension liability is determined based upon discounting projected benefit payments based on the benefit terms and legal agreements existing at the pension plan’s fiscal year end. Projected benefit payments are required to be discounted using a single rate that reflects the expected rate of return on investments, to the extent that plan assets are available to pay benefits, and a tax-exempt, high-quality municipal bond rate when plan assets are not available. This Statement requires that most changes in the net pension liability be included in pension expense in the period of the change.
GASB Statement No. 71 is a clarification to GASB Statement No. 68 requiring recognition of a beginning deferred outflow of resources for its pension contributions, if any, made subsequent to the measurement date of the beginning net pension liability. These statements also enhance accountability and transparency through revised note disclosures and required supplementary information (RSI). September 30, 2014 amounts have not been restated to reflect the impact of GASB Statement No. 68 because the information is not available to calculate the impact on pension expense for the fiscal year ending September 30, 2014. In accordance with the Statement, the University has reported a net pension liability (net of deferred outflows of resources) in the amount of $558,573,898 as a change in accounting principle adjustment to unrestricted net position as of October 1, 2014.

Aub
urn U
nive
rsity
201
5
34
that are in the possession of an outside party.” As an element of interest rate risk, this Statement requires certain disclosures of investments that have fair values which are highly sensitive to changes in interest rates. Deposit and investment policies related to the risks identified in this statement are also required to be disclosed (see Note 4).
Operating investments consist of cash and investments designated for current operations. Investments for capital and student loan activities represent funds that are intended to be used for the related specific activities. Investments recorded as endowment and life income represent funds that are considered by management to be of long duration. Investments received by gift are recorded at fair value on the date of receipt. Investments in real estate are recorded at fair value. For investments other than non-readily marketable investments, investment income is recorded on the accrual basis of accounting. For non-readily marketable investments, investment income is recorded as received.
InventoriesUnits currently holding inventories include Facilities, Scientific Supply Store, Chemistry Glass Shop, Animal Clinic Pharmacy, Alabama Agricultural Experiment Station, Bookstores, Museum Gift Shop, Copycat Duplicating Service, and Ralph Draughon and AUM Libraries. All inventories are valued at the lower of cost or market, on the first-in, first-out basis, and are considered to be current assets.
Capital AssetsCapital expenditures and gifts of land, buildings and equipment are carried at cost at date of acquisition or, in the case of gifts, at fair value at the date of donation. Depreciation is computed on a straight line basis over the estimated useful lives of buildings and building improvements (40 years), land improvements and infrastructure (10 – 40 years), library collection and software costs (10 years) and inventoried equipment (5 – 18 years). Land and construction in progress are not depreciated. The threshold for capitalizing buildings and infrastructure is $25,000. Expenditures for maintenance, repairs and minor renewals and replacements are expensed as incurred; major renewals and replacements are capitalized if they meet the $25,000 threshold. Construction in progress expense is capitalized as incurred. Interest expense related to construction is capitalized net of interest income earned on bond proceeds. Equipment is capitalized if the cost exceeds $5,000 and has a useful life of more than one year. All buildings are insured through the State of Alabama Property Insurance Fund.
Art collections and historical treasures are capitalized and valued at cost or fair value at the date of purchase or gift, respectively, but not depreciated. Collections are preserved and held for public exhibition, education and research.
Livestock is capitalized and valued at cost or fair value at the date of purchase or gift, respectively, but not depreciated. Annually, livestock inventories are adjusted to actual livestock counts, valued in various manners depending on the type and purpose of the livestock.
In accordance with GASB Statement No. 42, Accounting and Financial Reporting for Impairment of Capital Assets and for Insurance Recoveries, the University continues to evaluate prominent events or changes in circumstance to determine whether an impairment loss should be recorded and whether any insurance recoveries should be offset against the impairment loss. The University did not record any losses related to asset impairment during fiscal year 2015 or 2014.
Basis of AccountingThe financial statements of the University have been prepared on the accrual basis of accounting and in accordance with accounting standards of the United States of America and all significant, interdivisional transactions between auxiliary units and other funds have been eliminated. The University reports as a Business Type Activity (BTA) as defined by GASB Statement No. 35. BTAs are those institutions that are financed in whole or in part by fees charged to external parties for goods or services. Under BTA reporting, it is required that statements be prepared using the economic resources measurement focus.
GASB Statement No. 35 requires the recording of depreciation on capital assets, accrual or deferral of revenue associated with certain grants and contracts, accrual of interest expense, accounting for certain scholarship allowances as a reduction of revenue, classification of federal refundable loans as a liability, and capitalization and depreciation of equipment.
Use of EstimatesThe preparation of financial statements in conformity with accounting principles generally accepted in the United States of America requires management to make estimates and assumptions that affect the reported amounts of assets and liabilities and disclosure of contingent liabilities at the date of the financial statements and the reported amounts of revenues and expenses during the reporting period. Actual results could differ from those estimates.
(2) SIGNIFICANT ACCOUNTING POLICIES OF AUBURN UNIVERSITYCash & Cash EquivalentsCash and cash equivalents are defined as highly liquid debt instruments readily convertible into cash and with maturities at date of acquisition of three months or less, whose use is not restricted for long term purposes.
InvestmentsInvestments in equity securities, mutual funds, common trust funds, business trust funds, cash value of life insurance and debt securities are reported at fair value in the Statement of Net Position, with all net realized and unrealized gains and losses reflected in the Statement of Revenues, Expenses and Changes in Net Position. Fair value of these investments is based on quoted market prices or dealer quotes where available.
Under GASB Statement No. 31, Accounting and Financial Reporting for Certain Investments and for External Investment Pools, the University records its initial investment and subsequent contributions in non-readily marketable investments at cost with no adjustments for its share of income/appreciation and losses/depreciation received from the investment (see Note 4). The University performs periodic evaluations in which these investments are monitored for impairment. The University did not record any significant losses related to investment impairment during fiscal years 2015 or 2014.
Under GASB Statement No. 40, Deposit and Investment Risk Disclosures-an amendment of GASB Statement No. 3, common deposit and investment risks related to credit risk, concentration of credit risk, interest rate risk, and foreign currency risk are addressed. This statement defines custodial risk for deposits as “the risk that, in the event of a failure of a depository financial institution, a government will not be able to recover deposits or will not be able to recover collateral securities

Aub
urn U
nive
rsity
201
5
35
Unearned RevenuesUnearned revenues include funds received in advance of an event, such as tuition and fees and advance ticket sales for athletic events.Net student tuition and fee revenues and housing revenues for the fall semester are recognized in the fiscal year in which the related revenues are earned. Ticket sale revenues for athletic events are recognized as the related games are played. Unearned revenues also consist of amounts received from grant and contract sponsors that have not yet been earned under the terms of the agreements. Amounts received from grant sponsors for which the only unmet term of the agreement is timing (i.e. funds may not be spent until a certain date) are classified as deferred inflows of resources in accordance with GASB Statement No. 65. All other unearned revenue is classified as a current liability (see Note 13).
Classification of RevenuesThe University has classified its revenues as either operating or nonoperating according to the following criteria:
• Operating Revenues: Operating revenues include activities that have the characteristics of exchange transactions, such as student tuition and fees, net of scholarship discounts and allowances, sales and services of auxiliary enterprises, net of scholarship discounts and allowances, most federal, state, local, private grants and contracts and federal appropriations, and interest on institutional student loans.
• Nonoperating Revenues: Nonoperating revenues include activities that have the characteristics of nonexchange transactions, such as gifts and contributions, and other revenue sources that are defined as nonoperating revenues. In accordance with GASB Statement No. 35, certain significant revenues on which the University relies to support its operational mission are required to be recorded as nonoperating revenues. These revenues include state appropriations, private gifts, federal Pell grants and investment income, including realized and unrealized gains and losses on investments.
Student Tuition, Fees and Scholarship Discounts and AllowancesStudent tuition and fee revenues and certain other revenues from students are reported net of scholarship discounts and allowances in the Statement of Revenues, Expenses and Changes in Net Position. Scholarship discounts and allowances represent the difference between the stated charge for goods and services provided by the University and the amount that is paid by students and/or third parties making payments on the students’ behalf. Scholarship allowance to students is reported using the alternative method as prescribed by the National Association of College and University Business Officers (NACUBO). The alternative method is an algorithm that computes scholarship allowance on a university-wide basis rather than on an individual student basis.
Auxiliary RevenuesSales and services of auxiliary enterprises primarily consist of revenues generated by athletics, bookstore, housing, dining, printing and telecommunications, which are substantially self supporting activities that primarily provide services to students, faculty, administrative and professional employees and staff.
Grants and Contracts RevenuesThe University receives sponsored funding from governmental and private sources. Revenues from these projects are recognized in accordance with GASB Statement No. 33, Accounting and Financial
Reporting for Nonexchange Transactions, based on the terms of the individual grant or contract. Pell grants are recorded as nonoperating revenues in the accompanying Statements of Revenues, Expenses and Changes in Net Position.
Compensated AbsencesThe University reports employees’ accrued annual leave and sick leave at varying rates depending upon employee classification and length of service, subject to maximum limitations. Upon termination of employment, employees are paid all unused accrued vacation at their regular rates of pay up to a designated maximum number of days. GASB Statement No. 35 requires the amount of compensated absences that are due within one year of the fiscal year end to be classified as a current liability. Since this amount cannot be known precisely in advance, the current liability is estimated, based on a three year average cost of annual and sick leave taken by eligible employees.
Donor PledgesThe University normally does not receive gift pledges. Pledged revenue representing unconditional promises to give is normally received by AUF or TUF and later disbursed in accordance with the donors’ wishes for the benefit of the University. Pledges are recorded at their gross, undiscounted amounts.
(3) CASH AND CASH EQUIVALENTS Cash consists of petty cash funds and demand deposits held in the name of the University. The Board approves all banks or other institutions as depositories for University funds. GASB Statement No. 40, Deposit and Investment Risk Disclosures-an amendment of GASB Statement No. 3, defines custodial risk for deposits as “the risk that, in the event of a failure of a depository financial institution, a government will not be able to recover deposits or will not be able to recover securities which are in the possession of an outside party.”
Effective January 1, 2001, any depository of University funds must provide annual evidence of its continuing designation as a qualified public depository under the Security for Alabama Fund Enhancement Act (SAFE). The enactment of the SAFE program changed the way all Alabama public deposits are collateralized. In the past, the bank pledged collateral directly to each individual public entity. Under the mandatory SAFE program, each qualified public depository (QPD) is required to hold collateral for all its public deposits on a pooled basis in a custody account established for the State Treasurer as SAFE administrator. In the unlikely event a public entity should suffer a loss due to QPD insolvency or default, a claim form would be filed with the State Treasurer who would use the SAFE pool collateral or other means to reimburse the loss. As a result, the University believes its custodial risk related to cash is remote. In addition, the standard Federal Deposit Insurance Corporation (FDIC) is $250,000 per depositor, per insured bank, for each account ownership category.
Cash equivalents may consist of commercial paper, repurchase agreements, banker’s acceptances, and money market accounts purchased with maturities at date of acquisition of three months or less.
(4) INVESTMENTSThe Board is authorized to invest all available cash and is responsible for the management of the University’s investments. The endowment funds and the cash pool assets are invested in accordance with policies established by the Board. The Board has engaged a custodian and professional investment managers to manage the investment of the endowment funds while maintaining centralized management

Aub
urn U
nive
rsity
201
5
36
of the cash pool. The University monitors these investments through an on-going review of investment strategy, performance, valuation, risk management practices and operational activities.
Preservation of capital is regarded as the highest priority in the investing of the cash pool. It is assumed that all investments will be suitable to be held to maturity. The University’s investment portfolio is structured in such a manner to help ensure sufficient liquidity to pay obligations as they become due. The portfolio strives to provide a stable return consistent with investment policy. The Cash Pool Investment Policy authorizes investments in the following: money market accounts, repurchase and reverse repurchase agreements, banker’s acceptances, commercial paper, certificates of deposit, municipals, U.S. Treasury obligations, U.S. Agency securities and mortgage-backed securities.
Bond proceeds are invested in accordance with the underlying bond agreements. The University’s bond agreements generally permit bond proceeds and debt service funds to be invested in obligations in accordance with University policy in terms maturing on or before the date funds are expected to be required for expenditures or withdrawal. Certain bond indentures require the University to invest amounts held in certain construction funds, redemption funds and bond funds in federal securities or state, local and government series (SLGS) securities.
Diversification through asset allocation is utilized as a fundamental risk strategy for endowed funds. These strategic allocations represent a blend of assets best suited, over the long term, to achieve maximum returns without violating the risk parameters established by the Board. The Endowment Investment Policy, approved April 17, 2015, authorizes investment of the endowment portfolio to include the following: cash and cash equivalents; global fixed income; global equity securities; global private capital; absolute return/hedge funds; and real estate assets, collectively referred to as the endowment pool.
The Alabama Uniform Prudent Management of Institutional Funds Act (UPMIFA) was enacted by the Legislature of the State ofAlabama and signed into law effective January 1, 2009. Among its changes, UPMIFA prescribes new guidelines for expenditure of adonor-restricted endowment fund (in the absence of overriding, explicit donor stipulations). Its predecessor, the Uniform Management ofInstitutional Funds Act (UMIFA), focused on the prudent spending
of the net appreciation of the fund. UPMIFA instead, focuses on the entirety of a donor-restricted endowment fund, that is, both the original gift amount(s) and net appreciation. UPMIFA eliminates UMIFA’s historic dollar value-threshold, an amount below which an organization could not spend from the fund, in favor of a more robust set of guidelines about what constitutes prudent spending, explicitly requiring consideration of the duration and preservation of the fund.
The earnings distributions are appropriated for expenditure by the Board in a manner consistent with the standard of prudence prescribedby UPMIFA. In order to conform to the standards for prudent fiduciary management of investments, the Board has adopted a spending plan whose long term objective is to maintain the purchasing power of each endowment and provide a predictable and sustainable level of income to support current operations. In the policy approved on April 17, 2015, spending for a given year equals 80% of spending in the previous year, adjusted for inflation (Consumer Price Index (CPI) within a range of 0.0% and 6.0%), plus 20% of the long-term spending rate (4.0%) applied to the twelve month rolling average of the market values. The net appreciation on endowments and funds functioning as endowments available for authorization for expenditure by the Board amounted to $16,529,670 and $30,497,147 at September 30, 2015 and 2014, respectively, and are recorded as restricted expendable net position.
Investment RisksInvestments are subject to certain types of risks, including interest rate risk, custodial credit risk, credit quality risk, concentration of credit risk, and foreign currency risk. The following describes those risks:
• Interest Rate Risk – Interest rate or market risk is the potential for changes in the value of financial instruments due to interest rate changes in the market. Certain fixed maturity investments contain call provisions that could result in shorter maturity periods. As previously stated, it is the University’s intent to hold all investments in the Cash Pool until maturity. The Board understands that in order to achieve its objectives, investments can experience fluctuations in fair value. Both the Endowment Investment Policy and the Non-Endowment Cash Pool Investment Policy set forth allowable investments and allocations.

Aub
urn U
nive
rsity
201
5
37
The following segmented time distribution tables provide information as of September 30, 2015 and 2014, covering the fair value of investments by investment type and related maturity, with the exception of alternative investments, which are carried at cost:
Auburn University InvestmentsInvestment Maturities at Fair Value (in Years)
September 30, 2015
Type of Investments < 1 year 1-5 years 6-10 years > 10 years Total Fair Value
Fixed Maturity Certificates of Deposit $ - $ 676,922 $ - $ - $ 676,922 U.S. Treasury Obligations 21,345,204 76,639,713 5,457,723 - 103,442,640 U.S. Agency Securities 2,763,674 588,864,160 76,936,985 32,214,317 700,779,136 Mortgage Backed Securities - - 1,972,528 4,882,546 6,855,074 Municipals - 1,447,001 976,490 - 2,423,491
$ 24,108,878 $ 667,627,796 $ 85,343,726 $ 37,096,863 $ 814,177,263Domestic Equities 1,055,388Alternative Investments – at cost: Hedge Funds 48,827,879 Private Capital 15,533,227 Real Assets 16,812,936Real Estate 740,750Mutual Funds 99,799,131Other 679,358Money Market 70,844,695Total investments 1,068,470,627 Less cash equivalents held in cash pool (60,199,524) Operating and noncurrent investments $ 1,008,271,103
Auburn University InvestmentsInvestment Maturities at Fair Value (in Years)
September 30, 2014
Type of Investments < 1 year 1-5 years 6-10 years > 10 years Total Fair Value
Fixed Maturity
Certificates of Deposit $ - $ 701,842 $ - $ - $ 701,842 U.S. Treasury Obligations 29,440,652 86,260,207 11,751,838 - 127,452,697 U.S. Agency Securities 3,733,652 376,343,093 104,917,904 44,688,481 529,683,130 Mortgage Backed Securities - 1,719,046 7,300,256 14,220,481 23,239,783 Municipals - 402,568 1,017,969 - 1,420,537
$ 33,174,304 $ 465,426,756 $ 124,987,967 $ 58,908,962 $ 682,497,989Domestic Equities 1,319,513Alternative Investments – at cost:
Hedge Funds 49,289,826 Private Capital 14,188,576 Real Assets 22,256,369Real Estate 740,750Mutual Funds 106,083,788Other 4,214,711Money Market 146,603,997Total investments 1,027,195,519 Less cash equivalents held in cash pool (137,750,000) Operating and noncurrent investments $ 889,445,519

Aub
urn U
nive
rsity
201
5
38
prepayment options that are expected to fluctuate with interest rate changes. Generally, this variance presents itself in variable repayment amounts, uncertain early or extended payments.
Certain fixed maturity investments have call provisions that could result in shorter maturity periods. However, it is the intent that the University’s Cash Pool fixed maturity investments be held to maturity; therefore, the fixed maturity investments are classified in the above table as if they were held to maturity. As of September 30, 2015 and 2014, the University Cash Pool held $52,483,818 and $36,336,000, representing 4.9% and 3.5%, respectively, of total investments in continuously callable fixed maturity investments. The University investment policies do not restrict the purchase of mortgage-backed securities, asset-backed securities, or bonds with call provisions.
The University owns shares in eight mutual funds, one common trust fund, and four business trust funds. These funds are invested in global marketable securities, commodities and global debt securities. The University owns an interest in a corporation and limited partnership interests in several non-registered investment partnerships. The goal of the corporation and limited partnerships is to invest in readily marketable securities, privately held companies and properties within different industry sectors. At investment inception, the University enters into a separate subscription agreement with a capital commitment to each corporation or limited partnership.
• Custodial Credit Risk – GASB Statement No. 40 defines investment custodial risk as “the risk that, in the event of the failure of the counterparty to a transaction, a government will not be able to recover the value of investment or collateral securities that are in the possession of an outside party.” Although no formal policy has been adopted, the University requires its safekeeping agents to hold all securities in the University’s name for both the Cash Pool and the Endowment Pool. Certain limited partnership investments in Private Capital and Real Assets represent ownership interests that do not exist in physical or book-entry form. As a result, custodial credit risk is remote.
• Credit Quality Risk – GASB Statement No. 40 defines credit quality risk as “the risk that an issuer or other counterparty to an investment will not fulfill its obligations” as they become due. The University’s Non-Endowment Cash Pool Investment Policy stipulates that commercial paper be rated at least P1 by Moody’s or A1 by Standard & Poor’s or a comparable rating by another nationally recognized rating agency. Banker’s acceptances should hold a long term debt rating of at least AA or short term debt rating of AAA (or comparable ratings) as provided by one of the nationally recognized rating agencies.
The following table provides information as of September 30, 2015 and 2014, concerning credit quality risk:
Auburn University InvestmentsRatings of Fixed Maturities
Fair Value as a % of Fair value as a % of
Moody’s Rating Fair Value Total Fixed Maturity
Fair Value Fair ValueTotal Fixed Maturity
Fair Value
2015 2014
US Treasury $ 103,442,640 12.71% $ 127,452,697 18.68%Aaa 707,634,210 86.91% 552,922,913 81.01%Aa 2,423,491 0.30% 1,420,537 0.21%Not rated* 676,922 0.08% 701,842 0.10%
$ 814,177,263 100.00% $ 682,497,989 100.00%
*Certificates of deposit are included in the “Not rated” category.
• Concentration of Credit Risk – GASB Statement No. 40 defines concentration of credit risk as “the risk of loss attributed to the magnitude of a government’s investment in a single issuer.” The University Non-Endowment Cash Pool Investment Policy does not limit the aggregate amounts that can be invested in U.S. Treasury securities with the explicit guarantee of the U.S. Government or U.S. Agency securities that carry the implicit guarantee of the U.S. Government. As of September 30, 2015 and 2014, the University Cash Pool and the University Endowment Pool were in compliance with their respective policies.
The University Endowment Investment Policy provides for diversification by identifying asset allocation classes and ranges to provide reasonable assurance that no single security, or class of securities, will have a disproportionate impact on the performance of the total Endowment Pool.
• Foreign Currency Risk – GASB Statement No. 40 defines foreign currency risk as “the risk that changes in exchange rates will adversely affect the fair value of an investment or a deposit.” No formal University policy has been adopted addressing foreign currency risk. As of September 30, 2015 and 2014, the University held no investments in foreign currency.
Securities Lending Program As of September 30, 2015 and 2014, there was no participation in any securities lending program.
Interest Sensitive SecuritiesAs of September 30, 2015 and 2014, the University held $6,855,074 and $23,239,783, representing 0.6% and 2.3%, respectively, of its total investments in mortgage-backed securities. As of September 30, 2015 and 2014, the University held no investments in asset-backed securities. The mortgage-backed and asset-backed investments have embedded

Aub
urn U
nive
rsity
201
5
39
2015
Unfunded Commitment by Commitment Expiration
Type of Alternative Investment
Number of Commitments
Original Commitments
Capital Contributions
< 1 Year 1-5 years 6-10 years >10 years TotalUnfunded
Commitment
Hedge Funds 10 $ 50,250,000 $ 50,250,000 $ - $ - $ - $ - $ -Private Capital 18 41,550,000 27,391,955 97,960 1,129,979 5,576,565 7,353,541 14,158,045Real Assets 13 31,175,000 22,019,985 - 1,811,477 7,343,538 - 9,155,015
41 $ 122,975,000 $ 99,661,940 $ 97,960 $ 2,941,456 $ 12,920,103 $ 7,353,541 $ 23,313,060
2014
Unfunded Commitment by Commitment Expiration
Type of Alternative Investment
Number of Commitments
Original Commitments
Capital Contributions
< 1 Year 1-5 years 6-10 years >10 years TotalUnfunded
Commitment
Hedge Funds 10 $ 49,250,000 $ 49,250,000 $ - $ - $ - $ - $ -Private Capital 14 33,050,000 24,500,571 65,385 1,543,453 2,284,837 4,655,754 8,549,429Real Assets 13 42,975,000 36,512,574 - 2,190,378 2,744,988 1,527,060 6,462,426
37 $ 125,275,000 $ 110,263,145 $ 65,385 $ 3,733,831 $ 5,029,825 $ 6,182,814 $ 15,011,855
Unfunded commitments presented in the tables above are intended to reflect the time of expiration of the commitment, not the timing of future capital calls by the investment. The hedge funds are primarily invested in long/short-term equities, fixed income arbitrage, merger arbitrage and other event driven strategies through various investment managers, investment partnerships and offshore funds. The private capital fund commitments are investments in privately held companies in various industries, including alternative fuel technology. The real asset funds include investments in commercial real estate, residential real estate and oil and gas production.
As of September 30, 2015 and 2014, the University’s limited partnership investments are carried at cost. As required by GASB Statement No. 31, no adjustment was recorded to recognize net unrealized gains and losses. Limited partnership investments are made in accordance with the University’s investment policy, which approves the allocation of funds to various assets classes (i.e., global equity, private capital, hedge funds, real assets, global fixed income and cash) in order to ensure the proper
level of diversification within the endowment pool. The limited partnerships (private equity, hedge funds, and real assets) enhance diversification and provide reductions in overall portfolio volatility.
On September 30, 2015 and 2014, the University was not a party in any swap or other derivative contracts.
The table entitled, “Auburn University Investments, Investment Maturities at Fair Value (in Years)”, includes funds held for pending capital expenditures at September 30, 2015, as follows: $3,751,967, 2011 General Fee Bond proceeds, and $26,810,876, Deferred Maintenance Building Fund. The General Liability Account holds investments of $5,749,582.
At September 30, 2014, funds held for pending capital expenditures were as follows: $4,392,146, 2006 General Fee Bond proceeds; $5,287,720, 2011 General Fee Bond proceeds; $300,000, 2012A General Fee Bond proceeds; and $28,023,166, Deferred Maintenance Building Fund. The General Liability Account held investments of $5,735,301.
The University has entered into separate subscription agreements with a capital commitment to each alternative investment that expire periodically
in the future. The following information pertains to alternative investment capital commitments at September 30, 2015 and 2014:

Aub
urn U
nive
rsity
201
5
40
to uncertainty and, therefore, may differ from the value that would have been used had a ready market for the investments existed and such difference could be material. Limited partnership investments are made in accordance with AUF’s investment policy that approves the allocation of funds to various assets classes (i.e., global equity, private capital, hedge funds, real assets, global fixed income, and cash) in order to ensure the proper level of diversification within the endowment pool. Investments in limited partnerships (private equity, hedge funds, and real assets) are designed to enhance diversification and provide reductions in overall portfolio volatility. These fair values are estimated by the general partner of each limited partnership using various valuation techniques. The fair values of these investments at September 30, 2015 and 2014, were $196,410,031 and $197,069,779, respectively.
(5) FUNDS HELD IN TRUST In addition to permanently restricted endowments carried on the University’s financial statements, the University is the beneficiary of income earned on a number of AUF endowments. The cost of these funds was $327,177,712 and $298,979,591 and the market value was $382,439,328 and $378,993,254 at September 30, 2015 and 2014, respectively. The portion of endowment income received by the University from these funds was $11,939,752 and $10,607,752 for the fiscal years ended September 30, 2015 and 2014, respectively.
Endowment earnings are distributed annually in March, based on the AUF endowment distribution spending rate. These amounts are reported as investment income on the Statement of Revenues, Expenses and Changes in Net Position.
In addition, the University has been named as a beneficiary of a foundation with investments having a cost of $2,582,437 and $2,409,462 and a market value of $3,400,476 and $3,555,272 at September 30, 2015 and 2014, respectively.
The University is the beneficiary of the income earned on two additional trusts. The cost of investments held by these trusts was $753,000 as of September 30, 2015 and 2014. The income received from the two trusts was $70,542 and $69,373 for the fiscal years ended September 30, 2015 and 2014, respectively.
AUF owns shares in five mutual funds, four business trust funds, one common trust fund and two family limited partnerships. These funds are invested in global marketable securities, commodities and global debt securities. AUF owns an interest in a corporation and limited partnership interests of which the goal is to invest in readily marketable securities, privately held companies and properties within different industry sectors. At investment inception, AUF enters into a separate subscription agreement with a capital commitment to each corporation or limited partnership.
As of September 30, 2015, AUF had entered into subscription agreements with one corporate and forty-five limited partnership investments. The aggregate amount of capital committed to these investments is $209,962,200 of which capital contributions of $172,037,511 have been invested. A cumulative net unrealized gain of $43,388,660 has been recorded on these investments. Of these forty-five commitments, twelve subscriptions relate to hedge funds, twenty subscriptions relate to private equity funds, and thirteen subscriptions relate to real estate asset funds. The hedge funds are primarily invested in long/short equities, fixed-income arbitrage, merger arbitrage and other event-driven strategies through various investment managers, investment partnerships and offshore funds. The private equity fund commitments are for investments in privately held companies in various industries, including alternative fuel technology. The real assets funds include investments in commercial real estate, residential real estate, and oil and gas production.
Investment income, realized gains and losses, unrealized gains and losses, and changes in values of split-interest agreements are reported on AUF’s Consolidated Statements of Activities and Changes in Net Assets net of estimated investment expenses of $4,384,000 and $3,993,000 for the fiscal years ended September 30, 2015 and 2014, respectively.
AUF carries its limited partnership investments at fair value. This differs from how the University carries these investments, which is at cost, in accordance with GASB requirements. AUF believes that the carrying amount of its limited partnership investments is a reasonable estimate of fair value as of September 30, 2015. Because limited partnership investments are not readily marketable, the estimated value is subject
AUF holds endowments and distributes earnings from those endowments to the University. AUF investments at September 30, 2015 and 2014, include the following:
2015 2014
Fair Value Cost Fair Value Cost
Cash and pooled investments $ 4,446,913 $ 4,446,913 $ 6,678,108 $ 6,678,108Government bonds, notes and other securities 33,028,474 30,759,053 29,375,822 25,933,035Corporate stocks 1,178,973 278,417 1,887,652 1,006,000Mutual funds, business trust funds and common trust funds 187,386,931 176,220,120 183,034,720 152,982,542Hedge funds 124,792,151 89,697,649 122,277,034 83,476,191Private equity funds 31,951,732 27,755,905 34,106,675 26,055,081Real asset investment funds 38,731,689 34,662,675 40,686,070 37,934,948 Total investments $ 421,516,863 $ 363,820,732 $ 418,046,081 $ 334,065,905

Aub
urn U
nive
rsity
201
5
41
(6) ACCOUNTS RECEIVABLEAccounts receivable and the allowances for doubtful accounts at September 30, 2015 and 2014, are summarized as follows:
2015 2014NONSTUDENT ACCOUNTS RECEIVABLEFederal, state & local government, and other restricted expendable $ 28,262,990 $ 23,135,440 Less allowance for doubtful accounts (1,303,687) (2,218,796)Pledged receivables 534,056 575,934General 14,707,046 16,049,290 Less allowance for doubtful accounts (13,257,468) (13,764,142)Auxiliary 14,458,432 11,190,244Capital gifts and grants 1,861,835 2,327,086 Total nonstudent accounts receivable $ 45,263,204 $ 37,295,056
2015 2014STUDENT ACCOUNTS RECEIVABLEUnrestricted general $ 39,903,223 $ 35,196,598 Less allowance for doubtful accounts (1,179,619) (873,161)Unrestricted auxiliary 2,600,817 3,079,458 Less allowance for doubtful accounts (57,377) (56,233) Total student accounts receivable $ 41,267,044 $ 37,346,662

Aub
urn U
nive
rsity
201
5
42
(7) CAPITAL ASSETS Capital assets at September 30, 2015 and 2014, are summarized as follows (dollars in thousands):
September 30, 2014 Additions/Transfers Deletions/Transfers September 30, 2015
Capital assets not being depreciated Land $ 18,185 $ 1,275 $ - $ 19,460 Art & collectibles 9,938 725 - 10,663 Construction in progress 18,716 69,531 (55,257) 32,990 Livestock 2,245 941 (591) 2,595 Total capital assets not being depreciated 49,084 72,472 (55,848) 65,708
Capital assets being depreciated Land improvements 109,634 2,738 - 112,372 Buildings 1,632,084 37,462 (400) 1,669,146 Equipment 238,762 15,261 (31,967) 222,056 Infrastructure 204,481 6,277 - 210,758 Library books 176,127 7,516 (1,373) 182,270 Software system implementation 14,448 348 - 14,796 Total capital assets being depreciated 2,375,536 69,602 (33,740) 2,411,398
Less accumulated depreciation for Land improvements 45,213 6,797 - 52,010 Buildings 434,573 37,378 (396) 471,555 Equipment 166,980 15,564 (30,093) 152,451 Infrastructure 71,113 7,660 - 78,773 Library books 145,821 5,783 (1,372) 150,232 Software system implementation 10,776 1,115 - 11,891 Total accumulated depreciation 874,476 74,297 (31,861) 916,912 Total capital assets being depreciated, net 1,501,060 (4,695) (1,879) 1,494,486
Capital assets, net $ 1,550,144 $ 67,777 $ (57,727) $ 1,560,194

Aub
urn U
nive
rsity
201
5
43
Capital assets at September 30, 2014 and 2013, are summarized as follows (dollars in thousands):
September 30, 2013 Additions/Transfers Deletions/Transfers September 30, 2014
Capital assets not being depreciated Land $ 18,243 $ 280 $ (338) $ 18,185 Art & collectibles 9,334 656 (52) 9,938 Construction in progress 84,631 79,923 (145,838) 18,716 Livestock 1,937 443 (135) 2,245 Total capital assets not being depreciated 114,145 81,302 (146,363) 49,084
Capital assets being depreciated Land improvements 107,095 2,539 - 109,634 Buildings 1,515,023 117,061 - 1,632,084 Equipment 240,506 14,603 (16,347) 238,762 Infrastructure 192,527 11,954 - 204,481 Library books 169,646 7,056 (575) 176,127 Software system implementation 14,448 - - 14,448 Total capital assets being depreciated 2,239,245 153,213 (16,922) 2,375,536
Less accumulated depreciation for Land improvements 38,234 6,979 - 45,213 Buildings 399,892 34,681 - 434,573 Equipment 166,739 15,138 (14,897) 166,980 Infrastructure 63,949 7,164 - 71,113 Library books 140,006 6,389 (574) 145,821 Software system implementation 9,331 1,445 - 10,776 Total accumulated depreciation 818,151 71,796 (15,471) 874,476 Total capital assets being depreciated, net 1,421,094 81,417 (1,451) 1,501,060
Capital assets, net $ 1,535,239 $ 162,719 $ (147,814) $ 1,550,144
During the fiscal years ended September 30, 2015 and 2014, approximately $0 and $17,000, respectively, was received from the State of Alabama to fund construction. These revenues are classified as capital appropriations on the Statements of Revenues, Expenses and Changes in Net Position.
(8) DEFERRED OUTFLOWS OF RESOURCESDeferred outflows of resources are a consumption of net assets that is applicable to a future reporting period. In 2010, 2012, 2014 and 2015, the University defeased certain outstanding bonds. These refundings resulted in a loss (the difference between the acquisition price of the new debt and the net carrying amount of the old debt). In accordance
with GASB Statements No. 63 and No. 65, this loss is presented as a deferred outflow of resources that is amortized over the life of the old or new bonds, whichever is shorter. The University is amortizing each of the deferred losses presented below over the life of the defeased bonds. Additionally, in accordance with GASB Statement No. 68, which the University adopted in fiscal year 2015, the University’s proportionate share of the net difference between projected and actual earnings on pension plan investments is presented as a deferred outflow of resources. The components of deferred outflows of resources are summarized below.
September 30, 2015 September 30, 2014Loss on refunding 2009 General Fee refunding $ 2,317,000 $ 2,775,220 2012A General Fee refunding 5,165,323 6,150,409 2012B General Fee refunding 288,300 331,212 2014A General Fee refunding 4,694,370 5,185,344 2015A General Fee refunding 10,287,870 - 2015B General Fee refunding 4,200,934 -Pension 53,229,926 - Total deferred outflows of resources $ 80,183,723 $ 14,442,185

Aub
urn U
nive
rsity
201
5
44
(9) LONG-TERM DEBTBonds, notes and lease obligations are collateralized by certain real estate, equipment and pledged revenues (See Note 10).
Balance at Principal Balance atBonds and notes payable September 30, 2014 New Debt Repayment September 30, 2015
1978 Auburn University at Montgomery Dormitory Revenue Bonds, $3,279,000 face value, 3.0%, due annually through 2018, a reserve of $146,563 and a $138,501 contingency fund. $ 665,000 $ - $ (125,000) $ 540,000
2001A Athletic Revenue Bonds,$24,412,607 face value, 2.125% to5.49%, due annually through 2021. 11,671,442 - (1,993,361) 9,678,081
2006A General Fee Revenue Bonds,$60,000,000 face value, 3.5% to 5.0%,due annually through 2037. 13,450,000 - (4,960,000) 8,490,000
2007A General Fee Revenue Bonds, $162,530,000 face value, 3.6% to 5.0%,due annually from 2015 through 2022and annually from 2028 through 2038. 129,445,000 - (117,180,000) 12,265,000
2008 General Fee Revenue Bonds,$92,500,000 face value, 3.0% to 5.0%,due annually through 2038. 83,345,000 - (39,750,000) 43,595,000
2009 General Fee Revenue Bonds,$79,500,000 face value, 2.0% to 5.0%,due annually through 2026. 69,970,000 - (4,140,000) 65,830,000
2011A General Fee Revenue Bonds,$226,035,000 face value, 4.0% to 5.0%,due annually through 2041. 226,035,000 - (4,255,000) 221,780,000
2012A General Fee Revenue Bonds,$120,135,000 face value, 2.0% to 5.0%,due annually through 2042. 110,850,000 - (6,465,000) 104,385,000
2012B General Fee Revenue Bonds,$3,505,000 face value, 2.9%, dueannually through 2024. 3,385,000 - (60,000) 3,325,000
2014A General Fee Revenue Bonds,$66,415,000 face value, 2.0% to 5.0%,due annually through 2035. 66,415,000 - (555,000) 65,860,000
2015A General Fee Revenue Bonds,$116,190,000 face value, 2.0% to 5.0%,due annually from 2016 through 2038. - 116,190,000 - 116,190,000
2015B General Fee Revenue Bonds,$38,700,000 face value, 2.0% to 5.0%,due annually from 2016 through 2035. - 38,700,000 - 38,700,000
Total bonds payable 715,231,442 154,890,000 (179,483,361) 690,638,081 Plus unamortized bond premium 29,572,341 16,350,220 (6,467,222) 39,455,339
744,803,783 $ 171,240,220 $ (185,950,583) 730,093,420
Less: current portion Bonds payable (24,663,361) (25,403,719) Unamortized bond premium (3,951,840) (4,849,785)
Total noncurrent bonds and notes payable $ 716,188,582 $ 699,839,916

Aub
urn U
nive
rsity
201
5
45
Balance at Principal Balance atBonds and notes payable September 30, 2013 New Debt Repayment September 30, 2014
1978 Auburn University at Montgomery Dormitory Revenue Bonds, $3,279,000 face value, 3.0%, due annually through 2018, a reserve of $146,563 and a $138,501 contingency fund. $ 790,000 $ - $ (125,000) $ 665,000
2001A Athletic Revenue Bonds,$24,412,607 face value, 2.125% to5.49%, due annually through 2021. 13,788,791 - (2,117,349) 11,671,442
2004 General Fee Revenue Bonds, $76,875,000 face value, 3.0% to 5.25%,due annually through 2014. 1,800,000 - (1,800,000) -
2004A Athletic Revenue Bonds, $24,860,000 face value, 2.0% to 5.0%, due annually through 2014. 670,000 - (670,000) -
2006A General Fee Revenue Bonds,$60,000,000 face value, 3.5% to 5.0%,due annually through 2037. 53,435,000 - (39,985,000) 13,450,000
2007A General Fee Revenue Bonds, $162,530,000 face value, 3.6% to 5.0%,due annually from 2015 through 2022and annually from 2028 through 2038. 159,170,000 - (29,725,000) 129,445,000
2007B General Fee Revenue Bonds,$14,465,000 face value, 4.625% to5.125%, due annually through 2014. 3,175,000 - (3,175,000) -
2008 General Fee Revenue Bonds,$92,500,000 face value, 3.0% to 5.0%,due annually through 2038. 85,310,000 - (1,965,000) 83,345,000
2009 General Fee Revenue Bonds,$79,500,000 face value, 2.0% to 5.0%,due annually through 2026. 72,790,000 - (2,820,000) 69,970,000
2011A General Fee Revenue Bonds,$226,035,000 face value, 4.0% to 5.0%,due annually from 2015 through 2041. 226,035,000 - - 226,035,000
2012A General Fee Revenue Bonds,$120,135,000 face value, 2.0% to 5.0%,due annually from through 2042. 115,410,000 - (4,560,000) 110,850,000
2012B General Fee Revenue Bonds,$3,505,000 face value, 2.9%, dueannually through 2024. 3,445,000 - (60,000) 3,385,000
2014A General Fee Revenue Bonds,$66,415,000 face value, 2.0% to 5.0%,due annually from 2015 through 2035. - 66,415,000 - 66,415,000
Total bonds payable 735,818,791 66,415,000 (87,002,349) 715,231,442 Plus unamortized bond premium 26,124,255 8,931,556 (5,483,470) 29,572,341
Less unamortized bond discount (8,169) - 8,169 - 761,934,877 $ 75,346,556 $ (92,477,650) 744,803,783
Less: current portion Bonds payable (19,302,349) (24,663,361) Unamortized bond premium (3,385,117) (3,951,840) Unamortized bond discount 8,169 -
Total noncurrent bonds and notes payable $ 739,255,580 $ 716,188,582

Aub
urn U
nive
rsity
201
5
46
Future Debt ServiceFuture debt service payments for each of the five fiscal years subsequent to September 30, 2015, and thereafter, are as follows:
Bonds PayableYear Ending
September 30 Principal Interest
2016 $ 25,403,719 $ 33,440,8112017 22,398,501 32,957,4082018 23,612,554 32,154,6002019 24,159,123 31,320,7962020 24,972,709 30,364,280
2021-2025 136,526,475 124,265,7452026-2030 136,185,000 88,814,7352031-2035 155,960,000 55,090,1622036-2040 123,385,000 19,948,3812041-2044 18,035,000 988,000
Total future debt service $ 690,638,081 $ 449,344,918
Capital Lease ObligationsAUM acquired a building under a capital lease agreement which provides for the University to purchase the building over a period of 25 years.
Balance at New Principal Balance at
Lease Obligations September 30, 2014 Lease Obligations Repayment September 30, 2015
Building $ 200,000 $ - $ (200,000) $ - Total lease obligations $ 200,000 $ - $ (200,000) $ -
The University has entered into various operating leases for equipment. It is expected that, in the normal course of business, such leases will continue to be required. Net expenditures for rentals under operating leases for the years ended September 30, 2015 and 2014, amounted to approximately $3.8 million and $4.1 million, respectively.
On March 18, 2015, the University issued the 2015A General Fee bonds with a par value of $116,190,000 and interest rates ranging from 2.0% to 5.0% to advance refund $117,095,000 of outstanding 2006A General Fee and 2007A General Fee Bonds with interest rates ranging from 4.25% to 5.0%. The portion of the net proceeds of this new bond issue to be used for refunding was deposited in an irrevocable trust with an escrow agent and was used to purchase U.S. Government securities which will provide sufficient funds to pay all future debt service payments on the previously outstanding bonds. As a result, the previously outstanding bonds are considered to be defeased and the liability for those bonds has been removed from the University’s financial statements. This refunding resulted in the University recognizing a deferred outflow of resources of $11,126,551 for the difference between the acquisition price of the new debt and the net carrying amount of the old debt. The refunding decreases the University’s total debt service payments over the next 23 years by $14,782,269 and resulted in an economic gain (the difference between the present value of the debt service payments on the old and new bonds) for the University of $10,918,145.
On September 10, 2015, the University issued the 2015B General Fee bonds with a par value of $38,700,000 and interest rates ranging from 2.0% to 5.0% to advance refund $37,725,000 of outstanding 2008 General
Fee Bonds with an interest rate of 5.0%. The portion of the net proceeds of this new bond issue to be used for refunding was deposited in an irrevocable trust with an escrow agent and was used to purchase U.S. Government securities which will provide sufficient funds to pay all future debt service payments on the previously outstanding bonds. As a result, the previously outstanding bonds are considered to be defeased and the liability for those bonds has been removed from the University’s financial statements. This refunding resulted in the University recognizing a deferred outflow of resources of $4,539,080 for the difference between the acquisition price of the new debt and the net carrying amount of the old debt. The refunding decreases the University’s total debt service payments over the next 20 years by $4,605,961 and resulted in an economic gain (the difference between the present value of the debt service payments on the old and new bonds) for the University of $3,394,409.
These losses on refunding, combined with previous losses, have been classified as deferred outflows of resources on the Statements of Net Position. The University recognized $3,154,019 and $2,145,607 of interest and cost associated with the amortization of these deferred outflows in 2015 and 2014, respectively.

Aub
urn U
nive
rsity
201
5
47
2015 2014
Student fees collected $ 445,535,019 $ 415,790,651Less fees pledged for specific purposes: Athletic fees ($96 per student per semester) (4,799,903) (4,470,048) Transit fees ($145/$141 per semester) (7,007,982) (6,565,383) Student activities fees ($15 per student per semester) (747,404) (878,139) Total general fees pledged $ 432,979,730 $ 403,877,081
The pledge of Athletic program revenues was added to the General Fee Trust Indenture contemporaneously with the issuance of the Series 2008 Bonds and collateralizes, on a parity basis, all bonds now or hereafter issued under the General Fee Revenue Indenture. Athletic
program revenues pledged to the 2008 General Fee Revenue Bonds are subordinate to the Athletic program revenues previously pledged to the Athletic Bonds as described below.
The Series 2011A Bonds expands the definition of pledged revenues. “General Fees” pledged to secure the Series 2011A Bonds and all other Parity Bonds now or hereafter outstanding under the General Fee Revenue Indenture will include the general fees levied against the University’s students at both the main campus and AUM. “Housing Revenues” pledged to secure the Series 2011A Bonds and all other Parity Bonds now or hereafter outstanding under the General Fee Revenue Indenture will include the University’s
housing and dining revenues from the operation of housing and dining facilities on both the main campus and AUM.
The pledge of housing and dining revenues under the General Fee Revenue Indenture is subordinate in all respects to the University’s prior pledge of certain dormitory revenues at AUM to secure payment of the 1978 Dormitory Revenue Bonds.
AUM housing and dining revenue pledged for 2015 and 2014 subordinate to prior pledges of such revenues as defined by the Series 2011A General Fee Revenue Trust Indenture is as follows:
2015 2014
AUM housing revenues Room rental $ 5,071,716 $ 4,712,317 Other income 329,796 369,670 Total housing 5,401,512 5,081,987AUM dining revenue 2,048,293 1,798,862 Total AUM housing and dining revenues pledged $ 7,449,805 $ 6,880,849
Pledged revenue for 2015 and 2014 as defined by the Series 2001A and 2004 Athletic A & B Revenue Trust Indentures is as follows:
2015 2014
Jordan-Hare and other revenues: Television and broadcast revenues $ 24,945,871 $ 7,909,714 Conference and NCAA distributions 16,493,869 23,410,336 Sales and services revenues 27,506,023 34,164,211 Student fees 4,799,903 4,470,048 Royalties, advertisements and sponsorships 6,062,826 5,275,554 Other income 8,545,966 2,873,051 Total athletic revenues pledged $ 88,354,458 $ 78,102,914
The Series 2004 Athletic Revenue Bonds and Series 2001A Athletic Revenue Bonds are collateralized by a first-priority pledge of the Athletic program revenues that is senior to, and has priority in all respects over, the subordinate pledge of the Athletic program revenues that was added to the General Fee Trust Indenture concurrently with the issuance of the Series 2008 Bonds.
The pledge of housing and dining revenues was added to the General Fee Trust Indenture, contemporaneously with the issuance of the University’s General Fee Revenue Bonds, Series 2007A and 2007B (taxable) and collateralizes, on a parity basis now or hereafter issued under the General Fee Revenue Indenture.
(10) PLEDGED REVENUESPledged revenue for 2015 and 2014 as defined by the Series 2004, 2006A, 2007A, 2007B, 2008, 2009, 2011A, 2012A, 2012B, 2014A, 2015A and 2015B General Fee Revenue Trust Indentures is as follows:

Aub
urn U
nive
rsity
201
5
48
2015 2014Revenues: Room rental $ 1,241,852 $ 1,074,631 Other income 54,506 70,611Total revenues 1,296,358 1,145,242
Expenses and transfers: Personnel costs 306,897 392,743 Operating expenses 345,133 578,262 Transfers 146,787 599,697Total expenses and transfers 798,817 1,570,702
Surplus (deficit) of revenues over expenses and transfers 497,541 (425,460)AUM student housing net (deficit) surplus at beginning of year (327,522) 97,938AUM student housing net surplus (deficit) at end of year $ 170,019 $ (327,522)
The AUM dormitory occupancy rate for Fall semester 2015 and Fall semester 2014 was 99.2% and 97.7%, respectively (unaudited).
The following summary shows the pledged revenues and related expenses and transfers from operations of the West Dormitories of AUM for the years ended September 30, 2015 and 2014, as defined by the 1978 Auburn University at Montgomery Trust Indenture:
(11) RETIREMENT PROGRAMSThe employees of the University are participants in three benefit plans; a 401(a) defined benefit plan, a 403(b) defined contribution plan, and a 457(b) deferred compensation plan as follows:
A. Teachers' Retirement System of Alabama The University contributes to the Teachers’ Retirement System of Alabama (TRS), a cost sharing, multiple-employer, public employee retirement system for the various state-supported educational agencies and institutions. This plan is administered by the Retirement Systems of Alabama.
Substantially all non-student employees are members of TRS. Membership is mandatory for eligible employees. During the 2012 regular session of the Alabama Legislature, Act 2012-377 created a new defined benefit plan tier for employees hired on or after January 1, 2013, with no previous creditable service (“Tier 2”). Employees hired or with creditable service prior to that date are “Tier 1” participants.
Benefits vest after ten years of creditable service. Vested Tier 1 employees may retire with full benefits at age 60 with ten years of service or at any age with 25 years of service. Retirement benefits for Tier 1 employees are calculated by the formula method by which retirees are allowed 2.0125% of their final salary (average of the highest three of the last ten years) for each year of service. Vested Tier 2 employees may retire with full benefits at age 62 with 10 years of service. For Tier 2 employees, the percentage is 1.65% of their final salary (average of the highest five of the last ten years) for each year of service. Disability retirement benefits are calculated in the same manner for both Tier 1 and Tier 2 employees. Pre-retirement death benefits are provided to plan members.
TRS was established September 15, 1939, under the provisions of Act Number 419, of the Acts of Alabama 1939, for the purpose of providing retirement allowances and other specified benefits for qualified persons employed by state-supported educational institutions. The
responsibility for general administration and operation of TRS is vested in the Board of Control (currently 15 trustees). Benefit provisions are established by the Code of Alabama 1975, Sections 16-25-1 through 16-25-113, as amended, and Sections 36-27B-1 through 36-27B-6, as amended.
The Retirement Systems of Alabama issues a publicly available financial report that includes financial statements and required supplementary information for TRS. The TRS financial statements are prepared using the economic resources measurement focus and accrual basis of accounting. Contributions are recognized as revenue when earned, pursuant to plan requirements. Benefits and refunds are recognized when due and payable in accordance with the terms of the plan. Expenses are recognized when the corresponding liability is incurred, regardless of when the payment is made. Investments are reported at fair value. Financial statements are prepared in accordance with requirements of the GASB. Under these requirements, the TRS plan is considered a component unit of the State of Alabama and is included in the State’s Comprehensive Annual Financial Report. That report may be obtained by writing to the Retirement Systems of Alabama, 135 South Union Street, Montgomery, Alabama 36130-2150 or at www.rsa-al.gov.
Funding PolicyTier 1 employees are required by statute to contribute 7.5% of their salary to TRS. Tier 2 employees contribute 6.0% of their salary. The University is required to contribute the remaining amounts necessary to fund the actuarially determined contributions to ensure sufficient assets will be available to pay benefits when due. Each year TRS recommends to the Alabama State Legislature the contribution rate for the following fiscal year, with the Alabama State Legislature setting this rate in the annual appropriations bill. The percentages of the contributions and the amount of contributions made by the University and the University’s employees, for both Tier 1 and Tier 2 employees, respectively, equal the required contributions for each year as follows:

Aub
urn U
nive
rsity
201
5
49
Deferred Outflows of Resources
Deferred Inflows of Resources
Differences between expected and actual experience $ - $ -
Changes of assumptions - -
Net difference between projected and actual earnings on pension plan investments - 39,219,000
Changes in proportion and differences between Employer contributions and proportionate share of contributions 6,543,000 -
Employer contributions subsequent to the measurement date 42,535,000 -
Total $ 49,078,000 $ 39,219,000
At September 30, 2015, the University reported a liability of $523,080,000 for its proportionate share of the collective net pension liability. The collective net pension liability was measured as of September 30, 2014, and the total pension liability used to calculate the net pension liability was determined by an actuarial valuation as of September 30, 2013. The University’s proportion of the collective net pension liability was based on employers’ shares of contributions to the pension plan relative to the total employer contributions of all
$42,535,000 reported as deferred outflows of resources related to pensions resulting from University contributions subsequent to the measurement date will be recognized as a reduction of the net pension liability in the year ended September 30, 2016.
participating TRS employers. At September 30, 2014, the University’s proportion was 5.757899%, which was an increase of 0.081384% from its proportion measured as of September 30, 2013.
For the year ended September 30, 2015, the University recognized pension expense of $41,089,000. At September 30, 2015, the University reported deferred outflows of resources and deferred inflows of resources related to pension from the following sources:
Other amounts reported as deferred outflows of resources and deferred inflows of resources related to pensions will be recognized in compensation and benefits expense as follows:
Fiscal year ended September 30, 2015 2014 2013
Total percentage of covered payroll 19.21%/17.05% 19.21%/17.08% 17.58%/15.44%Contributions: Percentage contributed by the employer 11.71%/11.05% 11.71%/11.08% 10.08%/9.44% Percentage contributed by the employees 7.50%/6.00% 7.50%/6.00% 7.50%/6.00% Contributed by the employer $ 43,894,444 $ 42,684,405 $ 35,742,024 Contributed by the employees 27,572,040 27,016,081 26,543,214Total contributions $ 71,466,484 $ 69,700,486 $ 62,285,238
Year Ending September 30:
2016 $ (8,283,000) 2017 (8,283,000) 2018 (8,283,000) 2019 (8,283,000) 2020 456,000
Thereafter -
Actuarial AssumptionsThe total pension liability was determined by an actuarial valuation as of September 30, 2013, using the following actuarial assumptions, applied to all periods included in the measurement:
Actuarial Assumptions
Inflation 3.00%Investment rate of return* 8.00%Projected salary increases 3.50-8.25%
*Net of pension plan investment expense

Aub
urn U
nive
rsity
201
5
50
1.00% Decrease (7.00%)
Current Discount Rate (8.00%)
1.00% Increase (9.00%)
Employers’ proportionate share of the collective net pension liability $ 712,597,000 $ 523,080,000 $ 362,451,000
B. Employees’ Retirement System of AlabamaFederally appointed employees of the Alabama Cooperative Extension System are covered by the Employees’ Retirement System of Alabama (ERS). This program is a multi-employer defined benefit plan. Benefits of the ERS plan are similar to those of the TRS plan with the exception that they are based on half of the employee’s average final salary. Upon retirement, these employees will also receive pension benefits under the Federal Civil Service Retirement System. ERS is part of the Retirement Systems of Alabama.
ERS was established October 1, 1945, under the provisions of Act 515 of the Legislature of 1945 for the purpose of providing retirement allowances and other specified benefits for state employees. The responsibility for the general administration and operation of ERS is vested in its Board of Control (currently 13 trustees). The ERS financial statements are prepared using the economic resources measurement focus and accrual basis of accounting. Contributions are recognized as revenue when earned, pursuant to
plan requirements. Benefits and refunds are recognized when due and payable in accordance with the terms of the plan. Expenses are recognized when the corresponding liability is incurred, regardless of when the payment is made. Investments are reported at fair value. Financial statements are prepared in accordance with requirements of the GASB. Under these requirements, the ERS plan is considered a component unit of the State of Alabama and is included in the State’s Comprehensive Annual Financial Report. The Plan issues a publically available report that can be obtained at www.rsa-al.gov.
Funding PolicyTier 1 employees are required by statute to contribute 3.75% of their salary to the ERS. Tier 2 employees contribute 3.00% of their salary. The University is required to contribute the remaining amounts necessary to fund the actuarially determined contributions to ensure sufficient assets will be available to pay benefits when due. Each year the ERS recommends to the Legislature the contribution rate
Sensitivity of the System’s proportionate share of the net pension liability to changes in the discount rateThe following table presents the University’s proportionate share of the net pension liability calculated using the discount rate of 8.00% as well as what the University’s proportionate share of the net pension liability would be if it were calculated using a discount rate that is one percentage point lower (7.00%) or one percentage point higher (9.00%) than the current rate:
The long-term expected rate of return on pension plan investments was determined using a log-normal distribution analysis in which best-estimate ranges of expected future real rates of return (expected returns, net of pension plan investment expense and inflation) are developed for each major asset class. These ranges are combined to produce the long-term expected rate of return by weighting the expected future real rates of return by the target asset allocation percentage and by adding expected inflation. The target asset allocation and best estimate of geometric real rates of return for each major asset class are as follows:
Target Allocation
Long-Term Expected Rate of Return*
Fixed Income 25.00% 5.00%U.S. Large Stocks 34.00% 9.00%U.S. Mid Stocks 8.00% 12.00%U.S. Small Stocks 3.00% 15.00%International Developed Market Stocks 15.00% 11.00%International Emerging Market Stocks 3.00% 16.00%Real Estate 10.00% 7.50%Cash 2.00% 1.50% Total 100.00%
*Includes assumed rate of inflation of 2.50%
The actuarial assumptions used in the actuarial valuation as of September 30, 2013, were based on the results of an investigation of economic and demographic experience for the TRS based upon participant data as of September 30, 2010. The Board of Control accepted and approved these changes on January 27, 2012, which became effective at the beginning of fiscal year 2012.
Mortality rates for TRS were based on the RP-2000 Combined Mortality Table for Males or Females, as appropriate, with adjustments for morality improvements based on Scale AA projected to 2015 and set back one year for females.
Discount RateThe discount rate used to measure the total pension liability was 8.00%. The projection of cash flows used to determine the discount rate assumed that the plan member contributions will be made at the current contribution rate and that the employer contributions will be made at rates equal to the difference between actuarially determined contribution rates and the member rate. Based on those assumptions, components of the pension plan’s fiduciary net position were projected to be available to make all projected future benefit payments of current plan members. Therefore, the long-term expected rate of return on pension plan investments was applied to all periods of projected benefit payments to determine the total pension liability.
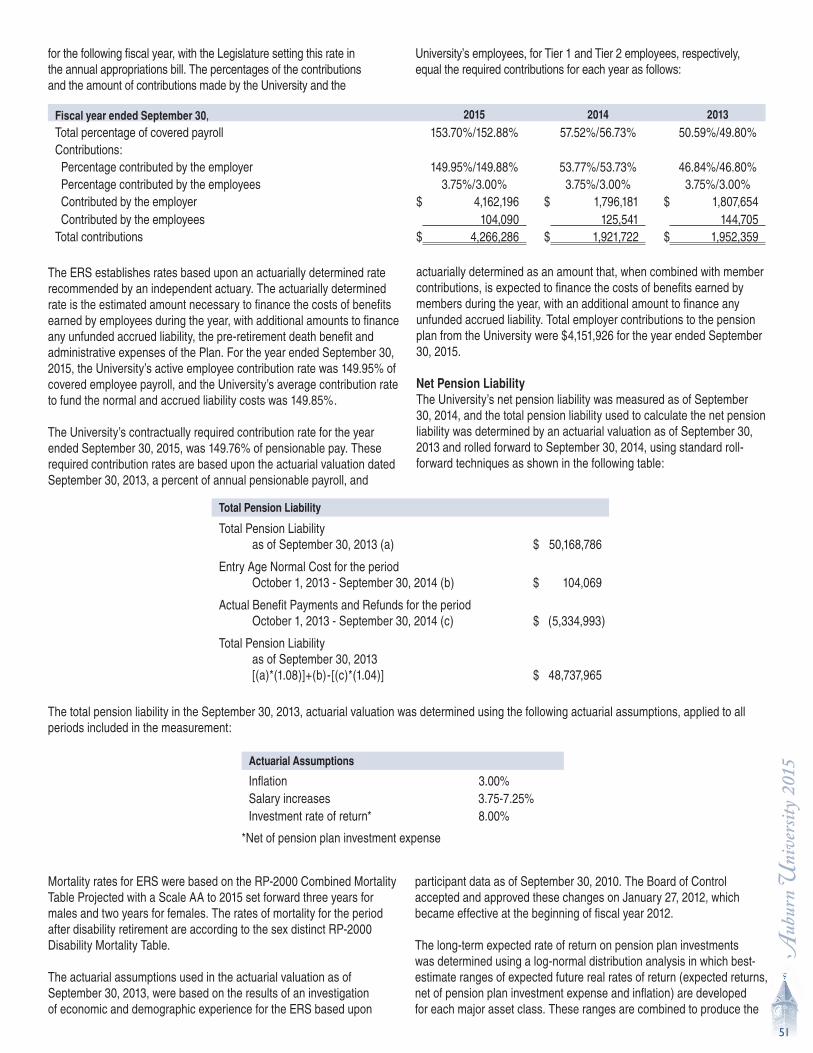
Aub
urn U
nive
rsity
201
5
51
for the following fiscal year, with the Legislature setting this rate in the annual appropriations bill. The percentages of the contributions and the amount of contributions made by the University and the
University’s employees, for Tier 1 and Tier 2 employees, respectively, equal the required contributions for each year as follows:
Fiscal year ended September 30, 2015 2014 2013
Total percentage of covered payroll 153.70%/152.88% 57.52%/56.73% 50.59%/49.80%Contributions: Percentage contributed by the employer 149.95%/149.88% 53.77%/53.73% 46.84%/46.80% Percentage contributed by the employees 3.75%/3.00% 3.75%/3.00% 3.75%/3.00% Contributed by the employer $ 4,162,196 $ 1,796,181 $ 1,807,654 Contributed by the employees 104,090 125,541 144,705Total contributions $ 4,266,286 $ 1,921,722 $ 1,952,359
The ERS establishes rates based upon an actuarially determined rate recommended by an independent actuary. The actuarially determined rate is the estimated amount necessary to finance the costs of benefits earned by employees during the year, with additional amounts to finance any unfunded accrued liability, the pre-retirement death benefit and administrative expenses of the Plan. For the year ended September 30, 2015, the University’s active employee contribution rate was 149.95% of covered employee payroll, and the University’s average contribution rate to fund the normal and accrued liability costs was 149.85%. The University’s contractually required contribution rate for the year ended September 30, 2015, was 149.76% of pensionable pay. These required contribution rates are based upon the actuarial valuation dated September 30, 2013, a percent of annual pensionable payroll, and
actuarially determined as an amount that, when combined with member contributions, is expected to finance the costs of benefits earned by members during the year, with an additional amount to finance any unfunded accrued liability. Total employer contributions to the pension plan from the University were $4,151,926 for the year ended September 30, 2015.
Net Pension LiabilityThe University’s net pension liability was measured as of September 30, 2014, and the total pension liability used to calculate the net pension liability was determined by an actuarial valuation as of September 30, 2013 and rolled forward to September 30, 2014, using standard roll-forward techniques as shown in the following table:
Total Pension Liability
Total Pension Liability as of September 30, 2013 (a) $ 50,168,786
Entry Age Normal Cost for the period October 1, 2013 - September 30, 2014 (b) $ 104,069
Actual Benefit Payments and Refunds for the period October 1, 2013 - September 30, 2014 (c) $ (5,334,993)
Total Pension Liability as of September 30, 2013 [(a)*(1.08)]+(b)-[(c)*(1.04)] $ 48,737,965
Actuarial Assumptions
Inflation 3.00%Salary increases 3.75-7.25%Investment rate of return* 8.00%
*Net of pension plan investment expense
Mortality rates for ERS were based on the RP-2000 Combined Mortality Table Projected with a Scale AA to 2015 set forward three years for males and two years for females. The rates of mortality for the period after disability retirement are according to the sex distinct RP-2000 Disability Mortality Table.
The actuarial assumptions used in the actuarial valuation as of September 30, 2013, were based on the results of an investigation of economic and demographic experience for the ERS based upon
participant data as of September 30, 2010. The Board of Control accepted and approved these changes on January 27, 2012, which became effective at the beginning of fiscal year 2012.
The long-term expected rate of return on pension plan investments was determined using a log-normal distribution analysis in which best-estimate ranges of expected future real rates of return (expected returns, net of pension plan investment expense and inflation) are developed for each major asset class. These ranges are combined to produce the
The total pension liability in the September 30, 2013, actuarial valuation was determined using the following actuarial assumptions, applied to all periods included in the measurement:

Aub
urn U
nive
rsity
201
5
52
long-term expected rate of return by weighting the expected future real rates of return by the target asset allocation percentage and by adding
expected inflation. The target asset allocation and best estimate of geometric real rates of return for each major asset class are as follows:
Target Allocation
Long-Term Expected Rate of Return*
Fixed Income 25.00% 5.00%U.S. Large Stocks 34.00% 9.00%U.S. Mid Stocks 8.00% 12.00%U.S. Small Stocks 3.00% 15.00%International Developed Market Stocks 15.00% 11.00%International Emerging Market Stocks 3.00% 16.00%Real Estate 10.00% 7.50%Cash 2.00% 1.50% Total 100.00%
*Includes assumed rate of inflation of 2.50%
Discount RateThe discount rate used to measure the total pension liability was the long term rate of return, 8.00%. The projection of cash flows used to determine the discount rate assumed that the plan member contributions will be made at the current contribution rate and that the employer contributions will be made in accordance with the funding policy adopted by the ERS Board of Control. Based on those
assumptions, components of the pension plan’s fiduciary net position were projected to be available to make all projected future benefit payments of current plan members. Therefore, the long-term expected rate of return on pension plan investments was applied to all periods of projected benefit payments to determine the total pension liability.
Increase (Decrease)
Total Pension Liability (a)
Plan Fiduciary Net Position (b)
Net Pension Liability (a)-(b)
Balance at September 30, 2013 $ 50,168,786 $ 4,471,552 $ 45,697,234 Changes for the year: Service cost 104,069 - 104,069 Interest 3,800,103 - 3,800,103 Differences between expected and actual experience Contributions - employer - 1,790,336 (1,790,336) Contributions - employees - 125,268 (125,268) Net Investment Income - 331,362 (331,362) Benefit payments, including refunds of employee contributions (5,334,993) (5,334,993) - Administrative expense - - - Transfers among employers - - - Net changes (1,430,821) (3,088,027) 1,657,206Balance at September 30, 2014 $ 48,737,965 $ 1,383,525 $ 47,354,440
Sensitivity of the System’s proportionate share of the net pension liability to changes in the discount rateThe following table presents the University’s proportionate share of the net pension liability calculated using the discount rate of 8.00% as well as what the University’s proportionate share of the net pension
Changes in Net Pension Liability
liability would be if it were calculated using a discount rate that is one percentage point lower (7.00%) or one percentage point higher (9.00%) than the current rate:
1.00% Decrease (7.00%)
Current Discount Rate (8.00%)
1.00% Increase (9.00%)
Employers’ proportionate share of the collective net pension liability $ 50,503,719 $ 47,354,440 $ 44,584,277
Pension plan fiduciary net position: Detailed information about the pension plan’s fiduciary net position is available in the separately issued RSA Comprehensive Annual Report for the fiscal year ended September 30, 2014. The supporting actuarial information is included in the GASB Statement No. 68 Report for the ERS prepared as of
September 30, 2014. The auditor’s report dated June 3, 2015, on the Schedule of Changes in Fiduciary Net Position by Employer and accompanying notes is also available. The additional financial and actuarial information is available at www.rsa-al.gov.

Aub
urn U
nive
rsity
201
5
53
For the year ended September 30, 2015, the University recognized pension expense of $3,535,872. At September 30, 2015, the University
reported deferred outflows of resources and deferred inflows of resources related to pensions of the following sources:
Deferred Outflows of Resources
Deferred Inflows of Resources
Differences between expected and actual experience $ - $ -
Changes of assumptions - -
Net difference between projected and actual earnings on pension plan investments - 88,330
Employer contributions subsequent to the measurement date 4,151,926 -
Total $ 4,151,926 $ 88,330
Amounts reported as deferred outflows of resources and deferred inflows of resources related to pensions will be recognized in compensation and benefits expense as follows:
Year Ending September 30:
2016 $ 22,0832017 22,0832018 22,0832019 22,0812020 -
Thereafter -Pension Expense
Deferred Inflows of Resources
Service Cost $ 104,069
Interest on the total pension liability 3,800,103
Current-period benefit changes -
Expensed portion of current-period difference between expected and actual experience in total pension liability -
Expense portion of current-period changes of assumptions -
Member contributions (125,268)
Projected earnings on plan investments (220,949)
Expensed portion of current-period differences between actual and projected earnings on plan investments (22,083)
Transfers among employers -
Recognition of beginning deferred outflows of resources as pension expense -
Recognition of beginning deferred inflows of resources as pension expense -
Pension Expense (Income) $ 3,535,872
C. Tax Deferred Annuity PlansThis plan is a defined contribution plan under Section 403(b) of the Internal Revenue Code. Accordingly, benefits depend solely on amounts contributed to the plan plus investment earnings. This is provided as a supplement to the aforementioned programs. All full-time regular or probationary employees are eligible to participate. Full-time temporary employees are also eligible if their employment period is for a minimum of one year. The University will match 100.0% of elective deferral contributions up to 5.0% of the employee’s plan compensation. The matching contributions cannot exceed $1,650 for any plan year (calendar year). An employee enrolling in one of the University’s tax deferred annuity plans will not vest in the University’s matching portion until he/she has completed five years of full-time continuous service. Upon the employee’s completion of the five year requirement, the
University’s matching contribution and interest earned will be vested to the participant. Nonparticipating employees with continuous service will be given credit toward the five year requirement upon joining the tax deferred annuity program. The total investment in the annuities is determined by Section 403(b). There are several investment options including fixed and variable annuities and mutual funds. The University-approved investment firms employees may select are Valic, TIAA-CREF, Fidelity Investments and Lincoln Financial. At September 30, 2015 and 2014, 3,381 and 3,299 employees, respectively, participated in the tax deferred annuity program. The contribution for 2015 was $20,314,942 which includes $5,002,639 from the University and $15,312,303 from its employees. The contribution for 2014 was $19,334,331, which includes $4,845,278 from the University and $14,489,053 from its employees.

Aub
urn U
nive
rsity
201
5
54
Total salaries and wages during the fiscal year for covered employees participating in the plan were $251,370,027 and $240,856,614 for the fiscal years ended September 30, 2015 and 2014, respectively.
D. Deferred Compensation PlansThe University follows the provisions of GASB Statement No. 32, Accounting and Financial Reporting for Internal Revenue Code Section 457 Deferred Compensation Plans-a recission of GASB Statement No. 2 and an amendment of GASB Statement No. 31. As of September 30, 2015 and 2014, 218 and 212 employees, respectively, participated in the plans. Contributions of $2,695,269 and $2,645,296 for fiscal years 2015 and 2014, respectively, were funded by employees and no employer contribution was funded. The University approved investment firms for 457(b) include Valic, TIAA-CREF and Fidelity Investments.
(12) OTHER POSTEMPLOYMENT BENEFITS (OPEB)The University offers postemployment health care benefits to all employees who officially retire from the University. Health care benefits are offered through the State of Alabama Public Education Employees Health Insurance Plan (PEEHIP) with TRS or the University’s self-insured Retiree Medical Plan (the Plan), which is available for select employees who are not eligible for PEEHIP or those who were grandfathered in as Civil Service employees. Eligibility for benefits for Tier 1 employees begins at age 60 with at least ten years of service or at any age with 25 years of service. For Tier 2 employees, eligibility begins at age 62 with at least ten years of service. Retirees must have been enrolled in the active employees’ health care plan for the last six of those years in order to be eligible for coverage under the plan.
The University applies GASB Statement No. 45, Accounting and Financial Reporting by Employers for Postretirement Benefits Other than Pensions. This statement requires governmental entities to recognize and match other post-retirement benefit costs with related services received and also to provide information regarding the actuarially calculated liability and funding level of the benefits associated with past services.
A. State of Alabama Public Education Employees Health Insurance Plan (PEEHIP)Alabama Retired Education Employees’ Health Care Trust is a cost-sharing multiple-employer defined benefit health care plan administered by the Public Education Employees’ Health Insurance Board (PEEHIB). PEEHIP offers a basic hospital/medical plan that provides basic medical coverage for up to 365 days of care during each hospital confinement. The basic hospital/medical plan also provides for physicians benefits, outpatient care, prescription drugs, and mental health benefits.
The Code of Alabama 1975, Section 16-25A-4 provides the PEEHIB with the authority to amend the benefit provisions for the plan, and Section 16-25A-8 provides the authority to set the contribution for retirees and employers.
The required contribution rate of the employer was $370 and $356 per employee per month in the years ended September 30, 2015 and 2014, respectively. The University paid $10,088,354 and $9,457,590 for 2,255 and 2,201 retirees for the years ended September 30, 2015 and 2014, respectively. 100% of the required contributions were paid to PEEHIP. The required contribution rate is determined by PEEHIP in accordance with state statute.
The required monthly contribution rates for fiscal year 2015 are as follows:Retired Member Rates• Individual Coverage/Non-Medicare Eligible - $151.00• Family Coverage/Non-Medicare Eligible Retired Member and Non- Medicare Eligible Dependent(s) - $391.00• Family Coverage/Non-Medicare Eligible Retired Member and Dependent Medicare Eligible - $250.00• Individual Coverage/Medicare Eligible Retired Member - $10.00• Family Coverage/Medicare Eligible Retired Member and Non- Medicare Eligible Dependent(s) - $250.00• Family Coverage/Medicare Eligible Retired Member and Dependent Medicare Eligible - $109.00• Tobacco surcharge - $28.00 per month• PEEHIP Supplemental Plan - $0• Optional Plans (Hospital Indemnity, Cancer, Dental, Vision) - up to two optional plans can be taken by retirees at no cost if the retiree is not also enrolled in one of the Hospital Medical Plans. Otherwise, they can purchase the Optional Plans at the normal monthly rate of $38.00 or $45.00 for family dental.
Members who retired on or after October 1, 2005, and before January 1, 2012, pay two percent of the employer premium for each year under 25 years of service, and for each year over 25 years of service, the retiree premium is reduced by two percent.
Employees who retire on or after January 1, 2012, with less than 25 years of service, are required to pay 4% for each year under 25 years of service. Additionally, non-Medicare eligible employees who retire on or after January 1, 2012, are required to pay 1% more for each year less than 65 (age premium) and to pay the net difference between the active employee subsidy and the non-Medicare eligible retiree subsidy (subsidy premium). When the retiree becomes Medicare eligible, the age and subsidy premium will no longer apply. However, the years of service premium (if applicable to the retiree) will continue to be applied throughout retirement. These changes are being phased in over a five year period.
Surviving Spouse Rates• Surviving Spouse Non-Medicare Eligible - $700.00• Surviving Spouse Non-Medicare Eligible and Dependent Non-Medicare Eligible - $934.00• Surviving Spouse Non-Medicare Eligible and Dependent Medicare Eligible - $907.00• Surviving Spouse Medicare Eligible - $354.00• Surviving Spouse Medicare Eligible and Dependent Non-Medicare Eligible - $595.00• Surviving Spouse Medicare Eligible and Dependent Medicare Eligible $568.00
The complete financial report for PEEHIP can be obtained on the PEEHIP website at http://www.rsa-al.gov/PEEHIP/peehip.html under the Trust Fund Financials tab and will be available at the end of January 2016.
B. Retiree Medical Plan (the Plan)The Plan is considered a single-employer plan and consists of hospital benefits, major medical benefits, a prescription drug program and a preferred care program. The health care benefits cover medical and hospitalization costs for retirees and their dependents. If the retiree is eligible for Medicare, University coverage is secondary. The authority under which the Plan’s benefit provisions are established or amended

Aub
urn U
nive
rsity
201
5
55
is the University President. Recommendations for modifications are brought to the President by the Insurance and Benefits Committee. Any amendments to the obligations of the plan members or employer(s) to contribute to the plan are brought forth by the Insurance and Benefits Committee and approved by the President.
Employees included in the actuarial valuation include retirees and survivors, active eligible Civil Service employees and those retirees who elected the PEEHIP plan on or prior to October 1, 1997 for whom the University pays a subsidy. Expenditures for postretirement health care benefits are recognized monthly and financed on a pay-as-you-go basis. The University funds approximately 60% of the postretirement healthcare premiums, which totaled $863,203 and $877,718 for fiscal years ended September 30, 2015 and 2014, respectively. The retirees are responsible for funding approximately 40% of the healthcare premiums.
In compliance with the provisions of GASB Statement No. 45, the University accrued an additional $1,772,580 and $1,668,406 in retiree healthcare expense during fiscal years 2015 and 2014, respectively.
The Plan does not issue a stand-alone financial report. For inquiries relating to the Plan, please contact Auburn University Payroll and Employee Benefits, 1550 East Glenn Avenue, Auburn University, Alabama 36849.
The required schedule of funding progress, contained in the Required Supplemental Information immediately following the divisional financial statements (see page 80), presents multiyear trend information about whether the actuarial value of plan assets is increasing or decreasing over time relative to the actuarial accrued liability for benefits.

Aub
urn U
nive
rsity
201
5
56
Determination of Annual Required Contribution (ARC) and End of Year Accrual for Retiree Medical Plan
Cost Element Fiscal Year Ended September 30, 2015
Amount Percent of Payroll1
1. Unfunded actuarial accrued liability at October 1, 2014 $ 68,027,346 3,102.8%
Annual Required Contribution (ARC) 2. Normal cost $ - 3. Amortization of the unfunded actuarial accrued liability over 15 years using level dollar amortization 5,229,775 4. Annual Required Contribution (ARC = 2 + 3) $ 5,229,775 238.5% Annual OPEB Cost (Expense) 5. ARC $ 5,229,775 6. Interest on beginning of year accrual 324,650 7. Adjustment to ARC (1,238,533) 8. Fiscal year 2015 OPEB cost (5 + 6 + 7) $ 4,315,892 196.9%
End of Year Accrual (Net OPEB Obligation)2
9. Beginning of year accrual 1 $ 16,232,518 10. Annual OPEB cost 4,315,892 11. Employer contribution (benefit payments)2 (2,543,312)12. End of year CAFR accrual (9 + 10 + 11)2 $ 18,005,098 821.2%
1 Annual payroll for 24 participants as of September 30, 2015, was $2,192,470.2 Actual amounts paid in fiscal year 2015 include claim costs, administrative fees, and PEEHIP subsidy less participant contributions.
Three Year Schedule of Percentage of OPEB Cost Contributed
Fiscal YearEnded
Annual OPEBCost
Percentage of OPEBCost Contributed3
Net OPEBObligation
September 30, 2013 $ 3,810,309 65.1% $ 14,564,112 September 30, 2014 $ 4,172,525 60.0% $ 16,232,518 September 30, 2015 $ 4,315,892 58.9% $ 18,005,098
3 Cost Contributed is shown in the “Determination of Annual Required contribution and End of Year Accrual.” Summary of Key Actuarial Methods and Assumptions
Valuation year October 1, 2014 – September 30, 2015
Actuarial cost method Unit Credit, Actuarial Cost Method
Amortization method 15 years, level dollar open amortization4
Asset valuation method Not applicable
Discount rate 2.0%
Projected payroll growth rate Not applicable
Health care cost trend rate formedical and prescription drugs 9.0% in fiscal year 2016, decreasing by one-half percentage point per year to an ultimate of 5.0% in fiscal year 2024 and later.
Valuation Date October 1, 2014
4 Open amortization means a fresh-start each year for the cumulative unrecognized amount.

Aub
urn U
nive
rsity
201
5
57
Valuation Date October 1, 2014
Monthly Per Capita Claim CostsAge Medical55 $734 60 $880 65 $357 70 $396 75 $422
Claim costs remained unchanged from last year based on a weighted average of benefit plan premiums. Future claim costs are increased by health care cost trend.
Retiree Premiums Non-smoking retirees contribute 40%, surviving spouses and retires who decline to participate pay 100%, and smokers pay an additional $20 of the monthly premiums shown below: As of 1/1/15 As of 1/1/14 Pre-65 Single $481 $472 Pre-65 Family $1,083 $1,062 Post-65 Single $156 $142 Post-65 Family $757 $742
Note: There are several other categories of premiums.
Administrative Expenses Included in claim cost.
Assumed Health Care Trend Rate Medical and Fiscal Rx Combined Year Rate 2016 9.0% 2017 8.5% 2018 8.0% 2019 7.5% 2020 7.0% 2021 6.5% 2022 6.0% 2023 5.5% 2024+ 5.0%
Spouse Age Difference Husbands are assumed to be three years older than wives for current and future retirees who are married. Mortality RP-2014 Combined Mortality Fully Generational Projected using Projection Scale MP=2014. Participation Rates 100% of active employees are assumed to elect postretirement health insurance coverage upon retirement.
Retirement Rates Employees are assumed to retire according to the following schedule:
Age Retirement Rate 45 or less 0% 46 - 49 1% 50 - 51 2% 52 - 54 3% 55 10% 56 - 59 8% 60 20% 61 15% 62 25% 63 - 64 20% 65 40% 66 - 69 30% 70 - 74 75% 75+ 100%

Aub
urn U
nive
rsity
201
5
58
Withdrawal Rates None assumed since all are long service Civil Service employees. Disability Rates Sample rates are shown below, percent assumed to terminate within one year:
Age Male Female 25 0.06% 0.09% 30 0.08% 0.12% 35 0.17% 0.24% 40 0.30% 0.41% 45 0.54% 0.65% 50 0.98% 0.98% 55 1.50% 1.50%
Impact of Healthcare Reform The provisions of Healthcare Reform are expected to increase costs by 4.3% on a discounted basis. The unlimited lifetime maximum, removal of limitations on preventive care and coverage of eligible dependents to age 26 are reflected in the claim costs. The Cadillac Plan excise tax is expected to increase costs by $5.5 million. There is not any cost impact for retirees who have elected PEEHIP.
(13) SELF INSURANCE PROGRAMS AND OTHER LIABILITIESSelf InsuranceAn actuarially determined rate is used to provide funding for retained risk in the University’s self-insurance program. The self-insurance reserves, liabilities and related assets are included in the accompanying financial statements. The estimated liability for general liability and on-the-job injury self-insurance is actuarially determined. These self-insured programs are supplemented with commercial excess insurance.
The Comprehensive General Liability Trust Fund is a self-insured retention program that protects the University, its faculty, staff and volunteers against claims brought by third parties arising from bodily injury, property damage and personal liability (libel, slander, etc.). Funds are held in a separate trust account with a financial institution to be used to pay claims for which the University may become legally liable. The liability at September 30, 2015 and 2014, was $430,623 and $476,765, respectively. These amounts are included in other noncurrent liabilities on the Statement of Net Position.
The On-The-Job-Injury program provides benefits for job-related injuries or death resulting from work at the University. This program is designed to cover out-of-pocket expenses of any employee who is not covered by insurance. The program will also pay for medically evidenced disability claims and provide death benefits arising from a job-related death of an employee. This self-funded program is provided to employees since the University is not subject to the workers’ compensation laws of the State of Alabama. The liability at September 30, 2015 and 2014, was $3,041,613 and $2,021,882, respectively. These amounts are included in other noncurrent liabilities on the Statement of Net Position.
The University self-insures its health insurance program for all eligible employees. Assets have been set aside to fund the related claims of this program. Should the assets be insufficient to pay the insurance claims, the University would be liable for such claims. The accompanying
Statements of Net Position include a self-insurance liability for health insurance as of September 30, 2015 and 2014, of $7,923,758 and $11,394,610, respectively. These amounts are included in accounts payable and other accrued liabilities on the Statement of Net Position. Other LiabilitiesOther liabilities include compensated absences, deposits held in custody and unearned revenues. The University allows employees to accrue and carryover annual and sick leave up to certain maximum amounts depending on years of service. Employees will be compensated for accrued annual leave at time of separation from University employment (termination or retirement) up to a maximum of one month’s additional compensation. All eligible employees hired before October 1, 1990, may be compensated for unused sick leave at the rate of 25% of their respective balances, subject to a maximum of one month’s additional compensation. The liability for compensated absences was $19,023,576 and $18,347,365 at September 30, 2015 and 2014, respectively.
Deposits held in custody include the portion of the Federal Perkins Student Loan funds and Health Professions Student Loans which would be refunded in the event the University ceased operations. The refundable amounts were $16,077,804 and $15,920,432 at September 30, 2015 and 2014, respectively. Also included in deposits held in custody of others are the agency funds. These amounts totaled $4,026,721 and $3,937,118 for September 30, 2015 and 2014, respectively. The remaining difference relates to immaterial rental deposits.
Unearned revenue includes tuition revenue related to the portion of Fall semester subsequent to September 30, funding received for contracts and grants which has not been expended as of September 30, as well as athletic revenue related to games played subsequent to September 30.Unearned revenues at September 30, 2015 and 2014, are as follows:
2015 2014
Tuition and fees, net $ 144,787,084 $ 136,497,793Federal, state and local government grants and contracts 8,818,782 13,440,678Auxiliary, net 45,455,323 33,864,410Plant 490,656 506,483 Total unearned revenue $ 199,551,845 $ 184,309,364

Aub
urn U
nive
rsity
201
5
59
Pollution Remediation ObligationsThe University follows GASB Statement No. 49, Accounting and Financial Reporting for Pollution Remediation Obligations, which requires recognition of liabilities, recoveries, and related disclosures, as appropriate.
The University conducts groundwater monitoring, monitored natural attenuation and clean-up in accordance with the Resource Conservation and Recovery Act (RCRA) and the Toxic Substances and Control Act. Additionally, asbestos abatement is necessary as older buildings on campus are demolished or renovated. During fiscal year 2011, the University, with the assistance of an outside consultant, prepared a 30-year Post Closure Cost Estimate related to all active and inactive solid waste management units managed through the University RCRA Facility permit.
As of September 30, 2015 and 2014, the total estimated pollution remediation liability (estimated using the expected cash-flow technique) is $7,003,258 and $6,972,856, respectively. The current portion of this amount ($348,948 and $3,306,421, respectively)
is included in other accrued liabilities and the long-term portion ($6,654,310 and $3,666,435, respectively) is included in other noncurrent liabilities in the accompanying Statements of Net Position. This estimate may change in future periods as additional information is obtained. The University does not expect to recover any funds from insurance or other third parties related to these obligations.
(14) DEFERRED INFLOWS OF RESOURCESDeferred inflows of resources are an acquisition of net assets that are applicable to a future reporting period. The University engages in certain voluntary nonexchange transactions (grants). Grant funds received for which all eligibility requirements have been met, other than time requirements, are presented as deferred inflows of resources in accordance with the adoption of GASB Statements No. 63 and No. 65. Additionally, in accordance with GASB Statement No. 68, which the University adopted in fiscal year 2015, the University’s proportionate share of the net difference between projected and actual earnings on pension plan investments is presented as a deferred inflow of resources. Deferred inflows of resources are summarized below:
September 30, 2015 September 30, 2014Nonexchange transactions $ 206,159 $ 435,203Pension 39,307,330 -Total deferred inflows $ 39,513,489 $ 435,203
(15) CONTRACTS AND GRANTSThe University has been awarded approximately $14.3 million and $6.4 million in contracts and grants that have not been received or expended as of September 30, 2015 and 2014, respectively. These awards, which represent commitments of sponsors to provide funds for research and training projects, have not been reflected in the financial statements.
(16) RECOVERY OF FACILITIES AND ADMINISTRATIVE COST FOR SPONSORED PROGRAMSThe portion of revenue recognized for all grants and contracts that represent facilities and administrative cost recovery is recognized on the Statements of Revenues, Expenses and Changes in Net Position within contract and grant operating revenues. The University recognized $17,276,028 and $16,220,174 in facilities and administrative cost recovery for the years ended September 30, 2015 and 2014, respectively.
(17) CONSTRUCTION COMMITMENTS AND FINANCINGThe University has entered into projects for the construction and renovation of various facilities that are estimated to cost approximately $366.5 million. At September 30, 2015, the estimated remaining cost to complete the projects is approximately $94.8 million which will be funded from University funds and bond proceeds.

Aub
urn U
nive
rsity
201
5
60
are broken out in the charts below. In addition, the graduate waivers are shown as compensation; however, they are shown functionally as scholarship and fellowship expense. The University is able to capture auxiliary utility expenditures; therefore, those expenditures are shown separately by function.
(18) OPERATING EXPENSES BY FUNCTIONOperating expenses by functional classification for the years ended September 30, 2015 and 2014, are listed below. In preparing the financial statements, all significant transactions and balances between auxiliary units and other funds have been eliminated. Some scholarships and fellowships are provided by the instruction or research function and
September 30, 2015
Compensation Scholarships Other Suppliesand Benefits and Fellowships Utilities and Services Depreciation Total
Instruction $ 220,518,958 $ 863,777 $ - $ 33,209,524 $ - $ 254,592,259Research 67,122,765 1,691,480 4,056 28,550,286 - 97,368,587 Public Service 64,969,808 73,926 49,845 41,614,055 - 106,707,634 Academic Support 45,905,858 - - 9,501,380 - 55,407,238 Library 7,585,076 - - 1,442,618 - 9,027,694 Student Services 22,923,422 995 - 10,037,135 - 32,961,552 Institutional Support 65,194,561 - - 13,340,757 - 78,535,318 Operation and Maintenance 28,117,641 - 19,295,455 31,343,993 - 78,757,089
Scholarships and Fellowships 21,544,265 17,165,759 - 600,555 - 39,310,579 Auxiliaries 54,522,581 943,982 5,170,980 61,919,345 - 122,556,888 Depreciation - - - - 74,297,440 74,297,440
$ 598,404,935 $ 20,739,919 $ 24,520,336 $ 231,559,648 $ 74,297,440 $ 949,522,278
September 30, 2014
Compensation Scholarships Other Suppliesand Benefits and Fellowships Utilities and Services Depreciation Total
Instruction $ 213,531,303 $ 1,102,162 $ - $ 34,327,058 $ - $ 248,960,523Research 66,800,529 1,404,987 635 31,006,628 - 99,212,779 Public Service 63,480,429 2,465 74,791 38,918,058 - 102,475,743 Academic Support 43,548,796 - - 9,778,431 - 53,327,227 Library 7,304,223 - - 2,401,629 - 9,705,852 Student Services 21,337,008 - - 8,847,034 - 30,184,042 Institutional Support 61,999,767 - - 8,541,053 - 70,540,820 Operation and Maintenance 27,312,590 - 21,019,977 30,432,719 - 78,765,286 Scholarships and Fellowships 20,006,300 19,977,514 - 226,335 - 40,210,149
Auxiliaries 52,921,909 163,949 4,908,433 65,125,112 - 123,119,403 Depreciation - - - - 71,795,613 71,795,613
$ 578,242,854 $ 22,651,077 $ 26,003,836 $ 229,604,057 $ 71,795,613 $ 928,297,437
(19) CONTINGENT LIABILITIESThe University is a party in various legal actions and administrative proceedings arising in the normal course of its operations. Management does not believe that the outcome of these actions will have a material adverse effect on the University’s financial position.
(20) RELATED PARTY TRANSACTIONSAuburn University FoundationAUF exists to raise and administer private gifts for the benefit of the University. The majority of funds that AUF raises are restricted by the donor for specific schools, colleges or programs of the University. These may be immediately transferred to the University or one of its institutionally-related foundations for its use, held within the Foundation’s temporarily restricted funds to be either transferred to the University or expended by AUF for the benefit of University schools,
colleges or programs, or in the case of endowments, invested with only the earnings transferred to or expended for the University’s behalf. Amounts transferred to the University or expended on behalf of its programs totaled $40,150,212 and $34,907,076 during the years ended September 30, 2015 and 2014, respectively.
The University Trustees have entered into an agreement whereby AUF Investment Committee manages the University’s endowments. AUF is compensated by a management fee. This fee was approximately $1.9 million and $1.8 million for the years ended 2015 and 2014, respectively.
The President of the University serves as an ex-officio non-voting member of AUF’s Board. The University’s Vice President for Development serves as the President of the Foundation, and the

Aub
urn U
nive
rsity
201
5
61
Director of the Endowment Management Office and the Director of Development Accounting serve as AUF’s Assistant Treasurers. The University maintains AUF’s financial records as a subsystem within the University’s accounting system and AUF has elected to use University employees for its other personnel functions for which it reimburses the University under a Services and Facilities agreement.
AUF and the University operate pursuant to a Services and Facilities Agreement (the AUF Agreement), which addresses the financial relationships between these two entities. The AUF Agreement states that in return for administering gifts for the benefit of the University, the University will provide to AUF certain services and facilities which primarily consist of personnel and other administrative support, and that AUF will make a periodic determination of the allocable shares of these costs and transfer funds as necessary. AUF and the University review the services and facilities at least annually. An estimate of the consideration to be paid for the upcoming year is approved annually by the respective Boards.
For the years ended September 30, 2015 and 2014, all personnel costs plus a limited amount of operational expenses were incurred by the University. AUF incurred and paid the majority of the operational expenses. AUF’s share of the combined costs allocated in accordance with the Agreement totaled $2,989,178 and $2,200,405, respectively. The actual payments by AUF totaled $5,067,895 and $2,069,917 for the two years. Costs were analyzed monthly and the net balances due were transferred between the two organizations to settle. For the year, the sum of these transfers resulted in the University reimbursing AUF a net of $2,078,717 for fiscal year 2015 and AUF reimbursing the University a net of $130,489 for fiscal year 2014.
Constituency development operations, which raise funds restricted to a school, college, or program of the University, are funded jointly by the University unit involved and may use AUF gifts restricted to that unit. These costs are the responsibility of the respective constituency unit.
AUREFI and the University entered into an agreement to provide certain services and facilities. AUREFI reimbursed the University $71,863 and $56,455 during the years ended September 30, 2015 and 2014, respectively, for agreement-related services and facilities. AUREFI provided a real property grant to the University of $3,500 during fiscal year 2014. AUREFI did not provide a real property grant to the University in 2015.
The amount due from AUF to the Association consists primarily of funds from the Association’s Life Membership program which are invested with AUF’s pooled endowments. AUF annually distributes to the Association from the Life Membership investments based on the spending policy. AUF distributed directly to the Association $311,970 and $298,677 during the years ended September 30, 2015 and 2014, respectively.
The Association does not maintain its own endowments but instead establishes endowments in AUF which are administered in the endowment pool. The Association made a campaign commitment of matching funds for scholarship endowments established with certain specific guidelines. Donors have been identified and approved for matches totaling the full amount and the Association makes grants at the end of each quarter for payments received by AUF on these endowments. At September 30, 2015, $639,500 remains unpaid by the Association and is carried as a receivable to AUF from the Association.
There was not an outstanding balance at September 30, 2014. Grants from the Association for matching and other endowments were $1,702,647 and $240,583 during the years ended September 30, 2015 and 2014, respectively.
The amount due from AUF to TUF primarily consists of TUF’s endowment funds, which are invested with AUF’s pooled endowments. AUF annually distributes TUF endowment earnings either to TUF or directly to the University on behalf of TUF based on the spending policy. AUF distributed $298,464 and $287,076 for TUF endowments during the years 2015 and 2014, respectively.
AUF participates in the Tigers Unlimited athletic priority system each year in order to obtain tickets and suites for the cultivation, solicitation and stewardship of contributions. Included in fund raising costs are payments to TUF in the amounts of $384,926 and $436,737 during the years 2015 and 2014, respectively. Actual ticket purchases paid to the AU Athletic Office totaled $125,390 and $100,800 for fiscal years 2015 and 2014, respectively.
Auburn Alumni AssociationThe Association, AUF, Auburn University Offices of Alumni and Development and their related support units jointly utilize operationalfacilities, personnel and other assets in order to effectively and efficiently carry out their required activities. All personnel are employed by the University and their services are provided to the other organizations under contractual agreements.
Expenditures are analyzed periodically and, based on each entity’s utilization of the facilities, supplies and services, any necessary reimbursements are made among the organizations. In the Statements of Activities, amounts received by the Operating Fund from other organizations are used to offset the related expenses. The Executive Director of the Association is an employee of the University, providing services to the Association under a services and facilities contract. The Executive Director also serves as the Vice President for Alumni Affairs for the University.
A portion of the Association’s investments have been pooled with AUF investments and are invested and managed by AUF. Cash receipts and disbursements records of the Association are maintained within the University’s accounting system.
During the years ended September 30, 2015 and 2014, the Association had a salary reimbursement expense of $1,135,273 and $1,042,275, respectively, to the University under the service and facilities agreement. These amounts were fully paid at September 30, 2015 and September 30, 2014, respectively.
Rental income recorded by the Association from the University totaled $374,361 and $362,961, respectively, for the years ended September 30, 2015 and 2014. Rental income recorded by the Association from AUF totaled $1,150 and $3,160 for the years ended September 30, 2015 and 2014, respectively. The University and AUF also paid the Association $62,008 and $4,994, respectively for shared alumni center building expenses for the fiscal year ended September 30, 2015. For the fiscal year ended September 30, 2014, these amounts were $61,385 and $6,065, respectively.

Aub
urn U
nive
rsity
201
5
62
During the years ended September 30, 2015 and 2014, the University provided for its share of alumni affairs activities costs by establishing a budget within the University’s budgetary system; whereby, the University pays a portion of the costs, and reimburses the Association for the balance. The alumni affairs activities costs were $640,000 and $680,190 for the years ended September 30, 2015 and 2014, respectively.
During the year ended September 30, 2015, the Association paid the University $19,301 for Alumni Accounting office space at the East Glenn Administrative Complex. During the year ended September 30, 2014, the Association paid the University $20,108 for Alumni Accounting office space rental at Eagle Crossing.
During the years ended September 30, 2015 and 2014, the Association contributed $166,920 and $177,071, respectively, to the Auburn Alumni Association Endowment for Scholarships held with AUF. The Association also contributed $1,124,810 and $304,626 to various AUF scholarship funds and $104,840 and $29,907 to various University scholarship funds during fiscal years 2015 and 2014, respectively.
During the year ended September 30, 2015, the Alumni Association Board approved a fundraising program called the Million Dollar Match program in effort to increase new alumni donor scholarship endowments. As a result of the program, the Association matched dollar for dollar endowment contributions of $460,500 toward qualifying endowments and accrued $639,500 as a payable to AUF. Tigers Unlimited FoundationThe funds that TUF raises are restricted for athletic-related programs of the University. These may be transferred to the University for itsuse, expended for the benefit of athletic programs or, in the case of endowments, invested according to donor restriction with the earnings thereon transferred to or expended for the University’s benefit. Amounts transferred to the University or expended on behalf of its programs totaled $34,401,547 and $34,748,751 during the years ended June 30, 2015 and 2014, respectively. Included in these amounts are current year accruals of severance payments due to terminated employees totaling $3,144,565 and $2,620,161, respectively.
TUF and the University operate pursuant to an operating agreement (the TUF Agreement), which addresses the financial relationships between these two entities. In summary, the TUF Agreement states that the University will provide certain services and facilities to TUF, which primarily consist of personnel and other administrative support. TUF shall pay to the University an amount equal to the compensation of Auburn University employees for services performed and reimbursement for space and property utilized by such employees, in an amount to be specifically approved by TUF’s Board of Directors each year. The TUF Agreement commenced on July 1, 2007, and expired on July 1, 2008, but remains in force in subsequent years unless cancelled in writing by one of the parties.
During the years ended June 30, 2015 and 2014, the University incurred obligations of $533,945 and $504,245, respectively, to TUF for the use of executive suites at University athletic events. Of this amount, $528,825 and $499,125, respectively, is recorded as public support-contributions revenue and $5,120 is recorded as other revenue on the Statements of Activities and Changes in Net Assets.
During the years ended June 30, 2015 and 2014, AUF incurred obligations of $140,261 and $157,374, respectively, to TUF for amenities related to the use of the executive suites at University athletic events. This amount is recorded as other revenue on the Statements of Activities and Changes in Net Assets.
During the years ended June 30, 2015 and 2014, TUF paid the University for normal, recurring expense transactions including, but notlimited to, purchasing athletic event tickets, reimbursing athletic staff salaries, sponsoring student scholarships, and funding the debt, repair, maintenance and operations of athletic facilities. At June 30, 2015 and 2014, obligations of $5,693,143 and $2,943,300 related to these transactions, respectively, were outstanding. TUF paid the 2014 obligation during fiscal year 2015, and it intends to pay the 2015 obligation during fiscal year 2016.
As indicated, the above TUF balances are as of June 30, 2015 and 2014; however, the University believes these figures are not materially different than September 30, 2015 and 2014, respectively.
Auburn Research and Technology FoundationARTF’s mission is to facilitate the acquisition, construction and equipping of a technology and research park on the University’s campus in order to create new academic and entrepreneurial opportunities for the University’s faculty and students. Consideration received by the University from ARTF includes the traditional benefits enjoyed by a University from an affiliated research park, including but not limited to increased exposure for development and commercialization of the University’s intellectual property and technologies, increased research opportunities for the University’s students and professors, and heightened exposure within the commercial world of the technological campus offerings. ARTF's Board of Directors include a member of the University's Board of Trustees as well as other University employees.
The Vice President for Research and Economic Development of the University serves as the President of ARTF and is a member of the ARTF Board of Directors with full voting powers. Contributed services in the amount of approximately $17,000 were recognized by ARTF during fiscal years 2015 and 2014, related to services provided by the Vice President for Research and Economic Development serving as the President of ARTF. Additionally, ARTF’s accounting records are maintained as a subsystem within the University’s accounting system.
ARTF and the University entered into an Operating Agreement (the ARTF Agreement), which governs the general and administrative and development financial relationships between these two entities. In summary, the ARTF Agreement states that in return for certain services and facilities that are within the capability and control of the University, ARTF will reimburse and compensate the University for the cost of such services and facilities. ARTF will make an annual determination of its allocable share of these costs and transfer the associated funds. ARTF and the University review the ARTF Agreement annually and provide an estimate of the maximum consideration to be paid for the upcoming year for approval by the respective boards. The actual reimbursement is determined based on the actual costs incurred.
In accordance with the ARTF Agreement for fiscal years 2015 and 2014, personnel costs incurred by the University and charged to ARTF were $65,063 and $61,091, respectively. ARTF entered into an agreement

Aub
urn U
nive
rsity
201
5
63
with the University to market the University’s Certification for Aquaculture Professionals (CAP) program. As of September 30, 2015 and September 30, 2014, ARTF owed the University $6,000 and $15,000, respectively, related to this agreement. ARTF entered into subcontacts with the University to provide services to fulfil ARTF’s sponsored project agreements. As of September 30, 2015 and September 30, 2014, ARTF owed the University $58,593 and $24,588, respectively. ARTF and the University enter into licensing agreements for certain intellectual property. Under the licensing agreements, ARTF owed the University $90,149 and $1,185 at September 30, 2015 and 2014, respectively. The University provides certain operating services to ARTF. As of September 30, 2015 and September 30, 2014, ARTF owed the University $5,293 and $7,588, respectively, related to these services. All above amounts owed to the University are shown in “Other payables to Auburn University” on the Statements of Financial Position.
The amounts due from the University to ARTF of $16,000 and $2,957 at September 30, 2015 and 2014, respectively, relate to operating transactions. These amounts are included in "Accounts receivable" on ARTF's Statements of Financial Position. ARTF held lease agreements with three University departments in fiscal years 2015 and 2014, respectively, whereby the departments lease office space from ARTF. As leasing tenants, the University departments remit a monthly rental fee to ARTF in accordance with their lease agreements. The University paid approximately $138,000 and $135,000 in lease costs during the fiscal years ended September 30, 2015 and 2014, respectively.
ARTF entered into a contract with the University during fiscal year 2011 to develop and manage a full service business incubator. Revenues of $134,755 and $142,577 related to this contract were recognized for the years ended September 30, 2015 and 2014, respectively. The remaining amounts of $15,245 and $7,423 are shown as deferred revenue at September 30, 2015 and 2014, respectively, and will be recognized when the expenditures are incurred.
(21) DIRECT LOAN PROGRAMThe Federal Direct Loan Program (DL) enables an eligible student or parent to obtain a loan directly through the Department of Education. Under DL, files are transmitted via the Federal Common Originator and Disbursement System (COD). Funds are received via G5, a federal website. The Department of Education is responsible for the collection of these loans.
The University’s Main Campus disbursed approximately $149 million and $131.7 million under these programs during the fiscal years ended September 30, 2015 and 2014, respectively. AUM disbursed approximately $25.5 million and $26.7 million under these programs during the fiscal years ended September 30, 2015 and 2014, respectively.
(22) IMPACT OF RECENTLY ISSUED ACCOUNTING STANDARDSStatement No. 72, Fair Value Measurement and Application was issued in February 2015. This Statement addresses accounting and financial reporting issues related to fair value measurements, and generally requires investments to be measured at fair value. Acquisition value will be required for some types of assets that were previously
reported at fair value. It also requires disclosures to be made about fair value measurements, the level of fair value hierarchy, and valuation techniques. This Statement is effective for periods beginning after June 15, 2015. Earlier application is encouraged. The University is currently evaluating the financial statement impact of this Statement.
Statement No. 73, Accounting and Financial Reporting for Pensions and Related Assets That Are Not within the Scope of GASB Statement 68, and Amendments to Certain Provisions of GASB Statements 67 and 68 was issued in June 2015. This Statement extends the approach to accounting and financial reporting established in Statement No. 68 to all pensions, with modifications as necessary. It also requires similar disclosures as Statement No. 68, as well as clarifying certain provisions of Statements No. 67 and No. 68. Various provisions of this Statement are effective for fiscal years beginning after June 15, 2016 and fiscal years beginning after June 15, 2015. Earlier application is encouraged. The University is currently evaluating the financial statement impact of this Statement.
Statement No. 74, Financial Reporting for Postemployment Benefit Plans Other Than Pension Plans was issued in June 2015. This Statement improves financial reporting through enhanced note disclosures and schedules of required supplementary information that will be presented by other postemployment benefit (OPEB) plans that are administered through trusts that meet the specified criteria. It is effective for financial statements for fiscal years beginning after June 15, 2016. Earlier application is encouraged. The University does not believe the adoption of this Statement will have an effect on the University’s financial statements.
Statement No. 75, Accounting and Financial Reporting for Postemployment Benefits Other Than Pensions was issued in June 2015. This Statement addresses accounting and financial reporting for other postemployment benefits (OPEB) that is provided to the employees of state and local governmental employers. It establishes standards for recognizing and measuring liabilities, deferred outflows of resources, deferred inflows of resources, and expense/expenditures. This Statement is effective for fiscal years beginning after June 15, 2017. Earlier application is encouraged. The University is currently evaluating the financial statement impact of this Statement, but expects it will record a material liability and a material reduction of its unrestricted net position upon adoption.
Statement No. 76, The Hierarchy of Generally Accepted Accounting Principles for State and Local Governments, was issued in June 2015. This Statement identifies the hierarchy of generally accepted accounting principles (GAAP) in the context of the current governmental financial reporting environment. The requirements of this Statement are effective for financial statements for periods beginning after June 15, 2015, and should be applied retroactively. Earlier application is permitted. The University does not believe the adoption of this Statement will have an effect on the University’s financial statements.
Statement No. 77, Tax Abatement Disclosures, was issued in August 2015. This Statement requires governments that enter into tax abatement agreements to disclose information about a reporting government’s own tax abatement agreements and those that are entered into by other governments that reduce the reporting government’s tax revenues. This Statement is effective for financial statements for periods beginning after December 15, 2015. Earlier

Aub
urn U
nive
rsity
201
5
64
application is encouraged. The University does not believe the adoption of this Statement will have an effect on the University’s financial statements.
Statement No. 78, Pensions Provided through Certain Multiple-Employer Defined Benefit Pension Plans was issued in December 2015. This Statement addresses the scope and applicability of Statement No. 68, Accounting and Financial Reporting for Pensions, regarding pensions provided through certain multiple-employer defined benefit pension plans and to state and local governmental employers whose employees are provided with such pensions. This Statement amends the scope of Statement No. 68 to exclude pensions provided to employees of state or local governmental employers through a cost-sharing multiple-employer defined benefit pension plan that meets certain criteria. This Statement establishes requirements for recognition and measurement of pension
expense, expenditures, and liabilities; note disclosures; and required supplementary information for pensions that qualify. This Statement is effective for periods beginning after December 15, 2015. Earlier application is encouraged. The University is currently evaluating the financial statement impact of this Statement.
Statement No. 79, Certain External Investment Pools and Pool Participants was issued in December 2015. This Statement establishes criteria for an external investment pool to qualify for making the election to measure all of its investments at amortized cost for financial reporting purposes. This Statement is effective for periods beginning after June 15, 2015, except for certain provisions which are effective for periods beginning after December 15, 2015. Earlier application is encouraged. The University is currently evaluating the financial statement impact of this Statement.

Aub
urn U
nive
rsity
201
5
65
unaudited diviSional Financial StatementS
2015Financial RepoRt

Aub
urn U
nive
rsity
201
5
66
AUBURN UNIVERSITY MAIN CAMPUSSTATEMENTS OF NET POSITIONSEPTEMBER 30, 2015 AND 2014
(UNAUDITED)
2015 2014ASSETS Current assets Cash and cash equivalents $ 68,821,235 $ 125,604,475 Operating investments 27,178,364 41,297,322 Accounts receivable, net 32,055,211 27,242,291 Student accounts receivable, net 36,467,532 33,145,907 Loans receivable, net 2,572,573 2,211,440 Accrued interest receivable 1,938,842 1,630,504 Inventories 4,213,700 4,097,851 Prepaid expenses 34,064,117 33,795,828 Due from other funds 2,406,951 2,235,269 Total current assets 209,718,525 271,260,887
Noncurrent assets Investments 902,116,832 771,856,321 Loans receivable, net 14,692,389 14,592,344 Investment in plant, net 1,463,430,749 1,453,016,865 Due from other funds 82,442,895 85,445,167 Total noncurrent assets 2,462,682,865 2,324,910,697 Total assets 2,672,401,390 2,596,171,584
DEFERRED OUTFLOWS OF RESOURCES Loss on refunding of bonds 26,953,797 14,442,185 Pension 38,653,673 - Total deferred outflows 65,607,470 14,442,185
LIABILITIES Current liabilities Accounts payable 47,578,448 52,149,329 Accrued salaries and wages 2,797,001 2,392,583 Accrued compensated absences 14,307,037 13,524,987 Accrued interest payable 11,673,228 12,292,550 Other accrued liabilities 5,449,261 8,344,327 Student deposits 2,861,091 3,055,404 Deposits held in custody 17,756,095 17,072,353 Unearned revenues 183,535,075 164,678,248 Noncurrent liabilities-current portion 30,123,504 28,490,201 Total current liabilities 316,080,740 301,999,982
Noncurrent liabilities Bonds and notes payable 699,429,916 715,648,582 Pension and OPEB 413,958,118 1,516,687 Other noncurrent liabilities 21,345,126 18,592,502 Due to other funds 30,141,027 29,686,099 Total noncurrent liabilities 1,164,874,187 765,443,870 Total liabilities 1,480,954,927 1,067,443,852
DEFERRED INFLOWS OF RESOURCES Nonexchange transactions 206,159 435,203 Pension 30,598,950 - Total deferred inflows 30,805,109 435,203
NET POSITION Net investment in capital assets 841,292,331 809,019,729 Restricted Nonexpendable 23,358,934 23,033,149 Expendable: Scholarships, research, instruction, other 134,927,075 120,114,872 Loans 4,816,755 4,656,696 Capital projects 4,189,871 5,044,973 Unrestricted 217,663,858 580,865,295 Total net position $ 1,226,248,824 $ 1,542,734,714

Aub
urn U
nive
rsity
201
5
67
AUBURN UNIVERSITY MAIN CAMPUSSTATEMENTS OF REVENUES, EXPENSES AND CHANGES IN NET POSITION
FOR THE YEARS ENDED SEPTEMBER 30, 2015 AND 2014(UNAUDITED)
2015 2014OPERATING REVENUES Tuition and fees, net of scholarship allowances of $94,987,834 and $97,464,758, respectively $ 363,014,113 $ 332,881,008 Federal appropriations 11,862 32,530 Federal grants & contracts, net 39,330,538 40,087,116 State & local grants & contracts, net 5,851,882 6,179,301 Nongovernmental grants & contracts, net 7,167,885 7,766,178 Sales & services of educational departments 38,603,615 35,819,007 Auxiliary revenue, net of scholarship allowances of $6,831,990 and $6,113,436, respectively 127,982,301 115,517,549 Other operating revenues 21,394,650 19,754,148 Total operating revenues 603,356,846 558,036,837 OPERATING EXPENSES Compensation & benefits 467,516,874 449,353,647 Scholarships & fellowships 17,475,015 19,255,298 Utilities 20,293,775 20,937,454 Other supplies & services 168,970,789 172,352,784 Depreciation 69,467,894 66,983,139 Total operating expenses 743,724,347 728,882,322
Operating loss (140,367,501) (170,845,485)
NONOPERATING REVENUES (EXPENSES) State appropriations 160,159,715 158,179,798 Gifts 40,677,175 32,617,505 Grants 14,489,928 14,032,340 Net investment income 25,034,984 36,544,858 Interest expense on capital debt (16,230,536) (13,074,828) Nonoperating revenues, net 224,131,266 228,299,673
Income before other changes in net position 83,763,765 57,454,188
OTHER CHANGES IN NET POSITION Capital appropriations - 16,585 Capital gifts & grants 4,816,181 3,722,074 Additions to permanent endowments 325,785 453,849 Net increase in net position 88,905,731 61,646,696
Net position - beginning of year 1,542,734,714 1,481,088,018 Cumulative effect of accounting change (405,391,621)Net position October 1, 2014, as restated 1,137,343,093Net position - end of year $ 1,226,248,824 $ 1,542,734,714

Aub
urn U
nive
rsity
201
5
68
AUBURN UNIVERSITY AT MONTGOMERYSTATEMENTS OF NET POSITIONSEPTEMBER 30, 2015 AND 2014
(UNAUDITED)
2015 2014ASSETS Current assets Cash and cash equivalents $ 900,252 $ 2,486,082 Operating investments 355,521 817,395 Accounts receivable, net 2,735,684 1,684,642 Student accounts receivable, net 4,799,512 4,200,755 Loans receivable, net 396,504 344,551 Accrued interest receivable 199,316 183,844 Inventories 647,423 502,055 Prepaid expenses 1,976,802 1,440,133 Total current assets 12,011,014 11,659,457
Noncurrent assets Investments 11,800,614 15,277,306 Loans receivable, net 2,348,629 2,524,207 Investment in plant, net 96,762,901 97,127,433 Due from other funds 30,141,027 29,686,099 Total noncurrent assets 141,053,171 144,615,045 Total assets 153,064,185 156,274,502
DEFERRED OUTFLOWS OF RESOURCES Pension 4,500,039 - Total deferred outflows 4,500,039 -
LIABILITIES Current liabilities Accounts payable 3,397,149 1,799,074 Accrued salaries and wages 274,375 251,070 Accrued compensated absences 1,429,342 1,543,202 Accrued interest payable 4,750 6,025 Student deposits 5,148 13,088 Deposits held in custody 2,366,694 2,820,596 Unearned revenues 13,473,898 12,480,486 Noncurrent liabilities-current portion 130,000 327,651 Due to other funds 2,406,951 2,235,269 Total current liabilities 23,488,307 21,476,461
Noncurrent liabilities Bonds and notes payable 410,000 540,000 Pension and OPEB 48,341,795 275,500 Due to other funds 82,442,895 85,445,167 Total noncurrent liabilities 131,194,690 86,260,667 Total liabilities 154,682,997 107,737,128
DEFERRED INFLOWS OF RESOURCES Pension 3,531,767 - Total deferred inflows 3,531,767 -
NET POSITION Net investment in capital assets 14,406,481 12,500,626 Restricted Nonexpendable 5,178,925 5,143,372 Expendable: Scholarships, research, instruction, other 25,695,622 25,326,481 Loans 354,309 356,854 Capital projects 165,500 138,500 Unrestricted (46,451,377) 5,071,541 Total net position $ (650,540) $ 48,537,374

Aub
urn U
nive
rsity
201
5
69
AUBURN UNIVERSITY AT MONTGOMERYSTATEMENTS OF REVENUES, EXPENSES AND CHANGES IN NET POSITION
FOR THE YEARS ENDED SEPTEMBER 30, 2015 AND 2014(UNAUDITED)
2015 2014OPERATING REVENUES Tuition and fees, net of scholarship allowances of $9,867,634 and $10,230,725 respectively $ 32,598,385 $ 33,065,804 Federal grants & contracts, net 1,313,539 2,149,692 State & local grants & contracts, net 8,379,124 6,460,315 Nongovernmental grants & contracts, net 829,794 672,311 Sales & services of educational departments 2,459,819 2,620,387 Auxiliary revenue, net of scholarship allowances of $1,281,781 and $927,675, respectively 8,327,468 7,883,759 Other operating revenues 1,760,537 1,190,159 Total operating revenues 55,668,666 54,042,427
OPERATING EXPENSES Compensation & benefits 52,183,458 51,802,596 Scholarships & fellowships 3,165,279 3,319,104 Utilities 3,011,480 3,884,201 Other supplies & services 25,406,056 22,175,617 Depreciation 4,829,546 4,812,474 Total operating expenses 88,595,819 85,993,992
Operating loss (32,927,153) (31,951,565)
NONOPERATING REVENUES (EXPENSES) State appropriations 22,663,801 22,557,727 Gifts 771,808 838,122 Grants 8,130,437 8,005,304 Net investment income 1,689,236 1,626,894 Interest expense on capital debt (2,366,596) (2,360,670) Nonoperating revenues, net 30,888,686 30,667,377
Loss before other changes in net position (2,038,467) (1,284,188)
OTHER CHANGES IN NET POSITION Capital gifts & grants 13,138 7,858 Additions to permanent endowments 35,553 26,109 Net decrease in net position (1,989,776) (1,250,221)
Net position - beginning of year 48,537,374 49,787,595 Cumulative effect of accounting change (47,198,138)Net position October 1, 2014, as restated 1,339,236Net position - end of year $ (650,540) $ 48,537,374

Aub
urn U
nive
rsity
201
5
70
ALABAMA AGRICULTURAL EXPERIMENT STATIONSTATEMENTS OF NET POSITIONSEPTEMBER 30, 2015 AND 2014
(UNAUDITED)
2015 2014ASSETS Current assets Cash and cash equivalents $ 2,783,724 $ 5,165,128 Operating investments 1,099,327 1,698,235 Accounts receivable, net 6,877,079 5,615,828 Total current assets 10,760,130 12,479,191
Noncurrent assets Investments 36,489,381 31,740,403 Total noncurrent assets 36,489,381 31,740,403 Total assets 47,249,511 44,219,594
DEFERRED OUTFLOWS OF RESOURCES Pension 2,986,519 - Total deferred outflows 2,986,519 -
LIABILITIES Current liabilities Accounts payable 1,130,076 1,081,597 Accrued salaries and wages 190,318 169,738 Accrued compensated absences 1,387,732 1,383,110 Deposits held in custody 10,300 7,300 Unearned revenues 1,996,448 6,774,223 Total current liabilities 4,714,874 9,415,968
Noncurrent liabilities Pension and OPEB 31,962,450 99,616 Total noncurrent liabilities 31,962,450 99,616 Total liabilities 36,677,324 9,515,584
DEFERRED INFLOWS OF RESOURCES Pension 2,353,883 - Total deferred inflows 2,353,883 -
NET POSITION Restricted Expendable: Scholarships, research, instruction, other 2,295,759 1,721,874 Unrestricted 8,909,064 32,982,136 Total net position $ 11,204,823 $ 34,704,010

Aub
urn U
nive
rsity
201
5
71
ALABAMA AGRICULTURAL EXPERIMENT STATIONSTATEMENTS OF REVENUES, EXPENSES AND CHANGES IN NET POSITION
FOR THE YEARS ENDED SEPTEMBER 30, 2015 AND 2014(UNAUDITED)
2015 2014OPERATING REVENUES Federal appropriations $ 5,769,974 $ 5,421,381 Federal grants & contracts 18,243,737 17,014,302 State & local grants & contracts 1,356,817 1,009,437 Nongovernmental grants & contracts 5,720,837 5,844,017 Sales & services of educational departments 2,818,882 3,223,980 Other operating revenues 5,321,229 709,004 Total operating revenues 39,231,476 33,222,121
OPERATING EXPENSES Compensation & benefits 37,440,277 37,292,011 Scholarships & fellowships 99,504 76,675 Utilities 1,054,253 1,023,094 Other supplies & services 26,061,086 24,510,519 Total operating expenses 64,655,120 62,902,299
Operating loss (25,423,644) (29,680,178)
NONOPERATING REVENUES State appropriations 30,634,258 30,422,954 Gifts 2,280,836 3,095,561 Net investment income 328,432 278,707 Nonoperating revenues, net 33,243,526 33,797,222
Net increase in net position 7,819,882 4,117,044
Net position - beginning of year 34,704,010 30,586,966 Cumulative effect of accounting change (31,319,069)Net position October 1, 2014, as restated 3,384,941Net position - end of year $ 11,204,823 $ 34,704,010

Aub
urn U
nive
rsity
201
5
72
ALABAMA COOPERATIVE EXTENSION SYSTEMSTATEMENTS OF NET POSITIONSEPTEMBER 30, 2015 AND 2014
(UNAUDITED)
2015 2014ASSETS Current assets Cash and cash equivalents $ 2,164,778 $ 4,133,280 Operating investments 854,898 1,358,976 Accounts receivable, net 3,595,230 2,752,295 Total current assets 6,614,906 8,244,551
Noncurrent assets Investments 28,376,166 25,399,561 Total noncurrent assets 28,376,166 25,399,561 Total assets 34,991,072 33,644,112
DEFERRED OUTFLOWS OF RESOURCES Pension 7,089,695 - Total deferred outflows 7,089,695 -
LIABILITIES Current liabilities Accounts payable 603,824 640,506 Accrued salaries and wages 240,178 212,081 Accrued compensated absences 1,899,465 1,896,066 Unearned revenues 546,424 376,407 Total current liabilities 3,289,891 3,125,060
Noncurrent liabilities Pension and OPEB 94,177,176 14,340,715 Total noncurrent liabilities 94,177,176 14,340,715 Total liabilities 97,467,067 17,465,775
DEFERRED INFLOWS OF RESOURCES Pension 2,822,730 - Total deferred inflows 2,822,730 -
NET POSITION Restricted Expendable: Scholarships, research, instruction, other 5,014,759 4,768,497 Capital projects 23,551 37,133 Unrestricted (63,247,340) 11,372,707 Total net position $ (58,209,030) $ 16,178,337

Aub
urn U
nive
rsity
201
5
73
ALABAMA COOPERATIVE EXTENSION SYSTEMSTATEMENTS OF REVENUES, EXPENSES AND CHANGES IN NET POSITION
FOR THE YEARS ENDED SEPTEMBER 30, 2015 AND 2014(UNAUDITED)
2015 2014OPERATING REVENUES Federal appropriations $ 8,522,178 $ 7,434,153 Federal grants & contracts 6,309,975 6,229,619 State & local grants & contracts 2,549,521 2,376,831 Nongovernmental grants & contracts 814,884 588,806 Sales & services of educational departments 511,260 408,668 Other operating revenue 1,550,143 1,569,690 Total operating revenues 20,257,961 18,607,767 OPERATING EXPENSES Compensation & benefits 41,264,326 39,794,600 Scholarships & fellowships 121 - Utilities 160,828 159,087 Other supplies & services 11,121,717 10,565,137 Total operating expenses 52,546,992 50,518,824
Operating loss (32,289,031) (31,911,057)
NONOPERATING REVENUES State appropriations 32,044,401 31,821,552 Gifts 133,105 71,158 Net investment income 389,228 393,090 Nonoperating revenues, net 32,566,734 32,285,800
Net increase in net position 277,703 374,743
Net position - beginning of year 16,178,337 15,803,594 Cumulative effect of accounting change (74,665,070)Net position October 1, 2014, as restated (58,486,733)Net position - end of year $ (58,209,030) $ 16,178,337

Aub
urn U
nive
rsity
201
5
74

Aub
urn U
nive
rsity
201
5
75
RequiRed Supplemental inFoRmation
2015Financial RepoRt

Aub
urn U
nive
rsity
201
5
76
REQUIRED SUPPLEMENTAL INFORMATION:Teachers’ Retirement System Schedule of Proportionate Share of Collective Net Pension Liability
2015
University’s proportion of the collective net pension liability 5.757899% University’s proportionate share of the collective net pension liability $ 523,080,000 University’s covered-employee payroll during the measurement period* $ 368,745,049 University’s proportionate share of the collective net pension liability as a percentage of its covered-employee payroll 141.85%Plan fiduciary net position as a percentage of the total collective pension liability 71.01%
*University’s covered-employee payroll during the measurement period is the total payroll paid to covered employees (not just pensionable payroll). For fiscal year 2015, the measurement period is October 1, 2013 - September 30, 2014.
Teachers’ Retirement System Schedule of System Contributions
2015
Contractually Required Contribution $ 42,534,706 Contributions in relation to the contractually required contribution 42,534,706 Contribution deficiency (excess) $ -
System covered-employee payroll $ 380,477,086
Contributions as a percentage of covered-employee payroll 11.18%
Employees’ Retirement System Schedule of System Contributions
2014
Total pension liabilityService cost $ 104,069 Interest 3,800,103Changes of benefit terms - Differences between expected and actual experience -Changes of assumptions -Benefit payments, including refunds of employee contributions (5,334,993)Net change in total pension liability $ (1,430,821)Total pension liability - beginning 50,168,786Total pension liability - ending (a) $ 48,737,965
Plan fiduciary net positionContributions - employer $ 1,790,336Contributions - member 125,268Net investment income 331,362Benefits payments, including refunds of employee contributions (5,334,993)Transfers among employers -Net change in plan fiduciary net position $ (3,088,027)Plan net position - beginning 4,471,552Plan net position - ending (b) $ 1,383,525
Net pension liability - ending (a)-(b) $ 47,354,440
Plan fiduciary net position as a percentage of total pension liability 2.84%
Covered-employee payroll* $ 3,341,010
Net pension liability as a percentage of covered-employee payroll 1,417.37%
*Employer’s covered-payroll during the measurement period is the total payroll paid to covered employees (not just pensionable payroll). For fiscal year 2014, the measurement period is October 1, 2013 - September 30, 2014.

Aub
urn U
nive
rsity
201
5
77
Employees’ Retirement System Schedule of Employer Contributions
Actuarially determined contribution* $ 4,151,926Contributions in relation to the actuarially determined contribution 4,151,926Contribution deficiency (excess) $ -
Covered-employee payroll** $ 2,775,630
Contributions as a percentage of covered-employee payroll 149.85%
*Amount of employer contributions related to normal and accrued liability components of employer rate net of any refunds or error service payments. For fiscal year 2015, the fiscal year is the twelve month period beginning after June 15, 2014 (October 1, 2014 - September 30, 2015).
**Employer’s covered-payroll during fiscal year is the total payroll paid to covered employees (not just pensionable payroll). For fiscal year 2015, the fiscal year is the twelve month period beginning after June 15, 2014 (October 1, 2014 - September 30, 2015).
Notes to ScheduleActuarially determined contribution rates are calculated as of September 30, two years prior to the end of the fiscal year in which contributions are reported. Contributions for fiscal year 2015 were based on the September 30, 2012 actuarial valuation.
Methods and assumptions used to determine contribution rates:
Actuarial cost method: Entry Age
Amortization method: Level percent closed
Remaining amortization period: 10 years
Asset valuation method: Five year smooth market
Inflation: 3.00%
Salary increases: 3.75-7.25%, including inflation
Investment rate of return: 8.00%, net of pension plan investment expense, including inflation

Aub
urn U
nive
rsity
201
5
78
Other Postemployment Benefits
Determination of Annual Required Contribution (ARC) and End of Year Accrual
Cost Element Fiscal Year Ended September 30, 2015
Amount Percent of Payroll1
1. Unfunded actuarial accrued liability at October 1, 2014 $ 68,027,346 3,102.8%
Annual Required Contribution (ARC) 2. Normal cost $ - 3. Amortization of the unfunded actuarial accrued liability over 15 years using level dollar amortization 5,229,775 4. Annual Required Contribution (ARC = 2 + 3) $ 5,229,775 238.5% Annual OPEB Cost (Expense) 5. ARC $ 5,229,775 6. Interest on beginning of year accrual 324,650 7. Adjustment to ARC (1,238,533) 8. Fiscal year 2015 OPEB cost (5 + 6 + 7) $ 4,315,892 196.9%
End of Year Accrual (Net OPEB Obligation)2
9. Beginning of year accrual 1 $ 16,232,518 10. Annual OPEB cost 4,315,892 11. Employer contribution (benefit payments)2 (2,543,312)12. End of year CAFR accrual (9 + 10 + 11)2 $ 18,005,098 821.2%
1 Annual payroll for 24 participants as of September 30, 2015, was $2,192,470.2 Actual amounts paid in fiscal year 2015 include claim costs, administrative fees, and PEEHIP subsidy less participant contributions.
Three Year Schedule of Percentage of OPEB Cost Contributed
Fiscal YearEnded
Annual OPEBCost
Percentage of OPEBCost Contributed3
Net OPEBObligation
September 30, 2013 $ 3,810,309 65.1% $ 14,564,112 September 30, 2014 $ 4,172,525 60.0% $ 16,232,518 September 30, 2015 $ 4,315,892 58.9% $ 18,005,098
3 Cost Contributed is shown in the “Determination of Annual Required contribution and End of Year Accrual.” Summary of Key Actuarial Methods and Assumptions
Valuation year October 1, 2014 – September 30, 2015
Actuarial cost method Unit Credit, Actuarial Cost Method
Amortization method 15 years, level dollar open amortization4
Asset valuation method Not applicable
Discount rate 2.0%
Projected payroll growth rate Not applicable
Health care cost trend rate formedical and prescription drugs 9.0% in fiscal year 2016, decreasing by one-half percentage point per year to an ultimate of 5.0% in fiscal year 2024 and later.
4 Open amortization means a fresh-start each year for the cumulative unrecognized amount.

Aub
urn U
nive
rsity
201
5
79
Valuation Date October 1, 2014
Monthly Per Capita Claim CostsAge Medical55 $734 60 $880 65 $357 70 $396 75 $422
Claim costs remained unchanged from last year based on a weighted average of benefit plan premiums. Future claim costs are increased by health care cost trend.
Retiree Premiums Non-smoking retirees contribute 40%, surviving spouses and retires who decline to participate pay 100%, and smokers pay an additional $20 of the monthly premiums shown below: As of 1/1/15 As of 1/1/14 Pre-65 Single $481 $472 Pre-65 Family $1,083 $1,062 Post-65 Single $156 $142 Post-65 Family $757 $742
Note: There are several other categories of premiums.
Administrative Expenses Included in claim cost.
Assumed Health Care Trend Rate Medical and Fiscal Rx Combined Year Rate 2016 9.0% 2017 8.5% 2018 8.0% 2019 7.5% 2020 7.0% 2021 6.5% 2022 6.0% 2023 5.5% 2024+ 5.0%
Spouse Age Difference Husbands are assumed to be three years older than wives for current and future retirees who are married. Mortality RP-2014 Combined Mortality Fully Generational Projected using Projection Scale MP=2014. Participation Rates 100% of active employees are assumed to elect postretirement health insurance coverage upon retirement.
Retirement Rates Employees are assumed to retire according to the following schedule:
Age Retirement Rate 45 or less 0% 46 - 49 1% 50 - 51 2% 52 - 54 3% 55 10% 56 - 59 8% 60 20% 61 15% 62 25% 63 - 64 20% 65 40% 66 - 69 30% 70 - 74 75% 75+ 100%

Aub
urn U
nive
rsity
201
5
80
Withdrawal Rates None assumed since all are long service Civil Service employees. Disability Rates Sample rates are shown below, percent assumed to terminate within one year:
Age Male Female 25 0.06% 0.09% 30 0.08% 0.12% 35 0.17% 0.24% 40 0.30% 0.41% 45 0.54% 0.65% 50 0.98% 0.98% 55 1.50% 1.50%
Impact of Healthcare Reform The provisions of Healthcare Reform are expected to increase costs by 4.3% on a discounted basis. The unlimited lifetime maximum, removal of limitations on preventive care and coverage of eligible dependents to age 26 are reflected in the claim costs. The Cadillac Plan excise tax is expected to increase costs by $5.5 million. There is not any cost impact for retirees who have elected PEEHIP.
Schedule of Employer Contributions
Fiscal YearEnded
Annual RequiredContribution
EmployerContribution
PercentageContributed
September 30, 2013 $ 4,555,416 $ 2,480,884 54.5%September 30, 2014 $ 4,992,477 $ 2,504,119 50.2%September 30, 2015 $ 5,229,775 $ 2,543,312 48.6%
Schedule of Funding Progress
Fiscal YearEnded
Actuarial Value of Assets
(a)
Actuarial Accrued Liability
(AAL)(b)
Unfunded (Overfunded) AAL (UAAL)
(b)-(a)Funded Ratio
(a)/(b)Covered Payroll
(c)
UAAL as a Percentage of
Covered Payroll [(b)-(a)/(c )]
September 30, 2013 - $ 58,200,833 $ 58,200,833 0.0% $ 3,942,432 1476.3%September 30, 2014 - $ 64,259,009 $ 64,259,009 0.0% $ 3,061,830 2098.7%September 30, 2015 - $ 68,027,346 $ 68,027,346 0.0% $ 2,192,470 3102.8%

Aub
urn U
nive
rsity
201
5
81
Auburn University is governed by a Board of Trustees consisting of one member from each congressional district, as these districts were constituted on January 1, 1961, one member from Lee County, three at-large members, all of whom shall be residents of the continental United States, and the Governor, who is ex-officio. The Governor is the President of the Board of Trustees. Prior to 2003, trustees were appointed by the Governor, by and with the consent of the State Senate, for a term of 12 years. Any new trustees will be appointed by a committee, by and with the consent of the State Senate, for a term of seven years, and may serve no more than two full seven-year terms. A member may continue to serve until a successor is confirmed, but in no case for more than one year after the completion of a term. Members of the board receive no compensation. By executive order of the Governor in 1971, two non-voting student representatives selected by the student body serve as members ex-officio, one from the Auburn campus and one from the Montgomery campus.
AUBURN UNIVERSITY BOARD OF TRUSTEES
B.T. RobertsMobile, First
Congressional District
James W. RaneAbbeville, Third
Congressional District
Bob DumasAuburn, Third
Congressional District
Elizabeth HuntleyClanton, Sixth
Congressional District
Charles D. McCraryAt-Large Member
President Pro Tempore
Wayne T. SmithAt-Large Member
Raymond J. HarbertAt-Large Member
Sarah B. NewtonFayette, Seventh
Congressional District
Michael A. DeMaioribusHuntsville, Eighth
Congressional District
Robert BentleyGovernor of Alabama
President, Montgomery
James PrattBirmingham, Ninth
Congressional District
D. Gaines LanierLanett, Fifth
Congressional District
Jimmy SanfordPrattville, Fourth
Congressional District
Clark SahlieMontgomery, SecondCongressional District

Aub
urn U
nive
rsity
201
5
82
This page is intentionally left blank.