FINANCIAL PHYSICS - Crestmont Research · This presentation introduces Crestmont’s core...
24
FINANCIAL PHYSICS “Financial Physics represents the interconnected relationships among key elements in the economy and the financial markets that determine the stock market’s overall direction.” Copyright 2003-2018, Crestmont Research (www.CrestmontResearch.com)
Transcript of FINANCIAL PHYSICS - Crestmont Research · This presentation introduces Crestmont’s core...

FINANCIAL PHYSICS
“Financial Physics represents theinterconnected relationships among key elements
in the economy and the financial marketsthat determine the stock market’s overall direction.”
Copyright 2003-2018, Crestmont Research (www.CrestmontResearch.com)

PREFACE
This presentation introduces Crestmont’s core "Financial Physics" model.The model represents a framework to understand the relationship of theeconomy ('the source of wealth') and the equity markets ('the measure ofequity wealth').
This presentation, although abbreviated and presented in slides, is intendedto be self-explanatory. A more descriptive presentation and discussion ofthe material is included in chapters 7 and 8 of Unexpected Returns:Understanding Secular Stock Market Cycles and chapters 3—7 of ProbableOutcomes: Secular Stock Market Insights, both books by Ed Easterling. Formore information about implications of Financial Physics for the nextdecade, please contact [email protected].
In summary, the key factors include Real GDP, Inflation, Nominal GDP,Earnings Per Share (EPS), and P/E Ratio. Since Real GDP has beenrelatively constant over extended periods of time and all other factors aredriven by inflation, a primary driver of the stock market is the inflationrate—as it trends toward or away from price stability. Given the currentstate of low inflation and the likelihood of it either rising (inflation) ordeclining (deflation), P/E ratios are expected to decline for a number ofyears. As P/E ratios decline and EPS grows, the result will be anotherrelatively non-directional secular bear market.

INTRODUCTION
Conventional Wisdom And Long-Term Studies OftenIgnore The Fundamental Factors That Drive Intermediate Stock Market Cycles
The S&P 500 Stock Index Started 1982 At 123; The 20-Year Treasury Bond Yielded 14.6%
By 1999, The S&P 500 Stock Index Reached 1,469; The 20-Year Treasury Bond Yielded 6.7%
The Secular Bull Market Was Driven By Fundamentals And Ultimately Accentuated By A Stock Market Bubble

INTRODUCTION (cont.)
The Preceding 16 Years (1966-1981) Were Also Driven By Fundamental Factors
Stocks Were Virtually Flat; Bond Yields Soared And Total Returns Were Disappointing
P/E Ratios Declined During The Secular Bear Market Starting In 1966 As Inflation Rose
Starting In 1982, The Inflation Cycle Reversed Thereby Starting A Secular Bull Market
During The Late 1990’s, An Infection Of Emotions And Other Factors Created A Stock Market Bubble

INTRODUCTION (cont.)
Real GDP Rose Equally During Both Secular Periods, Averaging Near 3% Annually
Earnings Per Share Rose By Over 300% During The Secular Bear Market (1966-1981), Similar To The Gains In The Secular Bull Market (1982-1999)
Regardless, The Stock Market Was Virtually Flat During The Secular Bear, Yet The Market Soared Dramatically During The Secular Bull
Stock Market Returns Were Affected By The P/E Cycle, Which Is Driven By Inflation Rate Trends

INTRODUCTION (cont.)
The Factors—Real GDP, Nominal GDP, Inflation, EPS, and P/E Ratios—Share An Interrelated Relationship That Crestmont Research Calls “Financial Physics”
This Presentation Will Explore The Consistency, Predictability, And Dependence For Each Of These Factors And Among The Factors
For Those Seeking To Understand The Potential Returns Available In The Stock Market In 5, 10, or 20 Years, The Financial Physics Model Provides The Framework To Determine Your Own Perspective

INTRODUCTION (cont.)
To Determine The Level Of The Stock Market In The Future, Estimates For Two Variables Are Needed: (1) Price/Earnings Ratio (“P/E”), The Price Of The Market Index Divided By Earnings Per Share, And(2) Earnings Per Share (“EPS”)
The Future Level Of The S&P 500 Stock Index Can Be Forecast By Multiplying The Estimated Future P/E Ratio For The S&P 500 Stock Index And The Estimated Future EPS For The S&P 500
When We Estimate The Future Stock Market Level, We Can Assess The Overall Investment Environment For Stocks Over 5, 10, or 20 Years

Stocks And Bonds Are Financial Assets That Often Are Not Correlated Month-To-Month, But Do Perform Similarly Over Longer Periods
During The 1960s & 1970s, Both Had Poor Returns; Yet During The 1980s & 1990s, Both Had Solid, Above-Average Returns

FINANCIAL PHYSICS
Regarding The Model Diagram On Slide 10: A Factor Is Considered ‘Given’ When It Tends To Be
Consistent Over Long Periods Of Time And Is Fundamentally Based Upon Underlying Factors; Prior To The 2000s, GDP-R Was Considered To Be Given, But It Is Now An “Uncertainty” Due To Significantly Lower Growth In the Past Decade
A Factor Is Considered “Driven” When It Is Directly Affected By Other Given Or Assumed Factors
A Factor Is Considered An “Uncertainty” When It Is Generally Unpredictable And Its Future Is Uncertain

FINANCIAL PHYSICS

REAL GDP
Annual Real GDP Averaged 3.3%
Most Decades Between 3.0%-4.5%
The ‘70s, ‘80s, & ‘90s: 3.2%, 3.0%, 3.2%
Real Gross Domestic Product (“GDP”) Represents The Absolute Level Of The Economy Before Inflation; Essentially The Revenues Of All Companies
Real GDP Growth Has Been Relatively Consistent Over The Past Century

Note: Real GDP for the decade of the 2000s was below 2%. Last decade’s GDP shift is generally unexplained. It is unlikely that this decade (the 2010s) will restore the trend average, yet recent policy changes shift the focus to the upcoming decade and whether it will restore the historical trend line growth rate.
SALES & EARNINGS
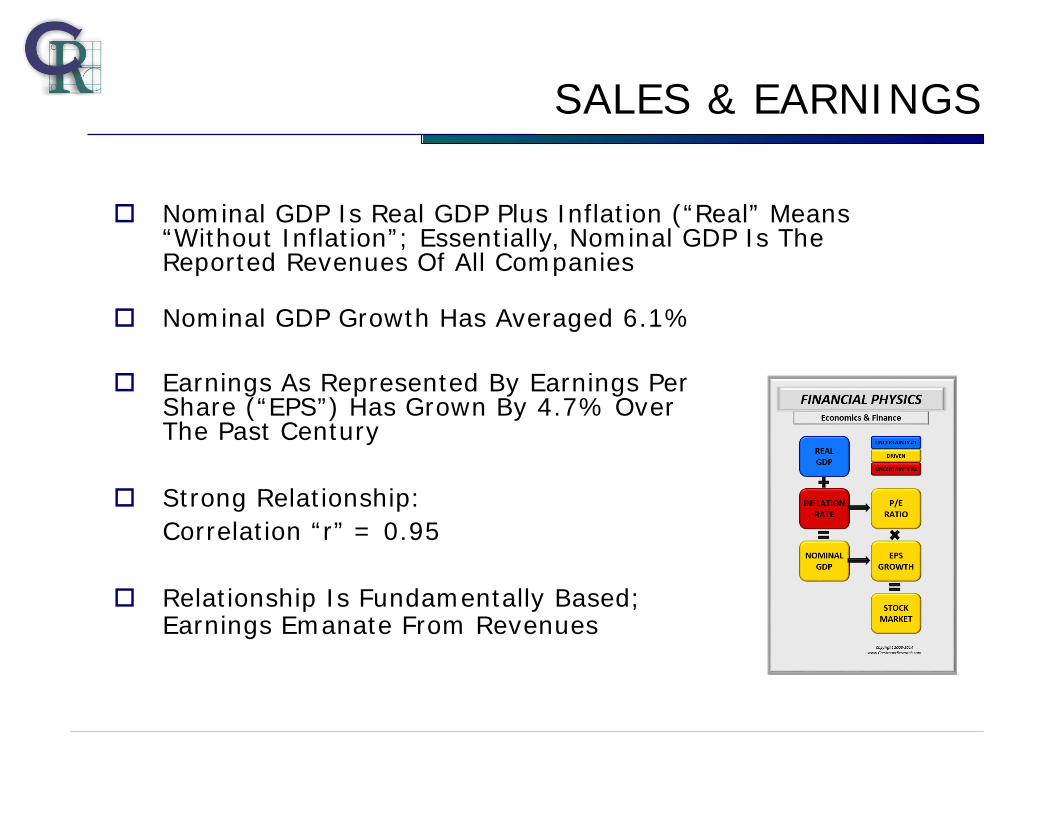
Earnings As Represented By Earnings Per Share (“EPS”) Has Grown By 4.7% Over The Past Century
Strong Relationship: Correlation “r” = 0.95
Relationship Is Fundamentally Based; Earnings Emanate From Revenues
Nominal GDP Is Real GDP Plus Inflation (“Real” Means “Without Inflation”; Essentially, Nominal GDP Is The Reported Revenues Of All Companies
Nominal GDP Growth Has Averaged 6.1%
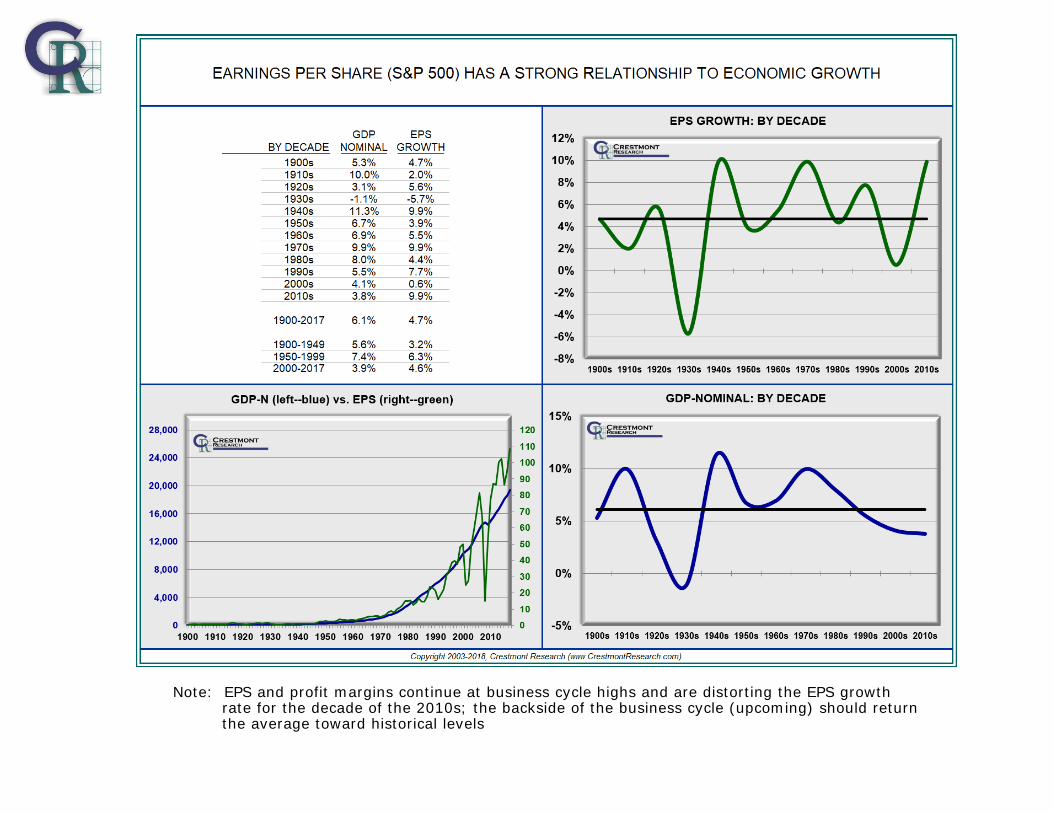
Note: EPS and profit margins continue at business cycle highs and are distorting the EPS growth rate for the decade of the 2010s; the backside of the business cycle (upcoming) should return the average toward historical levels

PREDICTING EPS
Since The Relationship Between GDP And EPS Is Strong And Fundamentally-Based, Estimates Of Future GDP Can Be Used To Determine Expected EPS
Despite The Uncertainty About Future GDP Growth, Future Growth Of Near 3% (A Midrange Value) Can Be Assumed To Estimate Future EPS Based Upon The Historical Average
A Regression Formula Can Be Developed To Use The Value Of GDP To Predict EPS
Historical Real GDP Growth Scenarios And Estimated Inflation Can Be Used To Predict Average Future Nominal GDP
The Estimated Future Nominal GDP Predicts A Gravity Line Around Which EPS Will Cycle Above And Below

Note: The EPS Prediction is the gravity line for historically consistent EPS; Actual EPS will cycle above and below the gravity line depending upon aggressive accounting, recessions, recoveries, etc.

RECAP
Economic Growth (GDP-Real), Excluding Inflation, Has Been Relatively Consistent Over Long Periods Of Time
EPS Is Relatively Consistent With Economic Growth Including Inflation (GDP-Nominal)
Extending Economic Growth (GDP-Nominal) Provides A Basis To Predict EPS

P/E RATIO
The Next Slide Reflects The Inconsistent Relationship Between Interest Rates And P/E Ratios Over The Past Century
In Addition, The Slide Reflects The Inconsistency Between Inflation And Interest Rates Over The Past Century
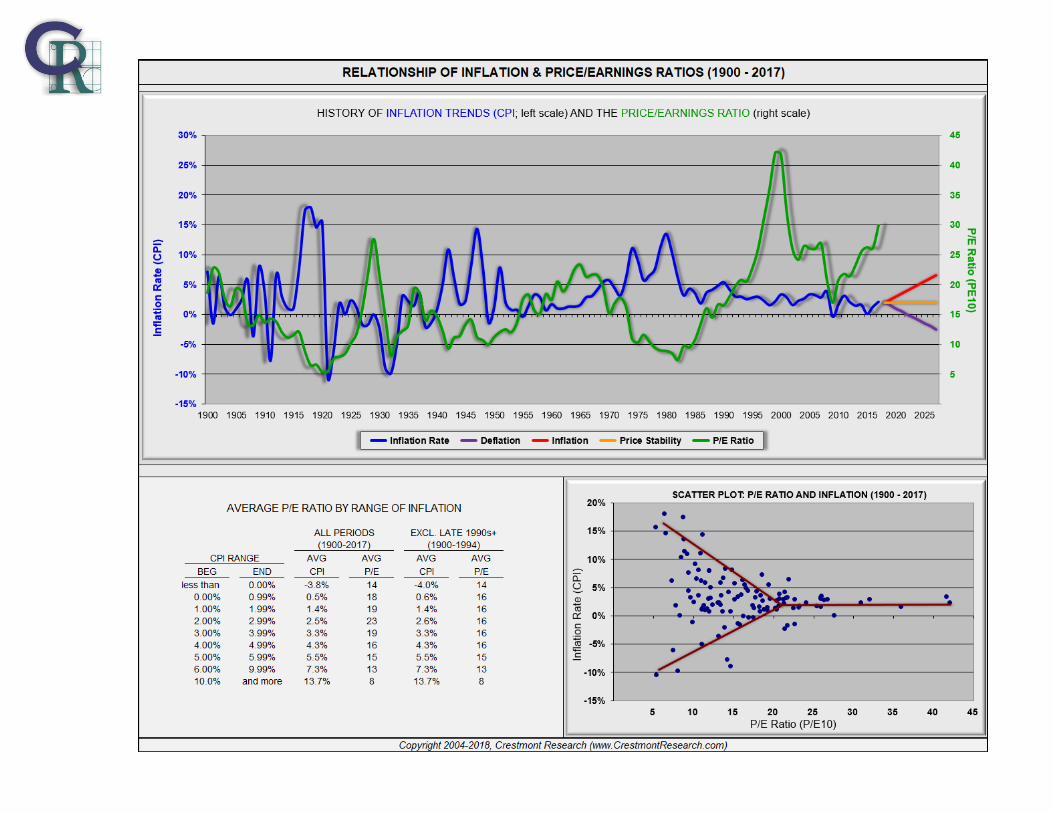
Contrary To Conventional Wisdom, P/E Ratios Are Not Driven By Interest Rates: P/E Ratios Are Driven By The Inflation Rate
Conventional Wisdom Implicitly Assumes Positive Inflation; Deflation Produces Low Interest Rates AND Low P/E Ratios Due To Expected Declines In Future Nominal Earnings (EPS)


P/E RATIO (cont.)
Slide 21 Reflects A Sideways “Y” Created By The Impact Of Rising Inflation Or Deflation On The P/E Ratio; A Fork Occurs As Inflation Departs From Price Stability
The Chart Indicates Future Trends In The Inflation Rate Are Likely To Drive P/E Ratios Lower
A Trend Toward Price Stability Increases P/E Ratios
Rising Inflation Decreases P/E’s; Deflation Decreases P/E’s
Crestmont Designates The Impact Of Inflation On P/E’s As The “Y Curve Effect”

RECAP
This Methodology Of Predicting EPS Trends Is Fundamentally-Based And Confirmed Historically
P/E Ratios Trend Based Upon Trends In The Inflation Rate Toward Or Away From Price Stability
Based Upon The Prediction Of EPS Into The Intermediate Future, An Investor Need Only A Perspective On Inflation To Determine The Return Environment Available In The Stock Market Over The Next 5, 10, Or 20 Years
From Current Low Levels Of Inflation, Increases Or Decreases In The Inflation Rate Are A Key Risk And Could Be Detrimental To P/E Ratios If Either Occurs

IMPLICATIONS
The Economy And Earnings Can Be Expected To Grow Over The Long-Term, Yet Cycle Over Shorter Periods
Relatively Low Inflation, If Sustained, Should Result In The Market P/E Ratio Near 20
The Direction And Level Of Inflation Is A Significant Driver Of Stock Market Returns Over The Longer-Term
Eight Secular Periods Driven By The Inflation And P/E Cycle Have Occurred Over The Past Century; Each Secular Cycle Has One Or More Shorter-Term Cyclical Cycles
Investment Strategies Are Significantly Different For Secular Bull And Secular Bear Markets

CONTACT INFORMATION
The Information In This Presentation Is Explained In Greater Detail In Both Books By Ed Easterling:
Unexpected Returns: Understanding Secular Stock Market Cycles
and Probable Outcomes:
Secular Stock Market Insights
Group Presentations, Individual Consultations, Or Coordinated Academic Research
Regarding This Presentation And Other Financial Market Perspectives Are Available.
Please Contact [email protected]