Financial Performance Q1FY22
12
© 2021 Coforge 1 © 2021 Coforge Financial Performance Q1FY22 July 28, 2021
Transcript of Financial Performance Q1FY22

© 2021 Coforge 1
© 2021 Coforge
Financial Performance Q1FY22July 28, 2021

© 2021 Coforge 22
Contents
▪ Financial Highlights
▪ Financial Statements• Income Statement• Balance Sheet
▪ Fact Sheet

© 2021 Coforge 3
Financial Highlights – Q1FY22
• On consolidated basis, Revenues for the quarter were $ 199.7 million and Rs 14,616 Million:
o Up 42.8% in dollar terms and 38.3% in rupee terms year-on-year.
o Up 16.0% in dollar terms and up 15.9% in rupee terms, sequentially.
• On an organic basis, Revenues for the quarter were $ 185.1 million and Rs 13,546 Million:
o Up 32.3% in dollar terms and 28.2% in rupee terms, year-on-year.
o Up 7.6% in dollar terms, 7.4% in rupee terms, and 7.0% in constant currency terms sequentially.
• EBITDA for the quarter, on a consolidated basis, up 34.8% year-on-year and 4.2% Q-on-Q.
• EBITDA margin (before ESOPs and acquisition related costs) for the quarter under review on a consolidated basis was
16.1%, reflecting the full impact of annual wage hikes rolled out across the organization worldwide with effect from April 1
as well as other expenses including visa costs and impact of transition in some of the material deals signed over the last six
months.
• PAT for the quarter, on a consolidated basis, increased 60.0% in dollar terms to $ 16.9 mn and 54.7% in rupee terms to Rs
1,236 mn, year-on-year.

© 2021 Coforge 4
INR Mn
Consolidated Income Statement – Q1FY22
Particulars Q1FY22 Q4FY21 QoQ% Q1FY21 YoY%
Revenues 14,616 12,615 15.9% 10,570 38.3%
Direct Costs 10,250 8,580 19.5% 7,241 41.6%
Gross Profit 4,366 4,035 8.2% 3,329 31.1%
GM% 29.9% 32.0% -211 Bps 31.5% -163 Bps
Selling / General And Administration 2,007 1,767 13.6% 1,523 31.8%
SG&A to Revenue % 13.7% 14.0% -28 Bps 14.4% -68 Bps
EBITDA 2,359 2,268 4.0% 1,806 30.6%
EBITDA% 16.1% 18.0% -184 Bps 17.1% -95 Bps
Acquisition related expenses 96 46 109.4% 0 NA
Cost of ESOPS 159 100 58.2% 120 32.3%
EBITDA (Post ESOPS) 2,104 2,122 -0.8% 1,686 24.8%
EBITDA% (Post ESOPS) 14.4% 16.8% -242 Bps 16.0% -156 Bps
Depreciation and Amortization 524 449 16.7% 465 12.7%
Other Income (net) 52 109 -52.7% 48 7.5%
Profit Before Tax (Before exceptional items) 1,632 1,782 -8.4% 1,269 28.6%
PBT % (Before exceptional items) 11.2% 14.1% -296 Bps 12.0% -84 Bps
Exceptional items 0 0 NA 180 NA
Profit Before Tax 1,632 1,782 -8.4% 1,089 49.8%
PBT % 11.2% 14.1% -296 Bps 10.3% 86 Bps
Provision for Tax 320 408 -21.6% 260 23.1%
Minority Interest 76 44 72.7% 30 153.3%
Profit After Tax (after Minority Int.) 1,236 1,330 -7.0% 799 54.7%
PAT% 8.5% 10.5% -208 Bps 7.6% 90 Bps
Basic EPS (INR) 20.4 21.9 -7.1% 12.8 59.0%

© 2021 Coforge 5
USD Mn
Consolidated Income Statement – Q1FY22
Particulars Q1FY22 Q4FY21 QoQ% Q1FY21 YoY%
Revenues 199.7 172.1 16.0% 139.9 42.8%
Direct Costs 140.1 117.1 19.6% 95.8 46.2%
Gross Profit 59.7 55.1 8.4% 44.1 35.4%
GM% 29.9% 32.0% -211 Bps 31.5% -163 Bps
Selling / General And Administration 27.4 24.1 13.7% 20.2 36.1%
SG&A to Revenue % 13.7% 14.0% -28 Bps 14.4% -68 Bps
EBITDA 32.2 30.9 4.2% 23.9 34.8%
EBITDA% 16.1% 18.0% -184 Bps 17.1% -95 Bps
Acquisition related expenses 1.3 0.6 NA 0.0 NA
Cost of ESOPS 2.2 1.4 58.1% 1.6 36.2%
EBITDA (Post ESOPS) 28.8 28.9 -0.7% 22.3 28.9%
EBITDA% (Post ESOPS) 14.4% 16.8% -242 Bps 16.0% -156 Bps
Depreciation and Amortization 7.2 6.1 16.6% 6.2 16.1%
Other Income (net) 0.7 1.5 -52.7% 0.6 10.6%
PBT (Before exceptional items) 22.3 24.3 -8.2% 16.8 32.8%
PBT % (Before exceptional items) 11.2% 14.1% -295 Bps 12.0% -84 Bps
Exceptional items 0.0 0.0 NA 2.4 NA
Profit Before Tax 22.3 24.3 -8.2% 14.4 54.9%
PBT % 11.2% 14.1% -295 Bps 10.3% 87 Bps
Provision for Tax 4.4 5.6 -21.6% 3.4 27.1%
Minority Interest 1.0 0.6 72.6% 0.4 160.7%
Profit After Tax (after Minority Int.) 16.9 18.1 -6.8% 10.6 60.0%
PAT% 8.5% 10.5% -207 Bps 7.6% 91 Bps

© 2021 Coforge 6
INR Mn
Balance Sheet
ParticularsAs at June 30
2021
As at Mar 31
2021
As at June 30
2020Particulars
As at June 30
2021
As at Mar 31
2021
As at June 30
2020
Equity 606 606 605 Fixed Assets 5,665 4,516 4,666
Reserves & Surplus 23,401 24,055 19,630 Capital Work in Progress 9 2 3
Intangible Assets 15,074 5,690 6,009
NET Worth 24,007 24,661 20,235 Current Assets
Cash and Cash Equivalent 3,017 8,391 5,457
Bank Borrowings 4,301 10 28 Debtors 10,890 8,895 8,353
Non Controlling Interest 899 0 0 Other Current Assets 8,299 6,092 4,756
Deferred Tax Liability 948 295 381 Current Liabilities -11,924 -9,460 -8,678
Future Acquisition Liability -2,890 -708 -1,351
Deferred Tax Assets 2,015 1,548 1,429
30,155 24,966 20,644 30,155 24,966 20,644

© 2021 Coforge 7
Financial Highlights for Q1FY22
139.9172.1
199.7
Q1FY21 Q4FY21 Q1FY22
10,57012,615
14,616
Q1FY22Q1FY21 Q4FY21
1,8062,268 2,359
Q4FY21Q1FY21 Q1FY22
Revenue ($ Mn) 16.0% QoQ 42.8% YoY Revenue (₹ Mn) 15.9% QoQ 38.3% YoY
EBITDA* (₹ Mn) 4.0% QoQ 30.6% YoY
23.930.9 32.2
Q1FY21 Q4FY21 Q1FY22
EBITDA* ($ Mn) 4.2% QoQ 34.8% YoY
* EBITDA excl. ESOPS and transaction related expenses
© 2021 Coforge 8
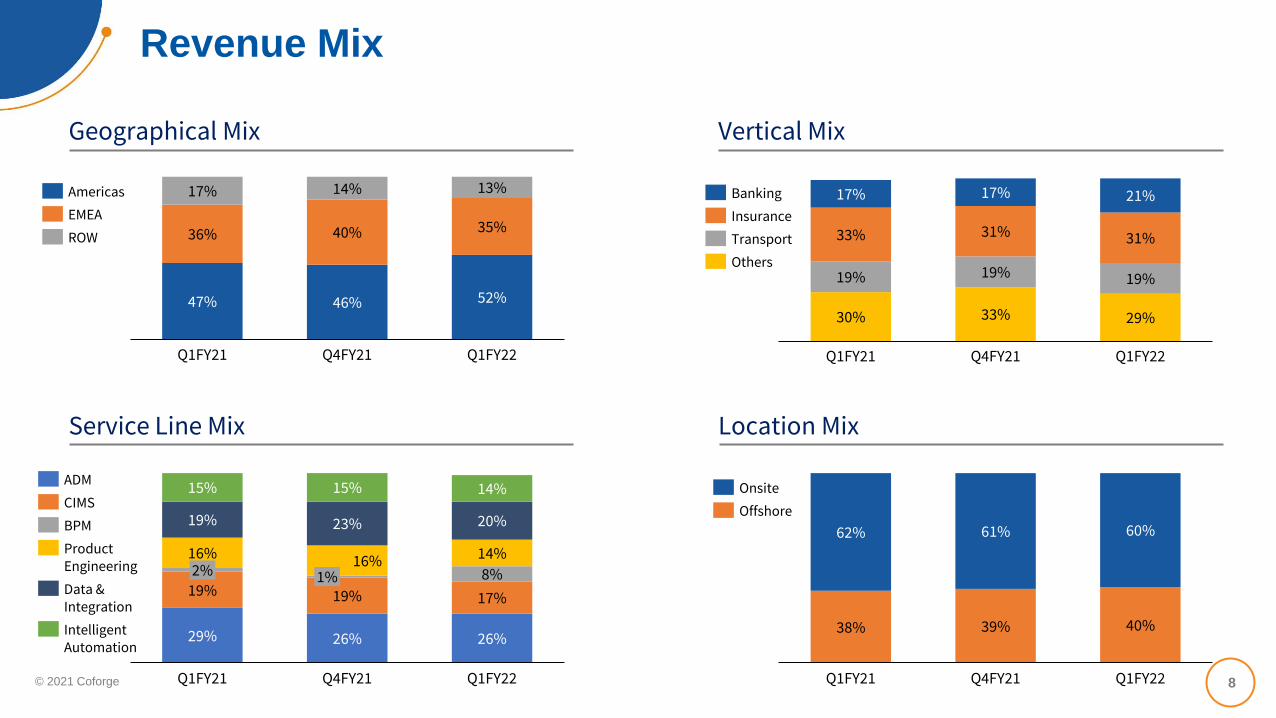
Revenue Mix
47% 46% 52%
36% 40% 35%
17% 14% 13%
Q1FY21 Q4FY21 Q1FY22
Geographical Mix Vertical Mix
Location MixService Line Mix
Americas
EMEA
ROW
30% 33% 29%
19% 19% 19%
33% 31% 31%
17% 17% 21%
Q1FY22Q1FY21 Q4FY21
Others
Transport
Insurance
Banking
29% 26% 26%
19% 19% 17%
8%
16% 16% 14%
19% 23% 20%
15% 15% 14%
Q1FY21 Q4FY21 Q1FY22
2% 1%
BPM
ADM
Product Engineering
CIMS
Data & Integration
Intelligent Automation
38% 39% 40%
62% 61% 60%
Q1FY22Q1FY21 Q4FY21
Onsite
Offshore

© 2021 Coforge 9
Key Client Metrics
85 11946
7065 227
46
18631
Q1FY21
17
318
Q4FY21 Q1FY22
201
5 46
55
4
2
-50
0
50
100
150
0
2
4
6
8
10
12
96%97%1
Q1FY21 Q1FY22
86%
Q4FY21
111 11 11
1515 16 20
81 8895
Q4FY21Q1FY21
11
130
11
Q1FY22
107115
Order Intake ($ Mn) New Client Addition & Repeat Business
Client Size
465 520 560
85
Q4FY21Q1FY21
645
Q1FY22
Executable Order Book ($ Mn)
USA
EMEA
ROW
USA
EMEA
APAC
India
RepeatBusiness
> 10 Mn
5 - 10 Mn
1 - 5 Mn
Coforge
SLK

© 2021 Coforge 10
People data
77% 77%
Q4FY21Q1FY21
81%
Q1FY22
People Numbers Utilization% (Excl BPO)
Attrition % (Excl BPO)
10,59812,391
13,529
6,962
June’20 Mar’21 June’21
20,491
+1,138
Q1FY22
11.8%
Q1FY21
10.5%
Q4FY21
12.6%
9,73611,469
18,739
1,494
678188
184
June’20
734
June’21Mar’21
258Direct
Others
Sales & Marketing
Coforge
SLK

© 2021 Coforge 11
Key Metrics
48% 46% 45%
52% 54% 55%
T&M
Q1FY21 Q4FY21 Q1FY22
FPP
Top Client Mix Revenue by Project Type
36%
26%
38%
52%
Q4FY21
51%
Q1FY21
25% 25%
36%
50%
Q1FY22
Top 5
Top 10
Top 20
Ru
pe
e D
olla
r R
ate
Q1FY21 Q4FY21 Q1FY22
Period Closing Rate 75.53 73.17 74.33
Period Average Rate 75.37 73.19 73.23
DSO
Q1FY21 Q4FY21 Q1FY22
71 70 71
He
dge
P
osi
tio
n
Q1FY21 Q4FY21 Q1FY22
USD 75.80 74.69 91.50
GBP 22.58 21.81 21.93
EUR 4.97 4.54 4.50
Ave
rage
Rat
es
Ou
tsta
nd
ing
He
dge
s
Q1FY21 Q4FY21 Q1FY22
USD 75.55 76.95 76.70
GBP 95.42 100.92 103.82
EUR 84.95 91.08 92.42

© 2021 Coforge 12© 2021 Coforge
End of Document