

Financial Pandemonium or Paradigm Shift Theory Explained ... In terms of Elliott Wave Analysis it...
27
Financial Pandemonium or Paradigm Shift Human Intervention versus Direct Access
Transcript of Financial Pandemonium or Paradigm Shift Theory Explained ... In terms of Elliott Wave Analysis it...
Financial Pandemonium or Paradigm Shift
Human Intervention versus Direct Access
Chapter 1
Newtonian versus Quantum Model:
Yes, God Plays Dice!

Newton’s Mechanics
• Everything moved contiguously.
• Actions and reactions were equal if mass was equal.
• All of nature followed this paradigm.
• This remained the prevailing school of thought for more than 200 years.
• Physicists such as Bohr, Planck and Heisenberg developed the Quantum Theory, which greatly changed the way scientists looked at nature.
God does not play dice with the universe.
Albert Einstein
Much to Einstein’s Chagrin, God likes to Gamble
• Einstein’s problem with Quantum Theory was that the model was probabilistic.
• His view was that electrons transitioned to the next energy level when heat was added.
• It was Einstein’s concept on light that gave the Theory its name.
• He saw light traveling in packets or quanta as he called it.
Free Will vs. Determinism
• Based on Newton’s model the future can be told if one worked through the mathematics of its mechanics.
• In other words one could divine the future if one knew all inputs.
• One could observe a phenomenon without effecting its process.
• The universe was deterministic.
• But in financial markets this assumes investors act rationally. They don’t and Efficient Market Theory has been proven to be irrelevant.
Quantum Theory Explained
• Quantum Theory is a process whereby electrons of an element do not always adhere to a uniform orbit around the nucleus. All matter emits light when the electrons are excited sufficiently this is caused by adding heat to the element at hand. The more heat the smaller the wavelengths.
• Electrons then do not pass smoothly to the next energy level. They jump to it in a discontinuous manner. The ratio of the diameters of the orbital electrons stands as 1:4:9. This means that an electron moving from orbit 1 to orbit 4 requires a great deal of energy to be expended.
• The formula for the energy needed was conceived by Planck and was stated simply as “E=hf.” E stands for energy (in Joules),v stands for frequency [in reciprocal seconds – written s-1 or Hertz (Hz)- 1Hz = 1 s-1), h is Planck’s constant (6.626x10⁻³⁴ J.s).

Quantum Theory Explained• This is important since there could only be a whole number jump and not a fraction
there of. It proves that electrons did not transition smoothly. This was the premise of the formula and from it Einstein derived his Theory of Relativity and E=MC2. However, he did not agree that matter jumped.
• It was an explanation of the construct of nature and it would therefore apply to all things naturally occurring. When we use our brains the process also causes excitation in the frontal cortex. Brain waves are emitted and are then part of the collective consciousness. The financial markets are organic. They adhere to the same laws of Physics, as does nature and are affected in the same way.
• This is the new way the market trades. Fundamentals of the physical market have a strong bearing on the duration of the trend, but do not set the immediate price. It is the fundamentals of the paper, as we like to say, that determines the immediate price structure. With the managed funds leaning strongly to one side of the market or another, changes in the technical advance or decline occur when prices reach certain levels. Once that occurs the jump of electrons to a new orbit is seen and with it prices jump to the next significant support or resistance area.

Chapter II
• When the music of the markets changed.
• The tempo of the market increased considerably.
• The advent of computer trading as the mainstay of the futures market was in 2006.
• We compare the volatility, both historical and intraday to support our view to the new quantum reality.
Market Personality Prior to 2006
• Prices tended to follow in a continuous flow.
• It took longer to execute orders of equal size.
• Reaction to breaking news took longer to feed traders’ appetite for capital gains.
• This was primarily due to human intervention between order initiation, execution and confirmation.
• This resulted in a smoothing process towards price discovery.

Historical Volatility Increases
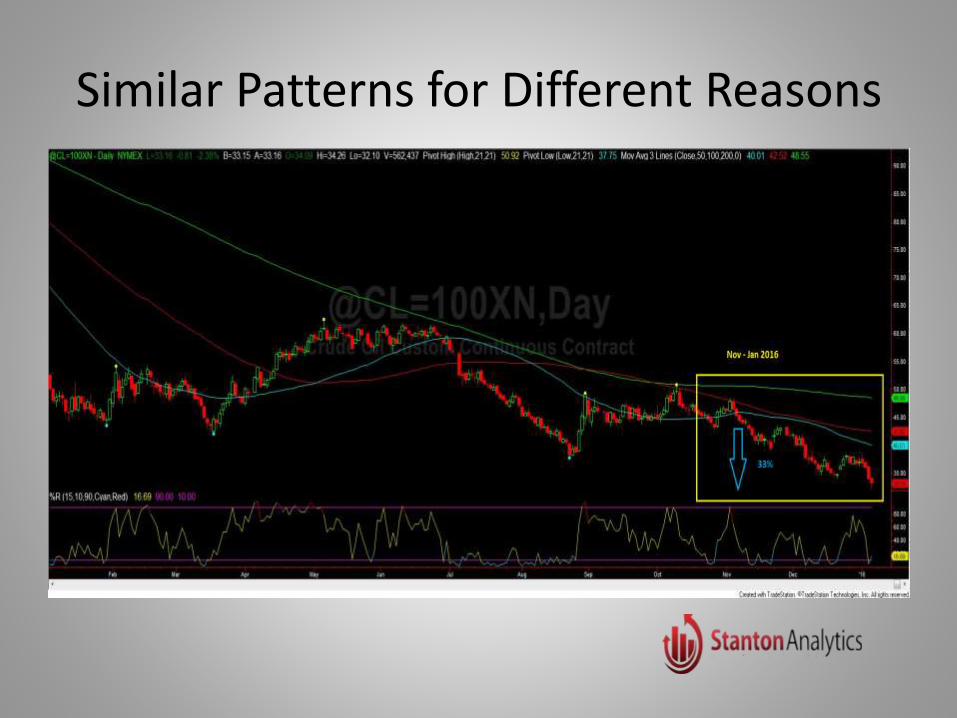
Similar Patterns for Different Reasons

Historical Volatilities DifferedDATE HIGH VOL LOW VOL MEAN %
DIFFERENCE
9/27/05 1.7736 1.145
1/04/05 .52
10/23/06 1.9199
1/11/06 1.1847 1.55 213
12/12/07 3.36
7/23/07 1.40 2.38 53.5
9/23/08 7.81
1/30/08 2,63 5.2 100
1/27/09 4.66 3.42.11
-34
12/31/09 2.11
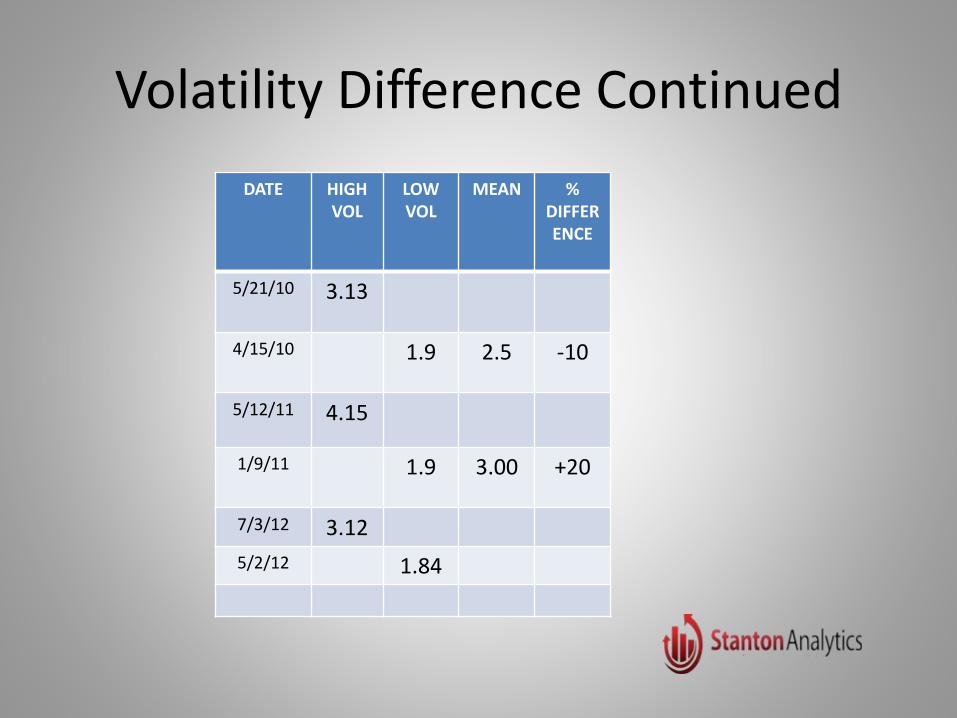
Volatility Difference Continued
DATE HIGH VOL
LOW VOL
MEAN % DIFFERENCE
5/21/10 3.13
4/15/10 1.9 2.5 -10
5/12/11 4.15
1/9/11 1.9 3.00 +20
7/3/12 3.12
5/2/12 1.84

Intraday Volatility
• This is defined by the change of price as a function of the intraday price range.
• It shows the greater influence computers have on the human psychology to exacerbate price movement.
• Panic is more evident as the increase of volatility continues to grow.
• Once the market reaches a price that will act as a springboard the computers take over to push the market to the next viable quantum level.
• They do not stop until they reach the Fibonacci extension outside deviation. More on this later.
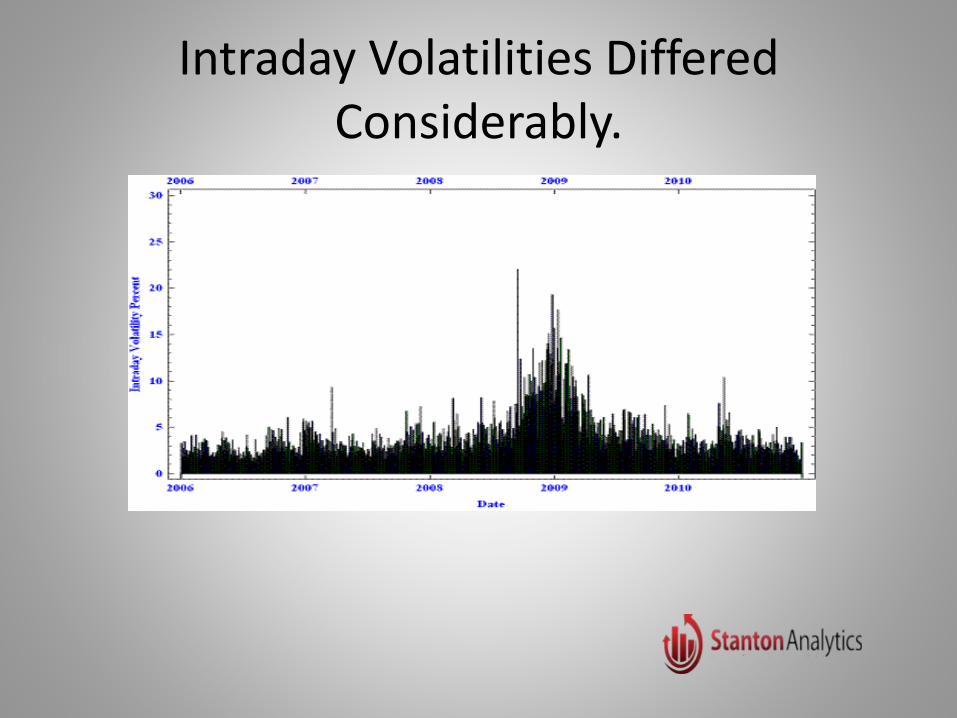
Intraday Volatilities Differed Considerably.
The Dawning of a New Age
• After 2006 computers were mated directly to the exchange through the internet or via micro wave transmission and some use lasers.
• While the speed of the markets and volatility of markets changed, yet the formations maintained the same structure.
• Human thought excites billions of electrons when focused on price activity.
• Hundreds of millions of traders each have their desire for market performance.
• When signals for market action have been given trillions of electrons flow through the internet to discover price.
• Just as in Quantum Physics the electrons jump to a higher energy level, the market does follow.
Factors That Cause Market Jumps
• Surprise news
• Economic data that did not meet expectations.
• Geopolitical events
• Breaking of moving averages.
• The removal of key pivot based on psychology.

Chapter III
• What constitutes a quantum jump?
• How to identify chart points that would lead to a leap to the next energy level.
• Are algorithms programmed for these potentials?
• How to trade a quantum jump.
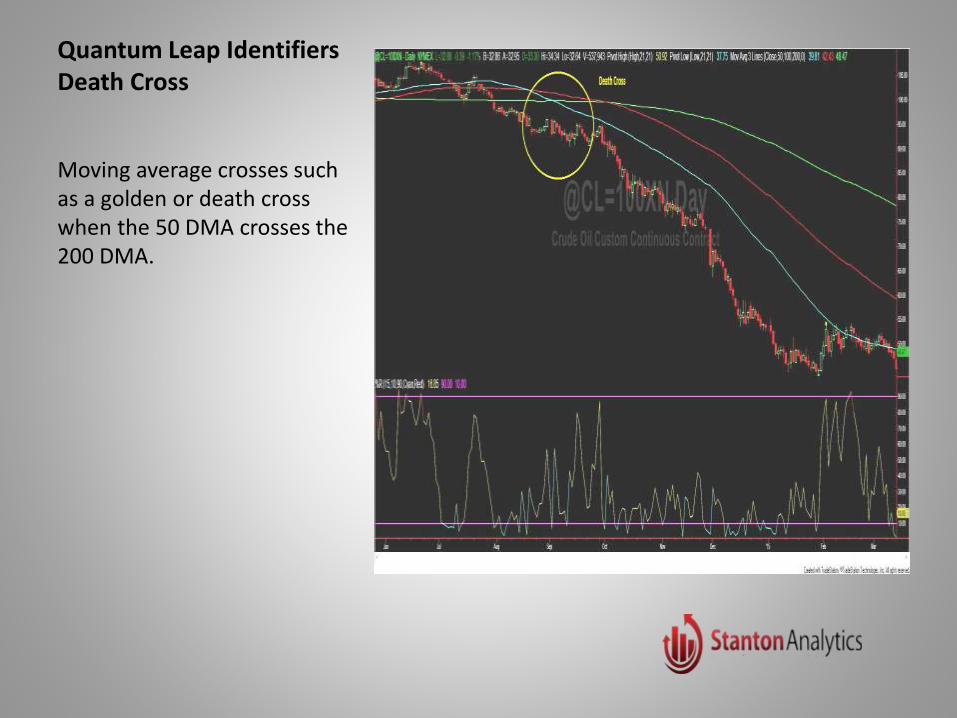
Quantum Leap IdentifiersDeath Cross
Moving average crosses such as a golden or death cross when the 50 DMA crosses the 200 DMA.

Penetration of Important Moving Averages
These would be the 50, 100 or 200 DMA.
They generate a move into the next energy field that is swift and sustained.

Recent Quantum Jumps in the Petroleum MarketsThe chart on the right pictures 3 recent quantum jumps.
The chart to the right is WTI up to 04/15/2016.
The result of these leaps was a more than 62% price increase from the very low to the very high. Interesting Fibonacci relationship, no?
Volume also tends to increase precipitously when the event takes place.
In the cases at the right volume posted for the break of the 50 DMA it was 1,053,581.
The 100 DMA showed a jolt of 1,139,553.
Finally the recent break of the 200 DMA brought a volume of 1,023,329,
Prior to the first quantum leap the volume from the year’s low averaged 245,500/day.

Psychology Pivots
These are pivots where the psychology of the pattern is altered when the point is penetrated.
In terms of Elliott Wave Analysis it would be seen with a break of the break of the extreme of wave 1.
A break of the 4th of 1 greater degree will also trigger a jump to a new energy (price) level.

Matching 10 years of data
The opposite chart is a picture of Fibonacci retracements and extensions based on ten years of data.
When there are strong correlations at critical points a top or bottom is highly probable.
The more the matches or clusters, the stronger the signal.
When outside of deviation HFT’s cannot calculate risk and stop the push.
This works for any time frame, but we use 240-minute chart for short-term signals and daily charts for long term indications.

CONCLUSION
• What we have tried to present is an explanation to increased volatility over 6 years from 2006 to 2012.
• The new paradigm has at it roots Quantum Physics, but it is also strongly related to Chaos Theory.
• The manipulation by central banks of every facet of finance only serves to exacerbate the kinetic energy stored in the developing patterns.
• In Chaos Theory a small change in the input of a chaotic equation results in a disproportional outcome.
• Economists tend to think in action = reaction where in reality it does not. Nor does Keynesian Economics understand this phenomenon.
• If the throwing of money at the economy worked, how come Japan is now in its third decade of moribund growth after its debt to GDP is more than 400%

Conclusion Continued
• We have tried to show just a few examples of what signal patterns assist in defining a quantum leap moment.
• The trillions of electrons flowing into the market via computers creates an oligopsony.
• This is a situation where the the buyers (or sellers) far outnumber their counterpart and create “gaps” in the price structure.
• While gaps in the 24-hour world of trading are few and far between, if one adheres to a “pit hours” chart they are more readily visible. Moreover Candlesticks give an insight into “hidden gaps between price structures (see Nison “Japanese Candlestick Charting).
• While in WTI or Brent they are not actual “gaps,”It does result in price activity being very thin until the energy objective has been reached.
• Thank you for your time.