Financial Overview for Fiscal Year Ended March 31, …6 Changes in Consolidated Results 1,308 1,311...
34
Financial Overview for Fiscal Year Ended March 31, 2012 Yutaka Kobayashi President & Chief Operating Officer Kobayashi Pharmaceutical Co., Ltd. May 7, 2012
Transcript of Financial Overview for Fiscal Year Ended March 31, …6 Changes in Consolidated Results 1,308 1,311...

Financial Overview for Fiscal Year Ended March 31, 2012
Yutaka KobayashiPresident & Chief Operating OfficerKobayashi Pharmaceutical Co., Ltd.
May 7, 2012

2
Quake-hit Sendai Kobayashi and its Recovery
March 11 The Great East Japan Earthquake struck.Production lines stopped.Supply of water and electricity was restored Trial production started. Production was suspended again due to a powerful aftershock. Operation resumed. Production of all products returned to normal.
March 31
April 1 April 7
April 14 June
Steps toward recovery

3
Impacts of the Great East Japan Earthquake on Business Performance
Energy-saving awareness was heightened. Great demand was marked earlier than the
previous year. Summer was cooler than the previous year. Sales were lower in July and Aug than the
previous year.
Sendai Kobayashi was hit by the earthquake.
Distribution quota system was introduced for some products.
Sales promotion began from 2Q. Initial sales targets
were achieved.
Heightened energy-saving awareness continued during the winter.
Demand increased due to the severe winter. Few products were returned due to the
prolonged cold period.
Year-end sales promotion in shops (V5000) Sales of Bluelet and Oheya-Shoshugen
increased.
Prod
ucts
for
cool
ing
Deod
orizi
ng ai
r fre
shen
ers
First Half (April – Sept) Second Half (Oct – March)
Compared witha year earlier: +19%
Compared witha year earlier: +12.5%
Compared witha year earlier: -6.6%
Compared witha year earlier: +1.0%
Body
war
mer
s De
odor
izing
air
fresh
ener
s * Sales of deodorizing air fresheners for the year: Down 3.3% from a year earlier

4
Report on Reconstruction Assistance Activities
One-Yen Empathy Campaign toSupport Eastern Japan
Distributed the donated ¥300 million to 10 municipalities. Ishinomaki, Rikuzen-Takata, Otsuchi, Kesennuma, Kamaishi,Higashi-Matsushima, Minami-Sanriku, Onagawa, Yamada, Yamamoto
Donation of ¥1 for each Kobayashi Pharmaceutical product sold between June 1 and March 31
Purchased playground equipment for nursery centers/kindergartens.
Ishinomaki CityPaid part of the construction costs
for temporary swimming pools.
Higashi-Matsushima City Paid part of the reconstruction costs for public health centers.
Kesennuma City
We will continue with our activities to assist with reconstruction this year. (Details are under consideration.)

5
Highlights ofConsolidated Financial Results
FY ended March 2011 FY ended March 2012 Increase (decrease)
Amount Margin Amount Margin Amount Percentage
SalesMillion yen
130,824%
---Million yen
131,166%
---Million yen
342%
0.3
Gross profit 74,640 57.1 76,531 58.3 1,891 2.5
Operating income 18,620 14.2 19,298 14.7 677 3.6
Ordinary income 19,010 14.5 20,092 15.3 1,082 5.7
Net income 9,335 7.1 11,726 8.9 2,390 25.6
EPS (yen) 227.98 --- 286.36 --- 58.38 25.6Dividend (yen) 66 --- 78 --- 12 18.2
Net income increased for the 14th consecutive fiscal year. Dividend per share grew for the 13th consecutive fiscal year in real terms.

6
Changes in Consolidated Results
1,3111,308
0
500
1,000
1,500
2,000
2,500
3,000
FY endedMarch2008
FY endedMarch2009
FY endedMarch2010
FY endedMarch2011
FY endedMarch2012
186 19214.2 14.7
0
50
100
150
200
250
FY endedMarch 2008
FY endedMarch 2009
FY endedMarch 2010
FY endedMarch 2011
FY endedMarch 2012
0
3
6
9
12
15Operating income
Operating margin
Since the 4Q of FY ended March 2008, the wholesale business has been excluded from the scope of consolidation. The new accounting standards have been applied since FY ended March 2009. (Loss on disposal of inventory is included in cost of sales.)
Sales Operating income (100 million yen) (100 million yen) (%)
Up 0.3% Up 3.6%

7
Increase (Decrease) inOperating Income
192
15
186
4
-17
8
-4
0 50 100 150 200 250
Operating income for FY ended March 2012
Decrease in other SGA expenses
Sales promotion & advertising expenses
Increase in profits due to sales increase, etc.
Rise in raw material prices
Cost reduction efforts
Operating income for FY ended March 2011
(100 million yen)
Operating income increased by 670 million yen (3.6%) despite aggressive marketing investments to promote brand awareness and enhance in-store sales, due to an increase in sales of higher-margin products and a reduction in manufacturing costs.

8
Consumer Products Business

9
Changes in Sales andOperating Income
1,1241,107
0
500
1,000
1,500
FY endedMarch 2008
FY endedMarch 2009
FY endedMarch 2010
FY endedMarch 2011
FY endedMarch 2012
189 183
17.116.3
0
50
100
150
200
250
300
FY endedMarch 2008
FY endedMarch 2009
FY endedMarch 2010
FY endedMarch 2011
FY endedMarch 2012
0
5
10
15
20Operating incomeOperating margin
Sales Operating income (100 million yen)
(100 million yen) (%)
Mail-order business became an independent segment in FY ended March 2011.
Up 1.5%
Down 3.4%

10
Sales by Product Category
155
91
45
297
143
162
229
148
88
47
307
140
155
219
0 50 100 150 200 250 300 350
Body warmers
Food products
Household sundries
Deodorizing air fresheners
Sanitary products
Oral hygiene products
Pharmaceutical products
FY ended March 2011
FY ended March 2012
Up 4.7%
Up 4.4%
Down 4.3%
Up 4.5%
Up 1.9%
Down 3.3%
(100 million yen)
Up 2.5%

11
New Product Contribution Rate
1721
5.3 5.1
18.0 15.3
0
10
20
30
40
FY endedMarch 2005
FY endedMarch 2006
FY endedMarch 2007
FY endedMarch 2008
FY endedMarch 2009
FY endedMarch 2010
FY endedMarch 2011
FY endedMarch 2012
0
10
20
30
40New products First yearFirst 4 years total
(Number of product items) (%)
Although 17 new products were launched, their contribution rate remained low.

12
Changes inOverseas Business Results
8178
0
20
40
60
80
100
FY endedMarch2008
FY endedMarch2009
FY endedMarch2010
FY endedMarch2011
FY endedMarch2012
2.51.9
-6
-4
-2
0
2
4
6
FY endedMarch2008
FY endedMarch2009
FY endedMarch2010
FY endedMarch2011
FY endedMarch2012
Sales Operating income/loss(after goodwill amortization)
(100 million yen) (100 million yen)
Up 4.8%
Sales, primarily of body warmers and Netsusama Sheet, expanded.

13
Mail-Order Business

14
Changes in Sales and Operating Income/Loss
98 103
0
30
60
90
120
FY endedMarch 2008
FY endedMarch 2009
FY endedMarch 2010
FY endedMarch 2011
FY endedMarch 2012
1.3
3
-5
0
5
FY endedMarch 2010
FY endedMarch 2011
FY endedMarch 2012
Sales Operating income/loss (100 million
yen)
(100 million yen)
Up 5.1%
Partly due to the impact of the Great Earthquake, sales growth slowed down.
Down 57.4%

15
Medical Devices Business

16
Changes in Sales andOperating Income
104121
0
50
100
150
FY endedMarch2008
FY endedMarch2009
FY endedMarch2010
FY endedMarch2011
FY endedMarch2012
2.5 2.9
-6
-4
-2
0
2
4
6
FY endedMarch2008
FY endedMarch2009
FY endedMarch2010
FY endedMarch2011
FY endedMarch2012
Sales Operating income/loss (100 million yen) (100 million yen)
Up 16.0%
Down 14.0%
Kobayashi Medical went ahead with selection and concentration of its business domains. eV assigned all its shares on July 31.
17
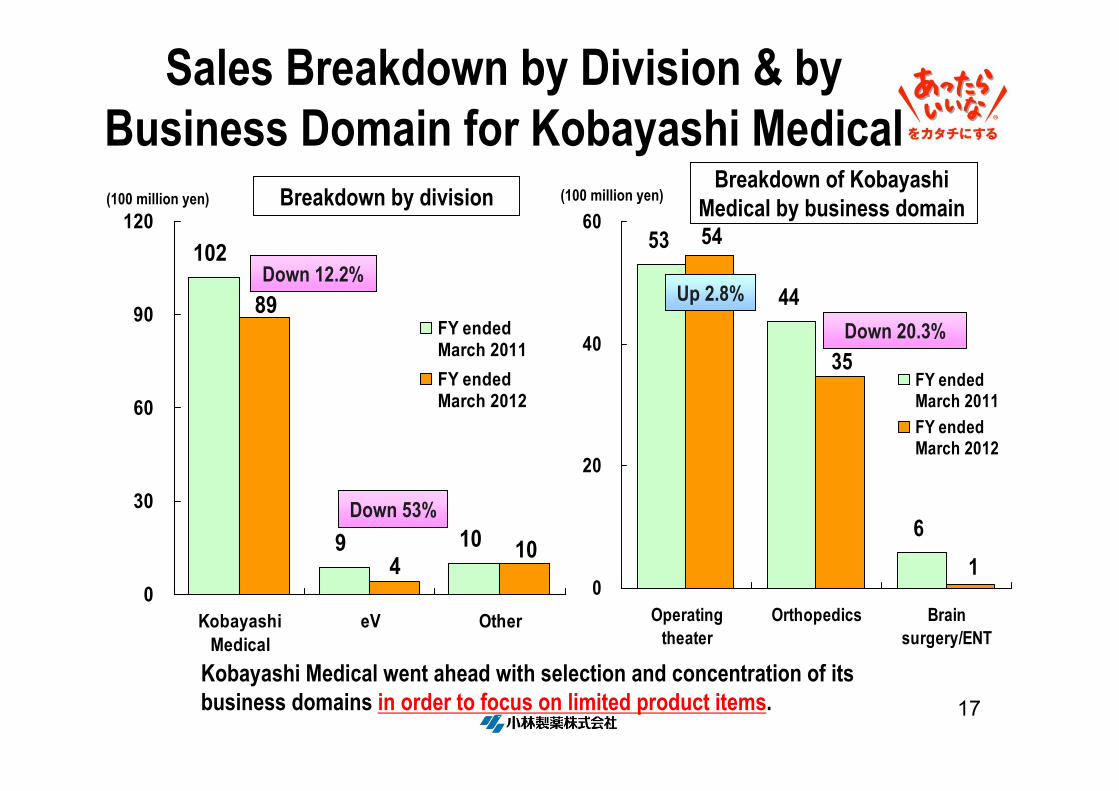
Sales Breakdown by Division & by Business Domain for Kobayashi Medical
109
102
104
89
0
30
60
90
120
KobayashiMedical
eV Other
FY endedMarch 2011FY endedMarch 2012
6
44
53 54
1
35
0
20
40
60
Operatingtheater
Orthopedics Brainsurgery/ENT
FY endedMarch 2011FY endedMarch 2012
Breakdown by division Breakdown of Kobayashi
Medical by business domain (100 million yen) (100 million yen)
Up 2.8%
Down 53%
Down 20.3%
Down 12.2%
Kobayashi Medical went ahead with selection and concentration of its business domains in order to focus on limited product items.

18
Forecasts for Fiscal Year Ending March 2013

19
Highlights of ConsolidatedFinancial Results
FY endedMarch 2012
FY endingMarch 2013 Increase (decrease)
Amount Margin Amount Margin Amount Percentage
SalesMillion yen
131,166%
---Million yen
132,000%
---Million yen
833%
0.6
Gross profit 76,531 58.3 78,100 59.2 1,568 2.0
Operating income 19,298 14.7 20,000 15.2 701 3.6
Ordinary income 20,092 15.3 20,900 15.8 807 4.0
Net income 11,726 8.9 12,500 9.5 773 6.6
EPS (yen) 286.36 --- 305.26 --- 18.90 6.6Dividend (yen) 78 --- 78 --- 0 0.0

20
Changes in Consolidated Results
1,3201,311
0
500
1,000
1,500
2,000
FY endedMarch2009
FY endedMarch2010
FY endedMarch2011
FY endedMarch2012
FY endingMarch2013
estimate
192 200
14.7 15.2
0
50
100
150
200
250
FY endedMarch 2009
FY endedMarch 2010
FY endedMarch 2011
FY endedMarch 2012
FY endingMarch 2013
estimate
0
5
10
15
20Operating income
Operating margin
Sales Operating income (%)
Up 0.6% Up 3.6%
(100 million yen) (100 million yen)

21
Changes in Consolidated Results(excluding the impact of Kobayashi Medical)
1,320
1,236
0
500
1,000
1,500
2,000
FY endedMarch2009
FY endedMarch2010
FY endedMarch2011
FY endedMarch2012
FY endingMarch2013
estimate
187 200
15.2 15.7
0
50
100
150
200
250
FY endedMarch 2009
FY endedMarch 2010
FY endedMarch 2011
FY endedMarch 2012
FY endingMarch 2013
estimate
0
5
10
15
20Operating incomeOperating margin
(%)
Up 6.8% Up 6.6%
* Sales and operating income for FY ended March 2012, excluding the results for Kobayashi Medical between June 2011 and March 2012
* 7.5 billion yen * 0.5 billion yen
Sales Operating income (100 million yen) (100 million yen)

22
Increase (Decrease) in Operating Income
200
13-5.4
192
8
-1511
-4
0 50 100 150 200 250
Operating income for FY ending March 2013
Decrease in other SGA expenses
Sales promotion & advertising expenses
Increase in profits due to sales increase, etc.
Rise in raw material prices
Cost reduction efforts
Impact of Kobayashi Medical
Operating income for FY ended March 2012
(100 million yen)
Operating income increased by 700 million yen (3.6%) despite aggressive marketing investments to acquire new customers in the mail-order business and promote brand awareness in overseas businesses, due to an increase in sales of higher-margin products and a reduction in manufacturing costs.

23
Consumer Products Business

24
Changes in Sales and Operating Income
1,1911,124
0
500
1,000
1,500
FY endedMarch2009
FY endedMarch2010
FY endedMarch2011
FY endedMarch2012
FY endingMarch2013
estimate
183 193
16.3 16.2
0
50
100
150
200
250
300
FY endedMarch 2009
FY endedMarch 2010
FY endedMarch 2011
FY endedMarch 2012
FY endingMarch 2013
estimate
0
5
10
15
20Operating incomeOperating margin
(%)
Mail-order business became an independent segment in FY ended March 2011.
Up 5.9%
Up 5.4%
Sales Operating income (100 million yen) (100 million yen)

25
Sales by Product Category
186
95
45
307
150
168
240
155
91
45
297
143
162
229
0 50 100 150 200 250 300 350
Body warmers
Food products
Household sundries
Deodorizing airfresheners
Sanitary products
Oral hygiene products
Pharmaceuticalproducts
FY ended March 2012
FY ending March 2013estimate
Up 3.7%
Up 20%
Up 4.8%
Up 4.9%
(100 million yen)
Up 4.4%
Up 3.4%

26
Measures to Enhance New Product Development Capabilities
Promote development of products that satisfy diverse consumer needs
<Objectives> 1) Development beyond existing
categories2) Creation of new development
themes
Aiming to improve stable contribution rate of new products
Daily Products Dept.
Marketing Dept. Deodorizing/Air Fresheners G
Cleaning/Consumer Products G
Hygiene/Skin Care G
New Product Development G

27
Measures to Enhance Kampo Herbal Medicine Domain
Seek independent procurement of crude drug materials
<Objectives>1) Stable supply of crude drug
materials2) Reduction of crude drug materials
costs
Aiming to achieve own stable procurement of Kampo herbal extracts
Manufacturing Division
Future Technology Development Dept.
Purchasing Dept.
Quality Control Dept.
Business Promotion Dept.
Overseas Production Strategies Dept.
Osaka Plant
Kampo Technology Development Dept.
28
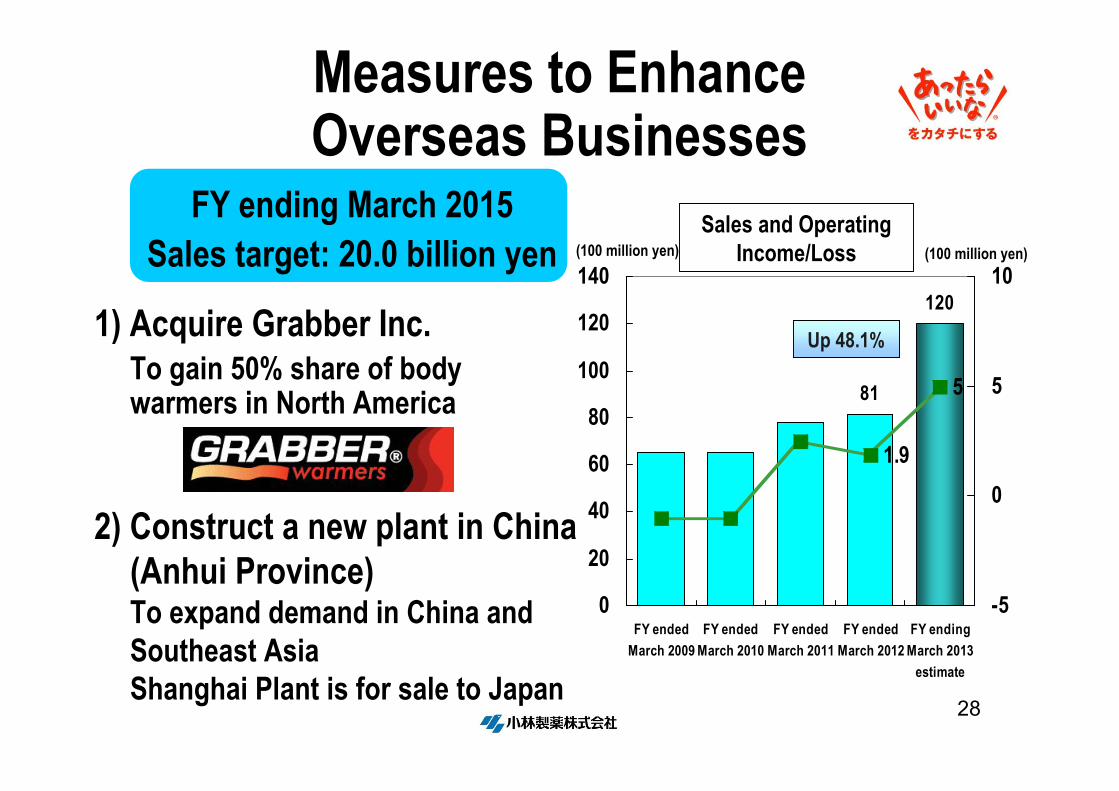
Measures to EnhanceOverseas Businesses
1) Acquire Grabber Inc.To gain 50% share of body warmers in North America 81
120
1.9
5
0
20
40
60
80
100
120
140
FY endedMarch 2009
FY endedMarch 2010
FY endedMarch 2011
FY endedMarch 2012
FY endingMarch 2013
estimate
-5
0
5
10
Sales and Operating Income/Loss (100 million yen)
Up 48.1%
(100 million yen)
FY ending March 2015Sales target: 20.0 billion yen
2) Construct a new plant in China (Anhui Province)To expand demand in China and Southeast AsiaShanghai Plant is for sale to Japan

29
Mail-Order Business

30
Changes in Sales and Operating Income/Loss
103
130
0
50
100
150
FY endedMarch2009
FY endedMarch2010
FY endedMarch2011
FY endedMarch2012
FY endingMarch2013
estimate
4
1.3
-5
0
5
FY endedMarch2010
FY endedMarch2011
FY endedMarch2012
FY endingMarch2013
estimate
SalesOperating
Income/Loss (100 million yen) (100 million yen) Up 25.2%
Up threefold

31
Measures to Acquire New Customers
PC website
Mobile website
FY ending March 2015Sales target: 20.0 billion yen
OpenMay 7
1) Enhance advertising through TV and web2) Develop a mobile website3) Develop new categories of pharmaceutical
products

32
Shareholder Returns Shareholder Returns

33
Changes in Dividends and Payout Ratios
787866
25.627.2
0
20
40
60
80
100
FY endedMarch 1999
FY endedMarch 2001
FY endedMarch 2003
FY endedMarch 2005
FY endedMarch 2007
FY endedMarch 2009
FY endedMarch 2011
FY endingMarch 2013
estimate
0
10
20
30
40
Amount of dividend(left-hand scale)Dividend payout ratio(right-hand scale)
(Yen) (%)

34


![FY Ended March 2015 Full Year Results Presentation · Net Sales [] →() →() →()](https://static.fdocuments.net/doc/165x107/5f118831d64fac5ddf14fef8/fy-ended-march-2015-full-year-results-presentation-net-sales-aii-aii.jpg)


![ANNUAL FINANCIAL STATEMENTS For years ended March ......2019/04/26 · Total comprehensive income (millions of yen) FY 2019: 511,586 [ + 23.1% ] FY 2018: 415,602 [ + 28.5% ] (2) Consolidated](https://static.fdocuments.net/doc/165x107/60acba23d205b46f7039a0ac/annual-financial-statements-for-years-ended-march-20190426-total-comprehensive.jpg)