Financial - Missouri Department of Transportation Financial Snapshot provides ... Missouri’s State...
27
Financial Snapshot November 2017 An appendix to the Citizen’s Guide to Transportation Funding in Missouri
Transcript of Financial - Missouri Department of Transportation Financial Snapshot provides ... Missouri’s State...
FinancialSnapshot
November 2017
An appendix to the Citizen’s Guide to Transportation Funding in Missouri


Financial Snapshot - November 2017
About the Financial Snapshot
The Financial Snapshot provides answers to frequently asked
questions regarding MoDOT’s finances. The document also serves
as an appendix to the Citizen’s Guide to Transportation Funding in
Missouri.
www.modot.org/about/documents/FinancialSnapshot.pdf
If you have any questions concerning this report, please contact
MoDOT’s Financial Services Division at (573) 526-8106.
MoDOT’s Mission
Our mission is to provide a world-class transportation experience
that delights our customers and promotes a prosperous Missouri.
Financial Snapshot

Financial Snapshot - November 2017 2
Table of Contents
Transportation Funding
Revenue for Roads and Bridges, Multimodal, Highway Safety – Table 3
MoDOT Revenue for Roads and Bridges, Multimodal, Highway Safety - Table 4
MoDOT Expenditures for Roads and Bridges, Multimodal, Highway Safety - Table 5
Summary of State and Federal Funds 6
Federal Aid Apportionments based on Fixing America’s Surface Transportation (FAST) Act 7
Ratio of Federal Highway Trust Fund Payments Into Fund vs. Apportionments and
Allocations Out of Fund 9
Summary of State Road Bond Financing Program 10
Highway User Fees to Local Governments by Fiscal Year 11
Transportation Facts
Summary of MoDOT’s External and Internal Expenditures 12
Summary of Actual and Projected Construction Awards and Contractor Payments 13
Missouri’s State and Federal Fuel Tax Rates and Fuel Tax History 14
Missouri Vehicle Registrations and Licensed Drivers Fiscal Year 2017 15
Net Motor Fuel Gallons Taxed 16
Distribution of Highway User Fees Fiscal Year 2017 17
Potential Transportation Revenue Options – Motor Fuel Tax 18
Potential Transportation Revenue Options – Sales Tax 19
Potential Transportation Revenue Options – Motor Vehicle and Driver Licensing Fees and
Alternative Fuel Decal Fees 20
Potential Transportation Revenue Options – $100 million, $250 million and $500 million 21
Potential Transportation Revenue Options – $100 million and $250 million 22
Road and Bridge Funding Flowchart 23
Financial Snapshot - November 2017 3
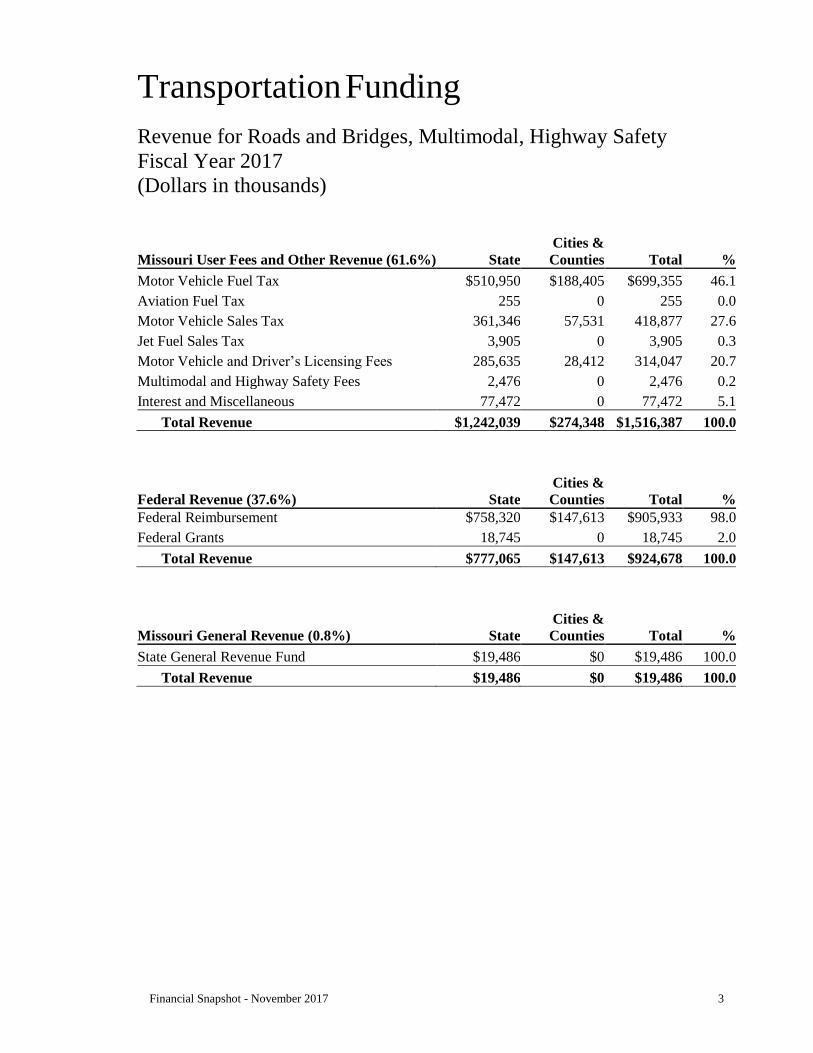
Transportation Funding
Revenue for Roads and Bridges, Multimodal, Highway Safety
Fiscal Year 2017
(Dollars in thousands)
Missouri User Fees and Other Revenue (61.6%)
State
Cities &
Counties Total %
Motor Vehicle Fuel Tax $510,950 $188,405 $699,355 46.1
Aviation Fuel Tax 255 0 255 0.0
Motor Vehicle Sales Tax 361,346 57,531 418,877 27.6
Jet Fuel Sales Tax 3,905 0 3,905 0.3
Motor Vehicle and Driver’s Licensing Fees 285,635 28,412 314,047 20.7
Multimodal and Highway Safety Fees 2,476 0 2,476 0.2
Interest and Miscellaneous 77,472 0 77,472 5.1
Total Revenue $1,242,039 $274,348 $1,516,387 100.0
Federal Revenue (37.6%)
State
Cities &
Counties Total %
Federal Reimbursement $758,320 $147,613 $905,933 98.0
Federal Grants 18,745 0 18,745 2.0
Total Revenue $777,065 $147,613 $924,678 100.0
Missouri General Revenue (0.8%)
State
Cities &
Counties Total %
State General Revenue Fund $19,486 $0 $19,486 100.0
Total Revenue $19,486 $0 $19,486 100.0

Financial Snapshot - November 2017 4
Transportation Funding
MoDOT Revenue for Roads and Bridges, Multimodal, Highway
Safety
(Dollars in thousands)
MoDOT’s funding comes from both state and federal sources. Most of the money is dedicated by
federal law or the state constitution and statutes to specific purposes. Included below are the funds
available for roads and bridges and other transportation modes.
Revenue (Road and Bridge)
2013 2014 2015 2016 2017
Fuel Tax1 $488,691 $488,800 $494,649 $511,786 $510,950
Vehicle/Driver’s Licensing Fees1 266,844 271,142 279,455 289,009 285,635
Motor Vehicle Sales Tax1 295,072 304,365 323,105 337,965 356,552
Interest and Miscellaneous2 185,576 123,339 102,388 116,466 75,465
Federal Reimbursement3,4,5
913,236 831,066 760,239 827,843 844,194
Total Revenue $2,149,419 $2,018,712 $1,959,836 $2,083,069 $2,072,796
Revenue (Multimodal) 2013 2014 2015 2016 2017
Aviation Fuel1 $271 $244 $247 $251 $255
Fees1 2,091 2,067 2,353 1,758 2,171
Sales Taxes1 8,166 10,003 10,092 8,894 8,699
State General Revenue Fund6 9,301 13,502 13,938 17,943 19,486
Interest and Miscellaneous2 2,111 1,572 2,745 2,707 2,000
Federal Reimbursement3,4,5
61,709 65,226 56,686 64,167 61,739
Total Revenue8 $83,649 $92,614 $86,061 $95,720 $94,350
Revenue (Highway Safety) 2013 2014 2015 2016 2017
Fees7 $372 $359 $328 $314 $305
Interest and Miscellaneous2 4 20 4 8 7
Federal Grants3 42,043 32,404 36,351 18,908 18,745
Total Revenue9 $42,419 $32,783 $36,683 $19,230 $19,057
Notes: 1 User fees.
2 Includes interest earned on invested funds, sale of surplus property and excess right of way and construction
cost reimbursements from local and other state governments. 3 User fees and transfers from the General Fund and Leaking Underground Storage Tank (L.U.S.T.) Fund.
4 Includes reimbursement for American Recovery and Reinvestment Act (ARRA) projects.
5 Includes federal funds that flow through MoDOT to local governments and agencies.
6 Appropriated by the Missouri General Assembly.
7 Includes motorcycle instruction permit fees and fees collected by the courts from violators of state laws or
municipal or county ordinances. 8 Includes the following funds: Multimodal Operations-Federal, State Transportation, Aviation Trust, State
Transportation Assistance Revolving, Grade Crossing Safety Account, Railroad Expense, Light Rail Safety and
General Revenue. 9 Includes the following funds: Highway Safety Federal, Motor Carrier Safety Assistance Program-Federal and
the Motorcycle Safety Trust Fund.
Source: MoDOT.

Financial Snapshot - November 2017 5
Transportation Funding
MoDOT Expenditures for Roads and Bridges, Multimodal, Highway
Safety
(Dollars in thousands)
MoDOT’s largest expenditure category is the construction program. The construction program
expenditures include contractor payments, engineering, reimbursement to local entities for acceleration
of projects, right of way payments, and federal pass-through to local public agencies. Other State
Agencies represents appropriations to the Missouri State Highway Patrol and the Department of
Revenue.
Expenditures (Road and Bridge)
2013 2014 2015 2016 2017
Construction Program1 $1,060,724 $907,269 $912,784 $818,994 $810,814
Construction Operating Costs2 127,281 127,002 130,552 126,880 129,147
Maintenance2 419,581 443,939 435,085 430,236 449,262
Fleet, Facilities & Info. Systems2 69,625 70,095 67,118 78,854 74,924
Debt Service3 289,334 292,930 288,009 280,237 412,523
Administration2 46,772 48,405 50,718 51,564 50,732
Other State Agencies4 227,054 233,307 250,109 250,272 261,491
Total Expenditures $2,240,371 $2,122,947 $2,134,375 $2,037,037 $2,188,893
Expenditures (Multimodal) 2013 2014 2015 2016 2017
Operating Costs2 $2,450 $2,341 $2,610 $2,625 $2,707
Transit 34,875 29,379 36,509 34,644 30,425
Rail 22,865 23,430 16,485 18,726 17,304
Aviation 23,337 30,153 27,558 35,275 38,718
Port-Waterway 615 3,279 3,307 6,220 4,464
STAR Fund Loan 0 0 0 1 301
Freight 0 850 650 850 1,000
Total Expenditures $84,142 $89,432 $87,119 $98,341 $94,919
Expenditures (Highway Safety) 2013 2014 2015 2016 2017
Operating Costs2 $391 $514 $497 $522 $521
Safety Programs 41,813 15,541 14,980 18,465 18,532
Total Expenditures $42,204 $16,055 $15,477 $18,987 $19,053
Notes: 1 Includes contractor payments to construct and design roads and bridges, payments to purchase right of way and
federal funds that flow through MoDOT to local governments.
2 Includes personal services and fringe benefits of MoDOT employees and expense & equipment costs.
3 Includes the principal and interest payments for funds borrowed by the Missouri Highways and Transportation
Commission (MHTC). In 2017, $117.8 million of bonds were paid-off early, saving future interest cost of $29.4
million. 4 Includes appropriated expenditures of the Missouri State Highway Patrol and Missouri Department of Revenue.
Source: MoDOT.

Financial Snapshot - November 2017 6
Transportation Funding
Summary of State and Federal Funds
Fund Source of Funds
State Road Fund Federal Highway Administration reimbursements; licenses, permits,
and fees for motor vehicles and drivers; state sales tax on motor
vehicles; cost reimbursements; and other miscellaneous fees [Section
226.220 RSMo.]
State Road Bond Fund State sales tax on motor vehicles [Section 226.210 RSMo.]
State Highways and
Transportation Department
Fund
Motor fuel tax and licenses, permits and fees for motor vehicles and
drivers [Section 226.200 RSMo.]
Aviation Trust Fund User fees of 9 cents per gallon on aviation gasoline and a portion of
the state sales tax collected on jet fuel [Section 155.090 RSMo.]
State Transportation Fund Two percent of one-half of the state sales tax on motor vehicles
[Section 226.225 RSMo.]
Grade Crossing Safety
Account
Owner of a motor vehicle pays a fee of twenty-five cents each year
when the person registers or renews the registration of a motor vehicle
[Section 389.612 RSMo.]
Railroad Expense Fund Assessments collected from the railroads [Section 622.015 RSMo.]
State Transportation
Assistance Revolving
(STAR) Fund
This fund accounts for loans to any political subdivision of the state or
to any public or private not-for-profit organization for the planning,
acquisition, development and construction of facilities for air, water,
rail or public transportation, the purchase of vehicles for transportation
of elderly and disabled persons, or the purchase of rolling stock for
transit purposes. Loan repayments are deposited into this fund and are
used to make additional loans under the revolving loan program.
[Section 226.191 RSMo.]
Motorcycle Safety Trust
Fund
Motorcycle instruction permit fees and a $1 surcharge from all
criminal cases including violations of any municipal or county
ordinance or any violation of criminal or traffic laws of the state.
[Section 302.137 RSMo. & Section 302.140 RSMo.]
Multimodal Operations
Federal Fund
Federal grant monies associated with Multimodal programs
Motor Carrier Safety
Assistance Federal Fund
Federal grant monies associated with the Motor Carrier Safety
Assistance Program
Highway Safety Federal
Fund
Federal grant monies associated with Highway Safety programs

Financial Snapshot - November 2017 7
Transportation Funding
Federal Aid Apportionments based on Fixing America’s Surface
Transportation (FAST) Act
(Dollars in millions) Federal funds are generated by the federal fuel tax – 18.4 cents per gallon for gasoline and 24.4 cents
per gallon for diesel. Federal fuel taxes are deposited into the Highway Trust Fund, and apportioned
back to states via federal authorization bills. The amount Missouri is apportioned is reduced by the
congressionally imposed obligation limitation, which places a ceiling on the amount we can commit to
projects. Historically, approximately 98 percent of apportionments are available to obligate. Federal
funds are received on a reimbursement basis. MoDOT and local public agencies spend state and local
funds to build projects and request reimbursement from the Federal Highway Administration.
Apportionments shown below include the amounts that by law are distributed to local public agencies.
The following chart lists the amounts apportioned to Missouri in each category under MAP-21 and
FAST Acts. The FAST Act was signed into law by the President on December 4, 2015 and provides
funding for surface transportation programs for federal fiscal years 2016, 2017, 2018, 2019 and 2020.
The total apportionments under the FAST Act are significantly more than under the previous federal
funding act, MAP-21.
$977.1 $982.5
$919.2 $914.2 $915.2 $915.5
$961.9
$973.8
$900
$925
$950
$975
$1,000
2010 2011 2012 2013 2014 2015 2016 2017
Mil
lio
ns
Federal Fiscal Year

Financial Snapshot - November 2017 8
Apportionments are subject to Obligation Limitation. Obligation Limitation is a restriction, or
“ceiling” on the amount of federal assistance that may be committed during a specified time period.
Historically, Missouri’s obligation limitation has averaged 98 percent. So, as an example, with 2017
apportionments of $973.8 million, we would be able to commit and spend about $954.3 million on
projects.
The apportionment categories under the FAST Act are as follows:
National Highway Performance is the construction, reconstruction, resurfacing, restoration
and rehabilitation of highways and bridges on National Highway System (NHS) routes which
are routes designated by Congress as roadways important to the nation’s economy, defense and
mobility.
National Highway Freight includes improvements to the National Highway Freight Network
(NHFN) that increase the efficiency of freight movement.
Surface Transportation is the construction, reconstruction, rehabilitation, resurfacing,
restoration and operational improvements of highways and bridges.
Congestion Mitigation & Air Quality includes traffic management, monitoring and
congestion relief strategies to assist areas designated as non-attainment under the Clean Air
Act Amendments of 1990.
Recreational Trails is for the development, construction, maintenance and rehabilitation of
trails and trail facilities.
Metropolitan Planning is for transportation planning activities to develop metropolitan area
transportation plans and transportation improvement programs.
Statewide Planning & Research includes transportation planning activities to develop the
statewide transportation improvement program. It also includes studies, research and training
on engineering standards and construction materials.
Highway Safety Improvement is for highway safety improvements to eliminate roadway
hazards.
Rail/Highway Crossings is for highway safety improvements to mitigate hazards caused by
rail-highway grade crossings.
Transportation Alternatives is for the construction of on-road and off-road facilities for
pedestrians, bicyclists and other non-motorized forms of transportation and infrastructure-
related projects that provide safe routes for non-drivers, including children, older adults and
individuals with disabilities to access daily needs.
Source: Prepared by MoDOT based on amounts received under MAP-21 and FAST Acts.
Apportionment Category 2013 2014 2015 2016 2017
National Highway Performance (NHPP) $539.0 $539.0 $539.2 $549.6 $558.3
National Highway Freight (NHFP) 0.0 0.0 0.0 27.1 25.7
Surface Transportation (STP) 250.2 251.0 251.6 257.2 260.1
Congestion Mitigation & Air Quality (CMAQ) 22.6 22.6 22.6 23.0 23.3
Recreational Trails 1.7 1.7 1.6 1.6 1.7
Metropolitan Planning (MP) 4.9 4.9 4.9 5.2 5.2
Statewide Planning & Research (SPR) 18.6 18.5 18.1 19.4 19.7
Highway Safety Improvement (HSIP) 54.1 54.1 54.1 51.9 55.8
Rail/Highway Crossings 5.5 5.5 5.5 8.6 5.7
Transportation Alternatives (TAP) 17.6 17.9 17.9 18.3 18.3
Total $914.2 $915.2 $915.5 $961.9 $973.8

Financial Snapshot - November 2017 9
Transportation Funding
Ratio of Federal Highway Trust Fund Payments Into Fund vs.
Apportionments and Allocations Out of Fund
(Dollars in thousands)
The chart below shows Missouri has received more funding from the Highway Trust Fund
than was contributed in highway taxes into the Fund. For example, in fiscal year 2015,
Missouri received $1.10 for every dollar contributed into the Highway Trust Fund.
Ratio of Federal Highway Trust Fund Payments Into the Fund vs. Apportionments and
Allocations Out of the Fund1
Surrounding States 2007 2008 2009 2010 2011 2012 2013 2014 2015
Arkansas 1.23 1.42 1.58 1.52 1.42 1.21 1.29 1.23 1.15
Illinois 1.21 1.29 1.36 1.36 1.30 1.09 1.23 1.15 1.11
Iowa 1.04 1.22 1.37 1.34 1.21 1.06 1.08 1.09 1.00
Kansas 1.18 1.28 1.31 1.37 1.17 1.02 1.10 1.03 0.98
Kentucky 1.10 1.26 1.41 1.38 1.24 1.07 1.35 1.12 1.06
Missouri 1.15 1.31 1.39 1.45 1.34 1.17 1.23 1.17 1.10
Nebraska 1.15 1.31 1.36 1.42 1.23 1.03 1.13 1.03 0.96
Oklahoma 1.26 1.37 1.41 1.42 1.28 1.08 1.15 1.07 1.00
Tennessee 1.11 1.23 1.29 1.35 1.26 1.02 1.14 1.06 1.00
Notes: 1 Payments into the Fund include only the net highway user tax receipts and fines and penalties
deposited in the Highway Account of the Federal Highway Trust Fund. Payments do not include
transfers from the General Fund and Leaking Underground Storage Tank (L.U.S.T.) Fund totaling
$62.8 billion from 2008 to 2015. Apportionments and allocations out of the fund includes all funds
apportioned or allocated from the Highway Trust Fund except where FHWA does not directly
allocate the funds to the states, e.g. portions of Indian Reservation Roads and safety programs.
Source: Federal Highway Statistics Series 2015.

Financial Snapshot - November 2017 10
Transportation Funding
Summary of State Road Bond Financing Program
(Dollars in millions) Bond financing allowed MoDOT to provide much needed infrastructure improvements to the traveling
public sooner than traditional funding allowed. Building projects sooner results in cost savings by
reducing project inflation costs, while advancing economic development, improving safety and
addressing congestion. The Missouri General Assembly authorized MoDOT to borrow $2.25 billion in
2000. MoDOT borrowed $907 million from fiscal years 2001-2004, referred to as senior lien debt.
Voters approved Amendment 3 in 2004 authorizing MoDOT to borrow funds by depositing vehicle
sales taxes previously deposited in the state’s General Revenue Fund into a newly created State Road
Bond Fund. The Amendment 3 revenues are designated for the payment of debt principal and
interest. MoDOT borrowed $1.98 billion from fiscal years 2006-2010.
In fiscal year 2009, MoDOT borrowed $143 million for a portion of the new Interstate 64, a
design-build project in the St. Louis region. This debt is referred to as Grant Anticipation Revenue
Vehicle (GARVEE) bonds. In fiscal year 2010, MoDOT borrowed an additional $100 million for
the new Mississippi River Bridge project and $685 million for the Safe and Sound Bridge
Improvement Program.
The borrowed funds, shown below, do not include refunding bonds.
Note:
The MHTC has $2.0 billion of bonds outstanding as of June 30, 2017. The average interest rate (true interest
cost) on all outstanding debt combined is 2.86 percent.
Source: MoDOT.
$0
$200
$400
$600
$800
$1,000
$1,200
200
1
200
3
200
5
200
7
200
9
201
1
201
3
201
5
201
7
201
9
202
1
202
3
202
5
202
7
202
9
203
1
203
3
Mil
lio
ns
State Fiscal Year
Borrowed Funds Annual Payments

Financial Snapshot - November 2017 11
Transportation Funding
Highway User Fees to Local Governments by Fiscal Year
(Dollars in thousands)
The state does not receive all of the revenue generated by state highway user taxes and fees. The
state constitution, Article IV, directs the Department of Revenue to distribute portions of the state
motor fuel tax, motor vehicle sales and use taxes, and motor vehicle and driver licensing fees to
cities and counties. The charts below show a six year history of transportation revenue sharing with
local entities.
Cities
Motor Fuel
Revenue
Vehicle Sales
Tax
Motor Vehicle
Fees Total
2012 100,994 23,155 16,418 140,567
2013 99,433 25,112 16,961 141,506
2014 100,077 28,340 16,059 144,476
2015 103,909 31,433 16,932 152,274
2016 104,130 33,285 17,343 154,758
2017 105,590 34,519 17,047 157,156
Counties
Motor Fuel
Revenue
Vehicle Sales
Tax
Motor Vehicle
Fees Total
2012 79,206 15,437 10,945 105,588
2013 77,980 16,741 11,307 106,028
2014 78,484 18,893 10,706 108,083
2015 81,487 20,956 11,288 113,731
2016 81,663 22,190 11,562 115,415
2017 82,815 23,012 11,365 117,192
Total
Motor Fuel
Revenue
Vehicle Sales
Tax
Motor Vehicle
Fees Total
2012 180,200 38,592 27,363 246,155
2013 177,413 41,853 28,268 247,534
2014 178,561 47,233 26,765 252,559
2015 185,396 52,389 28,220 266,005
2016 185,793 55,475 28,905 270,173
2017 188,405 57,531 28,412 274,348
Source: Prepared by MoDOT based on Missouri Department of Revenue data.

Financial Snapshot - November 2017 12
Transportation Facts
Summary of MoDOT’s External and Internal Expenditures (Dollars in thousands) The majority of MoDOT’s expenditures are payments to vendors. The payments are for goods and
services needed to build and maintain Missouri’s transportation infrastructure. Whether it is payments
to contractors, the purchase of equipment and supplies, design services or travel costs paid to hotels
and airlines, these outward focused expenditures are an investment in Missouri’s economy, and drive
economic opportunity in the state. Internally focused expenditures include employee salaries and
benefits, and program distributions to other state agencies and universities.
Expenditures (External)
2013 2014 2015 2016 2017
Construction Projects $915,099 $761,481 $763,552 $671,228 $644,073
Debt Service and Leases 302,666 299,741 289,111 287,584 413,177
Program Distributions1 219,175 215,605 232,524 244,743 249,804
Supplies 123,544 140,039 131,543 126,699 134,841
Services 74,812 88,818 75,730 60,871 80,423
Equipment 35,893 39,605 34,361 49,037 46,847
Miscellaneous 38,549 36,148 38,624 40,816 36,594
Fuel and Utilities 8,497 9,248 9,106 8,761 8,797
Refunds 3,784 1,629 2,862 3,653 2,625
Professional Development 1,335 1,387 1,495 3,780 1,944
Travel2 1,389 1,504 1,383 1,397 1,569
Total Expenditures $1,724,743 $1,595,205 $1,580,291 $1,498,569 $1,620,694
81% 80% 80% 79% 79%
Expenditures (Internal)
2013 2014 2015 2016 2017
Salaries and Benefits $380,481 $392,393 $400,454 $398,886 $413,212
Program Distributions3 34,008 7,057 5,699 6,180 7,011
Travel4 431 472 418 458 457
Total Expenditures $414,920 $399,922 $406,571 $405,524 $420,680
19% 20% 20% 21% 21%
Other State Agencies $227,054 $233,307 $250,109 $250,272 $261,491
Total $2,366,717 $2,228,434 $2,236,971 $2,154,365 $2,302,865
Notes: 1 Payments or federal funds passed through to cities, counties and other political subdivsions.
2 Payments to vendors.
3 Payments or federal funds passed through to other state agencies and universities.
4 Employee reimbursements.
Source: MoDOT

Financial Snapshot - November 2017 13
Transportation Facts
Summary of Actual and Projected Construction Awards and
Contractor Payments (Dollars in millions) The graph below displays the relationship between construction awards and contractor payments. Prior
to fiscal year (FY) 2011, MoDOT averaged annual construction awards of $1.2 billion. Most projects
are not completed in the year awarded, but are built and paid for in subsequent years. For example,
approximately $298 million of projected FY 2018 contractor payments is for projects awarded in FY
2018. The remainder is for projects awarded in prior years. Awards declined dramatically in FY 2011,
but contractor payments remained high as the prior year projects were completed. The FY 2013
contractor payments declined because awards in FY 2011 and FY 2012 reduced significantly.
Contruction awards and contractor payments equal in future years due to construction awards
remaining steady at $900 million from 2019-2022. The information is based on the latest financial
forecast that was used to develop the 2018-2022 Statewide Transportation Improvement Program
(STIP).
Source: MoDOT
$0
$200
$400
$600
$800
$1,000
$1,200
$1,400
2010 2011 2012 2013 2014 2015 2016 2017 2018 2019 2020 2021 2022
Mil
lio
ns
Fiscal Year
Construction Awards Contractor Payments
Financial Snapshot - November 2017 14
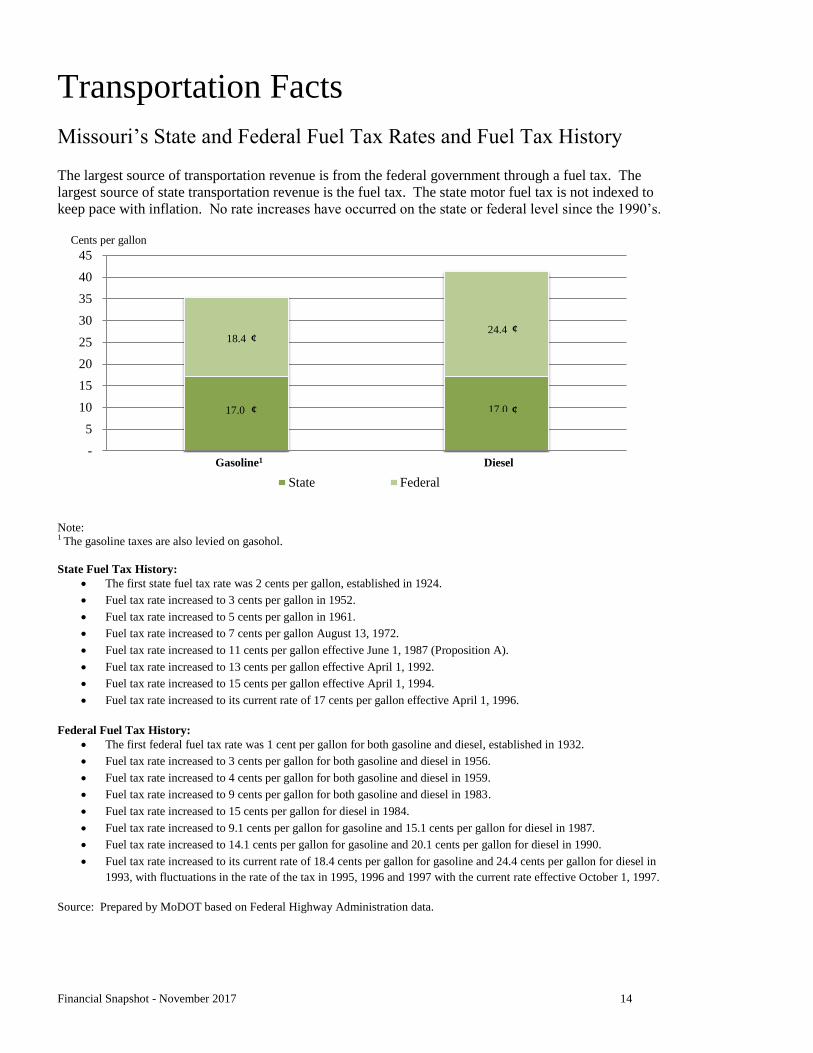
Transportation Facts
Missouri’s State and Federal Fuel Tax Rates and Fuel Tax History The largest source of transportation revenue is from the federal government through a fuel tax. The
largest source of state transportation revenue is the fuel tax. The state motor fuel tax is not indexed to
keep pace with inflation. No rate increases have occurred on the state or federal level since the 1990’s.
Note: 1 The gasoline taxes are also levied on gasohol.
State Fuel Tax History:
The first state fuel tax rate was 2 cents per gallon, established in 1924.
Fuel tax rate increased to 3 cents per gallon in 1952.
Fuel tax rate increased to 5 cents per gallon in 1961.
Fuel tax rate increased to 7 cents per gallon August 13, 1972.
Fuel tax rate increased to 11 cents per gallon effective June 1, 1987 (Proposition A).
Fuel tax rate increased to 13 cents per gallon effective April 1, 1992.
Fuel tax rate increased to 15 cents per gallon effective April 1, 1994.
Fuel tax rate increased to its current rate of 17 cents per gallon effective April 1, 1996.
Federal Fuel Tax History:
The first federal fuel tax rate was 1 cent per gallon for both gasoline and diesel, established in 1932.
Fuel tax rate increased to 3 cents per gallon for both gasoline and diesel in 1956.
Fuel tax rate increased to 4 cents per gallon for both gasoline and diesel in 1959.
Fuel tax rate increased to 9 cents per gallon for both gasoline and diesel in 1983.
Fuel tax rate increased to 15 cents per gallon for diesel in 1984.
Fuel tax rate increased to 9.1 cents per gallon for gasoline and 15.1 cents per gallon for diesel in 1987.
Fuel tax rate increased to 14.1 cents per gallon for gasoline and 20.1 cents per gallon for diesel in 1990.
Fuel tax rate increased to its current rate of 18.4 cents per gallon for gasoline and 24.4 cents per gallon for diesel in
1993, with fluctuations in the rate of the tax in 1995, 1996 and 1997 with the current rate effective October 1, 1997.
Source: Prepared by MoDOT based on Federal Highway Administration data.
-
5
10
15
20
25
30
35
40
45
State Federal
Cents per gallon
Gasoline1 Diesel
17.0 17.0
18.4 24.4
¢ ¢
¢ ¢

Financial Snapshot - November 2017 15
Transportation Facts
Missouri Vehicle Registrations and Licensed Drivers
Fiscal Year 2017
Vehicle Type Number
Passenger Cars 3,753,993
Trucks 1,488,095
Recreational Vehicles 17,133
Buses 22,490
Motorcycles/Tricycles 157,163
Total 5,438,874
Number of licensed drivers in Missouri
Male 2,048,659
Female 2,164,643
Total 4,213,302
Source: Prepared by MoDOT based on Missouri Department of Revenue and Federal
Highway Administration data.

Financial Snapshot - November 2017 16
Transportation Facts
Net Motor Fuel Gallons Taxed
(Gallons in millions)
Fiscal Year Gasoline1 Diesel Total
Percent
change
1990 2,622 614 3,236 0.929
1991 2,633 592 3,225 -0.324
1992 2,679 604 3,283 1.781
1993 2,686 613 3,299 0.500
19942 2,766 697 3,463 4.953
1995 2,796 709 3,505 1.248
1996 2,837 772 3,609 2.968
1997 2,887 782 3,669 1.631
1998 2,931 802 3,733 1.775
19993 2,926 835 3,761 0.741
2000 3,056 916 3,972 5.582
2001 2,975 860 3,835 -3.441
2002 3,025 914 3,939 2.708
2003 3,083 923 4,006 1.702
2004 3,148 977 4,125 2.993
2005 3,158 1,025 4,183 1.395
2006 3,124 1,032 4,156 -0.635
2007 3,109 1,033 4,142 -0.347
2008 3,119 1,064 4,183 0.982
2009 3,068 934 4,002 -4.316
2010 3,086 946 4,032 0.750
2011 3,066 967 4,033 0.019
2012 3,025 951 3,976 -1.413
2013 2,973 946 3,919 -1.431
2014 2,969 957 3,926 0.171
2015 3,030 979 4,009 2.120
2016 3,101 1,006 4,107 2.457
2017 3,115 1,014 4,129 0.536
Notes: 1 Gasoline gallons include gasohol, compressed natural gas and liquefied natural gas.
2 Beginning January 1, 1994, the Federal government moved the collection point to the terminal. All
tax exempt diesel has to be dyed. 3 Beginning January 1, 1999, the State moved the collection point to the rack (terminal). Fiscal year
2000 was the first full year of collections at the terminal.
Source: Prepared by MoDOT based on Missouri Department of Revenue month of distribution data.

Financial Snapshot - November 2017 17
Transportation Facts The following data shows the proportionate share between MoDOT, cities and counties of the
three main revenue sources: motor fuel tax, motor vehicle sales tax and the motor vehicle and
driver’s licensing fees. The Missouri State Highway Patrol (MSHP) and the Department of
Revenue (DOR) receive appropriations from these revenues as well.
Distribution of Highway User Fees Fiscal Year 2017
Fuel Taxes Rates:
State: Gas / Gasohol Percent Diesel Percent
State-Roads & Bridges, MSHP, DOR 12.45¢ 73.2% 12.45¢ 73.2%
Cities1 2.55¢ 15.0% 2.55¢ 15.0%
Counties2
2.00¢ 11.8% 2.00¢ 11.8%
Total State 17.00¢ 17.00¢
Federal:
Underground Storage Tank 0.10¢ 0.6% 0.10¢ 0.4%
Transit Account 2.86¢ 15.5% 2.86¢ 11.7%
Highway Account 15.44¢ 83.9% 21.44¢ 87.9%
Total Federal 18.40¢ 24.40¢
TOTAL FUEL TAX RATE 35.40¢ 41.40¢
State Motor Vehicle Sales Taxes: Sales Percent
State-Roads & Bridges 2.960% 70.1%
State-Other Transportation Modes 0.040% 0.9%
Cities1 0.300% 7.1%
Counties2
0.200% 4.7%
School District Trust Fund 0.500% 11.8%
Department of Conservation 0.125% 3.0%
Department of Natural Resources 0.100% 2.4%
TOTAL STATE TAX RATE 4.225%
State Motor Vehicle & Drivers Licensing Fees:
Fees prior to
1/1/80 Fee Increases
after 1/1/80
State-Roads & Bridges, MSHP, DOR 100% 75%
Cities1 - 15%
Counties2
- 10%
Notes: 1 City share is based on population.
2 County share is based on assessed rural land valuation and rural road mileage.
Source: MoDOT.

Financial Snapshot - November 2017 18
Transportation Facts
Potential Transportation Revenue Options-Motor Fuel Tax
Yield from Increasing Gas Excise Tax 1
5-Cents 10-Cents 15-Cents
State (70%) $108,793,535 $217,587,073 $326,380,608
City (15%) 23,312,901 46,625,801 69,938,702
County (15%) 23,312,901 46,625,801 69,938,702
Total $155,419,337 $310,838,675 $466,258,012
Yield From Increasing Diesel Fuel Excise Tax 1
5-Cents 10-Cents 15-Cents
State (70%) $35,508,923 $71,017,847 $106,526,770
City (15%) 7,609,055 15,218,110 22,827,165
County (15%) 7,609,055 15,218,110 22,827,165
Total $50,727,033 $101,454,067 $152,181,100
Yield From Increasing All Motor Fuel Excise Tax 1
5-Cents 10-Cents 15-Cents
State (70%) $144,302,458 $288,604,920 $432,907,378
City (15%) 30,921,956 61,843,911 92,765,867
County (15%) 30,921,956 61,843,911 92,765,867
Total $206,146,370 $412,292,742 $618,439,112
Yield From Implementing Sales Tax On Motor Fuel 2
1.0% 3.0% 5.0%
State (70%) $52,898,711 $158,696,134 $264,493,555
City (15%) 11,335,438 34,006,314 56,677,191
County (15%) 11,335,438 34,006,314 56,677,191
Total $75,569,587 $226,708,762 $377,847,937
Yield From Implementing Consumer Price Index Adjustment On Motor Fuel 1,3
Year-1 Year-2 Year-3
State (70%) $10,389,777 $20,779,554 $31,457,936
City (15%) 2,226,381 4,452,762 6,740,986
County (15%) 2,226,381 4,452,762 6,740,986
Total $14,842,539 $29,685,078 $44,939,908
Notes: 1 Potential yields are based on fiscal year 2017 net diesel gallons taxed of 1,014,540,669
and net gasoline and gasohol gallons taxed of 3,108,386,748. 2 Potential yields are based on the gasoline price per gallon of $2.15 and the diesel price
per gallon of $2.36 as reported in the August 11, 2017 Missouri Energy Bulletin. Yields
exclude federal and state motor fuel excise tax in the calculation. 3 Potential yields are based on an annual consumer price index of 2.1 percent (15-year
average).
Source: MoDOT.

Financial Snapshot - November 2017 19
Transportation Facts
Potential Transportation Revenue Options-Sales Tax
Yield From Increasing Motor Vehicle Sales Tax
0.10% 0.25% 0.75% 1.00%
State (87.5%) $10,539,255 $26,348,138 $79,044,414 $105,392,551
City (7.5%) 903,365 2,258,412 6,775,235 9,033,647
County (5%) 602,243 1,505,608 4,516,824 6,022,432
Total $12,044,863 $30,112,158 $90,336,473 $120,448,630
Yield From Increasing General Sales Tax (Excludes Motor Vehicle Sales Tax)
0.10% 0.25% 0.75% 1.00%
State (100%) $71,571,370 $178,928,424 $536,785,273 $715,713,697
City (0%) 0 0 0 0
County (0%) 0 0 0 0
Total $71,571,370 $178,928,424 $536,785,273 $715,713,697
Yield From Increasing General Sales Tax (Includes Motor Vehicle Sales Tax)
0.10% 0.25% 0.75% 1.00%
State (98.2%) $82,110,625 $205,276,562 $615,829,687 $821,106,248
City (1.1%) 903,365 2,258,412 6,775,235 9,033,647
County (0.7%) 602,243 1,505,608 4,516,824 6,022,432
Total $83,616,233 $209,040,582 $627,121,746 $836,162,327
Source: Prepared by MoDOT based on fiscal year 2017 receipts.

Financial Snapshot - November 2017 20
Transportation Facts
Potential Transportation Revenue Options-Motor Vehicle and
Driver Licensing Fees and Alternative Fuel Decal Fees
Yield From Increasing All Passenger Car Fees
$5.00 $10.00 $25.00 $30.00
State (75%) $14,077,473 $28,154,947 $70,387,368 $84,464,842
City (15%) 2,815,495 5,630,990 14,077,474 16,892,969
County (10%) 1,876,997 3,753,993 9,384,983 11,261,979
Total $18,769,965 $37,539,930 $93,849,825 $112,619,790
Yield From Increasing All Truck & Bus Fees
$5.00 $10.00 $25.00 $30.00
State (75%) $5,664,693 $11,329,387 $28,323,468 $33,988,162
City (15%) 1,132,939 2,265,878 5,664,694 6,797,633
County (10%) 755,293 1,510,585 3,776,463 4,531,755
Total $7,552,925 $15,105,850 $37,764,625 $45,317,550
Yield From Increasing Driver Licensing Fees
$5.00 $10.00 $25.00 $30.00
State (75%) $4,456,537 $8,913,075 $22,282,687 $26,739,225
City (15%) 891,308 1,782,615 4,456,538 5,347,845
County (10%) 594,205 1,188,410 2,971,025 3,565,230
Total $5,942,050 $11,884,100 $29,710,250 $35,652,300
Yield From Increasing Alternative Fuel Decal Fees
10.00% 20.00% 30.00% 40.00%
State (75%) $31,659 $63,318 $94,977 $126,636
City (15%) 6,332 12,664 18,995 25,327
County (10%) 4,221 8,442 12,664 16,885
Total $42,212 $84,424 $126,636 $168,848
Source: Prepared by MoDOT based on Missouri Department of Revenue passenger car, truck and bus
registrations and driver license renewal information. Alternative fuel decal fee data is based on fiscal
year 2017 revenue received.

Financial Snapshot - November 2017 21
Transportation Facts
Potential Transportation Revenue Options - $100 million,
$250 million and $500 million
Yield from Increasing All Motor Fuel Excise Tax 1
2.5-Cents 6-Cents 12-Cents
State (70%) $72,151,230 $173,162,951 $346,325,902
City (15%) 15,460,978 37,106,347 74,212,694
County (15%) 15,460,978 37,106,347 74,212,694
Total $103,073,186 $247,375,645 $494,751,290
Yield From Implementing Sales Tax On Motor Fuel 2
1.3% 3.3% 6.6%
State (70%) $68,768,324 $174,565,746 $349,131,493
City (15%) 14,736,070 37,406,946 74,813,892
County (15%) 14,736,070 37,406,946 74,813,892
Total $98,240,464 $249,379,638 $498,759,277
Yield From Increasing Motor Vehicle Sales Tax
0.85% 2.1% 4.2%
State (87.5%) $89,583,669 $211,324,358 $442,648,716
City (7.5%) 7,678,600 18,970,659 37,941,318
County (5%) 5,119,067 12,647,106 25,294,212
Total $102,381,336 $252,942,123 $505,884,246
Yield From Increasing General Sales Tax (Excludes Motor Vehicle Sales Tax)
0.14% 0.35% 0.70%
State (100%) $100,199,918 $250,499,794 $500,999,588
City (0%) 0 0 0
County (0%) 0 0 0
Total $100,199,918 $250,499,794 $500,999,588
Yield From Increasing General Sales Tax (Includes Motor Vehicle Sales Tax)
0.12% 0.30% 0.60%
State (98.2%) $98,532,750 $246,331,875 $492,663,749
City (1.1%) 1,084,038 2,710,094 5,420,188
County (0.7%) 722,692 1,806,729 3,613,459
Total $100,339,480 $250,848,698 $501,697,396
Notes: 1 Potential yields are based on fiscal year 2017 net diesel gallons taxed of 1,014,540,669
and net gasoline and gasohol gallons taxed of 3,108,386,748. 2 Potential yields are based on the gasoline price per gallon of $2.15 and the diesel price
per gallon of $2.36 as reported in the August 11, 2017 Missouri Energy Bulletin. Yields
exclude federal and state motor fuel excise tax in the calculation.
Source: Prepared by MoDOT based on fiscal year 2017 receipts.

Financial Snapshot - November 2017 22
Transportation Facts
Potential Transportation Revenue Options - $100 million
and $250 million
Yield from Increasing All Passenger Car, Truck, Bus and Driver Licensing Fees
$15.50 $38.50
State (75%) $75,015,986 $186,330,029
City (15%) 15,003,197 37,266,006
County (10%) 10,002,132 24,844,004
Total $100,021,315 $248,440,039
Source: Prepared by MoDOT based on Missouri Department of Revenue passenger car, truck and bus
registrations and driver license renewal information.

Financial Snapshot - November 2017 23

Missouri Department of Transportation Financial Services Division 573.526.8106 www.modot.org 1-888-ASK-MODOT