Financial Literacy, Portfolio Choice and Financial Well-Being
22
Financial Literacy, Portfolio Choice and Financial Well-Being Zhong Chu 1 • Zhengwei Wang 1 • Jing Jian Xiao 2 • Weiqiang Zhang 1 Accepted: 18 March 2016 Ó Springer Science+Business Media Dordrecht 2016 Abstract This study examined potential effects of financial literacy on household port- folio choice and investment return, an indicator of financial wellbeing. Using data from the 2014 Chinese Survey of Consumer Finance, financial literacy was measured and further categorized into basic financial literacy and advanced financial literacy. This study tested the hypothesis that financial literacy affects household choice between stock and mutual fund. The results indicated that households with higher financial literacy, especially those with higher level of advanced financial literacy tended to delegate at least part of their portfolio to experts and invest in mutual fund. However, households who were overcon- fident about their financial literacy tended to invest by themselves and were more likely to hold only stocks in their portfolios. The findings also indicated that households with higher financial literacy had a better chance of receiving a positive investment return, suggesting that higher financial literacy may result in a better financial outcome. Keywords Household finance Financial literacy Overconfidence Financial well-being 1 Introduction Financial products are everywhere in our modern life. The rapid spread of financially complex products is increasingly requiring people to decide how much to save and where to invest and, during retirement, to take on responsibility for careful decumulation so as not to outlive their assets while meeting their needs, which requires households to be & Zhong Chu [email protected] 1 PBC School of Finance, Tsinghua University, Beijing 100083, People’s Republic of China 2 Department of Human Development and Family Studies, University of Rhode Island, Transition Center, 2 Lower College Road, Kingston, RI 02881, USA 123 Soc Indic Res DOI 10.1007/s11205-016-1309-2
Transcript of Financial Literacy, Portfolio Choice and Financial Well-Being

Financial Literacy, Portfolio Choice and FinancialWell-Being
Zhong Chu1 • Zhengwei Wang1 • Jing Jian Xiao2 •
Weiqiang Zhang1
Accepted: 18 March 2016� Springer Science+Business Media Dordrecht 2016
Abstract This study examined potential effects of financial literacy on household port-
folio choice and investment return, an indicator of financial wellbeing. Using data from the
2014 Chinese Survey of Consumer Finance, financial literacy was measured and further
categorized into basic financial literacy and advanced financial literacy. This study tested
the hypothesis that financial literacy affects household choice between stock and mutual
fund. The results indicated that households with higher financial literacy, especially those
with higher level of advanced financial literacy tended to delegate at least part of their
portfolio to experts and invest in mutual fund. However, households who were overcon-
fident about their financial literacy tended to invest by themselves and were more likely to
hold only stocks in their portfolios. The findings also indicated that households with higher
financial literacy had a better chance of receiving a positive investment return, suggesting
that higher financial literacy may result in a better financial outcome.
Keywords Household finance � Financial literacy � Overconfidence � Financialwell-being
1 Introduction
Financial products are everywhere in our modern life. The rapid spread of financially
complex products is increasingly requiring people to decide how much to save and where
to invest and, during retirement, to take on responsibility for careful decumulation so as not
to outlive their assets while meeting their needs, which requires households to be
& Zhong [email protected]
1 PBC School of Finance, Tsinghua University, Beijing 100083, People’s Republic of China
2 Department of Human Development and Family Studies, University of Rhode Island, TransitionCenter, 2 Lower College Road, Kingston, RI 02881, USA
123
Soc Indic ResDOI 10.1007/s11205-016-1309-2

well-equipped with financial literacy. However, low financial literacy is found among
consumers in many countries (Lusardi and Mitchell 2014).
There are various literatures linking financial literacy with economic decisions. It has
been shown that households with high financial literacy do better in financial and retire-
ment planning (Lusardi and Mitchell 2005; Lusardi and Mitchell 2007). Also they perform
better in credit card usage and dealing with debt (Disney and Gathergood 2013; Mottola
2013). There are also evidences showing a strong relationship between financial knowl-
edge and the likelihood of engaging in desirable financial practices: paying bills on time,
tracking expenses, budgeting, paying credit card bills in full each month, saving out of
each paycheck, maintaining an emergency fund, diversifying investments, and setting
financial goals (Hilgert et al. 2003). Also financial literacy is found to contribute positively
to financial satisfaction (Xiao et al. 2014; Ali et al. 2014).
On the other hand, low financial literacy is associated with poor financial decisions in
equity investment, debt financing, as well as long term retirement planning and these
decisions can lead to decrease in welfare. Individuals with lower level of financial literacy
are less likely to participate in stock market (Kimball and Shumway 2006; Van Rooij et al.
2011; Yoong 2011) and thus can forgo the substantial equity gain (Cocco et al. 2005).
Households with lower level of financial literacy can also make suboptimal decisions when
choosing loans or mortgages (Lusardi and Tufano 2008; Utkus and Young 2011; Moore
2003), and suffer from problems such as debt accumulation (Lusardi and Tufano 2008),
bankruptcy and foreclosure (Gerardi et al. 2010).
Financial literacy has not yet been directly linked to how household choose among
different kinds of assets. There are literatures about household financial choices and
diversifications, however, using trading data, researchers failed to measure financial lit-
eracy accurately (Bailey et al. 2006). In this study, we used data from the 2014 Chinese
Survey of Consumer Finance and focused on household’s choice between the two risky
assets, stock and mutual fund. The survey covered nearly all provinces of China and
included questions about household’s asset and debt, income and expenditure, financial
plans as well as financial literacy. The section of financial literacy in the survey provides
opportunities to link financial literacy with other household financial outcomes. The unique
contributions of this study are using refined measurements for financial literacy and
directly linking financial literacy to household financial decisions. The research results
indicate that people with higher financial literacy, especially those who understand
advanced financial knowledge well, tend to add mutual funds to their portfolio. Besides, we
also propose a definition about the overconfidence in financial literacy. People who are
overconfident about financial literacy tend to only invest in stock. Finally, positive port-
folio return, an indicator of household financial wellbeing,is found to be linked to financial
literacy.
This paper is organized as following: in Sect. 2, we present an overview of Chinese
financial market. In Sect. 3, we provide a review of related literature and present
hypotheses. In Sect. 4, we describe the data and variables. In Sect. 5, we discuss the
results. In Sect. 6, we present results of robustness check using an alternative way to
calculate financial literacy. In the last section, we conclude with a brief discussion.
Z. Chu et al.
123
2 Overview of Chinese Financial Market
China’s stock market was established around 1992 and has grown in at a phenomenal pace
since then: the number of listed stocks was 13 and the aggregate market capitalization was
US$1.3 billion in 1991 (Eun and Huang 2007), while the number of listed stocks increased
to 2800 and the aggregate market capitalization has risen to more than US$7 trillion by the
end of 2015 (China Securities Regulatory Commission 2015). However, China has only
slowly developed a legal framework for stock markets and has a weak law enforcement
record, which played at best a marginal role in China’s market development (Pistor and Xu
2005). There are evidences showing that China’s stock markets are not efficient in that
prices and investors’ behavior are not necessarily driven by fundamental values of listed
firms (Allen et al. 2012). Morck et al. (2000) found that stock prices are more ‘‘syn-
chronous’’ (stock prices move up and down together) in emerging countries including
China than that in developed countries. They attribute this phenomenon to poor investor
protection and imperfect regulation in emerging markets. Considering all these factors, it is
not an easy job for households to invest in the Chinese stock market.
Mutual funds, as an investment instrument, have been playing a more and more critical
role in the Chinese financial market. As the number of the mutual funds in the Chinese
financial market grows rapidly, and the types of mutual funds increase as well as the
investor demand for diversification. In China, mutual fund companies have become the
most important institutional investors, who are not only optimizing the investors’ structure
in the Chinese security market but also promoting the value investment concept to the
public (Zhao and Wang 2007). However, mutual fund trading is not as easy as stock
trading. Some mutual funds can be traded just like stocks while some need to be bought
from banks or directly from the mutual fund companies. Therefore, retrieving the infor-
mation and trading procedures of these mutual funds are much more time-costing than
stocks.
Almost all (98.9 %) households reported ownership of some financial assets in China
(Liao et al. 2010). Stocks and mutual funds are most held among risky financial assets (Gan
2013). In this study, stock refers to the shares of listed company which can be traded in the
two stock exchanges (the Shanghai and Shenzhen stock exchanges) and mutual fund refers
only to public offering mutual funds, such as the mutual funds sold by commercial banks
and mutual fund companies. Different from financial markets in developed countries, the
financial advising industry in China is not well developed. Financial advice providers such
as private banks offer services to households with more than USD 1 million of
investable assets, which means only households that are extremely wealthy can obtain
professional advice (Wang et al. 2014). Therefore, we regard financial literacy as an
important factor when we discuss Chinese household’s portfolio choice and their financial
wellbeing, due to the lack of support from financial service professionals. Also, this gives
us the opportunity to explore the net effect of financial literacy without worrying about the
potential compounding effect of financial advising service.
Most existing studies on financial literacy using data from the United States and other
European countries (Puri and Robinson 2007; Christelis et al. 2010; Van Rooij et al. 2011).
Because China is a large, emerging economy, it is important to study the role of financial
literacy in how Chinese households invest in risky assets. China’s aggregate household
saving rate is among the highest in the world (Wang and Wen 2012). And the long tradition
of ‘‘stay in the middle’’ that tells one to stay from extreme and proverbs such as ‘‘One
misstep could cause a thousand year disaster’’ shape the culture of Chinese households to
Financial Literacy, Portfolio Choice and Financial Well-Being
123

avoid risk. However, there are also research findings showing that the Chinese are more
risk tolerant than Americans in their financial decisions which may also due to culture
reasons (Fan and Xiao 2006; Weber and Hsee 1998). Therefore, the culture difference may
affect financial decisions of Chinese households.
3 Prior Research and Hypotheses
Traditional consumption theories such as the life cycle hypothesis (Modigliani and
Brumberg 1954) and permanent income hypothesis (Friedman 1957) assume that indi-
viduals have the capacity to undertake complex economic calculations and to have
expertise in dealing with financial markets (Lusardi and Mitchell 2014). Lusardi et al.
(2013) construct a multi-period dynamic life cycle model where individuals not only select
capital market investments, but also undertake investments in financial knowledge and
people would pay a certain amount to obtain more financial knowledge. Their conceptual
model suggests that higher financial literacy is associated with better investment portfolio
choices and outcomes.
3.1 Choice Between Stock and Mutual Fund Investing
Consumers with low financial literacy may seek financial advice in investment. Financial
advising plays an important role here. For people that are not good at dealing with complex
financial products, they can turn to financial advisors for help. Financial institutions could
provide products and processes to improve the financial wellbeing of their customers (Vlaev
and Elliott 2013). A substitute for financial advice, although not a perfect one, is mutual fund.
Households can pay a fee and delegate part of their portfolio to mutual fund managers, who
are well educated in finance, and usually have rich experience of investing in a specific field.
Research literatures show that mutual fund managers do a good job in both stock selection
(Elton et al. 1996; Daniel et al. 1997; Carhart 1997) and timing ability (Jiang et al. 2007;
Kaplan and Sensoy 2008; Elton et al. 2012). As for mutual fund performance, it has been
documented that risk adjusted returns ofmutual fund, net of fees and expenses are comparable
to returns of the market return (Ippolito 1989), and the vast majority (80 %) of active man-
agers having at least enough skills to cover their fees (Berk and Green 2004).
Without the help of professional financial adviser, how do households with different
levels of financial literacy make their portfolio decisions? First, we considered the par-
ticipation problem. According to the financial theory, even households with relatively low
risk tolerance should participate, to some degree, directly or indirectly, in the stock market
(Campbell 2006). However, many families have failed to participate in risky asset market.
One explanation is that different households have different preferences about risk or
uncertainty, some are extremely loss avert and resist to participate (Barberis et al. 2006).
Ambiguity aversion could also lead to under-participation (Dimmock et al. 2013). Another
explanation is that investors have different expectations about the future return of stocks, in
which some believe their risk adjusted return is just below zero. Hurd et al. (2011) find that
expectations do affect household stock market participation. Those who are more opti-
mistic are more likely to participate in stock market (Puri and Robinson 2007). Moreover,
another popular explanation is that families fail to join the stock market because they are
presented with fixed cost (Vissing-Jørgensen 2004). The costs include monetary cost and
information cost, and a household makes the decision to participate based on the tradeoff
Z. Chu et al.
123

between the cost and return. And therefore, factors that could change the participation cost
could also influence household participation choice. Monetary cost usually includes
income and wealth (Calvet et al. 2007). For information cost, several factors are considered
to be linked with the participation puzzle: cognitive ability (Christelis et al. 2010; Grinblatt
et al. 2011; Agarwal and Mazumder 2013), awareness of stocks (Guiso and Jappelli 2005),
education level (Cole et al. 2014) and social interactions (Hong et al. 2004). Background
risk can be another factor that influences risky asset participation. Heaton and Lucas (2000)
find that background risks from sources such as entrepreneurial income influence portfolio
allocations. Age and home ownership are also related background risk factors and thus
influence participation (Cardak and Wilkins 2009). Household financial literacy may be
considered as another background risk factor.
3.2 Financial Literacy and Portfolio Choice
In this study, we focused on the role of financial literacy in consumer decisions on
choosing stock or mutual fund, which are the two most popular risky assets in China. As
mentioned in the Sect. 2, under the background of Chinese financial markets, financial
advising service is rare and therefore financial literacy plays an important role here. We
propose two competing hypotheses below:
H1a Households with higher financial literacy are more likely to invest in stocks directly.
H1b Households with higher level of financial literacy are more likely to delegate part of
their portfolios to fund managers and invest in mutual funds.
H1a is justified because that they have confidence in their own financial knowledge and
the trading cost of direct stock investing are much lower than investing in mutual fund. The
competing hypothesis is based on the saying that the more wit, the less courage. Investing
in risky assets is a complex task, and people who know less about the potential risk could
be more aggressive and do direct stock investment, which is also much easier than mutual
fund trading in Chinese financial markets. However, people who are equipped with more
financial knowledge are more careful about direct investment since they know that com-
pared to stock, mutual fund is more diversified in the first place. Also, regulations and rules
in China require mutual fund managers to fully diversify their portfolios. And thus people
with high level of financial literacy choose to delegate part of their money to mutual funds,
to give more diversification to the portfolio and earn profit from experts managed
investment, although they have to pay extra management fees.
There are mixed evidences from the research literature. The H1a is supported by several
studies. Korniotis and Kumar (2013) find that ‘‘smart’’ investor possess more related
information and tend to hold concentrated portfolios with only a handful of stocks. Bailey
et al. (2006) find that investors who are smarter or are with stronger behavioral biases, a
preference for gambling, or residence in states where lotteries are popular, tend to choose
stock. Alessie et al. (2004) conclude that mutual fund is particularly attractive for investors
with little financial knowledge.
However, Gaudecker (2015) finds that people with below-median financial literacy trust
their own decision-making capabilities and lose an expected 50 basis points (0.5 %) on
average. And this finding supports H1b that people with high level of financial literacy
choose to delegate part of their money to mutual funds and household with little knowledge
choose to invest on their own. Van Rooij et al. (2011) show that those who display high
levels of financial literacy are more likely to rely on formal sources such as newspapers,
Financial Literacy, Portfolio Choice and Financial Well-Being
123

financial advisors, and the internet. Therefore, if mutual fund acts as the substitute of
financial advice, we can infer that households with high level of financial literacy will
choose to invest in mutual fund, which supports H1b.
3.3 Financial Literacy Overconfidence and Portfolio Choice
In this study, we also examined whether financial literacy overconfidence affects house-
hold portfolio choice. The financial literacy overconfidence is defined based on the dif-
ference between perceived financial literacy and subjective financial literacy. And this is a
supplement for the first and main topic which discusses the financial literacy and portfolio
choice. Overconfidence has been linked with over trading in stock market (Barber and
Odean 2001; Grinblatt and Keloharju 2009). However, its relationship with portfolio
choice between stock and mutual fund has not been fully addressed. Bailey et al. (2006)
find that unsophisticated investors who have an illusion of control, which may be generated
by overconfidence, prefer individual stocks. Also there is evidence that financial literacy
overconfidence is correlated with higher possibility of stock market participation (Xia et al.
2014). We therefore propose the following hypothesis:
H2 Overconfident consumers are more likely to hold stocks instead of mutual funds.
3.4 Financial Literacy and Investment Return
We also took financial wellbeing into consideration in this study. Financial wellbeing has
been defined in various way, such as retirement planning (Lusardi and Mitchell 2005),
financial management (Lusardi and Mitchell 2007; Vlaev and Elliott 2013), capability of
dealing with debt (Tsai et al. 2014) and financial satisfaction (Ali et al. 2014; Xiao et al.
2014). In this study, we consider the household portfolio performance as an indicator of
financial wellbeing, which is also the result of household portfolio choice. There are
inconsistent results in literatures about how financial literacy could affect household
portfolio performance. Calvet et al. (2007) find that financially sophisticated households
invest more aggressively, and overall they incur higher return losses from under-diversi-
fication. However, Gaudecker (2015) shows that nearly all households that score high on
financial literacy achieve reasonable investment outcomes. In Korniotis and Kumar (2013),
results indicate that ‘‘smart investors,’’ who are more financial sophisticated outperform
dumb investors by about 3 % annually on a risk-adjusted basis. As it is discussed in
Sect. 2, Chinese stock market has suffered from great variation, and financial literacy may
play an important role in household portfolio performance. And similar to other kind of
financial wellbeing, we propose a hypothesis as follows:
H3 Positive return of the investment portfolio is positively associated with financial
literacy.
4 Methodology
4.1 Data
We used data from the 2014 Chinese Survey of Consumer Finance sponsored by China
Center for Financial Research and carried out by the Institute of Social Science Survey
Z. Chu et al.
123

(ISSS). The survey covers nearly all the provinces of mainland China and includes
questions about household’s asset and debt, income and expenditure, financial plans as well
as financial literacy. The survey included 3906 households living in 25 provinces of
mainland China, except for Xinjiang, Tibet, Qinghai, Inner Mongolia, Ningxia, and Hai-
nan. Designed by an interdisciplinary group of scholars, the survey collected a sample
representative of the national population. The survey covers 1 % of the nation’s total
population, selected by a stratified multi-stage clustering sampling method from the
Population Census, with the strata set at the provincial level and the ultimate sampling unit
set at the residential community level. (Gao et al. 2014; Li and Wu 2014). More details of
the survey and data are described in Xie and Hu (2014).
4.2 Measures of Financial Literacy
Financial literacy was measured with information from the answers to 12 questions about
some financial knowledge. And the specific questions are included in the ‘‘Appendix’’.
The twelve questions were further divided into two categories following Van Rooij
et al. (2011). One set of questions is about basic financial knowledge where no questions
are about the stock market, stocks, and bonds. The other set of questions are about more
advanced financial knowledge as well as knowledge related to stocks, the stock market,
and other financial instruments. The survey questions measuring financial literacy in the
2014 Chinese Survey of Consumer Finance are very similar to those used in Van Rooij
et al. (2011) except for the question about the central bank. The first seven questions were
used to measure basic financial literacy and the last five questions measured advanced
financial knowledge. In data analyses, we used several variables to measure household
financial literacy. We first introduced a general measure of financial literacy (variable FL),
represented by the total number of correct answers out of the twelve questions. Then we
0%
10%
20%
30%
40%
50%
60%
70%
80%
90%
Correct Incorrect Do not know
Fig. 1 Answers to financial literacy questions. Source Own calculation based on the financial asset sectionof 2014 Chinese Survey of Consumer Finance
Financial Literacy, Portfolio Choice and Financial Well-Being
123

created two refined measures of financial literacy, Financial_basic and Financial_adv.
Financial_basic measures the basic knowledge, represented by the right answers out of the
first seven questions, while Financial_adv measures the advance knowledge, represented
by the right answers out of the last five questions.
Figure 1 reports the proportion of households providing correct, incorrect, and ‘‘do not
know’’ answers to each of the twelve basic literacy questions. According to Fig. 1, the
households in the sample have good grasp of common financial questions, such as high
return is accompanied by high risk and money has time value, in which 85 % of
respondents provide the right answer to the relationship between risk and return and 68 %
of respondents knows money today is more worthy than the same amount of money next
year. However, when it comes to questions like ‘‘the risk of stock’’ and ‘‘the meaning of
holding stocks,’’ the percentages of correct answers dropped sharply and the percentages of
‘‘do not know’’ reply increased. Only 13 % households answered the question about
mutual fund correctly, while 16 % knew what the rights and responsibilities of holding
stocks are. 42 % household could not compare the risk between mutual fund mainly
investing in stock and those mainly investing in bond.
For financial literacy variables, the mean of variable FL is 5.49. Only 1 % respondents
get all 12 questions right, while 5.61 % of all respondents give wrong answers to all 12
questions. For the basic knowledge part, the maximum value of financial_basic is 7, and
the mean value is 3.90. For advance knowledge part, the maximum value of financial_adv
is 5, while the mean value is 1.59.
4.3 Financial Asset Holding Variables
In this study, we focused on stock and mutual fund holdings in household portfolios. We
used the dummy variable stock_holding to indicate whether a household holds stocks and
used fund_holding to indicate mutual fund holding. And we used pariticipation to indicate
whether a family holds stock, mutual fund, or both, which represents whether the house-
hold participates in the financial market.
The summary statistics of these variables are presented in Table 1. Only 13.4 %
households held stocks and/or mutual funds, and about 10 % held stocks. For mutual fund
holding, the percentage (5.5 %) is just about half of stock holding. And these rates are very
close to those reported by Gan (2013) who used another national survey of consumer
finance in China. Therefore, there is participation puzzle (Haliassos and Bertaut 1995) in
the China stock market, since the participation rate is relatively low. Also, it seems that
stock is more popular than mutual fund among Chinese households.
Table 1 Household portfolioholding choice and percentage
Source Own calculation based onthe financial asset section of2014 Chinese Survey ofConsumer Finance
Household choice Frequency Percentage (%)
Participate into at least one asset 522 13.36
Stock holding 397 10.16
Fund holding 216 5.53
Only stock holding 306 7.83
Only fund holding 125 3.56
Holding both stock and fund 91 2.33
Z. Chu et al.
123

4.4 Control Variables
In this study, we also included several control variables, which according to the literatures,
may affect portfolio decisions. Age may affect household participation choice in two
aspects. On the one hand, age may affect cognitive ability which has been shown to affect
household financial decision making (Christelis et al. 2010; Grinblatt et al. 2011; Agarwal
and Mazumder 2013). On the other hand, the elderly are faced with more health problems
and therefore have higher background risk which affect family’s participation in risky asset
(Cardak and Wilkins 2009). Also, the square of age is included due to the life cycle
hypothesis, which is also related to the asset allocation decision. In the dataset, the age
variable refers to the age of the family member who answers financial literacy questions.
And the family member is supposed to be responsible for household investment decision.
We also included gender. According to Lusardi and Mitchell (2008) gender differences
are found in long-term financial planning. Also males are more prone to participate in risky
investment due to overconfidence (Barber and Odean 2001). The gender variable is a
dummy one, 1 represents male, 0 female. 45 % of the respondents are male. Similar with
age, the gender variable refers to the gender of the family member who answers the
financial literacy questions. The average value of the age variable is 50.42.
We also included income and business owning status to control for the background risk
(Heaton and Lucas 2000). The income variable represents the income of the household in
the last 12 months. The mean value of income 71867.35 renminbi yuan. The natural
logarithm value of income was used in the analyses. The business owner variable is a
dummy one, 1 means there are family members who own a business. 13 % of the
households have their own businesses. We also included housing condition variable that
may affect household background risk. There are four types of living conditions: own or
partial own the house, special house provided by the government, rent the current house or
other types. We included dummy variables for these types and control for the potential
background risk.
Risk attitude may affect household portfolio choice (Vissing-Jørgensen and Attanasio
2003; Barberis et al. 2006), and we included the risk attitude variable as a control variable.
The higher the value, the more risk averse the household is. If the value is 1, the respondent
prefers products of both high risk and high return. If the value is 4, the respondent is
extremely risk averse and would not like to take any risk at all. 45 % of the respondents
would not like to take any risk at all, and the mean value of the risk attitude is 3.
We also included family size, which negatively affects the average income per family
member (Chen and Yang 2015) and thus could affect household portfolio choice. The
mean value of the family size is 3.20. Besides we also included marriage status following
previous research on risky asset participation (Xia et al. 2014; Grinblatt et al. 2011). The
variable marriage is a dummy variable, where 1 represents the respondent is married.
4.5 Empirical Strategy
We proposed two competing hypotheses. One hypothesis is that people with higher
financial literacy are more likely to choose to invest by themselves and invest in stock
directly. The other is ‘‘the more wit, the less courage’’ hypothesis: household with higher
level of financial literacy are more likely to choose to delegate at least part of their money
to mutual funds.
Financial Literacy, Portfolio Choice and Financial Well-Being
123
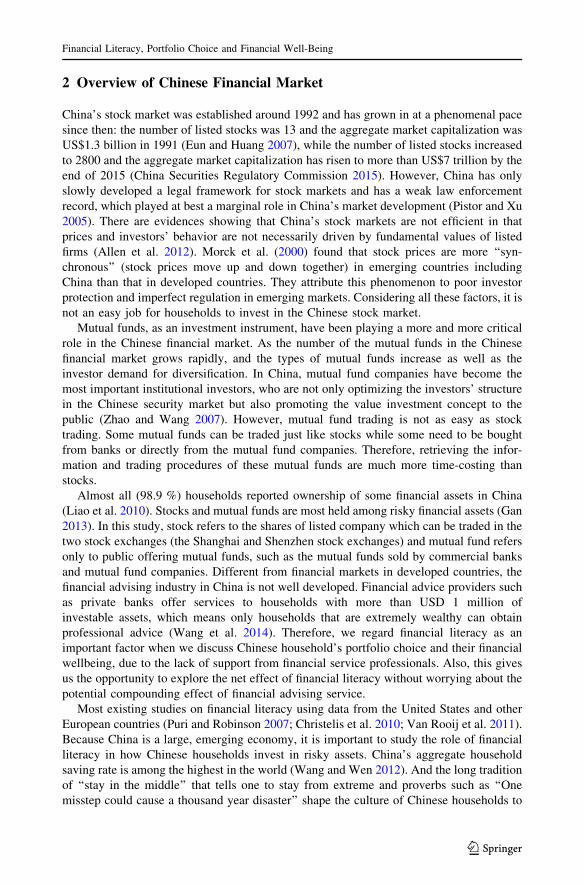
In the model proposed by Georgarakos and Inderst (2011), the process of household
decision making is generalized into a two steps game: people first decide whether to
participate in financial market and then decide how to choose between two risky assets. It
is assumed that for a given investor both products can be equally suitable, though actually
only one provides the best ‘‘fit.’’ The expected utility from a suitable product is denoted by
Uh, that from a non-suitable product by the strictly lower utility Ul. The investor’s expected
utility from choosing the safe and less complex product is denoted by U0. Since the authors
solve the game backwards, the second step is considered first. Investors with different
levels of perceived financial literacy have different distributions of posterior belief and thus
have distinct probabilities of choosing a certain asset in the second step. The investor then
compares the expected utility (U*) of the second step with U0, and will only participate if
the expected utility is larger than U0. It can be derived from the model that U* - U0 are
larger when perceived financial capability is higher. And thus perceived financial literacy
influences both steps.
We followed the approach of Georgarakos and Inderst (2011). However we used
objective financial literacy rather than the perceived financial literacy here. There are two
reasons we used objective financial literacy here. First of all, objective financial literacy is
more accurately measured in the survey. The choice of the households concentrated in the
middle level (average level of financial literacy or below average) which may not accu-
rately reflect the true level of financial literacy, and this may be due to the tradition of
Chinese to choose to ‘‘stay in the middle’’. Second, most financial literacy studies use
objective financial literacy if they use survey data as it is in this research (Hung et al. 2009;
Hastings et al. 2013). And we will discuss the perceived financial literacy in the next
session.
For the first step, we considered the two risky assets; stock and mutual fund as a whole,
and included the financial literacy variable and controls for other related factors. And it can
be modeled by Eq. (1).
Pr Participationh ¼ 1ð Þ ¼ aþ b financial literacyh þ Z 0hd0 þ eh ð1Þ
where ‘‘h’’ represents the index of the household. The way we measured financial literacy
has been discussed in Sect. 3. And Zh represents the vector of demographic characters. eh isthe error term. We use ; aþ b financial literacyh þ Z 0
hd0� �
to represent the chance that
household participate in financial market.
For the second step, households decide which asset they want to buy, stock or mutual
fund. And we used Eq. (2) to estimate how different factors affect the choice between
stock and fund.
Pr fund holdinghjParticipationh ¼ 1ð Þ ¼ af þ bf financial literacyh þ Z 0hd0 þ eh ð2Þ
We used Probit model to estimate Eqs. (1) and (2) in empirical test. The link between
the two equations is that, for Eq. (1), all households are included, while only households
who choose to participate in Eq. (1) are considered in Eq. (2). And the reason we do this is
that only households who choose to participate in the first step can actually choose between
the two assets.
If the hypothesis that people with high financial literacy choose to invest by themselves
and invest in stock directly is right, the coefficient bf should be negative, since household
with higher financial literacy simply want to invest all by themselves and not delegate it to
others. And they would not like to invest in mutual fund. If the opposite is true, bf shouldbe positive.
Z. Chu et al.
123

5 Results
5.1 Financial Literacy and Market Participation
We estimated Eq. (1) using the Probit model. We used two sets of measures of financial
literacy. The first set includes FL that was to measure financial literacy as a whole. And the
second set included financial_basic and financial_adv that measure basic financial
knowledge and advance financial knowledge, respectively. The results are shown in
Table 2.
In column (1) and (3) of Table 2, we used the FL measure of financial literacy and
column (2) and (4) financial_basic and financial_adv. First, we did not include control
Table 2 Multivariate analysis of market participation: Probit results
(1) (2) (3) (4)Participation Participation Participation Participation
FL 0.195*** 0.170***
(0.0109) (0.0141)
Financial_basic 0.147*** 0.112***
(0.0179) (0.0210)
Financial_adv 0.262*** 0.258***
(0.0231) (0.0276)
Age 0.110*** 0.113***
(0.0152) (0.0152)
Agesquare -0.000935*** -0.000953***
(0.000147) (0.000147)
Logincome 0.361*** 0.365***
(0.0474) (0.0474)
Business owner -0.199** -0.198**
(0.0997) (0.100)
Gender -0.281*** -0.287***
(0.0642) (0.0644)
Risk attitude -0.263*** -0.255***
(0.0371) (0.0373)
Family size -0.0920*** -0.0922***
(0.0270) (0.0271)
Marriage status -0.119 -0.112
(0.105) (0.105)
Province control variables Yes Yes
Living condition control variables Yes Yes
_Cons -2.346*** -2.264*** -7.814*** -7.881***
(0.0794) (0.0816) (0.702) (0.704)
N 3906 3906 3654 3654
Pseudo R2 0.126 0.129 0.276 0.281
Standard errors in parentheses, * p\ 0.1, ** p\ 0.05, *** p\ 0.01
Financial Literacy, Portfolio Choice and Financial Well-Being
123

variables. The results in column (1) and (2) indicate that, financial literacy, in both two sets
of measurements is significantly associated with financial market participation. After
control variables were entered, the coefficients and significance levels of financial literacy
variables are nearly unchanged. Van Rooij et al. (2011) find that households with higher
financial literacy are more likely to participate. And the regression results are consistent
with the previous study. In addition, age has a U shape effect on participation, the coef-
ficient of age is positive and significant, while the coefficient of age square is negative and
significant. This implies that as age increases investors participate more, however, when it
comes to a certain point (for column (3) 59 years old and 60 for column (4)), the proba-
bility of participation drops. This U shape effect may be the combine effect of age on
cognitive ability and background risk. Most Chinese workers retire at the age of sixty,
some face great decline of income. And the probability of getting a disease is higher than
the younger workers. The cognitive ability can also decay due to aging. All these factors
can affect household market participation. Self-employed respondents are less likely to
participate in the financial market. And this may be due to the fact that they have already
Table 3 Multivariate analysis ofmutual fund holding and return:Probit results
Standard errors in parentheses,* p\ 0.1, ** p\ 0.05,*** p\ 0.01
(1) (2)Fund_holding Fund_holding
FL 0.0542*
(0.0289)
Financial_basic 0.00492
(0.0444)
Financial_adv 0.117**
(0.0522)
Age 0.0234 0.0277
(0.0341) (0.0343)
Agesquare -0.000146 -0.000186
(0.000333) (0.000334)
Logincome 0.0455 0.0429
(0.0888) (0.0888)
Business owner 0.196 0.189
(0.195) (0.195)
Gender -0.226* -0.237*
(0.122) (0.123)
Risk attitude 0.213*** 0.219***
(0.0772) (0.0773)
Family size 0.0568 0.0572
(0.0608) (0.0608)
Marriage status -0.224 -0.230
(0.217) (0.218)
Province control variables Yes Yes
Living condition control variables Yes Yes
_Cons -1.642 -1.634
(1.433) (1.433)
N 509 509
Pseudo R2 0.0614 0.0645
Z. Chu et al.
123
face great risk. According to the result, risk aversion is also associated with participation
(the coefficient is negative significant), the more risk averse, the less likely to participate.
And this result is consistent with Calvet et al. (2007).
5.2 Financial Literacy and Portfolio Choice
We also tested the two hypotheses by estimating Eq. (2). And the result is presented in
Table 3. The results of the first column indicate that households with general high financial
literacy are more likely to choose mutual fund when they make their portfolio choice.
While when we turned to the result in column (2), in which we separated financial literacy
into two parts, we found that only advanced financial literacy was associated with mutual
fund holding. And the coefficient is larger than that of general financial literacy (FL). This
means that getting one more question right in advance financial knowledge section has
twice the effect of getting one more question right in the general financial literacy section
on the participation of mutual fund. The results suggest that we should reject the
hypothesis that people with high financial literacy just choose to invest by themselves and
invest in stock directly, because the estimation of the financial literacy coefficient is
positive and significant in both the two sets of measurements. And this means that the
famous saying ‘‘the more wit, the less courage’’ also works here. Also, advanced financial
literacy corresponds to questions about risk and financial market, which implies that
households who understand the market and risk well are more prone to invest in mutual
fund. We also found that the coefficient of gender is negative and significant. And this
indicates that males are less likely to invest in mutual fund and are more likely to invest
only in stock, consistent with previous research in which males are more likely than
females to have behavior bias due to overconfidence (Barber and Odean 2001). Besides,
the coefficient of risk attitude is positive and significant, which suggests more risk averse
households would tend to invest in mutual fund, matching the diversification function of
mutual fund.
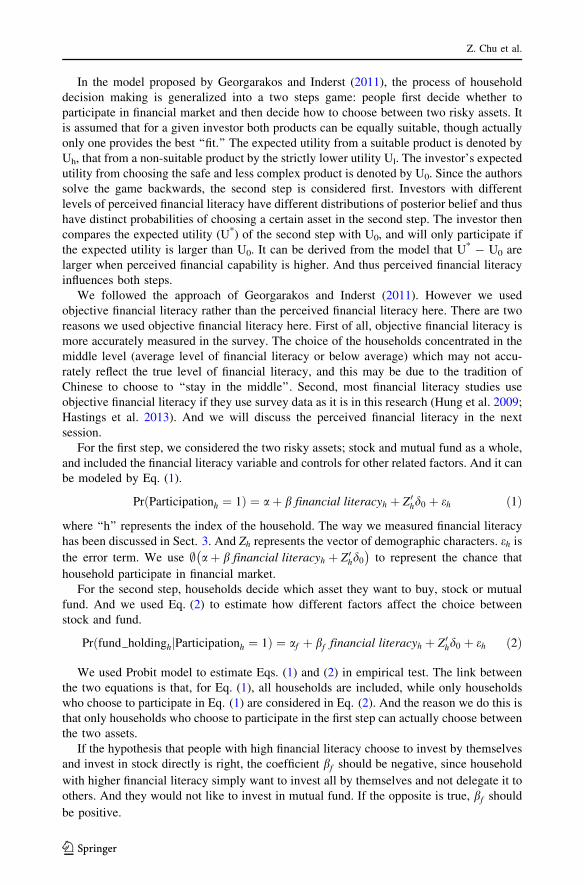
5.3 Confidence or Overconfidence
In this section, we provide an explanation to the question that if households with higher
financial literacy tend not to invest in stocks, what are other households that do it?
Georgarakos and Inderst (2011) argue that investors use the perceived financial literacy to
make financial decision. In the survey used in this study, there are five levels of perceived
financial literacy for the respondents to choose, from level 1 to level 5, and level 1 means
Table 4 Answer distribution ofperceived financial literacy
Source Own calculation based onthe financial literacy section of2014 Chinese Survey ofConsumer Finance
Answers Frequency Percent (%)
Level 1: Far above average 31 0.79
Level 2: Above average 199 5.09
Level 3: Average level 1552 39.73
Level 4: Below average 1590 40.71
Level 5: Far below average 467 11.96
Refuse to answer 1 0.03
Do not know 66 1.69
Financial Literacy, Portfolio Choice and Financial Well-Being
123

the respondent thinks her/his level of financial literacy is far beyond average, and level 5
represents far below average. And the distribution of the answers is listed in Table 4.
We first used Eqs. (1) and (2) to test the effect of perceived financial literacy. The
results are listed in Table 5. In column (1) and (2), the results indicate perceived financial
literacy may affect participation while the effect on the portfolio choice is insignificant. We
then used a dummy variable to represent whether the respondent thinks he or she has above
average financial literacy. And the result in column (3) and (4) are similar to (1) and (2).
Table 5 Effect of perceived financial literacy and overconfidence on stock holding: Probit result
(1)Participation
(2)Stock_not_fund
(3)Participation
(4)Stock_not_fund
(5)Stock_not_fund
Perceivedfinancialliteracy
0.127*** 0.000559
(0.0394) (0.0775)
Above averageperceivedfinancialliteracy
0.303*** 0.0577
(0.107) (0.186)
Over_confidence 0.276*
(0.149)
Age 0.105*** -0.0238 0.103*** -0.0243 -0.0132
(0.0147) (0.0341) (0.0147) (0.0341) (0.0352)
Agesquare -0.000957*** 0.000182 -0.000942*** 0.000187 0.0000847
(0.000143) (0.000333) (0.000142) (0.000333) (0.000342)
Logincome 0.466*** -0.0705 0.472*** -0.0736 -0.0428
(0.0453) (0.0887) (0.0452) (0.0884) (0.0909)
Business owner -0.273*** -0.174 -0.280*** -0.174 -0.177
(0.0967) (0.194) (0.0968) (0.194) (0.203)
Gender -0.161*** 0.184 -0.162*** 0.181 0.158
(0.0613) (0.121) (0.0613) (0.121) (0.126)
Risk attitude -0.344*** -0.175** -0.356*** -0.172** -0.183**
(0.0356) (0.0773) (0.0351) (0.0758) (0.0773)
Family size -0.118*** -0.0525 -0.119*** -0.0522 -0.0429
(0.0258) (0.0607) (0.0257) (0.0606) (0.0624)
Marriage status -0.0321 0.192 -0.0320 0.198 0.236
(0.102) (0.220) (0.102) (0.220) (0.223)
Province andlivingconditioncontrolvariables
Yes Yes Yes Yes Yes
_Cons -7.420*** 1.382 -7.255*** 1.421 0.593
(0.677) (1.419) (0.674) (1.425) (1.470)
N 3601 507 3601 507 472
Pseudo R2 0.225 0.0558 0.224 0.0560 0.0642
Standard errors in parentheses, * p\ 0.1, ** p\ 0.05, *** p\ 0.01
Z. Chu et al.
123

Therefore, using this data set we cannot verify that if perceived financial literacy affect
how households choose between the two different financial assets.
To further examine the issue, we used a measure of financial literacy overconfidence
following Xia et al. (2014):
(1) Respondents who think their financial knowledge is at average level or above.
(2) Respondents whose actual financial literacy (measured by FL) is below the average
level (7.7).
Table 6 Effect of financial literacy on positive return: Probit results
(1) (2) (3)Positive_return Positive_return Positive_return
FL 0.00472
(0.0342)
Financial_basic -0.103*
(0.0542)
Financial_basic above median -0.277
(0.173)
Financial_adv 0.135** 0.117**
(0.0614) (0.0596)
Age -0.0791** -0.0741* -0.0724*
(0.0398) (0.0398) (0.0398)
Agesquare 0.000680* 0.000626 0.000621
(0.000395) (0.000395) (0.000395)
Logincome 0.171* 0.168 0.167
(0.104) (0.105) (0.105)
Business owner -0.124 -0.158 -0.130
(0.232) (0.235) (0.234)
Gender 0.131 0.110 0.108
(0.143) (0.145) (0.145)
Risk attitude -0.0684 -0.0538 -0.0546
(0.0944) (0.0950) (0.0953)
Family size -0.151** -0.157** -0.158**
(0.0762) (0.0774) (0.0773)
Marriage status -0.330 -0.355 -0.337
(0.256) (0.258) (0.258)
Province control variables Yes Yes Yes
Living condition control variables Yes Yes Yes
_Cons -0.191 -0.0547 -0.439
(1.654) (1.671) (1.657)
N 463 463 463
Pseudo R2 0.105 0.118 0.116
Standard errors in parentheses, * p\ 0.1, ** p\ 0.05, *** p\ 0.01
Financial Literacy, Portfolio Choice and Financial Well-Being
123

The two criteria should be both satisfied to be recognized as overconfidence.We then used
the overconfidence dummy variable to estimate whether overconfidence affects portfolio
choice. And the dependent variable is a dummy variable indicates whether the households
only invest in stock. And the regression result is shown in column (5) of Table 5.
The regression result shows that households who are overconfident about their financial
knowledge are more likely to hold stock in their portfolio. Furthermore, this can be
interpreted as that consumers who are overconfident in financial literacy choose to pick
stocks by themselves rather than by some mutual fund managers. Therefore, it is not those
who perceive to have high level of financial literacy are investing only in stock, but those
who overestimate their financial literacy levels.
5.4 Financial Literacy and Portfolio Return
Next, we went to further by testing whether households with higher financial literacy
actually do better in investment. It is the portfolio performance that really matters for
financial wellbeing. We used a dummy variable positive_return to indicate whether
households make a profit in investment. We used Probit model similar to Eq. (2), and only
change the dependent variable into positive return dummy. The result is shown in Table 6.
We found that households with higher advance financial literacy tended to receive
positive return. And this suggests that financial literacy may contribute to good financial
performance. However, the effect of general financial literacy are not significant, which
suggests that advance financial literacy which concentrates more on the understanding of
risky assets matters more for a better portfolio performance. The coefficient of basic
financial literacy (-0.103) is negative, which is a little bit counterintuitive. One possible
reason may be that the score of basic financial literacy concentrated in 5, 6 and 7 (72.8 %).
Lack of variation could bring errors to the estimation of the coefficient. We therefore
constructed a dummy variable for above median basic financial literacy (the median of all
the risky asset participants is 5), and did the estimation again and the results are shown in
the column (3) of Table 6. The coefficient of basic financial literacy is not significant while
the coefficient of advance financial literacy is still positive and significant.
6 Robustness Check and Further Discussion
The method of measuring the financial literacy used in this study has been also used in
other studies in the financial literacy literature. Lusardi and Mitchell (2005) and Van Rooij
et al. (2011) used the method of factor analysis to construct two financial literacy indices.
For robustness check, we did it similarly and constructed two indices, factor_basic and
factor_adv. Factor_basic was built on question 1–7, and factor_adv was built on the
answers to question 8–12. The higher the factor is the higher financial literacy indicates.
We used the two indices to replace our financial literacy variables and estimated the
equations again. And the results are shown in Table 7. The results are nearly unchanged
comparing to the previous empirical results. We found that advance financial literacy still
have significant and positive influence on mutual fund participation. And our conclusion is
not changed.
Considering the fact that household who have extremely high income have the possi-
bility to hire a financial advisor, which may have different financial behaviors from our
assumption. We therefore doing all the estimation again by excluded the top 5 %
Z. Chu et al.
123

household who have relatively high income. And the result is shown in Table 8. And the
coefficient and significance are nearly unchanged.
7 Conclusion
In this study, we have examined whether financial literacy has potential effects on the
portfolio choice of households, especially the choice between the two risky assets, stock
and mutual fund. We have also examined if financial literacy has potential to contribute to
Table 7 Multivariate analysis of participation and mutual fund holding and return
(1) (2) (3)Participation Fund_holding Positive_return
Factor_basic 0.290*** -0.00474 -0.290*
(0.0560) (0.121) (0.148)
Factor_adv 0.483*** 0.213** 0.237**
(0.0507) (0.0949) (0.111)
Demographic control variables Yes Yes Yes
Province control variables Yes Yes Yes
Living condition control variables Yes Yes Yes
_Cons -7.051*** -1.437 -0.308
(0.702) (1.424) (1.655)
N 3654 509 463
Pseudo R2 0.281 0.0641 0.118
Standard errors in parentheses, * p\ 0.1, ** p\ 0.05, *** p\ 0.01
Table 8 Multivariate analysis of market participation and portfolio choice: Robustness check: Exclude thetop 5 %
(1)Participation
(2)Participation
(3)Fund_holding
(4)Fund_holding
FL 0.165*** 0.0571*
(0.0149) (0.0318)
Financial_basic 0.111*** 0.000335
(0.0219) (0.0478)
Financial_adv 0.247*** 0.134**
(0.0291) (0.0582)
Demographic control variables Yes Yes Yes Yes
Province control variables Yes Yes Yes Yes
Living condition control variables Yes Yes Yes Yes
_Cons -8.109*** -8.249*** -0.0480 -0.272
(0.845) (0.849) (1.842) (1.849)
N 3454 3454 426 426
Pseudo R2 0.265 0.269 0.0746 0.0789
Standard errors in parentheses, * p\ 0.1, ** p\ 0.05, *** p\ 0.01
Financial Literacy, Portfolio Choice and Financial Well-Being
123

household financial wellbeing, which in this study refers to positive investment return.
Using a Chinese national survey data, we find that households who have high level of
financial literacy are more likely to participate in financial markets, which is consistent
with previous studies (Kimball and Shumway 2006; Van Rooij et al. 2011; Yoong 2011).
This results indicate that in the context of Chinese financial market, there is still correlation
between financial literacy and risky asset investing behavior. Furthermore, we find that
households with higher level of financial literacy are more likely to hold mutual fund in
their portfolio. Just as the saying the more wit, the less courage, household who have
higher level of financial literacy are more careful about direct investment. Additionally,
households with higher financial literacy are more likely to earn positive return, which
suggests that they actually do better. We also find that overconfident households are more
likely to invest only in stocks instead of diversifying by investing in mutual funds.
There are mixed evidences in the literatures about the effects of financial literacy on
choice between risky assets and portfolio performance. We used data from China where
financial advising service is rare, and we therefore could remove the potential com-
pounding effect of the financial advisors when investigating the effect of financial literacy.
Although we use Chinese household data, however, the results may also hold in other
countries, because ‘‘the more wit, the less courage’’ is an American saying there similar to
a proverb in the Chinese culture. Our results about overconfidence complement the pre-
vious research on the link between overconfidence and financial behaviors and go further
by studying the choice problem.
Previous research on financial literacy usually focuses on its potential effects on market
participation, however, little research is done on its potential effects on financial outcomes.
This study has filled in this research gap. Only 10 % of household in this survey participate
into stock market, while the percentage is even smaller for mutual fund participation,
which is only 5 %. For those who participate, less than one in four can receive positive
return. Meanwhile financial literacy may improve the chance of ‘‘winning’’ in financial
market. As we have mentioned in Sect. 2, Chinese financial market is not efficient enough,
our research results indicate that investors have a big chance to suffer loss if not equipped
with enough level of financial literacy. The results may also holds in other financial
markets which are not efficient enough. With the fast development of global financial
market, more and more households start to participate in risky financial markets. However,
some are not well equipped with financial knowledge. And our results show the importance
of increasing household financial literacy, which may help consumers make wise decisions
in portfolio choices and improve financial wellbeing. Although effects of current financial
education programs are in debate, financial literacy itself should be paid more attention by
governments and financial service businesses. Financial literacy has been brought into
sight for the last two decades and some developed countries like United States and United
Kingdom have introduced financial education programs at various levels. Developing
countries like China with a growing financial market could learn successes and lessons
experienced by them.
Acknowledgments The authors acknowledge funding support from the National Natural Science Foun-dation of China (71232003 and 71573147), Specialized Research Fund for the Doctoral Program of HigherEducation (20120002110085) and China Postdoctoral Science Foundation (2015M570066). The authorswould also like to thank Hong Zhang and Bibo Liu for their comments and suggestions.
Z. Chu et al.
123

Appendix: Financial Literacy Questions in 2014 Chinese Surveyof Consumer Finance
The survey was conducted in Chinese. Questions are designed according to financial
literacy questions in OECD consumer finance survey (Atkinson and Messy 2012) and
Survey of Consumer Finances (SCF) in the US. In this study, except for question 7, the
questions are all come from the OECD consumer finance survey and Survey of Consumer
Finances (SCF), only names and the numbers are changed. Question 7 is developed by the
research team of China Center for Financial Economic.
1. One-year deposit interest rate: What is your estimation of one-year deposit interest
rate?
(1) Below 1 % (2) 1–5 % (3) 5–10 % (4) 10 % and above (9) Do not know
2. Interest calculation: If you save 10,000 yuan in the bank for 1 year and the annual
saving rate is 3 %, how much will get after one year?
(1) 10,300 (2) more than 10,300 (3) less than 10,300 (9) Do not know
3. Interest compounding: In the last question, if you continue saving the total amount you
get for another year, how much will you get?
(1) 10,600 (2) more than 10,600 (3) less than 10,600 (9) Do not know
4. Inflation: If the annual saving interest rate is 3 %, and the inflation rate is 5 %. After
1 year, using the same amount of money, you will buy:
(1) more things than now (2) equal things with now (3) less things than now (9) Do not
know
5. Time value of money: If Zhang inherits 100,000 yuan today, and Li will inherit
100,000 yuan after 3 years, who get more value from the inheritance?
(1) Zhang (2) Li (3) They get the same value (9) Do not know
6. Investment risk: Usually high return investment also have high risk.
(1) Right (2) Wrong (9) Do not know
7. Central bank: Which bank has the currency policy making function?
(1) Bank of China (2) Industry and Commerce Bank of China (3) People’s Bank of
China (4) China Construction Bank (9) Do not know
8. The risk of stock: Generally speaking, invest in one stock is less risky than invest in
Equity funds.
(1) Right (2) Wrong (9) Do not know
9. The risk comparison: Generally speaking, which of the following asset is most risky?
(1) Bank saving (2) Treasury bond (3) Stock (4) Mutual fund (9) Do not know
10. The meaning of holding stocks: What does it mean if you buy stocks of a particular
company?
(1) No matter you hold the stock for a long term or a short term, you lend your money
to the company
(2) No matter you hold the stock for a long term or a short term, you are the
shareholder of the company
(3) You are shareholder when you hold for a long term, while you are only lenders if
you only hold for a short while.
(4) All above are not right.
(9) Do not know
Financial Literacy, Portfolio Choice and Financial Well-Being
123
11. Mutual fund: Which of the following statement correctly describe mutual fund?
(1) Mutual fund with lower net worth will get higher performance in the future
(2) Generally speaking, a mutual fund could invest in several kinds of assets, such as
stock and bonds
(3) Generally speaking, mutual fund can promise you a positive return base on past
performance
(4) All above are not right.
(9) Do not know
12. Stock market: Which of the following statements correctly describe the core function
of stock market?
(1) Stock market helps predict stock return
(2) Stock market helps increase stock price
(3) Stock market helps buyers and sellers of stocks
(4) All above are not right.
(9) Do not know
References
Agarwal, S., & Mazumder, B. (2013). Cognitive abilities and household financial decision making.American Economic Journal Applied Economics, 5(1), 193–207.
Alessie, R., Hochguertel, S., & Soest, A. Van. (2004). Ownership of stocks and mutual funds: A panel dataanalysis. Review of Economics and Statistics, 86(3), 783–796.
Ali, A., Rahman, M. S. A., & Bakar, A. (2014). Financial satisfaction and the influence of financial literacyin Malaysia. Social Indicators Research, 120(1), 137–156.
Allen, F., Zhang, C., & Zhao, M. (2012). China’s financial system: Opportunities and challenges. InCapitalizing China (pp. 63–143). University of Chicago Press.
Atkinson, A., & Messy, F. (2012). Measuring financial literacy: Results of the OECD/International Networkon Financial Education (INFE) pilot study, OECD Working Papers on Finance, Insurance and PrivatePensions, 15. Paris: OECD Publishing.
Bailey, W., Kumar, A., & Ng, D. (2006). Why do individual investors hold stocks and high expense fundsinstead of index funds? Johnson Graduate School of Management, Cornell University, Working Paper.
Barber, B. M., & Odean, T. (2001). Boys will be boys: Gender, overconfidence, and common stockinvestment. The Quarterly Journal of Economics, 116(1), 261–292.
Barberis, N., Huang, M., & Thaler, R. H. (2006). Individual preferences, monetary gambles, and stockmarket participation: A case for narrow framing. The American Economic Review, 96(4), 1069–1090.
Berk, J. B., & Green, R. C. (2004). Mutual fund flows and performance in rational markets. Journal ofPolitical Economy, 112(6), 1269–1295.
Calvet, L. E., Campbell, J. Y., & Sodini, P. (2007). Down or out: assessing the welfare costs of householdinvestment mistakes. Journal of Political Economy, 115(5), 707–747.
Campbell, J. Y. (2006). Household finance. Journal of Finance, 61(4), 1553–1604.Cardak, B. A., & Wilkins, R. (2009). The determinants of household risky asset holdings: Australian
evidence on background risk and other factors. Journal of Banking and Finance, 33(5), 850–860.Carhart, M. (1997). On persistence in mutual fund performance. Journal of Finance, 52, 57–82.Chen, J., & Yang, H. (2015). Geographical mobility, income, life satisfaction and family size preferences:
An Empirical Study on rural households in Shaanxi and Henan Provinces in China. Social IndicatorsResearch. doi:10.1007/s11205-015-1102-7.
China Securities Regulatory Commission (2015). Securities market statistics in October 2015. http://www.csrc.gov.cn/pub/csrc_en/marketdata/security/monthly/201511/t20151124_287067.html.
Christelis, D., Jappelli, T., & Padula, M. (2010). Cognitive abilities and portfolio choice. European Eco-nomic Review, 54(1), 18–38.
Cocco, J. F., Gomes, F. J., & Maenhout, P. J. (2005). Consumption and portfolio choice over the life cycle.Review of Financial Studies, 18(2), 491–533.
Cole, S., Paulson, A., & Shastry, G. K. (2014). Smart money? The effect of education on financial outcomes.The Review of Financial Studies, 27, 2022–2051.
Z. Chu et al.
123

Daniel, K., Grinblatt, M., Titman, S., & Wermers, R. (1997). Measuring mutual fund performance withcharacteristic-based benchmarks. Journal of Finance, 52, 1035–1058.
Dimmock, S.G., Kouwenberg, R., Mitchell, O.S., Peijnenburg, K. (2013). Ambiguity aversion and house-hold portfolio choice: Empirical evidence. NBER Working paper, 18743, National Bureau of Eco-nomic Research.
Disney, R., & Gathergood, J. (2013). Financial literacy and consumer credit portfolios. Journal of Bankingand Finance, 37(7), 2246–2254.
Elton, E. J., Gruber, M. J., & Blake, C. R. (1996). The persistence of risk-adjusted mutual fund performance.Journal of Business, 69, 133–157.
Elton, E. J., Gruber, M. J., & Blake, C. R. (2012). An examination of mutual fund timing ability usingmonthly holdings data. Review of Finance, 16(3), 619–645.
Eun, C. S., & Huang, W. (2007). Asset pricing in China’s domestic stock markets: Is there a logic? PacificBasin Finance Journal, 15(5), 452–480.
Fan, J. X., & Xiao, J. J. (2006). Cross-cultural differences in risk tolerance: A comparison between Chineseand Americans. Journal of Personal Finance, 5(3), 54–75.
Friedman, M. (1957). A theory of the consumption function: A study by the National Bureau of EconomicResearch. Princeton: Princeton University Press.
Gan, L. (2013). Financial Market Participation. In L. Gan, Z. Yin, N. Jia, S. Xu, S. Ma, & L. L. Zheng(Eds.), Data you need to know about China: Research Report of China Household Finance Survey (pp.95–99). Berlin: Verlag.
Gao, Q., Wu, S., & Zhai, F. (2014). Welfare participation and time use in China. Social Indicators Research,124(3), 863–887.
Georgarakos, D., & Inderst, R. (2011). Financial advice and stock market participation. Gruneburgplatz:University of Frankfurt.
Gerardi, K., Goette, L., & Meier, S. (2010). Financial literacy and subprime mortgage delinquency: Evi-dence from a survey matched to administrative data. Working Paper No. 2010, Federal Reserve Bankof Atlanta.
Grinblatt, M., & Keloharju, M. (2009). Sensation seeking, overconfidence, and trading activity. Journal ofFinance, 64(2), 549–578.
Grinblatt, M., Keloharju, M., & Linnainmaa, J. (2011). IQ and stock market participation. Journal ofFinance, 66(6), 2121–2164.
Guiso, L., & Jappelli, T. (2005). Awareness and stock market participation. Review of Finance, 9(4),537–567.
Haliassos, M., & Bertaut, C. C. (1995). Why do so few hold stocks? Economic Journal, 105, 1110–1129.Hastings, J. S., Madrian, B. C., & Skimmyhorn, W. L. (2013). Financial literacy, financial education, and
economic outcomes. Annual Review of Economics, 5(1), 347–373.Heaton, J., & Lucas, D. (2000). Portfolio choice and asset prices: The importance of entrepreneurial risk.
The Journal of Finance, 55(3), 1163–1198.Hilgert, M. A., Hogarth, J. M., & Beverly, S. G. (2003). Household financial management: The connection
between knowledge and behavior. Federal Reserve Bulletin, 89(7), 309–322.Hong, H., Kubik, J. D., & Stein, J. C. (2004). Social interaction and stock market participation. The Journal
of Finance, 59(1), 137–163.Hung, A., Parker, A. M., & Yoong, J. (2009). Defining and measuring financial literacy. SSRN Electronic
Journal. doi:10.2139/ssrn.1498674.Hurd, M., van Rooij, M., & Winter, J. (2011). Stock market expectations of Dutch households. Journal of
Applied Econometrics, 26(3), 416–436.Ippolito, R. A. (1989). Efficiency with costly information: A study of mutual fund performance, 1965–1984.
The Quarterly Journal of Economics, 104(1), 1–23.Jiang, G., Yao, T., & Yu, T. (2007). Do mutual funds time the market? Evidence from holdings data.
Journal of Financial Economics, 88, 119–145.Kaplan, S. N. and Sensoy, B. A. (2008) Do mutual funds time their benchmarks? Working paper, University
of Chicago.Kimball, M., & Shumway, T. (2006). Investor sophistication, and the participation, home bias, diversifi-
cation, and employer stock puzzles. Unpublished manuscript, University of Michigan: Ann Arbor.Korniotis, G. M., & Kumar, A. (2013). Do portfolio distortions reflect superior information or psychological
biases? Journal of Financial and Quantitative Analysis, 48(01), 1–45.Li, L., & Wu, X. (2014). Housing price and entrepreneurship in China. Journal of Comparative Economics,
42(2), 436–449.Liao, L., Huang, N., & Yao, R. (2010). Family finances in urban china: Evidence from a national survey.
Journal of Family and Economic Issues, 31(3), 259–279.
Financial Literacy, Portfolio Choice and Financial Well-Being
123

Lusardi, A., Michaud, P. C., & Mitchell, O. S. (2013). Optimal financial knowledge and wealth inequality,NBER Working Papers 18669, National Bureau of Economic Research.
Lusardi, A., & Mitchell, O. S. (2005). Financial literacy and planning: Implications for retirement wellbeing.Michigan Retirement Research Center Research Paper No. WP, 108.
Lusardi, A., & Mitchell, O. S. (2007). Baby boomer retirement security: The roles of planning, financialliteracy, and housing wealth. Journal of monetary Economics, 54(1), 205–224.
Lusardi, A., & Mitchell, O. S. (2008). Planning and financial literacy: How do women fare? AmericanEconomic Review, 98(2), 413–417.
Lusardi, A., & Mitchell, O. S. (2014). The economic importance of financial literacy: theory and evidence.Journal of Economic Literature, 52(1), 5–44.
Lusardi, A. & Tufano, P. (2008). Debt literacy, financial experiences, and overindebtedness. DartmouthWorking Paper.
Modigliani, F., & Brumberg, R. F. (1954). Utility analysis and the consumption function: An interpretationof cross-section data. In K. K. Kurihara (Ed.), Post-Keynesian economics (pp. 388–436). NewBrunswick: Rutgers University Press.
Moore, D. L. (2003). Survey of financial literacy in Washington State: Knowledge, behavior, attitudes, andexperiences. Washington State Department of Financial Institutions.
Morck, R., Yeung, B., & Yu, W. (2000). The information content of stock markets: why do emergingmarkets have synchronous stock price movements? Journal of Financial Economics, 58(1), 215–260.
Mottola, G. (2013). In our best interest: women, financial literacy, and credit card behavior. Numeracy,.doi:10.5038/1936-4660.6.2.4.
Pistor, K., & Xu, C. (2005). Governing stock markets in transition economies: Lessons from China.American Law and Economics Review, 7(1), 184–210.
Puri, M., & Robinson, D. T. (2007). Optimism and economic choice. Journal of Financial Economics,86(1), 71–99.
Tsai, M., Dwyer, R. E., & Tsay, R. (2014). Does financial assistance really assist? The impact of debt onwellbeing, health behavior and self-concept in Taiwan. Social Indicators Research. doi:10.1007/s11205-014-0835-z.
Utkus, S. P., & Young, J. A. (2011). Financial Literacy and 401 (k) Loans. In Financial Literacy: Impli-cations for Retirement Security and the Financial Marketplace (pp. 59–75). Oxford University Press.
Van Rooij, M., Lusardi, A., & Alessie, R. (2011). Financial literacy and stock market participation. Journalof Financial Economics, 101(2), 449–472.
Vissing-Jørgensen, A. (2004). Perspectives on behavioral finance: Does ‘‘irrationality’’ disappear withwealth? Evidence from expectations and actions. In NBER Macroeconomics Annual 2003, (Vol. 18,pp. 139–208). The MIT Press.
Vissing-Jørgensen, A., & Attanasio, O. P. (2003). Stock-market participation, intertemporal substitution,and risk-aversion. American Economic Review, 93(2), 383–391.
Vlaev, I., & Elliott, A. (2013). Financial well-being components. Social Indicators Research, 118(3),1103–1123.
Von Gaudecker, H.-M. (2015). How does household portfolio diversification vary with financial literacy andfinancial advice? The Journal of Finance, 70(2), 489–507.
Wang, M., Lai, K. K., & Yen, J. (2014). Private banking and wealth management industry in China. InChina’s financial markets: Issues and opportunities (pp. 205–206). Routledge.
Wang, X., & Wen, Y. (2012). Housing prices and the high Chinese saving rate puzzle. China EconomicReview, 23(2), 265–283.
Weber, E. U., & Hsee, C. K. (1998). Cultural differences in risk perception, but cross-cultural similarities inattitudes towards perceived risk. Management Science, 44(9), 1205–1217.
Xia, T., Wang, Z., & Li, K. (2014). Financial literacy overconfidence and stock market participation. SocialIndicators Research, 119(3), 1233–1245.
Xiao, J. J., Chen, C., & Chen, F. (2014). Consumer financial capability and financial satisfaction. SocialIndicators Research, 118(1), 415–432.
Xie, Y., & Hu, J. (2014). An introduction to the China Family Panel Studies (CFPS). Chinese SociologicalReview, 47(1), 3–29.
Yoong, J. (2011). Financial illiteracy and stock market participation: Evidence from the RAND AmericanLife Panel. In O. S. Mitchell & A. Lusardi (Eds.), Financial literacy: Implications for retirementsecurity and the financial marketplace (pp. 76–97). Oxford: Oxford University Press.
Zhao, X., & Wang, S. (2007). Empirical study on Chinese mutual funds’ performance. Systems EngineeringTheory and Practice, 27(3), 1–11.
Z. Chu et al.
123