Financial Knowledge and 401(k) Investment...
35
Financial Knowledge and 401(k) Investment Performance: A Case Study Robert Clark, Annamaria Lusardi, and Olivia S. Mitchell June 22, 2015 Research support for the work reported herein was provided by the Pension Research Council/ Boettner Center at the Wharton School of the University of Pennsylvania, as well as the Office of Employee Benefits at the Federal Reserve System that provided the data for the study and partial funding for the project. Without implicating them, we are grateful for useful comments provided by William Clark, Pierre-Carl Michaud, Ryan Peters, Petra Todd, Ning Tang, and Steven Utkus. We are also appreciative of excellent programming assistance from Yong Yu. Opinions and conclusions expressed herein are solely those of the authors and do not represent the opinions or policy of the funders or any other institutions with which the authors are affiliated. ©2015 Clark, Lusardi, and Mitchell. All rights reserved.
Transcript of Financial Knowledge and 401(k) Investment...

Financial Knowledge and 401(k) Investment Performance: A Case Study
Robert Clark, Annamaria Lusardi, and Olivia S. Mitchell
June 22, 2015
Research support for the work reported herein was provided by the Pension Research Council/ Boettner Center at the Wharton School of the University of Pennsylvania, as well as the Office of Employee Benefits at the Federal Reserve System that provided the data for the study and partial funding for the project. Without implicating them, we are grateful for useful comments provided by William Clark, Pierre-Carl Michaud, Ryan Peters, Petra Todd, Ning Tang, and Steven Utkus. We are also appreciative of excellent programming assistance from Yong Yu. Opinions and conclusions expressed herein are solely those of the authors and do not represent the opinions or policy of the funders or any other institutions with which the authors are affiliated. ©2015 Clark, Lusardi, and Mitchell. All rights reserved.
Financial Knowledge and 401(k) Investment Performance: A Case Study
Abstract
We explore whether investors who are more financially knowledgeable earn more on their retirement plan investments compared to their less sophisticated counterparts, using a unique new dataset linking administrative data on investment performance and financial knowledge. Results show that the most financially knowledgeable investors: (a) held 18 percentage points more stock than their least knowledgeable counterparts; (b) could anticipate earning 8 basis points per month more in excess returns; (c) had 40% higher portfolio volatility; and (d) held portfolios with about 38% less idiosyncratic risk, as compared to their least savvy counterparts. Our results are qualitatively similar after controlling on observables as well as modeling sample selection. We also examine portfolio changes to assess the potential impact of the financial literacy intervention. Controlling on other factors, those who elected to take the Financial Literacy survey boosted their equity allocations by 66 basis points and their monthly expected excess returns rose by 2.3 basis points; no significant difference in volatility or nonsystematic risk was detected before versus after the survey. While these findings relate to only one firm, we anticipate that they may spur other efforts to enhance financial knowledge in the workplace.
Robert Clark Poole College of Management, Box 7229 NC State University Raleigh, NC 27696 e-mail: [email protected]
Olivia S. Mitchell Wharton School, University of Pennsylvania 3620 Locust Walk, 3000 SH-DH Philadelphia, PA 19104 e-mail: [email protected]
Annamaria Lusardi The George Washington University School of Business 2201 G Street, Suite 450E, Duquès Hall Washington, DC 20052 e-mail: [email protected]

1 !!
Financial Knowledge and 401(k) Investment Performance: A Case Study
Robert Clark, Annamaria Lusardi, and Olivia S. Mitchell
Financially knowledgeable individuals accumulate more retirement wealth, as we found
in our recent literature overview (Lusardi and Mitchell, 2014). Nevertheless, since little is known
about how this association arises, a further exploration of the mechanism could be relevant to
plan sponsors and, possibly, policymakers. For instance, if we could show that financial
knowledge enables people to do a better job investing their retirement savings, this could
motivate private and public efforts to enhance financial knowledge in the population at large.1
In what follows, we examine the link between financial literacy and investment outcomes
using a novel dataset linking administrative records on retirement plan investment performance
with an employee survey measuring employees’ financial knowledge. Since our findings draw
from a single firm, our results are suggestive rather than probative. Nevertheless, they do imply
that the most financially knowledgeable individuals invest differently and can expect higher
returns on their retirement savings. Results show that the most financially knowledgeable
investors: (a) held 18 percentage points more stock than their least knowledgeable counterparts;
(b) could anticipate earning 8 basis points per month more in excess returns; (c) had 40% higher
portfolio volatility; and (d) held portfolios with about 38% less idiosyncratic risk, as compared to
their least savvy counterparts. A return advantage due to more equity exposure does, of course,
!!!!!!!!!!!!!!!!!!!!!!!!!!!!!!!!!!!!!!!!!!!!!!!!!!!!!!!!!!!!!1 Alternatively, investors might be able to substitute financial advice instead of enhancing their own financial literacy, but few Americans consult financial advisors, lawyers, or accountants for investment help (Bricker et al. 2012; EBRI 2013). Kim, Maurer, and Mitchell (2015) explore the tradeoffs between hiring a financial adviser and investing in on-the-job human capital. Clark, Maki, and Morrill (2014) report most people (62%) get their investment advice from family and relatives rather than trained professional advisors. Of the third of the population that does engage paid advisors, only one-quarter follows the advice given. Calcagno and Monticone (2015) conclude that non-independent advisors fail to offset clients’ low levels of financial knowledge, while Collins (2012) reports that financial advice is a complement to, rather than a substitute for, financial knowledge.
2 !!imply more portfolio volatility, yet it could also help generate a larger nest egg over a lifetime of
retirement saving. It might also produce greater retirement wealth inequality across the most and
least sophisticated, consistent with recent theoretical work (Lusardi, Michaud, and Mitchell,
2013).
Prior Research
People who are more financially savvy have been demonstrated to have more retirement
wealth (Lusardi and Mitchell 2011a, 2014). Several possible explanations for this observation
have been suggested. One is that more financially literate individuals are wealthier because they
plan and save more. This has been confirmed empirically in several studies, even after
controlling for education, age, sex, marital status, IQ, and other factors (c.f., Behrman et al.
2012; Lusardi and Mitchell, 2007, 2008, 2011a). Another explanation is that more sophisticated
investors hold riskier assets, and hence they tend to benefit from higher excess returns. In one
study of Dutch respondents’ self-reports on stock and mutual fund holdings, van Rooij, Lusardi,
and Alessie (2011) did find!a positive correlation between financial knowledge and self-reported
stockholding. In a dataset from the US American Life Panel, Yoong (2011) again confirmed that
the more financially sophisticated were more likely to self-report they held stocks and mutual
funds. Nevertheless, neither of those studies had administrative information linking actual
investment patterns and financial knowledge.
In related research, better-educated households have been found to hold more stock than
their less-educated counterparts (Haliassos and Bertaut 1995; Calvet, Campbell, and Sodini
2007; 2009a, b; Calvet and Sodini 2014). Nevertheless, those authors had no information on
financial knowledge. This is important, since education and financial literacy measure somewhat
different things (Behrman et al. 2012). Bodnaruk and Simonov (2014) examined the portfolios of
3 !!private mutual fund managers and concluded that financial experts’ investment decisions were
no better than those of their less-savvy counterparts; here too, however, the dataset used had no
direct measures of investors’ financial knowledge. Christelis, Jappelli, and Padula (2010) and
Jappelli and Padula (2013a,b) found that respondents’ mathematics scores in grade school were
associated with more stock market participation later in life. Nevertheless, school IQ and math
scores are not identical to financial sophistication (Lusardi, Mitchell, and Curto 2010),
suggesting that there is room for a new evaluation of financial literacy effects on portfolio
investment behaviors.
Yet a different explanation for how financial literacy could contribute to greater wealth
accumulation is that sophisticated individuals may earn higher returns on their investments.
There are hints of this in the literature: for instance, Deuflhard, Georgarkos, and Inderst (2014)
linked saving account returns of Dutch survey respondents to a set of financial literacy questions
and to information on bank interest rates. That study concluded that financial knowledge was
associated with higher returns on saving accounts; interestingly, some of this impact was
attributable to people’s willingness to use self-managed online banking. Nevertheless, their
dataset lacked information on any more-sophisticated investments.2 Also in the Netherlands, von
Gaudecker (2015) showed that more knowledgeable respondents reported holding more
diversified funds; again, however, his analysis relied on self-reported portfolios rather than
arguably more accurate administrative records.
Related to this point is the possibility that sophisticated investors could possibly pick less
costly mutual funds, thereby enhancing net returns. Grinblatt et al. (2013) examined how Finnish
investors’ performance tied to measured IQ scores and business education, and they concluded
that higher-IQ investors and those with business education did pay lower fund fees. Lab !!!!!!!!!!!!!!!!!!!!!!!!!!!!!!!!!!!!!!!!!!!!!!!!!!!!!!!!!!!!!2 It is unclear whether that evidence is particularly informative about U.S. 401(k) participants, most of whom hold a mix of stocks and bonds in their portfolios.
4 !!experiments by Choi, Laibson, and Madrian (2010) reported that people who deemed themselves
more financially knowledgeable also selected somewhat lower-fee investment options than their
counterparts. In fact, the last set of authors concluded (p. 1408): “mistakes driven by financial
illiteracy are the primary source of the demand for high-fee index funds.” In a field experiment,
Hastings, Mitchell, and Chyn (2011) designed a financial literacy module administered by a
Chilean national survey, to examine whether less financially knowledgeable respondents were
differentially sensitive to how pension plan fee information was framed. They reported that the
less savvy were, in fact, much more sensitive to the way in which fund fees were framed.
Moreover, they reported that financial knowledge played an independent role, separate from that
of education. This evidence, while suggestive, stopped short of assessing how financial
knowledge affected investment performance in retirement plans, net of fees.
A final reason that the more financially sophisticated may be wealthier is that they may
select better-diversified investments, thereby being less exposed to nonmarket or idiosyncratic
risk. There is only indirect evidence on this point to date. Tang et al. (2010) reported that 401(k)
plan participants tended to be offered efficient menus of investment funds, but many constructed
quite inefficient portfolios given the choices. That study, however, lacked direct information on
participants’ financial capabilities.
In sum, previous research has been unable to determine directly whether more financially
savvy investors accumulate more assets because they manage their retirement investments more
effectively than their less-savvy counterparts. In what follows, we evaluate the links between
financial knowledge, investment behavior, and investment performance, using a new employer-
based administrative data linked to survey evidence. !

5 !!Data and Methods
Under confidentiality conditions, we gained access to a unique dataset from the Office of
Employee Benefits of the Federal Reserve System (OEB Fed) which has multiple locations
across the U.S. The Fed offers its employees a defined benefit (DB) plan of the conventional
variety. In addition, it has a DC pension with a fund menu that includes stock and bond index
choices, target date funds, lifestyle funds (conservative, moderate, aggressive), international and
emerging market funds, and a real estate fund. The OEB Fed provided us with administrative
records on each employee’s contributions and investment allocations across the DC plan fund
menu, which we then linked to fund returns data as detailed below.
Accordingly, we were able to learn which of the funds offered by the plan sponsor each
participant selected at two points in time, and what each participant earned on his individual
retirement portfolio.3 Using this linkage and a decade of historical net returns for each fund in
the employer’s investment menu, we have compute each participant’s equity allocation and own
portfolio performance metrics as of April and December 2013. Additionally, in cooperation with
the OEB, we fielded an internet survey on financial knowledge via email in October of 2013.
Responses to this survey were then linked to the administrative records on respondents’
investment allocations immediately prior to and after the survey, along with controls for
respondents’ personal characteristics (sex, age, marital status, job tenure, salary, and 401(k) plan
balances).4 Next we turn to an overview of the dataset and our analysis methods.
A. The Financial Literacy Survey
The Institution’s employee benefits office distributed to approximately 16,000 active
employees an online survey on financial literacy (FinLit), followed by a short informational !!!!!!!!!!!!!!!!!!!!!!!!!!!!!!!!!!!!!!!!!!!!!!!!!!!!!!!!!!!!!3 All fund returns are reported net of fees; we lack information on the gross returns earned by the investors. 4 The dataset lacks information on employees’ outside investments, but for most, their DB pension is likely their most substantial asset. In the empirical analysis below, we proxy DB plan accruals with controls for age, salary, and tenure in the models below.
6 !!webinar explaining key aspects of the firm’s retirement saving plan.5 About 17% of the active
workforce responded to the invitation to take the survey, a response rate similar to other
voluntary and non-incentivized surveys.6 Our respondent sample differs from the non-respondent
sample in some unsurprising ways: for instance, Table 1 shows that FinLit survey respondents
contributed 1.7 percentage points more of their pretax salaries; had significantly higher plan
balances of almost $100,000; held about two percentage points more equity; were about five
years older; and had worked for the Fed about four years longer than their counterparts. To the
extent that FinLit survey participants were more financially sophisticated than those who did not,
the effects we report below may underestimate the extent to which the entire workforce could
benefit from additional financial education.
Table 1 here
We measured respondents’ financial knowledge in the online FinLit survey using five
questions we have developed and field-tested in prior research (correct answers are provided in
bold):
• Interest Rate: Suppose you had $100 in a savings account and the interest rate was 2% per year. After 5 years, how much do you think you would have in the account if you left the money to grow? More than $110, Exactly $110, Less than $110, DK, RF.7
• Inflation: Imagine that the interest rate on your savings account was 1% per year and inflation was 2% per year. After 1 year, how much would you be able to buy with the money in this account? More than today, Exactly the same , Less than today, DK, RF
• Risk: Is this statement True or False? Buying a single company’s stock usually provides a safer return than a stock mutual fund. True, False, DK, RF
• Tax Offset: Assume you were in the 25 percent tax bracket (you pay $0.25 in tax for each dollar earned) and you contributed $100 pretax to an employer’s 401(k) plan. Your take-home pay (what’s in your paycheck after all taxes and other payments are taken out) will then: Decline by $100, Decline by $75, Decline by $50, Remain the same, DK, RF
!!!!!!!!!!!!!!!!!!!!!!!!!!!!!!!!!!!!!!!!!!!!!!!!!!!!!!!!!!!!!5 The webinar was designed to raise awareness of the importance of preparing for retirement and target retirement income needs, and to highlight attributes and benefits of the company’s retirement benefit options. 6This response rate is in line with what is found in many other online, non-mandatory, and non-incentivized surveys (c.f., Clark, Maki, and Morrill(2014); Constant Contact http://support2.constantcontact.com/articles/FAQ/2344; Benchmark http://www.benchmarkemail.com/help-FAQ/answer/what-is-a-typical-survey-response-rate; Surveygizmo, http://www.surveygizmo.com/survey-blog/survey-response-rates/ ). 7 DK refers to “do not know” and RF refers to “refuse to answer.”

7 !!
• Match: Assume that an employer matched employee contributions dollar for dollar. If the employee contributed $100 to the 401(k) plan, his account balance in the plan including his contribution would: Increase by $50, Increase by $100, Increase by $200, Remain the same , DK, RF
The first three questions, devised by Lusardi and Mitchell (2008; 2011a), are known as “the Big
Three.”8 The first measures people’s ability to do a simple interest rate calculation; the second
tests people’s understanding of inflation; and the third is a joint test of knowledge about “stocks”
and “stock mutual funds” as well as risk diversification, since the correct response requires the
respondent to know what a stock is and that a mutual fund is comprised of many stocks.
Our prior research has demonstrated that few Americans can answer all of the first three
questions correctly (with similar results in other countries), and not many more know the correct
answers to two of them. By contrast, this firm’s workforce proved to be substantially more
financially knowledgeable (as measured by the Big Three) compared to the general population, a
predictable result given that the group consists of financial sector employees (see Table 2).
Specifically, 76 percent of the respondents responded correctly to the Interest Rate question, 92
percent to the Inflation question, and 88 percent to the Risk question. This can be compared to 75
percent, 61 percent, and 48 percent correct answers in the nationally representative 2012
National Financial Capability Study, which is also an online survey (FINRA Investor Education
Foundation, 2013).9
Table 2 here
The last two questions were devised and implemented in surveys fielded in large U.S.
firms by Clark, Maki and Morrill (2014). Answering these questions proved more difficult, even
!!!!!!!!!!!!!!!!!!!!!!!!!!!!!!!!!!!!!!!!!!!!!!!!!!!!!!!!!!!!!8 These questions have also been adopted by many other United States surveys including the National Longitudinal Survey of Youth, the American Life Panel, and the US National Financial Capability Study (Lusardi, Mitchell and Curto, 2010; Lusardi and Mitchell, 2009; Lusardi, 2011); they have also been fielded in 12 other countries (Lusardi and Mitchell, 2011c, 2014); and most recently have been included in the OECD’s PISA study. 9 The 2012 FINRA findings are available at http://www.usfinancialcapability.org/downloads/NFCS_2012_Report_Natl_Findings.pdf
8 !!for this relatively sophisticated group. Both queries required respondents to understand how
employer and employee contributions influence retirement plan accumulations, taking into
account the tax implications of worker pre-tax contributions. In the Tax Offset question, for
instance, the employee had to understand that the tax-deferred aspect of his own contributions
reduced the net cost of payments into the plan: only 45 percent of respondents answered this item
correctly. The Match question required the employee to know that a dollar-for-dollar match
meant that $100 of own contributions would generate an equal employer contribution; moreover
employer match dollars are not taxed when contributed to the plan. The Match question was
easier to answer for this group, and 78 percent answered this question correctly.
As is conventional,10 we sum the correct answers to all of the questions to produce a
FinLit Index for each person. In this sample, the Index values ranged from 0 to 5, with a mean of
3.8 and a standard deviation of 1.2. One-third of the respondents answered all five questions
correctly, while fewer than two percent (46 respondents) got all questions wrong.
B. Investment Metrics
The Fed includes 16 mutual funds in its 401(k) plan including a government securities
fund, a TIPS fund, several bond funds, several equity funds, and a REIT Index Fund. Table 3
summarizes descriptive statistics regarding monthly fund returns (net of expenses, measured over
the 10-year period ending in April 2013) and asset allocation patterns. The first two columns
show that, over this period, bond funds generally earned returns below those of the equity and
REIT funds, and they also generally experienced lower volatility.
Table 3 here
The next four columns report the share of assets held by employees in April of 2013,
prior to responding to the financial literacy module, along with results sorted by their FinLit !!!!!!!!!!!!!!!!!!!!!!!!!!!!!!!!!!!!!!!!!!!!!!!!!!!!!!!!!!!!!10 As demonstrated by Behrman et al. (2012), generating an index by summing correct answers works just as well as an index generated using more complex principal components methods.

9 !!Index scores (the number of correct answers to the survey). Interestingly, the least
knowledgeable employees were substantially less likely to hold equity index, international
equity, and small company equity funds. And when they did invest in stock funds, they were
more likely to invest in the conservative asset allocation fund. Overall, the less savvy were much
more likely to be holding bonds than not. Conversely, the more financially sophisticated
employees held 17 percentage points or close to 40% (39.9%=(59.6-42.6)/42.6)) more of their
assets in equity, compared to the least financially sophisticated group.11
To analyze the results in more detail, we have generated four measures to evaluate
participants’ investment behavior and performance across the firm’s DC plan options (all as of
April 2013 before the financial literacy survey was conducted). First, we computed the equity
fraction in participants’ retirement portfolios. While financial sophistication need not imply that
savvier participants hold more equity, we wish to test whether more knowledgeable individuals
did in fact invest more in equities, controlling for other factors (to be described below).
Second, we computed participants’ monthly expected excess returns ejr , using each
participant j’s contribution allocations to the available funds on offer in month t. To do so, we
estimate a 6-factor model for all the funds i=1,…,I using net return data for the 60 months (t-60
to t-1) prior to contribution month t:
1 2 3 4 5 6( )it Ft Mt Ft t t t t t itR R R R SmB HmL WmL Term Def eα β β β β β β− = + − + + + + + +% % % (1)
Following Fama and French (1993), here it FtR R−% refers to the excess return of fund i over the
risk-free rate (the one-month Treasury bill rate from Ibbotson Associates); FtMt RR −~ refers to
the value-weighted return on all NYSE, AMEX, and NASDAQ stocks (from the Center for
!!!!!!!!!!!!!!!!!!!!!!!!!!!!!!!!!!!!!!!!!!!!!!!!!!!!!!!!!!!!!11 The equity allocation refers to the fraction of contributions directed to US equity funds, international equity funds, and a percentage of balance/lifecycle funds. The equity percentage for balanced/target date funds is calculated based on each fund’s investment policy which varied from fund to fund.

10 !Research in Security Prices, CRSP) minus the risk-free rate; SmB refers to the difference in the
performance of small relative to big stocks; HmL to the difference in performance of value
stocks to growth stocks; WmL is the Fama-French up-minus-down factor; Term measures the
difference between the return on a market portfolio of long-term corporate bonds (the composite
portfolio in the corporate bond module of Ibbotson Associates) and the one-month Treasury bill
rate measured at the end of the previous month (from CRSP); and Def measures the difference
between the monthly long-term government bond return (from Ibbotson Associates) and the one-
month Treasury bill rate measured at the end of the previous month (from CRSP).
Next we used the estimated coefficients from equation (1) and multiplied these by the
average values of the respective factors over the prior 60 months (called ktf for k=1,…,6):
)(ˆ)(ˆ)(ˆ)(ˆ)(ˆ)()( 66554433221111 ffffffFREr Ftitei ββββββα ++++++=−= ++
⌢⌢ (2’)
This approach assumes that investors could expect the future paths of each factor to track their
historical averages. The systematic return associated with the ith fund is then its factor exposure
times the average factor returns for that factor. Finally, to generate each participant’s expected
excess return for fund i, we computed:
∑=
=I
i
eiti
ej rr
1,ω (3)
where ti,ω is the weight of the ith fund in the jth participant’s contributions in month t. We also
report the standard deviation of participants’ expected excess returns derived from these
computations.
Our fourth performance measure examines how much of the participant’s portfolio
variance can be attributed to non-systematic (or idiosyncratic) risk. Following Calvet, Campbell,

11 !
and Sodini (2007), we used the variance-covariance matrix12 for all assets, Σ̂ , to estimate the
total portfolio variance for the jth participant, jΣ̂ . This individual portfolio variance can then be
decomposed into its systematic and idiosyncratic components as follows:
idioj
sysjti
idiosystititij D Σ+Σ=+Σ=Σ=Σ ˆˆ)ˆˆ(ˆˆ
,',,
', ωωωω (4)
As in Tang et al. (2010), Equation (4) is used to derive the ratio of the participant’s non-
systematic risk to his total portfolio variance, ˆ ˆ% / .idioj j jNSR = Σ Σ The lower is this ratio, the
better-diversified is the participant against non-market risk. One could anticipate that the
portfolios of the more financially knowledgeable might incorporate lower relative levels of
nonsystematic risk.
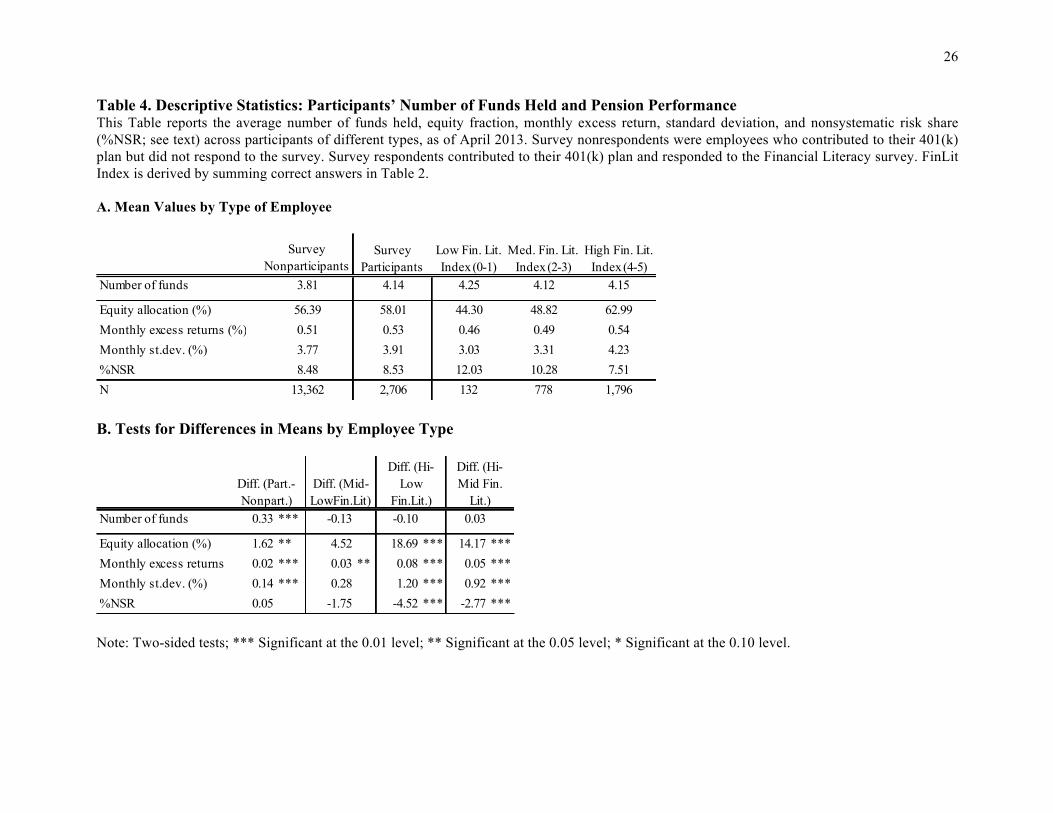
Information on these four investor performance measures along with the number of funds
held by participants prior to the FinLit survey appears in Table 4. In the first column of Panel A
we report investment patterns for those who did not take the survey. The second column focuses
on all those who did take the survey, and subsequent columns array outcome measures by
respondents’ FinLit Index scores. Looking at the first row in Panel A, we see that, on average,
nonparticipants held fewer funds compared to those who took the survey, 3.81 versus 4.14, and
the difference is statistically significant (Panel B). Moreover, those who answered the survey
held 1.62 percentage points more equity resulting in a higher expected monthly return of 2 basis
points, 14 basis points higher monthly standard deviation, and no significant difference in
nonsystematic risk.
Table 4 here
!!!!!!!!!!!!!!!!!!!!!!!!!!!!!!!!!!!!!!!!!!!!!!!!!!!!!!!!!!!!!12 Df
ˆˆˆˆˆ ' +ΒΣΒ=Σ , where D̂ is a diagonal matrix with elements computed as the square of the kε̂ estimated in
equation (1). The asset variance can be decomposed into a portion attributable to systematic risk, ΒΣΒ=Σ ˆˆˆˆ 'f
sys ,
and a second due to idiosyncratic risk idioD̂ .
12 !
The last three columns of Panel A reveal a strong positive relationship between financial
literacy and allocation to equity. That is, participants who scored the lowest on the FinLit Index
had the smallest proportion of their portfolios allocated to stocks (44.30 percentage points),
whereas the most sophisticated held over 40% more equity (the difference in Panel B of
42.2%=(62.99-44.30)/44.30 is statistically significant at the 1% level). This accounts for the
finding in the second row, namely that the sophisticated group averaged a monthly 8 basis points
higher expected excess return, compared to the least knowledgeable employees (the difference of
17.4%=(0.54-0.46)/0.46 is significant at the 1% level).13
Our finding is thus supportive of Calvet, Campbell, and Sodini’s (2007) surmise that
higher expected returns are positively correlated with financial sophistication (though that study
lacked direct measures of financial knowledge). Patterns of standard deviations correspond to the
greater equity holdings: that is, standard deviations are larger (by almost 40%) for the most
versus the least knowledgeable (39.6%=(4.23-3.03)/3.03). It is also worth noting that the
portfolios held by the most sophisticated displayed much less idiosyncratic risk, 7.51 percentage
points, versus the least-savvy respondents, 12.03 (the 38% difference is significant at the 1%
level). In other words, more financially knowledgeable participants hold more equity and
anticipate earning higher excess returns with higher volatility, but their portfolios embody less
nonsystematic risk than those of their less financially literate peers. Interestingly, the group
scoring in the mid-range on the financial literacy test looks like the least savvy group; that is, few
differences between them are statistically significant in Panel B at conventional levels. Below we
evaluate whether these differences persist after controlling for other factors.
!!!!!!!!!!!!!!!!!!!!!!!!!!!!!!!!!!!!!!!!!!!!!!!!!!!!!!!!!!!!!13 This could yield an almost 10% larger retirement fund for the most sophisticated over a 30-year life of contributions versus the least knowledgeable, if the former anticipated a base annual return of 2.51% versus the latter at 2% (see http://illuminations.nctm.org/Activity.aspx?id=3568; of course a higher equity share would also imply more volatility).

13 !A Multivariate Analysis of Participant Portfolios and Financial Literacy
To test whether the findings above are robust to a set of control variables, next we
estimate a series of multivariate regression models of the following form:
iii XFinLitcPORTFOLIO εβα +++= .
Here PORTFOLIOi refers to the four participant investment outcomes just discussed, i.e., the
portfolio equity share, expected excess return, standard deviation, and nonsystematic risk share.
In each case, α is the coefficient of interest on the FinLit Index. Results shown in Table 5
differentiate the three knowledge groups (the least knowledgeable group is the reference
category, with Index = 0-1; the middle group has Index = 2-3; and the most knowledgeable Index
= 4-5) as in Table 4. We also control on participant characteristics including age, sex, whether
married, salary (in $10K), plan balance (in $100K), and years of tenure at the institution.14
Table5 here
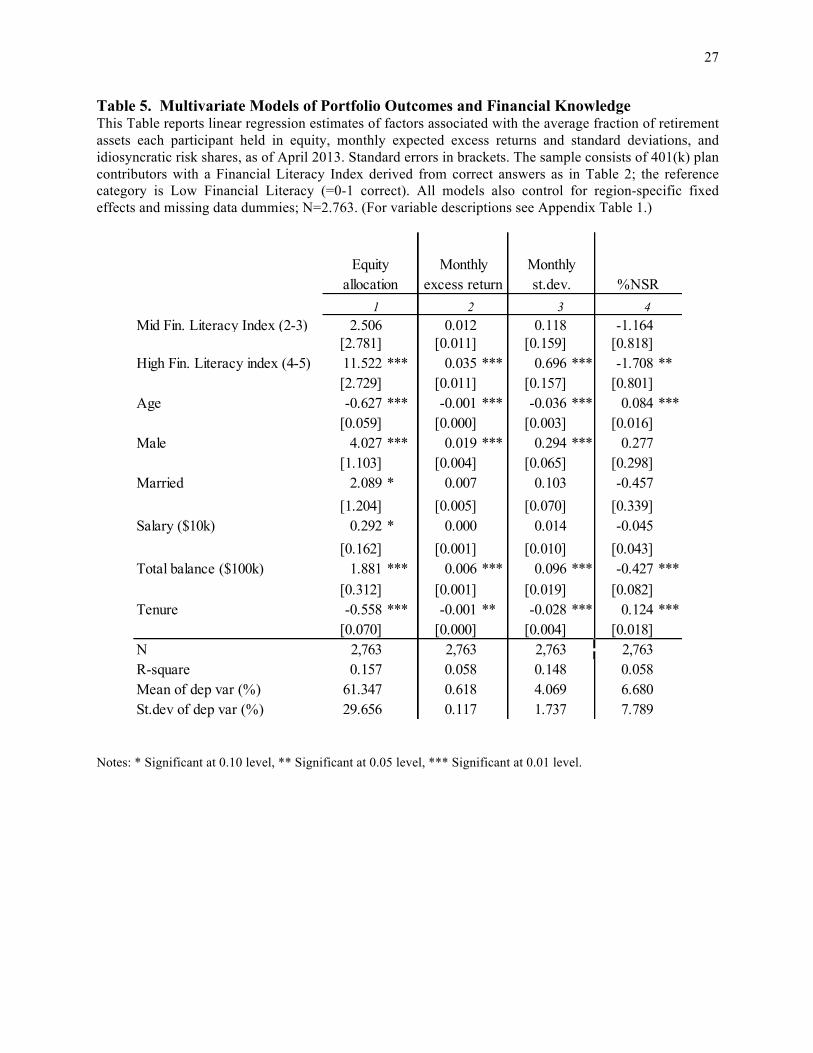
A first finding from Table 5 is that, even after including the controls, the most financially
knowledgeable plan contributors still held more equity in their portfolios and could expect higher
excess returns (and volatility).15 The FinLit coefficients indicate that the most knowledgeable
held 11.52 percentage points more stock than their least knowledgeable counterparts and they
could anticipate earning 3.5 basis points per month more in excess returns (versus 18.69 and 8
bps in Table 4, respectively, when no other controls were included). Though the financial
literacy effects were slightly smaller than without the control variables, they remain statistically
significant and economically large. Indeed, it is remarkable that the strong positive association
!!!!!!!!!!!!!!!!!!!!!!!!!!!!!!!!!!!!!!!!!!!!!!!!!!!!!!!!!!!!!14 Descriptive statistics for variables in Table 5 are reported in Appendix Table 1. We also control for region-specific fixed effects and added dummies for missing data. We lack information on respondent education, but income and plan balances are reasonable proxies. We also lack risk aversion measures in this dataset, though in other datasets, including the American Life Panel, we find that the correlation between financial literacy and risk aversion is only 0.05 (Brown, Kapteyn, and Mitchell 2013). 15 An alternative formulation using dummy variables for age and tenure appears in Appendix Table 2. Results are similar.
14 !between excess returns and the financial index remains, even after netting out past investment
success (since we control on respondents’ 401(k) balances) and fees (since we use net returns).16
Due in part to their higher equity fraction, the portfolios of the most financially
knowledgeable were also more volatile, by 70 basis points, compared to the least knowledgeable
(versus 1.2 without controls, from Table 4). Nevertheless, portfolios of the savvier group
exhibited a statistically significant 1.71 percentage points less idiosyncratic risk (versus -4.52
without controls, in Table 4). In other words, despite adding controls for key demographics and
fund balances, the most financially sophisticated still held more equity and diversified their
investment portfolios more efficiently, compared to their unsophisticated peers.
Additional Findings
We have established that those who subsequently responded to the financial knowledge
survey earned more, held higher plan balances, and contributed more of their salaries to their
retirement accounts compared to their non-respondent counterparts. Yet we are aware of the
possibility that the observed association between financial knowledge and better investment
performance may not be causal. That is, employees who do a poor job investing might be
financially illiterate due to some unobservable factor such as IQ or inattention, which could
make it difficult to assess whether boosting financial knowledge for those individuals would, in
fact, actually enhance their investment outcomes.17
Whether the linkage between financial knowledge and returns is larger or smaller when
financial knowledge is provided to the entire workforce rather than taken by just a few is
!!!!!!!!!!!!!!!!!!!!!!!!!!!!!!!!!!!!!!!!!!!!!!!!!!!!!!!!!!!!!16 We also include the respondents’ 401(k) balance as a control variable in the regressions, which weakens any concern about possible reverse causality between returns and financial knowledge. That is, the fact that there remains a positive and statistically significant association between excess returns and the financial index after netting out past investment success points to the fact that knowledge drives returns, rather than vice versa. 17 This point has been extensively discussed by Behrman et al. (2012), and Lusardi and Mitchell (2014).

15 !obviously interesting from a policy perspective. Nevertheless, as we have access only to
administrative records rather than results generated by a natural experiment, we are uncertain
whether high-financial literacy respondents might differ in some unmeasured but systematic
fashion from those who lack this sophistication. This makes it difficult to prove beyond a
reasonable doubt that the less sophisticated would benefit from financial education if it were
provided to them. An alternative econometric approach would be to use instrumental variables
(IV) to control for unobserved factors that might influence portfolio outcomes,18 but we also lack
independent yet correlated variables that we could use to this end.
Instead, we have explored two alternative approaches which we anticipate will diminish
potential bias due to sample selection. Table 6 reports results from a Heckman two-step model,
where the first column provides estimates of a sample selection equation for those taking the
financial literacy survey. The next four columns indicate the estimated impacts of financial
literacy on portfolio performance after conditioning on this selection correction; the lambda
term, which is the inverse Mills ratio, is constructed from Probit estimates of the first stage. The
qualitative impacts of having high financial knowledge are similar, and in some cases ever larger
(in absolute value). That is, those scoring high on the FinLit survey had even more equity and a
higher expected excess return than without the correction, and the estimated coefficient on the
nonsystematic risk share is twice as large (in absolute value) than in Table 5. Accordingly, our
conclusions are robust to this correction for sample selection.
Table 6 here
!!!!!!!!!!!!!!!!!!!!!!!!!!!!!!!!!!!!!!!!!!!!!!!!!!!!!!!!!!!!!18 Other studies, including Lusardi and Mitchell (2011b), have used IV methods to test for causal effects of financial literacy on retirement planning. Moreover, Bernheim, Garrett, and Maki (2001), Cole and Shastry (2009), and Lusardi and Mitchell (2009) investigate how changes in U.S. schooling laws and state mandates requiring schools to offer financial literacy relate to financial market participation. None of these studies examines how financial literacy relates to investment performance, however.

16 !
A different way to handle sample selection is to use a propensity matching model with
inverse probability weights. While this approach is less susceptible to misspecification bias
(Todd 2014), matching models do assume there is no systematic unobserved difference between
those who were “treated” – i.e., financially knowledgeable – versus others. We cannot test this
directly in our dataset, but when we use this framework to estimate the impact of financial
literacy on portfolio outcomes,19 we continue to find that the estimated Average Treatment Effect
(ATE) of high financial literacy is strongly positive and significant for the equity share, monthly
excess returns, and monthly volatility outcomes (see Table 7). Moreover, being in the high
financial literacy group is again significantly associated with a lower nonsystematic risk share.
The magnitudes of the effects are somewhat smaller for the equity fraction compared to Table 5
(7.1 percentage points instead of 11.5), and for the monthly excess return (3.3 basis points versus
3.5 in Table 5). The coefficient of high financial literacy nonsystematic risk is also smaller than
before (-1.57 versus of -1.71) but still statistically significant and quantitatively large.
Table 7
In sum, across three different model specifications, our results appear quite robust. In
particular, the most financially knowledgeable did invest more in equity, and hence they could
anticipate higher excess returns, albeit with more volatility, compared to their less savvy
counterparts. They also held portfolios that were significantly less exposed to nonsystematic risk.
And given that all the retirement funds offered in the plan were low-cost index funds, the
reported differences were not due to differential charges on participants’ portfolios.
Financial Literacy and Longitudinal Portfolio Changes
!!!!!!!!!!!!!!!!!!!!!!!!!!!!!!!!!!!!!!!!!!!!!!!!!!!!!!!!!!!!!19 See Cattaneo (2010) and Austin (2011). We estimate the effect of high financial literacy via inverse-probability weighting using estimated probability weights to correct for the missing data problem arising from the fact that each subject is observed in only one of the potential outcomes.

17 !
We are also able to compare changes in portfolio outcomes for a short period before and
after the financial literacy survey was administered. To this end, we report in Table 8 the changes
in equity allocations, excess returns, volatility, and nonsystematic risk percentages comparing
plan members’ April and December 2013 holdings.20 The survey, it will be recalled, took place
in October of that year.
Table 8 here
We use the entire sample for this analysis, with a dummy variable indicating who
participated in the FinLit survey. Controlling on other factors, we see that those who elected to
take survey boosted their equity allocations by 66 basis points (on a mean change of 3.90
percent) and their monthly expected excess returns rose by 2.3 basis points (on a mean of 60
bps). No significant difference in volatility or nonsystematic risk was detected, before and after
the FinLit survey.
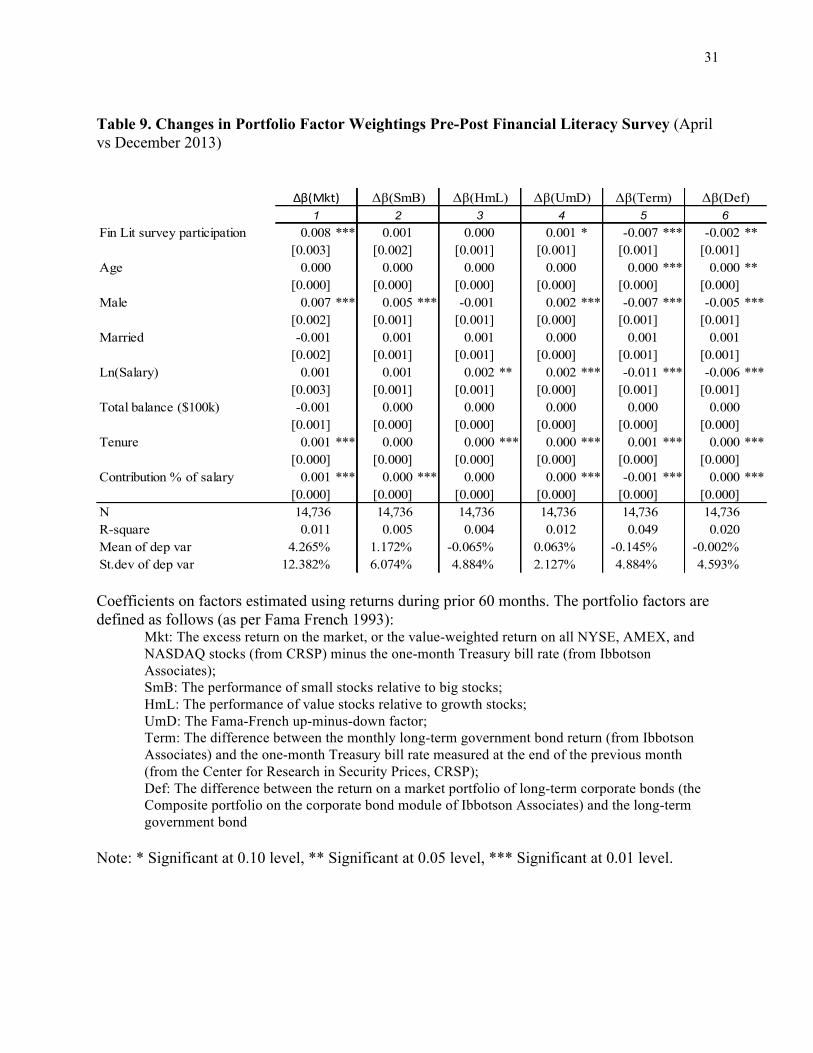
To further understand the reasons for these outcomes, in Table 9 we report how portfolio
factor weightings changed, comparing portfolio allocations before and after the FinLit survey.
Conditioning on other factors, participation in the survey was significantly associated with an
increased exposure to market risk, a marginally significant rise in the Fama-French UmD
factor,21 and small but statistically significant declines in the exposure to bond term structures22
and bond default risk.23 This pattern might be worth tracking over longer time periods to observe
whether the changes persist, but additional data are not currently available to do so.
!!!!!!!!!!!!!!!!!!!!!!!!!!!!!!!!!!!!!!!!!!!!!!!!!!!!!!!!!!!!!20 The longest time period available for analysis was mid-2014; results are similar to those reported here. 21 Up minus down factor (see Fama and French 1993). 22 This is defined as the difference between the monthly long-term government bond return (from Ibbotson Associates) and the one-month Treasury bill rate measured at the end of the previous month (from the Center for Research in Security Prices, CRSP); see Fama and French, 1993. 23 Def is defined as the difference between the return on a market portfolio of long-term corporate bonds (the Composite portfolio on the corporate bond module of Ibbotson Associates) and the long-term government bond; see Fama and French 1993.

18 !Nevertheless, the main message is that those who took the FinLit survey changed their portfolios
afterwards to exhibit less “tilt” toward systematic sources of variation.24
Table 9 here
Conclusions
Now that 401(k) plans are the most common form of employer pension in the United
States, employees are increasingly being asked to take on responsibility for managing their own
retirement savings.25 Yet recent research indicates that many Americans are financially illiterate,
casting doubt on the chances that they will be up to the challenge of managing their own money
successfully. Moreover, investors who are more financially savvy also save more and accumulate
more retirement wealth than their less-knowledgeable counterparts.
This paper has explored whether this might be due to different investment portfolios, and
if so, which particular elements differ across more versus less sophisticated investors. To do so
we used high-quality administrative data on participants in a large U.S. 401(k) retirement plan,
along with a purpose-built survey on financial knowledge. We found that the most financially
knowledgeable investors (a) held 18 percentage points more stock than their least knowledgeable
counterparts; (b) could anticipate earning 8 basis points per month more in excess returns; (c)
had 40% higher portfolio volatility; but (d) held portfolios with about 38% less idiosyncratic
risk, compared to their least savvy counterparts. Our results are qualitatively similar after
controlling on observables as well as modeling sample selection. Yet they also select portfolios
with lower nonsystematic risk, suggesting that they hold better diversified equity portfolios than
!!!!!!!!!!!!!!!!!!!!!!!!!!!!!!!!!!!!!!!!!!!!!!!!!!!!!!!!!!!!!24 This is confirmed in results available on request, using inverse-probability weighting models of the changes in portfolio weightings. 25 In the 1980’s, only 40 percent of U.S. private-sector retirement contributions went to Defined Contribution (DC) pensions; today, over 90 percent of contributions are flowing to DC retirement accounts (see Poterba, Venti, and Wise, 2014).

19 !their less sophisticated counterparts. This finding concords with prior studies showing that, even
given an efficient fund menu, some plan participants will select better portfolios than others
(Tang et al. 2010). We also examined how the portfolio changed after the financial literacy
intervention. Controlling on other factors, those who elected to take survey boosted their equity
allocations by 66 basis points and their monthly expected excess returns rose by 2.3 basis points,
while no significant difference in volatility or nonsystematic risk was detected before versus
after the FinLit survey.
Naturally, since this research reports on only one institution’s 401(k) plan, our findings
must be supplemented with additional quantitative evidence on the impact of financial literacy
interventions. Nevertheless, the fact that more knowledge is associated with better 401(k)
retirement plan outcomes is supportive of models that posit differences in financial sophistication
as a driver of wealth inequality (e.g., Lusardi, Michaud, and Mitchell 2013). An additional point
to consider is that, in our context, the investment choices available for participant investments
were relatively few and all were quite inexpensive index funds. By contrast, in companies
offering more complex investment menus and even brokerage accounts, the impact of high fees
on the least financial knowledgeable could be important.26 Moreover, such differences in
financial sophistication could contribute to growing inequality in retirement outcomes.
Undoubtedly, the ability to invest wisely and earn better returns is increasingly important for
retirement wellbeing in an aging world.
!!! !
!!!!!!!!!!!!!!!!!!!!!!!!!!!!!!!!!!!!!!!!!!!!!!!!!!!!!!!!!!!!!26 Potential changes in other employer-provided retirement benefits (e.g., health saving and health reimbursement accounts) are also likely to enhance the importance of individually-managed investment decisions, inasmuch as these other accounts also require employees to contribute to and manage their savings.

20 ! References
Austin, Peter C. 2011. An Introduction to Propensity Score Methods for Reducing the Effects of Confounding in Observational Studies. Multivariate Behavioral Research 46: 399–424.
Behrman, Jere, Olivia S. Mitchell, Cindy Soo, and David Bravo. 2012. Financial Literacy, Schooling, and Wealth Accumulation. American Economic Review, Papers and Proceedings. 102(3): 300–304.
Bernheim, Douglas, Daniel Garrett, and Dean Maki. 2001. Education and Saving: The Long-term Effects of High School Financial Curriculum Mandates. Journal of Public Economics 80: 435–565.
Bodnaruk, Andriy and Andrei Simonov. 2014. Do Financial Experts Make Better Investment Decisions? Journal of Financial Intermediation. Available online 5 October 2014
Bricker, Jesse, Arthur B. Kennickell, Kevin B. Moore, and John Sabelhaus. 2012. Changes in U.S. Family Finances from 2007 to 2010: Evidence from the Survey of Consumer Finances.” Federal Reserve Bulletin June 98(2).
Brown, Jeffrey R., Arie Kapteyn, and Olivia S. Mitchell. 2013. “Framing and Claiming: How Information-Framing Affects Expected Social Security Claiming Behavior.” Journal of Risk and Insurance. July.
Calcagno, Riccardo and Chiara Monticone. 2015. Financial Literacy and the Demand for Advice. Journal of Banking & Finance 50: 363–380
Calvet, Laurent, John Campbell, and Paolo Sodini. 2007. Down or Out: Assessing the Welfare Costs of Household Investment Mistakes. Journal of Political Economy 115: 707-747
Calvet, Laurent, John Campbell, and Paolo Sodini. 2009a. Fight or Flight? Portfolio Rebalancing by Individual Investors. Quarterly Journal of Economics 301-348.
Calvet, Laurent E., John Campbell, and Paolo Sodini. 2009b. Measuring the Financial Sophistication of Households. American Economic Review, Papers & Proceedings. 99:2, 393–398
Calvet, Laurent E. and Paolo Sodini. 2014. Twin Picks: Disentangling the Determinants of Risk-Taking in Household Portfolios. Journal of Finance. 69(2): 897-906.
Cattaneo, M. D. 2010. Efficient Semiparametric Estimation of Multi-Valued Treatment Effects Under Ignorability. Journal of Econometrics 155: 138–154.
Choi, James, David Laibson, and Brigitte Madrian. 2010. Why Does the Law of One Price Fail? An Experiment on Index Mutual Funds. Review of Financial Studies 23 (4): 1405-1432.
Christelis, Dimitris, Tullio Jappelli, and Mario Padula. 2010. Cognitive Abilities and Portfolio Choice. European Economic Review 54(1): 18–38.
Clark, Robert, Jennifer A. Maki, and Melinda Sandler Morrill. 2014. Can Simple Informational Nudges Increase Employee Participation in a 401(k) Plan? Southern Economics Journal 80(3): 677-701.

21 !Cole, Shawn and Gauri Shastry. 2009. “Smart Money: The Effect of Education, Cognitive
Ability, and Financial Literacy on Financial Market Participation.” HBS Working Paper 09-071.
Collins, J. Michael. 2012. Financial Advice: A Substitute for Financial Literacy? Financial Services Review 21:307-322.
Deuflhard, Florian, Dmitris Georgarakos, and Roman Inderst. 2014. Financial Literacy and Savings Account Returns. Unpublished working paper, Goethe University of Frankfurt.
EBRI. (2013). Few Get Paid Advice – Fewer Take It. Fast Facts, July 3: 236.
Fama, Eugene F. and Kenneth R. French. 1993. “Common Risk Factors in the Returns on Stocks and Bonds.” Journal of Financial Economics 33: 3-56.
FINRA Investor Education Foundation. 2013. Financial Capability in the United States. Report of Findings from the 2012 National Financial Capability Study. http://www.usfinancialcapability.org/downloads/NFCS_2012_Report_Natl_Findings.pdf
Grinblatt, Mark, Matt Keloharju, and Juhani Linnainmaa. 2011. IQ and Stock Market Participation. Journal of Finance 66(6): 2121-2164.
Haliassos, Michael and Carol Bertaut. 1995. Why Do So Few Hold Stocks? The Economic Journal 105, 1110-1129
Hastings, Justine and Olivia S. Mitchell. 2011. How Financial Literacy and Impatience Shape Retirement Wealth and Investment Behaviors. NBER WP 16740.
Hastings, Justine, Olivia S. Mitchell, and Eric Chyn. 2011. Fees, Framing, and Financial Literacy in the Choice of Pension Managers. In Financial Literacy: Implications for Retirement Security and the Financial Marketplace. Eds. Olivia S. Mitchell and Annamaria Lusardi. Oxford: Oxford University Press: 101-115.
Jappelli, Tulio, and Mario Padula. 2013a. Consumption Growth, the Interest Rate, and Financial Literacy. CSEF Working Paper no. 329. University of Naples.
Jappelli, Tullio, and Mario Padula. 2013b. Investment in Financial Literacy and Saving Decisions. Journal of Banking and Finance 37: 2779-2792.
Kim, Hugh H, Raimond Maurer, and Olivia S. Mitchell. 2015. Time is Money: Life Cycle Rational Inertia and Delegation of Investment Management. NBER WP 19732.
Lusardi, Annamaria. 2011. Americans’ Financial Capability. NBER Working Paper 17103.
Lusardi, Annamaria, Pierre-Carl Michaud, and Olivia S. Mitchell. 2013. Optimal Financial Literacy and Wealth Inequality. NBER Working Paper 18669.
Lusardi, Annamaria, and Olivia S. Mitchell. 2014. The Economic Importance of Financial Literacy: Theory and Evidence. Journal of Economic Literature 52(1): 5-44
Lusardi, Annamaria, and Olivia S. Mitchell. 2011a. Financial Literacy and Planning: Implications for Retirement Wellbeing. In Financial Literacy: Implications for Retirement Security and the Financial Marketplace. Eds. O. S. Mitchell and A. Lusardi. Oxford, Oxford University Press: 17-39.
Lusardi, Annamaria and Olivia S. Mitchell. 2011b. Financial Literacy and Retirement Planning in the United States. Journal of Pension Economics and Finance 10(4): 509-525.

22 !Lusardi, Annamaria and Olivia S. Mitchell. 2011c. Financial Literacy around the World: An
Overview. Journal of Pension Economics and Finance 10(4): 497-508.
Lusardi, Annamaria, and Olivia S. Mitchell. 2009. How Ordinary Consumers Make Complex Economic Decisions: Financial Literacy and Retirement Readiness. NBER Working Paper 15350
Lusardi, Annamaria and Olivia S. Mitchell. 2008. Planning and Financial Literacy: How Do Women Fare? American Economic Review 98:2, 413–417.
Lusardi, Annamaria, and Olivia S. Mitchell. 2007. Baby Boomer Retirement Security: The Roles of Planning, Financial literacy, and Housing Wealth. Journal of Monetary Economics, 54(1): 205–224.
Lusardi, Annamaria, Olivia S. Mitchell, and Vilsa Curto. 2010. Financial Literacy among the Young. Journal of Consumer Affairs 44(2): 358-380.
Poterba, James, Steven Venti, and David Wise. 2014. Health, Education, and the Post-Retirement Evolution of Household Assets. Journal of Human Capital 4.
Tang, Ning, Olivia S. Mitchell, Gary Mottola, and Steve Utkus. 2010. The Efficiency of Sponsor and Participant Portfolio Choices in 401(k) Plans. Journal of Public Economics 94: 1073-1085.
Todd, Petra E. 2014. Advanced Microeconometric Techniques and Applications. Unpublished manuscript, University of Pennsylvania.
van Rooij, Maarten, Annamaria Lusardi, and Rob Alessie. 2011. Financial Literacy and Stock Market Participation. Journal of Financial Economics 101(2): 449–472.
von Gaudecker, Hans-Martin. 2015. How Does Household Portfolio Diversification Vary with Financial Sophistication and Advice? Journal of Finance. 70(2): 489-507.
Yoong, Joanne. 2011. Financial Illiteracy and Stock Market Participation: Evidence from the RAND American Life Panel. In Financial Literacy: Implications for Retirement Security and the Financial Marketplace. Eds O. S. Mitchell and A. Lusardi. Oxford: Oxford University Press: 76-97.
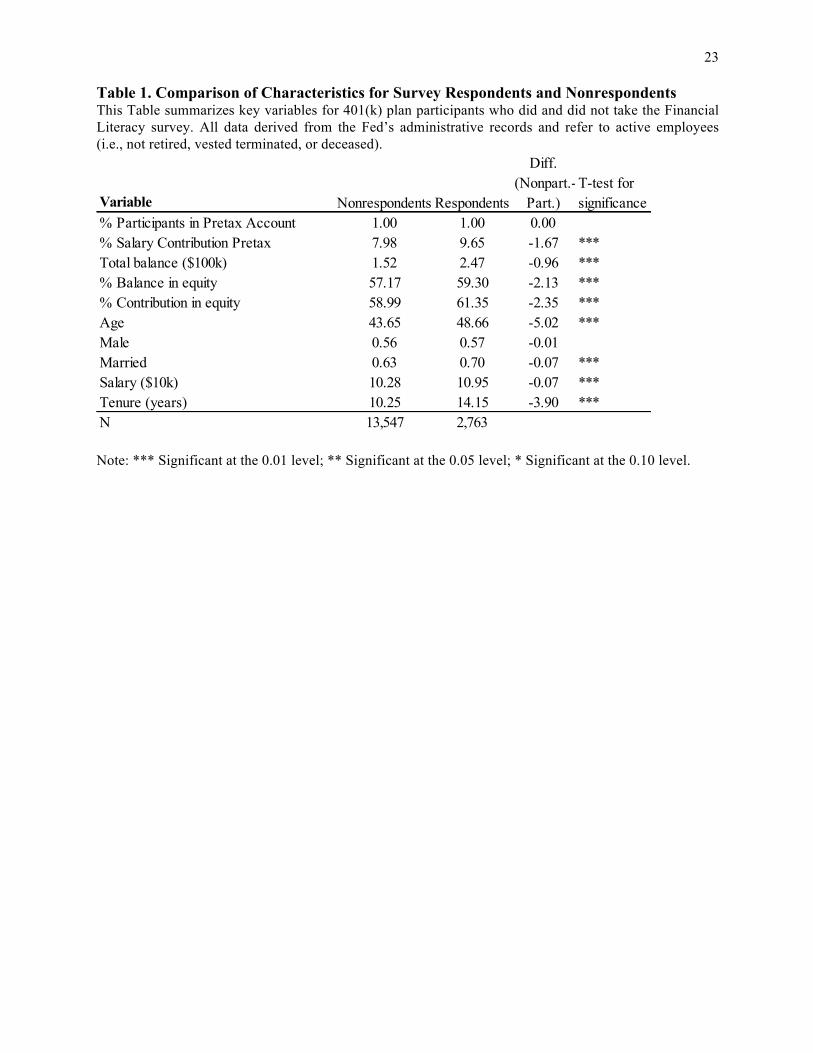
23 !Table 1. Comparison of Characteristics for Survey Respondents and Nonrespondents This Table summarizes key variables for 401(k) plan participants who did and did not take the Financial Literacy survey. All data derived from the Fed’s administrative records and refer to active employees (i.e., not retired, vested terminated, or deceased).
Note: *** Significant at the 0.01 level; ** Significant at the 0.05 level; * Significant at the 0.10 level.
Variable Nonrespondents Respondents
Diff. (Nonpart.-
Part.)T-test for significance
% Participants in Pretax Account 1.00 1.00 0.00% Salary Contribution Pretax 7.98 9.65 -1.67 ***Total balance ($100k) 1.52 2.47 -0.96 ***% Balance in equity 57.17 59.30 -2.13 ***% Contribution in equity 58.99 61.35 -2.35 ***Age 43.65 48.66 -5.02 ***Male 0.56 0.57 -0.01Married 0.63 0.70 -0.07 ***Salary ($10k) 10.28 10.95 -0.07 ***Tenure (years) 10.25 14.15 -3.90 ***N 13,547 2,763

24 ! Table 2. Results of Financial Literacy Assessment This Table summarizes responses to the five-item Financial Literacy questions by survey respondents. Correct answers are bolded. N=2,763. A. Responses by Question
B. Distribution of Financial Literacy Index*
*Number of financial literacy questions answered correctly.
Financial Literacy Questions: Mean SDSuppose you had $100 in a savings account and the interest rate was 2% per year. After 5 years, how much do you think you would have in the account if you left the money to grow? More than $110, Exactly $110, Less than $110, DK, RF
0.76 0.42
Imagine that the interest rate on your savings account was 1% per year and inflation was 2% per year. After 1 year, how much would you be able to buy with the money in this account? More than today, Exactly the same , Less than today, DK, RF
0.92 0.27
True or False? Buying a single company’s stock usually provides a safer return than a stock mutual fund. True, False, DK, RF 0.87 0.33
Assume you were in the 25% tax bracket (you pay $0.25 in tax for each dollar earned) and you contributed $100 pretax to an employer’s 401(k) plan. Your take-home pay (what’s in your paycheck after all taxes and other payments are taken out) will then: Decline by $100, Decline by $75, Decline by $50, Remain the same, DK, RF
0.45 0.50
Assume that an employer matched employee contributions dollar for dollar. If the employee contributed $100 to the 401(k) plan, his account balance in the plan including his contribution would: Increase by $50, Increase by $100, Increase by $200, Remain the same , DK, RF
0.77 0.42
Financial Knowledge Index (# of questions answered correctly) 3.79 1.19
FinLit Score Freq. Percent (%)
0 44 1.631 88 3.252 253 9.353 525 19.44 897 33.155 899 33.22
Total 2,706 100.0
DK
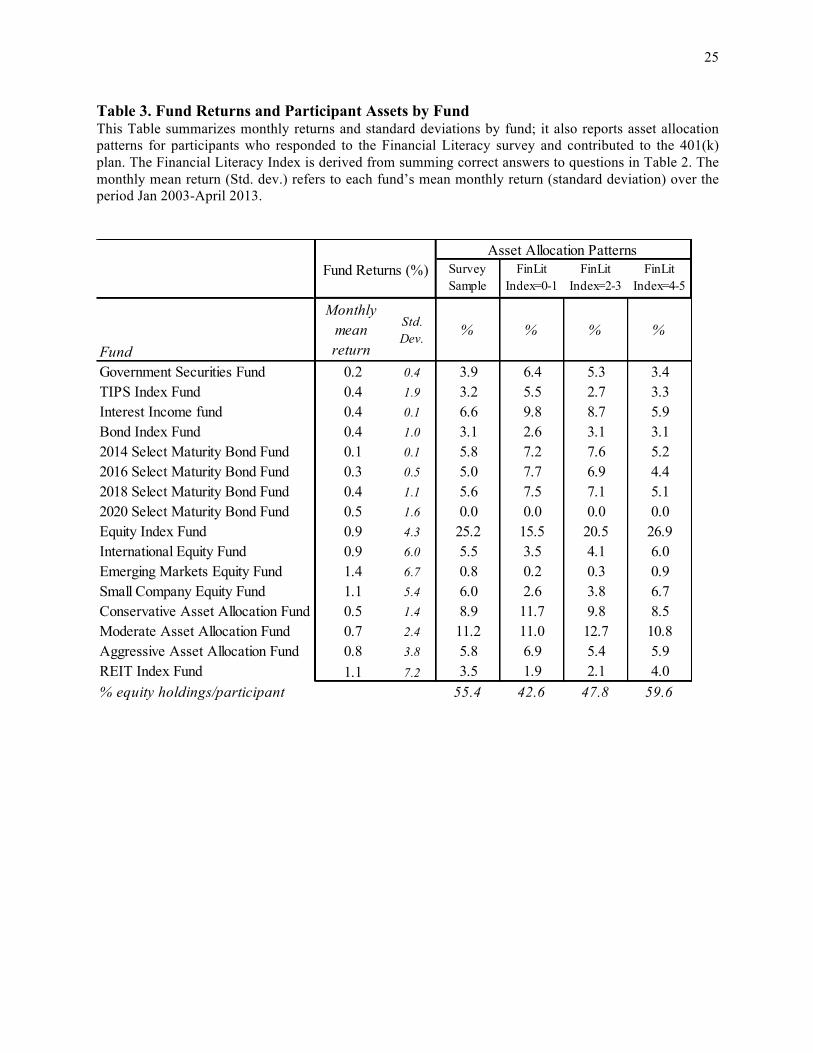
25 ! Table 3. Fund Returns and Participant Assets by Fund This Table summarizes monthly returns and standard deviations by fund; it also reports asset allocation patterns for participants who responded to the Financial Literacy survey and contributed to the 401(k) plan. The Financial Literacy Index is derived from summing correct answers to questions in Table 2. The monthly mean return (Std. dev.) refers to each fund’s mean monthly return (standard deviation) over the period Jan 2003-April 2013.
Survey Sample
FinLit Index=0-1
FinLit Index=2-3
FinLit Index=4-5
Fund
Monthly mean return
Std. Dev. % % % %
Government Securities Fund 0.2 0.4 3.9 6.4 5.3 3.4TIPS Index Fund 0.4 1.9 3.2 5.5 2.7 3.3Interest Income fund 0.4 0.1 6.6 9.8 8.7 5.9Bond Index Fund 0.4 1.0 3.1 2.6 3.1 3.12014 Select Maturity Bond Fund 0.1 0.1 5.8 7.2 7.6 5.22016 Select Maturity Bond Fund 0.3 0.5 5.0 7.7 6.9 4.42018 Select Maturity Bond Fund 0.4 1.1 5.6 7.5 7.1 5.12020 Select Maturity Bond Fund 0.5 1.6 0.0 0.0 0.0 0.0Equity Index Fund 0.9 4.3 25.2 15.5 20.5 26.9International Equity Fund 0.9 6.0 5.5 3.5 4.1 6.0Emerging Markets Equity Fund 1.4 6.7 0.8 0.2 0.3 0.9Small Company Equity Fund 1.1 5.4 6.0 2.6 3.8 6.7Conservative Asset Allocation Fund 0.5 1.4 8.9 11.7 9.8 8.5Moderate Asset Allocation Fund 0.7 2.4 11.2 11.0 12.7 10.8Aggressive Asset Allocation Fund 0.8 3.8 5.8 6.9 5.4 5.9REIT Index Fund 1.1 7.2 3.5 1.9 2.1 4.0% equity holdings/participant 55.4 42.6 47.8 59.6
Fund Returns (%)Asset Allocation Patterns
26 !
Table 4. Descriptive Statistics: Participants’ Number of Funds Held and Pension Performance This Table reports the average number of funds held, equity fraction, monthly excess return, standard deviation, and nonsystematic risk share (%NSR; see text) across participants of different types, as of April 2013. Survey nonrespondents were employees who contributed to their 401(k) plan but did not respond to the survey. Survey respondents contributed to their 401(k) plan and responded to the Financial Literacy survey. FinLit Index is derived by summing correct answers in Table 2. A. Mean Values by Type of Employee
B. Tests for Differences in Means by Employee Type
Note: Two-sided tests; *** Significant at the 0.01 level; ** Significant at the 0.05 level; * Significant at the 0.10 level.
Survey
NonparticipantsNumber of funds 3.81 4.14 4.25 4.12 4.15
Equity allocation (%) 56.39 58.01 44.30 48.82 62.99Monthly excess returns (%) 0.51 0.53 0.46 0.49 0.54Monthly st.dev. (%) 3.77 3.91 3.03 3.31 4.23%NSR 8.48 8.53 12.03 10.28 7.51N 13,362 2,706 132 778 1,796
Survey Participants
Low Fin. Lit. Index (0-1)
Med. Fin. Lit. Index (2-3)
High Fin. Lit. Index (4-5)
Number of funds 0.33 *** -0.13 -0.10 0.03
Equity allocation (%) 1.62 ** 4.52 18.69 *** 14.17 ***Monthly excess returns 0.02 *** 0.03 ** 0.08 *** 0.05 ***Monthly st.dev. (%) 0.14 *** 0.28 1.20 *** 0.92 ***%NSR 0.05 -1.75 -4.52 *** -2.77 ***
Diff. (Part.-Nonpart.)
Diff. (Mid-LowFin.Lit)
Diff. (Hi-Low
Fin.Lit.)
Diff. (Hi-Mid Fin.
Lit.)
27 !
Table 5. Multivariate Models of Portfolio Outcomes and Financial Knowledge This Table reports linear regression estimates of factors associated with the average fraction of retirement assets each participant held in equity, monthly expected excess returns and standard deviations, and idiosyncratic risk shares, as of April 2013. Standard errors in brackets. The sample consists of 401(k) plan contributors with a Financial Literacy Index derived from correct answers as in Table 2; the reference category is Low Financial Literacy (=0-1 correct). All models also control for region-specific fixed effects and missing data dummies; N=2.763. (For variable descriptions see Appendix Table 1.)
Notes: * Significant at 0.10 level, ** Significant at 0.05 level, *** Significant at 0.01 level.
1 2 3 4Mid Fin. Literacy Index (2-3) 2.506 0.012 0.118 -1.164
[2.781] [0.011] [0.159] [0.818]High Fin. Literacy index (4-5) 11.522 *** 0.035 *** 0.696 *** -1.708 **
[2.729] [0.011] [0.157] [0.801]Age -0.627 *** -0.001 *** -0.036 *** 0.084 ***
[0.059] [0.000] [0.003] [0.016]Male 4.027 *** 0.019 *** 0.294 *** 0.277
[1.103] [0.004] [0.065] [0.298]Married 2.089 * 0.007 0.103 -0.457
[1.204] [0.005] [0.070] [0.339]Salary ($10k) 0.292 * 0.000 0.014 -0.045
[0.162] [0.001] [0.010] [0.043]Total balance ($100k) 1.881 *** 0.006 *** 0.096 *** -0.427 ***
[0.312] [0.001] [0.019] [0.082]Tenure -0.558 *** -0.001 ** -0.028 *** 0.124 ***
[0.070] [0.000] [0.004] [0.018]N 2,763 2,763 2,763 2,763R-square 0.157 0.058 0.148 0.058Mean of dep var (%) 61.347 0.618 4.069 6.680St.dev of dep var (%) 29.656 0.117 1.737 7.789
Monthly excess return
Monthly st.dev. %NSR
Equity allocation

28 !
Table 6. Multivariate Models of Portfolio Outcomes and Financial Literacy with Heckit Sample Selection Correction The first column reports coefficient estimates from a Probit sample selection model for responding to the Financial Literacy Survey. Subsequent columns replicate the multivariate regressions for the four dependent variables of interest in Table 5 (as of April 2013), along with the Lambda that corrects for sample selection. Standard errors in brackets. The reference category in the last four columns is Low Financial Literacy (=0-1 correct). All models also control for region-specific fixed effects and missing data dummies.
Note: * Significant at 0.10 level, ** Significant at 0.05 level, *** Significant at 0.01 level.
1 2 3 4Mid Fin. Literacy Index (2-3) 3.685 0.025 ** 0.222 -1.577
[2.723] [0.012] [0.166] [1.313]High Fin. Literacy index (4-5) 14.055 *** 0.063 *** 0.915 *** -3.424 ***
[2.673] [0.012] [0.163] [1.273]Age 0.019 *** -4.804 *** -0.011 *** -0.306 *** 0.824 **
[0.001] [0.815] [0.004] [0.051] [0.336]Male -0.008 5.560 *** 0.025 *** 0.427 *** 0.120
[0.025] [1.191] [0.005] [0.075] [0.444]Married 0.027 -3.967 ** 0.002 -0.272 ** -0.033
[0.027] [1.812] [0.008] [0.114] [0.730]Salary ($10k) 0.009 *** -1.723 *** -0.004 ** -0.114 *** 0.242
[0.003] [0.447] [0.002] [0.028] [0.196]Total balance ($100k) 0.036 *** -5.888 *** -0.011 * -0.386 *** 0.831
[0.007] [1.429] [0.007] [0.091] [0.570]Tenure -0.001 -0.336 *** -0.001 *** -0.019 *** 0.157 ***
[0.002] [0.076] [0.000] [0.005] [0.031]Lambda -281.730 *** -0.635 ** -18.032 *** 47.718 **
[55.068] [0.254] [3.483] [22.754]N 16,068 2,706 2,706 2,706 2,706R-square 0.073 0.163 0.090 0.158 0.076Mean of dep var (%) 0.168 58.007 0.525 3.910 8.526St.dev of dep var (%) 0.374 30.610 0.135 1.944 11.323
Took FinLit SurveyProbit
Equity allocation
Monthly excess return
Monthly st.dev. %NSR

29 !
Table 7. Inverse-Probability Weighting Models of Portfolio Outcomes and Financial Knowledge This Table reports the estimated effects of the Average Treatment Effect (ATE) for the high financial literacy group for the four portfolio outcome variables of interest in Table 5 (as of April 2013). The inverse-probability weighting model computes the ATE level and percent for being in the high financial literacy group. Standard errors in brackets. Models also control for variables included in Table 5.
Note: * Significant at 0.10 level, ** Significant at 0.05 level, *** Significant at 0.01 level.
1 2 3 4 ATE 7.136 *** 0.033 *** 0.472 *** -1.571 *** [0.806] [0.003] [0.053] [0.305]
ATE (%) 0.128 *** 0.065 *** 0.126 *** -0.182 *** [0.015] [0.006] [0.014] [0.035]
Equity allocation
Monthly excess return
Monthly st.dev.
%NSR

30 !
Table 8. Changes in Portfolio Outcomes Pre/Post Financial Literacy Survey (April vs December 2013)
Δ!Equity allocation
Δ Monthly excess return
Δ Monthly st.dev. Δ %NSR
1 2 3 4 Fin Lit survey participation 0.664 * 0.023 *** -0.037 -0.206 [0.379] [0.006] [0.024] [0.168] Age 0.012 -0.005 *** 0.008 *** -0.011 * [0.015] [0.000] [0.001] [0.006] Male 0.278 0.044 *** -0.059 *** -0.065 [0.255] [0.004] [0.016] [0.113] Married -0.043 0.013 *** -0.002 0.093 [0.277] [0.005] [0.017] [0.124] Ln(Salary) 0.031 0.118 *** -0.223 *** -0.054 [0.330] [0.006] [0.021] [0.147] Total balance ($100k) 0.010 0.004 *** -0.009 0.059 [0.094] [0.002] [0.006] [0.044] Tenure 0.012 -0.002 *** 0.009 *** -0.048 *** [0.019] [0.000] [0.001] [0.009] Contribution % of salary 0.097 *** 0.004 *** -0.001 -0.043 *** [0.031] [0.001] [0.002] [0.015] N 14,736 14,736 14,736 14,736 R-square 0.003 0.090 0.029 0.009 Mean of dep var (%) 3.390 0.600 -0.478 0.470 St.dev of dep var (%) 15.321 0.275 0.971 6.656
Note: * Significant at 0.10 level, ** Significant at 0.05 level, *** Significant at 0.01 level. Average fund returns during prior 60 months used to predict expected returns.
31 !
Table 9. Changes in Portfolio Factor Weightings Pre-Post Financial Literacy Survey (April vs December 2013)
Coefficients on factors estimated using returns during prior 60 months. The portfolio factors are defined as follows (as per Fama French 1993):
Mkt: The excess return on the market, or the value-weighted return on all NYSE, AMEX, and NASDAQ stocks (from CRSP) minus the one-month Treasury bill rate (from Ibbotson Associates); SmB: The performance of small stocks relative to big stocks; HmL: The performance of value stocks relative to growth stocks; UmD: The Fama-French up-minus-down factor; Term: The difference between the monthly long-term government bond return (from Ibbotson Associates) and the one-month Treasury bill rate measured at the end of the previous month (from the Center for Research in Security Prices, CRSP); Def: The difference between the return on a market portfolio of long-term corporate bonds (the Composite portfolio on the corporate bond module of Ibbotson Associates) and the long-term government bond
Note: * Significant at 0.10 level, ** Significant at 0.05 level, *** Significant at 0.01 level.
Fin Lit survey participation 0.008 *** 0.001 0.000 0.001 * -0.007 *** -0.002 **[0.003] [0.002] [0.001] [0.001] [0.001] [0.001]
Age 0.000 0.000 0.000 0.000 0.000 *** 0.000 **[0.000] [0.000] [0.000] [0.000] [0.000] [0.000]
Male 0.007 *** 0.005 *** -0.001 0.002 *** -0.007 *** -0.005 ***[0.002] [0.001] [0.001] [0.000] [0.001] [0.001]
Married -0.001 0.001 0.001 0.000 0.001 0.001[0.002] [0.001] [0.001] [0.000] [0.001] [0.001]
Ln(Salary) 0.001 0.001 0.002 ** 0.002 *** -0.011 *** -0.006 ***[0.003] [0.001] [0.001] [0.000] [0.001] [0.001]
Total balance ($100k) -0.001 0.000 0.000 0.000 0.000 0.000[0.001] [0.000] [0.000] [0.000] [0.000] [0.000]
Tenure 0.001 *** 0.000 0.000 *** 0.000 *** 0.001 *** 0.000 ***[0.000] [0.000] [0.000] [0.000] [0.000] [0.000]
Contribution % of salary 0.001 *** 0.000 *** 0.000 0.000 *** -0.001 *** 0.000 ***[0.000] [0.000] [0.000] [0.000] [0.000] [0.000]
N 14,736 14,736 14,736 14,736 14,736 14,736R-square 0.011 0.005 0.004 0.012 0.049 0.020Mean of dep var 4.265% 1.172% -0.065% 0.063% -0.145% -0.002%St.dev of dep var 12.382% 6.074% 4.884% 2.127% 4.884% 4.593%
Δβ(UmD) Δβ(Term) Δβ(Def)1 2 3 4 5 6
Δβ(Mkt) Δβ(SmB) Δβ(HmL)

32 !
Appendix Table 1. Descriptive Statistics for Variables in Table 5 This Table reports descriptive statistics for dependent and explanatory variables used in models reported in Table 5.
!!
Mean Sd. Dev. Min MaxEquity allocation (%) 58.01 30.61 0.00 100.00Monthly excess return (%) 0.53 0.13 0.11 1.03Monthly st.dev. (%) 3.91 1.94 0.19 9.41%NSR (%) 8.53 11.32 0.04 75.49Low Fin. Literacy Index (0-1) 0.05 0.22 0 1Low Fin. Literacy Index (2-3) 0.29 0.45 0 1High Fin. Literacy index (4-5) 0.66 0.47 0 1Age 48.45 10.18 21 77Male 0.57 0.50 0 1Married 0.70 0.46 0 1Salary ($10k) 10.95 5.11 2.94 42.41Total balance ($100k) 2.44 2.86 0 29.63Tenure 14.57 11.37 0 46Self-assessment score 4.70 1.28 1 7Allocating plan investments 4.04 1.57 1 7

33 !
Appendix Table 2. Multivariate Models of Portfolio Outcomes and Financial Knowledge with dummies for Age and Tenure (instead of continuous variables). This Table reports coefficient estimates from multivariate regressions for the same four dependent variables used in Table 4, along with dummy variables for Age and Tenure (instead of continuous variables). The sample consists of 401(k) plan contributors with a Financial Literacy Index derived from correct answers as in Table 2; the reference category is Low Financial Literacy (=0-1 correct). All models also control for region-specific fixed effects and missing data dummies. Standard errors in brackets.
Notes: * Significant at 0.10 level, ** Significant at 0.05 level, *** Significant at 0.01 level. Regional controls also included.
Mid Fin. Literacy Index (2-3) 4.219 0.026 ** 0.249 -1.802[2.758] [0.012] [0.168] [1.321]
High Fin. Literacy index (4-5) 14.583 *** 0.064 *** 0.935 *** -3.689 ***[2.730] [0.012] [0.166] [1.275]
Age>=50 -12.668 *** -0.025 *** -0.772 *** 2.239 ***[1.221] [0.006] [0.078] [0.463]
Male 4.120 *** 0.022 *** 0.334 *** 0.341[1.160] [0.005] [0.074] [0.434]
Married 1.174 0.013 ** 0.059 -0.828[1.268] [0.006] [0.080] [0.512]
Ln(Salary) 5.496 *** 0.015 * 0.315 *** -1.821 ***[1.796] [0.008] [0.115] [0.697]
Total balance ($100k) 0.414 0.002 * 0.017 -0.197 *[0.306] [0.001] [0.020] [0.118]
Tenure>=10 -8.734 *** -0.037 *** -0.524 *** 3.49 ***[1.370] [0.006] [0.087] [0.514]
Contribution % of salary 0.300 *** 0.001 * 0.025 *** 0.039[0.114] [0.001] [0.007] [0.045]
N 2,706 2,706 2,706 2,706R-square 0.135 0.082 0.134 0.065Mean of dep var (%) 58.007 0.525 3.910 8.526St.dev of dep var (%) 30.610 0.135 1.944 11.323
1 2 3 4
Equity allocation
Monthly excess return
Monthly st.dev. %NSR