Financial inclusion in Uganfa - COMCEC · FINANCIAL INCLUSION IN UGANDA ... Forex bureaus, Mobile...
40
FINANCIAL INCLUSION IN UGANDA A Presentation During the 2nd Meeting of the COMCEC Financial Cooperation Working Group, March 27th, 2014, at Crowne Plaza 0Hotel, in Ankara, Republic of Turkey By Kasenge Lawrence Economist, Microfinance Department, Ministry Of Finance, Planning And Economic Development, UGANDA
-
Upload
truongdiep -
Category
Documents
-
view
215 -
download
2
Transcript of Financial inclusion in Uganfa - COMCEC · FINANCIAL INCLUSION IN UGANDA ... Forex bureaus, Mobile...

FINANCIAL INCLUSION IN UGANDA A Presentation During the 2nd Meeting of the COMCEC Financial Cooperation Working Group, March 27th, 2014, at Crowne Plaza 0Hotel, in Ankara, Republic of Turkey
By Kasenge Lawrence Economist, Microfinance Department, Ministry Of Finance,
Planning And Economic Development, UGANDA

Outline of presentation
• Background
• Classification of Financial institutions
• FINANCIAL INCLUSION IN UGANDA-Key Findings of FINSCOPE Survey
• Financial Access Strands
• Challenges and Barriers to financial Inclusion
• Way Forward

Background Since 2006, the Uganda’s financial sector has experienced
positive changes, remarkably; in the increase of commercial banks (24 banks with over 400 branches), SACCOS and MFIS and informal financial institutions (VSLAs, ASCAs and ROSCAs) 20 insurance companies licensed and regulated by IRA In particular since 2009, there has been a dramatic increase in the
use of mobile money services
Government efforts to strengthen financial inclusion since 2001 With the above developments, there is need to explore the
extent to which these developments have translated into more financial inclusion of the adult population.
In Uganda this has been monitored through FinScope surveys since 2006, repeated every after three years

Financial Inclusion- Definition & Measurement Issues Financial inclusion means access to
basic financial services from reliable service providers in day to day life.

Financial Inclusion- Definition & Measurement Issues With no widely adopted uniform definition, financial inclusion is
reckoned in Uganda as access to financial services from:
a) Officially regulated and supervised entities
Banks and MDI institutions licensed by Bank of Uganda Insurance companies supervised by Insurance Regulatory
Authority, Capital market institutions like investment banks, merchant
banks, stock exchanges supervised by the Securities and Exchange Commission (SEC).
a) Official entities themselves
Post offices offering savings; Money transfer and insurance services; Mobile banking
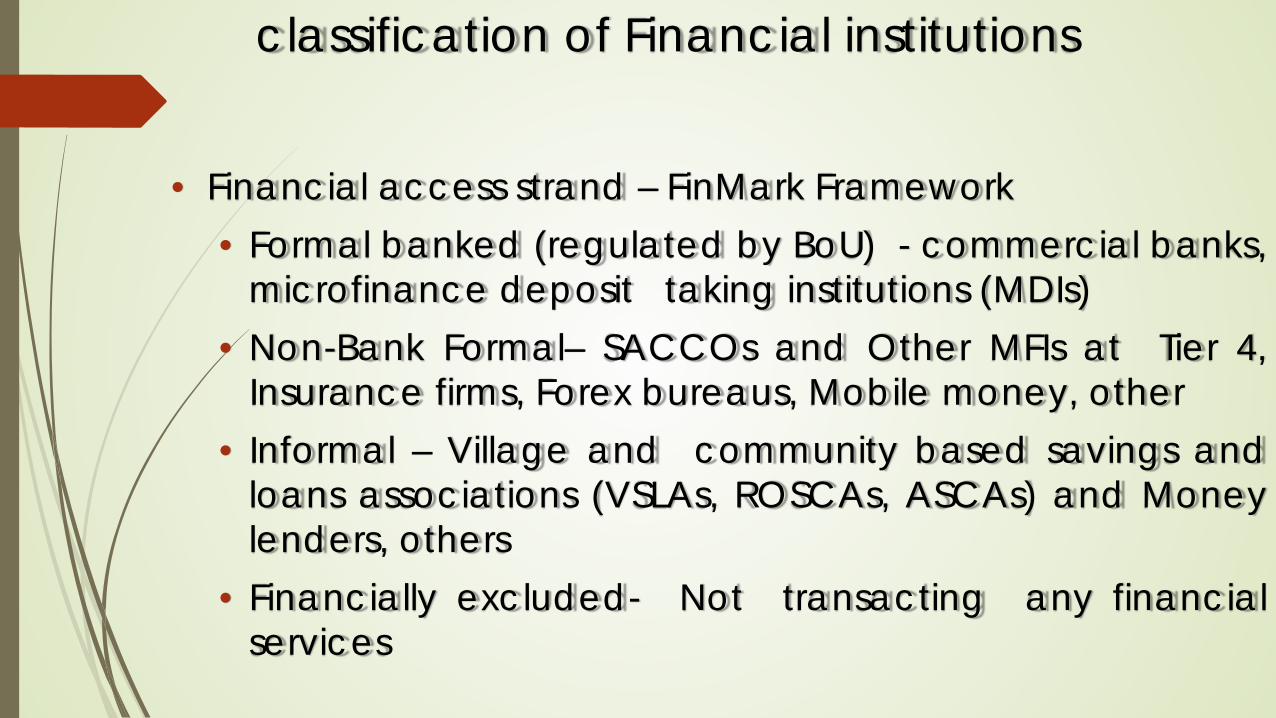
classification of Financial institutions
• Financial access strand – FinMark Framework
• Formal banked (regulated by BoU) - commercial banks, microfinance deposit taking institutions (MDIs)
• Non-Bank Formal– SACCOs and Other MFIs at Tier 4, Insurance firms, Forex bureaus, Mobile money, other
• Informal – Village and community based savings and loans associations (VSLAs, ROSCAs, ASCAs) and Money lenders, others
• Financially excluded- Not transacting any financial services

FINANCIAL INCLUSION IN UGANDA FINSCOPE 3 SURVEY 2013

Overall usage of financial services, % 2013 2009
30
60
20
21
28
Excluded
Informal
Non-bank formal
Formal bank
Formal
15
74
52
20
54
Excluded
Informal
Non-bank formal
Formal bank
Formal

Formal Product penetration Formal product penetration means products and services that are transacted through formal financial institutions (formal banked and non-bank formal) These include (operating a savings account, fixed deposit
account, joint account, current account, ATM card/Debit card, credit card, investment account, other)
The common ones are operating a savings account and ATM card/Debit card
Overall 20 percent of Adult Ugandans have accounts with formal financial institutions
SACCOs next to commercial banks seem to be picking up in providing account holding

Operating an account with formal financial institutions, % 74
8 5 5 7
1
50
5 5
21
8 11
Commercial bank MDIs Creditinstitutions
SACCOs MFIs Others
2009 2013

Product penetration…ctd
Who is likely to operate an account?
Urban residents
especially Kampala
Well to do households
Males Those in paid employment
Those wit higher
education
The main accounts operated are savings followed by ATM card/Debit, which are operated by more than 10 percent of the urban population
The most common
transactions with different banking points are deposit and withdraws by about 33 percent of the adult population in 2013

SAVINGS AND INVESTMENTS

Figure 6: Savings and investment strand, %
18
24
16
23
15
36
16
33
21
19
4
4
6
7
4
4
5
11
4
6
28
28
46
40
34
12
47
28
28
43
19
17
26
25
17
22
26
22
18
25
31
27
7
5
30
25
6
5
29
6
Female
Male
Female
Male
Rural
Urban
Rural
Urban
Uganda
Uganda
2009
2013
2009
2013
2009
2013
Formal Bank Formal Other Informal Home/Secret Place Excluded

Reasons for savings, %
7
9
11
13
22
33
41
67
Agricultural inputs
Business
Land
Safety
Livestock
Education
Emergency
Basic needs
Investment mechanisms, %
10
23
24
39
41
53
Investment in financialinstitution
Produce to sell later
Investing in business
Investment through informalinstitution
Livestock
Farm land

CREDIT & BORROWING

Overall access to credit % 2013
65
13
23
12
35
Unserved
Friends
Informal
Formal
All credit
2009
55
15
34
5
44
Unserved
Friends
Informal
Formal
All credit

7
10
13
14
15
20
Asset acquistion
Agricultural production
Business
Daily expenses
Emergencies
Education
Uses of credit from all sources, %
6
8
15
29
54
Farm equipment
Buy agricultural land
Buy livestock
Farm labour
Agricultural inputs
Reasons for accessing agricultural credit, %
Remittances and Transfers

Overall access to remittances & transfers, % 2013
26
41
55
Informal
Formal
Any remittances
2009
22
11
30
Informal
Formal
Any remittances

Insurance and Risk Management

Risks encountered in the last 12 months 2013,%
10
15
15
18
21
26
48
Death of livestock
Crop/livstock disease
Theft
Price fluctuations
Death of family member/relative
Drought
Ill-health of family member

Overall usage of insurance, % 2013
43
2
45
Informal
Formal
Any insurance
2009
21
3
23
Informal
Formal
Any insurance

Risk management mechanisms in 2013, %
8
13
15
18
18
Borrow from informal institution
Reduce consumption
Sale assets
Seek for donations
Borrow from friends/family

Mobile Money Services

Mobile Money Services in 2013
56
34
77
Currently using
Registered user
Knowledge about mobile money
Knowledge & use, %
33
46
54
56
Cash deposits
Send money
Receive money
Cash withdrawal
What transactions done, %

Challenges to financial inclusion

Challenges to Financial Inclusion: Bank accounts, %
47
22 18 17
Do not haveincome
Cost of operatingaccount
Do not understandhow it works
Do not have a job

Challenges to savings and investments, %
44 47
3
Do not have money toinvest
Do not have adequateinformation on savings
Lost money in investmentbefore

Challenges to credit & borrowing, %
31
14 13
9
Fear of debts Loans are tooexpensive
Lack of security I do not think I amcredit worthy

Challenges to informal insurance in 2013, %
43 40 39
29
22 19
Members do notpay contributions
Members keeppulling out
Death occurred tomembers
Dishonesty bymembers causing
financial loss
Pooradministration
Loss of moneythrough theft or
fraud from aCommittee
member
%

Challenges to formal insurance in 2013, % 55
17 17
10 6
Does not knowhow it works
Never thoughtabout it
Lack knowledgeon how
Does not knowwhere to go
Do not want it

Barriers to using mobile money services 2013, %
26
19
11 9
6
No cell phone No money tosend/receive
No sim card Not enoughinformation
Not though aboutit

Challenges from the supply side
the transaction costs that the bankers incur, poor communication, lack of infrastructure, language barriers, low literacy levels poor technology High costs of providing services

Challenges from the supply side cont’d
Few branches or service outlets of banks and other formal financial institutions in rural areas;
Small sized transactions with the poor which is seen as un-remunerative and unattractive by the financial institutions;
Quite difficult to have a One-Size-Fits-All financial inclusion policy and regulations for the different players
Absence of sufficient data on institutions especially on microfinance institutions
Lack of a definitive present address of rural migrants in urban areas.

Challenges on the supply side cont’d
• Legislative Requirements – The legislative environment may hinder establishment
of financial inclusion policies Capital adequacy requirements, audited balance sheets, size of business, threshold category based on number of members
and professionalism – They aim at financial sustainability but are a constraint
to inclusion

WAY FORWARD-How to address challenges
“Cooperation”. policy makers can work together in - engineering solutions, - creating a financial inclusion enabling environment, - designing regulation and infrastructure, - monitoring progress and assessing policy achievement.

WAY FORWARD-How to address challenges cont’d • Build bridges and collaborations between
Government institutions concerning policy on financial inclusion.
• Cooperation across departments within the same level of Government.
• Ensure inter-sectoral collaboration for communities that are to play an active role in the policy-making process.
• Build financial literacy so that people have realistic expectations and understand their rights

WAY FORWARD-How to address challenges cont’d
Information Technology: a major breakthrough Lower borrowing costs made possible by IT based
remote delivery and recovery of loans can enable many currently excluded individuals to borrow for new output activities.
Some public utilities are already collecting utility bills from users through mobile phone based arrangements.
Cost saving IT based remote delivery arrangements are possible for numerous government payments like social safety net allowances, pension payments, and so on.

Concluding Remarks There may never be an occasion to call the tasks of
financial inclusion and poverty eradication over and done with.
In conclusion, we should deeply keep in mind that financial inclusion combats poverty by: unblocking advancement opportunities for the
disadvantaged poor; fostering social inclusion; Promoting inclusive socioeconomic growth.

Many thanks