Financial globalisation and financial development in Africa ... · development benefits of...
21
Munich Personal RePEc Archive Financial globalisation and financial development in Africa: assessing marginal, threshold and net effects Asongu, Simplice and De Moor, Lieven 2015 Online at https://mpra.ub.uni-muenchen.de/69448/ MPRA Paper No. 69448, posted 11 Feb 2016 08:21 UTC
Transcript of Financial globalisation and financial development in Africa ... · development benefits of...

Munich Personal RePEc Archive
Financial globalisation and financial
development in Africa: assessing
marginal, threshold and net effects
Asongu, Simplice and De Moor, Lieven
2015
Online at https://mpra.ub.uni-muenchen.de/69448/
MPRA Paper No. 69448, posted 11 Feb 2016 08:21 UTC

1
AFRICAN GOVERNANCE AND DEVELOPMENT
INSTITUTE
A G D I Working Paper
WP/15/040
Financial globalisation and financial development in Africa: assessing
marginal, threshold and net effects
Simplice A. Asonguab
& Lieven De Moora
aVrije Universiteit Brussel,
Faculty of Economic and Social Sciences and Solvay Business School,
E-mail: [email protected]
bAfrican Governance and Development Institute,
Yaoundé, Cameroon
E-mail: [email protected] / [email protected]
2
© 2015 African Governance and Development Institute WP/15/040
AGDI Working Paper
Research Department
Simplice A. Asongu & Lieven De Moor
September 2015
Abstract
The present inquiry contributes to extant literature by simultaneously accounting for variations in
financial development and financial globalisation in the assessment of hypothetical initial
financial development conditions for the rewards of financial globalisation. The policy relevance
for assessing these variations simultaneously builds on the intuition that, thresholds for financial
development benefits of financial globalisation may also be contingent on initial levels of
financial development. For this purpose, we examine marginal, threshold and net effects of
financial globalisation on financial development throughout the conditional distributions of
financial development. The empirical evidence is based on contemporary and non-contemporary
quantile regressions with data from 53 African countries for the period 1996-2011. Financial
globalisation is measured with Net Foreign Direct Investment inflows whereas financial
development entails all dimensions identified by the Financial Development and Structure
Database of the World Bank. The findings consistently reveal: (i) positive marginal effects, (ii)
unfeasible financial globalisation positive thresholds and (iii) negative financial globalisation net
effects. The second and third findings are fundamentally due to marginal effects of low positive
magnitude. Policy implications are discussed.
JEL Classification: F02; F21; F30; F40; O10
Keywords: Banking; International investment; Financial integration; Development

3
1. Introduction
Externalities of globalisation have been substantially documented in recent African
development literature, inter alia: (i) the welfare (Makochekanwa, 2014), growth (Kummer-
Noormamode, 2014; Tumwebaze & Ijjo, 2015), employment (Anyanwu, 2014; Foster-McGregor
et al., 2015) and trade (Shuaibu, 2015) implications of growing openness; (ii) reverse foreign
direct investment (FDI) from Africa to Europe (Barros et al., 2014) and (iii) financial
implications of macroeconomic shocks (Nguena & Nanfosso, 2014).
A strand of underlying literature has been devoted to assessing if initial conditions are
essential to materialise the benefits of globalisation, notably: threshold conditions of financial
development benefits from financial globalisation (Asongu, 2014). The debate has been skewed
towards financial globalisation because while some consensus in the literature has been
established on the rewards of trade openness, the debate on benefits of financial openness has
seen renewed interest after the recent financial crisis (Rodrik & Subramanian, 2009). The debate
on initial conditions has been partly motivated by cautious positions from some researchers,
notably: (i) Henry (2007) on the relevance of calculated and gradual capital account openness;
(ii) Prasad and Rajan (2008) have advised on the need to consider country-specific features in
financial openness decisions and (iii) Kose et al. (2011) have articulated the essence of factoring-
in initial conditions in the management of potential risks from financial globalisation.
To the best of our knowledge, the literature on the debate about rewards from financial
openness can be engaged in three main strands: thesis, anti-thesis and synthesis. The first strand
is based on the theoretical motivations of financial globalisation. According to the narrative,
financial globalisation enables efficient capital allocation and international risk sharing. The
phenomenon is more rewarding to less developed countries that are scarce in capital and rich in
labour (Fischer, 1998; Summers, 2000). Such benefits include: access to foreign capital,
economic growth and transition from low- to middle-income. According to the authors,
developed countries are equally rewarded with greater economic stability.
Kose et al. (2011) in the second strand have argued that the relative stability experienced
by developed countries is traceable to less volatile output, compared to their developing
counterparts who experience more volatile output. This anti-thesis builds on narratives
advocating that, inter alia: (i) global financial instability is the product of complete account
liberalisation (Rodrik, 1998; Bhagwati, 1998; Stiglitz, 2000; Kose et al., 2006) and (ii) financial

4
globalisation is a concealed motivation of extending the rewards of international trade in goods
to trade in assets (Rodrik & Subramanian, 2009; Asongu, 2014).
The third strand documenting a synthesis which we have alluded to in the second
paragraph is also known as the Henry (2007) and/or Kose al. (2011) hypothesis: “In this paper
we develop a unified empirical framework for characterizing such threshold conditions. We find
that there are clearly identifiable thresholds in variables such as financial depth and
institutional quality: the cost-benefit trade-off from financial openness improves significantly
once these threshold conditions are satisfied” (Kose et al., 2011, p.147). The recent financial
crisis has consolidated the underlying hypothesis because developing countries which had
previously experienced substantial capital inflows have had to witness a considerable decline in
the same flows (Asongu & De Moor, 2015). Following a revival of the debate on benefits of
capital account openness in financial development, some scholars have expressed deep
skepticism about claims that recent financial engineering has resulted in substantial positive
development externalities (Rodrik & Subramanian, 2009). This sceptical strand has been
partially motivated by an evolving strand of post-crisis African development literature that is
centred around the highlighted hypothesis, namely: Price and Elu (2014), Asongu (2014),
Motelle and Biekpe (2015) and Asongu and De Moor (2015).
First, Price and Elu (2014) have established that the adverse-growth effects of credit
contraction during the 2008-2009 financial crises have been more felt by sub-Saharan African
(SSA) countries belonging to the French African Colonies (CFA) monetary union. Second,
Asongu (2014) has concluded that the Kose et al. hypothesis is valid exclusively with respect to
financial size, as opposed to dynamics of financial depth, activity and efficiency. Motelle and
Biekpe (2015) have settled on the position that deeper financial integration results in financial
sector instability in the Southern African Development Community (SADC). Asongu and De
Moor (2015) have extended Asongu (2014) by further investigating the Kose et al. hypothesis to
present thresholds of financial globalisation at which an initially negative effect of financial
globalisation on financial development becomes positive.
The present inquiry contributes to extant literature by simultaneously accounting for
variations in financial development and financial globalisation in assessing the underlying
hypothesis of initial financial development conditions for the reward of financial globalisation.
In essence, both financial development and financial globalisation thresholds for the benefit of

5
financial globalisation are considered at the same time. Financial development thresholds are
established when there is a consistent significance in the estimated financial globalisation
variable, with either decreasing negative magnitude or increasing positive magnitude throughout
the conditional distribution of financial development (Asongu, 2014). Conversely, financial
globalisation thresholds refer to cut-off points from which a previously negative effect from
financial globalisation on financial development changes to positive (Asongu & De Moor, 2015).
The policy relevance for assessing these thresholds simultaneously builds on the intuition
that, cut-offs points for financial development benefits of financial globalisation may also be
contingent on initial levels of financial development. In essence, blanket policies based on mean
values of financial development may not be effective unless they are contingent on initial
financial development levels and tailored differently across countries with low- medium- and
high-financial development. Accordingly, while the role of policy has either been to encourage
or discourage capital flows (Rodrik & Subramanian, 2009, pp.16-17; Asongu, 2014, p. 166), this
inquiry improves policy decisions by attempting to provide insights into what levels of capital
flows are needed for what levels of financial development to benefit which dynamics of financial
development.
It is important to devote some space to articulating how this study steers clear of previous
inquiries. First, it is different from Asongu (2014) in that: (i) it focuses on 53 instead of 15
African countries; (ii) specifications are also tailored to capture FDI thresholds and (iii) marginal
and net effects are computed. Second, in relation to Asongu and De Moor (2015), three
differences are also clearly apparent: (i) the periodicity is longer to capture tail effects of
financial development distributions; (ii) adopted methodology assesses FDI effects on financial
development throughout the conditional distributions of financial development and (iii) FDI net
effects are computed.
The rest of the study is structured as follows. Section 2 discusses the data and
methodology. The empirical analysis and discussion of results are covered in Section 3. Section
4 concludes with implications and future directions.
2. Data and Methodology
2.1 Data
6
We examine a panel 53 African countries with data for the period 1996-2011 from World
Development Indicators and the Financial Development and Structure Database (FDSD) of the
World Bank. The African scope and periodicity of inquiry are in accordance with the literature
partially motivating the study (Asongu, 2014). Moreover, while the starting year captures the
period of Africa’s growth resurgence (Fosu, 2015, p. 44), the ending year is determined by
constraints in data availability.
In accordance with the motivating literature, the dependent indicators are financial
development dynamics of depth (from global economic and financial system standpoints)1,
efficiency (at banking and financial system levels)2, activity (from banking and financial system
perspectives)3 and size
4. Financial globalisation is measured as net FDI inflows, in accordance
with Henry (2007) and Rodrik and Subramanian (2009).
Selected control variables included: public investment, trade openness, foreign aid,
inflation and Gross Domestic Product (GDP) growth. Whereas we expect trade openness, public
investment and GDP growth to increase financial development, the effects of foreign aid and
inflation cannot be established prior. This is essentially because low (high) inflation is positively
(negatively) related to financial development and the impact of foreign aid is contingent on the
amount that actually reaches the recipient economy. For brevity and lack of space, more in-depth
elucidation of expected signs of control variables can be found in Asongu and De Moor (2015).
1 “Borrowing from the FDSD, this paper measures financial depth both from overall-economic and financial system
perspectives with indicators of broad money supply (M2/GDP) and financial system deposits (Fdgdp) respectively.
While the former denotes the monetary base plus demand, saving and time deposits, the later indicates liquid
liabilities. Since we are dealing exclusively with developing countries, we distinguish liquid liabilities from money
supply because a substantial chunk of the monetary base does not transit through the banking sector” (Asongu, 2014, p. 189). 2 “By financial intermediation efficiency here, this study neither refers to the profitability-oriented concept nor to
the production efficiency of decision making units in the financial sector (through Data Envelopment Analysis:
DEA). What we seek to highlight is the ability of banks to effectively fulfill their fundamental role of transforming
mobilized deposits into credit for economic operators (agents). We adopt proxies for banking-system-efficiency and
financial-system-efficiency (respectively ‘bank credit on bank deposits: Bcbd’ and ‘financial system credit on financial system deposits: Fcfd’)” (Asongu, 2014, pp.189-190). 3 “By financial intermediary activity here, the work highlights the ability of banks to grant credit to economic
operators. We proxy for both banking intermediary activity and financial intermediary activity with “private domestic credit by deposit banks: Pcrb” and “private credit by domestic banks and other financial institutions: Pcrbof” respectively” (Asongu, 2014, p. 190). 4 According to the FDSD, financial intermediary size is measured as the ratio of “deposit bank assets” to “total
assets” (deposit bank assets on central bank assets plus deposit bank assets: Dbacba).

7
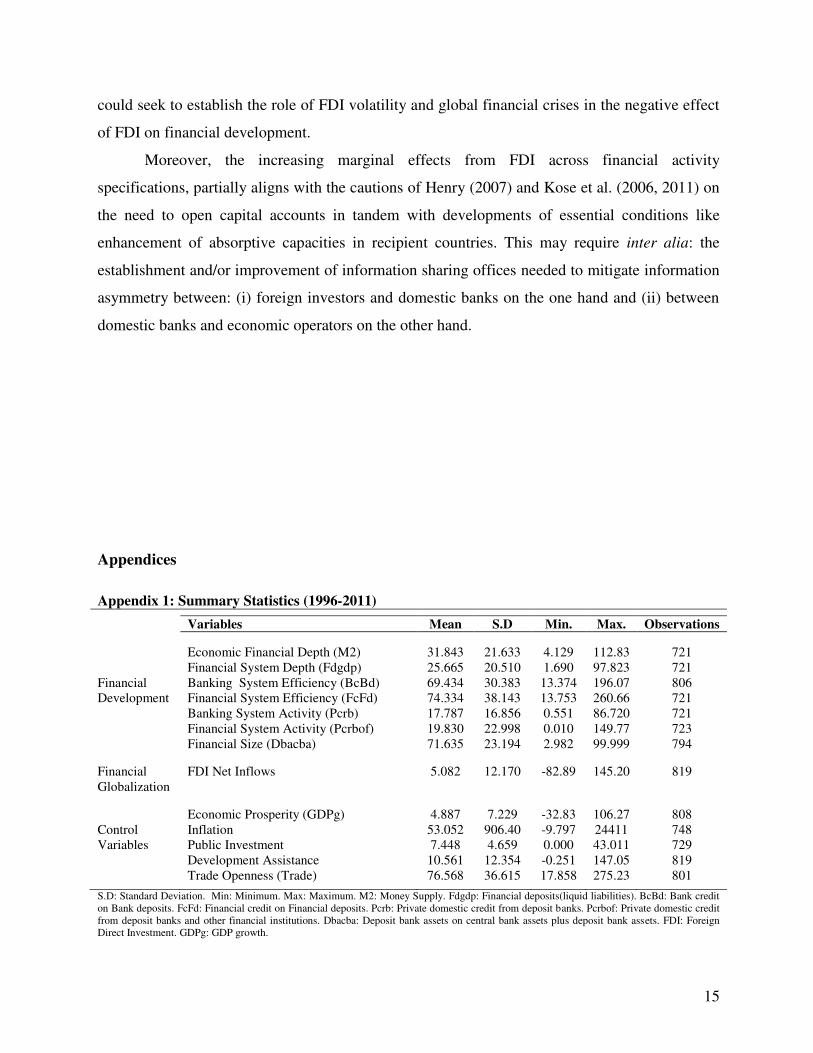
The definition and source of variables, the summary statistics and corresponding
correlation matrix are disclosed in Appendix 1, Appendix 2 and Appendix 3 respectively. The
‘summary statistics’ indicates that: (i) the variables are quite comparable and (ii) from the
standard deviations, we can be confident that reasonable estimated nexuses would emerge. The
objective of the correlation matrix is to control for potential concerns of multicollinearity.
2.2 Methodology
We adopt quantile regressions (QR) with an interaction variable for financial globalisation as
estimation strategy. QR enable us to examine the effect of financial globalisation on financial
development throughout the conditional distributions of financial development whereas the
interaction variable of financial globalisation provides insights into what levels of financial
globalisation are required for financial globalisation to benefit financial development in recipient
countries.
Previous studies investigating the Kose et al. hypothesis have reported parameter
estimates either at the mean (Asongu & De Moor, 2015) and throughout the distribution
(Asongu, 2014) of financial development, in order to respectively investigate thresholds directly
from the dependent variable and indirectly from the main independent variable. Moreover, while
mean effects from models like Ordinary Least Squares (OLS) may be relevant for baseline
estimations, they are based on the assumption of normally distributed error terms. Conversely
QR are not based on the underlying assumption (Keonker & Hallock, 2001).
With the technique, parameters are estimated at multiple points of financial development,
hence enabling a distinction between countries with low- medium- and high-levels of financial
development.
The th quantile estimator of a financial development dynamic is obtained by solving for
the optimization problem in Eq. (1), which is disclosed without panel subscripts for ease of
presentation and simplicity.
ii
i
ii
ik
xyii
i
xyii
iR
xyxy::
)1(min (1)
Where 1,0 . Contrary to OLS which is based on minimizing the sum of squared residuals,
the weighted sum of absolute deviations are minimised in QR. For instance, the 75th
or 90th

8
quantiles (with =0.75 or 0.90 respectively) by approximately weighing the residuals. The
conditional quantile of financial development or iy given ix is:
iiy xxQ )/( (2)
where unique slope parameters are estimated for each th specific quantile. This formulation is
analogous to ixxyE )/( in the OLS slope where parameters are assessed only at the mean
of the conditional distribution of financial development. For the model in Eq. (2), the dependent
variable iy is a financial development indicator while ix entails a constant term, FDI, FDI*FDI,
GDP growth, inflation, public investment, foreign aid and trade.
Given that the adopted estimation approach consists of employing an interaction variable
for financial globalisation, we briefly engage some pitfalls to bear in mind. According to
Brambor et al. (2006), all constitutive terms must be involved in the specifications. Moreover, in
order for the estimations have economic meaning, estimated interaction parameters are
interpreted as conditional marginal impacts. In addition, for the interacting FDI indicator to make
economic sense, it should be within the range provided by the summary statistics.
3. Empirical results
The findings related to financial dynamics of depth, efficiency, activity and size are
presented in Tables 1, 2, 3 and 4 respectively. Whereas the left-hand-side (LHS) of tables shows
contemporary estimations, the right-hand-side (RHS) reveals non-contemporary regressions.
Consistent with Mlachila et al. (2014, p. 21) and Asongu and Nwachukwu (2015), independent
variables on the RHS are lagged by one year in order to have some bite on endogeneity.
Moreover, as expected the OLS results are different from QR estimates in terms of significance
and magnitude.
Consistent with the motivation of the inquiry, we compute: (i) FDI thresholds for which
an initially negative effect of FDI on financial development becomes positive and (ii) the net
effect of financial globalisation on financial development. For example, given that -0.489 and
0.002 are respectively significant estimated parameters from FDI and ‘FDI×FDI’, the potential
FDI threshold at which the negative effect becomes positive is 244.5 (0.489/0.002) while the net

9
effect is -0.478 (-0.489 + [0.002×5.082])5. The computation of threshold and net effect are
consistent with Asongu and De Moor (2015) and Koomson and Asongu (2015), respectively.
The following findings can be established from Table 1 on the relationship between
financial depth and financial globalisation. First, there is some evidence of positive thresholds in
the 0.50th
quantile and 0.10th
to 0.50th
quantiles respectively on the LHS and RHS of Panel A for
money supply. Second, in Panel B for liquid liabilities, a (some) positive threshold(s) is (are)
also apparent in the 0.50th
(0.25th
to 0.50th
) quantile(s) on the RHS (LHS). Unfortunately for
either panel the positive modifying thresholds are not within range (-82.89 to 145.20). Third, the
corresponding net effects of FDI are negative. Fourth, with the exception of GDP growth, the
significant control variables have the expected signs. Consistent with Asongu and De Moor
(2015), the unexpected negative effect of GDP growth may be traceable to immiserizing growth
during Africa’s growth resurgence. The period of this resurgence (see Fosu, 2015, p. 44) is
consistent with the periodicity adopted in this study.
Panel A (B) of Table 2 shows findings corresponding to banking (financial) system
efficiency. In Panel A, there are threshold effects in the 0.25th
and 0.50th
quantiles of the LHS
and RHS whereas in Panel B, the threshold impact(s) is (are) apparent in the 0.50th
(0.25th
and
0.50th
) quantile (s). Unfortunately: (i) identified thresholds are not within range and (ii)
corresponding net financial globalisation effects are negative.
In Table 3 on financial activity, irrespective of the contemporaneous character of the
specifications, there is overwhelming evidence of positive thresholds throughout the conditional
distributions of banking system activity (Panel A) and financial system activity (Panel B).
Corresponding financial globalisation thresholds are unfeasible and net effects are negative.
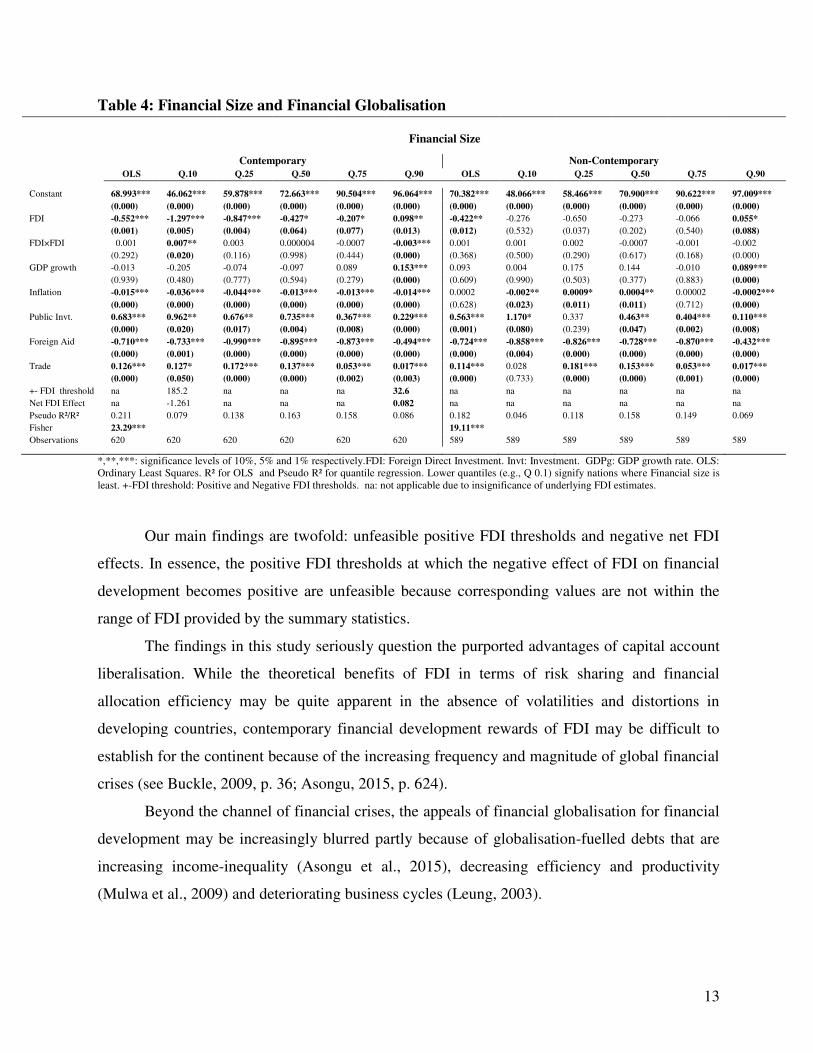
The findings from Table 4 on financial size show that there is a positive (negative)
threshold in the 0.10th
(0.90th
) quantile of contemporary regressions. The positive threshold is not
within range and corresponding net effect is negative. Conversely, the negative threshold is
within the FDI range. Unfortunately, the slightly different tendency from the 0.90th
quantile of
the LHS is unlikely to counterbalance findings from Tables 1-3.
The control variables in Tables 2-4 are significant with expected signs. These are broadly
in line with those of Table 1 because underlying financial development variables are conflicting
by definition. For example, observed opposite signs in the control variables corresponding to
5 5.028 is the mean value of FDI.

10
financial efficiency regressions are traceable to the definition and measurement of financial
allocation efficiency: the ability to convert mobilised savings into credit for economic agents.
Therefore, financial depth or deposits decrease with improving financial efficiency.
Table 1: Financial Depth and Financial Globalisation
Financial Depth
Panel A: Overall Economic Depth (Money Supply)
Contemporary Non-Contemporary
OLS Q.10 Q.25 Q.50 Q.75 Q.90 OLS Q.10 Q.25 Q.50 Q.75 Q.90
Constant 31.203*** 13.918*** 17.618*** 20.896*** 29.176*** 37.038*** 30.508*** 14.106*** 16.535*** 20.471*** 27.298*** 36.373***
(0.000) (0.000) (0.000) (0.000) (0.000) (0.000) (0.000) (0.000) (0.000) (0.000) (0.000) (0.000)
FDI -0.340** -0.054 -0.196* -0.489*** -0.491** -0.291 -0.360* -0.250* -0.250*** -0.389*** -0.492* -0.069
(0.049) (0.663) (0.062) (0.000) (0.048) (0.494) (0.051) (0.080) (0.003) (0.001) (0.095) (0.874)
FDI×FDI 0.001 0.0002 0.0008 0.002*** 0.002 0.001 0.001 0.001* 0.001* 0.002** 0.002 -0.001
(0.145) (0.741) (0.240) (0.000) (0.227) (0.736) (0.217) (0.093) (0.052) (0.016) (0.337) (0.624)
GDP growth -0.382*** -0.267*** -0.337*** -0.324*** -0.615*** -0.539** -0.313*** -0.264** -0.311*** -0.299*** -0.628*** -0.375
(0.000) (0.001) (0.000) (0.000) (0.001) (0.047) (0.007) (0.010) (0.000) (0.000) (0.001) (0.141)
Inflation -0.008*** -0.006*** -0.002*** -0.005*** -0.010*** -0.019*** -0.007** -0.020*** -0.003*** -0.003*** -0.009*** -0.017***
(0.000) (0.000) (0.001) (0.000) (0.000) (0.000) (0.013) (0.000) (0.000) (0.000) (0.000) (0.000)
Public Invt. 0.778*** 0.243 0.452*** 1.020*** 1.290*** 2.085*** 0.858*** 0.249 0.605*** 1.037*** 1.763*** 2.086***
(0.003) (0.220) (0.000) (0.000) (0.000) (0.000) (0.003) (0.252) (0.000) (0.000) (0.000) (0.000)
Foreign Aid -0.589*** -0.061 -0.117*** -0.384*** -0.657*** -1.006* -0.582*** -0.055 -0.094*** -0.318*** -0.733*** -0.951*
(0.000) (0.498) (0.009) (0.000) (0.001) (0.066) (0.000) (0.532) (0.006) (0.000) (0.002) (0.097)
Trade 0.035 -0.005 0.009 0.045*** 0.134*** 0.256*** 0.040 0.005 0.013 0.039** 0.136*** 0.256***
(0.173) (0.756) (0.496) (0.000) (0.000) (0.002) (0.138) (0.777) (0.245) (0.015) (0.002) (0.001)
+ FDI threshold na na na 244.5 na na na 250 250 194.5 na na
Net FDI Effect na na na -0.478 na na na -0.244 -0.244 -0.378 na na
Pseudo R²/R² 0.110 0.046 0.053 0.074 0.092 0.139 0.112 0.052 0.056 0.068 0.094 0.143
Fisher 10.98*** 12.38***
Observations 624 624 624 624 624 624 587 587 587 587 587 587
Panel B: Financial System Depth (Liquid Liabilities)
Contemporary Non-Contemporary
OLS Q.10 Q.25 Q.50 Q.75 Q.90 OLS Q.10 Q.25 Q.50 Q.75 Q.90
Constant 24.442*** 6.891*** 10.333*** 14.048*** 25.621*** 34.286*** 24.148*** 6.588*** 10.611*** 14.855*** 25.678*** 33.928***
(0.000) (0.002) (0.000) (0.000) (0.000) (0.000) (0.000) (0.005) (0.000) (0.000) (0.000) (0.000)
FDI -0.322* -0.129 -0.336*** -0.334*** -0.647** -0.330 -0.337* -0.187 -0.364*** -0.259** -0.753** 0.138
(0.051) (0.373) (0.001) (0.004) (0.030) (0.288) (0.055) (0.208) (0.001) (0.012) (0.019) (0.631)
FDI×FDI 0.001 0.0008 0.001** 0.001** 0.003 0.001 0.001 0.001 0.002*** 0.001 0.003 -0.003
(0.156) (0.415) (0.010) (0.021) (0.131) (0.517) (0.205) (0.305) (0.009) (0.055) (0.100) (0.144)
GDP growth -0.303*** -0.134 -0.186*** -0.263*** -0.391** -0.464** -0.248** -0.115 -0.155* -0.224*** -0.359 -0.163
(0.002) (0.186) (0.009) (0.002) (0.043) (0.010) (0.022) (0.455) (0.061) (0.002) (0.077) (0.326)
Inflation -0.008*** -0.0007 -0.003*** -0.005*** -0.009*** -0.018*** -0.007*** -0.010*** -0.001* -0.003*** -0.008*** -0.018***
(0.000) (0.507) (0.000) (0.000) (0.000) (0.000) (0.001) (0.000) (0.053) (0.000) (0.000) (0.000)
Public Invt. 0.734*** 0.100 0.490*** 1.066*** 1.233*** 1.691*** 0.810*** 0.070 0.525*** 1.111*** 1.404*** 1.535***
(0.002) (0.557) (0.000) (0.000) (0.001) (0.000) (0.002) (0.692) (0.000) (0.000) (0.000) (0.000)
Foreign Aid -0.607*** -0.059 -0.113** -0.360*** -0.724*** -1.078** -0.612*** -0.051 -0.139*** -0.394*** -0.776*** -1.028***
(0.000) (0.363) (0.010) (0.000) (0.002) (0.011) (0.000) (0.480) (0.005) (0.000) (0.002) (0.009)
Trade 0.045* 0.017 0.032** 0.037** 0.101** 0.259*** 0.047* 0.024 0.032** 0.024* 0.109** 0.273***
(0.060) (0.401) (0.014) (0.020) (0.018) (0.000) (0.061) (0.277) (0.027) (0.075) (0.019) (0.000)
+ FDI threshold na na 336 334 na na na na 182 na na na
Net FDI Effect na na -0.330 -0.328 na na na na -0.353 na na na
Pseudo R²/R² 0.123 0.029 0.049 0.071 0.096 0.158 0.127 0.026 0.048 0.0757 0.097 0.158
Fisher 11.42*** 10.98***
Observations 624 624 624 624 624 624 587 587 587 587 587 587
*,**,***: significance levels of 10%, 5% and 1% respectively.FDI: Foreign Direct Investment. Invt: Investment. GDPg: GDP growth rate. OLS:
Ordinary Least Squares. R² for OLS and Pseudo R² for quantile regression. Lower quantiles (e.g., Q 0.1) signify nations where Financial depth is
least. +FDI threshold: Positive FDI threshold. na: not applicable due to insignificance of underlying FDI estimates.

11
Table 2: Financial Efficiency and Financial Globalisation
Financial Efficiency Panel A: Banking System Efficiency
Contemporary Non-Contemporary
OLS Q.10 Q.25 Q.50 Q.75 Q.90 OLS Q.10 Q.25 Q.50 Q.75 Q.90
Constant 91.108*** 41.433*** 71.264*** 89.217*** 115.13*** 139.04*** 90.842*** 46.129*** 72.263*** 87.062*** 110.16*** 139.99***
(0.000) (0.000) (0.000) (0.000) (0.000) (0.000) (0.000) (0.000) (0.000) (0.000) (0.000) (0.000)
FDI -0.578** -0.498 -0.953*** -1.112*** -0.070 0.182 -0.527* -0.023 -0.923*** -0.851*** -0.358 -0.059
(0.048) (0.123) (0.000) (0.000) (0.884) (0.687) (0.070) (0.926) (0.000) (0.007) (0.322) (0.899)
FDI×FDI 0.003 0.002 0.005** 0.006*** 0.0005 -0.002 0.003 -0.0009 0.005*** 0.004* 0.003 0.0009
(0.137) (0.262) (0.020) (0.008) (0.876) (0.427) (0.141) (0.588) (0.001) (0.072) (0.160) (0.763)
GDP growth 0.184 0.293 0.398 0.024 0.117 0.003 0.277* 0.341** 0.375* 0.364 0.267 -0.080
(0.342) (0.281) (0.112) (0.916) (0.786) (0.989) (0.090) (0.026) (0.067) (0.133) (0.274) (0.753)
Inflation -0.001*** -0.003*** -0.0001 -0.001*** -0.001*** -0.002*** -0.016** -0.033*** -0.053*** -0.020*** -0.010*** -0.015***
(0.009) (0.000) (0.745) (0.001) (0.000) (0.000) (0.038) (0.000) (0.000) (0.070) (0.000) (0.000)
Public Invt. -1.228*** -0.222 -0.913** -1.218*** -1.372** -1.916*** -1.069*** -0.548 -0.888*** -0.891*** -1.247*** -1.479**
(0.000) (0.644) (0.016) (0.000) (0.015) (0.003) (0.000) (0.196) (0.007) (0.007) (0.002) (0.015)
Foreign Aid -0.462*** 0.002 -0.461*** -0.326** -0.681*** -0.849*** -0.473*** -0.048 -0.457*** -0.416*** -0.591*** -0.940***
(0.000) (0.994) (0.006) (0.032) (0.004) (0.003) (0.000) (0.802) (0.002) (0.003) (0.000) (0.000)
Trade -0.061* -0.033 -0.067 -0.045 -0.133** -0.105* -0.078** -0.067 -0.070 -0.062 -0.105** -0.128**
(0.070) (0.586) (0.168) (0.266) (0.034) (0.072) (0.026) (0.245) (0.110) (0.149) (0.025) (0.017)
+ FDI threshold na na 190.6 185.33 na na na na 184.6 212.75 na na
Net FDI Effect na na -0.927 -1.081 na na na na -0.897 -0.830 na na
Pseudo R²/R² 0.097 0.037 0.059 0.061 0.055 0.113 0.097 0.042 0.067 0.054 0.053 0.121
Fisher 10.44*** 8.53***
Observations 630 630 630 630 630 630 597 597 597 597 597 597
Panel B: Financial System Efficiency Contemporary Non-Contemporary
OLS Q.10 Q.25 Q.50 Q.75 Q.90 OLS Q.10 Q.25 Q.50 Q.75 Q.90
Constant 106.25*** 13.918*** 17.618*** 20.896*** 29.176*** 37.038*** 107.07*** 46.154*** 73.254*** 91.603*** 119.04*** 168.97***
(0.000) (0.000) (0.000) (0.000) (0.000) (0.000) (0.000) (0.000) (0.000) (0.000) (0.000) (0.000)
FDI -0.780*** -0.054 -0.196* -0.489*** -0.491** -0.291 -0.660** -0.443 -1.090*** -1.085*** -0.316 -0.201
(0.008) (0.663) (0.062) (0.000) (0.048) (0.494) (0.037) (0.152) (0.000) (0.000) (0.446) (0.807)
FDI×FDI 0.005** 0.0002 0.0008 0.002*** 0.002 0.001 0.004** 0.002 0.006*** 0.006*** 0.002 0.001
(0.012) (0.741) (0.240) (0.000) (0.227) (0.736) (0.044) (0.268) (0.000) (0.003) (0.308) (0.776)
GDP growth 0.073 -0.267*** -0.337*** -0.324*** -0.615*** -0.539** 0.204 0.283 0.286 0.153 0.300 0.174
(0.732) (0.000) (0.000) (0.000) (0.001) (0.047) (0.322) (0.122) (0.132) (0.441) (0.384) (0.700)
Inflation -0.015** -0.006*** -0.002*** -0.005*** -0.010*** -0.019*** -0.015** -0.026*** -0.058*** -0.008*** -0.010*** -0.014***
(0.019) (0.000) (0.001) (0.000) (0.000) (0.000) (0.036) (0.000) (0.000) (0.000) (0.000) (0.000)
Public Invt. -1.388*** 0.243 0.452*** 1.020*** 1.290*** 2.085*** -1.410 -0.347 -1.141*** -0.831*** -1.891*** -2.833**
(0.000) (0.220) (0.000) (0.000) (0.000) (0.000) (0.000) (0.528) (0.000) (0.002) (0.000) (0.018)
Foreign Aid -0.802*** -0.061 -0.117*** -0.384*** -0.657*** -1.006* -0.829 -0.052 -0.395*** -.441*** -0.500*** -1.155**
(0.000) (0.498) (0.009) (0.000) (0.001) (0.066) (0.000) (0.821) (0.000) (0.000) (0.005) (0.018)
Trade -0.134*** -0.005 0.009 0.045*** 0.134*** 0.256*** -0.159 -0.062 -0.045 -0.102*** -0.168*** -0.279***
(0.000) (0.756) (0.496) (0.000) (0.000) (0.002) (0.000) (0.344) (0.254) (0.004) (0.001) (0.007)
+ FDI threshold 156 na na 244.5 na na 165 na 181.6 180.8 na na
Net FDI Effect -0.754 na na -0.478 na na -0.639 na -1.059 -1.054 na na
Pseudo R²/R² 0.111 0.046 0.053 0.074 0.092 0.139 0.113 0.041 0.069 0.056 0.043 0.108
Fisher 106.25*** 8.24***
Observations 624 624 624 624 624 624 587 587 587 587 587 587
*,**,***: significance levels of 10%, 5% and 1% respectively.FDI: Foreign Direct Investment. Invt: Investment. GDPg: GDP growth rate. OLS:
Ordinary Least Squares. R² for OLS and Pseudo R² for quantile regression. Lower quantiles (e.g., Q 0.1) signify nations where Financial
efficiency is least. +FDI threshold: Positive FDI threshold. na: not applicable due to insignificance of underlying FDI estimates.

12
Table 3: Financial Activity and Financial Globalisation
Financial Activity Panel A: Banking System Activity
Contemporary Non-Contemporary
OLS Q.10 Q.25 Q.50 Q.75 Q.90 OLS Q.10 Q.25 Q.50 Q.75 Q.90
Constant 22.694*** 4.512*** 7.143*** 13.747*** 20.450*** 39.421*** 22.863*** 5.105*** 7.573*** 14.169*** 17.259*** 42.736***
(0.000) (0.000) (0.000) (0.000) (0.000) (0.000) (0.000) (0.000) (0.000) (0.000) (0.000) (0.000)
FDI -0.406*** -0.082 -0.270*** -0.330*** -0.697*** -0.761*** -0.400*** -0.118** -0.201*** -0.313** -0.826*** -0.875***
(0.001) (0.135) (0.000) (0.002) (0.000) (0.009) (0.002) (0.011) (0.006) (0.014) (0.000) (0.001)
FDI×FDI 0.002*** 0.0004 0.001*** 0.001*** 0.004*** 0.004* 0.002** 0.0007** 0.001** 0.001** 0.004*** 0.005**
(0.006) (0.208) (0.000) (0.009) (0.003) (0.051) (0.014) (0.018) (0.025) (0.044) (0.002) (0.016)
GDP growth -0.169** -0.067 -0.107** -0.134* -0.206 -0.454** -0.108 -0.036 -0.055 -0.103 -0.185 -0.794***
(0.036) (0.122) (0.021) (0.092) (0.176) (0.010) (0.223) (0.404) (0.306) (0.227) (0.194) (0.000)
Inflation -0.007*** -0.006*** -0.001*** -0.003*** -0.007*** -0.014*** -0.007*** -0.007*** -0.011*** -0.003*** -0.008*** -0.014***
(0.001) (0.000) (0.000) (0.000) (0.000) (0.000) (0.005) (0.000) (0.000) (0.000) (0.000) (0.000)
Public Invt. 0.050 0.092 0.086 0.320*** 0.404* -0.249 0.072 0.083 0.127 0.359** 0.667*** 0.086
(0.747) (0.162) (0.214) (0.004) (0.062) (0.568) (0.669) (0.306) (0.143) (0.010) (0.005) (0.848)
Foreign Aid -0.549*** -0.033 -0.087*** -0.255*** -0.522*** -0.908** -0.555*** -0.069** -0.082** -0.247*** -0.519*** -0.885**
(0.000) (0.254) (0.002) (0.000) (0.000) (0.040) (0.000) (0.013) (0.015) (0.000) (0.001) (0.033)
Trade 0.032 0.001 0.023*** 0.010 0.088*** 0.261*** 0.029 -0.001 0.013 0.003 0.121*** 0.224***
(0.115) (0.843) (0.004) (0.484) (0.001) (0.000) (0.167) (0.863) (0.181) (0.856) (0.000) (0.000)
+ FDI threshold 203 na 270 330 174.25 190.25 200 168 201 313 206.5 175
Net FDI Effect -0.395 na -0.264 -0.324 -0.676 -0.740 -0.389 -0.114 -0.195 -0.307 -0.805 -0.849
Pseudo R²/R² 0.116 0.033 0.040 0.040 0.065 0.145 0.115 0.033 0.040 0.037 0.062 0.149
Fisher 10.82*** 10.43***
Observations 624 624 624 624 624 624 587 587 587 587 587 587
Panel B: Financial System Activity
Contemporary Non-Contemporary
OLS Q.10 Q.25 Q.50 Q.75 Q.90 OLS Q.10 Q.25 Q.50 Q.75 Q.90
Constant 30.861*** 4.474*** 7.655*** 14.534*** 22.840*** 52.326*** 30.813*** 4.854*** 7.722*** 14.360*** 23.367*** 51.814***
(0.000) (0.000) (0.000) (0.000) (0.000) (0.000) (0.000) (0.000) (0.000) (0.000) (0.000) (0.000)
FDI -0.467*** -0.121** -0.288*** -0.377*** -0.789*** -1.174*** -0.459*** -0.119** -0.257*** -0.310** -0.668** -1.048***
(0.001) (0.029) (0.000) (0.000) (0.000) (0.000) (0.001) (0.026) (0.001) (0.017) (0.015) (0.001)
FDI×FDI 0.003*** 0.0007* 0.001*** 0.002*** 0.005*** 0.008*** 0.002*** 0.0007** 0.001*** 0.001** 0.003* 0.006***
(0.002) (0.064) (0.000) (0.001) (0.000) (0.001) (0.005) (0.042) (0.007) (0.049) (0.074) (0.001)
GDP growth -0.185* -0.082** -0.088** -0.139** -0.203 -0.620*** -0.119 -0.067 -0.060 -0.099 -0.178 -0.616***
(0.051) (0.023) (0.043) (0.040) (0.205) (0.001) (0.244) (0.199) (0.035) (0.240) (0.339) (0.002)
Inflation -0.007*** -0.004*** -0.001*** -0.003*** -0.007*** -0.014*** -0.007** -0.007*** -0.010*** -0.002*** -0.007*** -0.013***
(0.003) (0.000) (0.000) (0.000) (0.000) (0.000) (0.012) (0.000) (0.000) (0.000) (0.000) (0.000)
Public Invt. -0.032 0.115 0.071 0.320*** 0.423 0.325 -0.013 0.106 0.097 0.347** 0.605* 0.160
(0.866) (0.101) (0.292) (0.002) (0.107) (0.505) (0.947) (0.279) (0.307) (0.012) (0.054) (0.762)
Foreign Aid -0.773*** -0.029 -0.076*** -0.275*** -0.564*** -1.180** -0.772*** -0.048 -0.068* -0.245*** -0.644*** -1.106**
(0.000) (0.321) (0.006) (0.000) (0.000) (0.017) (0.000) (0.183) (0.058) (0.000) (0.002) (0.031)
Trade -0.007 0.001 0.020*** 0.009 0.081** 0.143** -0.009 -0.001 0.017 0.001 0.068* 0.153**
(0.760) (0.886) (0.009) (0.478) (0.013) (0.013) (0.721) (0.865) (0.121) (0.945) (0.073) (0.010)
+ FDI threshold 155.6 172.8 288 188.5 157.8 146.7 229.5 170 257 310 222 174.6
Net FDI Effect -0.390 -0.117 -0.282 -0.366 -0.763 -1.133 -0.448 -0.115 -0.251 -0.304 -0.652 -1.017
Pseudo R²/R² 0.104 0.030 0.037 0.036 0.054 0.114 0.102 0.031 0.036 0.034 0.050 0.115
Fisher 9.51*** 8.92***
Observations 626 626 626 626 626 626 589 589 589 589 589 589
*,**,***: significance levels of 10%, 5% and 1% respectively.FDI: Foreign Direct Investment. Invt: Investment. GDPg: GDP growth rate. OLS:
Ordinary Least Squares. R² for OLS and Pseudo R² for quantile regression. Lower quantiles (e.g., Q 0.1) signify nations where Financial activity
is least. +FDI threshold: Positive FDI threshold. na: not applicable due to insignificance of underlying FDI estimates.
13
Table 4: Financial Size and Financial Globalisation
Financial Size
Contemporary Non-Contemporary
OLS Q.10 Q.25 Q.50 Q.75 Q.90 OLS Q.10 Q.25 Q.50 Q.75 Q.90
Constant 68.993*** 46.062*** 59.878*** 72.663*** 90.504*** 96.064*** 70.382*** 48.066*** 58.466*** 70.900*** 90.622*** 97.009***
(0.000) (0.000) (0.000) (0.000) (0.000) (0.000) (0.000) (0.000) (0.000) (0.000) (0.000) (0.000)
FDI -0.552*** -1.297*** -0.847*** -0.427* -0.207* 0.098** -0.422** -0.276 -0.650 -0.273 -0.066 0.055*
(0.001) (0.005) (0.004) (0.064) (0.077) (0.013) (0.012) (0.532) (0.037) (0.202) (0.540) (0.088)
FDI×FDI 0.001 0.007** 0.003 0.000004 -0.0007 -0.003*** 0.001 0.001 0.002 -0.0007 -0.001 -0.002
(0.292) (0.020) (0.116) (0.998) (0.444) (0.000) (0.368) (0.500) (0.290) (0.617) (0.168) (0.000)
GDP growth -0.013 -0.205 -0.074 -0.097 0.089 0.153*** 0.093 0.004 0.175 0.144 -0.010 0.089***
(0.939) (0.480) (0.777) (0.594) (0.279) (0.000) (0.609) (0.990) (0.503) (0.377) (0.883) (0.000)
Inflation -0.015*** -0.036*** -0.044*** -0.013*** -0.013*** -0.014*** 0.0002 -0.002** 0.0009* 0.0004** 0.00002 -0.0002***
(0.000) (0.000) (0.000) (0.000) (0.000) (0.000) (0.628) (0.023) (0.011) (0.011) (0.712) (0.000)
Public Invt. 0.683*** 0.962** 0.676** 0.735*** 0.367*** 0.229*** 0.563*** 1.170* 0.337 0.463** 0.404*** 0.110***
(0.000) (0.020) (0.017) (0.004) (0.008) (0.000) (0.001) (0.080) (0.239) (0.047) (0.002) (0.008)
Foreign Aid -0.710*** -0.733*** -0.990*** -0.895*** -0.873*** -0.494*** -0.724*** -0.858*** -0.826*** -0.728*** -0.870*** -0.432***
(0.000) (0.001) (0.000) (0.000) (0.000) (0.000) (0.000) (0.004) (0.000) (0.000) (0.000) (0.000)
Trade 0.126*** 0.127* 0.172*** 0.137*** 0.053*** 0.017*** 0.114*** 0.028 0.181*** 0.153*** 0.053*** 0.017***
(0.000) (0.050) (0.000) (0.000) (0.002) (0.003) (0.000) (0.733) (0.000) (0.000) (0.001) (0.000)
+- FDI threshold na 185.2 na na na 32.6 na na na na na na
Net FDI Effect na -1.261 na na na 0.082 na na na na na na
Pseudo R²/R² 0.211 0.079 0.138 0.163 0.158 0.086 0.182 0.046 0.118 0.158 0.149 0.069
Fisher 23.29*** 19.11***
Observations 620 620 620 620 620 620 589 589 589 589 589 589
*,**,***: significance levels of 10%, 5% and 1% respectively.FDI: Foreign Direct Investment. Invt: Investment. GDPg: GDP growth rate. OLS:
Ordinary Least Squares. R² for OLS and Pseudo R² for quantile regression. Lower quantiles (e.g., Q 0.1) signify nations where Financial size is
least. +-FDI threshold: Positive and Negative FDI thresholds. na: not applicable due to insignificance of underlying FDI estimates.
Our main findings are twofold: unfeasible positive FDI thresholds and negative net FDI
effects. In essence, the positive FDI thresholds at which the negative effect of FDI on financial
development becomes positive are unfeasible because corresponding values are not within the
range of FDI provided by the summary statistics.
The findings in this study seriously question the purported advantages of capital account
liberalisation. While the theoretical benefits of FDI in terms of risk sharing and financial
allocation efficiency may be quite apparent in the absence of volatilities and distortions in
developing countries, contemporary financial development rewards of FDI may be difficult to
establish for the continent because of the increasing frequency and magnitude of global financial
crises (see Buckle, 2009, p. 36; Asongu, 2015, p. 624).
Beyond the channel of financial crises, the appeals of financial globalisation for financial
development may be increasingly blurred partly because of globalisation-fuelled debts that are
increasing income-inequality (Asongu et al., 2015), decreasing efficiency and productivity
(Mulwa et al., 2009) and deteriorating business cycles (Leung, 2003).

14
Findings of the study are broadly consistent with the sceptical strand of the literature on
the disappointment of financial globalisation (Rodrik, 1998; Rodrik and Subramanian, 2009).
The results also align with Fischer’s (1998) recommendation on the orderly openness of capital
accounts. Conversely, overly optimistic positions in the literature should be considered with
caution, notably: Dornbusch’s International Monetary Fund lectures, which considered capital
controls as “an idea who’s time had past” (Dornbusch, 1996) and later claimed that “the correct
answer to the question of capital mobility is that it ought to be unrestricted” (Dornbusch, 1998,
p. 20).
4. Concluding implications and future research directions
We set-out to contribute to extant literature by simultaneously accounting for variations in
financial development and financial globalisation in the assessment of hypothetical initial
financial development conditions for the rewards of financial globalisation. The policy relevance
for assessing these variations simultaneously builds on the intuition that, thresholds for financial
development benefits of financial globalisation may also be contingent on initial levels of
financial development. Accordingly, blanket policies based on mean values of financial
development may not be effective unless they are contingent on initial financial development
levels and tailored differently across countries with low- medium- and high-financial
development. For this purpose, we have examined marginal, threshold and net effects of
financial globalisation on financial development throughout conditional distributions of financial
development. We have established that, but for a thin exception from the 0.90th
quantile of
contemporary financial size regressions, the findings consistently reveal: (i) positive marginal
effects, (ii) unfeasible financial globalisation positive thresholds and (iii) negative financial
globalisation net effects. The second and third findings are fundamentally due to marginal effects
of low positive magnitude.
As an implication, the marginal effect of FDI in financial development can be improved
by enhancing the absorptive capacity of FDI. Some of these factors may include: trade openness,
increasing technological know-how, improving human capital and greater emphasis on
knowledge economy. Evidently, extant literature would be enriched if future lines of inquiry
focus on establishing mechanisms by which the marginal effect and absorptive capacity of FDI
can be increased to achieve greater development outcomes. Another future research direction
15
could seek to establish the role of FDI volatility and global financial crises in the negative effect
of FDI on financial development.
Moreover, the increasing marginal effects from FDI across financial activity
specifications, partially aligns with the cautions of Henry (2007) and Kose et al. (2006, 2011) on
the need to open capital accounts in tandem with developments of essential conditions like
enhancement of absorptive capacities in recipient countries. This may require inter alia: the
establishment and/or improvement of information sharing offices needed to mitigate information
asymmetry between: (i) foreign investors and domestic banks on the one hand and (ii) between
domestic banks and economic operators on the other hand.
Appendices
Appendix 1: Summary Statistics (1996-2011)
Variables Mean S.D Min. Max. Observations
Financial
Development
Economic Financial Depth (M2) 31.843 21.633 4.129 112.83 721
Financial System Depth (Fdgdp) 25.665 20.510 1.690 97.823 721
Banking System Efficiency (BcBd) 69.434 30.383 13.374 196.07 806
Financial System Efficiency (FcFd) 74.334 38.143 13.753 260.66 721
Banking System Activity (Pcrb) 17.787 16.856 0.551 86.720 721
Financial System Activity (Pcrbof) 19.830 22.998 0.010 149.77 723
Financial Size (Dbacba) 71.635 23.194 2.982 99.999 794
Financial
Globalization
FDI Net Inflows 5.082 12.170 -82.89 145.20 819
Control
Variables
Economic Prosperity (GDPg) 4.887 7.229 -32.83 106.27 808
Inflation 53.052 906.40 -9.797 24411 748
Public Investment 7.448 4.659 0.000 43.011 729
Development Assistance 10.561 12.354 -0.251 147.05 819
Trade Openness (Trade) 76.568 36.615 17.858 275.23 801
S.D: Standard Deviation. Min: Minimum. Max: Maximum. M2: Money Supply. Fdgdp: Financial deposits(liquid liabilities). BcBd: Bank credit
on Bank deposits. FcFd: Financial credit on Financial deposits. Pcrb: Private domestic credit from deposit banks. Pcrbof: Private domestic credit
from deposit banks and other financial institutions. Dbacba: Deposit bank assets on central bank assets plus deposit bank assets. FDI: Foreign
Direct Investment. GDPg: GDP growth.

16
Appendix 2: Correlation Matrix (Uniform sample size: 616)
Financial Development Dynamics Other variables
Financial Depth Financial Efficiency Financial Activity Fin. Size
M2 Fdgdp BcBd FcFd Prcb Pcrbof Dbacba FDIgdp GDPg Inflation PubIvt NODA Trade
1.000 0.974 0.080 0.118 0.833 0.669 0.458 -0.084 -0.100 -0.061 0.114 -0.261 0.088 M2
1.000 0.095 0.184 0.883 0.758 0.501 -0.077 -0.080 -0.057 0.113 -0.288 0.117 Fdgdp
1.000 0.868 0.446 0.461 0.207 -0.132 -0.050 -0.107 -0.230 -0.170 -0.112 Bcbd
1.000 0.554 0.701 0.240 -0.124 -0.070 -0.082 -0.212 -0.187 -0.144 FcFd
1.000 0.931 0.519 -0.108 -0.080 -0.062 -0.039 -0.314 0.074 Pcrb
1.000 0.454 -0.103 -0.080 -0.050 -0.070 -0.300 0.009 Pcrbof
1.000 -0.119 -0.009 -0.092 0.095 -0.355 0.227 Dbacba
1.000 0.301 0.014 0.060 0.059 0.398 FDIgdp
1.000 0.012 0.129 0.030 0.235 GDPg
1.000 0.030 -0.009 0.090 Inflation
1.000 0.171 0.148 PubIvt
1.000 -0.243 NODA
1.000 Trade
M2: Money Supply. Fdgdp: Financial deposits(liquid liabilities). BcBd: Bank credit on bank deposits. FcFd: Financial credit on Financial deposits. Pcrb: Private domestic credit from
deposit banks. Pcrbof: Private domestic credit from deposit banks and other financial institutions. Dbacba: Deposit bank assets on central bank assets plus deposit bank assets. FDI:
Foreign Direct Investment. GDPg: GDP growth. Popg: Population growth. PubIvt: Public Investment. NODA: Net Official Development Assistance. Fin: Financial.
17
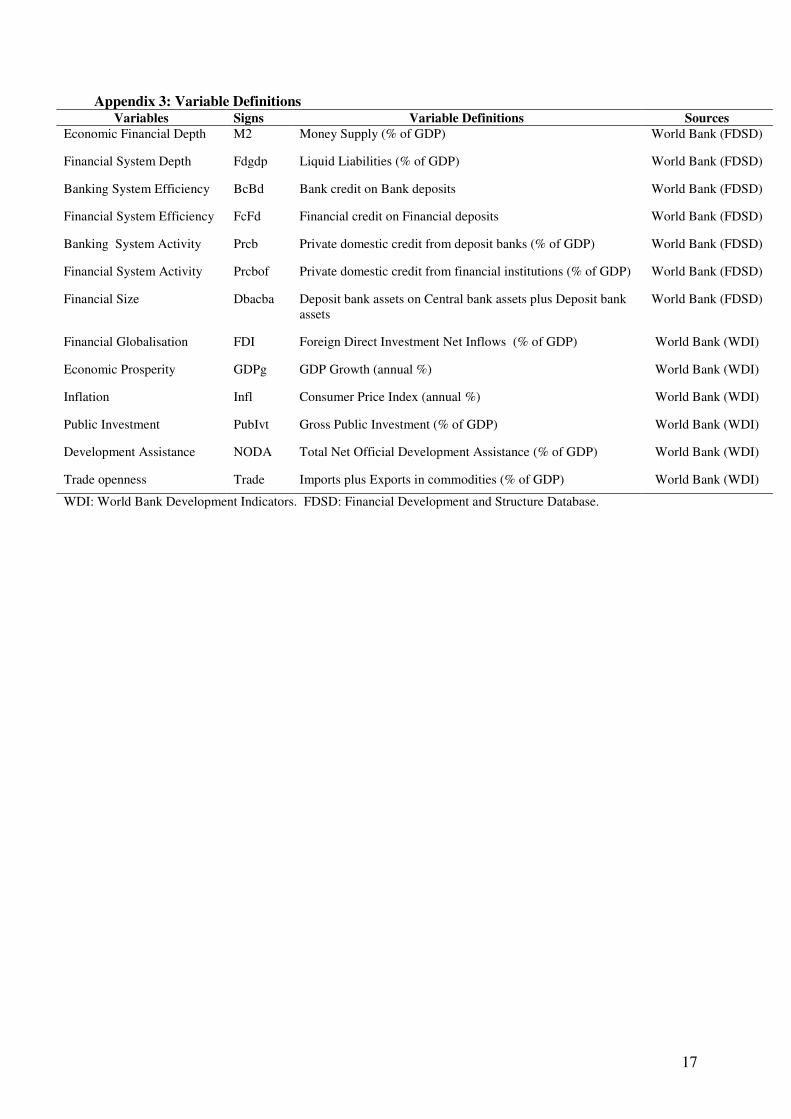
Appendix 3: Variable Definitions Variables Signs Variable Definitions Sources
Economic Financial Depth M2 Money Supply (% of GDP) World Bank (FDSD)
Financial System Depth Fdgdp Liquid Liabilities (% of GDP) World Bank (FDSD)
Banking System Efficiency BcBd Bank credit on Bank deposits World Bank (FDSD)
Financial System Efficiency FcFd Financial credit on Financial deposits World Bank (FDSD)
Banking System Activity Prcb Private domestic credit from deposit banks (% of GDP) World Bank (FDSD)
Financial System Activity Prcbof Private domestic credit from financial institutions (% of GDP) World Bank (FDSD)
Financial Size Dbacba Deposit bank assets on Central bank assets plus Deposit bank
assets
World Bank (FDSD)
Financial Globalisation FDI Foreign Direct Investment Net Inflows (% of GDP) World Bank (WDI)
Economic Prosperity GDPg GDP Growth (annual %) World Bank (WDI)
Inflation Infl Consumer Price Index (annual %) World Bank (WDI)
Public Investment PubIvt Gross Public Investment (% of GDP) World Bank (WDI)
Development Assistance NODA Total Net Official Development Assistance (% of GDP) World Bank (WDI)
Trade openness Trade Imports plus Exports in commodities (% of GDP) World Bank (WDI)
WDI: World Bank Development Indicators. FDSD: Financial Development and Structure Database.
18
References
Anyanwu, J. C., (2014). “Does Intra-African Trade Reduce Youth Unemployment in
Africa?”, African Development Review, 26(2), pp. 286-309.
Asongu, S. A., (2014). “Financial development dynamic thresholds of financial globalisation: evidence from Africa”, Journal of Economics Studies, 41(2), pp. 166-195.
Asongu, S. A., (2015). “Finance and growth: new evidence from meta-analysis”, Managerial
Finance, 41(6), pp. 615-639.
Asongu, S., & De Moor, L., (2015). “Financial globalisation dynamic thresholds for financial
development: evidence from Africa”, African Governance and Development Institute
Working Paper, No. 15/035, Yaoundé.
Asongu, S., Efobi, U., & Beecroft, I., (2015). “Inclusive Human Development in Pre-Crisis
Times of Globalisation-Driven Debts”, African Development Review: Forthcoming.
Asongu, S. A. & Nwachukwu, J. C., (2015). “A Good Turn Deserves Another: Political Stability, Corruption and Corruption-Control”, Economics Bulletin: Forthcoming.
Barros, C. P., Damasia, B., & Faria, J. R., (2014). “Reverse FDI in Europe: An Analysis of
Angola's FDI in Portugal”, African Development Review, 26(1), pp. 160-171.
Brambor, T., Clark, W. M., & Golder, M., (2006). “Understanding Interaction Models: Improving Empirical Analyses”, Political Analysis, 14 (1), pp. 63-82.
Buckle, B., (2009). “Asia-Pacific Growth. Before and After the Global Financial Crisis”, Policy Quarterly, 5(4), pp. 36-45
Chen, C-H., (1996). “Regional determinants of foreign direct investment in mainland China”, Journal of Economic Studies, 23 (2), pp. 18-30.
Dornbusch, R., (1996, August/September). “It’s Time for a Financial Transactions Tax”, International Economy.
Dornbusch, R., (1998, May). “Capital Controls: An Idea Whose Time is Past”, Essays in
International Finance, No. 207.
Fischer, S., (1998). “Capital Account Liberalization and the Role of the IMF”, in “Should the IMF Pursue Capital-Account Convertibility?”, Essays in International Finance, Department of Economics, Princeton University, 207, pp. 1-10.
Foster-McGregor, N., Isaksson, A., & Kaulich, F., (2015). “Foreign Ownership and Labour
in Sub-Saharan African Firms”, African Development Review, 27(2), pp. 130-144.
Fosu, A. K., (2015). “Growth, Inequality and Poverty in Sub-Saharan Africa: Recent Progress
in a Global Context”, Oxford Development Studies, 43(1), pp. 44-59.
Henry, P. B., (2007). “Capital Account Liberalization: Theory, Evidence and Speculation”Journal of Economic Literature, XLV, pp. 887-935.

19
Koenker, R., & Hallock, F.K., (2001). “Quantile regression”, Journal of Economic
Perspectives, 15, pp.143-156.
Koomson, I., & Asongu, S. A., (2015). “Relative Contribution of Child Labour to Household
Farm and Non-Farm Income in Ghana: Simulation with Child's Education”, African
Governance and Development Institute Working Paper No. 15/032, Yaoundé.
Kose, M. A., Prasad, E. S., & Rogoff, K., Wei, S. J., (2006). “Financial globalization: are
appraisal”, IMF Staff Papers 56(1), pp. 8-62.
Kose, M. A., Prasad, E. S., & Taylor, A. D. (2011). “Threshold in the process of international financial integration”, Journal of International Money and Finance 30(1), pp.147-179.
Kummer-Noormamode, S., (2014). “Does Trade with China Have an Impact on African
Countries' Growth?”, African Development Review, 26(2), pp. 397-415.
Leung, H. M., (2003). “External debt and worsening business cycles in less developed
countries”, Journal of Economic Studies, 30(2), pp. 155-168.
Makochekanwa, A., (2014). “Welfare Implications of COMESA-EAC-SADC Tripartite Free
Trade Area”, African Development Review, 26(1), pp. 186-202.
Mlachila, M., Tapsoba, R., & Tapsoba, S. J. A., (2014). “A Quality of Growth Index for Developing Countries: A Proposal”, IMF Working Paper No. 14/172, Washington.
Motelle, S., & Biekpe, N., (2015). “Financial integration and stability in the Southern African development community”, Journal of Economics and Business, 79(May-June, 2015), pp.
100-117.
Mulwa, M. R., Emrouznejad, A., & Murithi, F. M., (2009). “Impact of liberalization on
efficiency and productivity of sugar industry in Kenya”, Journal of Economic Studies, 36 (3),
pp. 250 -264.
Nguena, C. L & Nanfosso, R. T. (2014). “Banking Activity Sensitivity to Macroeconomic
Shocks and Financial Policies Implications: The Case of CEMAC Sub-region”, African
Development Review, 26(1), pp. 102-117.
Prasad, E. S., & Rajan, R. G., (2008). “A pragmatic approach to capital account liberalization”, Journal of Economic Perspectives, 22(3), pp. 149-172.
Price, G. N., & Elu, J. U., (2014). “Does regional currency integration ameliorate macroeconomic shocks in sub-Saharan Africa? The case of the 2008-2009 global financial
crisis”, Journal of Economic Studies, 41(5), pp. 737-750.
Rodrik, D., & Subramanian, A., (2009). “Why Did Financial Globalization Disappoint?”, IMF
Staff Papers, 56(1), pp. 112-138.
Shuaibu, M., (2015). “Trade Liberalization and Intra-Regional Trade: A Case of Selected
ECOWAS Countries”, African Development Review, 27(1), pp. 27-40.

20
Summers, L. H., (2000). “International Financial Crises: Causes, Prevention and Cures”, American Economic Review, 90(2), pp. 1-16.
Tumwebaze, H. K., & Ijjo, A. T. (2015). “Regional Economic Integration and Economic
Growth in the COMESA Region, 1980–2010”, African Development Review, 27(1), pp. 67-
77.