
FINANCIAL ANALYSIS SUMMARY 2 JUNE 2014
34
FINANCIAL ANALYSIS SUMMARY 2 JUNE 2014
Transcript of FINANCIAL ANALYSIS SUMMARY 2 JUNE 2014

1
FINANCIAL ANALYSIS SUMMARY
2 JUNE 2014

1
The DirectorsMariner Finance p.l.c.Nineteen Twenty ThreeValletta RoadMarsa MRS 3000
2 June 2014
Dear Sirs
Mariner Finance p.l.c. Financial Analysis Summary
In accordance with your instructions, and in line with the requirements of the Listing Authority Policies, we have compiled the Financial Analysis Summary set out on the following pages and which is being forwarded to you together with this letter. The purpose of the financial analysis is that of summarising key financial data appertaining to Mariner Finance p.l.c. (the “Group” or the “Company”). The data is derived from various sources or is based on our own computations as follows: (a) Historical financial data for the three years ended 31 December 2011 to 31 December 2013 has been
extracted from the audited financial statements of each of the companies forming part of the Group for the three years in question (other than SIA Mariner Finance Baltic which was set up in 2013 and therefore historical financial data refers to FY2013 only; and SIA Mariner Baltic Holdings which was incorporated in FY2014 and as such no audited financial statements have been prepared), and from the pro forma consolidated financial statements of the Company for the year ended 31 December 2013.
(b) The forecast data of the Group for the years ending 31 December 2014 and 31 December 2015 has been provided by management of the Company.
(c) Our commentary on the results of the Group and on its financial position is based on the explanations provided by the Company.
(d) The ratios quoted in the Financial Analysis Summary have been computed by us applying the definitions set out in Part 4 of the Analysis.
(e) Relevant financial data in respect of the companies included in Part 3 has been extracted from public sources such as websites of the companies concerned, financial statements filed with the Registrar of Companies or websites providing financial data.

2
The Analysis is meant to assist investors in the Company’s securities and potential investors by summarising the more important financial data of the Group. The Analysis does not contain all data that is relevant to investors or potential investors. The Analysis does not constitute an endorsement by our firm of any securities of the Company and should not be interpreted as a recommendation to invest in any of the Company’s securities. We shall not accept any liability for any loss or damage arising out of the use of the Analysis. As with all investments, potential investors are encouraged to seek professional advice before investing in the Company’s securities.
Yours faithfully,
Wilfred MalliaDirector

3
CONTENTS
PART 1
1. Company’s Key Activities .....................................................................................................................4
2. Directors and Key Employees ..............................................................................................................4
3. Mariner Group ........................................................................................................................................53.1 Organisational structure .............................................................................................................5
4. Group Operating Companies ...............................................................................................................64.1 SIA Equinor Riga..........................................................................................................................6
4.1.1 Introduction ....................................................................................................................64.1.2 Riga office market overview ...........................................................................................74.1.3 Operational performance ..............................................................................................7
4.2 SIA Baltic Container Terminal .....................................................................................................94.2.1 Introduction ....................................................................................................................94.2.2 Market and competition .................................................................................................94.2.3 Principal activities .........................................................................................................104.2.4 Operational performance ............................................................................................ 114.2.5 Revenue by segment ....................................................................................................124.2.6 Revenue by customer ...................................................................................................134.2.7 Operational performance (2004 – 2013) .....................................................................144.2.8 Financial position..........................................................................................................174.2.9 Optimisation of terminal operations............................................................................18
5. The Global Container Market .............................................................................................................195.1 Introduction ...............................................................................................................................195.2 Growth in global containerisation ............................................................................................195.3 Origin & destination (O&D) vs transhipment ...........................................................................205.4 Hinterland transportation .........................................................................................................205.5 Container terminal market ........................................................................................................20
6. Baltic Sea Region Container Market..................................................................................................216.1 Overview ...................................................................................................................................216.2 Historical development .............................................................................................................216.3 BSR container demand ..............................................................................................................236.4 Conclusion .................................................................................................................................24
PART 2
7. Company Performance Review ..........................................................................................................257.1 Financial information .................................................................................................................25
PART 3
8. Comparables .........................................................................................................................................30
PART 4
9. Explanatory Definitions ......................................................................................................................32

4
PART 1
1. COMPANY’S KEY ACTIVITIES
The principal activity of the Mariner Finance p.l.c. (the “Company”, “Issuer” or the “Group”) is to carry on the business of a finance and investment company within the Group, in particular, the financing of acquisitions in seaport terminals.
The Issuer was incorporated on 30 May 2003 in advance of issuing a bond of €13 million at an annual interest rate of 5.75% and redeemable between 2008 and 2010. The bond was listed on the Official List of the Malta Stock Exchange. The net bond proceeds of the issue were on-lent to its then parent company, Mariner Srl (formerly Mariner SpA), to fund the acquisition of a shareholding in Terminal Intermodale Venezia SpA., a licensed operator of a seaport terminal in Venice Italy, and to fund the 100 per cent equity interest in SIA Baltic Container Terminal (“BCT”).
Subsequent to the redemption of the aforesaid bond on 15 July 2010, the principal activity of the Issuer was that of servicing a portfolio of available-for-sale investments.
In November 2013, a corporate restructuring exercise took place whereby the Company was acquired by Mariner Capital Limited from Mariner Srl. Furthermore, in May 2014 the Company became the parent of the Group as set out in section 3 below.
2. DIRECTORS AND KEY EMPLOYEES
The Company is managed by a Board consisting of six directors entrusted with its overall direction and management.
Board of Directors
Marin Hili Chairman and Chief Executive OfficerEdward Hili Non-Executive DirectorMichela Borg Non-Executive DirectorKevin Saliba Non-Executive DirectorLawrence Zammit Independent Non-Executive DirectorNicholas Bianco Independent Non-Executive Director
The Issuer is an investment company which does not require an elaborate management structure. Marin Hili has been appointed Chairman and Chief Executive of the Issuer. The Chief Executive Officer is responsible for the day-to-day management of the Group. In the execution of the strategic direction, investment and management oversight of the Group, he is assisted by senior management of the operating Group companies having the appropriate experience and knowledge required in particular cases arising from time to time. The aforesaid senior management of the operating companies, BCT and SIA Equinor RIga (EQR), as well as their principal roles are included hereunder:
Gerard Sammut Finance (BCT and EQR)Aldis Zieds Administration (BCT)Dzintars Vigulis Operations (BCT)Dimitri Kiseljev Information Technology (BCT)

5
3. MARINER GROUP
3.1 ORGANISATIONAL STRUCTURE
As the holding company of the Group, the Company is ultimately dependent upon the operations and performance of the Group’s operating companies. The organisational structure of the Group is illustrated in the diagram hereunder:
SIA Mariner Baltic Holdings (“MBH”) is a private limited liability company incorporated and registered in Latvia. It has an authorised and issued share capital of €2,800 divided into 2,800 ordinary shares of €1.00, fully paid up. The company was incorporated on 16 April 2014 principally to act as a holding company.
SIA Mariner Finance Baltic (“MFB”) is a private limited liability company incorporated and registered in Latvia. It has an authorised and issued share capital of the euro equivalent of €40,001,195 divided into 281,130 ordinary shares of €142.29 per share, fully paid up. The company was set up on 28 February 2013 principally to act as the immediate parent company of BCT and to provide financing to its subsidiary company.
On 1 March 2013, the company acquired from Mariner Srl the 100% shareholding in BCT for €70 million. The terms of the purchase agreement include a cash consideration of €26 million, which was settled during the reporting period. The remaining balance of €44 million was settled through a set-off of debt balances with MFB’s ultimate parent company, Mariner Capital Limited. In 2013, MFB entered into a loan agreement with two Latvian credit institutions for an aggregate amount of €40 million which is repayable in April 2018. As at 31 December 2013, the balance from such facility amounted to €34.9 million.
A brief overview and primary business activities of each of the two operating companies of the Group, SIA Equinor Riga (“EQR”) and SIA Baltic Container Terminal (“BCT”), is provided in section 4 below.
On 1 January 2014, Latvia joined the Eurozone and the Latvian Lat was replaced with the
Euro. The conversion to Euro was effected at the official exchange rate set by the Bank of Latvia - €1:Ls 0.702804. The audited historical financial statements of Group companies registered and operating in Latvia had been prepared in the home currency – Latvian Lats. For comparative purposes, such financial information has been translated into Euro, being the functional currency of the Issuer, at the said official conversion rate of €1:Ls 0.702804.
(ISSUER)
100%
100%
100%
100%
SIA Mariner Baltic Holdings(MBH)
SIA Equinor Riga(EQR)
SIA Mariner Finance Baltic(MFB)
SIA Baltic Container Terminal(BCT)
6
4. GROUP OPERATING COMPANIES
4.1 SIA EQUINOR RIGA
4.1.1 Introduction
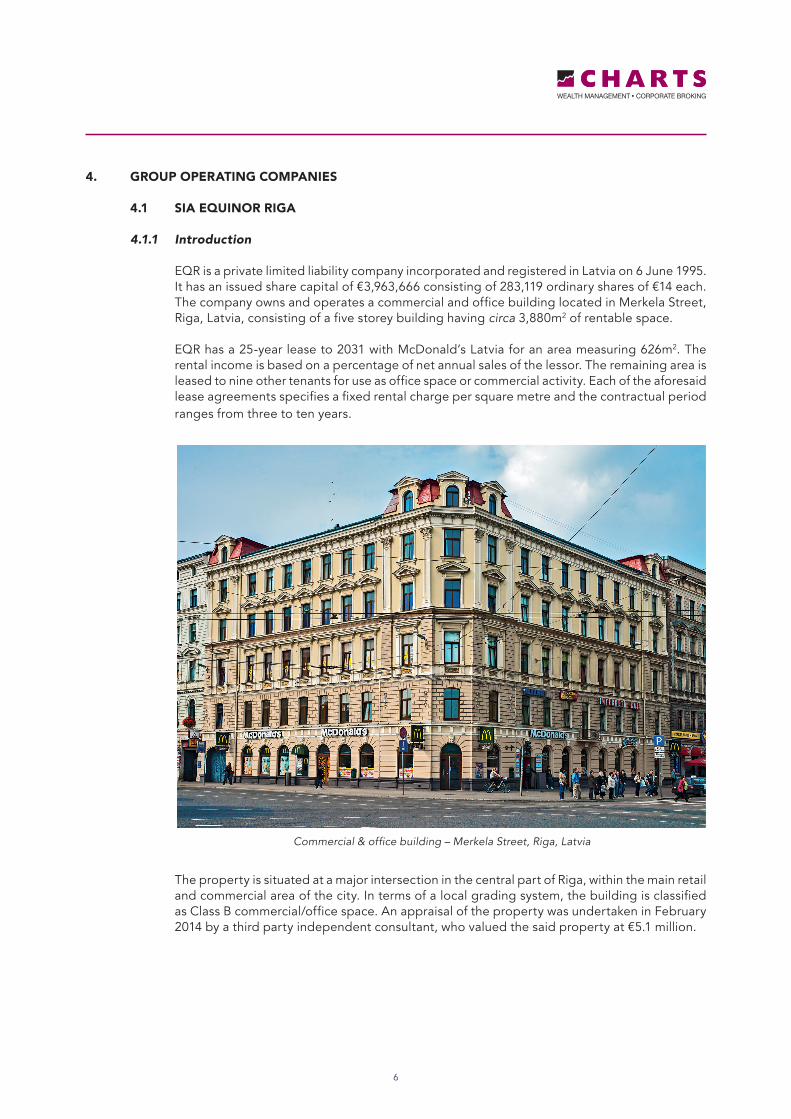
EQR is a private limited liability company incorporated and registered in Latvia on 6 June 1995. It has an issued share capital of €3,963,666 consisting of 283,119 ordinary shares of €14 each. The company owns and operates a commercial and office building located in Merkela Street, Riga, Latvia, consisting of a five storey building having circa 3,880m2 of rentable space.
EQR has a 25-year lease to 2031 with McDonald’s Latvia for an area measuring 626m2. The rental income is based on a percentage of net annual sales of the lessor. The remaining area is leased to nine other tenants for use as office space or commercial activity. Each of the aforesaid lease agreements specifies a fixed rental charge per square metre and the contractual period ranges from three to ten years.
The property is situated at a major intersection in the central part of Riga, within the main retail and commercial area of the city. In terms of a local grading system, the building is classified as Class B commercial/office space. An appraisal of the property was undertaken in February 2014 by a third party independent consultant, who valued the said property at €5.1 million.
Commercial & office building – Merkela Street, Riga, Latvia

7
4.1.2 Riga office market overview
The office space rental market in Riga offers Class A, B and C lease space and consists of a total area of circa 500,000m2 in 65 premises. Class A buildings make up approximately 20% of total rentable area and are primarily utilised for commercial banking purposes. Therefore, quality commercial space available to businesses (other than banking) is of a Class B standard.
Statistical data shows that the highest demand is for office space not exceeding 150m2 and the top quality office space is generally taken up by companies that have a staff complement of at least 10 employees. On the other hand, Class C office space tends to be requested for by start-up companies or other organisations that have limited budgets and cannot afford Class A or B facilities.
As to rental prices, property owners typically prefer a low turnover of tenants and therefore tend to minimise increases in rental rates. The average rent payable for Class A space is €12 to €15 per square metre with an annual average rent increase of 7% to 8%. Class B rates average around €7 to €8 per square metre, with an annual increment of circa 5% to 7%.
4.1.3 Operational performance Set out below are highlights of EQR’s operating performance for the years indicated therein:
Income Statement FY2015 FY2014 FY2013 FY2012 FY2011(€’000) Projection Forecast Actual Actual Actual
Revenue (rental income and other services) 451 419 375 345 289Operating expenses (124) (98) (90) (84) (62)
EBITDA 327 321 285 261 227Depreciation - - (72) (72) (72)Net interest income 89 87 29 16 18
Profit before tax 416 408 242 205 173Taxation (57) (64) (52) (40) (40)
Profit for the year 359 344 190 165 133
The key accounting ratios are set out below:
FY2015 FY2014 FY2013 FY2012 FY2011
Revenue growth 8% 12% 9% 19% (Revenue FY1/Revenue FY0)EBITDA margin 73% 77% 76% 76% 79%(EBITDA/revenue)Net profit margin 80% 82% 51% 48% 46%(Profit after tax/revenue)
Source: Charts Investment Management Service Limited

8
Statement of financial position 31 Dec‘13 31 Dec‘12 31 Dec‘11(€’000) Actual Actual Actual
ASSETSNon-current assetsLand and buildings 1,676 1,705 1,733 Other fixed assets 198 237 280 Amounts due from related and affiliated companies 2,917 2,272 2,272
Total non-current assets 4,791 4,214 4,285
Current assetsTrade and other receivables 37 39 53 Amounts due from related and affiliated companies 56 625 556 Cash and cash equivalents 115 24 31
Total current assets 208 688 640
Total assets 4,999 4,902 4,925
EQUITY AND LIABILITIESEquity 3,321 3,130 2,966
LIABILITIESNon-current liabilitiesLoans from credit institution - 61 194 Loans from related parties 1,330 1,330 1,093 Deferred tax liability and other creditors 88 90 96
Total non-current liabilities 1,418 1,481 1,383
Current liabilitiesLoans from credit institution 61 133 467 Other creditors 199 158 109
Total current liabilities 260 291 576
Total liabilities 1,678 1,771 1,959
Total equity and liabilities 4,999 4,902 4,925
Revenue generated by EQR mainly relates to rental income and the provision of other ancillary services. In FY2013 income increased to €375,000 from €289,000 in FY2011 (equivalent to a compound annual growth rate of 14%) as a result of an increase in occupancy rate during this period from 71.2% to 100%. Profit for the year increased by 15% to €190,459 (FY2012: €164,697), reflecting the increase in tenancy following the signing of a new customer that will be operating a collective accommodation establishment. Revenue and profits are projected to grow after FY2013 in line with any increments factored into the respective lease agreements.
The assets of the company primarily include the aforesaid property and building improvements amounting to an aggregate of €1.9 million, and receivables due from affiliated companies of €2.9 million. In line with an appraisal of the property dated 14 February 2014, the property has been revalued in FY2014 to €5.1 million. EQR’s outstanding bank borrowings as at 30 April 2014 amounted to €40,355, which will be settled in full during the financial year ending 31 December 2014.

9
4.2 SIA BALTIC CONTAINER TERMINAL
4.2.1 Introduction
BCT is a private limited liability company incorporated and registered in Latvia. The company was incorporated on 26 March 1996 and is principally engaged in the provision of port and related services at the port of Riga. BCT operates at the Riga Free Port No. 2 under a port concession license issued by the Riga Free Port Authority which expires in April 2047. Apart from the license, the company had entered into a real estate purchase agreement on 30 April 2003 whereby the Riga Free Port Authority sold to BCT, which acquired, full ownership of all yards within the boundaries of the BCT terminal (excluding the quay), together with all underlying communications, five warehouses having an aggregate total area of approximately 14,000m2, parking and paved areas surrounding said warehouses, and covered rail ramps.
4.2.2 Market and competition BCT is located at the mouth of the river Daugava which runs through the centre of Latvia’s
capital Riga. Its favourable geographical location and good, direct access via road and rail to its market hinterland make it strategically located to serve as a gateway to meet container traffic demand to and from the main industrial centres of Russia and other destinations including Moscow, Kaluga, Novgorod, St Petersburg, Minsk, Kiev, Vilnius, Tallinn, Almaty and Tashkent.
Latvia is a fast developing country located on the south-east coast of the Baltic Sea in the centre of the Baltic States (Lithuania, Latvia and Estonia). It represents the financial hub of the three nations and its favourable geopolitical environment provides excellent business opportunities for the four major growth markets bordering Latvia - Belarus, Estonia, Lithuania and Russia.
There are three main ports in Latvia - Venstpils, Riga and Liepaja - and these are mainly involved
in transit cargo. The Freeport of Riga is by far the major container-handling port in Latvia at over 98.5% in 2013. In turn, within the port, BCT is the only specialised container terminal and in 2013 handled approximately 72% of containers. There are two other terminals - Riga Central Terminal (RCT) and Riga Universal Terminal (RUT) - which handle relatively small volumes of containerised cargo, though their main fields of activity are in the handling of general and bulk cargoes. As a specialised container terminal BCT is better equipped in terms of infrastructure, superstructure and workforce to efficiently and productively handle containers.
SIA Baltic Container Terminal

10
Although the RUT and RCT do constitute a form of competition, BCT’s main competitors are other specialised container terminals which are located in the neighbouring Baltic States and other eastern Baltic countries. These include: Klaipeda Container Terminal (KCT) and Klaipeda Smelte Container Terminal (KSCT) in Klaipeda, Lithuania; Transiidikeskuse (formerly Muuga Container Terminal) (TK) in Tallinn, Estonia; the container terminals within the Port of St. Petersburg, Russia, and; Palokangas - EU Container Terminal and Mussalo Container Terminal within HaminaKotka Port, Finland.
KCT, KSCT and TK, located in the neighbouring Baltic States represent the most direct form of competition to BCT due to their similar geographical locations, hinterland markets, inland connections, geopolitical environment and general terminal facilities. Below is a comparison of BCT with its direct competitors for the financial years 2010 to 2013.
4.2.3 Principal activities
BCT commenced activities on 1 May 1996, subsequent to the restructuring of a state-owned company, Riga Trade Port. It operates over an area of circa 557,000m2. The BCT terminal has an annual container handling capacity of circa 450,000 twenty-foot equivalent units (“TEUs”), and offers the following services:
• Quay-side operations – including the berthing of vessels for the loading and/or unloading of containerised cargo using three ship-to-shore quay cranes. A fourth quay crane has been commissioned for delivery in Q3 2014. Ro-ro vessels, which are ships designed to carry wheeled cargo such as automobiles, trucks and trailers (roll-on/roll-off), may also be serviced.
• Yard operations – the terminal has a container storage yard comprising a capacity of circa 20,000 TEUs. In addition, the yard has 500 reefer points, that is, electrical outlets for the storage of temperature-controlled containers.
Co
ntai
ner V
olum
e in
TEU
s
Comparison to total volumes of containers handled atBaltic States container terminals post-crisis (2010-2013)
2010 2011 2012 2013
350,000
280,000
210,000
140,000
70,000
0
BCT TK KCT KSCT

11
• Gate and rail operations – including the transfer of containers between the container terminal and inland road and rail networks. BCT has direct access to both road and rail networks, and operates its own rail handling facility which can service up to 64 rail platforms simultaneously.
• Warehousing – the terminal has circa 20,400m2 of covered warehousing space for the storage of general cargo. The warehouse facilities have direct access to the rail and road networks for more efficient distribution of cargo.
• Ancilliary activities – a wide range of value-added services are provided at the container terminal due to an optimised integrated logistics chain. Through a container freight station the terminal offers the service of, amongst others, stuffing and stripping of containers (packing/unpacking). In addition, BCT also provides engineering services for the repair of damaged containers.
Of the activities outlined above, the main operation at BCT is the loading and unloading of containers, which in 2013 represented 78% of total revenue generated by the company.
4.2.4 Operational performance
The following table sets out the highlights of BCT’s operating performance for the years indicated therein.
Income Statement FY2015 FY2014 FY2013 FY2012 FY2011(€’000) Projection Forecast Actual Actual Actual
Revenue 18,581 17,608 17,648 19,762 19,888Operating expenses (9,381) (9,031) (9,144) (8,313) (8,177)
EBITDA 9,200 8,577 8,504 11,449 11,711Depreciation and amortisation (1,551) (1,435) (1,215) (1,301) (1,440)Net interest income 726 717 446 472 23
Profit before tax 8,375 7,859 7,735 10,620 10,294Taxation (253) (238) (225) (736) (1,511)
Profit for the year 8,122 7,621 7,510 9,884 8,783
The key accounting ratios are set out below:
FY2015 FY2014 FY2013 FY2012 FY2011
Revenue growth 6% - -11% -1% (Revenue FY1/Revenue FY0)EBITDA margin 50% 49% 48% 58% 59%(EBITDA/revenue)Net profit margin 44% 43% 43% 50% 44%(Profit after tax/revenue)
Source: Charts Investment Management Service Limited

12
During the year ended 31 December 2012, BCT handled 265,054 TEUs and generated €19.8 million in revenue (equivalent to €75 per TEU). This result was broadly similar to that achieved in the prior year (FY2011: 266,161 TEU and €19.9 million in revenue). As to the number of ship calls, the terminal received 350 vessels in FY2012 which, although greater in number by 21%, had on average a lower TEU load when compared to FY2011.
FY2013 was a record year in terms of TEUs as the container terminal handled its highest volume of containers (273,650 TEUs). Despite this 3.2% increase, revenue declined by 10.7% to €17.6 million (FY2012: €19.8 million) and operating profit decreased by 28.3% to €7.3 million. Consequently, profit for the year also decreased from €9.9 million to €7.5 million (24.0%). The primary reason for this decrease was due to the cessation of storage requirements of NATO reefers as troops in Afghanistan were withdrawn. This reduced revenue generated from cargo handling from €3.6 million in 2012 to €1.8 million in 2013. Moreover, BCT offers certain volume discounts in order to induce higher volumes, and during 2013 shipping lines took particular advantage of such discounts by passing increased volumes through the terminal. In FY2013, the effect of such discounted rates impacted revenues adversely by €0.4 million (2012: €0.09 million).
In FY2014 management expects to generate revenue similar to that achieved in FY2013 at €17.6 million, but EBITDA should improve marginally by 1% from €8.5 million in FY2013 to €8.6 million in FY2014. Revenue in FY2015 is projected to recover by 6% to €18.6 million, whilst improving EBITDA margin from 49% to 50%.
4.2.5 Revenue by segment
The revenue of the company can be categorised into three main revenue streams as follows:
i. Container services – including loading and unloading of containers to and from ships, other container handling services, berthing and other vessel services;
ii. Cargo storage – comprising primarily yard storage, with increasing capacity in warehouse storage; and
iii. Additional handling and other services – provided through the integrated logistics chain including additional services, such as transferring containers from the terminal to inland networks via rail or trucks.

13
A segmental analysis of revenue by segment for the three financial years ended 31 December 2011 to 31 December 2013 is provided below:
Revenue by segment FY2013 FY2012 FY2011(€’000) Actual Actual Actual
Container services 13,166 13,601 13,323Cargo storage 1,836 3,556 3,594Additional handling and other services 3,041 2,695 3,090Discounts (395) (90) (119)
Total revenue 17,650 19,762 19,888
Annual container volumes handled (TEUs) 273,650 265,064 266,121
FY2013 FY2012 FY2011
Revenue growth(Revenue FY1/Revenue FY0) -11% -1% Growth in TEUs(TEUs FY1/TEUs FY0) 3% -1% % of total revenue:Container services 75% 69% 67%Cargo storage 10% 18% 18%Additional handling and other services 17% 14% 16%Discounts -2% -1% -1%
In FY2012, revenue generated from container services was relatively stable at €13.6 million (+2.3%) when compared to FY2011 (€13.3 million), and registered a 3% drop in the subsequent year (FY2013) to €13.2 million. The decrease in revenue was mainly the result of the company earning lower income per TEU, since in FY2013 the terminal handled a record 273,446 TEUs (+3%).
As to cargo storage, the company registered a sharp decline in FY2013 (-48%) primarily due to the cessation of storage of NATO reefers at the terminal as a result of a withdrawal of troops from Afghanistan. In FY2013, additional handling and other services recovered from the decline in FY2012 to €3 million (+13%), which is similar to revenue achieved in FY2011.
During FY2013, shipping lines took advantage of volume discounts by passing increased volume of containers through the terminal and which therefore resulted in an increase in discounts from €90,000 in FY2012 to €395,000 in FY2013.
4.2.6 Revenue by customer As an important node within the region’s logistics network, BCT’s clients include shipping lines,
freight forwarders, third party logistics service providers, liner agents, inland carriers (such as road haulage companies), as well as end-customers. The container terminal services some of the world’s largest shipping lines which call directly at the terminal as well as other shipping lines that use common feeder services. These include Maersk Line, Compagnie Maritime d’Affretement – Campagnie Generale Maritime (CMA-CGM) and Mediterranean Shipping Company (MSC), Unifeeder and Team Lines, as well as Evergreen, China Shipping Container Lines (CSCL), Nippon Yusen Kaisha (NYK) and Orient Overseas Container Line (OOCL). BCT has strong relationships with all the major shipping lines and their local representatives, and strives to maintain good relations with both existing and potential clients.

14
A segmental analysis of revenue by customer for the three financial years ended 31 December 2011 to 31 December 2013 is provided below:
Revenue by customer FY2013 FY2012 FY2011(€’000) Actual Actual Actual
Total revenue 17,648 19,762 19,888
Top three customers 10,356 10,030 11,306Top five customers 13,383 12,622 14,110Top ten customers 14,673 16,682 16,304
% of total revenue:Top three customers 59% 51% 57%Top five customers 76% 77% 77%Top ten customers 83% 84% 82%
Revenue for the top three customers increased by 3% in FY2013 following a decrease of 11%
in FY2012. Revenue attributed to the top three customers amounted to 59% of total reported revenue in FY2013 compared to 51% in FY2012 and 57% in FY2011.
Revenue derived from the top five customers increased by 6% in FY2013. However, revenue from the top five customers as a percentage of total reported revenue decreased from 77% in FY2012 to 76% in FY2013.
As to the top ten customers, revenue attributable to this sector decreased by 12% in FY2013, but as a percentage of total revenue, top ten customers maintained broadly the same share of revenue at 83%.
4.2.7 Operational performance (2004 – 2013)
As detailed below, over the past 10 years, BCT has performed well and this is reflected both in revenue growth and yearly profits. During the period under review, revenue more than doubled from €8.0 million in FY2004 to €17.6 million in FY2013, while profits tripled from €2.5 million in FY2004 to €7.5 million in FY2013. The significant increase in results is due to the ongoing investment undertaken in terms of equipment, infrastructure and facilities at the terminal to handle increased volumes. In fact, over the year, volume handled by BCT increased from circa 150,000 TEUs in FY2004 to circa 273,000 TEUs in FY2013.
Furthermore, as the company managed to increase TEUs handled at the terminal over the years and consequently its income generation, management ensured that the company’s EBITDA and profit margins were broadly maintained. As outlined hereunder, the lowest EBITDA and net profit margins were registered in FY2009 (46% and 31% respectively) due to the global economic crisis that negatively affected both the Latvian economy and BCT’s business activities.

15
BCT FY2013 FY2012 FY2011 FY2010 FY2009 FY2008 FY2007 FY2006 FY2005 FY2004(€’000) Actual Actual Actual Actual Actual Actual Actual Actual Actual Actual
Revenue 17,648 19,762 19,888 15,738 11,239 15,142 14,202 12,025 10,158 7,971
Container services 13,166 13,601 13,323 10,953 7,556 9,946 9,315 7,924 7,217 6,021Cargo storage 1,836 3,556 3,594 2,422 2,102 3,317 3,258 2,471 1,667 1,306Other services 3,040 2,694 3,090 2,363 1,588 1,879 1,646 1,636 1,280 689Discounts -395 -90 -119 - -8 - -18 -6 -6 -44
EBITDA 8,504 11,449 11,711 8,986 5,173 8,114 8,197 6,844 5,817 3,936Profit for the year 7,510 9,884 8,783 6,612 3,504 5,911 6,265 5,043 4,166 2,501
TEUs (‘000) 274 265 266 218 156 207 212 177 167 150
Revenue growth -11% -1% 26% 40% -26% 7% 18% 18% 27% (Revenue FY1/Revenue FY0)TEUs growth 3% -1% 22% 40% -25% -2% 20% 6% 11% (TEUs FY1/TEUs FY0)EBITDA margin 48% 58% 59% 57% 46% 54% 58% 57% 57% 49%(EBITDA/revenue)Net profit margin 43% 50% 44% 42% 31% 39% 44% 42% 41% 31%(Profit after tax/reAdd. handling & other servicese)
BCT Operational Performance
2004 2005 2006 2007 2008 2009 2010 2011 2012 2013
€20,000,000
€15,000,000
€10,000,000
€5,000,000
0
Revenue EBITDA Proift after tax

16
As depicted in the above chart, BCT is principally involved in the handling of containers (loading and unloading). Furthermore, revenue generated from this activity (red line) is correlated to the volume of containers that pass through the terminal (purple dashed line). Growth in container services at BCT has been constant over the ten year period, except for the impact of the economic crisis in FY2009. On the positive side, the negative effect of the downturn was short and volumes immediately recovered to pre-crisis levels.
2004 2005 2006 2007 2008 2009 2010 2011 2012 2013
€15,000,000
€12,000,000
€9,000,000
€6,000,000
€3,000,000
0
300,000
250,000
200,000
150.000
100,000
50,000
0
Revenue by segment
Add. handling & other services
Cargo storage
TEUs
Container services

17
4.2.8 Financial position
Statement of financial position 31 Dec‘13 31 Dec‘12 31 Dec‘11(€’000) Actual Actual Actual
ASSETSNon-current assetsIntangible assets 362 427 454Property, plant and equipment 10,257 7,496 7,509 Investment in EQR 2,976 2,976 2,976 Investment property 82 82 82Amounts due from related parties and other receivables 30,811 24,541 25,038
Total non-current assets 44,488 35,522 36,059
Current assetsInventory 387 415 392Trade and other receivables 3,601 3,759 2,732 Amounts due from related parties 412 1,482 875 Cash and cash equivalents 1,001 4,571 3,275
Total current assets 5,401 10,227 7,274
Total assets 49,889 45,749 43,333
EQUITY AND LIABILITIESEquity 37,513 32,503 29,619
LIABILITIESNon-current liabilitiesLoans from related parties 8,208 - - Loans from credit institution - 7,288 8,210Other loans 454 321 -Other creditors - - 1,395Deferred tax liability 557 547 463
Total non-current liabilities 9,219 8,156 10,068
Current liabilitiesLoans from related parties 138 113 - Loans from credit institution 1 1,121 2,045 Other loans 227 19 -Other creditors 1,078 2,542 1,601Unpaid dividends 1,713 1,295 -
Total current liabilities 3,157 5,090 3,646
Total liabilities 12,376 13,246 13,714
Total equity and liabilities 49,889 45,749 43,333

18
Intangible assets mainly relate to the “SPARCS” software (the terminal operating system) provided by a company called NAVIS. This system is used to optimise yard storage, that is, to minimise cost of placement of containers and increase efficiency in space utilisation. It is also used to plan unloading and loading of containers from/to vessels. Furthermore, through the software the company maintains a record of all movements of containers. BCT’s customers are linked to this system which enables them to monitor the status of their respective containers with related historical records.
Property, plant and equipment comprise all equipment, yard structures and warehouses situated at the terminal operated by BCT. The land is public property and is leased from the Riga Freeport Authority. Since FY2001, BCT has invested in modernising the existing plant and equipment as well as expanding the fleet of cranes, reach stackers and other yard machinery.
The company also added two new warehouses which were completed during the years FY2009 to FY2013, and extended existing rail facilities. Following the completion of these warehouses, BCT increased available warehouse space to 20,400m2. Due to the increase in demand for modern warehousing space in the region, BCT plans to continue investing further in such storage facilities.
BCT’s capital expenditure on a cash basis for FY2011, FY2012 and FY2013 was €1.8 million, €1.2 million and €3.9 million respectively. Capital commitments for FY2014 amount to €3,325,000 and relate to the outstanding balance due on a new ship-to-shore crane.
As to bank borrowings, during FY2013 BCT repaid in full the outstanding bank loan (loans from credit institutions). This transaction was financed through a new loan granted to BCT by its immediate parent MFB and matures on 30 November 2015. Other loans amounting to €680,000 at FY2013 (as at 30 April 2014: €604,800) comprise loans granted by a commercial company for investment in a new warehouse for the storage of general freight. This loan matures on 31 December 2016, and it is expected that between FY2014 and FY2016, BCT will offset rental income of €227,000 per annum against loan repayments until such loan has been settled.
4.2.9 Optimisation of terminal operations In order to maintain its competitive edge in the market, BCT’s management reviews operation
methodologies and performance on an on-going basis, monitors developments in the industry and ensures that it maintains excellent relations with its clients. Through this gathering of information, BCT is able to plan timely and strategic investments at the terminal to maintain its competitiveness.
It is expected that BCT will continue to optimise its operations by increasing productivity, further investing in equipment, technological processes and infrastructure, and enhancing its customer service to consolidate customer relationships.

19
5. THE GLOBAL CONTAINER MARKET
5.1 INTRODUCTION Container shipping was first introduced in the 1950s and since the late 1960s has become the
most common method for transporting many industrial and consumer products by sea. As a result, containerised trades (being the transportation of cargo in standardised containers) and container port throughputs has seen an overall strong, continuous and almost uninterrupted growth. Container shipping is performed by container shipping companies that operate frequent scheduled or liner services, similar to a passenger airline, with pre-determined port calls, using a number of owned or chartered vessels of a particular size in each service to achieve an appropriate frequency and utilisation level.
Container shipping has a number of advantages, compared with other shipping methods, including:
• Less cargo handling – containers provide a secure environment for cargo. The contents
of a container, once loaded into the container, are not directly handled until they reach their final destination.
• Efficient port turnaround – with specialised cranes and other terminal equipment, container ships can be loaded and unloaded in significantly less time and at a lower cost than other cargo vessels.
• Highly developed intermodal network – onshore movement of containerised cargo, from point of origin, around container terminals, staging or storage areas and to final destinations, benefits from the physical integration of the container with other transportation equipment such as road chassis, railcars and other means of hauling the standard sized containers. A sophisticated port and intermodal industry has developed to support container transportation.
• Reduced shipping time – container ships can travel at speeds of up to 25 knots, even in rough seas, thereby transporting cargo over long distances in relatively short periods of time.
5.2 GROWTH IN GLOBAL CONTAINERISATION Since the introduction of containerised commercial services up to 2008, world container traffic
(the number of containers being carried) has grown exponentially, with an estimated volume of 28.7 million TEUs (Twenty-foot Equivalent Units - the standardised measure of container volumes) in 1990 to some 152.0 million TEUs in 2008 - an increase of approximately 430%. During this same period global container throughput (containers handled at ports and terminals) went from 88 million TEUs to 530 million TEUs - an increase of over 500%. The chart below highlights the year-on-year growth in TEUs since 1980, and indicates an accelerating growth trend, except for 2009, which was negatively impacted by the global financial crisis. Despite growth rates not reaching the levels recorded prior to the downturn, global traffic in 2010 exceeded pre-crisis volumes. The global container throughput is forecasted to reach 684 million TEUs in 2014 and exhibit an average of 6.5% year-on-year growth over the next few years.

20
Key drivers that contributed to the growth in global container throughput over this period were sustained growth in global trade, increased global sourcing and manufacturing, a shift from transporting cargo in bulk to transporting cargo in containers and growth in transhipment volumes. This has resulted in the evolution of ever-expanding container ships as well as a shift toward the specialisation of ports and terminals.
5.3 ORIGIN & DESTINATION (O&D) VS TRANSHIPMENT
The two main categories of container throughput are Origin & Destination (O&D), which is also often referred to as import and export, and transhipment. Every container shipped by sea is, by definition, an export container at the origination terminal and an import container at the destination terminal. A container that is transferred from one ship to another at some point during the journey is referred to as transhipped, which gives rise to transhipment throughput at an intermediate terminal somewhere between the load terminal and the discharge terminal.
5.4 HINTERLAND TRANSPORTATION
Container terminals are a crucial link in a logistics chain. They are nodes that connect with other inland transport modes such as motorways, railways, and inland waterway systems. Terminals have evolved from a cargo handling point to a distribution centre with physical infrastructure serving as transport hubs in the container supply chain. Hence, a container terminal has become an interface between the areas of production and consumption, attracting the attention of players in the shipping and transport related areas. Additionally, high quality inland transport links is a key element in the success of a container terminal.
5.5 CONTAINER TERMINAL MARKET
The container terminal market features high barriers to entry due to the high capital requirements necessary to build container terminal capacity, regulatory requirements and limited land availability. The construction of new ports or terminals is capital intensive and is highly dependent on the region and the type of construction required.
8,000,000
7,000,000
6,000,000
5,000,000
4,000,000
3,000,000
2,000,000
1,000,000
0
Graphical representation of global container port throughput between 1980 and 2012
1980
1981
1982
1983
1984
1985
1986
1987
1988
1989
1990
1991
1992
1993
1994
1995
1996
1997
1998
1999
2000
2001
2002
2003
2004
2005
2006
2007
2008
2009
2010
2011
2012
21
6. BALTIC SEA REGION CONTAINER MARKET
6.1 OVERVIEW
The global major and minor shipping routes form a complex transportation network which links the worlds’ ports and terminals. The latter are often classified into groups of ports/terminals - port systems - which serve as maritime/land interfaces to specific hinterland markets. The Baltic Sea Region is one such port system and is considered as one of the major European transport gateways.
The Baltic Sea Region (BSR) comprises eleven nations with 100 million inhabitants, eight of which are EU members. These include the Baltic states (Estonia, Latvia and Lithuania), the Nordic countries (Denmark, Iceland, Finland, Norway and Sweden), Northern Germany, Northern Poland and Russia’s Northwestern region, including Kaliningrad. Individually, the constituent nations are diverse in terms of politics, geography, demography and economics. The region, however, is characterised by stable democracies, institutional structures favourable to business, proximity of markets, good infrastructure, high levels of education, strong industrial traditions and a shared history of co-operation and trade.
The BSR port system is versatile and multifunctional which features well-established large ports and a whole range of medium-sized and smaller ports, each with its individual characteristics in terms of hinterland markets served, cargo handled and unique location features. This exceptional blend of different port types and sizes combined with a vast economic hinterland shapes port significance and competition in the region.
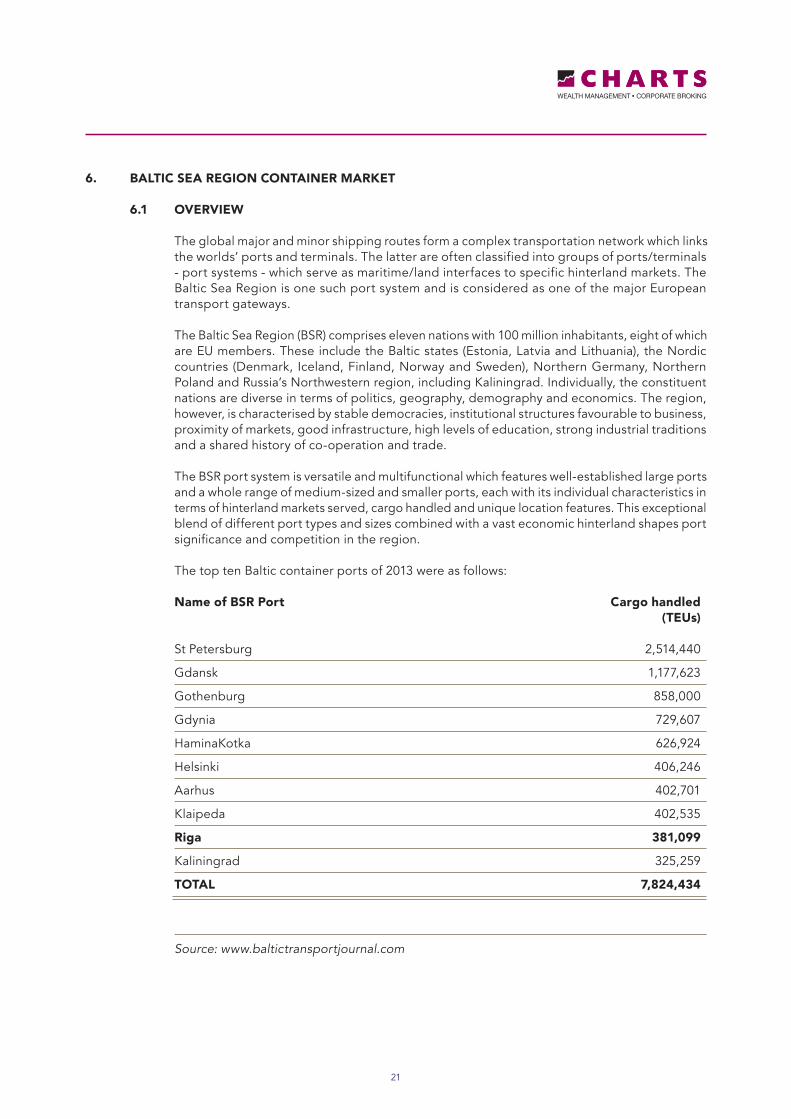
The top ten Baltic container ports of 2013 were as follows:
Name of BSR Port Cargo handled (TEUs)
St Petersburg 2,514,440
Gdansk 1,177,623
Gothenburg 858,000
Gdynia 729,607
HaminaKotka 626,924
Helsinki 406,246
Aarhus 402,701
Klaipeda 402,535
Riga 381,099
Kaliningrad 325,259
TOTAL 7,824,434
Source: www.baltictransportjournal.com

22
6.2 HISTORICAL DEVELOPMENT
In the 1990s, the Baltic ports witnessed a significant transition, mainly as a result of changes in the political environment. The BSR ports got embedded in the ever-changing economic and logistics systems and were confronted with changing port governance structures due to globalisation processes.
Through the expansion of the European Union to 27 member states, economic centres in East and Central Europe gained importance when compared to the traditional economic core of Europe. The increased participation of these regions in EU economic activities created opportunities for new transhipment centres and hinterland networks.
During the latter half of the 1990s, the ‘Europe – Far East trade route’ became the most important international trade route and the so-called China factor redirected focus of a number of ports and terminals towards the East. This implied a shift from the Atlantic Rim to the Suez Canal Route, thereby providing an opportunity for Baltic ports to participate in these trade flows.
At the same time, logistics service providers, shipping lines and terminal operators have gone through an unprecedented wave of consolidations. This has led to powerful global terminal networks, carrier groups, and third party logistics service providers to emerge. This process was further enhanced by vertical integration strategies of many market players contributing to the emergence of global carriers. As a result, European terminal operators and inland transport operators are increasingly dealing with large port clients that have more bargaining power than smaller ones.
On the other hand the European port system, including the Baltic ports, has been witnessing an inflow of global terminal operators since the mid-1990s. Global companies such as DP World from Dubai, PSA from Singapore and Hutchison Port Holdings from Hong Kong have entered the European container handling business. The entry of large terminal groups has been supported by the lowering of entry barriers as a consequence of more open and transparent procedures used by port authorities and government agencies in relation to the awarding of seaport concessions.

23
6.3 BSR CONTAINER DEMAND In the last few years container terminal development in the BSR has been characterised by
capacity growth. Subsequent to the global recession, the BSR experienced a strong recovery in 2010 which, as indicated in the graph overleaf, was followed by almost exceptional growth in 2011.
Russia plays a very important role in the development of the Baltic container trade. It provides
the main critical volume and size for the region and largely defines trends in Baltic container shipping. St Petersburg is Russia’s, as well as the Baltic’s, largest container port handling over 26% and 50% of all containerised cargo in the BSR and Russia respectively. The majority of Russian cargo is still transported as bulk cargo and therefore, there is a high containerisation potential for both Russia as well as the BSR.
From an EU perspective, member states are intensely promoting short-sea shipping in order to shift some volumes of cargo from motorways to the sea. The EU is therefore investing in the development of inland corridors, linking inland regions to more gateways to create more routing options and provide increased flexibility to shippers and logistic service providers.
The outlook for the BSR may be summarised as follows:
• Strong and sustained growth anticipated for the BSR to 2025;
• Increased number of direct calls and likely reduction in transhipment intensity;
• Increased competition for deep-water terminals by 2016;
• Terminals to become increasingly efficient with further services added to their offerings;
• Transit links to Central Europe will create opportunities and threats for BSR ports.
Volu
me
in T
EUs
8,000,000
7,000,000
6,000,000
5,000,000
4,000,000
3,000,000
2,000,000
1,000,000
0
Historical Baltic Container Demand(incl. Lithuania, Latvia, Estonia, Kaliningrad, St Petersburg, Poland and Finland)
2000 2001 2002 2003 2004 2005 2006 2007 2008 2009 2010 2011 2012

24
6.4 CONCLUSION
The above changes in the port environment have influenced the competitive perspective for container terminals in Europe, and in particular, have impacted the dynamic development of the Baltic ports and cargo flows. This has generated economic growth for the entire region and has increased the importance of the BSR amongst the global players in the sector. In the short term the market will continue to be served via transhipment in major European hubs. This scenario is expected to change in the medium to long term as direct calls of main line vessels to European ports, including Baltic ports, gradually increase partly displacing frequency of feeder vessels.

25
PART 2
7. COMPANY PERFORMANCE REVIEW
The projected financial statements detailed below relate to events in the future and are based on assumptions which the Company believes to be reasonable. Consequently, the actual outcome may be adversely affected by unforeseen situations and the variation between forecast and actual results may be material.
In November 2013, a corporate restructuring exercise took place pursuant to which 49,999 ordinary shares of €10 each share in the Company were transferred from Mariner Srl (a company registered in Italy with registration number 07839180630) to Mariner Capital Limited (a company registered in Malta with registration number C 11890), and the remaining 1 ordinary share (having a nominal value of €10) was transferred from HCL Holdings Limited (a company registered in Malta with registration number C 15213) to Mr Marin Hili. A further corporate restructuring exercise was carried out in April 2014, whereby the Issuer became the parent company of the Mariner Group as set out in section 3.1 under the heading “Organisational structure”. Accordingly, the financial information below for the year ended 31 December 2013 is being presented on a pro forma consolidated basis to reflect the above restructuring process.
7.1 FINANCIAL INFORMATION
The following financial information is extracted from the pro forma consolidated financial statements of Mariner Finance p.l.c. (the “Company”) for the year ended 31 December 2013. The financial information for the years ending 31 December 2014 and 31 December 2015 has been provided by the Company.
Income Statement FY2015 FY2014 FY2013(€’000) Projection Forecast Pro forma
BCT 18,581 17,608 17,648EQR 451 419 375 Revenue 19,031 18,027 18,023Operating expenses (9,561) (9,179) (9,234) EBITDA 9,470 8,848 8,789Depreciation and amortisation (1,911) (1,771) (1,574)Net interest expense (1,737) (1,525) (143) Profit before tax 5,822 5,552 7,072Taxation (779) (678) (259) Profit for the year 5,043 4,874 6,813
26
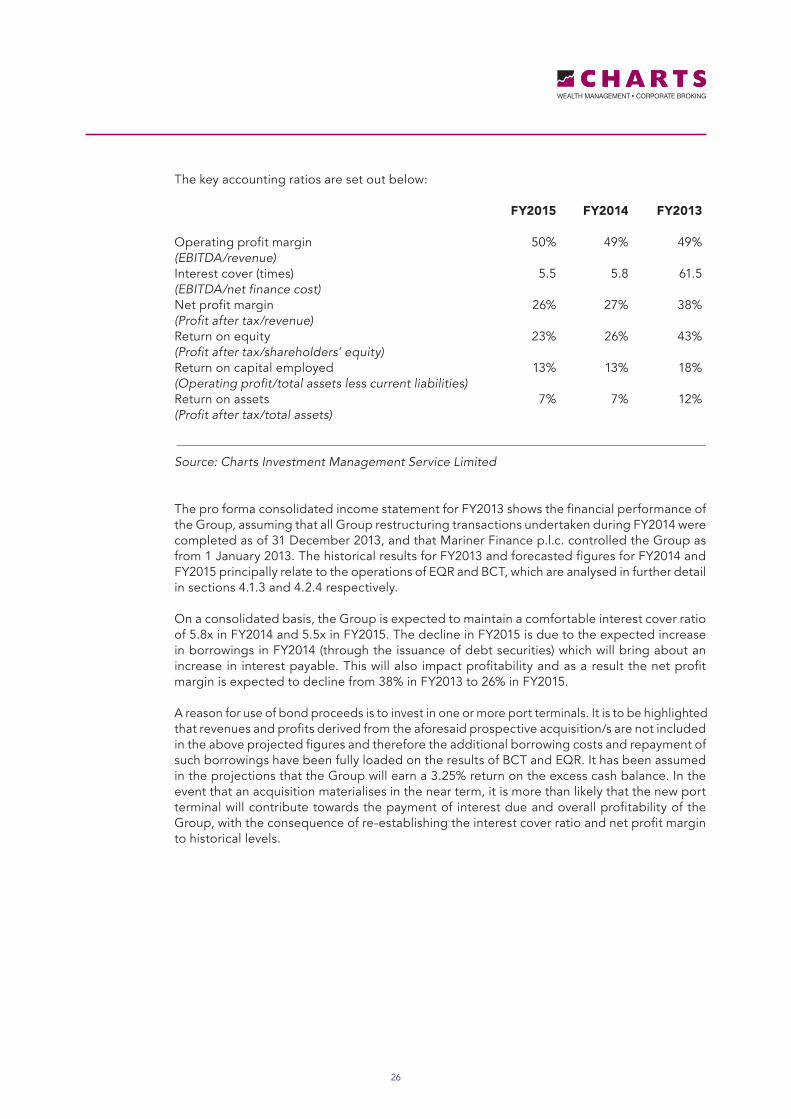
The key accounting ratios are set out below:
FY2015 FY2014 FY2013
Operating profit margin 50% 49% 49% (EBITDA/revenue) Interest cover (times) 5.5 5.8 61.5 (EBITDA/net finance cost) Net profit margin 26% 27% 38% (Profit after tax/revenue) Return on equity 23% 26% 43% (Profit after tax/shareholders’ equity) Return on capital employed 13% 13% 18% (Operating profit/total assets less current liabilities) Return on assets 7% 7% 12% (Profit after tax/total assets)
Source: Charts Investment Management Service Limited
The pro forma consolidated income statement for FY2013 shows the financial performance of the Group, assuming that all Group restructuring transactions undertaken during FY2014 were completed as of 31 December 2013, and that Mariner Finance p.l.c. controlled the Group as from 1 January 2013. The historical results for FY2013 and forecasted figures for FY2014 and FY2015 principally relate to the operations of EQR and BCT, which are analysed in further detail in sections 4.1.3 and 4.2.4 respectively.
On a consolidated basis, the Group is expected to maintain a comfortable interest cover ratio of 5.8x in FY2014 and 5.5x in FY2015. The decline in FY2015 is due to the expected increase in borrowings in FY2014 (through the issuance of debt securities) which will bring about an increase in interest payable. This will also impact profitability and as a result the net profit margin is expected to decline from 38% in FY2013 to 26% in FY2015.
A reason for use of bond proceeds is to invest in one or more port terminals. It is to be highlighted that revenues and profits derived from the aforesaid prospective acquisition/s are not included in the above projected figures and therefore the additional borrowing costs and repayment of such borrowings have been fully loaded on the results of BCT and EQR. It has been assumed in the projections that the Group will earn a 3.25% return on the excess cash balance. In the event that an acquisition materialises in the near term, it is more than likely that the new port terminal will contribute towards the payment of interest due and overall profitability of the Group, with the consequence of re-establishing the interest cover ratio and net profit margin to historical levels.

27
Cash Flows Statement FY2015 FY2014 FY2013(€’000) Projection Forecast Pro forma
Cash flows from operating activiities 9,796 8,328 7,560Cash flows from investing activities (3,133) (3,907) (29,905)Cash flows from financing activities (5,622) 12,523 18,816 Net movement in cash and cash equivalents 1,041 16,944 (3,529)Opening cash balance 18,101 1,157 4,686 Closing cash balance 19,142 18,101 1,157
Net cash flows from operating activities principally relate to the operations of BCT and EQR, which are analysed in further detail in sections 4.1.3 and 4.2.4 respectively.
In FY2013, cash used in investing activities included an investment in subsidiary entities
which was funded through bank borrowings (in financing activities). Other investing activities comprise the acquisition of tangible assets at BCT, which in the financial years 2013 to 2015 is estimated to amount to €10.9 million.
As to financing activities, the Group withdrew in FY2013 €26 million from a loan facility to fund the aforesaid investment in subsidiary entities. The proceeds from the bond issue of €35 million have been included in the forecast of FY2014 against a repayment of bank loans of €20 million. A further €2 million is expected to be utilised in FY2015 for the repayment of bank loans. Aggregate net interest paid in the years FY2013 to FY2015 is expected to amount to €3.4 million, and the Group plans to pay €4.9 million in dividends in the period under review.
Statement of financial position 31 Dec‘15 31 Dec‘14 31 Dec‘13(€’000) Projection Forecast Pro forma
ASSETSNon-current assetsGoodwill 13,185 13,185 13,185Intangible assets 629 283 362Property, plant and equipment 27,081 25,696 26,350 Investment property 5,184 5,183 5,184Other tangible assets 6,910 7,418 4,548Other non-current assets 320 327 301 Total non-current assets 53,309 52,092 49,930
Current assetsInventory 387 387 387Trade and other receivables 2,360 3,640 2,902 Taxation - - 767 Cash and cash equivalents 19,142 18,101 1,157 Total current assets 21,889 22,128 5,213 Total assets 75,198 74,220 55,143
28
Statement of financial position (cont.) 31 Dec‘15 31 Dec‘14 31 Dec‘13(€’000) Projection Forecast Pro forma
EQUITY AND LIABILITIESEquity 22,012 18,769 15,695
LIABILITIESNon-current liabilitiesLoans from credit institutions 10,940 12,941 30,606Bonds 35,000 35,000 -Related party balances 1,837 1,927 2,017Other creditors - 227 551Deferred tax liability 548 548 548 Total non-current liabilities 48,326 50,643 33,722 Current liabilitiesLoans from credit institutions 2,001 2,001 4,333 Trade and other payables 2,081 2,130 1,219Taxation 778 677 174 Total current liabilities 4,860 4,808 5,726 Total liabilities 53,186 55,451 39,448 Total equity and liabilities 75,198 74,220 55,143
Goodwill represents goodwill on acquisition of BCT and EQR, and results from the excess consideration paid over the fair value of the net assets and liabilities.
All assets included in the balance sheet, other than investment property and financial instruments, are assets held by BCT, which are analysed in further detail in section 4.2.8. Investment property comprises EQR’s property in Riga Latvia, the value of which corresponds to the value estimated by a third party expert pursuant to a valuation exercise undertaken in February 2014. Financial instruments includes available-for-sale investments held by Mariner Finance p.l.c. (FY2013: €281,000) and derivative financial instruments held by MFB (FY2013: €32,000).
The key accounting ratios are set out below:
FY2015 FY2014 FY2013 Gearing ratio (%) 57 63 68(Net debt/net debt + shareholders’ equity)Liquidity ratio (times) 4.50 4.60 0.91(Current assets/current liabilities)
Source: Charts Investment Management Service Limited

29
The gearing ratio (net debt/net debt + equity) demonstrates the degree to which the capital employed in a business is funded by external borrowings as compared to shareholders’ funds. A company with high leverage tends to be more vulnerable when its business goes through a slowdown. At a leverage of 68% in FY2013, the Company’s capital is funded to a higher degree from external debt as opposed to shareholders’ funds. The Directors believe that the high leverage is appropriate for the Group in view of the substantial cash flows generated by BCT. As detailed in section 4.2.7 above, BCT has registered healthy operating profits in the past ten years, even during the economic crisis in FY2009, and is expected to continue generating substantial profits in the foreseeable future. Furthermore, BCT’s cash flows are expected to be supplemented in the near term by positive earnings from prospective new acquisitions.
Other than equity, the Group is principally financed through bank loans and corporate bonds, analysed as follows:
Mariner Group Borrowings & Bonds 31 Dec‘15 31 Dec‘14 31 Dec‘13(€’000) Projection Forecast Pro forma
Loans from credit institutions 12,941 14,942 34,939Bonds 35,000 35,000 - Total debt 47,941 49,942 34,939
In FY2013, the Group had outstanding bank borrowings due by MFB of €34.88 million. The loan agreement was entered into on 29 April 2013 for an aggregate amount of €40 million. The funds were primarily utilised to acquire BCT from Mariner Srl, to purchase a container crane and the real estate property at the Riga terminal. Security for the obligations was provided by BCT and Mariner Capital Limited (the parent company of Mariner Finance p.l.c.). In addition to the aforesaid bank borrowings, EQR had an outstanding bank loan of €0.06 million as at FY2013 which will be settled during FY2014.

30
PART 3
8. COMPARABLES
The table below compares the Company and its proposed bond issues to other debt issuers listed on the Malta Stock Exchange and their respective debt securities. The list includes all issuers (excluding financial institutions) that have listed bonds maturing in the medium term (within six to ten years), similar to the duration of the Company’s bonds. Although there are significant variances between the activities of the Company and other issuers (including different industries, principal markets, competition, capital requirements etc) and material differences between the risks associated with the Company’s business and that of the Issuers, the comparative analysis provides an indication of the financial performance and strength of the Company.
Comparative Analysis Nominal Yield to Interest Total Net Asset Gearing Value Maturity Cover Assets Value Ratio (€’000) (%) (times) (€’million) (€’million) (%)
7.0% GH Marina plc 2017/20 11,664 5.76 0.72 56.79 23.39 50 6.8% Premier Cap. plc 2017/20 24,656 5.52 3.38 69.58 16.17 67 6.0% S. Farsons Cisk plc 2017/20 15,000 5.02 8.59 151.53 91.93 24 6.6% Eden Finance plc 2017/20 14,133 5.99 3.01 100.23 43.69 46 6.2% Tumas Investments plc 2017/20 25,000 5.10 3.74 286.00 93.60 55 4.9% Gasan Finance plc 2019/21 25,000 4.66 3.88 185.58 78.01 40 6.0% Corinthia Fin. plc 2019/22 7,500 5.36 2.09 1,299.87 677.82 39 6.0% Medserv plc 2020/23 20,000 5.56 3.38 22.46 8.16 49 5.5% Pendergardens Dev plc 2020 15,000 5.50 n/a 18.74 3.27 53 6.0% Pendergardens Dev plc 2022 27,000 6.00 n/a 18.74 3.27 53 5.8% IHI plc 2023 10,000 5.27 2.54 1,092.67 626.49 33 6.0% AXI plc 2024 40,000 5.58 2.89 157.01 88.03 54 5.3% Mariner Finance plc 2024 35,000 5.30 61.5 55.1 15.7 68
14 May 2014
Source: Malta Stock Exchange, Charts Investment Management Service Limited Annual Accounts: For the year ended 31 December 2013, except for Simonds Farsons
Cisk plc (YE 31/01/13), Grand Harbour Marina plc (YE 31/12/12),Tumas Investments plc (YE 31/12/2012), Gasan Finance plc (YE 31/12/2012) and AX Investments plc (YE 31/10/2013).
The interest cover ratio determines the ability of a company to pay interest on its outstanding borrowings. For the financial year ending 31 December 2014 (post-bond issue), the Group’s earnings before depreciation, interest and taxes is expected to be 5.8 times higher than interest expenses for the year. This indicates that the Group is generating significantly higher earnings to service its outstanding and future debt.
The debt to equity ratio or gearing ratio demonstrates the degree to which the capital employed in a business is funded by external borrowings as compared to shareholders’ funds. A company with high leverage tends to be more vulnerable when its business goes through a slowdown. At a gearing ratio of 68%, the Group’s external net debt is approximately double its shareholders’ funds. Although this ratio is on the high side when compared to the gearing level of other listed issuers, it is observed that the Group generates substantial cash flows from BCT to service interest payments (FY2014: interest cover of 5.8 times). The Directors believe that, based on the current operations of BCT and future expectations, the current leverage is adequate for the business activities of the Group.
31
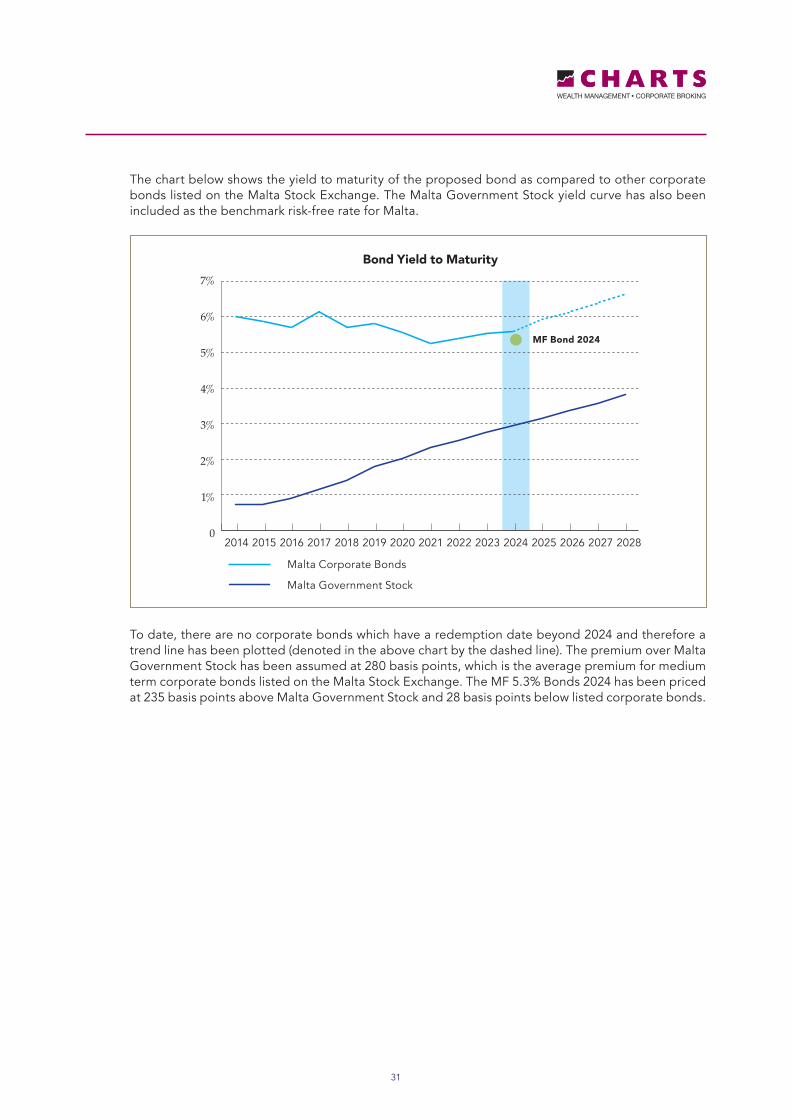
The chart below shows the yield to maturity of the proposed bond as compared to other corporate bonds listed on the Malta Stock Exchange. The Malta Government Stock yield curve has also been included as the benchmark risk-free rate for Malta.
To date, there are no corporate bonds which have a redemption date beyond 2024 and therefore a trend line has been plotted (denoted in the above chart by the dashed line). The premium over Malta Government Stock has been assumed at 280 basis points, which is the average premium for medium term corporate bonds listed on the Malta Stock Exchange. The MF 5.3% Bonds 2024 has been priced at 235 basis points above Malta Government Stock and 28 basis points below listed corporate bonds.
2014 2015 2016 2017 2018 2019 2020 2021 2022 2023 2024 2025 2026 2027 2028
7%
6%
5%
4%
3%
2%
1%
0
Bond Yield to Maturity
Malta Corporate Bonds
Malta Government Stock
MF Bond 2024
32
PART 4
9. EXPLANATORY DEFINITIONS
Income Statement
Revenue Total revenue generated by the Group from its business activities during the financial year, that is, the operations of BCT and EQR .
Operating expenses Operating expenses include the cost of terminal operations and management expenses in maintaining the investment property of EQR.
EBITDA EBITDA is an abbreviation for earnings before interest, tax, depreciation and amortisation. EBITDA can be used to analyse and compare profitability between companies and industries because it eliminates the effects of financing and accounting decisions.
Profit after tax Profit after tax is the profit made by the Group during the financial year both from its operating as well as non-operating activities.
Profitability RatiosOperating profit margin Operating profit margin is operating income or EBITDA as
a percentage of total revenue.
Net profit margin Net profit margin is profit after tax achieved during the financial year expressed as a percentage of total revenue.
Efficiency RatiosReturn on equity Return on equity (ROE) measures the rate of return on the
shareholders’ equity of the owners of issued share capital, computed by dividing profit after tax by shareholders’ equity.
Return on capital employed Return on capital employed (ROCE) indicates the efficiency and profitability of a company’s capital investments, estimated by dividing operating profit by capital employed.
Return on Assets Return on assets (ROA) is computed by dividing profit after tax by total assets.
Equity RatiosEarnings per share Earnings per share (EPS) is the amount of earnings per
outstanding share of a company’s share capital. It is computed by dividing net income available to equity shareholders by total shares outstanding as at balance sheet date.
Cash Flow StatementCash flow from operating activities Cash generated from the principal revenue-producing
activities of the Company.
Cash flow from investing activities Cash generated from the activities dealing with the acquisition and disposal of long-term assets and other investments of the Company.
Cash flow from financing activities Cash generated from the activities that result in change in share capital and borrowings of the Company.

33
Balance SheetNon-current assets Non-current asset are the Group’s long-term investments,
which full value will not be realised within the accounting year. Non-current assets are capitalised rather than expensed, meaning that the Group allocates the cost of the asset over the number of years for which the asset will be in use, instead of allocating the entire cost to the accounting year in which the asset was purchased. Such assets include intangible assets (goodwill on acquisition), investment properties, and property, plant & equipment.
Current assets Current assets are all assets of the Company, which are realisable within one year from the balance sheet date. Such amounts include inventory, accounts receivable, cash and bank balances.
Current liabilities All liabilities payable by the Company within a period of one year from the balance sheet date, and include accounts payable and short-term debt.
Net debt Borrowings before unamortised issue costs less cash and cash equivalents.
Non-current liabilities The Company’s long-term financial obligations that are not due within the present accounting year. The Company’s non-current liabilities include bank borrowings and bonds.
Total equity Total equity includes share capital, reserves & other equity components, and retained earnings.
Financial Strength Ratios
Liquidity ratio The liquidity ratio (also known as current ratio) is a financial ratio that measures whether or not a company has enough resources to pay its debts over the next 12 months. It compares a company’s current assets to its current liabilities.
Interest cover The interest coverage ratio is calculated by dividing a company’s operating profit of one period by the company’s interest expense of the same period.
Gearing ratio The gearing ratio indicates the relative proportion of shareholders’ equity and debt used to finance a company’s assets, and is calculated by dividing a company’s net debt by net debt plus shareholders’ equity.


![Financial Results Summary for the 1st Quarter of 2020...2020/08/07 · Financial Results Summary for the 1stQuarter of 2020 Ended In June 30, 2020 [Unofficial translation] I.OurresponsestoCOVID-19①](https://static.fdocuments.net/doc/165x107/5fc47f809384b32eee3169e3/financial-results-summary-for-the-1st-quarter-of-2020-20200807-financial.jpg)


