
Financial analysis of pakistan oil field limited By M. Taha Uddin Khan Ghori
14
FINANCIAL ANALYSIS OF PAKISTAN OIL-FIELD LIMITED BY: M. TAHA UDDIN KHAN GHORI
-
Upload
taha-ghori -
Category
Business
-
view
94 -
download
0
Transcript of Financial analysis of pakistan oil field limited By M. Taha Uddin Khan Ghori
FINANCIAL ANALYSIS OF PAKISTAN OIL-FIELD
LIMITED
BY: M. TAHA UDDIN KHAN GHORI
COMPANY OVERVIEW
POL is the symbol of Pakistan Oilfield Limited in KSE-100.
POL was incorporated in November 25, 1950. POL is a
leading oil and gas exploration and production company.
Its revenue have stood Rs. 28,624 million in 2012. Its
earning price have increased to Rs. 50.1 in 2012.
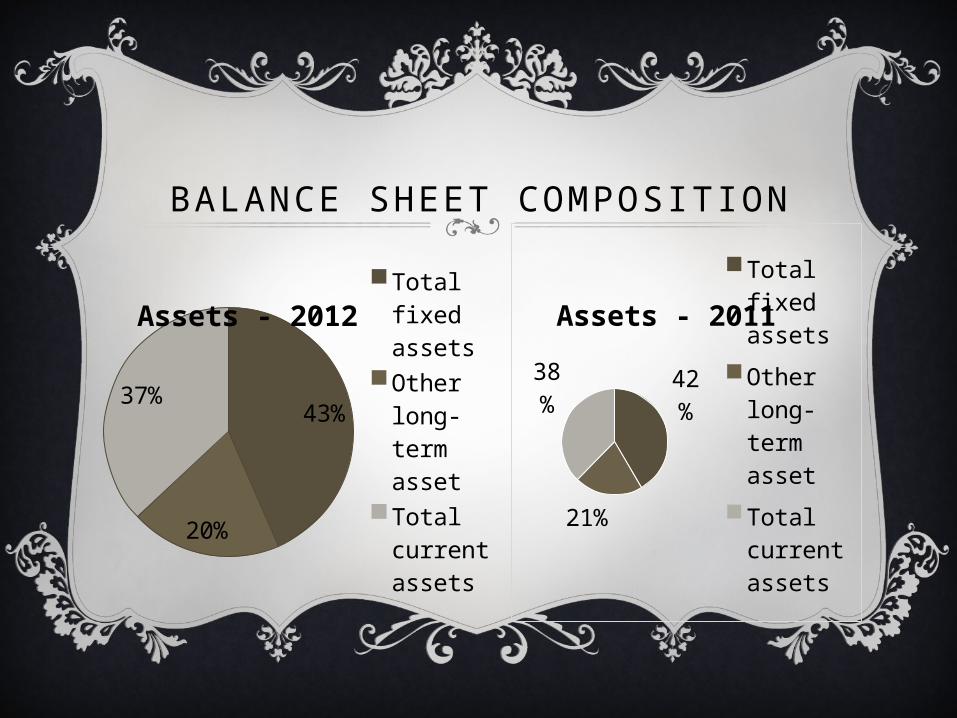
BALANCE SHEET COMPOSITION
43%
20%
37%
Assets - 2012Total fixed assets
Other long-term asset
Total current assets
42%
21%
38%
Assets - 2011Total fixed assets
Other long-term asset
Total current assets
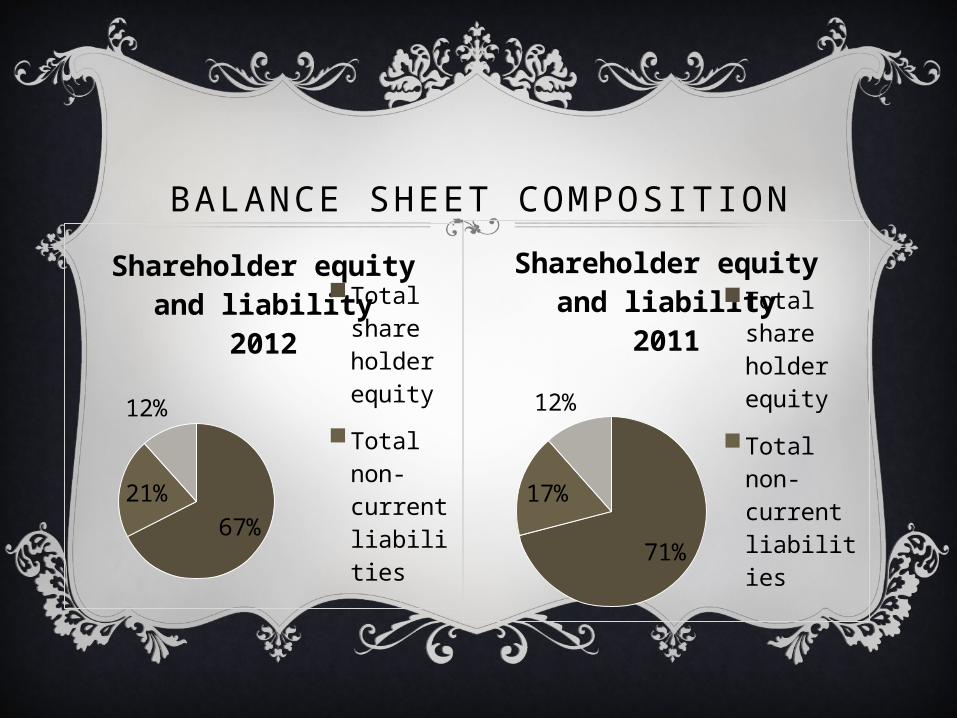
BALANCE SHEET COMPOSITION
67%
21%
12%
Shareholder equity and liability
2012
Total share holder equity
Total non-current liabili-tiesTotal current liabilty
71%
17%
12%
Shareholder equity and liability
2011Total share holder equity
Total non-current liabili-tiesTotal current liabilty

HORIZONTAL ANALYSIS BALANCE SHEET (Note Rupees (‘000)) 2012 2011 Difference
change in %
SHARE CAPITAL AND RESERVES
Issued, subscribed and paid up capital 2,365,459 2,365,459 0 0%
Revenue reserves 32,847,810 31,048,217 1,799,593 5.80%
Fair value gain on available-for-sale investments
57,973 9,412 48,561 515.95%
Total Share Holder Equity 35,271,242 33,423,088 1,848,154 5.53%
NON CURRENT LIABILITIES
Long term deposits 504,448 487,314 17,134 3.52%
Deferred liabilities 10,504,449 7,710,102 2,794,347 36.24%
Total noncurrent liabilities 11,008,897 8,197,416 2,811,481 34.30%
CURRENT LIABILITIES AND PROVISIONS
Trade and other payables 4,465,713 4,045,039 420,674 10.40%
Provision for income tax 1,593,673 1,373,662 220,011 16.02%
Total current liabilities 6,059,386 5,418,701 640,685 11.82%
Total liability 17068283 13616117 3,452,166 25.35%
TOTAL SHARE CAPITAL AND LIABILITIES
52,339,525 47,039,205 5,300,320 11.27%
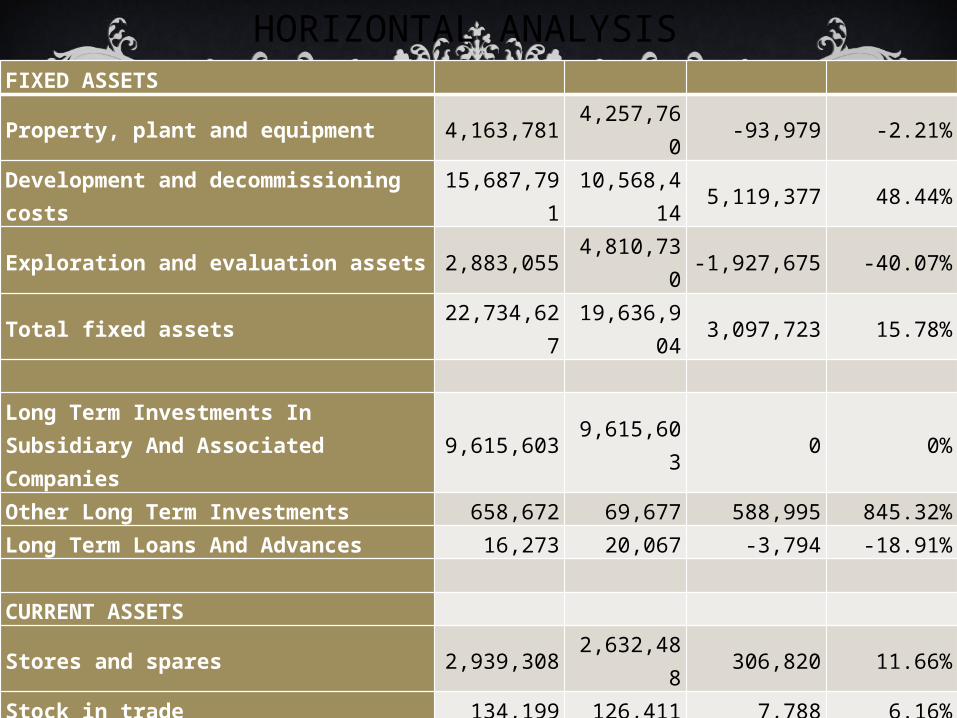
FIXED ASSETS Property, plant and equipment 4,163,781 4,257,760 -93,979 -2.21%Development and decommissioning costs
15,687,791
10,568,414
5,119,377 48.44%
Exploration and evaluation assets 2,883,055 4,810,730 -1,927,675 -40.07%
Total fixed assets22,734,62
719,636,90
43,097,723 15.78%
Long Term Investments In Subsidiary And Associated Companies
9,615,603 9,615,603 0 0%
Other Long Term Investments 658,672 69,677 588,995 845.32%Long Term Loans And Advances 16,273 20,067 -3,794 -18.91% CURRENT ASSETS Stores and spares 2,939,308 2,632,488 306,820 11.66%Stock in trade 134,199 126,411 7,788 6.16%Trade debts 3,006,567 4,343,528 -1,336,961 -30.78%Advances, deposits, prepayments and other receivables
601,966 662,879 -60,913 -9.19%
Short term investments 3,898,907 3,226,550 672,357 20.84%Cash and bank balances 8,733,403 6,705,098 2,028,305 30.25%
Total current assets19,314,35
017,696,95
41,617,396 9.14%
TOTAL ASSETS52,339,52
547,039,20
55,300,320 11.27%
HORIZONTAL ANALYSIS
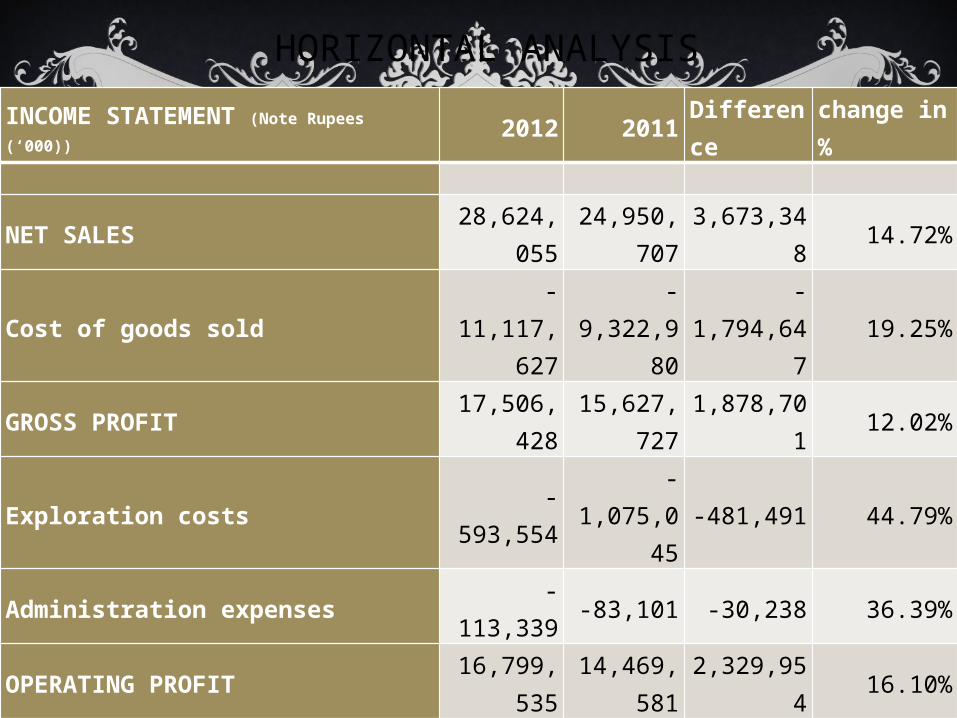
INCOME STATEMENT (Note Rupees
(‘000))2012 2011
Difference
change in %
NET SALES 28,624,0
5524,950,7
073,673,34
814.72%
Cost of goods sold-
11,117,627
-9,322,98
0
-1,794,64
719.25%
GROSS PROFIT 17,506,4
2815,627,7
271,878,70
112.02%
Exploration costs -593,554-
1,075,045
-481,491 44.79%
Administration expenses -113,339 -83,101 -30,238 36.39%
OPERATING PROFIT16,799,5
3514,469,5
812,329,95
416.10%
Other charges -
1,286,588
-1,104,23
7-182,351 16.51%
Other operating income 2,547,20
71,808,59
6738,611 40.84%
EBIT18,060,1
5415,173,9
402,886,21
419.02%
Finance cost -684,576 -223,930 -460,646 205.71%
PROFIT BEFORE TAXATION 17,375,5
7814,950,0
102,425,56
816.22%
Provision for taxation -
5,522,783
-4,135,00
0
-1,387,78
333.56%
NET INCOME11,852,7
9510,815,0
101,037,78
59.60%
HORIZONTAL ANALYSIS
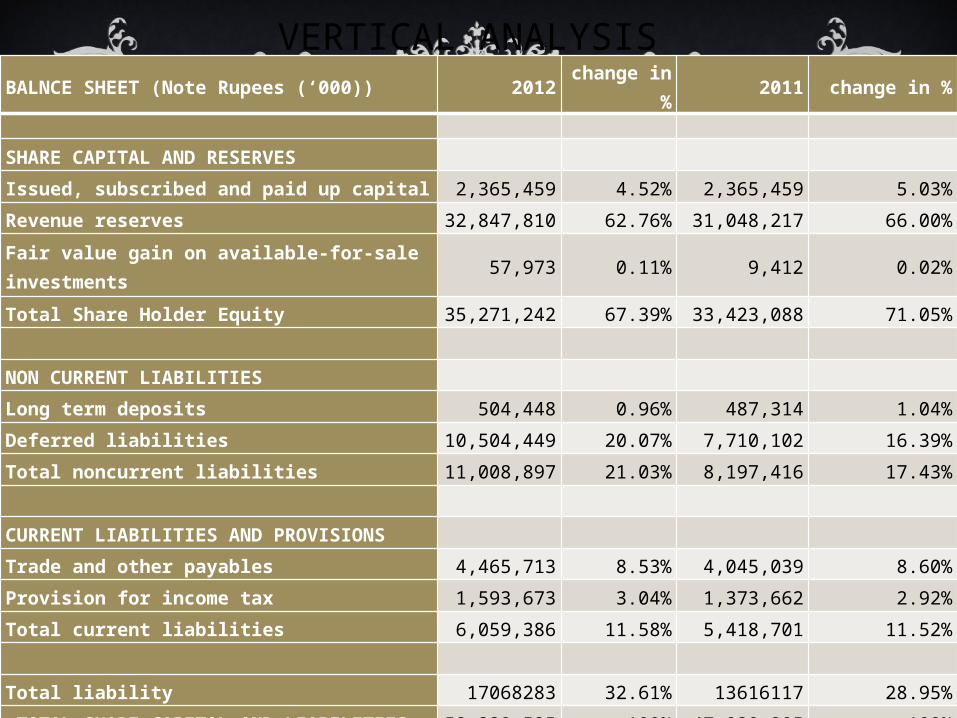
BALNCE SHEET (Note Rupees (‘000)) 2012change in
%2011 change in %
SHARE CAPITAL AND RESERVES
Issued, subscribed and paid up capital 2,365,459 4.52% 2,365,459 5.03%
Revenue reserves 32,847,810 62.76% 31,048,217 66.00%
Fair value gain on available-for-sale investments
57,973 0.11% 9,412 0.02%
Total Share Holder Equity 35,271,242 67.39% 33,423,088 71.05%
NON CURRENT LIABILITIES
Long term deposits 504,448 0.96% 487,314 1.04%
Deferred liabilities 10,504,449 20.07% 7,710,102 16.39%
Total noncurrent liabilities 11,008,897 21.03% 8,197,416 17.43%
CURRENT LIABILITIES AND PROVISIONS
Trade and other payables 4,465,713 8.53% 4,045,039 8.60%
Provision for income tax 1,593,673 3.04% 1,373,662 2.92%
Total current liabilities 6,059,386 11.58% 5,418,701 11.52%
Total liability 17068283 32.61% 13616117 28.95%
TOTAL SHARE CAPITAL AND LIABILITIES
52,339,525 100% 47,039,205 100%
VERTICAL ANALYSIS
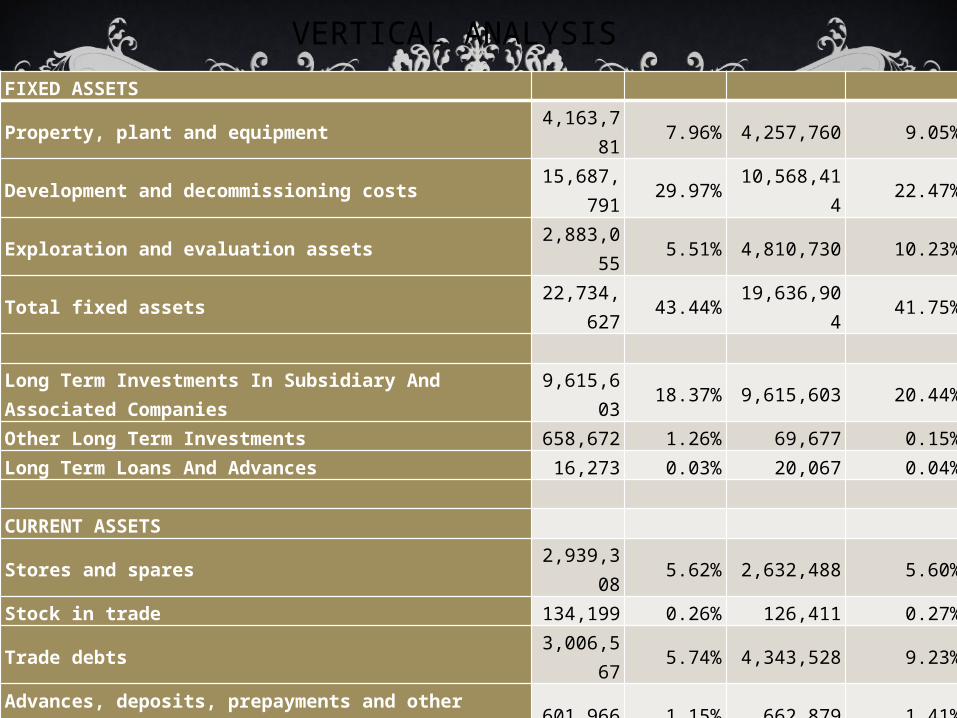
FIXED ASSETS
Property, plant and equipment 4,163,78
17.96% 4,257,760 9.05%
Development and decommissioning costs 15,687,7
9129.97% 10,568,414 22.47%
Exploration and evaluation assets 2,883,05
55.51% 4,810,730 10.23%
Total fixed assets22,734,6
2743.44% 19,636,904 41.75%
Long Term Investments In Subsidiary And Associated Companies
9,615,603
18.37% 9,615,603 20.44%
Other Long Term Investments 658,672 1.26% 69,677 0.15%Long Term Loans And Advances 16,273 0.03% 20,067 0.04% CURRENT ASSETS
Stores and spares 2,939,30
85.62% 2,632,488 5.60%
Stock in trade 134,199 0.26% 126,411 0.27%
Trade debts 3,006,56
75.74% 4,343,528 9.23%
Advances, deposits, prepayments and other receivables
601,966 1.15% 662,879 1.41%
Short term investments 3,898,90
77.45% 3,226,550 6.86%
Cash and bank balances 8,733,40
316.69% 6,705,098 14.25%
Total current assets19,314,3
5036.90% 17,696,954 37.62%
TOTAL ASSETS52,339,5
25100% 47,039,205 100%
VERTICAL ANALYSIS

INCOME STATEMENT (Note Rupees (‘000))
2012 change% 2011 change%
NET SALES 28,624,055
100.00% 24,950,707
100.00%
Cost of goods sold -11,117,62
7
-38.84% -9,322,980
-37.37%
GROSS PROFIT 17,506,428
61.16% 15,627,727
62.63%
Exploration costs -593,554 -2.07% -1,075,045
-4.31%
Administration expenses -113,339 -0.40% -83,101 -0.33%
OPERATING PROFIT 16,799,535
58.69% 14,469,581
57.99%
Other charges -1,286,588 -4.49% -1,104,237
-4.43%
Other operating income 2,547,207 8.90% 1,808,596 7.25%
EBIT 18,060,154
63.09% 2,886,214 11.57%
Finance cost -684,576 -2.39% -223,930 -0.90%
PROFIT BEFORE TAXATION 17,375,578
60.70% 14,950,010
59.92%
Provision for taxation -5,522,783 -19.29% -4,135,000
-16.57%
NET INCOME 11,852,795
41.41% 10,815,010
43%
VERTICAL ANALYSIS

Liquidity Ratio 2012 2011
Current Ratio (times) 3.19 3.27
Working Capital 13,254,964,000 12,278,253,000
Quick Ratio (times) 4.01 3.87
Cash Ratio (times) 3.52 3.07
Profitability Ratio
Return on assets (%) 22.65% 22.99%
Operating income margin (%) 58.69% 57.99%
Gross profit margin (%) 61.16% 62.63%
Return on equity (%) 33.60% 32.36%
Solvency Ratio
Operating cash flow to total debt (%) 89.45% 91.27%
Debt of total assets (%) 32.61% 28.95%
Debt to equity (%) 48.39% 40.74%
RATIOS
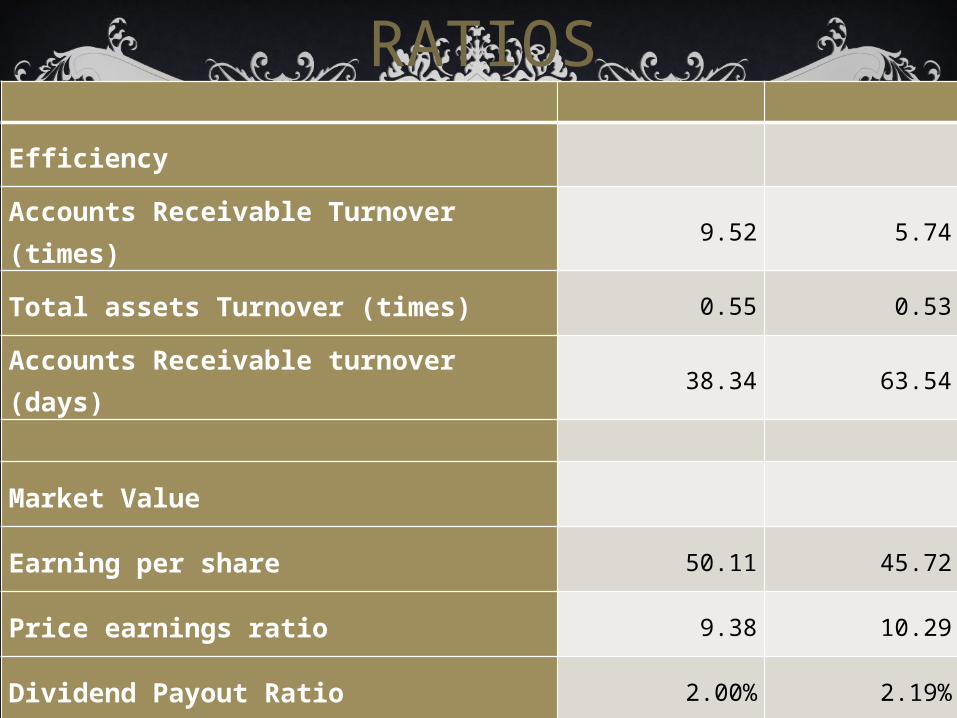
Efficiency
Accounts Receivable Turnover (times)
9.52 5.74
Total assets Turnover (times) 0.55 0.53
Accounts Receivable turnover (days)
38.34 63.54
Market Value
Earning per share 50.11 45.72
Price earnings ratio 9.38 10.29
Dividend Payout Ratio 2.00% 2.19%
RATIOS
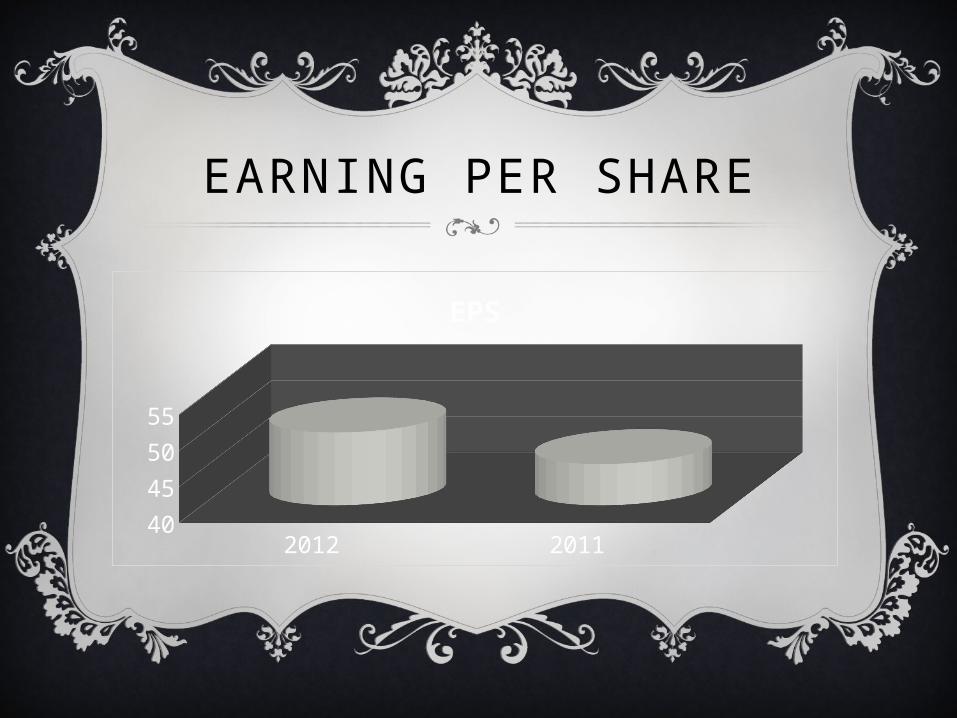
EARNING PER SHARE
2012 201140
45
50
55
EPS