Financial analysis of Hero Motorcorp'13 ppt
52
Hero MotorCor p Financia l Statemen t Analysis
-
Upload
sakshi-garg -
Category
Economy & Finance
-
view
1.609 -
download
2
Transcript of Financial analysis of Hero Motorcorp'13 ppt

Hero MotorCorp
Financial Statement
Analysis’13

INTRODUCTION•Hero Motors Ltd. is the world's largest manufacturer of two wheelers, based in India.• The company was a joint venture between India's Hero Group and Honda Motor Company, Japan that began in 1984 later in 2011 it turn into Hero Motors Limited.•In 2001, the company achieved the coveted position of being the largest two-wheeler manufacturing company in India and the “World No.1” two-wheeler company in terms of unit volume sales in a calendar year by a single company. Hero has retained that coveted position till date.• Today, every second motorcycle sold in the country is a Hero Honda bike. Every 30 seconds, someone in India buys Hero splendor which is India’s selling motor cycle.

VISIONThe story of Hero Honda began with a simple vision – that of a mobile and empowered India, powered by its bikes. The Company’s new identity – Hero MotoCorp Ltd. – reflects its commitment towards providing sturdy and solid world-class mobility solutions with a renewed focus on steadily moving ahead and expanding the footprint in the global arena.
MISSION
Hero MotoCorp’s mission is to become a global enterprise fulfilling its customers’ needs and aspirations for mobility, solidity and sturdiness.
The company aims to set benchmarks in technology, style and quality to convert its customers into brand advocates. The company provides an engaging environment for its people to perform to their true potential. It aims to continue its focus on value creation and enduring relationships with its partners.

MANUFACTURING
Hero motocorp two wheelers are manufactured across 3 globally benchmarked manufacturing facilities. Two of these are based at Gurgaon and Dharuhera which are located in the state of Haryana in northern India. The third and the latest manufacturing plant is based at Haridwar, in the hill state of Uttrakhand. The combined annual installed capacity is approx. 6.90 million units.
DISTRIBUTION
The Company's growth in the two wheeler market in India is the result of an intrinsic ability to increase reach in new geographies and growth markets. Hero motocorp’s extensive sales and service network now spans over to 6000 customer touch points. These comprise a mix of authorized dealerships, service & spare parts outlets and dealer-appointed outlets across the country.

TREND ANALYSISAn aspect of technical analysis that
tries to predict the future movement based on past data.

Based On Overall Performance
2013
2012
2011
2010
2009
1.00 3.00 5.00 7.00 9.00 11.00 13.002013 2012 2011 2010 2009
Return on as-sets(%)
2.50641747003883
2.42129575322684
1.81494862039752
1.88886894307112
1.38302766935898
Return on eq-uity(%)
4.82717568474541
5.5815731625729
6.66021663971636
4.64614922857588
3.30592646188252
Return on in-vested capital
4.41713261085329
4.3161940196269
4.18898964667632
4.36088718415465
3.11607213713197

2013 2012 2011 2010 2009
Gross Profit Mar-gin(%)
0.0831409537499985
0.0950286204785479
0.0850748751565931
0.133010104477293
0.0946608196504643
0.01
0.03
0.05
0.07
0.09
0.11
0.13
Gross Profit Margin(%)
Axis Title
Based On Profitability Ratio

2013 2012 2011 2010 2009
Net profit mar-gin/Return on sale(%)
0.948623365591343
0.956839902749519
0.868752148383291
0.959377093180968
0.927779406324559
0.830.850.870.890.910.930.950.97
Net Profit Margin/Return On Sale(%)
Axis Title

2013
2012
2011
2010
2009
10.00 30.00 50.00 70.00 90.00 110.00 130.002013 2012 2011 2010 2009
Earnings per share 106.1 119.1 96.5 111.8 64.8
Earnings Per Share

2013
2012
2011
2010
2009
0.50 1.50 2.50 3.50 4.50 5.50 6.50 7.50 8.502013 2012 2011 2010 2009
Asset turnover(times)
2.64216290780105
2.53051293771211
2.08914432473642
1.9688493257727
1.49068588926533
Invested Capital turnover
4.65636075503978
4.51088422130407
4.82184666187228
4.54554024184111
3.35863473137053
Equity turnover
5.08861141295664
5.83334071513326
7.66641746107993
4.8428811377712
3.56326777609683
Equity , Invested Capital & Asset Turnover
Based On Investment Utilization

2013
2012
2011
2010
2009
0.10 0.30 0.50 0.70 0.90 1.10 1.302013 2012 2011 2010 2009
Current Ratio
1.21745374854939
1.11275521485959
0.244854550632654
0.596633280967663
0.493706218762483
Acid test Ratio(Quick Ratio)
0.0434077896170409
0.0176945898135182
0.0116392041987062
0.394752256587621
0.106960181603843
Current Ratio & Quick Ratio

2013 2012 2011 2010 2009
13.4714.36 13.94
10.488.98
Capital IntensityCapital Intensity
Based On Investment Utilization

2013 2012 2011 2010 2009
2.28
0.58
0.83
1.74
0.44
Days CashDays Cash

2013 2012 2011 2010 2009
9.12
9.85
8.45
9.49
8.81
Days InventoryDays Inventory

2013 2012 2011 2010 2009
9.53
3.97
2.10 2.36
4.04
Days ReceivableDays receivable
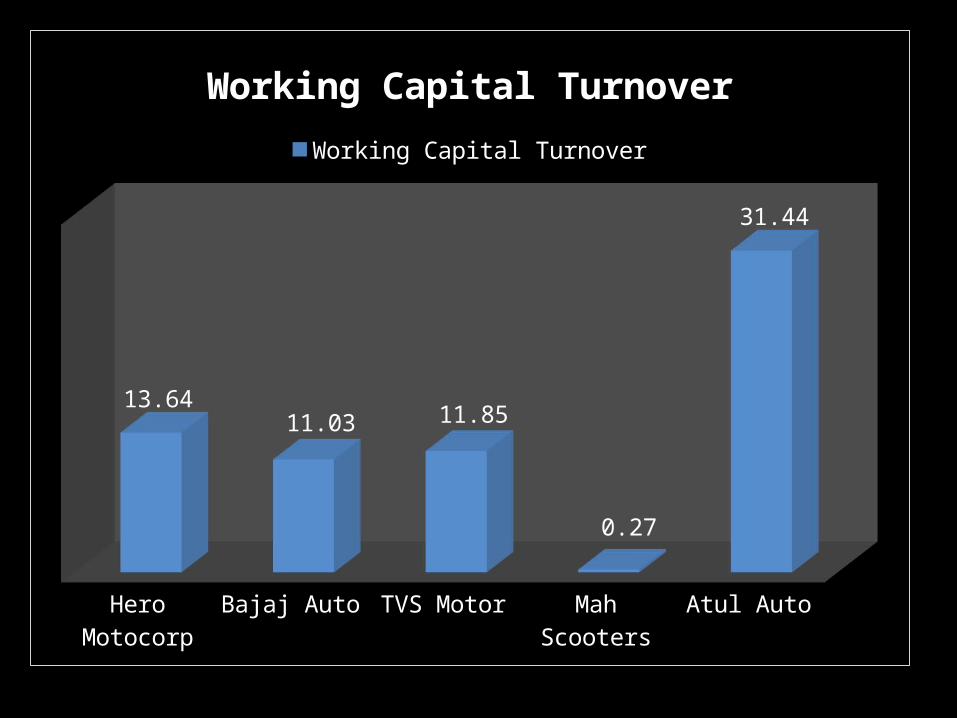
2013 2012 2011 2010 2009
40.01
37.04
43.17
38.45
41.44
Inventory TurnoverInventory Turnover

2013 2012 2011 2010 2009
Work-ing capital Turnover
28.0890586925121
51.1195456773982
-4.883946312
42753
-8.610643309
06237
-13.03059663
43702-15.00
-5.00
5.00
15.00
25.00
35.00
45.00
55.00
Working Capital Turnover
Axis Title

2013 2012 2011 2010 2009
Finan-cial Lever-age
1.92592644379814
2.30520090539718
3.66964472980927
2.45975203606327
2.39035453528909
0.25
0.75
1.25
1.75
2.25
2.75
3.25
3.75
Financial Leverage
Axis Title
Based On Financial Condition

2013 2012 2011 2010 2009
Debt Equity Ratio
0.0928301479753268
0.293170125622695
0.589933898500031
0.0654137638455193
0.0609274485298954
Debt Capital-ization
0.0849447172987605
0.226706540627456
0.37104303459193
0.0613975209118887
0.0574284778985795
0.05
0.15
0.25
0.35
0.45
0.55
Debt Equity Ratio and Debt Capitalization
Axis Title

2013 2012 2011 2010 2009
Times Inter-est Earned
212.342569269521
85.7014657493274
85.2836879432624
254.219030520646
136.579754601226
25.00
75.00
125.00
175.00
225.00
275.00
Times Interest Earned
Axis Title

2013 2012 2011 2010 2009
0.13
0.040.06
0.49
0.09
Cash Flow To DebtCash Flow to debt

TREND ANALYSIS BASED ON
COMPETITION WITH COMPETITORS-WHO?-WHERE?-WHAT?-HOW MUCH?

Hero Motocorp Bajaj Auto TVS Motor Mah Scooters Atul Auto
0.22
0.29
0.04
0.17
0.21
Return on AssetsReturn on Assets
Based On Overall Performance

Hero Motocorp Bajaj Auto TVS Motor Mah Scooters Atul Auto
0.42
0.39
0.09
0.22
0.35
Return on EquityReturn on Equity

Hero Motocorp Bajaj Auto TVS Motor Mah Scooters Atul Auto
0.400.38
0.07
0.22
0.35
Return On Invested CapitalReturn on invested Capital

Based On Profitability Ratio
Hero Motocorp Bajaj Auto TVS Motor Mah Scooters Atul Auto
0.26 0.26 0.28
0.51
0.22
Gross profit marginGross profit margin

Hero Mo-tocorp
Bajaj Auto TVS Motor Mah Scooters Atul Auto
0.09 0.15 0.02
7.29
0.07
Return on SaleReturn on Sale
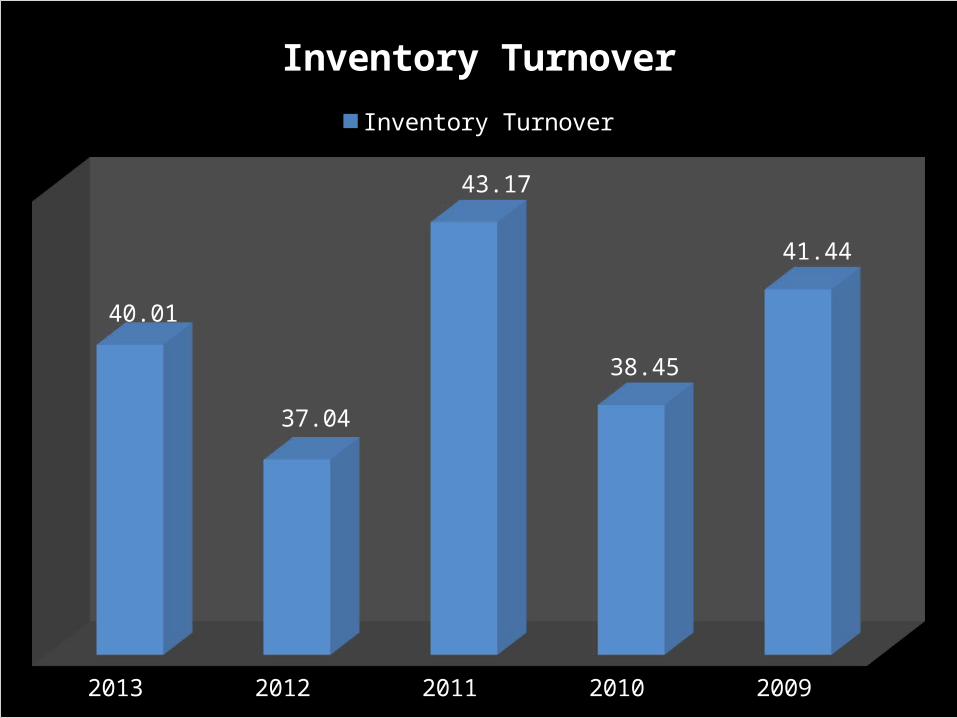
Hero Motocorp Bajaj Auto TVS Motor Mah Scooters Atul Auto
106.07 105.18
2.44
42.74
23.62
Earnings Per ShareEarning per share

Hero Mo-tocorp
Bajaj Auto TVS Motor Mah Scooters Atul Auto
2.47
1.93
2.48
0.03
3.32
Asset TurnoverAsset Turnover
Based On Investment Utilization

Hero Motocorp Bajaj Auto TVS Motor Mah Scooters Atul Auto
4.48
2.51
4.37
0.03
5.50
Invested Capital turnoverInvested Capital turnover

Hero Motocorp Bajaj Auto TVS Motor Mah Scooters Atul Auto
4.75
2.53
6.31
0.03
5.50
Equity TurnoverEquity Turnover

Hero Motocorp Bajaj Auto TVS Motor Mah Scooters Atul Auto
6.56 3.11 8.90 0.03
332.07
Capital IntensityCapital Intensity

Hero Motocorp Bajaj Auto TVS Motor Mah Scooters Atul Auto
2.41 12.29
-1.89
1115.79
43.02
Days cash
Days cash

Hero Mo-tocorp
Bajaj Auto TVS Motor Mah Scooters Atul Auto
9.7811.61
24.06
27.70
20.51
Days InventoryDays Inventory

Hero Mo-tocorp
Bajaj Auto TVS Motor Mah Scooters Atul Auto
10.210.00
14.18
122.96
6.39
Days ReceivableDays receivable

Hero Mo-tocorp
Bajaj Auto TVS Motor Mah Scooters Atul Auto
27.44
23.20
10.03
5.72
12.34
Inventory TurnoverInventory Turnover
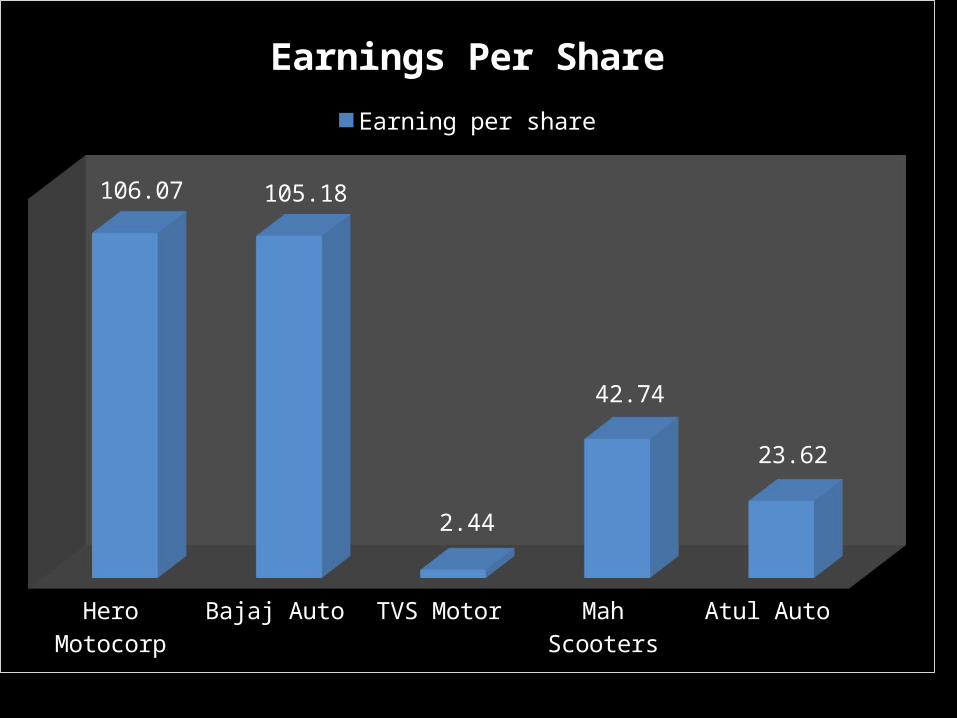
Hero Mo-tocorp
Bajaj Auto TVS Motor Mah Scooters Atul Auto
13.6411.03 11.85
0.27
31.44
Working Capital TurnoverWorking Capital Turnover

Hero Mo-tocorp
Bajaj Auto TVS Motor Mah Scooters Atul Auto
1.60
3.71
1.53
1.90
1.36
Current RatioCurrent ratio

Hero Mo-tocorp
Bajaj Auto TVS Motor Mah Scooters Atul Auto
0.06
0.84
0.01
1.04 1.07
Quick RatioQuick Ratio

Hero Motocorp Bajaj Auto TVS Motor Mah Scooters Atul Auto
1.93
1.31
2.55
1.26
1.65
Financial LeverageFinancial Leverage
Based On Financial Condition

Hero Motocorp Bajaj Auto TVS Motor Mah Scooters Atul Auto
0.060.01
0.45
0.00 0.00
Debt Equity RatioDebt Equity Ratio
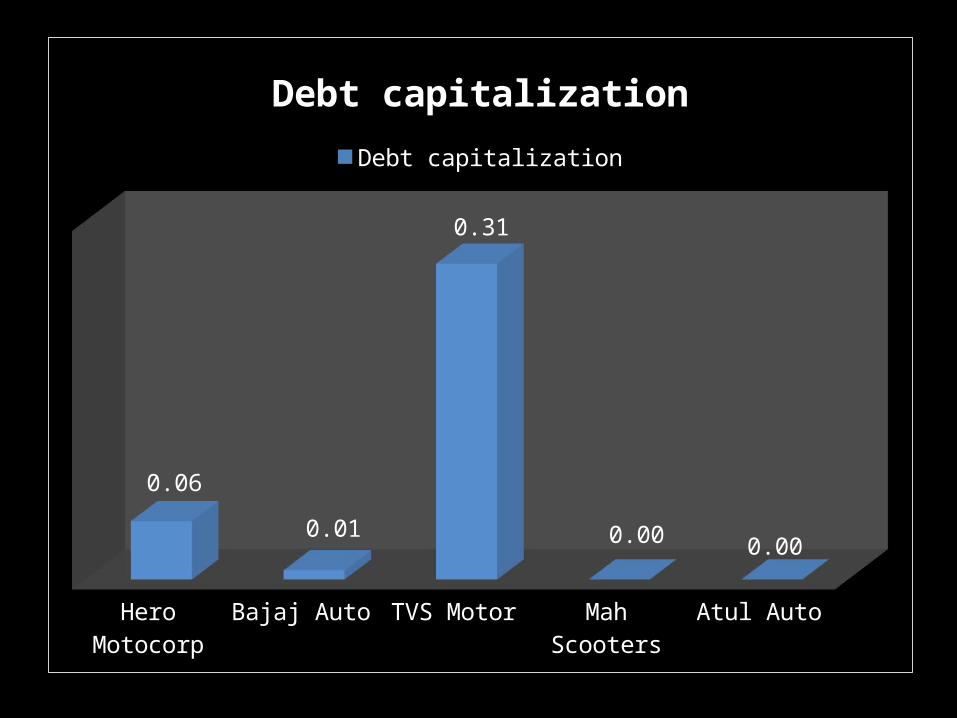
Hero Mo-tocorp
Bajaj Auto TVS Motor Mah Scooters Atul Auto
0.06
0.01
0.31
0.00 0.00
Debt capitalizationDebt capitalization

Hero Mo-tocorp
Bajaj Auto TVS Motor Mah Scooters Atul Auto
312.37
8205.07
7.12 0.00 105.18
Times Interest EarnedInterest Earned

Hero Mo-tocorp
Bajaj Auto TVS Motor Mah Scooters Atul Auto
6.26
29.95
0.77 0.00 0.00
Cash Flow to debtCash Flow to debt

Hero Motocorp Bajaj Auto TVS Motor Mah Scooters Atul Auto
28.28
4.28
49.18
4.682.54
Dividends payoutDividends payout
Based On Dividend Policy

CONCLUSION

Bajaj Auto
Hero Moto-corp
TVS Motor
Mah Scoot-
ers
Atul Auto
LML Kinetic Motor
Last Price
2127.7 2111.15 50.2 400 258.5 5.75 7.1
250.00
750.00
1,250.00
1,750.00
2,250.00
Last Price
Axis Title

58%
39%
2% 0% 0%0%0%
Market Capital (Rs Crore)Bajaj Auto Hero Motocorp TVS MotorMah Scooters Atul Auto
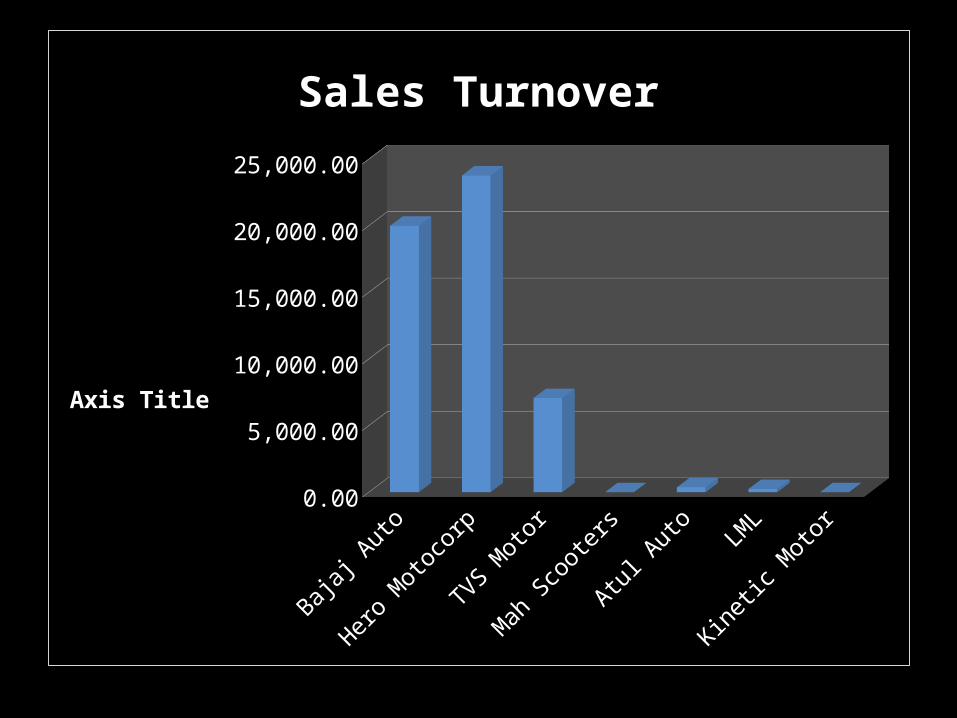
Bajaj Auto
Hero Moto-corp
TVS Motor
Mah Scoot-
ers
Atul Auto
LML Kinetic Motor
Sales Turnover
19997.25
23768.109999
9999
7065 6.7 363.84 243.73 5.67
2,500.00
7,500.00
12,500.00
17,500.00
22,500.00
Sales Turnover
Axis Title

Bajaj Auto
Hero Moto-corp
TVS Mo-tor
Mah Scooters
Atul Auto
LML Kinetic Motor
Net Profit
3043.57 2118.16 116.02 48.84 25.92 -65.45 1.48
-250.00
250.00
750.00
1,250.00
1,750.00
2,250.00
2,750.00
3,250.00
Net Profit
Axis Title

Bajaj Auto
Hero Moto-corp
TVS Motor
Mah Scoot-
ers
Atul Auto
LML Kinetic Motor
Net As-sets
9300.3499999
9996
5308.4 1770.53
224.59 74.31 -424.86 58.54
-1,000.00
1,000.00
3,000.00
5,000.00
7,000.00
9,000.00
Net Assets
Axis Title