Finance, U.S. Senate - Government Accountability Office · Congress* consideration of proposals to...
70
GAO United States General Accounting Office Report to the Chairman, Committee on Finance, U.S. Senate June 1993 TAX POLICY Puerto Rico and the Section 936 Tax Credit GAQ&GD-93-109
Transcript of Finance, U.S. Senate - Government Accountability Office · Congress* consideration of proposals to...

GAO United States General Accounting Office
Report to the Chairman, Committee on Finance, U.S. Senate
June 1993 TAX POLICY
Puerto Rico and the Section 936 Tax Credit
GAQ&GD-93-109


GAO United States General Accounting Office Washington, D.C. 20648
General Government Division
B-253336
June 8,1993
The Honorable Daniel P. Moynihan Chairman, Committee on Finance United States Senate
Dear Mr. Chairman:
In response to your request, this report presents information relevant to Congress* consideration of proposals to revise the Internal Revenue Code section 936 tax credit, which primarily affects Puerto Rico and the subsidiaries of U.S. companies that operate there. Under section 936, income earned by U.S. firms from operations in U.S. possessions is effectively exempt from federal corporate income taxes. Section 936 also exempts income from certain passive investments of section 936 corporations in the possessions and other qualified locations.’
Recently, several proposals have been offered to modify or replace section 936. You asked for information to assist Congress as it considers revisions to the section 936 tax credit. Specifically, you asked for information on
(1) the effects on federal revenues and Puerto Rico’s economy of linking section 936 credits directly to the amount of employment and real investments generated by U.S. corporations in Puerto Rico;
(2) the possible multiplier effect that section 936 firms have on the Puerto Rican economy;
(3) changes in the Puerto Rican economy over the past 2 decades;
(4) investments creating qualified possessions source investment income (cpsn) in Puerto RI ‘co and the Caribbean, and charitable contributions made and local taxes paid by section 936 firms;
(5) the volume of maritime shipments to and from Puerto Rico;
(6) the distribution of tax benefits by industry;
(7) the tax benefits for each industry compared to their real investments, employment, and employee compensation in Puerto Rico; and
%pecific limitations on the availability of the section 936 tax credit are discussed on pages 2 and 3.
Page 1 GAO/GGD-93-109 Puerto Rico and Section 936

B-263336
(8) the first-round changes in tax credits that section 936 companies could claim if section 936 credits were limited to various levels of employee compensation.
This letter provides background information, addresses issues concerning estimating the effects of alternatives to the section 936 tax credit, and discusses the possible multiplier effects of section 936 firms on the Puerto Rican economy. The letter also summarizes information reiating to changes in the Puerto Rican economy since 1971 and to the distribution of tax benefits, employment, and compensation among section 936 manufacturing firms. More detailed information on these topics as weIl as on your additional interests is provided in appendixes I and II.
Background Income derived from operations of U.S. corporations in U.S. possessions has been subject to special tax provisions since the Revenue Act of 1921. These provisions were primarily intended to help U.S. corporations compete with foreign firms in the Philippines (then a U.S. possession). Since 1948, when Puerto Rico adjusted its tax policies with the Industrial Incentives Act of 1948, most U.S. subsidiaries in Puerto Rico have been completely or partially exempt from Puerto Rican taxes as well as from the U.S. income tax.
With the Tax Reform Act of 1976, Congress connected the special tax provisions with the development of possessions’ economies. The Senate Finance Committee report on the 1976 act portrayed the purpose of these special provisions as “assist[ing] the U.S. possessions in obtaining employment producing investments by U.S. corporations.” The 1976 act created section 936, which revised the treatment of possessions source income. Since 1983, over 99 percent of the benefits of this section have gone to companies operating in Puerto Rico. The Joint Committee on Taxation estimates that federal revenues forgone due to the section 936 tax credit will total $3.9 billion in fiscal year 1994.
Under section 936, the tax credit equals the fulI amount of the U.S. income tax liability on possessions source income. Firms qualify for the credit if, over a three year period preceding a taxable year, 80 percent or more of their income was derived from sources within a possession and 75 percent or more of their income was derived from the active conduct of a trade or business within a possession. This provision effectively exempts ah possessions source income from U.S. taxation. Dividends repatriated from a U.S. subsidiary to a mainland parent qualify for a dividends-received
Page 2 GAO/GGD-93-109 Puerto Rico and Section 936

B-253336
deduction, thus allowing tax-free repatriation of possessions income. In addition, the provision exempts from U.S. taxation the income earned on qualified investments made by section 936 firms from their profits earned in the possessions. This income is called qualified possessions source investment income, or QPSII. Puerto Rico established rules to ensure that QPSII funds invested through the islands financial intermediaries meet the act’s requirements.
Congress periodically reconsiders the benefits and costs of the section 936 tax credit. In the 1982 Tax Equity and Fiscal Responsibility Act and the 1986 Tax Reform Act, Congress adjusted the section 936 provisions in an attempt to reduce the ratio of federal revenue loss to employment created and investments made in U.S. possessions. Congress principally adjusted the tax treatment of income derived from intangible assets (such as patents, trademarks, and trade names) and passive investments.
Before the 1982 and 1986 adjustments, corporations could (1) reduce their U.S. income taxes by deducting from their U.S. revenues research and development expenses that led to a patent and then (2) transfer the patent (or other intangible asset) to Puerto Rico and realize tax-free income under section 936 from its use in Puerto Rico. In the 1982 act, Congress required that companies allocate some of their income realized in Puerto Rico from intangible assets to their U.S. parents. The 1986 act changed the allocation procedures again to ensure that a greater portion of income from intangible assets was allocated to U.S. parents.
Regarding QPSII, the 1982 act changed the proportion of gross income that a section 936 firm must earn from the active conduct of a possessions trade or business in order to qualify for the section 936 tax credit. The act increased the proportion from 50 to 65 percent. This, in turn, decreased the proportion of gross income that a possessions firm could earn from passive investments and still qualify as a section 936 firm. The 1986 act raised the proportion again so that a firm must derive 75 percent of its gross income from the active conduct of a trade or business and no more than 25 percent from passive investments.
The 1986 act also expanded the eligible activities in which QPSII funds could be invested and still qualify for tax exemption. QPSII could now be earned on deposits from which the Government Development Bank and other financial institutions in Puerto Rico made loans for the acquisition or construction of active business assets or development projects in qualified Caribbean Basin Initiative (CBI) countries.
Page 3 GAO/GGD-93-109 Puerto Rico and Section 936

B-263336
Debate Over Effectiveness Significant debate continues over the effectiveness of section 936 as an of Section 936 impetus for development in Puerto Rico. On one hand, the Puerto Rican
economy has improved substantially in the post-World War II period. By developing tax policies to complement the federal government’s possessions source income tax credit, Puerto Rico has attracted considerable manufacturing industry to the island. Propelled by this growth in the manufacturing sector, Puerto Rico’s real gross national product (GNP) has increased more than four-fold since 1947. On the other hand, by mainland U.S. standards, Puerto Rico remains a poor island. Puerto Rico’s real average per capita income rose from $1,400 in 1947 to $6,000 in 1991, but it remained less than 30 percent of the U.S. average real per capita income and its 1991 unemployment rate of 16 percent was more than double the mainland’s unemployment rate of 6.6 percent.’
Many proposals have been made to modify or replace the section 936 tax credit. In 1984, the Department of the Treasury proposed that the credit be replaced with a wage credit. Under the wage credit, a firm’s tax credit would be linked to the wages it pays in the possessions. The President’s fiscal year 1994 budget proposes to retain section 936 but to limit the total amount of credit a section 936 firm can claim on its operating profits to the lesser of its current section 936 tax credits or 60 percent of the wages paid to its employees. In addition, section 936 firms would be able to claim a loo-percent credit against the tax liability on the income from their passive investments that were not more than 80 percent of their tangible assets. The Joint Committee on Taxation staff estimated that the revised section 936 tax credit would increase federal revenues by about $6.8 billion over 5 years. A principal question associated with these proposals is how they wilI affect the Puerto Rican economy.
Results in Brief The section 936 tax credit provides significant benefits to U.S. subsidiaries that locate in Puerto Rico-$2.6 billion in 1989, the most recent year for which data on tax benefits, compensation, and employment levels were available. In 1989, section 936 manufacturing corporations’ benefits slightly exceeded the average compensation these section 936 firms paid to their employees. Average tax benefits per employee were $24,300 while average wages paid, including estimated fringe benefits, were $22,800. For some industries, in particular the chemical industry and its pharmaceutical component, average tax benefits considerably exceeded wages paid. The average tax benefits per chemical industry &ployee were $69,800 in 1989, and average compensation was $32,900.
2All dollar amounts in this report are expressed in constant 1991 dollars.
Page 4 GAO/GGD-93-109 Puerto Rico and Section 936

B-253336
Concerns about the tax benefits in relation to employment generated have led to proposals to revise the section 936 tax credit. If section 936 were changed as the President proposes-by limiting section 936 tax benefits to no more than a 60-percent wage credit-more than half of current section 936 firms we analyzed would not lose any tax credits. The President’s proposal would most severely affect 34 firms, or about 11 percent of the 308 section 936 firms with appropriate data that we analyzed. These firms could lose 75 percent or more of the tax credits they otherwise could claim. The 34 firms could lose $1.3 billion in credits, or about 73 percent of all of the credits section 936 manufacturing fiMns could lose under this wage credit design. These 34 firms employed 9,623, or about 11 percent of the employees in the 308 firms. (See app. II, table 11.7.)
In considering changes to section 936, a key question is the impact on Puerto Rico’s economic development. The impact of changing section 936 on Puerto Rico’s economic development and growth depends on how the change would affect the use of Puerto Rico’s resources, both resources employed directly by section 936 firms as well as resources employed indirectly through Puerto Rican suppliers. The effect of changing section 936 on the employment of Puerto Rico’s resources depends on how the tax change affects firms’ location decisions and whether the resources would be otherwise employed.
Since the President’s proposal centers on wages (labor), the large losses in tax credits under the President’s proposal would tend to concentrate in capital intensive fm. Thus, these ffnns might reconsider their decisions about where to locate. However, the effect of capital intensive firms on the Puerto Rican economy may not be proportional to their capital investments in Puerto Rico or to the tax credits they receive. Because the section 936 credit applies to the income generated in Puerto Rico, not to jobs or investments in plant or equipment, U.S. parent firms may find it advantageous to shift income producing intangible assets, such as patents and trademarks, to their section 936 Puerto Rican subsidiaries. Firms with intangible assets may be able to earn relatively high income in relation to the labor and plant and equipment costs associated with actual production processes. This may account for the variations in tax benefits per employee realized among section 936 manufacturing firms. Although some firms may consider relocating, the kind of detailed information on firms, including firms that may move to Puerto Rico, necessary to estimate the effects of the proposed tax changes on firms’ location decisions does not exist.
Page 6 GAO/GGD-93-109 Puerto Rico and Section 936

B-263336
In addition to the direct effects of firms reducing their Puerto Rican operations, there may also be indirect effects from changing section 936. Investment in Puerto Rico by section 936 firms may lead, through a multiplier effect, to an expansion of income and employment throughout the island. In an economy with high persistent unemployment like Puerto Rico’s, investment undoubtedly produces a multiplier effect. However, the magnitude of the multiplier effect depends on whether the resources would have been employed otherwise. It is likely that some portion of’ those who lose employment due to a change in section 936, either from reduced operations of firms directly benefiting from section 936 or firms indirectly benefiting, would find alternative employment. The relatively high level of education in the Puerto Rican labor force combined with the below average unemployment rate for the well educated suggests such a result. Approximately 40 percent of Puerto Rico’s labor force has 13 or more years of education; this segment of the labor force has below average unemployment, 9.6 percent in 1991 compared to an average unemployment rate of 16 percent. We were unable to find estimates of a multiplier that takes into account the possibility of alternative employment for Puerto Rico’s resources and the adjustments that would occur in response to price changes resulting from firms’ location decisions.
If by revising section 936 Congress wishes to provide more of an incentive for labor intensive firms to expand operations in Puerto Rico, an alternative tax credit could be designed to do so and raise the same estimated revenues as the President’s proposal. For example, section 936 firms could receive a tax credit based on wages paid their employees even when such credits would exceed their current section 936 benefits. To raise estimated revenues similar to the President’s proposal, each firm’s total credits would need to be restricted to a maximum amount, probably somewhat less than the 60-percent limit proposed by the President because labor intensive firms would receive a greater subsidy. Thus, to raise the same revenues, this alternative would reduce the credits available to capital intensive firms more than under the President’s proposal.
Effect of Section 936 Changes on Puerto Rican Economy Is Difficult to Estimate
Policymakers are keenly interested in the effects alternative tax treatments will have on Puerto Rico’s economy, industries receiving the tax credit, and federal revenues. The effects of changing section 936 have been a concern in the past, when statehood was considered for Puerto Rico, a course that precludes application of the section 936 tax credit in Puerto Rico, and now, as Congress considers proposals to limit or replace
Page 6 GAO/GGD-93-109 Puerto Rico and Section 936

B-253336
section 936 to increase federal revenues while maintaining an adequate economic stimulus for Puerto Rico. The changes in firms’ economic incentives due to proposed changes to section 936 can be described, but reliable estimates of the magnitude of the effects cannot be made.
To reliably estimate the magnitude of the effects of possible changes to section 936, the responses of firms would have to be estimated as well as the impact of such responses on the Puerto Rican economy. Options for section 936 firms include relocating from Puerto Rico to the United States or other countries and altering the size or nature of their Puerto Rican operations. F’irms that might consider moving to Puerto Rico, i.e., prospective firms, may also respond to any changes in factors such as Puerto Rican labor or capital costs. The ultimate impact of any change to section 936 on the Puerto Rican economy depends on how firms’ responses to the change affect their demand for Puerto Rican resources, such as labor.
We reviewed the economics literature on firms’ location decisions. The relevant literature, in this case, is on international location decisions, because locations that compete with Puerto Rico include other countries. The literature identifies many factors that influence firms’ international location decisions, including such things as labor costs, labor productivity, transportation costs, infrastructure, national stability, and the tax consequences of choosing one location over others.
The literature did not contain a consensus on the magnitude of influence that differing tax regimes have on companies’ international location decisions. The importance of tax effects likely depends on firms’ individual circumstances and the specific tax. However, the kind of detailed information on firms, including prospective firms, necessary to estimate the effects of substituting a revised tax credit for the current section 936 does not exist.
Some analysts have used models of the Puerto Rican economy to estimate the economic consequences of altering section 936 or granting Puerto Rico statehood. Given the absence of information about the responses of firms to the changes, they had to make assumptions about the behavior of section 936 firms and other firms and input those assumptions to the models. However, without reliable estimates of firms’ responses to tax changes, models cannot reliably forecast the effects of tax changes on the Puerto Rican economy.
Page 7 GAO/GGD-93-109 Puerto Rico and Section 936

B-253336
Proposals Would Alter Incentives
Although reliable estimates of firms’ responses cannot be made, the general change in firms’ incentives implicit in proposals to cap the amount of section 936 tax credits can be described. The President’s proposal to restrict section 936 tax credits would alter the attractiveness of Puerto Rico for some current and potential section 936 firms. The President’s section 936 proposal has the basic effect of substituting, for some firms, the equivalent of a wage credit, limited to 60 percent of wages paid to employees (not including fringe benefits), in place of the current section 936 credit on possessions source income. For other firms, the section 936 credit would not be affected.
Although we were unable to estimate the overall effect on the Puerto Rican economy of wage credit caps that may be placed on the tax credits claimed by section 936 fums, we were able to estimate the initial impact on firms. To illustrate the impact of such limits, we estimated how much the tax credits received by section 936 manufacturing firms in 1989 would be reduced under the President’s proposed 60-percent, and also a loo-percent, wage credit cap. We estimated the initial impact including and excluding fringe benefits as part of employee compensation. We accounted for the effect that the President’s proposal would have on the tax credits attributable to income earned on section 936 firms’ QPSII investments. The estimates are not the same as the federal revenues that might be raised under a wage credit cap. They assume no behavioral response by the section 936 firms to the imposition of the wage credit cap. The estimates were made for the 308 manufacturing firms (about 75 percent of section 936 manufacturing firms) that reported wages on their 1989 Employer’s Annual Federal Unemployment (FUTA) Tax Return (Form 940). These 308 firms employed 86 percent of the employees and claimed 87 percent of the tax credits claimed by all section 936 manufacturing firms.
Overall, a wage credit cap on section 936 tax credits would affect less than half of the 308 section 936 manufacturing firms analyzed-35 to 44 percent of the firms would lose at least some tax credits. The most restrictive cap, a 60-percent wage credit applied only to direct wages, would affect 44 percent of the firms. They would lose 68 percent of the tax credits they realized under section 936; they employed 47 percent of the employees in the firms analyzed. The least restrictive cap, a lOO-percent wage credit including fringe benefits, would affect 35 percent of the firms. They would lose 52 percent of the tax credits they realize under section 936; they employed 40 percent of the employees in the 308 firms. (See app. II, tables II.7 through II. 10.)
Page 8 GAO/GGD-93-109 Puerto Rico and Section 936

B-253336
The effect of the wage credit is further concentrated if one considers only the companies that would lose 75 percent or more of their tax credits. For example, under the most restrictive cap, 34 firms, or 11 percent of those analyzed, would lose between 75 and 100 percent of the tax credits they claimed. The 34 firms would lose tax credits totaling $1.3 billion, or an average of 85 percent of the credits they claimed under an unchanged section 936; this is 73 percent of all the credits that would be lost by the 308 firms analyzed. The 34 firms employed 9,623 workers in 1989, 11 percent of the employment of the 308 tis.
Most labor intensive section 936 firms would not be affected. They would not lose any tax credits or, if they did, only a small percentage; thus, their incentive to stay or locate in Puerto Rico would change little if at all. For example, the labor intensive apparel industry paid average compensation per employee of $12,600 in 1989 but received only $2,100 of tax benefit per employee. Under the 60- or lOO-percent wage credit caps, this industry’s tax credits would be changed very little. And, because the tax credits available to labor intensive firms considering Puerto Rico as a location would be similar to those of labor intensive firms already there, potential section 936 firms’ incentive to locate in Puerto Rico would be unchanged.
In contrast, many capital intensive section 936 firms would lose substantial tax credits and this may affect their location decisions3 For example, the capital intensive pharmaceutical industry, with 1989 average tax benefits per employee of $71,700 in contrast to average compensation per employee of $33,800, would lose substantial tax credits under either the 60- or loo-percent wage credit formulation. And, capital intensive firms considering moving to Puerto Rico would likely receive lower tax credits than under the current section 936 and, thus, would be less attracted to Puerto Rico.
However, the effect of capital intensive firms on the Puerto Rican economy may not be proportional to their capital investments in Puerto Rico or to the tax credits they receive. Because the section 936 credit applies to income generated in Puerto Rico, not to jobs or investments in plant or equipment, U.S. parent firms may shift income producing intangible assets, such as patents and trademarks, to their section 936 Puerto Rican subsidiaries. These intangible assets make the subsidiaries capital intensive because intangible assets are capital, Firms with intangible assets may earn relatively high income in relation to the labor,
The proposed changes to section 936 reduce the cost of new labor relative to new capital inv+stments. While this may weaken the incentive for capital intensive firms to stay in or move to Puerto Rico, it may increase their incentive to employ additional labor in the short term.
Page 9 GAO/GGD-93-109 Puerto Rico and Section 936
s
.’ I”

B-253336
plant, and equipment costs associated with actual production processes. And high income, not high employment and investment, is what the current section 936 tax credit rewards through tax exemption. Such shifting of intangible assets to Puerto Rico probably accounts for the rapid, growth of property income compared to employee compensation for the Puerto Rican manufacturing sector that is shown in appendix I, figure I.3.
As noted previously, the tax credits for most labor intensive firms would not be reduced under a wage credit cap on section 936 tax credits as proposed by the President, but neither would they be increased. If Congress wishes to provide, through a wage credit or other means, an additional incentive for labor intensive firms to locate or expand operations in Puerto Rico, a tax policy could be structured to do so. For example, the President’s proposal could be revised so that labor intensive firms would receive a tax credit equal to the greater, rather than the lesser, of section 936 tax credits or a wage credit. Such an alternative could be constructed so that the revenue gain to the federal treasury would be the same as under the President’s proposal. However, to obtain the same revenue gain, the maximum wage credit would have to be lower than under the President’s proposal. This would reduce the tax credits available to capital intensive firms more than under the President’s proposal, but increase the tax credits for labor intensive firms over what is available under section 936. As with the President’s proposal, the magnitude of changes that would result from this policy are difficult to estimate with any known degree of precision.
Economic One of the most difficult questions posed is the impact of changing section
Development, 936 on Puerto Rico’s economic development and growth. The impact on economic development and growth depends on how changing section 936
Input-Output Analysis, affects the use of Puerto Rico’s resources, both resources employed
and Section 936 directly by section 936 firms as well as resources employed indirectly through Puerto Rican suppliers.
As already noted, the impact on Puerto Rico’s economy of reducing section 936 tax credits may not be proportional to the credits lost because they are not tied to the use of Puerto Rican resources. Section 936 gives some firms an incentive to move intangible assets to subsidiaries in Puerto Rico in order to produce income free from federal tax. The tax credits received can be high in relation to the cost of Puerto Rican resources employed, such as labor. However, to the extent that labor resources would have remained unemployed, their employment by section 936 firms
Page 10 GAO/GGD-93-109 Puerto Rico and Section 936
1 ‘.’
B-253336
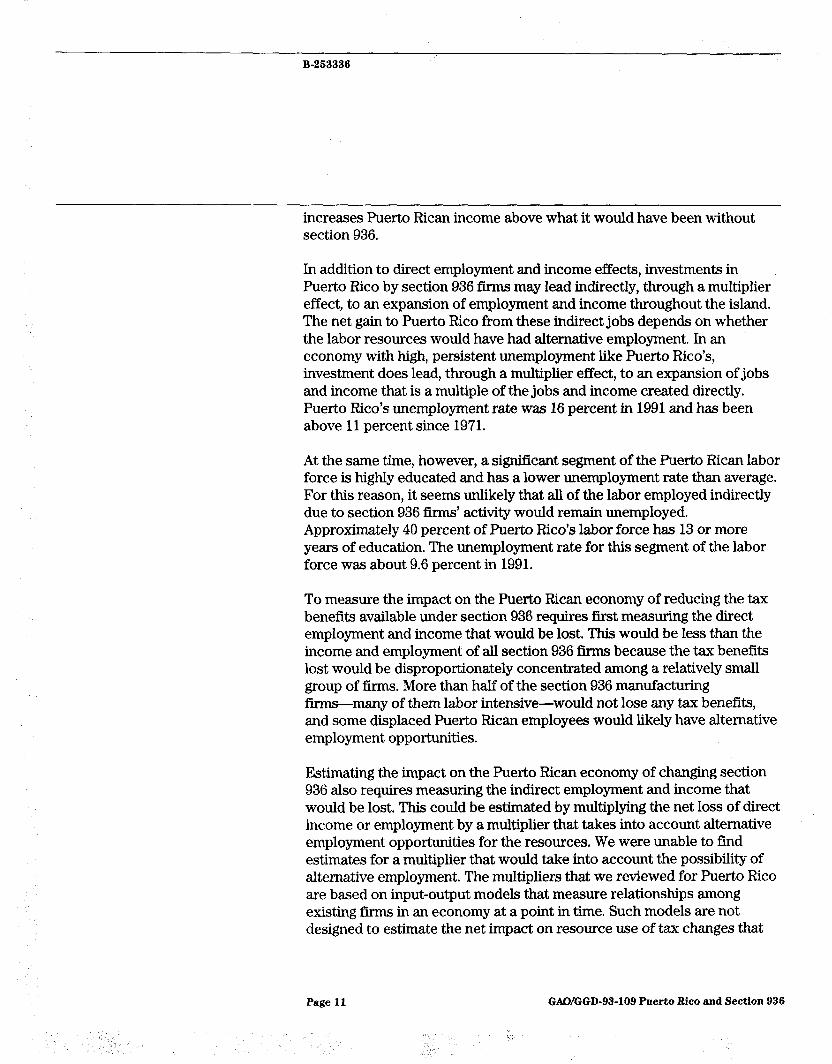
increases Puerto Rican income above what it would have been without section 936.
In addition to direct employment and income effects, investments in Puerto Rico by section 936 firms may lead indirectly, through a multiplier effect, to an expansion of employment and income throughout the island. The net gain to Puerto Rico from these indirect jobs depends on whether the labor resources would have had alternative employment. In an economy with high, persistent unemployment like Puerto Rico’s, investment does lead, through a multiplier effect, to an expansion of jobs and income that is a multiple of the jobs and income created directly. Puerto Rico’s unemployment rate was 16 percent in 1991 and has been above 11 percent since 1971.
At the same time, however, a significant segment of the Puerto Rican labor force is highly educated and has a lower unemployment rate than average. For this reason, it seems unlikely that all of the labor employed indirectly due to section 936 firms’ activity would remain unemployed. Approximately 40 percent of Puerto Rico’s labor force has 13 or more years of education, The unemployment rate for this segment of the labor force was about 9.6 percent in 1991.
To measure the impact on the Puerto Rican economy of reducing the tax benefits available under section 936 requires first measuring the direct employment and income that would be lost. This would be less than the income and employment of all section 936 firms because the tax benefits lost would be disproportionately concentrated among a relatively small group of firms. More than half of the section 936 manufacturing firms-many of them labor intensive-would not lose any tax benefits, and some displaced Puerto Rican employees would likely have alternative employment opportunities.
Estimating the impact on the Puerto Rican economy of changing section 936 also requires measuring the indirect employment and income that would be lost, This could be estimated by multiplying the net loss of direct income or employment by a multiplier that takes into account alternative employment opportunities for the resources. We were unable to find estimates for a multiplier that would take into account the possibility of alternative employment. The multipliers that we reviewed for Puerto Rico are based on input-output models that measure relationships among existing firms in an economy at a point in time. Such models are not designed to estimate the net impact on resource use of tax changes that
Page 11 GAO/GGD-93-109 Puerto Rico and Section 936

B-263336
would alter firms’ location decisions, nor are they designed to estimate the reallocation of resources that would occur in response to price changes resulting from altered location decisions.
Undoubtedly, section 936 and the exemption from Puerto Rican taxes attracted fnms to Puerto Rico. But it is also reasonable to assume that many of these firms would not have moved there or expanded to their present size without a mix of complementary investments by Puerto Rico. For example, adequate transportation, communication, and public utility facilities, as well as a skilled and productive workforce, are needed to support business operations on the scale engaged in by section 936 firms. The Puerto Rican government has long recognized this and took steps to improve the island’s infrastructure and education system, and to provide an environment to stimulate economic development. Given this interdependence between private and public investment, it may be overly simplistic to say that section 936 firms “created” a certain number of jobs in Puerto Rico.
Puerto Rico’s Economy
As shown by its GNP and gross domestic product (GDP), Puerto Rico’s economy has grown over the past 2 decades. Between 1971 and 1991, Puerto Rico’s GNP increased at an average annual rate of 2.2 percent and its GDP increased at an annual average rate of 3.5 percent. (See app. I, fig. I. 1.) The growth rate of the Puerto Rican GNP was slightly less than that of the United States, which was 2.3 percent; but the growth rate of the Puerto Rican GDP was considerably higher than that of the United States, which also was 2.3 percent.
The faster growth rate for Puerto Rico’s GDP compared to GNP means that an increasing portion of total income produced in Puerto Rico went to U.S. and foreign investors than to Puerto Rican residents. The trends in GDP and GNP are the logical result of Puerto Rico’s development strategy, which emphasizes long-term tax reduction to U.S. firms that locate in Puerto Rico, and section 936, which allows tax free repatriation of profits to the mainland. These complementary tax policies are tied to income earned in Puerto Rico and not to investment in plant and equipment, or job creation. Over time, these policies attracted industries to Puerto Rico that rely more on capital-including intangible assets-than labor for manufacturing goods. Because relatively little of the cost of manufacturing is paid in the form of wages, and the capital is owned by non-Puerto Ricans, relatively
Page 12
,j
GAO/GGD-93-109 Puerto Rico and Section 936
1 Lo

B-263336
little income from these industries is retained in Puerto Rico.4 A substantial portion of the income generated by these industries is transferred off the island, principally to mainland parents.
This trend is also reflected in the distribution of employee compensation and property income. Domestic net income can be divided between employee compensation and property income (profits and interest) earned by Puerto Rican residents and property income earned by nonresidents. Prom 1971 through 1991, employee compensation and property income earned by Puerto Rican residents grew at an annual rate of 2.3 percent. The property income received by nonresidents grew at an annual rate of 7.7 percent. (See app. I, fig. 1.2.)
This divergence in who receives the income produced in Puerto Rico is related to the sources of investment capital for the Puerto Rican economy. Gross domestic investment is the resources used to replace capital consumed during a year and to add to the stock of capital. A growing proportion of Puerto Rico’s gross domestic investment has come from external sources. And, while gross domestic investment from internal savings was positive over the period, without transfer payments from the Puerto Rican and U.S. governments Puerto Ricans consumed more than they produced in GNP. (See app. I, fig. 1.8.)
There was a shift in the sources of personal income for Puerto Rican residents in the 1970s. In 1971, employee compensation accounted for 65.6 percent of personal income. In 1991, it accounted for 54.5 percent. The decline in employee compensation as a percentage of personal income occurred abruptly as U.S. transfer payments climbed from 10 percent of personaI income in 1973 to 19 percent in 1976. This shift coincides with the introduction of food stamps in 1974. (See app. I, fig. 1.9.)
From 1971 to 1991, unemployment in Puerto Rico remained high. The unemployment rate was 11.6 percent, its lowest point over the period, in 1971. Its highest point was 23.4 percent in 1983, and it stood at 16 percent in 1991. Unemployment rates according to the level of education followed patterns similar to the overall unemployment rate. In general, the higher the level of education completed, the lower the unemployment rate. (See app. I, figs. 1.10 and 1.11.)
‘The divergence between GDP and GNP growth was noted in The Committee to Study Puerto Rico’s Finances’ Report to the Governor, (Dec. 11,1975) p. 21.
Page 13 GAO/GGD-93-109 Puerto Rico and Section 936

B-253336
The distribution of domestic net income and employment by economic sector from 1971 through 1991 indicated a slowdown in the growth rate of the manufacturing sector in the 1980s relative to the rest of the economy. From 1971 through 1980, manufacturing net income grew from 24 percent to 38 percent of domestic net income. During this time, manufacturing net income grew at an annual rate of 10.9 percent. During the 198Os, manufacturing net income as a percentage of domestic net income increased only 4 percentage points more, to 42 percent of domestic net income. Although the growth of manufacturing net income slowed down, the sector’s 42-percent share of domestic net income is substantial. (See app. I, fig. 1.12.)
Manufacturing employment as a percentage of total employment gradually declined from 1971 to 1991; it feII from 19.1 percent of total employment to 16.8 percent. Over the period, the Puerto Rican economy gained 261,000 new jobs, 27,000 of which were in the manufacturing sector. The greatest increase in jobs was in the service sector, which gained 103,000 jobs. (See app. I, fig. 1.13.)
Tax Benefit and Overall, section 936 firms received $2.64 billion of tax benefits in 1989.
Related Information Section 936 manufacturing firms received nearly aII of the tax benefits-$256 billion. Nonmanufacturing section 936 firms received
for Section 936 Firms $0.08 billion in tax benefits. Our analysis focuses on the manufacturing industries.
Five manufacturing industries-food and kindred products, chemicals, machinery (except electrical), electrical and electronic equipment, and instruments and related products-accounted for 90 percent of the tax benefits received by section 936 firms in 19851987, and 1989. The pharmaceuticals component of the chemicals industry received about 50 percent of the benefits in 1985,1987, and 1989. (See app. II, table 11.1.)
Per employee, section 936 manufacturing firms received an average tax benefit of $24,300 in 1989, slightly more than the average estimated employee compensation of $22,800. The average tax benefits differed widely among section 936 industries. The apparel industry received the lowest benefit per employee, $2,100, and the chemical industry the highest, $69,800. The average tax benefit per employee declined from 1985 to 1989. This decline is principally attributable to the decline in federal tax rates for corporations. (See app. II, table 11.5.)
Page 14 GAO/GGD-93-109 Puerto Rico and Section 936
B-263336
Section 936 manufacturing firms’ employment in 1989 was an estimated 105,500 individuals in an economy with total employment of 952,000. Section 936 manufacturing firms’ direct employment represented 11 percent of the total workforce. Section 936 manufacturing employees received an estimated $2.4 billion in compensation, 17 percent of compensation paid to all workers in Puerto Rico. Employees of section 936 manufacturing firms received higher average compensation than employees elsewhere in the economy. The average compensation per employee of section 936 manufacturing firms was $22,800 in 1989 compared to an economywide average of $14,900. (See app. II, tables 11.2, 11.3, and 11.4.)
Average compensation per employee varied substantially within section 936 manufacturing industries. In 1989, it ranged from a low of $12,200 in the textile industry to a high of $35,800 in the rubber and plastics industry. From 1983 to 1989, the chemical industry, including pharmaceutical firms, paid the highest average compensation per employee, $30,600. (See app. II, table 11.4.)
Scope and Methodology
In responding to your request, we obtained information from and discussed section 936 and proposed changes with (1) Puerto Rican government officials and other Puerto Rican citizens actively involved in the debate about the future of section 936; (2) industry association officials representing firms likely to be affected by changes to section 936; and (3) analysts in the Department of the Treasury, Congressional Budget Office, and Library of Congress who previously studied section 936. We reviewed relevant economic literature and visited Puerto Rico. We obtained and analyzed data from standard statistical sources in the Puerto Rican and U.S. governments that portray trends in the Puerto Rican economy and section 936 corporations. We also calculated the initial changes in tax credits that 308 section 936 manufacturing firms could receive under some alternative wage credits. In consideration of the timing of Congress’ deliberation on the President’s tax proposals, we did not obtain comments on this report.
We did our work between June 1992 and May 1993 in accordance with generally accepted government auditing standards.
Unless you publicly announce its contents earlier, we plan no further distribution of this report until 30 days from its issue date. At that time, we
Page 15 GAO/GGD-93-109 Puerto Rico and Section 936

B-263336
will send copies of this report to appropriate congressional committees, Members of Congress, representatives of the Puerto Rican government, and other interested parties. Copies will also be made available to others upon request.
This work was performed under the direction of Natwar M. Gandhi, Associate Director, Tax Policy and Administration Issues. Major contributors to this report are listed in appendix III. If you have any questions, please contact me on (202) 512-5407 or Mr. Gandhi on (202) 272-7904.
Sincerely yours,
Jennie S. Stathis Director, Tax Policy
and Administration Issues
Page 16 GAO/GGD-93-109 Puerto Rico and Section 936

Page 17 GAOIGGD-93-109 Puerto Rico and Section 936
‘$ -. ^
/

Contents
Letter 1
Appendix I Puerto Rico’s Economy
Gross Domestic and National Products Distribution of Domestic Net Income by Employee Compensation
and Property Income
22 22 23
Employee Compensation and Property Income in the Manufacturing Sector
25
Employee Compensation and Property Income in the Pharmaceutical Industry, Manufacturing Sector
Employee Compensation and Property Income in the Metal Products and Machinery Industry, Manufacturing Sector
Employee Compensation and Property Income in the Trade Sector
26
28
29
Employee Compensation and Property Income in the F’inancial, 30 Insurance, and Real Estate Sector
Gross Domestic Investment Sources of Personal Income for Puerto Rican Residents Unemployment Rate Unemployment Rate by Education Level Domestic Net Income by Economic Sector Employment by Economic Sector Eligible Activities and Direct Deposits of Section 936 Funds Section 936 F’inancing and Other Investments Promoted by
31 33 34 36 37 39 41 43
Puerto Rico in CBI Countries Eligible Uses of Section 936 Funds by Type of Investment 44
Appendix II Tax Benefit and Estimated Tax Benefits of Section 936 Corporations
Estimated Number of Employees of Section 936 Manufacturing Related Information Corporations - -
for Section 936 Firms Estimated Total Employee Compensation of Section 936 Manufacturing Corporations
Estimated Compensation Per Employee of Section 936 Manufacturing Corporations
Estimated Tax Benefits Per Employee of Section 936 Manufacturing Corporations
Ratio of Tax Benefits Per Employee to Employee Compensation Per Employee, Manufacturing Sector
47 47 48
50
51
53
54
Page 18 GAO/GGD-93-109 Puerto Rico and Section 936
* v-

Contents
Estimated First-Round Effects on the Manufacturing Sector of Substituting a Wage Credit for Section 936
Taxes Paid to the Puerto Rican Government by Section 936 Firms Estimated F’ixed Assets of Section 936 Corporations,
Manufacturing Sector
55
61 62
Estimated Charitable Contributions of Section 936 Manufacturing Corporations
63
Maritime Shipments Between the United States and Puerto Rico in 1992
64
-
Appendix III Major Contributors to This Report
66
Tables Table 11.1: Estimated Tax Benefits of Section 936 Corporations, 1983-1989
Table 11.2: Estimated Number of Employees of Section 936 Manufacturing Corporations, 1983-1989
Table II.3 Estimated Total Employee Compensation of Section 936 Manufacturing Corporations, 1983-1989
Table 11.4: Estimated Compensation per Employee of Section 936 Manufacturing Corporations, 1983-1989
Table 11.5: Estimated Tax Benefits per Employee of Section 936 Manufacturing Corporations, 1983-1989
Table IL& Ratio of Tax Benefits per Employee to Employee Compensation per Employee, Manufacturing Sector, 1983-1989
Table 11.7: Estimated Effects of a 60-Percent Wage Credit, Excluding Fringe BeneEts, on Section 936 Tax Credits, Manufacturing Sector
Table 11.8: Estimated Effects of a 60-Percent Wage Credit, Including F’ringe Benefits, on Section 936 Tax Credits, Manufacturing Sector
Table 11.9: Estimated Effects of a loo-Percent Wage Credit, Excluding Fringe Benefits, on Section 936 Tax Credits, Manufacturing Sector
Table II. 10: Estimated Effects of a loo-Percent Wage Credit, Including F’ringe Benefits, on Section 936 Tax Credits, Manufacturing Sector
Table 11.11: Taxes Paid to the Puerto Rican Government by Section 936 F’irms
48
50
51
52
53
55
58
59
60
61
62
Page 19 GAO/GGD-93-109 Puerto Rico and Section 936
s
)

Contents
Table II. 12: Estimated F’ixed Assets of Section 936 Corporations, Manufacturing Sector, 1983-1989
Table II. 13: Estimated Charitable Contributions of Section 936 Manufacturing Corporations
63
64
Table 11.14: Maritime Shipments Between the United States and Puerto Rico in 1992
65
Figures Figure I. 1: Gross Domestic and National Product, 1971-1991 Figure 1.2: Percentage Distribution of Domestic Net Income by
Employee Compensation and Property Income, 1971-1991 Figure 1.3: Employee Compensation and Property Income in the
Manufacturing Sector, 1971-1991 Figure 1.4: Employee Compensation and Property Income in the
Pharmaceutical Industry, Manufacturing Sector, 1971-1989 Figure 1.5: Employee Compensation and Property Income in the
Metal Products and Machinery Industry, Manufacturing Sector, 1971-1989
Figure 1.6: Employee Compensation and Property Income in the Trade Sector, 1971-1989
Figure 1.7: Employee Compensation and Property Income in the Financial, Insurance, and Real Estate Services Sector, 1971-1989
Figure 1.8: Gross Domestic Investment, 1982-1991 Figure 1.9: Percentage Distribution of the Sources of Personal
Income for Puerto Rican Residents, 1971-1991 Figure I. 10: Unemployment Rate, 1971-1991 Figure 1.11: Unemployment Rate by Education Level, 1971-1991 Figure I. 12. Percentage Distribution of Domestic Net Income by
Economic Sector, 1971-1991 Figure I. 13: Percentage Distribution of Employment by Economic
Sector, 1971-1991 Figure I. 14: Eligible Activities and Direct Deposits of Section 936
Funds Figure I. 15: Annual Investment Promoted by Puerto Rico in CBI
Countries, Section 936 Financing and Other Investments Figure 1.16: Eligible Uses of Section 936 Funds by Type of
Investment
23 24
26
27
29
30
31
33 34
36 37 39
41
43
44
46
Page 20 GAO/GGD-93-109 Puerto Rico aud Section 936
a .I I“.,’ .:-
Contents
Abbreviations
CBI Caribbean Basin Initiative GDP gross domestic product GNP gross national product IRS Internal Revenue Service QPSU qualified possessions source investment income
Page 21 GAO/GGD-93-109 Puerto Rico and Section 936

Appendix I
Puerto Rico’s Economy
Congress has connected the section 936 tax provisions to the development of possessions’ economies. This appendix illustrates various measures of Puerto Rico’s economic development.
Gross Domestic and National Products
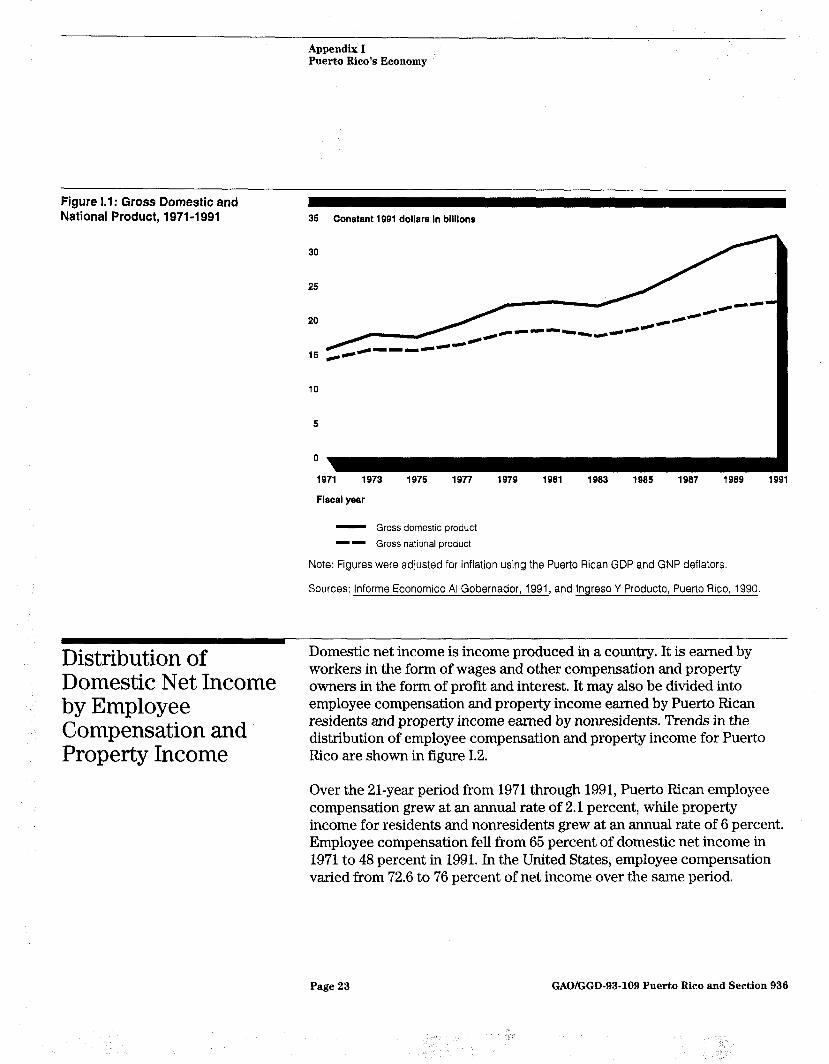
Gross domestic product (GDP) is a measure of the income produced in Puerto Rico. Gross national product (GNP) is a measure of the income produced that is available to residents of Puerto Rico. The difference between the two represents, for the most part, the remittance of profits and interest to U.S. and foreign fii and creditors.
As shown in figure 1.1, the GDP and GNP of Puerto Rico both grew between 1971 and 1991. However, the GDP has been growing at an annual rate that is 59-percent greater than that of the GNP, 3.5 percent versus 2.2 percent from 1971 to 1991. The difference between GDP and GNP, and the difference in their growth rates, reflects the growing dependence of Puerto Rico on external sources for its economic growth.
The trends in GDP and GNP are the logical result of Puerto Rico’s development strategy, which emphasizes long-term tax reduction to U.S. firms that locate in Puerto Rico, and section 936 of the Internal Revenue Code, which allows the tax free repatriation of profits to the mainland. These complementary tax policies are tied to income earned in Puerto Rico and not to investment in plant and equipment or job creation. Over time, these policies attracted industries to Puerto Rico that rely more on capital-including intangible assets-than labor for manufacturing goods. Because relatively little of the cost of manufacturing is paid in the form of wages, and the capital is owned by non-Puerto Ricans, relatively little income from these industries is retained in Puerto Rico.’ A substantial portion of the income generated by these industries is transferred off the island, principally to mainland parents.
‘The divergence between GDP and GNP growth was noted in The Committee to Study Puerto Rico’s Finances’ Report to the Governor, (Dec. 11,1975) p. 21.
Page 22 GAO/GOD-93-109 Puerto Rico and Section 936
Appendix I Puerto Rico’s Economy
Figure 1.1: Gross Domestic and National Product, 1971-l 991 35 Constant 1991 dollars in billions
30
25
20
15 @C C-9-4
10
5
0
1971 1973 1975 1977 1979 1991 1993 1985 1987 1989 1991
Fiscal year
- Gross domestic product -- Gross national product
Note: Figures were adjusted for inflation using the Puerto Rican GDP and GNP deflators.
Sources: lnforme Economico Al Gobernador, 1991, and lngreso Y Producto, Puerto Rico, 1990.
Distribution of Domestic net income is income produced in a country. It is earned by
Domestic Net Income workers in the form of wages and other compensation and property owners in the form of profit and interest. It may also be divided into
by Employee employee compensation and property income earned by Puerto Rican
Compensation and residents and property income earned by nonresidents. Trends in the
Property Income distribution of employee compensation and property income for Puerto Rico are shown in figure 1.2.
Over the 21-year period from 1971 through 1991, Puerto Rican employee compensation grew at an annual rate of 2.1 percent, while property income for residents and nonresidents grew at an annual rate of 6 percent. Employee compensation feIl from 65 percent of domestic net income in 1971 to 48 percent in 1991. In the United States, employee compensation varied from 72.6 to 76 percent of net income over the same period.
Page 23 GAO/GGD-93-109 Puerto Rico and Section 936

Appendix I Puerto Rico’s Economy
Also, from 1971 through 1991, property income earned by nonresidents grew at an annual rate of 7.7 percent, while domestic net income (employee compensation and property income) earned by residents grew at an annual rate of 2.3 percent. Domestic net income earned by Puerto Rican residents fell from 87 percent of total domestic net income in 1971 to 64 percent in 1991.
These results are also the logical result of Puerto Rico’s development strategy and section 936, which attracted capital intensive industries to the island.
Figure 1.2: Percentage Distribution of Domestic Net Income by Employee Compensation and Property Income, 1971-1991
Percel 100
90
60
70
60
60
40
30
20
10
0
It
Flscal Year
Property income, non-residents
Property income, residents
Employee compensation
Sources: lnforme Economico Al Gobernador, 1991, and lngreso Y Producto, Puerto Rico, 1990
Page 24 GAO/GGD-93-109 Puerto Rico and Section 936

Appendii I Puerto Rico’s Economy
Employee Compensation and Property Income in the Manufacturing Sector
From 1971 through 1991, employee compensation increased from $1.8 billion to $3 billion, while property income increased from $1.1 billion to $8.3 billion (see fig. 1.3). As a percentage of net income produced in the sector, employee compensation dropped from 61 to 25 percent, while property income increased from 39 to 75 percent of net income. This occurred because employee compensation grew at an annual rate of 2.3 percent while property income grew at a rate of 8 percent.
From 1971 through 1991, employee compensation in Puerto Rico increased $5.6 billion, from $8.1 billion to $13.7 billion. The increase in employee compensation in the manufacturing sector accounted for $1.2 billion, or 22 percent, of the overall increase.
Over the same period, property income in Puerto Rico increased from $4.3 billion to $14.7 billion, or $10.4 billion. The increase in property income in the manufacturing sector accounted for $7.7 billion, or 73 percent of the overall increase. During this period, the property income of nonresidents grew $8.5 billion from $1.6 billion to $10.1 billion. If it is assumed that all of the increase in property income earned in the manufacturing sector went to nonresidents, then it accounted for about 90 percent of the increase earned by nonresidents.
The difference in the growth of employee compensation and property income in the manufacturing sector is an indication of the growth in capital intensiveness of the industries attracted to Puerto Rico. This is evidence that section 936 is working, with perhaps some unintended results. Since section 936 provides a tax benefit on the basis of income earned, it follows that U.S. firms transfer to Puerto Rico that which earns them income, which is either tangible or intangible capital. Although labor is used in production, it represents a relatively small portion of the value of the products.
Page 26 GAO/GGD-93-109 Puerto Rico and Section 936

Appendix I Puerto Rico’s Economy
Figure 1.3: Employee Compensation and Property Income in the Manufacturing Sector, 1971-1991
12 Constant 1991 dollars in bllllona
6 r 6
Fiscal year
Property income
Employee compensation
Note: Figures were adjusted for inflation using the Puerto Rican GNP deflator.
Sources: lnforme Economico Al Gobernador, 1991, and lngreso Y Producto, Puerto Rico, 1990.
Employee Compensation and Property Income in the Pharmaceutical
Other than growing in size relative to the rest of the manufacturing sector,
Industry,
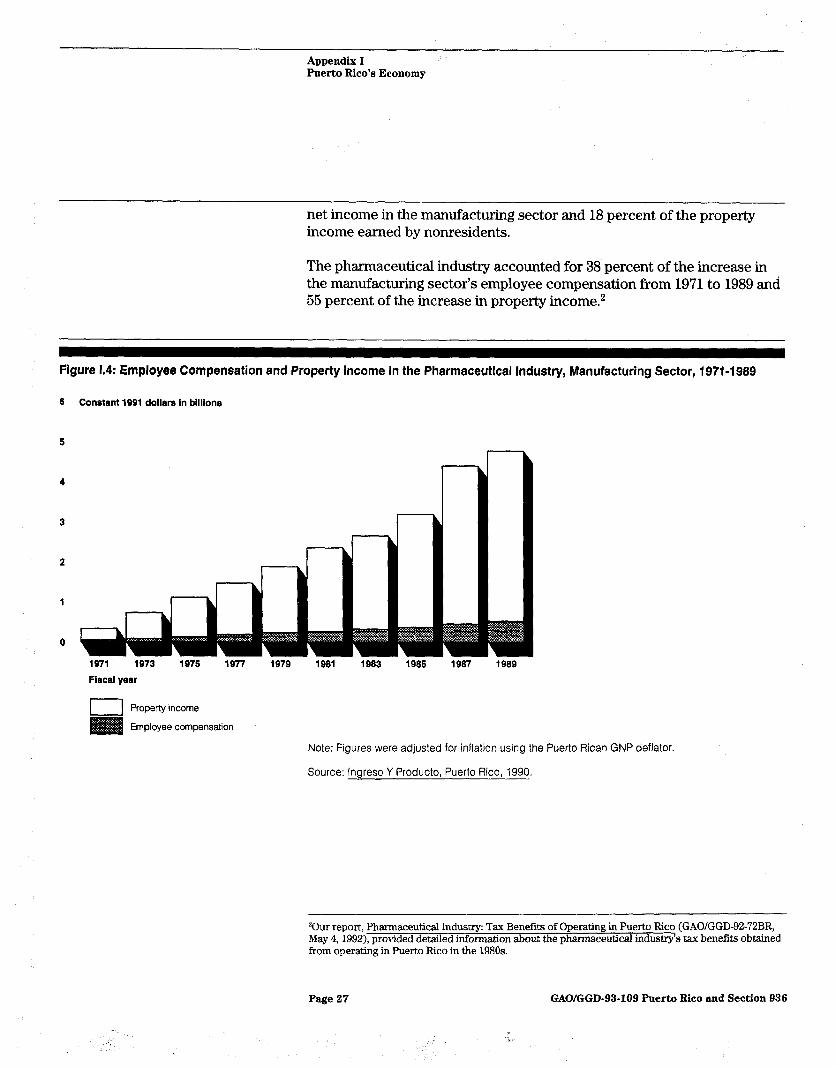
the characteristics of the pharmaceutical industry have changed little since 1971. Employee compensation increased from $42 million in 1971 to $515 million in 1989. Property income increased from $289 million in 1971 to $4.3 billion in 1989. These increases are shown in figure 1.4. The ratio of property income to employee compensation has averaged 7.8 over the period with no significant upward or downward trend.
Manufacturing Sector The pharmaceutical industry accounted for about 50 percent of the tax benefits received by section 936 manufacturing firms in Puerto Rico in 1989. The industry produces 42 percent of the net income in the manufacturing sector and accounts for 44 percent of the property income earned by nonresidents, because its firms are virtually all section 936 corporations. In contrast, in 1971 the industry produced 11 percent of the
Page 26 GAO/GGD-93-109 Puerto Rico and Section 936
Appendix I Puerto Rico’s Economy
net income in the manufacturing sector and 18 percent of the property income earned by nonresidents.
The pharmaceutical industry accounted for 38 percent of the increase in the manufacturing sector’s employee compensation from 1971 to 1989 andi 55 percent of the increase in property income.2
Figure 1.4: Employee Compensation and Property Income in the Pharmaceutical Industry, Manufacturing Sector, 1971-1989
6 Constant 1991 dollars In billions
6
4
1971 1973 1976 1977 1979 1961 1963 1965 1967 1969 Fiscal year
I Property income
Employee compensation
Note: Figures were adjusted for inflation using the Puerto Rican GNP deflator.
Source: lngreso Y Producto, Puerto Rico, 1990.
20ur report, Pharmaceutical Industry: Tax Benefits of Operating in Puerto Rico (GAOIGGD-92-72BR, May 4,1992), provided detailed information about the phwmaceutical industry’s tax benefits obtained from operating in Puerto Rico in the 1980s.
Page 27 GAO/GGD-93-109 Puerto Rico and Section 936

Appendix I Puerto Rico’s Economy
Employee Compensation and Property Income in the Metal Products and Machinery Industry, Manufacturing Sector
As the second largest segment of the manufacturing sector, in terms of net income, the metal products and machinery industry3 accounted for 26 percent of the tax benefits received by section 936 manufacturing firms in Puerto Rico in 1989. In 1989, the industry accounted for 11 percent of Puerto Rican domestic net income and 27 percent of the net income in the manufacturing sector. In 1971, the industry accounted for only 4.9 percent of total net income and 20.8 percent of the net income in the manufacturing sector.
Figure I.5 illustrates that employee compensation in this industry increased from $331 million in 1971 to $950 million in 1989 for a 5. l-percent annual rate of increase. Property income increased from $272 million in 1971 to $2.1 billion in 1989 for an 8.5-percent annual rate of increase. The ratio of property income to employee compensation increased from 0.8 in 1971 to 2.2 in 1989.
As part of the manufacturing sector, the metal products and machinery industry accounted for 49 percent of the increase in the sector’s employee compensation from 1971 to 1989 but only 25.5 percent of the increase in property income.
me metal products and machinery industry in the Puerto Rican national income accounts includes four of the section 936 industries-fabricated metal products, machinery (except electrical), electrical and electronic equipment, and instruments and related products.
Page 28 GAO/GGD-93-109 Puerto Rico and Section 936

Appendix I Puerto Rico’s Economy
Figure 1.5: Employee Compensation and Property Income in the Metal Products and Machinery Industry, Manufacturing Sector, 1971-1989
4 Constant 1991 dollars In billions
Fiscal year
I Property income Employee compensation
Note: Figures were adjusted for inflation using the Puerto Rican GNP deflator.
Source: lngreso Y Producto, Puerto Rico, 1990.
Employee Compensation and Property Income in the Trade Sector
compensation, the only major sector of the Puerto Rican economy in which employee compensation has consistently been greater than property income is the trade sector. Employee compensation increased from $1.1 billion in 1971 to $2 billion in 1989 for an annual rate of increase of 2.2 percent (see fig. 1.6). Property income increased from $737 million in 1971 to $1.5 billion in 1989, for an annual rate of increase of 4.3 percent.
Page 29 GAO/GGD-93-109 Puerto Rico and Section 936

Appendix I Puerto Rico’s Economy
Figure 1.8: Employee Compensation and Property Income in the Trade Sector, 1971-l 989
4 Constant1991 dollars In billions
1971 1973 Fiscal year
1975 1977 1979 1981 1903 1985 IQ87 1989
1 1 Property income Employee compensation
Note: Figures were adjusted for inflation using the Puerto Rican GNP deflator
Source: lngreso Y Producto, Puerto Rico, 1990.
Employee Compensation and Property Income in the Financial, Insurance, and Real Estate Sector
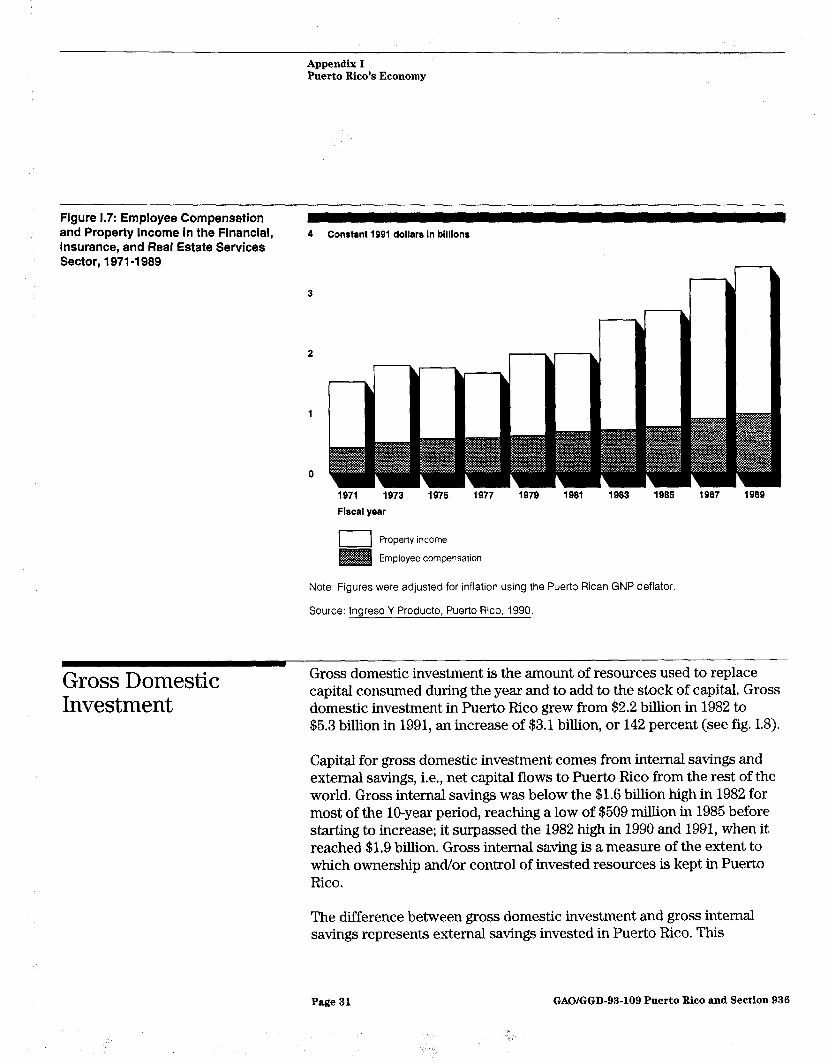
Property income has consistently been higher than employee compensation in financial, insurance, and real estate services. Figure I.7 shows that employee compensation grew from $416 million in 1971 to $988 million in 1989 for an annual rate of increase of 4.2 percent. Property income grew from $1.1 billion in 1971 to $2.4 bilIion in 1989, for an annual rate of increase of 5.3 percent.
The ratio of property income to employee compensation fluctuated over the period. It was 2.6 in 1971, dropped to 1.7 in 1976, and then stood at 2.5 in 1989.
Page 30 GAO/GGD-93-109 Puerto Rico and Section 936
II *.
Appendix I Puerto Rico’s Economy
Figure 1.7: Employee Compensation and Property Income in the Financial, Insurance, and Real Estate Services Sector, 1971-l 989
4 Constant1991 dollarsin billions
1971 1973 1975 1977 1979 1981 1983 1985 1987 1989
Fiscal year
ProDertv income - .
Employee compensation
Note: Figures were adlusted for inflation using the Puerto Rican GNP deflator.
Source: lngreso Y Producto, Puerto Rico, 1990.
Gross Domestic Investment
Gross domestic investment is the amount of resources used to replace capital consumed during the year and to add to the stock of capital. Gross domestic investment in Puerto Rico grew from $2.2 billion in 1982 to $5.3 billion in 1991, an increase of $3.1 billion, or 142 percent (see fig. 1.8).
Capital for gross domestic investment comes from internal savings and external savings, i.e., net capital flows to Puerto Rico from the rest of the world. Gross internal savings was below the $1.6 billion high in 1982 for most of the IO-year period, reaching a low of $509 million in 1985 before starting to increase; it surpassed the 1982 high in 1990 and 1991, when it reached $1.9 billion. Gross internal saving is a measure of the extent to which ownership and/or control of invested resources is kept in Puerto Rico.
The difference between gross domestic investment and gross internal savings represents external savings invested in Puerto Rico. This
Page 31 GAOIGGD-93-109 Puerto Rico and Section 936

Appendix I Puerto Rico’s Economy
difference increased from $570 million in 1982 to over $3.3 billion in 1991. It is a measure of the extent to which ownership and/or control of invested resources is maintained outside of Puerto Rico. Gross external savings was greater than gross internal savings for all years except 1982. This helps explain why the growth rate of GDP has exceeded the growth rate of GNP.
The trends in gross internal and external savings invested in Puerto Rico seem to be independent of each other; there is no correlation between the two time series over the lo-year period. Thus, even though internal savings was lower than external savings, internal savings did not tend to decrease as external savings increased. Puerto Rico must increase its rate of internal saving and investment relative to external saving and investment if its GNP is to grow as fast as its GDP. A similar growth rate for GNP and GDP
would maintain Puerto Rico’s independence from external investment sources and could help shield Puerto Rico from economic disruptions due to changes in investment patterns by non-Puerto Rican investors.
Even Puerto Rico’s internal saving, however, may not be as robust as it first appears. In subtracting transfer payments to Puerto Ricans from the U.S. and Puerto Rican governments, Puerto Rico consumed an average of $3.4 billion more per year than it produced in GNP over the lo-year period. This does not necessarily mean than Puerto Rico would have net internal dissavings without the transfer payments; it does mean that if Puerto Rico wants to maintain its level of gross internal savings in the absence of transfer payments, its people would have to curtail their consumption considerably.
,’
Page 32 GAO/GGD-93-109 Puerto Rico and Section 936
> *.;

Appendix I Puerto Rico’s Economy
Figure 1.8: Gross Domestic Investment, 1982-1991 6 Constant 1991 dollars in billions
5
4
3
-5
1982 1963 7964
Fiscal year
1985 1986 1987 1988 1989 1990 1991
- Gross domestic investment -- Gross internal saving ===*m= Gross internal saving (less U.S. transfers) - . - Gross internal saving (less all transfers)
Note: Figures were adjusted for inflation using the Puerto Rican GNP deflator.
Source: lnforme Economico Al Gobernador, 1991.
Sources of Personal Income for Puerto Rican Residents
Figure I.9 shows that while personal income of Puerto Rican residents increased from $11.4 billion in 1971 to $21.4 billion in 1991, the sources of personal income changed considerably. Employee compensation, less social security taxes, fell from 65.6 percent of personal income in 1971 to 54.5 percent in 1991. Property income as a percentage of personal income declined slightly, falling from 18.4 percent in 1971 to 16.9 percent in 1991. Transfer payments from the Puerto Rican government stayed in a narrow range between 7.3 percent and 9.1 percent of personal income.
While the percentage of personal income in the form of wages declined considerably, transfer payments from the U.S. government increased by almost a similar amount. They were 8.3 percent of personal income in 1971 but climbed to 21.1 percent in 1991. However, virtually all of the increase occurred by 1976, when transfer payments from the U.S. government
Page 33 GAO/GGD-93-109 Puerto Rico and Section 936

Appendix I Puerto Rico’s Economy
reached 19.3 percent of personal income. The 1976 plateau also applies to the decline in the percentage of employee compensation; virtually all of the decline occurred by 1976, when employee compensation fell to 55.2 percent of personal income. This marked change in the sources of personal income from wages to transfer payments from the federal government coincides with the introduction of food stamps to Puerto Rico in September 1974.
Figure 1.9: Percentage Distribution of the Sources of Personal Income for Puerto Rican Residents, 1971-1991
Pert 100
90
80
70
60
50
40
30
20
10
0
:e
Fiscal year
I Transfer payments from other sources m Transfer payments from U.S. government
Property income
Employee compensation, less SSI contributions
Sources: lnforme Economico Al Gobernador, 1991, and lngreso Y Producto, Puerto Rico, 1990.
Unemployment Rate Changes in Puerto Rico’s unemployment rate are shown in figure 1.10. The unemployment rate was 11.6 percent in 1971, climbed to a high of 23.4 percent in 1983, declined to 14.2 percent in 1990, and edged back up
Page 34 GAO/GGD-93-109 Puerto Rico and Section 936

Appendix I Puerto Rico’s Economy
to 16 percent in 1991. The rapid increase in the unemployment rate during the second half of the 1970s corresponds to the elimination of the industry-specific exemptions from the U.S. statutory minimum wage. At other times, the unemployment rate seems to follow economic events in the U.S. fairly closely.
From 1941 to 1973, minimum wage boards in Puerto Rico recommended exemptions from the U.S. minimum wage on an industry-by-industry basis. In 1974, the Fair Labor Standards Act was amended to provide for automatic annual increases in minimum wages in Puerto Rico until the U.S. statutory minimum was reached at the end of the decade. This policy took effect as the U.S. economy entered a recession and oil prices increased significantly. The oil refining industry in Puerto Rico, which was exempt from US. import quotas, was dealt a severe blow and never recovered. The combined effect of these events on the unemployment rate in Puerto Rico was dramatic. By 1977, the unemployment rate rose to 20 percent, an increase of 7 percentage points in 3 years.
In the late 1970s the unemployment rate began to decline, reaching 17 percent in 1980. In 1981 and 1982, however, the US. entered another recession; the Puerto Rican unemployment rate jumped back up to its high of 23.4 percent in 1983. Beginning in 1983, the unemployment rate edged slowly downward, reaching a low of 14.2 percent in 1990 but increasing to 16 percent in 1991.
Page 36 GAO/GGD-93-109 Puerto Rico and Section 936
I Ad.

Appendii I Puerto Rico’s Economy
Figure 1.10: Unemployment Rate, 1971-1991
25 Percent unemployment
10
5
0
1971
Year
1973 1975 1977 1979 1981 1903 1985 1987 1989 1991
Source: Computed by GAO from figures supplied by Departamento Del Trabajo Y Recursos Humanos. Puerto Rico.
Unemployment Rate by Education Level
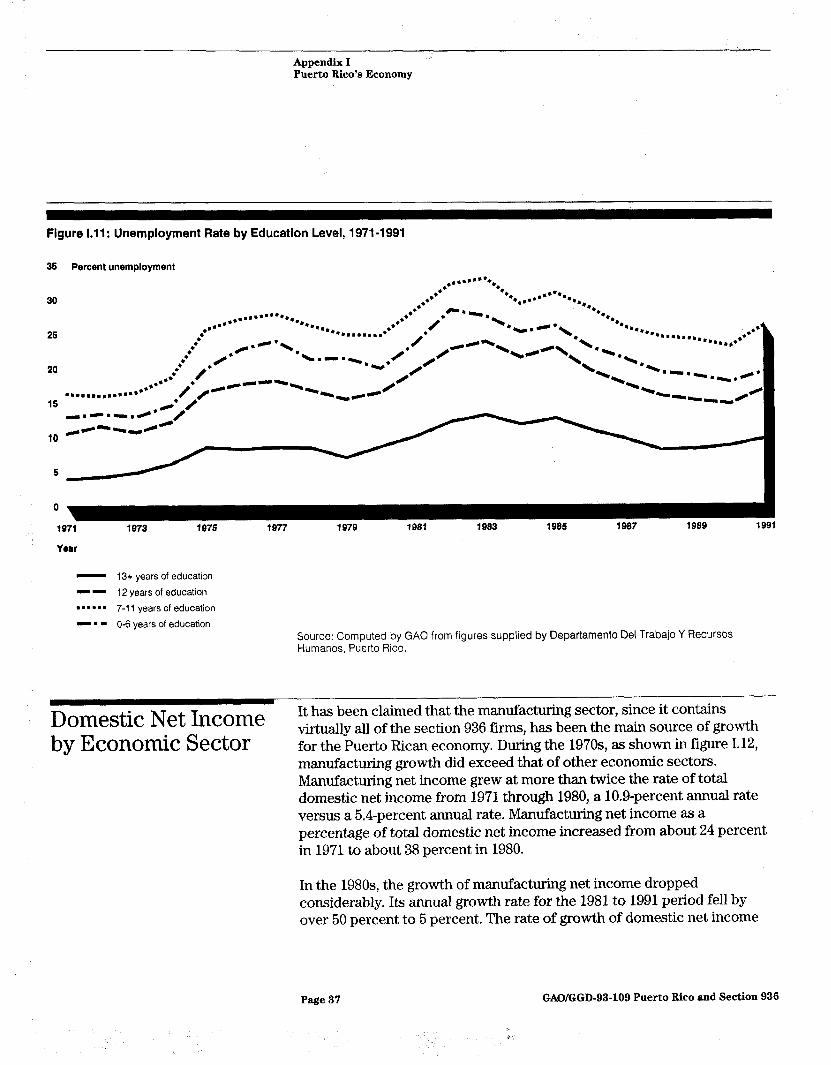
Puerto Rico’s unemployment rates by education level follow the same trend as the overall unemployment rate, except that they are shifted upward or downward (see fig. I. 11). The unemployment rate for those with 12 years of education is closest to the trend line of the overall unemployment rate. For those with 13 or more years of education, the unemployment rate follows a trend line that is about one-half of the overall rate. The unemployment rates for those with 0 to 6 and 7 to 11 years of education are above the trend line of the overall unemployment rate. The unemployment rate for those with 7 to 11 years of education reached a high of 33 percent in 1983,lO percentage points above the overall unemployment rate.
Page 36 GAO/GGD-93-109 Puerto Rico and Section 936
Appendix I Puerto Rico’s Economy
Figure I.1 1: Unemployment Rate by Education Level, 1971-1991
35 Percent unemployment
0
1971 1973
Year
1975 1977 1979 1931 1983 1985 1987 1989 1991
- 13+ years of education -9 12 years of education l .‘--. 7-11 years of education - . - O-6 years of education
Source: Computed by GAO from figures supplied by Departamento Del Trabajo Y Recursos Humanos, Puerto Rico.
Domestic Net Income by Economic Sector
virtually alI of the section 936 km.s, has been the main source of growth for the Puerto Rican economy. During the 197Os, as shown in figure 1.12, manufacturing growth did exceed that of other economic sectors. Manufacturing net income grew at more than twice the rate of total domestic net income from 1971 through 1980, a 10.9-percent annual rate versus a 5.4-percent annual rate. Manufacturing net income as a percentage of total domestic net income increased from about 24 percent in 1971 to about 38 percent in 1980.
In the 1980s the growth of manufacturing net income dropped considerably. Its annual growth rate for the 1981 to 1991 period fell by over 50 percent to 5 percent. The rate of growth of domestic net income
Page 37 GAOIGGD-93-109 Puerto Rico and Section 936
I _-

Appendix I Puerto Rico’s Economy
fell only 20 percent to an annual rate of 4.2 percent. The increase in the service sector made up for some of the slowdown in the manufacturing sector. The annual growth rate of net income in the service sector increased from 3.1 percent in the 1970s to 5 percent in the 198Os, a rate that matched that of the manufacturing sector.
During the 1980s manufacturing net income as a percentage of total domestic net income increased by only 4 percentage points to about 42 percent. Since 1985, there has been little increase in the manufacturing sector’s share of total domestic net income. Since 1985, the major sectors of the economy have grown at virtually the same rate,
These trends indicate that the growth rate of the manufacturing sector now parallels the growth rate of the rest of the Puerto Rican economy. If section 936 is restricted, the effect on future economic growth rates may be less than during earlier stages of Puerto Rico’s development because other economic sectors are more robust. On the other hand, the manufacturing sector produces a substantial portion of Puerto Rico’s domestic net income40 percent. Therefore, the Puerto Rican economy remains dependent upon manufacturing and a change in section 936 that reduces Puerto Rico’s attractiveness to manufacturing firms could have a significant effect on the economy’s output.
Page 38 GAO/GGD-93-109 Puerto Rico and Section 936
*,i

Appendii I Puerto Rico’s Economy
Figure 1.12. Percentage Distribution of Domestic Net income by Economic Sector, 1971-1991 Percent 100
90
80
70
60
50
40
30
20
10
0
1971 1973 Fiscal Year
1975 1977 1979 1981 1983 1985 1987 1989 1991
Other sectors
Government sector
~ Service sector
Trade sector
Manufacturing sector
Source: lnforme Economico Al Gobernador, 1991; and lngreso Y Producto, Puerto Rico, 1990.
Employment by Economic Sector
While the manufacturing sector’s net income grew at more than twice the rate of total domestic net income from 1971 to 1991, employment in the manufacturing sector grew at 65 percent of the growth rate of total employment. These trends are shown in figure 1.13. The annual growth rate in manufacturing employment was 1.1 percent versus 1.7 percent for total employment. As a result, manufacturing employment fell from 19 percent of total employment in 1971 to 16.8 percent in 1991.
Employment in three sectors-trade, services, and government-grew at rates greater than the rate of total employment. The annual growth rate of employment was 1.9 percent in the trade sector, 2.6 percent in the
Page 39 GAO/GGD-93-109 Puerto Rico and Section 936

Appendix I Puerto Rico’s Economy
government sector, and 3.5 percent in the service sector. Employment in the service sector as a percentage of total employment rose from 16.9 percent in 1971 to 22.9 percent in 1991.
Over the 21-year period, the Puerto Rican economy gained a net 261,000 jobs. Only 27,000, or 10 percent, were in the manufacturing sector; 103,000, or 39 percent, of the jobs gained were in the service sector; and 59,000, or 23 percent, were in the trade sector.
Proponents of section 936 point to employment multipliers as one of the benefits of section 936 corporations. Thus, they assert that for every direct job created by section 936 corporations, additional indirect jobs are also created. Notwithstanding the issues discussed in the letter relating to input-output employment multipliers, and assuming all 27,000 jobs created in the manufacturing sector were section 936 jobs, the section 936 corporations can account for, directly and indirectly, no more than 30 percent of the net job growth in Puerto Rico over the 21-year period. Section 936 manufacturing fiis can account for this portion of jobs only if the more generous multipliers sometimes claimed are used. However, since many of the indirect jobs created by section 936 corporations may be in other section 936 corporations, or in the manufacturing sector, the 30.percent figure could include considerable double counting.4
4For a discussion of the double counting issue, see The Operation and Effect of the Possessions Corporation System of Taxation, Sixth Report, Department of the Treasury, March 1989, pp. 51-56.
Page 40 GAO/GGD-93-109 Puerto Rico and Section 936

Appendix I Puerto Rico’s Economy
Figure 1.13: Percentage Distribution of Employment by Economic Sector, 1971-1991
Percent 100
90
60
70
60
50
40
30
20
10
0
1971 1973
Fiscal year
1975 1977 1979 1961 1963 1965 1967 1969 1991
El Other sectors j!zJJFg Government sector
@#@/ Service sector
Trade sector
Manufactunng sector
Sources: lnforme Economico Al Gobernador, 1991, and lngreso Y Producto, Puerto Rico, 1990.
Section 936 Funds earned, it is subject to a lo-percent Puerto Rican tollgate tax. The lo-percent tollgate tax may be reduced if the section 936 company invests its income for a period of years in certain eligible activities, including deposits in financial institutions eligible to receive section 936 funds. The income that section 936 firms earn from investments in these eligible activities is considered qualified possessions source investment income (QPSE) under section 936 and is exempt from federal income tax.
Page 41 GAO/GGD-93-109 Puerto Rico and Section 936
Y ‘*’
,_

Appendix I Puerto Rico’s Economy
Figure I.14 shows that the total direct deposits by section 936 corporations in Puerto Rican financial institutions were $7 billion in 1982.6 From 1984 through 1991, section 936 deposits ranged between $9 and $10 billion. The level has remained fairly constant because the funds repatriated to the United States each year are almost the same amount as the new section 936 income deposited in financial institutions and because of the limit on income 936 firms can earn on passive investments.
Total eligible activities are the investments in Puerto Rico and Caribbean Basin Initiative (CBI) countries that have been financed with section 936 funds through financial institutions. These activities were $12 billion in 1982, increased to $19 billion in 1987, and then declined to $13 billion in 1991. Eligible activities are greater than section 936 deposits because under Puerto Rican law, financial institutions are required to add commonwealth source funds to section 936 funds when making section 936 investments.
“Section 936 tirms can also invest directly in eligible activities. Although such investments occur, data were not available on how extensive they are.
Page 42 GAO/GGD-93-109 Puerto Rico and Section 936
.

Appendix L Puerto Rico’s Economy
Figure 1.14: Eligible Activities and Direct Deposits of Section 936 Funds Constant 1991 dollars in billions
20
18
16
14
4
2
0
1962 1963 1904 1965 1966 1967 1986 1989 1990 1991
Year
- Total eligible activities -- Total direct deposits
Note: Figures ware adjusted for inflation using the Puerto Rican GNP deflator.
Source: Government Development Bank of Puerto Rico.
Section 936 Financing In 1985, Puerto Rico began its Caribbean Basin Development Program, a
and Other program designed to promote investment in the Caribbean Basin. A special provision of the Tax Reform Act of 1986 made section 936 funds deposited
Investments in Puerto Rican financial institutions also available for financing
Promoted by Puerto development projects in CBI countries that have signed Tax Information
Rico in CBI Countries Exchange Agreements with the United States.
Annual investments by Puerto Rico, including both section 936 funds and other Puerto Rican source funds, in the CBI countries were $1 million in 1985, grew to $115 million in 1988, jumped to $489 million in 1990, and then feIl to $279 million in 1991 (see fig. 1.15). By 1991, a total of $909 million had been invested in the Caribbean Basin.
Page 43 GAOIGGD-93-109 Puerto Rico and Section 936

Appendix I Puerto Rico’s Economy
Disbursements of funds from section 936 deposits for Caribbean Basin investments began in 1988. Disbursements were $12.4 million in 1988 and grew steadily to $233.3 million in 1991.
Figure 1.15: Annual Investment Promoted by Puerto Rico in CBI Constant 1991 dollars in millions Countries, Section 936 Financing and 500 Other Investments
450
400
350
300
250
Year
- Investment in CBI countries -1 936 funds disbursed
Note: Figures were adjusted for inflation using the Puerto Rican GNP deflator.
Source: State Department of Puerto Rico.
Eligible Uses of Section 936 funds may be used to finance qualified commercial loans,
Section 936 Funds by mortgage loans, investments and loans to the government, loans to CBI
countries, consumer loans, student loans, and other eligible activities. Qpe of Investment When section 936 firms invest their section 936 funds in qualified financial
institutions and those institutions add some of their own funds before making qualified investments, the link between the section 936 funds and the specific activities in which they are invested is lost. Therefore, data were only available on the total investments in eligible activities as opposed to the specific section 936 investments in these activities.
Page 44 GAO/GGD-93-109 Puerto Rico and Section 936

Appendix I Puerto Rico’s Economy
Figure I.16 shows that commercial loans comprised the greatest portion, over time, of eligible investments. They were $4.5 billion in 1982, rising to $7.1 billion in 1989 and 1990. They were 37 percent of all eligible activities in 1982 and 48 percent in 1990. Mortgage loans increased from $1.6 billion in 1982 to $3.4 billion in 1984; they remained in the $3.5 to $4 billion range from 1985 to 1991. Investments and loans to the government stayed at about $2 to $3 billion throughout the lo-year period. “Other” investments were $3.6 billion in 1982, increased to $6.5 biliion in 1987, then fell sharply to $1.1 billion in 1991. The reason for the sharp decline in other investments was the discontinuance of consumer and student loans in 1988.
Page 46 GAO/GGD-93-109 Puerto Rico and Section 936

Appendix I Puerto Rico’s Economy
Figure 1.16: Eligible Uses of Section 936 Funds by Type of Investment Constant 1991 dollars in billions
20
10
f6
14
12
10
0
6
4
2
0
1982 Year
n Other
Investments/loans to government
Mortgage loans
Commercial loans
Note 1: “Other” includes loans to CBI countries, consumer loans, student loans, and other eligible activities.
Note 2: Figures were adjusted for inflation using the Puerto Rican GNP deflator.
Source: Government Development Bank of Puerto Rico.
Page 46 GAO/GOD-93-109 Puerto Rico and Section 936
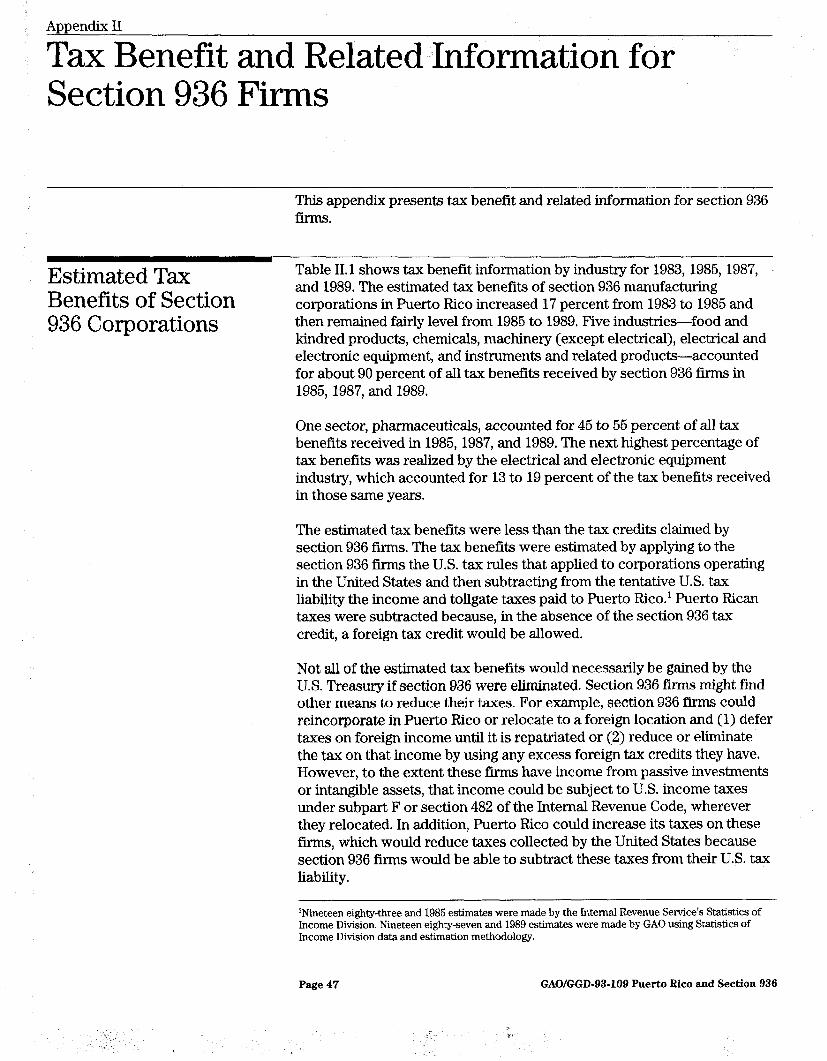
Appendix II
Tax Benefit and Related Information for Section 936 Firms
This appendix presents tax benefit and related information for section 936 firms.
Estimated Tax Benefits of Section 936 Corporations
Table II.1 shows tax benefit information by industry for 1983,1985,1987, and 1989. The estimated tax benefits of section 936 manufacturing corporations in Puerto Rico increased 17 percent from 1983 to 1985 and then remained fairly level from 1985 to 1989. Five industries-food and kindred products, chemicals, machinery (except electrical), electrical and electronic equipment, and instruments and related products-accounted for about 90 percent of all tax benefits received by section 936 firms in 1985,1987, and 1989.
One sector, pharmaceuticals, accounted for 45 to 55 percent of all tax benefits received in 1985,1987, and 1989. The next highest percentage of tax benefits was realized by the electrical and electronic equipment industry, which accounted for 13 to 19 percent of the tax benefits received in those same years.
The estimated tax benefits were less than the tax credits claimed by section 936 firms. The tax benefits were estimated by applying to the section 936 firms the U.S. tax rules that applied to corporations operating in the United States and then subtracting from the tentative U.S. tax liability the income and tollgate taxes paid to Puerto Rico.’ Puerto Rican taxes were subtracted because, in the absence of the section 936 tax credit, a foreign tax credit would be allowed.
Not all of the estimated tax benefits would necessarily be gained by the U.S. Treasury if section 936 were eliminated. Section 936 firms might find other means to reduce their taxes. For example, section 936 firms could reincorporate in Puerto Rico or relocate to a foreign location and (I) defer taxes on foreign income until it is repatriated or (2) reduce or eliminate the tax on that income by using any excess foreign tax credits they have. However, to the extent these fii have income from passive investments or intangible assets, that income could be subject to U.S. income taxes under subpart F or section 482 of the Internal Revenue Code, wherever they relocated. In addition, Puerto Rico could increase its taxes on these fm, which would reduce taxes collected by the United States because section 936 firms would be able to subtract these taxes from their U.S. tax liability.
‘Nineteen eighty-three and 1986 estimates were made by the Internal Revenue Service’s Statistics of Income Division. Nineteen eighty-seven and 1989 estimates were made by GAO using Statistics of Income Division data and estimation methodology.
Page 47 GAO/GGD-93-109 Puerto Rico and Section 936
I
: . U’
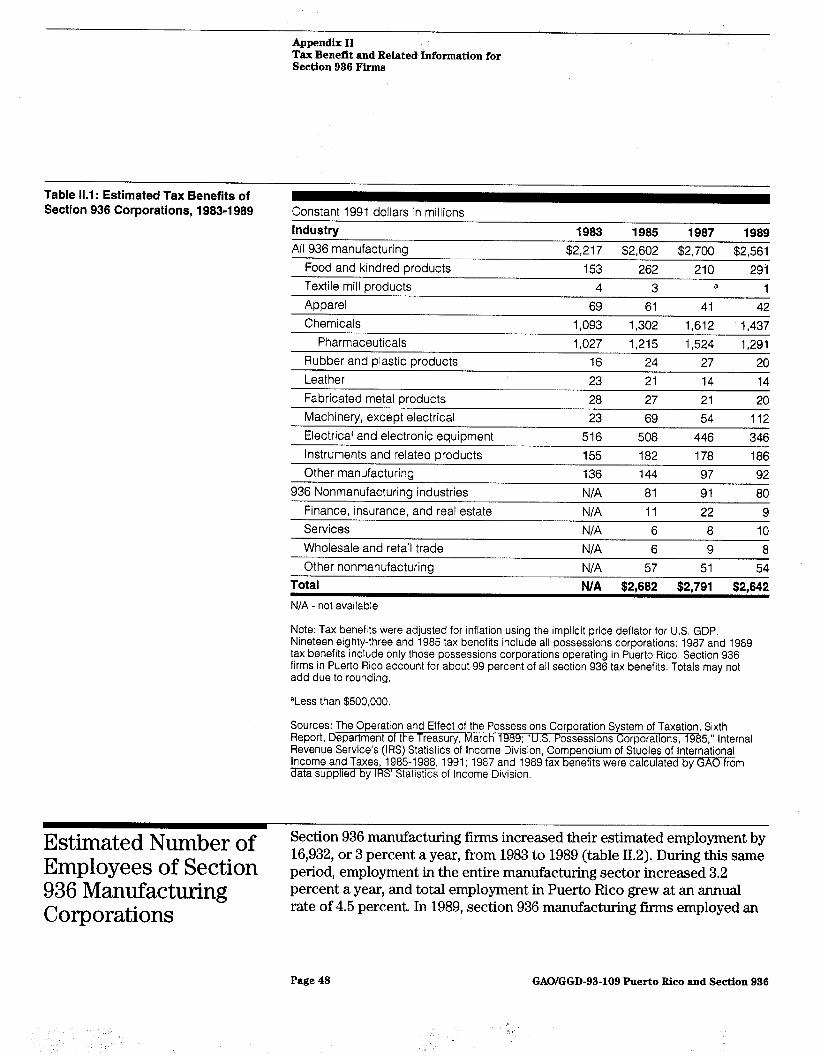
Appendix II Tax Benedt and Related Information for Section 936 Firms
Table 11.1: Estimated Tax Benefits of Section 936 Corporations, 1983-l 989 Constant 1991 dollars in millions
Industry Ail 936 manufacturing
Food and kindred products Textile mill products
Apparel Chemicals
1983 1985 1987 1989 $2,217 $2,602 $2,700 $2,561
153 262 210 29i 4 3 a 1
69 61 41 42 1.093 1,302 1,612 1,437
Pharmaceuticals 1,027 1,215 1,524 1,291 Rubber and plastic products 16 24 27 20 I eather 73 21 14 14
Fabricated metal products 28 27 21 20 Machinery, except electrical 23 69 54 112
Electrical and electronic equipment 516 508 446 346
Instruments and related products 155 182 178 186 Other manufacturing 136 144 97 92
936 Nonmanufacturing industries N/A 81 91 80
Finance, insurance, and real estate N/A 11 22 9 Services N/A 6 8 10 Wholesale and retail trade N/A 6 9 8
Other nonmanufacturina N/A 57 51 54 Total N/A $2,682 $2,791 $2,642 N/A - not available
Note: Tax benefits were adjusted for inflation using the implicit price deflator for U.S. GDP. Nineteen eighty-three and 1985 tax benefits include all possessions corporations; 1987 and 1989 tax benefits include only those possessions corporations operating in Puerto Rico. Section 936 firms in Puerto Rico account for about 99 percent of all section 936 tax benefits. Totals may not add due to rounding.
aLess than $500,000.
Sources: The Operation and Effect of the Possessions Corporation System of Taxation, Sixth Report, Department of the Treasury, March 1989. “U S Possessions Corporations, 1965,” Internal Revenue Service’s (IRS) Statistics of Income Division, Compendium of Studies of International income and Taxes, 1965-1988, 1991; 1987 and 1989 tax benefits were calculated by GAO from data supplied by IRS’ Statistics of Income Division,
Estimated Number of Section 936 manufacturing firms increased their estimated employment by
Employees of Section 16,932, or 3 percent a year, from 1983 to 1989 (table II.2). During this same period, employment in the entire manufacturing sector increased 3.2
936 Manufacturing percent a year, and total employment in Puerto Rico grew at an annual
Corporations rate of 4.5 percent. In 1989, section 936 manufacturing firms employed an
Page 48 GAO/GGD-93-109 Puerto Rico and Section 936

Appendix II Tax Benefit and Related Information for Section 936 Firms
estimated 105,511 workers, about 62.8 percent of the manufacturing workforce and 11.1 percent of the total workforce.
It is sometimes difficult to determine what is happening to estimated employment in an industry because the number of fii in the industry may be small and firms may switch from one standard industrial classification to another and back again over a short period. The significant year-to-year changes within industries may be due to these shifts. With this caveat in mind, estimated employment in the food and kindred products industry increased by 3,730, or 6.5 percent a year. Estimated employment in section 936 pharmaceutical firms increased 4,862, or 5.4 percent a year, over the ‘i-year period. And estimated employment in the apparel industry increased 3,983, or 3.9 percent a year.
Estimated employment in two significant industries declined over the 7-year period. The instruments and related products industry lost an estimated 4,166 employees, a 6.4-percent annual rate of decline. The electrical and electronic equipment industry lost an estimated 4,183 employees for an annual rate of decline of 2.9 percent.
The employment levels for several industries diverged significantly from the tax benefits received under section 936. For example, in 1989 the apparel industry employed an estimated 19,611 people, 18.6 percent of those employed by section 936 manufacturing companies, but received an estimated 1.6 percent of the manufacturing companies’ section 936 tax benefits. In contrast, the chemical industry employed an estimated 20,599 workers, 19.5 percent of the section 936 manufacturing workforce, but received 56.1 percent of the estimated tax benefits. A basic reason for the divergence in employment and tax benefits among industries lies in the amount of tangible and intangible capital employed per worker. A high capital-to-labor ratio may well give a firm a large tax benefit per employee.
Page 49 GAO/GGD-93-109 Puerto Rico and Section 936

Appendiv II Tax Benefit and Related Information for Section 936 Firms
Table 11.2: Estimated Number of Employees of Section 936 Manufacturing Corporations, 1983-l 989
Industry 1983 1985 1987 1989 All 936 manufacturing 88,579 97,726 100,916 105,511
Food and kindred products 8,098 9,452 10,364 11,828 Textile mill products 996 393 255 329 Apparel 15,628 18,565 17,363 19,611 Chemicals 15,227 16,345 21 ,116 20,599
Pharmaceuticals 13,149 14,184 18,384 18,011 Rubber and plastic products 1,173 1,469 2,449 6,475 Leather 4,720 3,588 4,036 4,466 Fabricated metal products 1,965 1,936 3,189 2,333 Machinery, except electrical 843 5,191 2,799 3,303 Electrical and electronic equipment 25,439 25,138 23,180 21,256 Instruments and related oroducts 12.649 9,676 7,071 8.483 Other manufacturing 6,109 4,486 5,059 5,376
Total economy 731,000 776,000 880,000 952,000 Note: Totals do not add because of estimating and reporting procedures used by the Department of the Treasury and IRS’ Statistics of Income Division.
Sources: The Operation and Effect of the Possessions Corporation System of Taxation, Sixth Report, Department of the Treasury, March 1989 “U S Possessions Corporations, 1985,” IRS’ Statistics of Income Division, Compendium of Studies of International Income and Taxes, 19851988, 1991; “U.S. Possessions Corporation Returns, 1987 ” Statistics of Income Bulletin, IRS Summer 1991; “U.S. Possessions Corporation Returns, 1989: Statistics of Income Bulletin, IRS: Fall 1992.
Estimated Total Employee Compensation of Section 936 Manufacturing
Table II.3 shows employee compensation levels for section 936
Corporations-
manufacturing firms. Estimated employee compensation of section 936 manufacturing firms increased by $623 million over the 7-year period for an annual rate of increase of 5.1 percent2 During this same period, employee compensation in the entire manufacturing sector increased at an annual rate of 2.8 percent, and total employee compensation in Puerto Rico grew at an annual rate of 4.3 percent. In contrast, total employee compensation in the United States increased at an annual rate of 3.5 percent from 1983 to 1989.
Changes in industry level employee compensation may be misleading for the same reasons discussed in relation to table 11.2. With this caveat in mind, estimated employee compensation in the pharmaceutical industry increased by $219 million over the 7-year period, an average annual
2Estimated employee compensation includes fringe benefits equal to 23.5 percent of direct wages as used by the Department of the Treasury.
Page 60 GAO/GGD-93-109 Puerto Rico and Section 936

Appendix II Tax Benefit and Related Information for Section 936 Firms
Table 11.3: Estimated Total Employee Compensation of Section 936 Manufacturing Corporations, 1983-l 989
Estimated Compensation Per Employee of Section 936 Manufacturing Corporations
increase of 7.7 percent. Estimated employee compensation in the food and kindred products industry increased $80 million, or 6.7 percent a year. However, estimated employee compensation in the electrical and electronic equipment industry decreased $108 million, an annual decrease of 3.7 percent.
Constant 1991 dollars in millions Industry 1983 1985 1987 1989 All 936 manufacturing $1,781 $2,013 $2,138 $2,404
Food and kindred products 167 193 207 247 Textile mill products 13 5 5 4 Apparel 220 244 222 248 Chemicais 443 484 650 677
Pharmaceuticals 389 431 579 608 Rubber and plastic products 20 28 47 232 Leather 68 50 52 57 Fabricated metal products 42 41 62 45 Machinery, except electrical 18 120 83 95 Electrical and electronic equipment 540 507 465 432 Instruments and related products 169 210 171 195 Other manufacturing 139 86 112 125
Total economy 11,080 11,897 12,696 14,220
Note: Employee compensation was adjusted for inflation using the implicit price deflator for Puerto Rican GNP. Totals do not add because of estimating and reporting procedures used by the Department of the Treasury and IRS’ Statistics of Income Division.
Sources: The Operation and Effect of the Possessions Corporation System of Taxation, Sixth Report, Department of the Treasury, March 1989; “U.S. Possessions Corporations, 1985,” IRS’ Statistics of Income Division, Compendium of Studies of International Income and Taxes, 1985-1988, 1991; “U.S. Posse~letin, IRS Summer 1991; “U.S. Possessions Corporation Returns, 1989,” IRS: Fall 1992.
Statisticsin,
Estimated compensation per employee of section 936 manufacturing corporations increased from $20,106 to $22,784 over the ‘i-year period for an estimated annual increase of 2.1 percent (see table 11.4). Compensation per employee for the total Puerto Rican economy, however, decreased from $15,157 to $14,937 over the period for an estimated annual decrease of 0.5 percent. Average compensation per employee in the United States increased from $26,744 to $28,288 over the same period for an average annual increase of 1 percent.
Page 61 GAOIGGD-93-109 Puerto Rico and Section 936

Appendix II Tax Benefit and Related Information for Section 936 Fhs
Over the 7-year period the pharmaceutical industry paid the nighest compensation per employee, averaging almost 50-percent nigher than the average for all section 936 companies and log-percent higher than the average for the Puerto Rican economy. The apparel industry paid the lowest compensation per employee over the period, averaging 3%percent less than the average for all section 936 companies and 12-percent less than the average for the Puerto Rican economy. The leather and textile industries paid compensation levels similar to that of the apparel industry.
Table 11.4: Estimated Compensation Per Employee of Section 936 Manufacturing Corporations, 1983-l 989
Constant 1991 dollars Industry All 936 manufacturing
1983 1985 1987 1989 $20,106 $20,598 $21,186 $22,784
Food and kindred products 20,622 20,419 19,973 20,883 Textile mill products 13,052 12,723 19,608 12,158 Apparel 14,077 13,143 12,786 12,646 Chemicals 29,093 29.612 30.782 32.866
Pharmaceuticals 29,584 30,386 31,495 33,757 Rubber and plastic products 17,050 19,061 19,192 35,830 Leather 14,407 13,935 12,884 12,763 Fabricated metal products 21.374 21.178 19.442 19.288 Machinery, except electrical 21,352 23,117 29,653 28,762 Electrical and electronic equipment 21,227 20,169 20,060 20,324 Instruments and related products 13,361 21,703 24,183 22,987 Other manufacturing 22,753 19,171 22,139 23,251
Total economy 15,157 15,330 14,428 14,937 Note: Employee compensation was adjusted for inflation using the implicit price deflator for Puerto Rican GNP.
Sources: The Operation and Effect of the Possessions Corporation System of Taxation, Sixth Report, Department of the Treasurv. March 1989: “U.S. Possessions Corporations. 1985.” IRS’ Statistics of Income Division, Compendium of Studies of International Income andTaxes; 1985-1988, 1991; “U.S. Possessions Corporationletin, IHS Summer 1991; “U.S. Possessions Corporation Returns, 1989,“in IRS: Fall 1992.
Page 62 GAO/GGD-93-109 Puerto Rico and Section 936

Appendix II Tax Benefit and Related Information for Section 936 Firms
Estimated Tax Benefits Per Employee of Section 936 Manufacturing Corporations
Estimated average tax benefits per employee of section 936 manufacturing corporations were $25,029 in 1983, increased to $26,755 in 1987, and then declined to $24,272 in 1989. These trends are shown in table II.5
The tax benefits per employee that we computed ranged from a low of $2,142 in the apparel industry in 1989 to a high of $85,660 in the pharmaceutical industry in 1985. Other industries with relatively low tax benefits per employee were textile miIl products and leather. Industries with higher tax benefits per employee included food and kindred products, machinery (except electrical), electrical and electronic equipment, and instruments and related products.
Table 11.5: Estimated Tax Benefits Per Employee of Section 936 Manufacturing Corporations, 1983-l 989
Constant 1991 dollars Industry All 936 manufacturing
Food and kindred products
1983 1985 1987 1989 $25,029 $26,625 $26,755 $24,272
18,894 27,719 20,262 24,603 Textile mill products 4,016 7,634 a 3,040 Apparel 4,415 3,286 2,361 2,142 Chemicals 71,780 79,657 76,340 69,761
Pharmaceuticals 78,105 85,660 82,898 71,678 Rubber and plastic products 13,640 16,338 11,025 3,089 Leather 4,873 5,853 3,469 3,135 Fabricated metal products 14,249 13,946 6,585 8,573 Machinery, except electrical 27,284 13,292 19,293 33,909 Electrical and electronic equipment 20,284 20,208 19,241 16,278 Instruments and related products 12,254 18,809 25,173 21,926 Other manufacturing 22,262 32,100 19,174 17,113
Note: Tax benefits were adjusted for inflation using the implicit price deflator for U.S. GDP.
aNot computed because tax benefits were too small.
Sources: The Operation and Effect of the Possessions Corporation System of Taxation, Sixth Report, Department of the Treasury, March 1989 “U S Possessions Corporations, 1985,” IRS’ Statistics of Income Division, Compendium of Studies of International Income and Taxes, 19851988, 1991; “U.S. Possessions Corporation Returns, 1987 ” Statistics of Income Bulletin, if%-%%ier 1991; “U.S. Possessions Corporation Returns, 1989:’ Statistics of Income Bulletin, IRS, Fall 1992.
Page 63 GAOIGGD-93-109 Puerto Rico and Section 936

Appendix II Tax Benefit and Related Information for Section 936 Firms
Ratio of Tax Benefits As shown in table 11.6, the overall ratio of tax benefits to employee
Per Employee to compensation feIl from 124 percent in 1983 to 107 percent in 1989. The ratio in the pharmaceutical industry fell from a high of 282 percent in 1985
Employee to 212 percent in 1989. The other industries also experienced a decline in
Compensation Per the ratio of tax benefits to employee compensation, except food and
Employee, kindred products and machinery (except electrical), where the ratio fluctuated considerably.
Manufacturing Sector Changes in the ratio of tax benefits to employee compensation result from changes in profits, employee compensation, or tax rates.
Our analysis indicated that the increase of 5 percentage points in the ratio from 1983 to 1985 was due to a slight increase in the average effective tax rate the manufacturing firms used in determining their tax credits under section 936. The decline of 4 percentage points in the ratio from 1985 to 1987 was due to a decline in the average effective tax rate that more than offset the increase in the ratio due to the net effect of profits and employee compensation. The decline of 18 percentage points in the ratio from 1987 to 1989 was due entirely to the decline in tax rates3
The decrease in tax rates and consequent tax benefits for a given level of profits would tend to lessen the incentive provided by section 936 for corporations to invest or expand investment in Puerto Rico.
The ratio of 107 percent in 1989 for all manufacturing corporations is almost equivalent to a loo-percent wage credit, including fringe benefits. If a loo-percent wage credit were substituted for section 936, one industry, chemicals, would be most affected. It would lose about half of its current benefits, assuming no response to changes in the tax law. Two industries, food and kindred products and machinery, would be hurt slightly. The other industries, with ratios below 100 percent, would benefit from a change to a loo-percent wage credit to the extent they have sufficient profits against which they could deduct the wage credit.
3The change in the manufacturing corporations’ average effective tax rate mirrors the change in the statutory tax rate. The statutory tax rate was 46 percent before 1987. In 1987, it was 40 percent. Since 1987, the statutory rate has been 34 percent. Although section 936 firms’ income is not subject to federal tax, the value of the tax benefit is computed on the basis of the federal tax rate.
Page 54 GAO/GGD-93-109 Puerto Rico and Section 936

Appendix II Tax Benefit and ReIated Information for Section 936 Firms
Table 11.6: Ratio of lax Benefits Per Employee to Employee Compensation Per Employee, Manufacturing Sector, 1983-l 989
In percent Industry 1983 1985 1987 1989 All 936 manufacturina 124 129 126 107
Food and kindred products 92 136 101 118 Textile mill products 31 60 a 25 Aware1 31 25 18 17 Chemicals 247 269 248 212
Pharmaceuticals 264 282 263 212 Rubber and Dlastic Droducts 80 86 57 9 Leather 34 42 27 25 Fabricated metal products 67 66 34 44 Machinery, exceDt electrical 128 58 65 118 Electrical and electronic equipment 96 100 96 80 Instruments and related products 92 87 104 95
Estimated One of the most perplexing problems facing policymakers concerned with
First-Round Effects section 936 and Puerto Rico’s economy is the extent to which section 936 firms will leave or be attracted to Puerto Rico if section 936 is changed.
on the Manufacturing Tables II.7 through II. 10 present information relevant to answering this
Sector of Substituting question. The tables look at the first-round effects on section 936 firms in Puerto Rico’s manufacturing sector of applying the President’s proposed
a Wage Credit for wage credit limit and three additional formulations to the section 936 tax
Section 936 credits that would be available to possessions corporations.4 Because firms consider many factors when deciding where to locate internationally, the changes affecting the tax credits alone may or may not alter firms’ decisions about future investment levels in Puerto Rico.
4J?irst-round effects look at how a change in policy affects the benefits (costs) a person or corporation receives bays), assuming no change in behavior to mitigate any losses or enhance any gains. The final effects would take into account how firms alter their behavior in response to changes in tax policy.
Other manufacturing 98 167 76 74
Note: Tax benefits were adjusted for inflation using the implicit price deflator for U.S. GDP and empioyee compensation was adjusted for inflation using the implicit price deflator for Puerto Rican GNP.
aNot computed because tax benefits were not given.
Sources: The Operation and Effect of the Possessions Corporation System of Taxation, Sixth Report, Department of the Treasury, March 1989; “U S Possessions Corporations, 1985,” IRS’ Statistics of Income Division, Compendium of Studies bf International Income and Taxes, 1985-1988, 1991; “U,S. Possessionsletin, II-6 Summer 1991; “U.S. Possessions Corporation Returns, 1989,min, IRS: Fall 1992.
Page 56 GAO/GGD-93-109 Puerto Rico and Section 936

Appendix II Tax Benefit and Related Information for Section 936 Firms
We considered 60- and loo-percent wage credit caps and calculated the tax credit for each first with wages excluding fringe benefits (as in the President’s proposal) and second with wages including fringe benefits. We calculated section 936 firms’ 1989 tax credits under section 936. We then calculated the tax credits that would be available based on the wage credit caps, in all cases including the President’s proposed restriction to limit the QPSII tax exemption to 80 percent of firms’ tangible assets. In calculating the wage credits, we assumed that the credit was limited to the firms’ U.S. tax liabilities, i.e., a firm could not receive a tax refund exceeding the amount of its tax credits under an unchanged section 936. Finally, we used the lesser of the firms’ 1989 section 936 tax credits or the credits available under the wage credit proposals to determine how much the firms’ total tax credits would be reduced, if at all, by the wage credit caps.
Our calculations using 1989 data on the 308 section 936 firms in the manufacturing sector that reported actual employee compensation data showed that limiting the section 936 tax credit to various wage credit maximums would affect some, but not all, firms. The firms not affected by the wage credit limit retain their full 1989 section 936 tax credits.
The percentage of the 308 firms affected by the wage credit ranged from a high of 43.5 percent under a go-percent wage credit, excluding fringe benefits, to a low of 35.1 percent under a loo-percent wage credit, including fringe benefits. The affected firms employed from 47.2 to 39.7 percent of section 936 employees, paid from 53.0 to 44.4 percent of section 936 employee compensation, and lost from 67.7 to 51.6 percent of the total section 936 tax credits. Under the most restrictive wage credit, the go-percent wage credit without fringe benefits, 42,968 individuals were employed in firms receiving reduced tax credits. The 42,968 employees represent 47.2 percent of all employees in the 308 section 936 firms used in the analysis and represent 4.5 percent of all employees in the Puerto Rican economy.
Firms losing tax credits did not lose them all. Some firms would lose only a small fraction of their tax credits; their incentive to remain in Puerto Rico would be much the same as before. Other firms would lose a large fraction of their tax credits; their incentive to remain in Puerto Rico, to the extent it was based on existing tax credits continuing, would be considerably weakened. Many firms losing tax credits would likely reconsider their decision to locate in Puerto Rico, to the extent that decision was based on the level of taxation. Firms with a substantial investment in physical assets in Puerto Rico would have to weigh the loss
Page 66 GAO/GGD-93-109 Puerto Rico and Section 936
I” ,,

Appendix II Tax Benefit and Related Information for Section 936 Firms
of tax credits against the cost of building facilities or transferring production elsewhere.
Under the 60-percent wage credit excluding fringe benefits, 34 firms, or 11 percent of the 308 firms analyzed, would lose 75 percent or more of the tax credits they would otherwise receive with no change to section 936. These 34 firms employed 9,623 individuals, or 10.6 percent of employees in the 308 firms. The 34 firms could lose $1.3 billion in tax credits, or 84.9 percent of the credits they otherwise could claim. The $1.3 billion in credits lost by these 34 firms represents 72.6 percent of all of the credits lost under this wage credit formulation.
Under the least restrictive wage credit, a loo-percent wage credit including fringe benefits, 14 fm would lose 75 percent or more of their tax credits. These 14 firms employed 2,774 workers in 1989, or 3.0 percent of the total employees in the 308 firms. The 14 firms would lose an estimated $663 million in credits, or 83.7 percent of the credits they claimed and 49.9 percent of the $1.3 billion credits lost by the 308 firms.
Page 57 GAOGGD-93-109 Puerto Rico and Section 936
1 4,

Appendix II Tax Benefit and Related Information for Section 936 Firms
Table 11.7: Estimated Effects of a 60-Percent Wage Credit, Excluding Fringe Benefits, on Section 936 Tax Credits, Manufacturing Sector
Constant 1991 dollars in miilions Amount/
percent Amount/ Number/ Number/ employee percent Amount/
percent of percent of compensation total tax percent tax Percent of tax firms employees without fringe credits credits lost, credits lost affected affected benefits claimed 1989 0 percent 174 48,133 $971.3 $171.1 $0.0
56.5% 52.8% 47.0% 6.6% 0.0% Oto 25 percent 26 7,858 147.9 68.9 6.3
8.4% 8.6% 7,2% 2.7% 0.4% 25to50 percent
36 12,479 296.2 272.1 103.9
11.7% 13.7% 14.3% 10.6% 6.0% 38 13,008 338.9 571.9 368.0
12.3% 14.3% 16.4% 22.2% 21.1% 34 9,623 311.3 1,490.2 1,265.6
11.0% 10.6% 15.1% 57.9% 72.6% 308 91,101 2,065.6 2,574.l 1,743.8
100.0% 100.0% 100.0% 100.0% 100.0%
50to 75 percent
75to100 percent
Total
Note: Dollar amounts were adjusted for inflation. Employee compensation was adjusted using the Puerto Rican GNP deflator, and tax credits lost were adjusted using the US. GDP deflator. Totals may not add due to rounding.
Source: Computed by GAO using 1989 data supplied by the IRS’ Statistics of Income Division. Calculations based on data for 308 firms that reported actual employee compensation on their Employer’s Annual Federal Unemployment (FUTA) Tax Return (Form 940). The calculations assume full phase-in of the wage credit.
Page 58 GAO/GGD-93-109 Puerto Rico and Section 936
1

Appendix II Tax Benefit and ReIated Information for Section 936 Firms
Table 11.8: Estimated Effects of a 80-Percent Wage Credit, Including Fringe Benefits, on Section 936 lax Credits, Manufacturing Sector
Constant 1991 dollars in millions Amount/ percent Amount/
Number/ Number/ employee percent Amount/ percent of percent of compensation total tax percent tax
Percent of tax firms employees without fringe credits credits lost, credits lost affected affected benefits claimed 1989 0 percent 183 50,451 $1,026.3 $209.3 $0.0
59.4% 55.4% 49.7% 8.1% 0.0% Oto 25 percent 33 9,876 200.6 129.8 22.0
10.7% 10.8% 9.7% 5.0% 1.3% 25to50 percent
26 11,188 275.7 277.7 98.6
8.4% 12.3% 13.3% 10.8% 6.0% 50to75 percent
43 13,699 369.4 804.4 531.0
14.0% 15.0% 17.9% 31.2% 32.5% 75 to 100 23 5,888 193.6 1,152.g 984.4 percent
Total 7.5% 6.5% 9.4% 44.8% 60.2%
308 91,102 2,065.6 2,574.l 1,636.O 100.0% 100.0% 100.0% 100.0% 100.0%
Note: Dollar amounts were adjusted for inflation. Employee compensation was adjusted using the Puerto Rican GNP deflator, and tax credits lost were adjusted using the U.S. GDP deflator. Totals may not add due to rounding.
Source: Computed by GAO using 1989 data supplied by IRS’ Statistics of Income Division. Calculations based on data for 308 firms that reported actual employee compensation on their Employer’s Annual Federal Unemployment (FUTA) Tax Return (Form 940). The calculations assume full phase-in of the wage credit.
Page 69 GAO/GGD-93-109 Puerto Rico and Section 936

Appendix II Tax Benefit and Related Information for Section 936 Firms
Table 5.9: Estimated Effects of a loo-Percent Wage Credit, Excluding Fringe Benefits, on Section 936 Tax Credits, Manufacturing Sector
Constant 1991 dollars in millions
Amount/ percent Amount/
Number/ Number/ employee percent Amount/ percent of percent of compensation total tax
Percent of tax firms percent tax
credits lost affected employees without fringe credits credits lost,
affected benefits claimed 1989 0 percent 194 53,343 $1,100.5 $275.4 $0.0
63.0% 58.6% 53.3% 10.7% 0.0% 0 to 25 percent 36 15,779 355.3 301.7 44.3
11.7% 17.3% 17.2% 11.7% 3.0% 25 to 50 27 8,932 191.4 272.2 115.8 percent
50 to 75
8.8% 9.8% 9.3% 10.6% 8.0%
33 9,110 285.6 770,9 493.0 percent
75 to 100 Dercent
10.7% 10.0% 13.8% 29.9% 33.8%
18 3,938 132.9 953.9 803.6
5.8% 4.3% 6.4% 37.1% 55.2% Total 308 91,102 2,065.6 2,574.l 1,456.8
100.0% 100.0% 100.0% 100.0% 100.0% Note: Dollar amounts were adjusted for inflation. Employee compensation was adjusted using the Puerto Rican GNP deflator, and tax credits lost were adjusted using the US. GDP deflator. Totals may not add due to rounding.
Source: Computed by GAO using 1989 data supplied by IRS’ Statistics of Income Division. Calculations based on data for 308 firms that reported actual employee compensation on their Employer’s Annual Federal Unemployment (FUTA) Tax Return (Form 940). The calculations assume full phase-in of the wage credit.
Page 60 GAO/GGD-93-109 Puerto Rico and Section 936

Appendix II Tax Benefit and Related Information for Section 936 Firms
Table il.1 0: Estimated Effects of a loo-Percent Wage Credit, Including Fringe Benefits, on Section 936 Tax Credits, Manufacturing Sector
Constant 1991 dollars in millions Amount/ percent
Number/ Number/ employee percent of percent of compensation
Percent of tax firms employees without fringe credits lost affected affected benefits
Amount/ percent Amount/
total tax percent tax credits credits lost,
claimed 1989 0 percent 200 54,911 $1,149.4 $324.9 $0.0
64.9% 60.3% 55.6% 12.6% 0.0%
0 to 25 percent 36 15,403 330.7 284.4 30.7
11.7% 16.9% 16.0% 11.0% 2.3%
25 to 50 33 10,238 249.2 413.7 157.2 percent
10.7% 11.2% 12.1% 16.1% 11.8% 50 to 75 25 7,776 239.5 758.7 478.1 percent
8.15 8.5% 11.6% 29.5% 36.0%
75 to 100 14 2,774 96.9 792.5 663.3 percent
4.5% 3.0% 4.7% 30.8% 49.9%
Total 308 91,102 2,065.6 2,574.l 1,329.3 100.0% 100.0% 100.0% 100.0% 100.0%
Note: Dollar amounts were adjusted for inflation. Employee compensation was adjusted using the Puerto Rican GNP deflator, and tax credits lost were adjusted using the U.S. GDP deflator. Totals may not add due to rounding.
Source: Computed by GAO using 1989 data supplied by IRS’ Statistics of Income Division. Calculations based on data for 308 firms that reported actual employee compensation on their Employer’s Annual Federal Unemployment (FUTA) Tax Return (Form 940). The calculations assume full phase-in of the wage credit.
Taxes Paid to the Puerto Rican Government by Section 936 Firms
Section 936 firms paid over $460 million dollars in taxes to the Puerto Rican government in 1987 and 1989, as shown in table 11.11. More than two-thirds of the total was income taxes. One-third was tollgate taxes that Puerto Rico charges on income transferred off the island.
Page 61 GAO/GGD-93-109 Puerto Rico and Section 936
Y ::

Appendix II Tax Benefit and Related Information for Section 936 Firms
Table 11.11: Taxes Paid to the Puerto Rican Government by Section 936 Firms
Constant 1991 dollars in millions
Year Tollgate
taxes Income
taxes Total 1987 $142.4 $310.7 $453.1 1989 132.0 325.1 457.1 Note: Dollar amounts were adjusted for inflation using the implicit price deflator for Puerto Rican GNP.
Source: IRS’ Statistics of Income Division.
Estimated Fixed F’ixed assets are a firm’s or an industry’s net property, plant, and
Assets of Section 936 equipment, the physical factors of production used to produce a product. Table II. 12 shows that the fmed assets of the section 936 firms in the
Corporations, manufacturing sector grew from $2.6 billion in 1983 to $4 billion in 1989,
Manufacturing Sector for an annual growth rate of 7.2 percent.
The chemical industry accounted for the largest dollar amount of manufacturing fixed assets in 1989, $2.2 billion, or 55.6 percent of all the estimated fixed assets of section 936 firms in the manufacturing sector. The next largest percentage was the food and kindred products industry with 9.4 percent of the fixed assets. This was followed by the electrical and electronic equipment industry with 8.4 percent and the instruments and related products industry with 6.8 percent.
One alternative federal tax policy for Puerto Rico might be to provide tax credits for productive assets placed in Puerto Rico. The distribution of fixed assets is similar to the distribution of tax benefits provided under section 936 (see table 11.4). Accordingly, if tax credits were allocated on the basis of fured assets, the initial allocation of credits would be similar to that occurring under present law.
Page 62 GAO/GGD-93-109 Puerto Rico and Section 936

Appendix II Tax Benefit and Related Information for Section 936 Firms
Table 11.12: Estimated Fixed Assets of Section 936 Coroorations. Constant 1991 dollars in millions Manufacturing Sector, 1983-1989 industry 1983 1985 1987 1989
All 936 manufacturinq $2,630 $2,908 $3,226 $4,024 Food and kindred croducts 272 344 347 378 Textile mill products 2 a a 1 Apparel 38 35 50 89 Chemicals 1,195 1,353 1,640 2,239
Pharmaceuticals 1,115 1,265 1,531 2,092 Rubber and plastic products 45 62 92 119 Leather 17 9 10 11 Fabricated metal products 92 86 118 89 Machinery, except electrical 20 80 68 67 Electrical and electronic eauioment 407 448 313 339 Instruments and related products 183 164 287 272 Other manufacturing 359 326 301 420
Note: Fixed assets include net property, plant, and equipment. Fixed asset values were adjusted for inflation using the implicit price deflator for Puerto Rican GNP. Numbers may not add to totals due to rounding.
aLess than $500,000.
Source: IRS’ Statistics of Income Division Bulletins
Estimated Charitable Section 936 firms made contributions totaling about $5.6 million in 1987
Contributions of and $3.2 million in 1989 (see table 11.13). The chemical industry, and specifically its pharmaceutical sector, contributed the largest amount in
Section 936 Manufacturing Corporations
each year.
Page 63 GAO/GGD-93-109 Puerto Rico and Section 936
b

Appendix II Tax Benefit and Related Information for Section 936 Firms
Table 11.13: Estimated Charitable Contributions of Section 936 Manufacturing Corporations
Apparel
Constant 1991 dollars in thousands
Chemicals
Industry
Pharmaceuticals
All 936 manufacturing Food and kindred products Textile mill products
38.3 113.6 2,166.7 1,101.6
1987
2.149.9
1989
1.023.9
$5578.5 $3,179.6 556.4 528.5
0.6 1.6
Rubber and plastic products 1,591.8 16.7
Leather 34.7 98.3 Fabricated metal products 193.8 13.5 Machinery, except electrical 571.7 847.1 Electrical and electronic equipment 170.9 94.2 Instruments and related products 118.7 243.8 Other manufacturing 135.0 120.8
Note: Data represent contributions section 936 firms, located in Puerto Rico, reported on their tax returns. The data do not specify whether the contributions were made specifically to Puerto Rican charities. Contributions were adjusted for inflation using the implicit price deflator for Puerto Rican GNP.
Source: Contributions were calculated by GAO from data supplied by the IRS’ Statistics of Income Division.
Maritime Shipments Between the United
Table II.14 shows that $11.4 billion of the U.S. 1992 imports came from Puerto Rico by ship. Seven billion seven hundred million dollars of U.S. exports in 1992 went by ship to Puerto Rico.
States and Puerto Rico in 1992
Page 64 GAOIGGD-93-109 Puerto Rico and Section 936
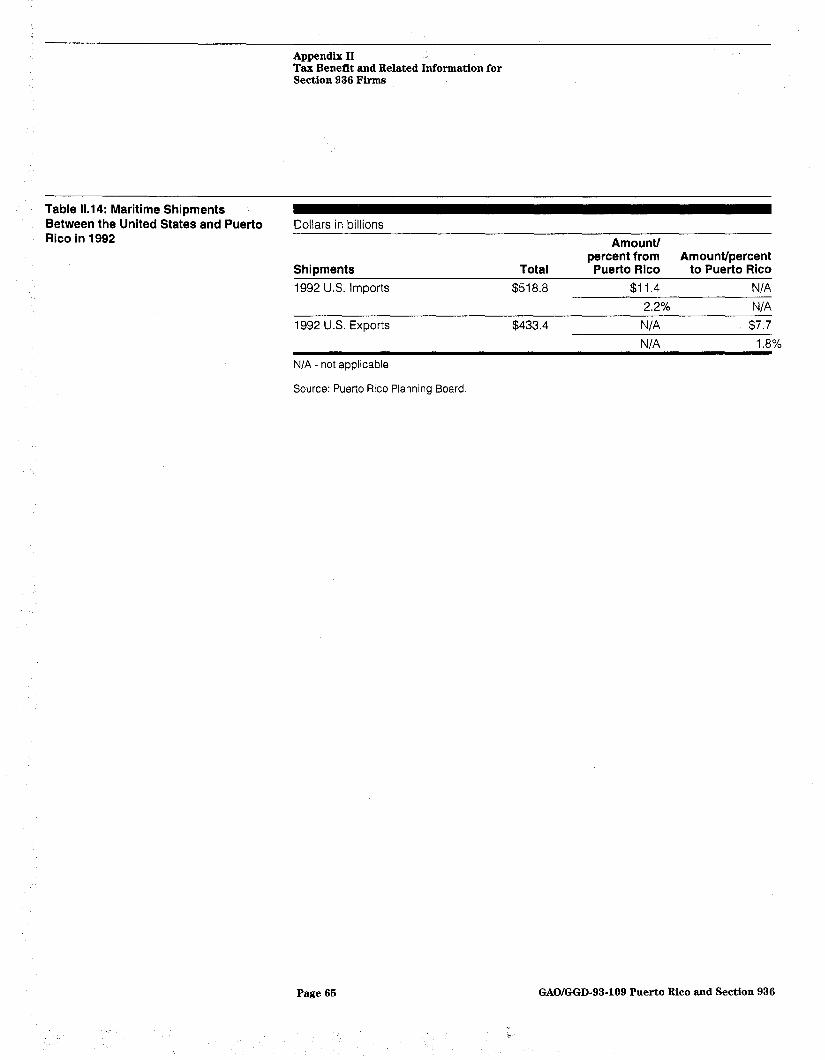
Appendix II Tax Beneflt and Related Information for Section 936 Firms
Table 11.14: Maritime Shipments
Rico in 1992 Between the United States and Puerto Dollars in billions
oercent from Amount/
Amountloercent Shipments 1992 U.S. Imports
Total $518.8
’ Puerto Rico $11.4
to Pue;to Rico N/A
2.2% NIA 1992 U.S. Exports $433.4 N/A $7.7
NIA 1.8% N/A - not applicable
Source: Puerto Rico Planning Board
Page 65 GAO/GGD-93-109 Puerto Rico and Section 936

Appendix III
Major Contributors to This Report
General Government Division, Washington,
Michael Brostek, Assistant Director, Tax Policy and Administration Issues
D.C. Thomas J. McCool, Assistant Director, Tax Policy and
Administration Issues Lawrence M. Korb, Assignment Manager MacDonald R. Phillips, Economist-in-Charge Patricia H. McGuire, Senior Computer Specialist Edward J. Nannenhorn, Economist Pamela Vines, Managing Editor Balvinder Sangha, Intern
Office of the Chief Economist,
James R. White, Assistant Director
Washington, D.C.
(268671) Page 66 GAO/GGD-93-109 Puerto Rico and Section 936
Ordering Information ~-
The first copy of each GAO report and testimony is free. Additional copies are $2 each. Orders should be sent to the following address, accompanied by a check or money order made out to the Superintendent of Documents, when necessary. Orders for 100 or more copies to be mailed to a single address are discounted 25 percent.
Orders by mail:
U.S. General Accounting Office P.O. Box 6015 Gaithersburg, MD 20884-6015
or visit:
Room 1000 700 4th St. NW (corner of 4th and G Sts. NW) U.S. General Accounting Office Washington, DC
Orders may also be placed by calling (202) 512-6000 or by using fax number (301) 258-4066.
PRINTED ON &B RECYCLED PAPER

-- United States General Accounting Office Washington, D.C. 20548
Official Business Penalty for Private Use $300
First-Class Mail Postage & Fees Paid
GAO I Permit No. GlOO I