Finance - Notes
34
Chapter 1 Introduction to Corporate Finance Balance Sheet Model of the Firm • Fixed assets are those that will last a long time, such as buildings. o Firms assets are broken down into current (short lives, typically less than a year) and fixed (last a long time) o Fixed assets can be tangible (machinery, buildings) or intangible (patents, trademarks) • Current assets comprises those that will have short lives, such as inventory. • Firm’s options for financing (raising money) are debt or equity (stock) o Debts or liabilities can be current or longterm (doesn’t have be paid within a year) o Shareholders equity is residual, leftover value between value of assets and firm’s debt • Finance focuses on 3 questions: 1. In what longlived assets should the firm invest? a. Capital budgeting – the process of making and managing expenditures on long lived assets. 2. How can the firm raise cash for required capital expenditures? a. Capital structure – the portions of the firm’s financing from current and long term debt and equity. 3. How should shortterm operating cash flows be managed? a. Net working capital – current assets minus current liabilities. The Corporate Firm • A sole proprietorship is a business owned by one person. 1. The sole proprietorship is the cheapest business to form. 2. A sole proprietorship pays no corporate income taxes. 3. The sole proprietorship has unlimited liability for business debts and obligations. 4. The life of the sole proprietorship is limited by the life of the sole proprietorship. 5. Because the only money invested in the firm is the proprietor’s, the equity money that can be raised by the sole proprietor is limited to the proprietor’s personal wealth. • Any two or more people can get together and form a partnership. o Partnerships fall into two categories: (1) general partnerships and (2) limited partnerships. In a general partnership all partners agree to provide some fraction of the work and cash and to share the profits and losses. • General partners have unlimited liability for all debts. • General partnership is terminated when a general partner dies or withdraws. Limited partnerships permit the liability of some of the partners to be limited to the amount of cash each person has contributed to the partnership. • Limited partnerships usually require that (1) at least one partner be a general partner and (2) the limited partners do not participate in managing the business. o Partnerships are usually inexpensive and easy to form. o It is difficult for a partnership to raise large amounts of cash. o Income from a partnership is taxed as personal income to the partners. o Management control resides with the general partners. o The disadvantages are (1) unlimited liability, (2) limited life of the enterprise, and (3) difficultly of transferring ownership. These three disadvantages lead to (4) difficultly in raising cash. • The articles of incorporation must include the following: 1. Name of the corporation. 2. Intended life of the corporation (it may be forever).
Transcript of Finance - Notes
Chapter 1 -‐ Introduction to Corporate Finance
Balance Sheet Model of the Firm • Fixed assets are those that will last a long time, such as buildings.
o Firms assets are broken down into current (short lives, typically less than a year) and fixed (last a long time)
o Fixed assets can be tangible (machinery, buildings) or intangible (patents, trademarks) • Current assets comprises those that will have short lives, such as inventory. • Firm’s options for financing (raising money) are debt or equity (stock)
o Debts or liabilities can be current or long-‐term (doesn’t have be paid within a year) o Shareholders equity is residual, leftover value between value of assets and firm’s debt
• Finance focuses on 3 questions: 1. In what long-‐lived assets should the firm invest?
a. Capital budgeting – the process of making and managing expenditures on long-‐lived assets.
2. How can the firm raise cash for required capital expenditures? a. Capital structure – the portions of the firm’s financing from current and long-‐
term debt and equity. 3. How should short-‐term operating cash flows be managed?
a. Net working capital – current assets minus current liabilities. The Corporate Firm
• A sole proprietorship is a business owned by one person. 1. The sole proprietorship is the cheapest business to form. 2. A sole proprietorship pays no corporate income taxes. 3. The sole proprietorship has unlimited liability for business debts and obligations. 4. The life of the sole proprietorship is limited by the life of the sole proprietorship. 5. Because the only money invested in the firm is the proprietor’s, the equity money that can
be raised by the sole proprietor is limited to the proprietor’s personal wealth. • Any two or more people can get together and form a partnership.
o Partnerships fall into two categories: (1) general partnerships and (2) limited partnerships. § In a general partnership all partners agree to provide some fraction of the work and
cash and to share the profits and losses. • General partners have unlimited liability for all debts. • General partnership is terminated when a general partner dies or withdraws.
§ Limited partnerships permit the liability of some of the partners to be limited to the amount of cash each person has contributed to the partnership.
• Limited partnerships usually require that (1) at least one partner be a general partner and (2) the limited partners do not participate in managing the business.
o Partnerships are usually inexpensive and easy to form. o It is difficult for a partnership to raise large amounts of cash. o Income from a partnership is taxed as personal income to the partners. o Management control resides with the general partners. o The disadvantages are (1) unlimited liability, (2) limited life of the enterprise, and (3)
difficultly of transferring ownership. These three disadvantages lead to (4) difficultly in raising cash.
• The articles of incorporation must include the following: 1. Name of the corporation. 2. Intended life of the corporation (it may be forever).
3. Business purpose. 4. Number of shares of stock that the corporation is authorized to issue, with a statement of
limitations and rights of different classes of shares. 5. Nature of the rights granted to shareholders. 6. Number of members of the initial board of directors.
• The potential separation of ownership from management gives the corporation several advantages over proprietorships and partnerships.
1. Because ownership in a corporation is represented by shares of stock, ownership can readily be transferred to new owners.
2. The corporation has unlimited life. 3. The shareholders’ liability is limited to the amount invested in the ownership shares.
• Firms are often called joint stock companies, public limited companies, or limited liability companies, depending on the specific nature of the firm and the country of origin.
Goal of Financial Management
• To create and sustain maximum value for the firm's owners o Value is a function of the amount, timing, and riskiness of expected cashflows
• Possible financial goals: o Survive. o Avoid financial distress and bankruptcy. o Beat the competition. o Maximize sales or market share. o Minimize costs. o Maximize profits. o Maintain steady earnings growth.
• Goal of financial management: maximize the current value per share of the existing stock. • Corporate finance – the study of the relationship between business decisions, cash flows, and the
value of the stock in the business. How to Create Value
• Create value if the value today of the steam of net cashflows to be generated by a transaction exceeds the cost of the transaction
o To create sustainable value, we must: § Respect ethical and legal boundaries § Focus on amount, timing, and riskiness of cashflows § Consider social responsibilities § Manage agency relationships
• How do financial managers create value? 1. Try to buy assets that generate more cash than they cost. 2. Sell bonds and stock and other financial instruments that raise more cash than they cost.
• Allocational Efficiency o Assets end up in the hands of those who can use them most productively
• Market (informational) efficiency o Security prices quickly and accurately reflect all relevant information o Three degrees of market (informational) efficiency: weak, semi-‐strong, strong o Implications for managers
§ Price adjustments reveal market’s assessment of managerial decisions § No value added if “you can do-‐it-‐yourself” § No sustainable financial illusions
The Agency Problem and Control of the Corporation • The relationship between stockholders and management is called an agency relationship. • Agency problem – the possibility of a conflict of interest between the principal and the agent.
o One person (principal) engages another person (agent) to perform some duty on the principal’s behalf
o Involves delegating some decision-‐making authority to the agent • Agency costs refers to the costs of the conflict of interest between stockholders and management. • An important mechanism by which unhappy stockholders can replace existing management is
called a proxy fight. • In general, a stakeholder is someone other than a stockholder or creditor who potentially has a
claim on the cash flows of the firm. Competing and/or Complementary Models
• Behavioral hypothesis o Psychological biases affect financial markets o Markets are driven by fear and greed o Consider cognitive biases: overconfidence, overreaction, and representative bias
• Adaptive markets hypothesis o Reconciles efficient markets and behavioral theories o Applies principles of evolution to financial markets
Chapter 3 – Financial Statement Analysis and Financial Models Sources of Financial Information
• Accounting based (book values) – info that already happened; past info to predict future value o Traditional uses of accounting based financial information
§ Common-‐size statements are standardized and used to compare companies • Income statements– express each value as a percentage of sales • Balance sheet s-‐ express each value as a percentage of total assets
§ Ratio analysis o Ratios that primarily use accounting-‐based financial information
§ Liquidity § Profitability § Asset utilization (turnover) § Leverage
o Ratios that combine accounting based and market-‐based financial information § Dividend § Valuation
• Market based (market values) – uses values today and builds in expectations of future value o Money markets o Capital markets o Derivatives markets
Financial Ratios (using accounting based financial info)
• Measures of earnings o Earnings before interest expense and taxes (EBIT) – total operations revenues –
operating expenses § Measure of operating cash flow and doesn’t take into account differences in earnings
from a firm’s capital structure

o Earnings before interest, taxes, depreciation, and amortization (EBITDA) – EBIT + depreciation + amortization
• Short-‐term solvency ratios as a group are intended to provide information about a firm’s liquidity, and these ratios are sometimes called liquidity measures.
o Current ratio: current assets/current liabilities § How well can a company cover its short term liabilities § Measure of short-‐term liquidity: higher ratio means a firm is more liquid though
could also be inefficient use of cash and short-‐term assets § Usually have current ratio of at least 1
o Quick ratio: (current assets-‐inventory)/current liabilities § Removes inventory because it’s 2 steps away from being money so is less liquid than
other assets o Cash ratio: cash/current liabilities
• Long-‐term solvency ratios are intended to address the firm’s long-‐run ability to meet its obligations or, more generally, its financial leverage; sometimes called financial leverage ratios or just leverage ratios
o Total debt ratio: (total assets-‐total equity)/total assets § How much of firm’s financing is debt; tells for every $1 in assets, how much debt
does the firm have o Debt-‐equity ratio: total debt/total equity o Equity multiplier: total assets/total equity
§ Turns out to be 1 plus the debt to equity ratio because total assets in numerator is just total debt + total equity
o Times interest earned (TIE): EBIT/interest (Not discussed in class) § Also known as interest coverage ratio, indication of how well company can cover its
interest obligations o Cash coverage ratio: EBITDA/interest (Not discussed in class)
§ Used because EBIT (in TIE) isn’t really a measure of cash you have to pay interest since amortization and depreciation have been deducted. This take into account how much cash is actually available to pay interest
• Asset management or utilization ratios – describe how efficiently, or intensively, a firm uses its assets to generate sales.
o Inventory turnover: COGS/Inventory § How many times in a year does a firm sell off its entire inventory § Generally, higher the ratio is, the better (as long as firm isn’t running out of stock)
o Days sales in inventory: 365 days/inventory turnover § Length of time inventory is held before being sold
o Receivables Turnover: sales/accounts receivables § How many times in a year a firm collects its outstanding credit
o Days Sales in Receivables: 365 days/receivables turnover § On average, how long it takes for a firm to receive cash from its credit sales § Also called average collection period
o Total Asset Turnover: Sales/total assets § Big picture ratio: for every dollar of assets, how much you generate in sales
• Profitability measures o Profit margin: net income/sales
§ How much goes to be bottom line, for every dollar in sales, how much ends up as net income
o EBITDA margin: EBITDA/Sales

§ Looks more at actual cash flows than net income does since it doesn’t include taxes or effect of capital structure.
o Return on Assets (ROA): Net income/total assets § How much profit is made for each dollar of assets
o ROE = Net Income/Equity = (Net Income/Sales) x (Sales/Assets) x (Assets/Equity) § How much profit is made for each dollar in equity; tells how firm is benefiting
shareholders Financial Ratios Using Market-‐Based and Accounting-‐Based Information
• Valuation ratios o Price-‐earnings ratio: price per share/earnings per share
§ Shares sell for __ times earnings (blank equals PE ratio) § Measure of how much investors are willing to pay per dollar of current earnings § Usually higher PE is an indication of high prospects for future growth
o Market-‐to-‐Book ratio: Market value per share/book value per share § Compares market value of firm’s investments to their cost
o Market capitalization: price per share x shares outstanding § Total cost of all shares of the firm
o Enterprise value: Market cap + market value of interest bearing debt – cash § Measure of how cost of buying all shares of a firm and paying off the debt
o Enterprise Value Multiple: EV/EBITDA § Estimates value of a firm’s total business rather than just value of equity
• Dividend ratios o Dividend yield: dividend/stock price
§ Dividend a shareholder receives as a percentage of investment o Payout ratio: dividends/net income
§ Percentage of net income paid out as dividends § Complement to payout ratio is retention ratio: (net income-‐
dividends)/dividends • Amount of net income that is retained in the firm
Dupont Identity (ROE Decomposition)
• Return on Equity = Net Income/Equity . . . can be broken down into: (Net Income/Sales) x (Sales/Assets) x (Assets/Equity)
o This is profit margin * total asset turnover * equity multiplier and is known as the DuPont Identity
• DuPont Identity means that ROE is affected by operating efficiency (profit margin), asset use efficiency (Total asset turnover) and financial leverage (equity multiplier)
• The Du Pont Identity tells us that ROE is affected by three things: 1. Operating efficiency (as measured by profit margin). 2. Asset use efficiency (as measured by total asset turnover). 3. Financial leverage (as measured by the equity multiplier).
Sources of Market-‐Based Information
• Money markets – short term investments and loans o Interest rates need to reflect expected inflation so should be at least as much as inflation
rate o Consumer price index – how much overall prices have changed in the US o Federal funds rate – rate govt. targets when Fed Reserve adjusts interest rates
• Capital markets

o Longer term assets/liabilities with maturities more than a year o Includes stock market: major US indices are:
§ Dow Jones: average of 30 stocks of major companies (McD’s, Dupont, Coke) § S&P 500 – 50 large companies – provides broader measure of markets § Nasdaq – smaller companies, usually tech, pharmaceutical, biotech, etc. § Indices indicate growth or decline within the particular type of companies listed on
it • Derivatives markets
o Derivative something whose value is derived from something else such as a stock option (value is based on value of the actual stock)
o Two types of options – put and call § Put – right to sell an asset at a fixed price (value increases if stock goes down) § Call – right to buy an asset as a fixed price (value increases as stock value goes up)
Chapter 3 -‐ Financial Modeling Important Concepts
• Financial planning models use pro forma financial statements • Allows you to see where company will go in the future
Applications of Financial Models
• Valuation (firms, securities, projects) • Restructuring • Justification for whether a change makes sense for a company
o If the company were to change its policy, what would it look like versus what it would look like under its current plan
• Planning Outcome of Financial Modeling
• Identification of how much financing the firm will need, when it will be needed, and where it will come from
• What problems are solvable and whether they are worth the costs of solving them Short-‐Term Modeling Process
• Estimate cash receipts • Estimate cash disbursements • Specify desired cash balance • Identify cash deficits/surpluses • Specify needed financing (if deficit) or short-‐term investment (if surplus) • Short term modeling with percentage of sales approach (items increase at same rate as sales)
o Separate income statement and balance sheet items into those that vary with sales and those that do not and establish a sales forecast
o Income statement: § Project sales/costs: assume costs are the same percentage of sales as current year § Project dividend payment
o Balance sheet § Project sales, then project items that vary with sales (such as inventory) using
current percentage of sales
• Capital intensity ratio is total assets/total sales and tells you amount needed to generate $1 in sales. Therefore you can calculate how much total assets need to increase based on sales forecast
• Liabilities such as accounts payable will vary with sales, notes payable and long term debt will not
§ For items that don’t vary with sales, initially write in same amount as current year § Determine if there is a difference between projected assets and liabilities and if
external financing is needed. § Determine method of external financing to use and examine how chosen method
(long term borrowing, short term, new equity) may affect financial ratios Long-‐Term Modeling Process
• Forecast sales • Define relation between sales and other account balances • Specify dividend policy
o Dividend yield = dividend / stock price o Percentage of Sales Approach
§ Dividend payout ratio = Cash dividends/Net income § Retention ratio = net income – dividend / net income
• Estimate external financing needed (EFN) o Long-‐term company financial planning makes use of financial statements. External
financing needed (EFN) is a forecast of the external financing a company will need based on sales forecasts, or the external financing a company will need to finance forecasted sales.
§ The formula to determine external financing needs (EFN) is: • EFN = ((assets/sales) X ∆sales) -‐ ((spontaneous liabilities/sales) X ∆sales)
-‐ (PM X projected sales X (1 -‐ d)) . . . Where: o ∆sales = the projected change in sales in dollar amount. o Spontaneous liabilities = liabilities that change with changes in
sales; listed on financial forms as accounts payable. o PM = Profit margin ratio = net income/sales o d = dividend payout ratio = cash dividends/net income
o Example: The most recent financial statements for a firm are as follows: § Income Statement Balance Sheet § Sales 25,800 Assets 113,000 Debt 20,500 § -‐ Costs 16,500 +Equity 92,500 § Taxable Income 9,3000 Total 113,000 Total 113,000 § -‐ Taxes (34%) 3,162 § Net Income 6,138
o Assets and costs are proportional to sales. Debt and equity are not. A dividend of $1,841.40 was paid, and Martin wishes to maintain a constant payout ratio. Next year’s sales are projected to be $30,960. What external financing is needed?
§ An increase of sales to $30,960 is an increase of: • Sales increase = ($30,960 – 25,800) / $25,800 = .20 or 20%
§ Assuming costs and assets increase proportionally, the pro forma financial statements will look like this:
• Pro forma income statement Pro forma balance sheet • Sales 30,960.00 Assets 135,600 Debt 20,500.00 • Costs 19,800.00 Equity 97,655.92 • EBIT 11,160.00 Total 135,600 Total 118,155.92 • Taxes (34%) 3,794.40
• Net income 7,365.60 § The payout ratio is constant, so the dividends paid this year is the payout ratio from
last year times net income, or: • Dividends = ($1,841.40 / $6,138)($7,365.60) = $2,209.68
§ The addition to retained earnings is: • Addition to retained earnings = $7,365 – 2,209.68 = $5,155.92
§ And the new equity balance is: • Equity = $92,500 + 5,155.92 = $97,655.92
§ So the EFN is: • EFN = Total assets – Total liabilities and equity • EFN = $135,600 – 118,155.92 = $17,444.08
Sustainable Growth
• Internal growth rate = ROA X b/1 – ROA X b • Sustainable growth rate – the maximum rate of growth a firm can maintain without
increasing its financial leverage (ROE x b/1 – ROE x b) o ROE = Net Income/Equity = (Net Income/Sales) x (Sales/Assets) x (Assets/Equity)
• A firm’s ability to sustain growth depends explicitly on the following four factors: 1. Profit margin: an increase in profit margin will increase the firm’s ability to generate funds
internally and thereby increase its sustainable growth. 2. Dividend policy: A decrease in the percentage of net income paid out as dividends will
increase the retention ratio. 3. Financial policy: An increase in the debt-‐equity ratio increases the firm’s financial leverage. 4. Total asset turnover: An increase in the firm’s total asset turnover increases the sales
generated for each dollar in assets. • If a firm does not wish to sell new equity & its profit margin, dividend policy, financial policy, &
total asset turnover (or capital intensity) are all fixed, then there is only one possible growth rate. Chapter 26 -‐ Short-‐Term Finance and Planning What types of questions fall under the general heading of short-‐term finance?
1. What is a reasonable level of cash to keep on hand (in a bank) to pay bills? 2. How much should the firm borrow in the short term? 3. How much credit should be extended to customers?
Tracing Cash and Net Working Capital
• Net working capital = working capital management o Basic balance sheet identity is:
§ Net working capital + Fixed assets = Long-‐term debt + Equity § Net working capital = (Cash + Other current assets) – Current liabilities § Substitute net working capital into basic balance sheet identity and you get:
• Cash = long-‐term debt + equity + current liabilities – current assets other than cash – fixed assets
o This indicates that to increase cash you either increase liabilities (long term or short term debt), increase equity, or decrease an asset (sell of inventory or building)
§ Activities that increase cash are called sources of cash o Conversely, to decrease cash, decrease liabilities (pay off debt), decrease equity (buy back
stock), or increase an asset (purchase something) § Activities that decrease cash are called uses of cash

• Activities That Increase Cash ß sources of cash o Increasing long-‐term debt (borrowing over the long-‐term) o Increasing equity (selling some stock) o Increasing current liabilities (getting a 90-‐day loan) o Decreasing current assets other than cash (selling some inventory for cash) o Decreasing fixed assets (selling some property)
• Activities That Decrease Cash ß uses of cash o Decreasing long-‐term debt (paying off a long-‐term debt) o Decreasing equity (repurchasing some stock) o Decreasing current liabilities (paying off a 90-‐day loan) o Increasing current assets other cash (buying some inventory for cash) o Increasing fixed assets (buying some property)
The Operating Cycle and the Cash Cycle
• Operating cycle is length of time it takes to acquire inventory, sell it, and collect for it. 2 parts: o Inventory period – the time it takes to acquire and sell the inventory. o Accounts receivable period – the time it takes to collect on the sale.
• The cash cycle is the number of days that pass before we collect the cash from a sale, measure from when we actually pay for the inventory (different from operating cycle because you may not pay for purchase of inventory at the time you acquire it)
o Accounts payable period –period of time between receiving inventory & paying for it o Cash cycle = operating cycle – accounts payable period
• The cash flow time line presents the operating cycle and the cash cycle in graphical form. o Inventory turnover = Cost of goods sold/Average inventory o Inventory period = 365 days/Inventory turnover o Receivables turnover = Credit sales/Average accounts receivable o Receivables period = 365 days/Receivables turnover o Operating cycle = Inventory period + Accounts receivable period o Payables turnover = Cost of goods sold/Average payables o Payables period = 365 days/Payables turnover o Cash cycle = Operating cycle – Accounts payable period
Some Aspects of Short-‐Term Financial Policy
• The policy that a firm adopts for short-‐term finance will be composed of at least two elements: 1. The size of the firm’s investment in current assets: This is usually measured relative to the
firm’s level of total operating revenues. 2. The financing of current assets: measured as the proportion of short-‐term to long-‐term debt
• Flexible short-‐term financial policies include: 1. Keeping large balances of cash and marketable securities. 2. Making large investments in inventory. 3. Granting liberal credit terms, which results in a high level of accounts receivables.
• Restrictive short-‐term financial policies are: 1. Keeping low cash balances and no investment in marketable securities. 2. Making small investments in inventory. 3. Allowing no credit sales and no accounts receivable.
• Costs that rise with the level of investment in current assets are called carrying costs. • Costs that fall with increases in the level of investment in current assets are called shortage costs.
o There are two kinds of shortage costs: 1. Trading, or order, costs: Order costs are the costs of placing an order for more cash
(brokerage costs) or more inventory (production setup costs).

2. Costs related to safety reserves: These are the costs of lost sales, lost customer goodwill, and disruption of production schedules.
• A growing firm can be thought of as having a permanent requirement for both current assets and long-‐term assets. This total asset requirement will exhibit balances over time reflecting
1. a secular growth trend, 2. a seasonal variation around the trend, and 3. unpredictable day-‐to-‐day and month-‐to-‐month fluctuations.
• Several considerations must be included in a proper analysis: 1. Cash reserves: flexible financing strategy implies surplus cash & little short-‐term borrowing. 2. Maturity hedging: Most firms finance inventories with short-‐term bank loans and fixed
assets with long-‐term financing. 3. Term structure: Short-‐term interest rates are normally lower than long-‐term interest rates.
Cash Budgeting
• Financial manager can identify short-‐term financial needs and how much borrowing is needed • Cash outflow -‐ cash disbursements are four basic categories
1. Payments of accounts payable: payments for goods or services, such as raw material. 2. Wages, taxes, and other expenses: This category includes all other normal costs of doing
business that require actual expenditures. 3. Capital expenditures: These are payments of cash for long-‐lived assets. 4. Long-‐term financing: This category includes interest and principal payments on long-‐term
outstanding debt and dividend payments to shareholders. The Short-‐Term Financial Plan
• Financing options include (1) unsecured bank balancing, (2) secured borrowing, (3) other sources. • A noncommitted line of credit is an informal arrangement that allows firms to borrow up to a
previously specified limit without going through the normal paperwork. • Committed lines of credit are formal legal arrangements and usually involve a commitment fee
paid by the firm to bank. • Compensating balances are deposits the firm keeps with the bank in low-‐interest or non-‐
interest-‐bearing accounts. • Under accounts receivable financing, receivables are either assigned or factored. • As the name implies, an inventory loan uses inventory as collateral. Some common types are:
1. Blanket inventory lien: The blanket inventory lien gives the lender a lien against all the borrower’s inventories.
2. Trust receipt: Under this arrangement, the borrower holds inventory in trust for the lender. 3. Field warehouse financing: In field warehouse financing, a public warehouse company
supervises the inventory for the lender. • Commercial paper consists of short-‐term notes issued by large, highly rated firms. • A banker’s acceptance is an agreement by a bank to pay a sum of money.
Chapter 4 -‐ Time Value of Money
Basic Valuation 0 1 2 t
Value C1 Ct Ct PV = [C1/(1 + r)1] + [C2/(1 + r)2] + … + [Ct/(1 + r)t]
PV = present value
C = cash flow
r = required rate of return
t = time
Review from Accounting
• Future value of a single amount o Assume that you invest $100 today at 6%, how much will you have after 10 years?
§ 100 X (1.06)10 = 179.08 • Present value of a single amount
o Assume that you will need $120 four years from now and can invest at 5% (annual compounding), how much must you invest today to reach your goal?
§ 120/(1.05)4 = 98.72 • Present value of an annuity
o Assume that you will need $100 one year from today and another $100 two years from today. Assume you can invest at 10%. How much must you invest today to reach your goal?
§ (100/(1.10)1) + (100/(1.10)2) = 173.55 • Compound Semiannually
o Assume that you will need $120 four years from now and can invest at 5% compounding semiannually, how much must you invest today to reach your goal?
§ 2.5% 8 periods 120/(1.025)8 = 98.49 Cash Flow Valuation
• Value of Any Claim o Present value of expected cash-‐flows from assets in place discounted at an appropriate
required return + value of strategic (real) options • Important Concepts
o Understand how the timing of cashflows affects value o Determine the present and future value of various types of cashflows
• Future Value (FV) or Compound Value o The value that an amount of cash will grow to over a specific length of time at an
appropriate rate of return with an assumption of compounding interest that is reinvested each year; the bracketed part is the future value interest factor
§ FVT = Co * (1 + r)T • T = time • C = cashflow amount • r = annual interest = required return
§ FV1 = 1,100 * (1.10)1 = 1,210 § FV5 = 1,100 * (1.10)5 = 1,772 § Example (one period): A firm is considering investing in a piece of land that costs
$85,000. They are certain that next year the land will be worth $91,000, a sure $6000 gain. Given that the guaranteed interest rate in the bank is 10%, should the firm undertake the investment in the land?
• At the interest rate of 10%, the $85,000 would grow to: (1 + .10) x $85,000 = $93,000 next year. This would be $2500 more than the $91000 she would gain from investing in the land. Therefore she should not invest in the land.
§ Example (multi-‐period): You put $500 in a savings account that earns 7% compounded annually. How much will you earn in 3 years?
• Interest on interest = $500 x 1.07 x 1.07 x 1.07 = $500 x (1.07)3 = $612.52 § Example (finding the rate): You won $10,000 and you want to buy a car in five years.
The car will cost $16,105 at that time. What interest rate must you earn to be able to afford the car?
• The ratio of purchase price to initial cash is: $16,105/$10,000 = 1.6105. Thus, you must earn an interest rate that allows $1 to become $1.6105 in five

years. $10,000 x (1 + r)5 = $16,105 where r is the interest rate needed to purchase the car. Because $16,105/$10,000 = 1.6105, we have: (1 + r)5 = 1.6105 and r = 10%
• Present Value of an Investment o The value today of future cash-‐flows discounted at an appropriate rate of return o PV = CT/(1 + r)T
§ C = cash flow at date 1 § r = the required rate of return or discount rate
o Example: A firm is considering investing in a piece of land that costs $85,000. They are certain that next year the land will be worth $91,000, a sure $6000 gain. Given that the guaranteed interest rate in the bank is 10%, should the firm invest in the land?
§ Calculate the present value of the sale price next year as: • Present value = $91000/1.10 = $82727.27.
§ Because the present value of next year’s sales price is less than this year’s purchase price of $85,000, present value analysis also indicates that she should not recommend purchasing the land.
o Example: You will receive $10,000 three years from now. You can earn 8 percent on your investments, so the appropriate discount rate is 8 percent. What is the present value of your future cash flow?
§ PV = $10,000 x (1/1.08)3 = $10,000 x .7938 = $7,938 o Discounting = the process of calculating the present value of a future cash flow. o Present value factor = the factor used to calculate the present value of a future cash flow
• What is the exact cost or benefit of a decision? o Net Present Value of an Investment = -‐Cost + PV o NPV = PV of future cash flows minus present value of the cost of the investment o Net present value of a cash flow = -‐C0 + (C1/(1 + r)) + (C2/(1 + r)2) + . . . + (CT/(1 + r)T)
• Compounding Interest Rate o Compounding an investment m times a year provides end-‐of-‐year wealth of: C0(1 + r/m)m
§ C0 is the initial investment § r is the stated interest rate (annual interest rate w/o considering compounding)
o Example: What is the end-‐of-‐year wealth if you receive a stated annual interest rate of 24 percent compounded monthly on a $1 investment?
§ $1(1 + .24/12)12 = $1 x (1.02)12 = $1.2682. The annual rate of return is 26.82 percent. Due to compounding, the annual interest rate is greater than the stated annual interest rate of 24 percent.
o Future vale of compounding: FV = C0(1 + r/m)mT § Example: You are investing $5,000 at a stated interest rate of 12 percent per year,
compounded quarterly, for five years. What is your wealth at the end of five years? • $5,000 x (s + .12/4)4x5 = $5,000 x (1.03)20 = $5000 x 1.8061 = $9,030.50
Simplifications – Four Cash Flow Steams
1. Perpetuity o Series of cashflows of the same amount which continue for indefinite number of periods o Constant stream of cash flow without end o PV of Perpetuity = C1/r
§ C1 = cashflow one year from today § r = annual interest rate = required return § g = annual growth rate of the cashflow
o Example: An insurance company is trying to sell you an investment policy that will pay you and your heirs $20,000 per year forever. If the required rate of return on this investment is 6.5
percent, how much will you pay for the policy? Suppose the policy costs $340,000; at what interest rate would this be a fair deal?
§ This cash flow is = perpetuity. To find the PV of a perpetuity, we use the equation: • PV = C/r = $20,000/.065 = $307,692.31
§ To find the interest rate that equates the perpetuity cash flows with the PV of the cash flows. Using the PV of a perpetuity equation:
• PV = C / r $340,000 = $20,000 / r § We can now solve for the interest rate as follows:
• r = $20,000 / $340,000 = .0588 or 5.88% 2. Growing Perpetuity
o Series of cashflows over an indefinite number of periods which increase each period by a constant percentage
o PV of Growing Perpetuity = C1/(r – g) § C1 = cashflow one year from today § r = annual interest rate = required return § g = annual growth rate of the cashflow
o Example: You expect the first annual cash flow on your technology to be $215,000, received 2 years from today. Subsequent annual cash flows will grow at 4 percent in perpetuity. What is the present value of the technology if the discount rate is 10 percent?
§ This is a growing perpetuity. The present value of a growing perpetuity is: • PV = C / (r – g) • PV = $215,000 / (.10 – .04) = $3,583,333.33
§ It is important to recognize that when dealing with annuities or perpetuities, the present value equation calculates the present value one period before the first payment. In this case, since the first payment is in two years, we have calculated the present value one year from now. To find the value today, we simply discount this value as a lump sum. Doing so, we find the value of the cash flow stream today is:
• PV = FV / (1 + r)t • PV = $3,583,333.33 / (1 + .10)1 = $3,257,575.76
3. Annuity o Series of cashflows of the same amount for each of a fixed number of periods o Example: An investment offers $4,300 per year for 15 years, with the first payment occurring
1 year from now. If the required return is 9%, what is the value of the investment? What would the value be if payments occurred for 40 yrs? 75 yrs? Forever?
§ To find the PVA, we use the equation: PVA=C({1–[1/(1+r)]t }/r) • PVA @ 15 yrs: PVA = $4,300{[1 – (1/1.09)15 ]/.09} = $34,660.96 • PVA @ 40 yrs: PVA = $4,300{[1 – (1/1.09)40 ]/.09} = $46,256.65 • PVA @ 75 yrs: PVA = $4,300{[1 – (1/1.09)75 ]/.09} = $47,703.26
§ PV = C/r • PV = $4,300/.09 = $47,777.78
§ Notice that as the length of the annuity payments increases, the present value of the annuity approaches the present value of the perpetuity.
§ The present value of the 75-‐year annuity and the present value of the perpetuity imply that the value today of all perpetuity payments beyond 75 years = $74.51.
o Example: You are planning to save for retirement over the next 30 years. To do this you will invest $700/month in a stock account and $300/month in a bond account. The return on stock is expected to be 10%, and the bond account will pay 6%. When you retire, you will combine your money into an account with an 8% return. How much can you withdraw each month from your account assuming a 25-‐year withdrawal period?
§ We need to find the annuity payment in retirement. Our retirement savings ends at the same time the retirement withdrawals begin, so the PV of the retirement withdrawals will be the FV of the retirement savings. So, we find the FV of the stock account and the FV of the bond account and add the two FVs.
• Stock: FVA = $700[{[1 + (.10/12) ]360 – 1} / (.10/12)] = $1,582,341.55 • Bond: FVA = $300[{[1 + (.06/12) ]360 – 1} / (.06/12)] = $301,354.51 • Total saved at retirement is: $1,582,341.55 + 301,354.51 = $1,883,696.06
§ Solving for the withdrawal amount in retirement using the PVA equation gives us: • PVA = $1,883,696.06 = C[1 – {1 / [1 + (.08/12)]300} / (.08/12)] • C = $1,883,696.06 / 129.5645 = $14,538.67 withdrawal per month
o Timing of Annuity Payments § Ordinary annuity (or annuity in arrears) = first of annual cash-‐flows occur one
period from now § Annuity due (or annuity in advance) = 1st of annual cashflow occurs immediately § Deferred annuity = annuity starting more than one year in the future
4. Growing Annuity o Series of cash-‐flows for fixed number of periods which increase each period by a constant
percentage rather than infinite cash flows like growing perpetuity o Example: Your job pays once per year. Today you received your salary of $60,000 and you
plan to spend all of it. However, you want to start saving for retirement beginning next year. One year from today you will begin depositing 5% of your annual salary in an account that will earn 9% per year. Your salary will increase at 4% per year throughout your career. How much will you have on the date of your retirement 40 years from today?
§ Since your salary grows at 4 percent per year, your salary next year will be: • Next year’s salary = $60,000 (1 + .04) = $62,400
§ This means your deposit next year will be: • Next year’s deposit = $62,400(.05) = $3,120
§ Since salary grows at 4%, the deposit will also grow at 4%. We can use the PV of a growing perpetuity equation to find the value of deposits today. Doing so, we find:
• PV = C {[1/(r – g)] – [1/(r – g)] × [(1 + g)/(1 + r)]t} • PV = $3,120{[1/(.09 – .04)] – [1/(.09 – .04)] × [(1 + .04)/(1 + .09)]40} • PV = $52,861.98
§ Now, we can find the future value of this lump sum in 40 years. We find: • FV = PV(1 + r)t • FV = $52,861.98(1 + .09)40 = $1,660,364.12 • This is the value of your savings in 40 years
Deferred Annuity Example Example: Kevin wishes to retire 3 years from now. When he retires, he will require $100,000 per year for the next 5 years to cover living expenses. The 1st $100,000 cashflow will occur at the end of his 1st year of retirement. The other annual $100,000 cashflows will occur at the end of each subsequent year of his retirement. He plans to fully deplete his personal savings by the end of his 5th year of retirement since his pension will begin 5 years after he retires. Kevin expects an annual return of 15%. He plans to make 2 deposits into an investment account: $125,000 one year from now and $150,000 three years from now. Will these investments be sufficient to meet his retirement goals? Today 0 1 2 3 4 5 6 7 8 +125 +150 -‐100 -‐100 -‐100 -‐100 -‐100 Value of $125 from today: 125[1/1.151) = 108.7 At the end of year 3: 100[1 – (1/1.155) / .15 = 335 Value today of $150: 150(1/1.153) = 98.6 335(1/(1.15)3) = -‐ 220.4 . . . we don’t have enough to cover this
Chapter 8 – Interest Rates and Bond Valuation Bond Features and Prices
• When a corporation or government wishes to borrow money from the public on a long-‐term basis, it usually does so by issuing or selling debt securities that are generically called bonds.
• Bonds = promise by a borrower to pay specified interest payments and/or specified principal amount at maturity (normally an interest-‐only loan).
o Example: a corporation wants to borrow $1,000 for 30 years and that the interest rate on similar debt issued by similar corporations is 12 percent. the corporation thus pays .12 × $1,000 = $120 in interest every year for 30 years. At the end of 30 years, the corporation repays the $1,000.
§ The $120 regular interest payments that the corporation promises to make are called the bond’s coupons (the stated interest payments made on a bond).
• Because the coupon is constant and paid every year, the type of bond we are describing is sometimes called a level coupon bond.
§ The principal amount of a bond that is repaid at the end of the term is the bond’s face value or par value.
• As in the example, this par value is usually $1,000 for corporate bonds, and a bond that sells for its par value is called a par bond.
§ The annual coupon divided by the face value is called the coupon rate on the bond, which is $120/1,000 = 12%; so the bond has a 12 percent coupon rate.
§ The number of years until the face value is paid is the bond’s time to maturity. • A corporate bond would frequently have a maturity of 30 years when it is
originally issued, but this varies. • Once the bond has been issued, the number of years to maturity declines as
time goes by. Bond Values and Yields
• Value of a bond fluctuates o Cash flows from a bond stay the same because the coupon rate and maturity date are
specified when it is issued. o When interest rates rise, the present value of the bond’s remaining cash flows declines, and
the bond is worthless; when interest rates fall, the bond is worth more. • To determine the value of a bond on a particular date, we need to know the number of periods
remaining until maturity, the face value, the coupon, and the market interest rate for bonds with similar features.
o This interest rate required in the market on a bond is called the bond’s yield to maturity § The market interest rate that equates a bond’s present value of interest payments
and principal repayment with its price § Market-‐based required rate of return as determined by current market conditions
and bond's risk; the cost of the debt § Frequently, we know a bond’s price, coupon rate, and maturity date, but not its YTM.
• Example: suppose we were interested in a six-‐year, 8% coupon bond. A broker quotes a price of $955.14. What is the yield on this bond?
o The price of a bond can be written as the sum of its annuity and lump-‐sum components. With an $80 coupon for 6 years and a $1,000 face value, this price is:
§ $955.14 = $80 × (1 – 1/(1 + r)6)/r + $1,000/(1 + r)6 where r is the unknown discount rate or yield to maturity.

o We have one equation and one unknown, but we cannot solve it for r explicitly; so, we must use trial and error. Use what you know about bond prices and yields:
§ The bond has an $80 coupon and is selling at a discount. We thus know that the yield is greater than 8%.
o If we compute the price at 10%: § Bond value = $80 × (1 – 1/1.106)/.10 + $1,000/1.106 = $80 ×
(4.3553) + $1,000/1.7716 = $912.89 o At 10%, the value we calculate is lower than the actual price, so 10% is
too high. The true yield must be somewhere between 8% and 10%. Plug and chug to find the answer.
§ Try 9%, which is, in fact, the bond’s YTM. The Present Value of a Bond = The Present Value of the Coupon Payments (an annuity) + The Present Value of the Par Value or Face Amount (time value of money) Example: A bank issues a bond with 10 years to maturity. The bank's bond has an annual coupon of $56. Suppose similar bonds have a yield to maturity of 5.6 percent. Based on our previous discussion, the bank's bond pays $56 per year for the next 10 years in coupon interest. In 10 years, the bank pays $1,000 to the owner of the bond. What would this bond sell for?
Cash Flows Year 0 1 2 3 4 5 6 7 8 9 10 Coupon $56 $56 $56 $56 $56 $56 $56 $56 $56 $56 Face Value -‐ -‐ -‐ -‐ -‐ -‐ -‐ -‐ -‐ -‐ $1000 $56 $56 $56 $56 $56 $56 $56 $56 $56 $56 $1056 The bank's bond's cash flows have an annuity component (the coupons) and a lump sum (the face value paid at maturity). We thus estimate the market value of the bond by calculating the present value of these two components separately and adding the results together. First, at the going rate of 5.6%, the present value of the $1,000 paid in 10 years is:
PV = $1,000/1.05610 = $1,000/1.7244 = $579.91 Second, the bond offers $56 per year for 10 years, so the present value of this annuity stream is:
Annuity PV = $56 × (1 – 1/1.05610)/.056 = $56 × (1 – 1/1.7244)/.056 = $56 × 7.5016 = $420.09 We can now add the values for the two parts together to get the bond’s value:
Total bond value = $579.91 + 420.09 = $1,000.00� If a bond has (1) a face value of F paid at maturity, (2) a coupon of C paid per period, (3) t periods to maturity, and (4) a yield of r per period, its value is:
Bond value = C × (1 – 1/(1 + r)t)/r + F/(1 + r)t
Three Ways to Sell a Bond PAR Discount Premium
Price Sold for face value Sold for < face value Sold for > face value Investor Equals coupon rate Higher return than coupon rate Less return than coupon rate Example Consider a bond selling
for $10,000 with an annual coupon payment of $1,000. Similar types of bonds are also offering interest payments of $1,000 a year. What is the coupon rate?
Consider a bond selling in 2005 for $10,000 with an annual coupon payment of $1,000. What is the coupon rate? $1,000/$10,000 = 10% Suppose in 2006, the same bond yields only 8% interest payments annually. What is the coupon payment? 8% x 10,000 = $800/yr.
Consider a bond selling in 2005 for $10,000 with an annual coupon payment of $1000. What is the coupon rate? $1,000/10,000 = 10% Now suppose that in 2006, the same bond yields an insane 15% in interest payments annually.
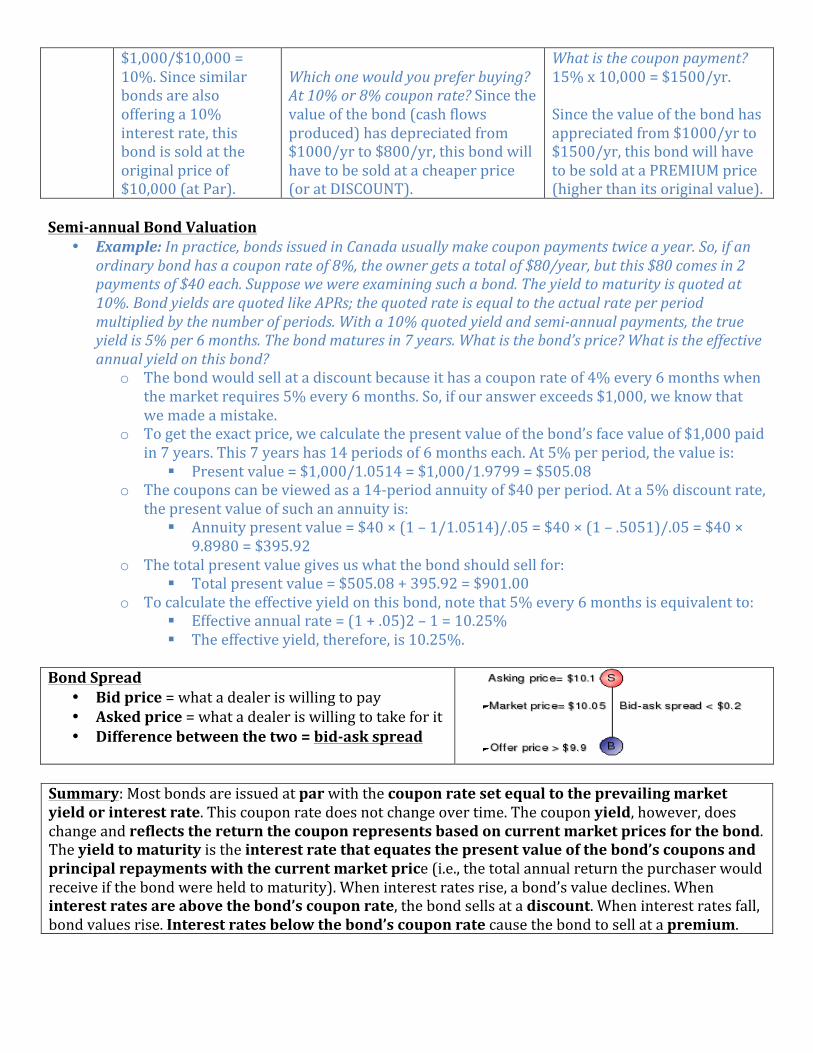
$1,000/$10,000 = 10%. Since similar bonds are also offering a 10% interest rate, this bond is sold at the original price of $10,000 (at Par).
Which one would you prefer buying? At 10% or 8% coupon rate? Since the value of the bond (cash flows produced) has depreciated from $1000/yr to $800/yr, this bond will have to be sold at a cheaper price (or at DISCOUNT).
What is the coupon payment? 15% x 10,000 = $1500/yr. Since the value of the bond has appreciated from $1000/yr to $1500/yr, this bond will have to be sold at a PREMIUM price (higher than its original value).
Semi-‐annual Bond Valuation
• Example: In practice, bonds issued in Canada usually make coupon payments twice a year. So, if an ordinary bond has a coupon rate of 8%, the owner gets a total of $80/year, but this $80 comes in 2 payments of $40 each. Suppose we were examining such a bond. The yield to maturity is quoted at 10%. Bond yields are quoted like APRs; the quoted rate is equal to the actual rate per period multiplied by the number of periods. With a 10% quoted yield and semi-‐annual payments, the true yield is 5% per 6 months. The bond matures in 7 years. What is the bond’s price? What is the effective annual yield on this bond?
o The bond would sell at a discount because it has a coupon rate of 4% every 6 months when the market requires 5% every 6 months. So, if our answer exceeds $1,000, we know that we made a mistake.
o To get the exact price, we calculate the present value of the bond’s face value of $1,000 paid in 7 years. This 7 years has 14 periods of 6 months each. At 5% per period, the value is:
§ Present value = $1,000/1.0514 = $1,000/1.9799 = $505.08 o The coupons can be viewed as a 14-‐period annuity of $40 per period. At a 5% discount rate,
the present value of such an annuity is: § Annuity present value = $40 × (1 – 1/1.0514)/.05 = $40 × (1 – .5051)/.05 = $40 ×
9.8980 = $395.92 o The total present value gives us what the bond should sell for:
§ Total present value = $505.08 + 395.92 = $901.00 o To calculate the effective yield on this bond, note that 5% every 6 months is equivalent to:
§ Effective annual rate = (1 + .05)2 – 1 = 10.25% § The effective yield, therefore, is 10.25%.
Bond Spread
• Bid price = what a dealer is willing to pay • Asked price = what a dealer is willing to take for it • Difference between the two = bid-‐ask spread
Summary: Most bonds are issued at par with the coupon rate set equal to the prevailing market yield or interest rate. This coupon rate does not change over time. The coupon yield, however, does change and reflects the return the coupon represents based on current market prices for the bond. The yield to maturity is the interest rate that equates the present value of the bond’s coupons and principal repayments with the current market price (i.e., the total annual return the purchaser would receive if the bond were held to maturity). When interest rates rise, a bond’s value declines. When interest rates are above the bond’s coupon rate, the bond sells at a discount. When interest rates fall, bond values rise. Interest rates below the bond’s coupon rate cause the bond to sell at a premium.
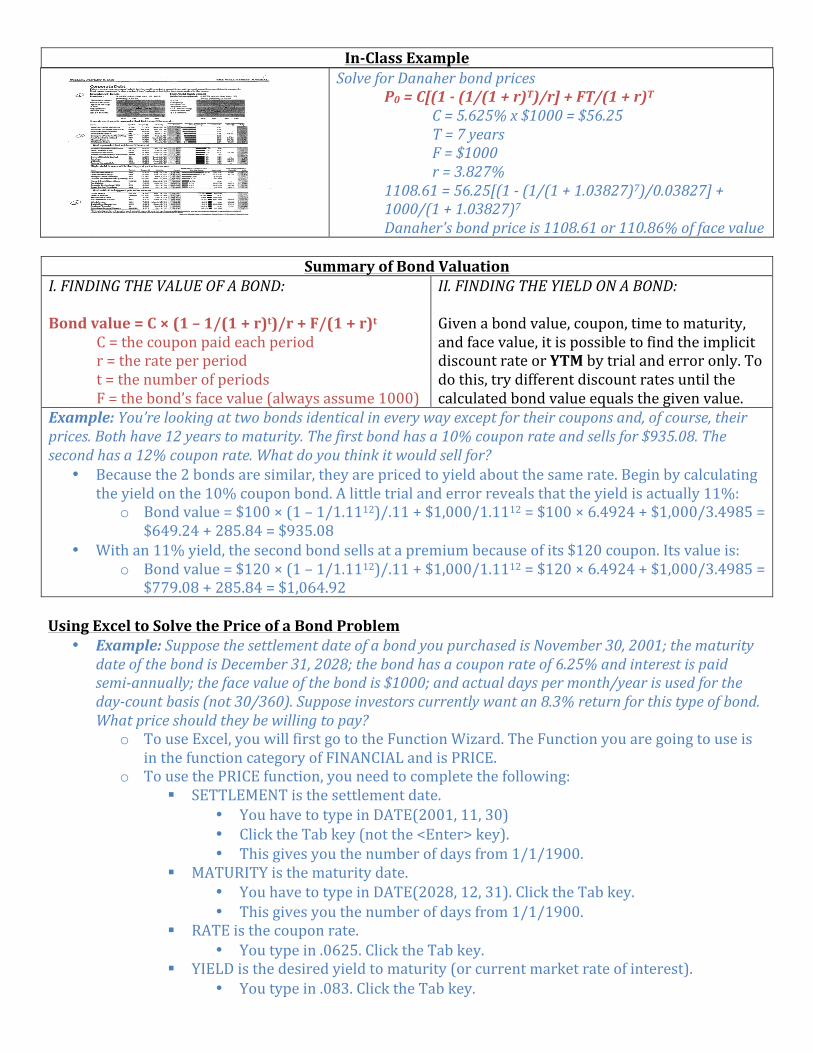
In-‐Class Example
Solve for Danaher bond prices P0 = C[(1 -‐ (1/(1 + r)T)/r] + FT/(1 + r)T
C = 5.625% x $1000 = $56.25 T = 7 years F = $1000 r = 3.827%
1108.61 = 56.25[(1 -‐ (1/(1 + 1.03827)7)/0.03827] + 1000/(1 + 1.03827)7 Danaher's bond price is 1108.61 or 110.86% of face value
Summary of Bond Valuation
I. FINDING THE VALUE OF A BOND: Bond value = C × (1 – 1/(1 + r)t)/r + F/(1 + r)t
C = the coupon paid each period r = the rate per period t = the number of periods F = the bond’s face value (always assume 1000)
II. FINDING THE YIELD ON A BOND: Given a bond value, coupon, time to maturity, and face value, it is possible to find the implicit discount rate or YTM by trial and error only. To do this, try different discount rates until the calculated bond value equals the given value.
Example: You’re looking at two bonds identical in every way except for their coupons and, of course, their prices. Both have 12 years to maturity. The first bond has a 10% coupon rate and sells for $935.08. The second has a 12% coupon rate. What do you think it would sell for?
• Because the 2 bonds are similar, they are priced to yield about the same rate. Begin by calculating the yield on the 10% coupon bond. A little trial and error reveals that the yield is actually 11%:
o Bond value = $100 × (1 – 1/1.1112)/.11 + $1,000/1.1112 = $100 × 6.4924 + $1,000/3.4985 = $649.24 + 285.84 = $935.08
• With an 11% yield, the second bond sells at a premium because of its $120 coupon. Its value is: o Bond value = $120 × (1 – 1/1.1112)/.11 + $1,000/1.1112 = $120 × 6.4924 + $1,000/3.4985 =
$779.08 + 285.84 = $1,064.92 Using Excel to Solve the Price of a Bond Problem
• Example: Suppose the settlement date of a bond you purchased is November 30, 2001; the maturity date of the bond is December 31, 2028; the bond has a coupon rate of 6.25% and interest is paid semi-‐annually; the face value of the bond is $1000; and actual days per month/year is used for the day-‐count basis (not 30/360). Suppose investors currently want an 8.3% return for this type of bond. What price should they be willing to pay?
o To use Excel, you will first go to the Function Wizard. The Function you are going to use is in the function category of FINANCIAL and is PRICE.
o To use the PRICE function, you need to complete the following: § SETTLEMENT is the settlement date.
• You have to type in DATE(2001, 11, 30) • Click the Tab key (not the <Enter> key). • This gives you the number of days from 1/1/1900.
§ MATURITY is the maturity date. • You have to type in DATE(2028, 12, 31). Click the Tab key. • This gives you the number of days from 1/1/1900.
§ RATE is the coupon rate. • You type in .0625. Click the Tab key.
§ YIELD is the desired yield to maturity (or current market rate of interest). • You type in .083. Click the Tab key.
§ REDEMPTION is the redemption value per $100 of value • You type in 100 since you will not be given more than $100 per $100 of face
value (even if the face value of the bond is $1000); click the Tab key. § FREQUENCY is how often interest is paid; 2 for semi-‐annual and 1 for annual.
• You type in 2 (the default) since interest is paid semi-‐annually; click Tab key. § BASIS Type of day-‐count basis to use: 0 means 30/360, 1 is actual/actual, etc.
• Type in 1; click the Tab key. § Click on FINISH
• The answer is 78.02187. This means that investors are only willing to pay me 78.02 per 100. For a $1000 bond (multiply by 10), investors will only pay me $780.22. Investors are only willing to pay about $780 for a bond with a $1000 face value. Why? Because the coupon rate is below the desired yield to maturity sought by investors.
o If you know the PRICE investors are willing to pay and want to calculate the desired Yield to Maturity, go to the Function Wizard and use the YIELD function. Everything is the same except, instead of (4) YIELD, you will see PR (PRICE). Type in the price per $100.
§ Thus, if investors are paying, say, $850 for a $1000 bond, you type in 85. Zero-‐Coupon Bond
• Most bonds pay interest semi-‐annually until maturity, when the bondholder receives the par value of the bond back; zero coupon bonds pay no interest, but are sold at a discount to par value, which is paid when the bond matures.
• How do zero coupon bonds make money then if they don't pay interest? o A zero coupon bond must be offered at a price that is much lower that its stated face value.
• Investment dealers engage in bond stripping when they sell the principal and coupons separately. • Example: Suppose the DDB Company issues a $1,000 face value 5-‐year stripped (zero coupon)
bond. The initial price is set at $497. It is straightforward to check that, at this price, the bonds yield 15% to maturity. The total interest paid over the life of the bond is $1,000 – 497 = $503.
• For tax purposes, the issuer of a stripped bond deducts interest every year even though no interest is actually paid; the owner must also pay taxes on interest accrued each year, even though no interest is actually received, making zero-‐coupon bonds less attractive to taxable investors
• Zero-‐coupon bonds are still a very attractive investment for tax-‐exempt investors with long-‐term dollar-‐denominated liabilities because the future dollar value is known with relative certainty.
• The most famous example of a zero-‐coupon bond: the US T-‐bill (or Treasury bill). Inflation and Interest Rates
• Real Rate of Interest o Interest rates or rates of return that have been adjusted for inflation. o This is the pure cost of money, assuming no change in purchasing power o The percentage change in your buying power (how much you can buy with your dollars)
• Nominal Rate of Interest o Interest rates or rates of return that have not been adjusted for inflation. o Percentage change in the number of dollars you have o Increase or decrease in purchasing power
• The Fisher Effect o The relationship between nominal returns, real returns, and inflation. o A rise in the rate of inflation causes the nominal rate to rise just enough so that the real rate
of interest is unaffected because people know that with inflation comes uncertainty about what you money can buy; so, a demand in the increase of the nominal interest rate is necessary to ensure purchasing power parity

§ 1 + R = ( 1 + r ) x ( 1 + h) • R = nominal rate • r = real rate • h = expected inflation rate
§ Exact • R = r + h + rh
§ Approximation • R = r + h
o Example: We require a 10% real return & expect inflation to be 8%. What’s the nominal rate? § Exact
• R = (1.1)(1.08) – 1 = .188 = 18.8% § Approximation
• R = 10% + 8% = 18% § Because the real return and expected inflation are relatively high, there is significant
difference between the actual Fisher Effect and the approximation. o Example: If investors require a 10 percent real rate of return, and the inflation rate is 8
percent, what must be the approximate nominal rate? The exact nominal rate? § The nominal rate is approximately equal to the sum of the real rate and the inflation
rate: 10% + 8% = 18%. § From the Fisher effect, we have: 1 + R = (1 + r) × (1 + h) = 1.10 × 1.08 = 1.1880 § Therefore, the nominal rate will actually be closer to 19%.
Risk to Bondholders
• Interest-‐Rate (Maturity) Risk o Sensitivity of bond prices to changes in market interest rates o Amount of interest-‐rate risk is affected by: time to maturity and coupon rate
• Default Risk o Corporate bonds have default risk which is why you have higher returns o Government bonds do NOT have default risk but this is correlated in the yield to maturity
which is usually low • Reinvestment Rate Risk
o Uncertainty concerning rates at which cash flows can be reinvested o Short-‐term bonds have more reinvestment rate risk than long-‐term bonds o Cash flows may be reinvested in the future at lower interest rates o Long-‐Term Bonds: higher price risk, lower reinvestment rate risk o Short-‐Term Bonds: lower price risk, higher reinvestment rate risk
• Liquidity Risk o Investors prefer liquid assets to illiquid ones, so they demand a liquidity premium on top of
all the other premiums we have discussed. o A liquidity premium is the portion of a nominal interest rate or bond yield that represents
compensation for lack of liquidity. o As a result, all else being the same, less liquid bonds will have higher yields than more
liquid bonds; more liquid bonds will generally have lower required returns o Anything else that affects the risk of the cash flows to the bondholders, will affect the
required returns • Expropriation (Agency) Risk
o Legal implications that may impact receiving receipts from bond o Based on conflict of interest between stockholders and bondholders o Managers (agents of stockholders) may take actions that benefit stockholders at the
expense of bondholders

Interest Rate Risk
• Interest rate risk = the risk that arises for bond owners from fluctuating interest rates (market yields); how much interest risk a bond has depends on how sensitive its price is to interest rate changes; this sensitivity depends on 2 things: 1) the time to maturity and 2) the coupon rate.
• Keep the following in mind when looking at a bond: 1. All other things being equal, the longer time to maturity, the greater the interest rate risk.
§ Longer-‐term bonds have greater interest rate sensitivity. § A large portion of a bond’s value comes from the $1,000 face amount. § The present value of this amount isn’t greatly affected by a small change in interest
rates if it is to be received in one year. § If it is to be received in 30 years, even a small change in the interest rate can have a
significant effect once it is compounded for 30 years. § The present value of the face amount becomes much more volatile with a longer-‐
term bond as a result. 2. All other things being equal, the lower the coupon rate, the greater the interest rate risk.
§ Bonds with lower coupons have greater interest rate risk. § The value of a bond depends on the present value of its coupons and the present
value of the face amount. § If two bonds with different coupon rates have the same maturity, the value of the
one with the lower coupon is proportionately more dependent on the face amount to be received at maturity; as a result, all other things being equal, its value fluctuates more as interest rates change.
§ The bond with the higher coupon has a larger cash flow early in its life, so its value is less sensitive to changes in the discount rate.
Value of a Bond with a 10% Coupon Rate for Different Interest Rates and Maturities
Interest Rate RiskThe risk that arises for bond owners from fluctuating interest rates (market yields) is calledinterest rate risk. How much interest risk a bond has depends on how sensitive its price is tointerest rate changes. This sensitivity directly depends on two things: the time to maturity andthe coupon rate. Keep the following in mind when looking at a bond:
1. All other things being equal, the longer the time to maturity, the greater the interest rate risk.2. All other things being equal, the lower the coupon rate, the greater the interest rate risk.
We illustrate the first of these two points in Figure 7.2. As shown, we compute and plotprices under different interest rate scenarios for 10 percent coupon bonds with maturities ofone year and 30 years. Notice how the slope of the line connecting the prices is much steeper forthe 30-year maturity than it is for the one-year maturity.1 This tells us that a relatively smallchange in interest rates could lead to a substantial change in the bond’s value. In comparison,the one-year bond’s price is relatively insensitive to interest rate changes.
Intuitively, the reason that longer-term bonds have greater interest rate sensitivity is that alarge portion of a bond’s value comes from the $1,000 face amount. The present value of this
176 PART 3: Valuation of Future Cash Flows
Bondvalues
$2,000
$1,500
$1,000
$500
20%15%10%5%Interestrates
•
•
••
•
$1,768.62
$1,047.62
$916.67
$502.11
30-year bond
1-year bond
Figure 7.2Interest rate risk andtime to maturity
Value of a Bond with a 10% Coupon Rate for Different Interest Rates and Maturities
1 We explain a more precise measure of this slope, called duration, in Appendix 7A. Our example assumes thatyields of one-year and 30-year bonds are the same
Time to Maturity
Interest Rate 1 Year 30 Years
5% $1,047.62 $1,768.6210% 1,000.00 1,000.0015% 956.52 671.7020% 916.67 502.11
Time to Maturity
Interest Rate 1 Year 30 Years 5% $1,047.62 $1,768.62 10% $1,000.00 $1,000.00 15% $956.52 $671.70 20% $916.67 $502.11
This table shows prices under different interest rate scenarios for 10% coupon bonds with maturities of

1 year & 30 years. Notice how the slope of the line connecting the prices is much steeper for the 30-‐year maturity than it is for the 1-‐year maturity. A small change in interest rates could lead to a substantial change in the bond’s value, but the 1-‐year bond’s price is relatively insensitive to interest rate changes.
Duration Statistic • Measures rate of change in bond price caused by a change in interest rates • Most widely used duration statistics: Macaulay Duration and Modified Duration
Any coupon bond is actually a combination of pure discount bonds. Example, a five-‐year, 10 percent coupon bond, with a face value of $100, is made up of five pure discount bonds:
1. A pure discount bond paying $10 at the end of Year 1. 2. A pure discount bond paying $10 at the end of Year 2. 3. A pure discount bond paying $10 at the end of Year 3. 4. A pure discount bond paying $10 at the end of Year 4. 5. A pure discount bond paying $110 at the end of Year 5.
Because the price volatility of a pure discount bond is determined only by its maturity, we would like to determine the average maturity of the 5 pure discount bonds that make up a 5-‐year coupon bond. This leads us to the concept of duration. We calculate average maturity in 3 steps for the 10% coupon bond:
1. Calculate present value of each payment using the bond’s yield to maturity. Year Payment Present Value of Payment by Discounting at 10% 1 $10 9.091 2 $10 8.264 3 $10 7.513 4 $10 6.830 5 $110 68.302
Total $100.000 2. Express PV of each payment in relative terms by calculating the relative value of a single
payment as the ratio of the PV of the payment to the value of the bond (which is $100). The bulk of the relative value, 68.302%, occurs at Date 5 when the principal is paid back.
Year Payment Present Value of Payment Relative Value = PV of Payment ÷ Value of Bond 1 $10 9.091 $9.091/$100 = 0.09091 2 $10 8.264 8.264/$100 = 0.08264 3 $10 7.513 7.513/$100 = 0.07513 4 $10 6.830 6.830/$100 = 0.0683 5 $110 68.302 68.302/$100 = 0.68302
Total $100.000 $100.000/$100 = 1.00000 3. Weigh the maturity of each payment by its relative value.
1 year × 0.09091 + 2 years × 0.08264 + 3 years × 0.07513 + 4 years × 0.06830 + 5 years × 0.68302 = 4.1699 years = the effective maturity of the bond (duration) Duration is an average of the maturity of the bond’s cash flows, weighted by the present value of each cash flow. The duration of a bond is a function of the current interest rate. A 5-‐year, 1% coupon bond has a duration of 4.8742 years. Because the 1% coupon bond has a higher duration than the 10% bond, the 1% coupon bond should be subject to greater price fluctuations. The 1% coupon bond receives only $1 in each of the first 4 years. Thus, the weights applied to Years 1 through 4 in the duration formula will be low. Conversely, the 10% coupon bond receives $10 in each of the first 4 years. The weights applied to Years 1 through 4 in the duration formula will be higher. In general, the percentage price changes of a bond with high duration are greater than the percentage price changes for a bond with low duration.
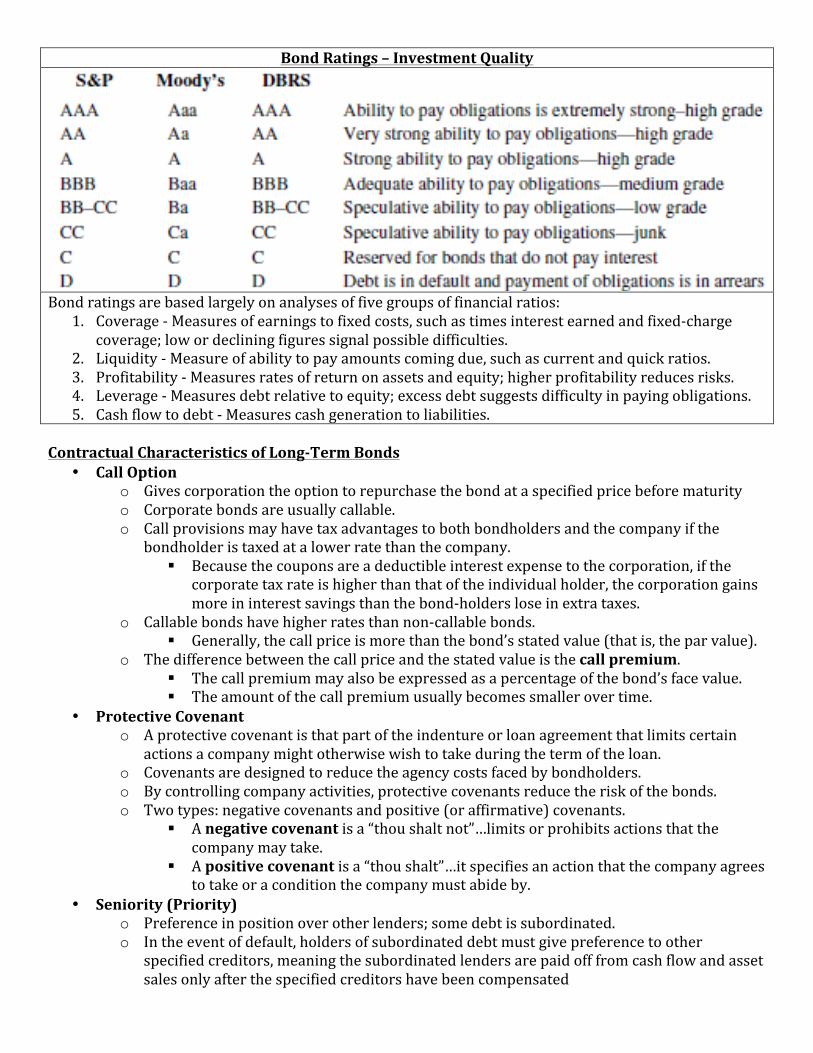
Bond Ratings – Investment Quality
Bond ratings are based largely on analyses of five groups of financial ratios:
1. Coverage -‐ Measures of earnings to fixed costs, such as times interest earned and fixed-‐charge coverage; low or declining figures signal possible difficulties.
2. Liquidity -‐ Measure of ability to pay amounts coming due, such as current and quick ratios. 3. Profitability -‐ Measures rates of return on assets and equity; higher profitability reduces risks. 4. Leverage -‐ Measures debt relative to equity; excess debt suggests difficulty in paying obligations. 5. Cash flow to debt -‐ Measures cash generation to liabilities.
Contractual Characteristics of Long-‐Term Bonds
• Call Option o Gives corporation the option to repurchase the bond at a specified price before maturity o Corporate bonds are usually callable. o Call provisions may have tax advantages to both bondholders and the company if the
bondholder is taxed at a lower rate than the company. § Because the coupons are a deductible interest expense to the corporation, if the
corporate tax rate is higher than that of the individual holder, the corporation gains more in interest savings than the bond-‐holders lose in extra taxes.
o Callable bonds have higher rates than non-‐callable bonds. § Generally, the call price is more than the bond’s stated value (that is, the par value).
o The difference between the call price and the stated value is the call premium. § The call premium may also be expressed as a percentage of the bond’s face value. § The amount of the call premium usually becomes smaller over time.
• Protective Covenant o A protective covenant is that part of the indenture or loan agreement that limits certain
actions a company might otherwise wish to take during the term of the loan. o Covenants are designed to reduce the agency costs faced by bondholders. o By controlling company activities, protective covenants reduce the risk of the bonds. o Two types: negative covenants and positive (or affirmative) covenants.
§ A negative covenant is a “thou shalt not”…limits or prohibits actions that the company may take.
§ A positive covenant is a “thou shalt”…it specifies an action that the company agrees to take or a condition the company must abide by.
• Seniority (Priority) o Preference in position over other lenders; some debt is subordinated. o In the event of default, holders of subordinated debt must give preference to other
specified creditors, meaning the subordinated lenders are paid off from cash flow and asset sales only after the specified creditors have been compensated

o Debt cannot be subordinated to equity. • Security (Collateral)
o Debt securities classified by the collateral & mortgages used to protect the bondholder § Collateral is a general term that, strictly speaking, means securities (for example,
bonds and stocks) pledged as security for payment of debt. o Bonds frequently represent unsecured obligations of the company.
§ A debenture is an unsecured bond, where no specific pledge of property is made. • Sinking Fund
o Bonds can be repaid at maturity, at which time the bondholder receives the stated or face value of the bonds, or they may be repaid in part or in entirety before maturity.
o Early repayment in some form is more typical and is often handled through a sinking fund (an account managed by the bond trustee for the purpose of repaying the bonds0
o From an investor’s viewpoint, a sinking fund reduces the risk that the company will be unable to repay the principal at maturity.
o Since it involves regular purchases, a sinking fund improves the marketability of the bonds. • Conversion Option
o A convertible bond can be swapped for a fixed number of shares of stock anytime before maturity at the holder’s option.
• Put Option o A put bond allows the holder to force the issuer to buy the bond back at a stated price. o As long as the issuer remains solvent, the put feature sets a floor price for the bond. o The reverse of the call provision.
Tax Treatment of Interest on Corporate Debt
• Tax deductible to issuer • Taxable to all investors
Government Bonds
• Treasury Securities • Federal government debt • T-‐bills – pure discount bonds with original maturity of one year or less • T-‐notes – coupon debt with original maturity between one and ten years • T-‐bonds coupon debt with original maturity greater than ten years
Municipal Securities
• Debt of state and local governments • Varying degrees of default risk, rated similar to corporate debt • Interest received is tax-‐exempt at the federal level
o Example: A taxable bond has a yield of 8% and a municipal bond has a yield of 6%. If you are in a 40% tax bracket, which bond do you prefer?
§ 8%(1 -‐ .4) = 4.8% o The after-‐tax return on the corporate bond is 4.8%, compared to a 6% return on the
municipal. At what tax rate would you be indifferent between the two bonds? § 8%(1–T)=6% . . . T = 25%
Chapter 9 -‐ Stock Valuation ß NOT ON TEST The Present Value of Common Stocks
• Common stock represents equity, an ownership position, in a corporation. • Important characteristics of common stock:
1. Residual claim: common stockholders have claim to firm’s cash flows and assets after all obligations to creditors and preferred stockholders are met
2. Limited liability: common stockholders may lose their investments, but no more 3. Voting rights: Common stockholders are entitled to vote for the board of directors and on
other matters. • As compared with bond valuation, stock valuation is more complex because:
1. The future cash flows are not certain. In case of bonds we have certain payments but in case of common stock, the dividends are not predictable.
2. The investment has no maturity. 3. The rate of return cannot be easily determined.
• Like bond valuation, stock valuation centers around the time value concept of future cash flows • With bonds, future cash flows were coupon payments; with common stock, these are dividends • The value of shares of common stock, like any other financial instrument, is often understood as
the present value of expected future returns. • Common stocks do not have a fixed maturity; their cash payments consist of an indefinite stream
of dividends. Techniques of Common Stock Valuation
• Discounted Cashflow (DCF) • Method of Comparable (Use of Multiples)
Discounted Cashflow Valuation
• Free Cashflow Models o Operating Cash Flow -‐ Capital Expenditures
• Dividend Discount Models (DDM) o A stock can be valued by discounting its dividends o Make one of three simplifying assumptions about pattern of future dividends
§ Zero Growth § Constant Growth
• g = Growth Rate in Dividends • Div0 = Dividend Just Paid • Div1 = Dividend to be Paid in 1 Period • Div1 = Div0(1 + g) • Example: If a dividend is $2 today (D0) and the expected growth rate is 5%,
then D5 = D0 x (1.05)5 = $2 x 1.276 =$2.55 § Non-‐Constant Dividend Growth
• Dividends grow at varying rates and then ultimately grow at a constant or zero rate at a specific point in the future
Three Types of Dividend Discounting Models
• Zero Growth o If a firm does not grow at all, meaning that all earnings are paid out as dividends, the
expected return is also equal to the earnings per share divided by the share price § Price = P0 = Div1/r = EPS1/r § This just an application of the perpetuity formula
• Constant Growth o It may be reasonable to assume that the dividends of a mature company will grow at a
constant rate, g, forever o If the cash flows grow at a constant rate forever, this is simply a growing perpetuity o As long as g < r, the present value at the rate r of dividends growing at the rate g is:
§ Price = P0 = Div/r -‐ g • g = the growth rate in dividends (capital gains yield) • r = the required return on the stock
o The constant growth stock equation can be rearranged to obtain an expression for the expected return on the stock as follows:
§ Expected return = r = Div1/P0 + g § The expected return = the dividend yield (DIV1/P0) + the dividend growth rate
o The hard part is to estimate g, the expected rate of dividend growth. § Earnings next year = earnings this year + retained earnings x return on
retained earnings § 1 + g = 1 + retention ratio (ratio of retained earnings to earnings) x ROE § With these to formulas we can define the dividend growth rate (g) as:
• Dividend growth rate = g = RR x ROE o ROE = Net Income/Equity = (Net Income/Sales) x (Sales/Assets) x
(Assets/Equity) o Retention Ratio = 1-‐ Payout Ratio
§ Payout Ratio = Dividends/Earnings • Differential Growth
o Assume that dividends will grow at different rates in the foreseeable future and then will grow at a constant rate thereafter
o To value a Differential Growth Stock, we need to: § estimate future dividends in the foreseeable future § estimate the future stock price when the stock becomes a constant growth stock § compute the total present value of the estimated future dividends and stock price at
the appropriate discount rate o A Differential Growth Example
§ r = 12% (investors’ required return) § g1 = g2 = g3 = 8%; g4 = g5 = ... = 4% § D0 = $2 § D1 = $2 x 1.08 = $2.16, D2 = $2.33, D3 = $2.52 § Imagine that you are at t=3 looking forward
• D4 = $2.52 x 1.04 = $2.62 • P3 = $2.62 / (.12 -‐ .04) = $32.75 • P0 = 2.16/1.12 + 2.33/1.122 + 35.27/1.123 = $28.89
Calculating the Present Value of a Common Stock Investment
How to value common stocks The first way to figure out the value of common stock is to use the present value of future dividends. In this case, the present value of the stocks would equal future dividends divided by the required rate of return. Each investor has some base rate of return called required rate of return, (r) which they require considering the riskiness of the stock under valuation and the opportunity costs of the investor. They are also called opportunity costs of capital.
On the other hand you can change the formula using given forecasts of dividends and price calculating the price P0:
To give a more detailed calculation of the Price P0 we need to calculate further future stock prices and dividends:
The valuation philosophy is just a method of discounting the future cash flows to get the present value and that present value is then treated as the intrinsic value of the stock. This model allows us to look as far in the future as we want. If we call the final period H we get a general formula to calculate P0:
As common stocks do not expire of old age, period H could be infinitely distant. The value of shares of common stock, like any other financial instrument, is often understood as the present value of expected future returns. The value of a stock is equal to the stream of cash payments discounted at the rate of return that investors expect to receive on other securities with equivalent risks. Common stocks do not have a fixed maturity; their cash payments consist of an indefinite stream of dividends. Therefore, the present value of a common stock is
The price of a share of common stock to the investor is equal to the present value of all the expected future dividends
Div = the dividend paid at year’s end R = the appropriate discount rate for the stock
Growth Rate of Dividends
• An estimate of the growth rate of dividends is needed for the dividend discount model o Estimate of the growth rate is g = Retention Ratio x Return on Retained Earnings (ROE)

o As long as the firm holds its ratio of dividends to earnings constant, g represents the growth rate of both dividends and earnings
• The price of a share of stock can be viewed as the sum of its price (under the assumption that the firm is a "cash cow") plus the per share value of the firm's growth opportunities.
o A company is termed a cash cow if it pays out all of its earnings as dividends. o The formula for the value of a share is = EPS/R + NPVGO
§ EPS = Div (where EPS is earnings per share and Div is dividends per share) § The NPVGO is the NPV of the investments that the firm will make in order to grow.
• Net present value of growth opportunities = NPVGO = NPV1/r-‐g • Negative NPV projects lower the value of the firm.
o Projects with rate of returns below discount rate have a negative NPV. • Example: A shipping corporation expects to earn $1 million per year in perpetuity if it undertakes no
new investment opportunities. There are 100,000 shares of stock outstanding, so earnings per share equal $10 ($1,000,000/100,000). The firm will have an opportunity at date 1 to subsequent period by $210,000 (for $2.10 per share). This is a 21% return per year on the project. The firm's discount rate is 10%. What is the value per share before and after deciding to accept the marketing campaign?
o The value of a share of the company before the campaign (when firm acts as a cash cow): § EPS/R = $10/.1 = $100
o The value of the marketing campaign as of date 1 is: § -‐$1,000,000 + $210,000/.1 = $1,100,000
o Because the investment is made at date 1 and the first cash inflow occurs at date 2. We determine the value at date 0 by discounting back one period as follows:
§ $1,100,000/1.1 = $1,000,000 o Thus, NPVGO per share is $10($1,000,000/100,000); the price per share is:
§ EPS/R + NPVGO = $100 + $10 = $110 Growth in Earnings
• Both the earnings and dividends of a firm will grow as long as the firm's projects have positive rates of return.
• Earnings are divided into two parts: dividends and retained earnings • Most firms continually retain earnings in order to create future dividends • Do not discount earnings to obtain price per share since part of the earnings must be reinvested • Only dividends reach the stockholders and only they should be discounted to obtain share price. • Two conditions must be met in order to increase value
o Earnings must be retained so that projects can be funded o The projects must have positive net present value
• Example: A new firm will earn $100,000 a year in perpetuity if it pays out all its dividends. However, the firm plans to invest 20% of its earnings in projects that earn 10% per year. The discount rate is 18%. Does the firm’s investment policy lead to an increase or decrease in the vale of the firm?
o The policy reduces value because the rate of return on future projects of 10% is less than the discount rate of 18%. In other words, the firm will be investing in negative NPV projects, implying that the firm would have had a higher value at date 0 if it simply paid all of its earnings out as dividends.
o Is the firm growing? Yes, the firm will grow over time, either in terms of earnings or in terms of dividends. The annual growth rate of earnings is:
§ g = retention rate x return on retained earnings = .2 x .10 = 2% • Since earnings in the first year will be $100,000, earnings in the second year
will be $100,000 x 1.02 = $102,000, earnings in the third year will be $100,000 x (1.02)2 = $104,040 and so on.
• Because dividends are a constant proportion of earnings, dividends must grow at 2% per year as well.
o Since the firm’s retention ratio is 20%, dividends are (1 – 20%) = 80% of earnings. In the 1st year of the new policy, dividends will be (1 – 2) x $100,000 = $80,000. Dividends next year will be $80,000 x 1.02 = $81,600. Dividends the following year will be $80,000 x (1.02)2 = $83,232 and so on.
o In conclusion, the firm’s policy of investing in negative NPV projects produces 2 outcomes. § First, the policy reduces the value of the firm. § Second, the policy creates growth in both earnings and dividends.
o In other words, the firm’s policy growth actually destroys firm value. o Under what conditions would the firm’s earnings and dividends actually fall over time?
Earnings and dividends would fall over time only if the firm invested in projects with negative rates of return.
Price-‐Earnings Ratio
• The earnings-‐price ratio = EPS1/P0 = r x [1 -‐ (NPVGO/P0)] • Companies with significant growth opportunities are likely to have high PE ratios • Low -‐risk stocks are likely to have high PE ratios • Firms following conservative accounting practices will likely have high PE ratios • A firm's price-‐earnings ratio is a function of 3 factors
1. The per-‐share amount of the firm's valuable growth opportunities 2. The risk of the stock 3. The type of accounting method used by the firm
Chapter 10 -‐ Risk and Return Dollar Returns
• There are 2 components to a return on your investment o Income component = the dividend you receive o Capital gain (or loss) = part of the return required to maintain investment of the company
• Example: You purchased 100 shares of stock at the beginning of the year at a price of $37 per share. Your total investment then was: C0 -‐ $37 x 100 -‐ $3,700
o Suppose that over the year the stock paid a dividend of $1.85 per share. During the year, then, you received income of:
§ Dividend = $1.85 x 100 = 185 o At the end of the year the market price of the stock is $40.33 per share. Because the stock
increased in price, you had a capital gain of: § Capital Gain = ($40.33 -‐ $37) x 100 = $333 § If the price of the company's stock had dropped in value to $34.78:
• Capital Loss = ($34.78 -‐ $37) x 100 = -‐$222 o The total dollar return on your investment is the sum of the dividend income and the
capital gain or loss on the investment: § Total dollar return = Dividend income + Capital gain (or loss) § The total dollar return of the initial example is:
• Total dollar return = $185 + $333 = $518 o If you sold the stock at the end of the year, your total amount of each would be the initial
investment plus the total dollar return. In this example you would have: § Total cash if stock is sold = initial investment + total dollar return
§ Total cash if stock is sold = 3,700 + $518 = $4,218 § This is the same as the proceeds from the sale of stock plus the dividends
• Stock Proceeds + Dividends = $40.33 x 100 + $185 = $4,033 + $185 = $4,218 Percentage Returns
• Example: You purchased 100 shares of stock at the beginning of the year at a price of $37 per share. The dividend paid during the year on each share was $1.85.
o The percentage income return (dividend yield) is: § Dividend yield = Divt + 1 / Pt = $1.85/$37 = .05 = 5%
o The capital gain (or loss) is the change in the price of the stock divided by the initial price § Letting Pt + 1 be the price of the stock at year-‐end, we can compute the capital
gain as follows: Capital Gain = (Pt + 1 -‐ Pt) / -‐Pt • Capital Gain = ($40.33 -‐ $37) / $37 = $3.33 / $37 = .09 = 9%
o Combining these two results, we find that the total return on the investment in the company's stock over the year, which is labeled Rt+1, was:
§ Rt + 1 = Divt + 1 / Pt + (Pt + 1 -‐ Pt) / Pt = 5% + 9% = 14% Holding Period Returns
• Average compound return per year over a particular period = (1 + R1) x (1 + R2)...(1 + Rt) o Rt is the return in year t (expressed in decimals); the value you would have at the end
of year T is the product of 1 plus the return in each of the years • Example: if the returns were 11%, -‐5%, and 9% in a 3-‐year period, an investment of $1 at the
beginning of the period would be worth: o (1 + R1) x (1 + R2) x (1 + R3) = ($1 + 0.11) x ($1 -‐ 0.05) x ($1 + 0.09) = $1.11 x $.95 x $1.09
= $1.15 ß 15% is the total return at the end of 3 years, including the return from reinvesting the first year dividends in the stock market for 2 more years and reinvesting the 2nd year dividends for the final year
Average Stock Returns and Risk-‐Free Returns
• Excess return on the risky asset = the difference between risky returns and risk-‐free returns • Equity risk premium = the average excess return on common stocks; the additional return from
bearing risk Risk Statistics
• Risk = uncertainty that actual return will differ from expected (pro forma or forecasted) return • Standard deviation = measures the dispersion of potential returns about the expected return;
measure of total risk • Variance = most common measure of variability or dispersion
o Example: The return on common stocks are (in decimals) .1370, .3580, .4514, and -‐.0888, respectively. The variance of the sample is computed as follows:
§ Variance = (1 / T-‐1) x [(individual return1 -‐ average return)2 + (individual return2 -‐ average return)2 + (individual return3 -‐ average return)2 + (individual return4 -‐ average return)2]
• Variance = .0582 = (1 / 3) x [(.1370 -‐ .2144)2 + (.3580 -‐ .2144)2 + (.4514 -‐ .2144)2 + (-‐.0888 -‐ .2144)2]
• standard deviation = the square root of .0582 = .2412 or 24.12% • Sharpe Ratio = Return to Level of Risk Taken = Risk Premium of Asset / Standard Deviation
o Example: The Sharpe ratio is the average equity risk premium over a period of the time divided by the standard deviation. From 1926 to 2008, the average risk premium for large-‐
company sticks was 7.9% while the standard deviation was 20.6%. The Sharpe ratio of this sample is computed as:
§ Sharpe ratio = 7.9% / 20.6% = .383 o The Sharpe ratio is sometimes referred to as the reward-‐to-‐risk ratio where the reward is
the average excess return and the risk is the standard deviation Arithmetic Versus Geometric Averages
• Geometric average return answers the question: "what was your average compound return per year over a particular period?"
o Tells you what you actually earned per year on average, compounded annually o Useful in describing historical investment experience o Example: Suppose a particular investment had annual returns of 10%, 12%, 3%, and -‐9%
over the last 4 years. The geometric average return over this 4 year period is calculated as: o Geometric average return = [(1 + R1) x (1 + R2) x . . . x (1 + RT)]1/T -‐ 1 o Geometric average return = (1.10 x 1.12 x 1.03 x .91)1/4 -‐ 1 = 3.66%
o Four steps to this formula: 1. Take each of the T annual returns R1, R2, . . . , RT and add 1 to each (after
converting them to decimals) 2. Multiply all the numbers from step 1 together 3. Take the result from step 2 and raise it to the power of 1/T 4. Subtract 1 from the result of Step 3; the result is the geometric average return
• Arithmetic average return answers the question: "what was your return in an average year over a particular period?"
o Your earnings in a typical year; an unbiased estimate of the true mean of the distribution o Useful in making estimates for the future o Example: suppose a particular investment had annual returns of 10%, 12%, 3%, and -‐9%
over the last 4 years. The average arithmetic return is (.10 + .12 + .03 -‐ .09)/4 = 4.0% Chapter 11 – The Capital Asset Pricing Model
Expected Return and Variance State of the Economy
Rate of Return Deviation from Expectation Return Squared Value of Deviation
Supertech Returns (RAt)
Slowpoke Returns (RBt)
Supertech: Expected Return = 0.175
Slowpoke: Expected Return = 0.055
Supertech Slowpoke
Depression -‐.20 .05 -‐.20 -‐ .175 = -‐.375 .05 -‐ .055 = -‐.005 -‐3752 = .140625
-‐.0052 = .000025
Recession .10 .20 10 -‐ .175 = -‐.075 .20 -‐ .055 = .145 -‐.0752 = .005625
.1452 =
.021025 Normal .30 -‐.12 .30 -‐ .175 = .125 -‐.12 -‐ .055 = -‐.175 .1252 =
.015625 -‐.1752 = .030625
Boom .50 .09 .50 -‐ .175 = .325 .09 -‐ .055 = .035 .3252 = .105625
.0352 =
.001225 Step 1 Calculate the expected return
Supertech Example: (-‐.20 + .10 + .30 = .50)/4 = .175 = 17.5% Slowpoke Example: (.05 + .20 -‐ .12 + .09)/4 = .055 = 5.5%
Step 2 For each company, calculate the deviation of each possible return from the company’s expected return given previously
Step 3 Multiply each deviation by itself to make it positive Step 4 Calculate the variance . . . Variance = the expected value of (the security’s actual return –
the security’s expected return)2 Step 5 Calculate the standard deviation by taking the square root of the variance
Calculating Covariance and Correlation Product of the deviations = (the return of company A in the specific state of the economy – the expected return on security A) x (the return of company B in the specific state of the economy – the expected return on security B) Calculate the average value of the four states. This average is the covariance. If the two returns are positively related to each other, the covariance will be positive. If they are negatively related to each other, the covariance will be negative. If they are unrelated, the covariance should be zero. To calculate the correlation, divide the covariance by the standard deviation of both of the two securities. Individual Securities
• Expected return o Return that an individual expects a stock to earn over the next period
• Variance and standard deviation o Way to assess the volatility of a security's return
• Covariance and correlation o Returns on individual securities are related to one another o Covariance = statistic measuring the interrelationship between two securities
• Positive correlation o Stocks move in line with one another
• Perfect Negative Correlation o Stocks move opposite of each other
• Zero Correlation o Return on security A is completely unrelated to the return on security B
• Return and Risk for Portfolios o Portfolio theory analyzes investors’ asset demand given asset returns. o Portfolio risk depends on risk of individual assets and the correlation of returns between
the pairs of assets in the portfolio o The market portfolio is the portfolio of all risky assets traded in the market. o Consider:
§ The relationship between the expected returns on individual securities and the expected return on a portfolio made up of these securities
§ The relationship between the standard deviations of individual securities, the correlation between these securities, and the standard deviation of a portfolio made up of these securities
• Expected return on portfolio o The expected return on a portfolio is a weighted average of the expected returns on the
individual securities o Example: The expected returns on 2 securities are 17.5% and 5.5%. The expected return on a
portfolio of these two securities alone can be written as: § Expected return on portfolio = (percentage of the portfolio in company A x 17.5%) +
(percentage of portfolio in company B x 5.5%) o If an investor with $100 invests $60 in company A and $40 in company B, the expected
return on the portfolio can be written as: § Expected return on portfolio = .6 x 17.5% + .4 x 5.5% = 12.7%
• Effect of Diversification o Portfolio risk reduced by combining assets that are less than perfectly positively correlated
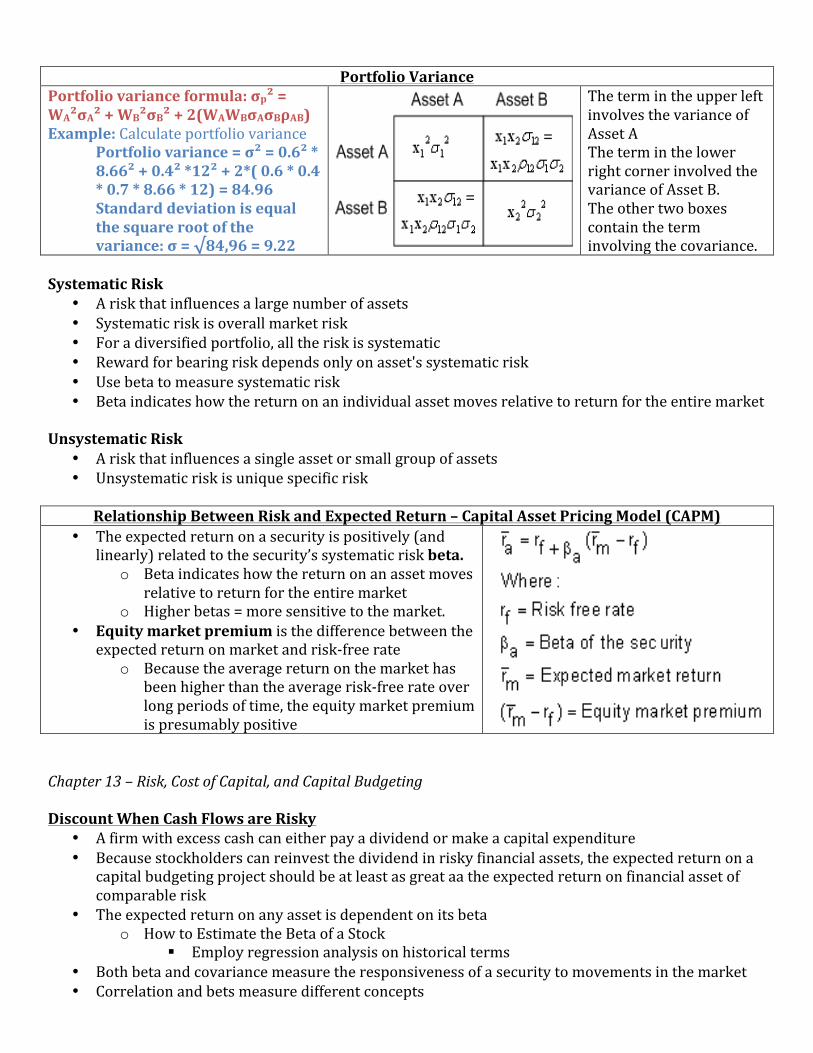
Portfolio Variance
Portfolio variance formula: σp² = WA²σA² + WB²σB² + 2(WAWBσAσBρAB) Example: Calculate portfolio variance
Portfolio variance = σ² = 0.6² * 8.66² + 0.4² *12² + 2*( 0.6 * 0.4 * 0.7 * 8.66 * 12) = 84.96 Standard deviation is equal the square root of the variance: σ = √84,96 = 9.22
The term in the upper left involves the variance of Asset A The term in the lower right corner involved the variance of Asset B. The other two boxes contain the term involving the covariance.
Systematic Risk
• A risk that influences a large number of assets • Systematic risk is overall market risk • For a diversified portfolio, all the risk is systematic • Reward for bearing risk depends only on asset's systematic risk • Use beta to measure systematic risk • Beta indicates how the return on an individual asset moves relative to return for the entire market
Unsystematic Risk
• A risk that influences a single asset or small group of assets • Unsystematic risk is unique specific risk
Relationship Between Risk and Expected Return – Capital Asset Pricing Model (CAPM)
• The expected return on a security is positively (and linearly) related to the security’s systematic risk beta.
o Beta indicates how the return on an asset moves relative to return for the entire market
o Higher betas = more sensitive to the market. • Equity market premium is the difference between the
expected return on market and risk-‐free rate o Because the average return on the market has
been higher than the average risk-‐free rate over long periods of time, the equity market premium is presumably positive
Chapter 13 – Risk, Cost of Capital, and Capital Budgeting Discount When Cash Flows are Risky
• A firm with excess cash can either pay a dividend or make a capital expenditure • Because stockholders can reinvest the dividend in risky financial assets, the expected return on a
capital budgeting project should be at least as great aa the expected return on financial asset of comparable risk
• The expected return on any asset is dependent on its beta o How to Estimate the Beta of a Stock
§ Employ regression analysis on historical terms • Both beta and covariance measure the responsiveness of a security to movements in the market • Correlation and bets measure different concepts
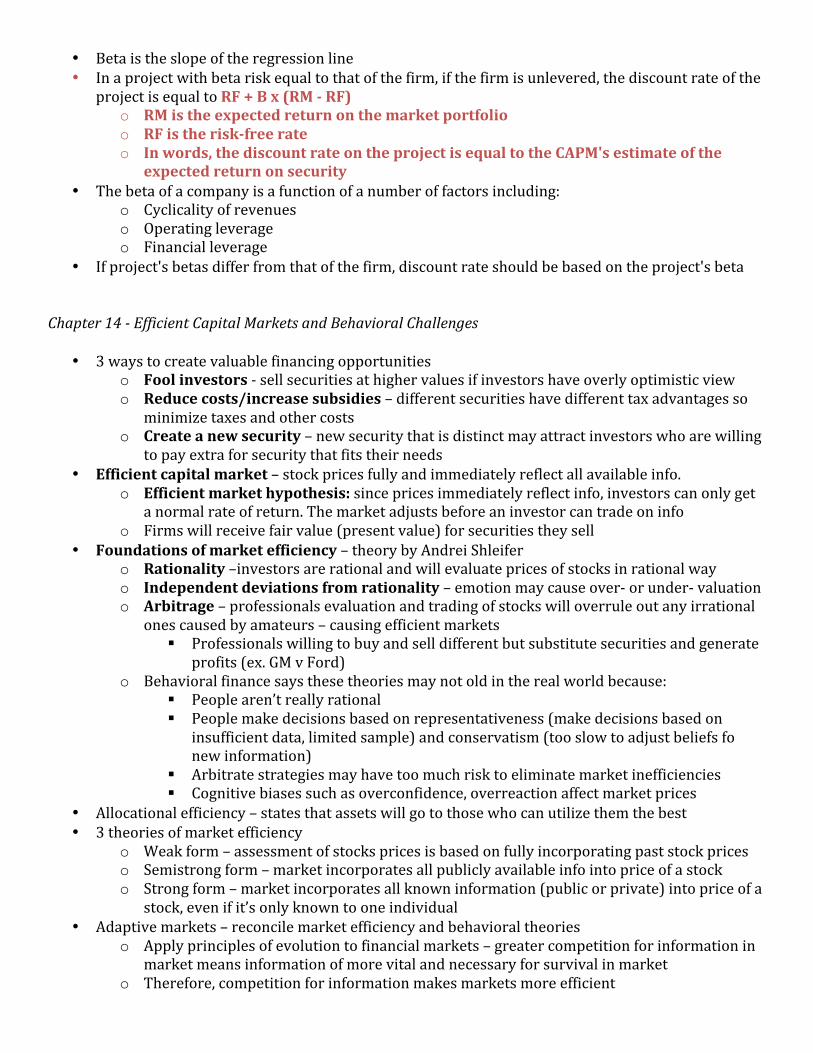
• Beta is the slope of the regression line • In a project with beta risk equal to that of the firm, if the firm is unlevered, the discount rate of the
project is equal to RF + B x (RM -‐ RF) o RM is the expected return on the market portfolio o RF is the risk-‐free rate o In words, the discount rate on the project is equal to the CAPM's estimate of the
expected return on security • The beta of a company is a function of a number of factors including:
o Cyclicality of revenues o Operating leverage o Financial leverage
• If project's betas differ from that of the firm, discount rate should be based on the project's beta Chapter 14 -‐ Efficient Capital Markets and Behavioral Challenges
• 3 ways to create valuable financing opportunities o Fool investors -‐ sell securities at higher values if investors have overly optimistic view o Reduce costs/increase subsidies – different securities have different tax advantages so
minimize taxes and other costs o Create a new security – new security that is distinct may attract investors who are willing
to pay extra for security that fits their needs • Efficient capital market – stock prices fully and immediately reflect all available info.
o Efficient market hypothesis: since prices immediately reflect info, investors can only get a normal rate of return. The market adjusts before an investor can trade on info
o Firms will receive fair value (present value) for securities they sell • Foundations of market efficiency – theory by Andrei Shleifer
o Rationality –investors are rational and will evaluate prices of stocks in rational way o Independent deviations from rationality – emotion may cause over-‐ or under-‐ valuation o Arbitrage – professionals evaluation and trading of stocks will overrule out any irrational
ones caused by amateurs – causing efficient markets § Professionals willing to buy and sell different but substitute securities and generate
profits (ex. GM v Ford) o Behavioral finance says these theories may not old in the real world because:
§ People aren’t really rational § People make decisions based on representativeness (make decisions based on
insufficient data, limited sample) and conservatism (too slow to adjust beliefs fo new information)
§ Arbitrate strategies may have too much risk to eliminate market inefficiencies § Cognitive biases such as overconfidence, overreaction affect market prices
• Allocational efficiency – states that assets will go to those who can utilize them the best • 3 theories of market efficiency
o Weak form – assessment of stocks prices is based on fully incorporating past stock prices o Semistrong form – market incorporates all publicly available info into price of a stock o Strong form – market incorporates all known information (public or private) into price of a
stock, even if it’s only known to one individual • Adaptive markets – reconcile market efficiency and behavioral theories
o Apply principles of evolution to financial markets – greater competition for information in market means information of more vital and necessary for survival in market
o Therefore, competition for information makes markets more efficient
• Implications of market efficiency for managers – the market is generally efficient enough see through any choices made by managers and price stock fairly
o Choices in accounting practices (ex. Straight line vs accelerated depreciation ) don’t generally affect stock price provided accounting numbers are not fraudulent (ex: Enron)
o Timing of equity– managers who believe stock is overprice will issue equity. If they believe it’s underpriced, they’ll wait to issue stock.
§ Studies have shown that SEOs (seasoned equity offerings) lead to higher stock returns in period after SEO though this is not the same for IPOs.
§ Firms are also more likely to repurchase stock if they feel its undervalued and evidence suggests stock returns of repurchasing firms are abnormally high after repurchase occurs
o Speculation – can occur if firms believe interest rates will rise or fall (firm will borrow today is rates will rise), or firms may speculate and issue debt in foreign currencies if they believe interest rates will change.