FINALREPORT - Childcarepolicy.net
87
An Economic Perspective on the Current and Future Role of Nonprofit Provision of Early Learning and Child Care Services in Canada March 7, 2007 FINAL REPORT Michael Krashinsky University of Toronto at Scarborough Gordon Cleveland University of Toronto at Scarborough Barry Forer University of British Columbia Douglas Hyatt University of Toronto Christa Japel Université du Québec à Montréal
Transcript of FINALREPORT - Childcarepolicy.net

An Economic Perspective on the Current and Future Role of Nonprofit Provision of Early Learning and Child Care Services in CanadaMarch 7, 2007
FINALREPORT
Michael Krashinsky
University of Toronto at Scarborough
Gordon Cleveland
University of Toronto at Scarborough
Barry Forer
University of British Columbia
Douglas Hyatt
University of Toronto
Christa Japel
Université du Québec à Montréal


An Economic Perspective on the Current and Future Role of Nonprofit Provision of Early Learning and
Child Care Services in Canada
Final Project Report
Gordon ClevelandUniversity of Toronto at Scarborough
Barry ForerUniversity of British Columbia
Douglas HyattUniversity of Toronto
Christa JapelUniversité du Québec à Montréal
Michael KrashinskyUniversity of Toronto at Scarborough
March 1, 2007


Table of Contents
IMPORTANT NOTE ......................................................................................................3
THANK YOU ...................................................................................................................5
1. INTRODUCTION .......................................................................................................9
2. SUMMARY OF RESEARCH AND CONCLUSIONS .......................................... 13
3. REVIEW OF LITERATURE ON NONPROFIT CHILD CARE ......................... 19
4. EVIDENCE ON NONPROFITS IN CANADA: THE “YOU BET I CARE!” SURVEY ...................................................................................................................... 29
5. EVIDENCE ON NONPROFITS IN QUEBEC: THE “GRANDIR EN QUALITÉ” STUDY ................................................................................................... 45
6. NONPROFIT AND COMMERCIAL CHILD CARE IN THE CITY OF TORONTO ................................................................................................................. 51
7. EVIDENCE FROM THE ELDEQ ON CHILD CARE QUALITY ..................... 57
8. NONPROFIT AND COMMERCIAL CHILD CARE IN OTHER COUNTRIES ............................................................. 63
REFERENCES ............................................................................................................... 77
Appendix A: Provincial/Territorial Grant Programs in 1998 .......................................... 81
Appendix B: Average Values of Key Variables in Thin and Thick Markets by Nonprofit Status, YBIC ................................................................................................................ 82


3
IMPORTANT NOTE
This project has been financially supported by Social Development Partnerships Program at Social Development Canada (now Human Resources and Skills Development Canada). Their support for this project implies that they found the issues we have investigated worthy of concern, but it should not be taken to imply in any way that this Department or the Government of Canada agrees with the analysis or the conclusions reached.
Similar caveats should be attached to those who have kindly provided access to various data sets. The Institut de la Statistique du Québec provided access to both the public user version and the restricted version of the Grandir en Qualité data set, and both Carl Drouin and Lucie Gingras were extremely helpful in providing information and research assistance, but neither the ISQ nor the CIQSS is in any way responsible for the use and interpretation of the data.
Gillian Doherty generously provided access to the You Bet I Care! data set, but she is not in any way responsible for the use and interpretation of the data.
Petr Varmuza, from Children’s Services at the City of Toronto, provided access to data from child care centres in 2005 having purchase-of-service agreements with the City of Toronto. He was very helpful in aiding our understanding of the limitations of the data at the current stage, and the improvements being made for the 2006 and 2007 data. However, he is in no way responsible for the specific use and interpretation we have made of the 2005 data.
We are similarly grateful to have been given access, by the Institut de la Statistique du Québec, through Christa Japel, to the data from the Étude Longitudinale de Développement des Enfants du Québec (ELDEQ). The ISQ is, again, in no way responsible for the specific use and interpretation we have made of the data.


5
THANK YOU
Any project of this magnitude relies on the good graces, and generous contributions, of a large number of people. There are many unsung heroes.
Our thanks go to Tammy Turpin-Loyer, our original project officer at Social Development Canada, and to Julia Fuchs and Mathilde Nduwimana, who took on this role later on. Thanks to Penny Hammell, too, for wise and helpful advice and support when we needed it. Thanks also to Sigrid Plamenco from the Office of Research Services, at U of T, who worked tirelessly to keep the finances straight. Special thanks to Judith Smith, the effortlessly cheerful and efficient financial officer at the Department of Management, UTSC.
Thanks to all who helped with data sets. This includes Gillian Doherty, Carl Drouin, Lucie Gingras, Petr Varmuza, Michele Campolieti and Pierre McDuff at least, and probably others we have neglected to thank.
Thanks to all those whom we interviewed – in British Columbia, Saskatchewan, Ontario, Quebec and Nova Scotia. We have decided not to quote people directly, nor to attribute opinions indirectly, but the interviews became an important foundation of our empirical work and our interpretation of data results, as well as guiding us towards helpful policy conclusions. We had conversations with a wide range of people over the several years of the project. Those interviewed included (note that position shown in brackets is for identification purposes only and was correct at the time of the interviews):
Saskatchewan
Rick August Executive Director, Strategic Policy, Saskatchewan Community Resources and Employment
Shauna Coons Instructor, Saskatchewan, Institute of Applied Science and Technology, Wasana Campus, Regina
Sue Delanoy co-ordinator, Saskatoon Communities for Children and Co-ordinator of the Understanding the Early Years Project, Saskatoon
Marta Juorio Director of Child Care, YWCA Child Development Centre, Saskatoon
Anne Luke Co-ordinator, Regina Early Learning Centre
Monica Lysack Consultant, Regina
British Columbia
Jane Beach Social Policy Consultant, Victoria, British Columbia
Rita Chudnovsky Child Care Advocate, Coalition of Child Care Advocates of B.C., Vancouver, British Columbia
Barry Forer Ph.D. Candidate, University of British Columbia, and data analyst with You Bet I Care!, Vancouver
Hillel Goelman Professor, Department of Educational and Counselling Psychology and Special Education, Human Early Learning Partnership, University of British Columbia
Paul Kershaw Assistant Professor, Faculty of Graduate Studies, Human Early Learning Partnership, University of British Columbia
Mab Oloman Consultant, Vancouver, British Columbia

6
Susanna McIlhenny Instructor, Saskatchewan, Institute of Applied Science and Technology, Wasana Campus, Regin
Brian Malley Facilitator, Early Learning and Care Discussion Forums, Malley Contract Services, Saskatchewan
Kay Molnar Instructor, Saskatchewan Institute of Applied Science and Technology, Regina
Shelley Whitehead Assistant Deputy Minister, Department of Community Resources and Employment, Saskatchewan
Barbara Young Facilitator and Researcher, Early Learning and Care Contract with SIDRU, YoungStone Consulting, Saskatchewan
Ontario
Sue Colley Co-ordinator, Integration Network Project; Executive Director, Building Blocks for Child Care, Toronto
Barbara Coyle Executive Director, Canadian Child Care Federation
David Hay Director of Family Network, Canadian Policy Research Networks, Ottawa
Sherri Torjman Vice-President, Caledon Institute of Social Policy, Ottawa
Quebec
Nina Howe Professor, Department of Education, Concordia University, Montreal
Ellen Jacobs Professor and Chair, Department of Education, Concordia University, Montreal
Pierre Lefebvre Professor of Economics, Université du Québec à Montréal
Philip Merrigan Professor of Economics, Université du Québec à Montréal
New Brunswick
Diane Lutes Director of Child Care, Government of New Brunswick, Fredericton
Pam Nason Professor, Department of Education, University of New Brunswick, Fredericton
Pam Whitty Professor Department of Education, University of New Brunswick, Fredericton
Nova Scotia
Elaine Ferguson Executive Director, Child Care Connections, Halifax
Margo Kirk Executive Director, Dalhousie University Children’s Centre, Halifax; Treasurer, Child Care Advocacy Association of Canada
John McCracken CUPE Communications Representative, Halifax
Shari Ridgewell Early Child Development Officer, Halifax
International
Sue Naughton Child Care Educator, Canterbury, New Zealand


9
1. INTRODUCTION
This is the final report of a project to investigate how nonprofit child care is different from and similar to for-profit (or commercial) child care in Canada. This project has been nurtured by the Department of Management at the University of Toronto at Scarborough and funded by Social Development Partnerships Program of Human Resources and Skills Development Canada. Naturally, neither of these is responsible for the content of the report.
The start date of this project was October 21, 2003. Originally, the plan was to complete our investigations, with emphasis on analysis of the You Bet I Care! data set by July 31, 2005. The original objectives of the project were described this way:
Strategic Description:
This project will investigate the current and future role of non-profit organizations within the early learning and child care system in Canada. The project includes literature review, collection of information nationally and internationally, statistical analysis of data from the YBIC! data sets, and interviews with key informants. Published results will inform policy makers and non-profit organizations.
Executive Summary of Proposed Project:
Non-profit organizations have often been favoured by governments in the delivery of early learning and child care services; they are viewed as superior agents in safeguarding public interests in quality and accountability. However, studies of Canadian early learning and child care services have not yet been able to establish whether non-profit status is a reliable indicator and determinant of quality of service, or under what conditions this would be true. Further, it is not clear whether the “quality-enhancing” role of non-profit status depends on the particular agencies currently involved and would not be preserved if the provision of early learning and child care services were to be significantly expanded.
This project will investigate the current and potential future role of non-profit organizations in the provision of early learning and child care services. There are four broad objectives:
• To clearly identify hypotheses about causal mechanisms and processes determining a distinct role for non-profit organizations in ELCC;
• To describe and evaluate the policy perspectives and experiences of Canadian jurisdictions and OECD countries with non-profit and for-profit ELCC services;
• To assess, using both simple and sophisticated statistical techniques, the data on the behaviour of non-profits from YBIC!;
• To collect significant contextual evidence about the operation of non-profits in Canadian ELCC, and to assess whether these operations are likely to be significantly changed by expansion of the system of ELCC services in Canada
The intended result of the project will be to produce insightful analyses of the current and future role of non-profits in an expanded system of ELCC services. Ultimately this would contribute to system-design decisions of policy makers.

10
This project has, so far, investigated the role of non-profit organizations in delivering child care in Canada, using data analysis (of the You Bet I Care! study), key informant interviews, and a review of policy and academic literature on this topic. Because the conclusions reached are controversial (that non-profit status has important causal effects on quality even when differences in financial resources and clientele are held constant), it is important to continue to test their validity as a basis for policy. It is proposed to use the information in three other new data sets to verify or modify the conclusions reached in the study up till now. Two of these data sets focus on the determinants of quality in child care services in Quebec, and the third provides data on quality in child care centres in Metropolitan Toronto. In each case, the data available would permit research in general on the role of key determinants of quality in child care settings, and, in particular, on the separate effect of non-profit status and the ways in which non-profit status is linked to other determinants of quality. Further, the examination of the determinants of quality in these data sets will bear other fruit. First, the exploration of these data sets will provide valuable information on the general and specific determinants of quality in child care. By isolating the magnitude of contribution to quality of each of a number of policies or resources (e.g., staff-child ratio, education level of staff, education level of director, non-profit status, etc.), this project extension will enhance public discussions about how best to spend scarce public dollars to improve quality in child care services in Canada. Second, using these three new data sets, we will examine a number of alternative statistical indicators of quality in child care to determine which indicators might be useful for provinces and territories to report on in their monitoring and accountability efforts.
Each of the three data sets has its particular strengths. The Grandir en Qualité data set has a large sample with detailed information from staff, directors, and on-site quality inspections about each facility (centres and family homes, commercial and non-profit). It is possible to get access to a considerable amount of detailed financial information from each centre to determine the role of financing in producing quality services.
The Longitudinal Study of Child Development in Quebec (ÉLDEQ) provides information from on-site inspections of quality, information about non-profit status, but also a considerable amount of information about the characteristics of children and families using different types and qualities of care.
The data provided by Children’s Services at the City of Toronto is interesting, in particular, because it speaks to the question of whether regulation and monitoring can make non-profit and commercial child care services behave similarly. The City of Toronto is very active in monitoring and regulating child care services within its jurisdiction above and beyond normal provincial regulation activities. This data set has information about measured quality, non-profit status and a set of other variables for child care centres in Toronto.
In the spring of 2005, we requested an extension of the project to verify or reject the conclusions to which our project was coming, by evaluating evidence from three additional data sets: Grandir en Qualité, the Étude Longitudinale de Développement des Enfants du Québec and administrative data from child care centres having purchase-of-service agreements with the City of Toronto. This extension was granted and lasted until October 21st, 2006.
The plan for the second phase of the project was described in these terms:

11
The extension of the project involved bringing in some new personnel. The original project involved Gordon Cleveland and Michael Krashinsky, economists from the Department of Management at the University of Toronto at Scarborough. At the time of the project extension, three additional academics were added. These were: Douglas Hyatt (Centre for Industrial Relations at University of Toronto and Rotman School of Management), Barry Forer (a Ph.D. candidate and methodologist in psychology at the Department of Educational and Counselling Psychology and Special Education in the Faculty of Education at U.B.C.), and Christa Japel (developmental psychologist from the Département d’éducation et formation spécialisées at Université du Québec à Montreal).


13
2. SUMMARY OF RESEARCH AND CONCLUSIONS
Canada has one of the largest and most vibrant nonprofit and voluntary sectors in the world (Hall et al., 2005). Nonprofit and voluntary organizations employ 12 percent of Canada’s work force (second only to the Netherlands) and account for nearly 7% of its GDP. Nearly 3⁄4 of the workers in Canada’s nonprofit organizations are involved in direct delivery of services, such as education, health, housing, social services, economic development promotion, and so on. The main source of support for nonprofit organizations is not charitable donations, but government grants and reimbursements for services provided. Government funding is particularly prominent in the fields of health, education and social services. If hospitals, universities and colleges are set aside, the most important revenue source for other nonprofits is earnings from private fees and service charges (Hall et al., 2005).
In nonprofit organizations in social services across Canada, ⅔rds of revenues come from government. Child care centres are unusual because, while there is a substantial amount of government funding, this typically is less than half of all revenues (and is concentrated, outside of Quebec, in supporting services directed at low-income families). In fact, the majority of revenues for this social service come from parent fees. Corresponding to this mixed financial status, child care in Canada is characterized by mixed nonprofit/for-profit provision of services.
Like any broad class of persons or organizations, nonprofit organizations are similar in some ways and different in others. It is difficult or impossible to make any statement that will be true of every nonprofit organization.
Despite these difficulties, in the child care field there appear to be important differences on average between nonprofit and for-profit organizations. However, there is not yet agreement on how to define and analyze these differences. Many believe that nonprofit organizations are inefficient because they lack the profit motive that would give them incentives to cut costs and make sharp business decisions. Many others believe that nonprofit organizations spend money more wisely and provide better financial accountability in the service of human needs because they have no incentive to siphon revenues off into owner profits. Some believe that nonprofits inevitably produce better quality services for their clients; some believe that for-profits provide better quality because they are more responsive to customer demands.
The purpose of this project has been to move beyond these broad stereotypes and to seek to investigate under what conditions and circumstances nonprofit organizations provide better quality child care services, and whether these tendencies can be relied upon by board members, parents, advocates and governments seeking to improve the quality of child care services available for preschool children.
As we see in the literature review in the next chapter, nonprofit child care centres have frequently been found to be, on average, of better quality than for-profit (or commercial) child care centres. However, the reasons for this have been unclear. In the first place, it has not been found that every nonprofit centre is better than every for-profit centre. Although averages are different, the distributions of quality in the two types of centres overlap. Further, it is not obvious that the straight quality comparison between the two types of centres is a fair one. It may be the case that commercial child care centres are not aiming to produce high quality child care, but instead are aiming to produce child care of moderate quality but at a cheaper price. If so, we would want to adjust for differences in fees between the two types of centres, and then compare the adjusted average levels of quality of nonprofit and commercial child care.

14
1 Some of these statistical controls create problems of interpretation. What does it mean to hold constant the extra resources that nonprofits gain by virtue of the fact that they can attract donations? In our opinion, it is part of the essence of nonprofits that they are trusted sufficiently by users and donors to attract volunteer and donated resources.
Alternatively, it may be the case (depending on the jurisdiction), that nonprofit centres have more access to government grants and subsidies than do commercial centres. If this is true, perhaps the average differences in quality are entirely explained by the differences in access to government financial resources. So, we need to statistically adjust the figures to standardize for government financial resources across the two types of centres, and observe whether an average difference in quality still remains.
There are other factors, too. It may be true that nonprofits have volunteer donations - either donated labour or donated resources (e.g., maintenance and cleaning services) by parents or by a sponsoring organization – and for-profits do not. It may be true that nonprofits and commercial centres have different clientele, making it easier (less resource-intensive) in one of these types of centres to produce good quality child care services. It is desirable to statistically control1 for all of these kinds of differences as well, and observe whether an average difference in quality still remains.
2.1 The Evidence About Nonprofits and Quality
In chapters 4, 5, 6 and 7, we examine Canadian evidence about the relation between auspice and quality in four different data sets. The gross pattern is remarkably uniform. Everywhere, nonprofits produce a higher quality of care in child care centres, whether measured by the Early Childhood Environments Rating Scale and the Infant Toddler Environments Rating Scale, or by the special scale developed to measure the quality of “educational” child care in Quebec, or by the measures used by the City of Toronto. Although there are good quality nonprofits and poor quality nonprofits, nonprofit centres are overrepresented at higher levels of quality and underrepresented at lower levels of quality. Although the frequency distributions of quality in nonprofit and in for-profit care overlap, the nonprofit distribution is shifted towards higher quality levels.
You Bet I Care!
The “You Bet I Care!” data set is the one in which we are able to control most effectively for resource or other differences that might account for these average differences in quality. The gross quality difference of 7.79 percentage points drops to 4.2 percentage points when a host of different controls are included. Differences in revenue per child account for some of the quality differences between for-profit and nonprofits. So do differences in the education level of the director, differences in ECE-specific training of the lead teacher in the classroom, and differences in the child-staff ratio and group size. Yet, after all this, there is a modest but important difference in quality that remains, using data from 6 provinces and 1 territory across Canada.
In fact, however, these relatively modest differences mask an underlying reality of bigger differences in some locations and smaller differences in others. When we divide child care markets across the country into those which are thin (a relatively small number of children in the right age range) and those that are thick (a relatively large number of children geographically concentrated in the right age range to use child care), we find that nonprofit centres play a different role in each. In thin markets, there is no significant difference between nonprofits and for-profits, either before or after controlling for any resource differences. Revenue per child matters substantially for quality. So do the education level of the director and of the lead teacher. But nonprofit status does not independently influence quality produced.

15
We hypothesize that in thin markets there is no opportunity for nonprofits to produce and sell a differentiated service – differentiated by higher quality. Child care centres need to remain full most of the time, so their ability to charge a higher fee depends on the marginal customer who wants to purchase the quality that they are producing. In thin markets, there are not many parents with the demand and income to support higher quality services, so the marginal consumer restricts what nonprofits can strive to do (unless government grants are substantial enough to change this equation).
In thick markets, there is a sufficient mass of geographically concentrated potential consumers to allow nonprofits to aim for the higher quality end of the market (while commercial centres go for the lower end). The result, in thick markets, creates an apparent virtuous circle. Striving for higher quality services (and hiring the staff, encouraging the ongoing professional development, and paying the wages, that are commensurate with that objective), makes nonprofit centres in thick markets especially productive at producing child care quality. In the end, even holding constant the resource and input differences between nonprofit and for-profit centres in thick markets, the nonprofits have an advantage in producing better quality of care.
The gross quality difference between nonprofits and commercial centres in thick markets is over 12 percentage points. This is reduced to 9.1 percentage points when revenue per child and a host of other differences between nonprofits and for-profits are controlled. Given that the average quality level across the data set is 60.1%, a net nonprofit advantage of over 9 percentage points is very large.
Grandir En Qualité
The Quebec child care/family policy reforms began in 1997. By 2003, although child care was still a purchased service, the large majority of the cost is paid by government. Nonprofit child care centres appear to target the higher end of the quality spectrum, while the commercial centres have negotiated to have lower teacher training requirements at lower levels of quality. The Grandir en Qualité data set allows us to analyze the effect of nonprofit status in this situation.
There is no doubt that nonprofit status has been favoured by the Quebec Government in the design of its child care reforms. In order to be licensed as a Centre de la Petite Enfance (CPE), centres must be both nonprofits and have a parent-dominated board. But, due to shortages of supply, a considerable number of for-profit “garderies” are also licensed to provide subsidized $5 per day services to children.
The analyses of the Grandir data set are still preliminary, but for preschool children, they show a marked difference in average quality between nonprofit and for-profit providers. On average there is nearly a 12 percentage point difference in quality, or, to put it another way, the average CPE has preschool quality which is 22% higher than the average garderie.
There are important differences in resources between CPEs and garderies, and it is not clear that we have yet controlled adequately for all of these differences. CPEs pay a much higher proportion of their wage bill to trained staff than do commercial garderies. Average wages are much higher in CPEs . Correspondingly, teachers in CPEs are much more likely to have a college education, to have had recent professional development training, and to have considerable job experience than are teachers in the for-profit sector. When we control for these and for a wide range of other input differences, as well as for regional differences, we still find that quality in nonprofit CPEs is over 5 percentage points higher for preschool children.

16
City of Toronto
The data from the City of Toronto do not provide complete quality measures, but only assessments of interaction in preschool classrooms. Further, the quality measures are being revised for 2006 and 2007. Again, therefore, the City of Toronto data give a preliminary look, best taken as part of an overall picture along with other pieces of evidence from other data sets. The City of Toronto is particularly interesting because it helps to give insight into the difficulties of regulating away differences in quality between nonprofit and for-profit providers of child care. The City of Toronto has been quite active in monitoring and regulating the centres with which it has purchase-of-service agreements (this is the group of centres on which we have data). If regulation was sufficient to eliminate quality differences between nonprofit and commercial centres, we should observe it in the City of Toronto.
In preschool classrooms in the City of Toronto, there is, on average, a five- percentage-point difference in quality between nonprofits and for-profits. Controlling for differences in government grants received as a percentage of wages, and for differences in the characteristics of families receiving low-income subsidies in the centre reduces this profit/nonprofit difference only marginally. However, when differences in the percent of hours taught by ECE-trained educators, and differences in the average wage of ECE teachers are also controlled, nonprofits no longer have a remaining quality advantage.
Better data are needed before we can definitively interpret these results. It appears that the quality difference between nonprofits and for-profits in the City of Toronto is not mostly due to differential resources or clientele. Instead, it is due to the differential use of the resources that centres have. Nonprofits are much more likely to put their revenues into hiring teachers who are better trained and paying them higher wages. This differential use of the resources they have produces higher quality child care in nonprofit preschool classrooms.
The ELDEQ
The Quebec Longitudinal Study of Child Development collected on-site observational data about the quality of care in whatever child care arrangements its children were using, beyond the age of 21⁄2 years. This included both for-profit garderies and centre-based services in a CPE, but also regulated family care (co-ordinated by CPE’s) and unlicensed neighbourhood care in a home. The data set does not contain detailed measures of resources and inputs used by child care providers, so it is not possible to analyze the contribution of resource-differences to quality of care among these different types of care. The strength of this data set, however, is its inclusion of a wide range of different types of child care, allowing us to set the for-profit/nonprofit quality differences into context.
Several conclusions emerge. First is that a considerable number of the arrangements used by children in Quebec at that time have quality too low to promote desired child development. Second, is that both centre-based CPEs and regulated home-based services associated with CPEs have average quality above the mid-point on the ECERS quality scale. The average quality in for-profit centre-based care and unregulated home-based care are both below the mid-point on the ECERS scale.

17
When we correct for response bias by predicting quality level in those arrangements unwilling to respond to the survey, it becomes clear that there are few unregulated home-based child care arrangements that could be called stimulating of child development. Many for-profit centres are similarly unstimulating, though over 30% have quality above the mid-point. Over 45% of regulated home-based care has care above the mid-point on the quality scale, along with about 70% of centre-based CPE’s. These are quite dramatic findings, confirming and extending the pattern found in the “Grandir” study. The ELDEQ makes clear that the for-profit/nonprofit distinction in centre-based care is only one front in the battle for higher quality developmental child care services.
2.2 What is the Right Policy Approach to Child Care Auspice?
There may be no single right approach to the for-profit/nonprofit issue in child care. Much depends upon context, situation, history, available resources, political will and, of course, objectives. The issue of nonprofit child care in Denmark or France may call for a different policy response at any point in time than in Australia, or New Zealand.
However, if we confine ourselves to thinking about Canada, we can be somewhat more prescriptive. We believe that improvements in the educational and developmental quality of child care are of key importance in Canada. The current quality of nonparental child care is too low to stimulate child development appropriately. This is particularly true in informal neighbourhood home settings upon which many Canadian parents rely.
This is the underlying rationale for supporting public financing of a system of regulated child care services that are affordable and accessible to a wide range of Canadian families. In order for that public financing to make sense, these regulated child care services must deliver early learning and child care that contributes strongly to child development, as well as supporting parental employment.
It is in this context that the preference for nonprofit delivery of child care services emerges. Under the right conditions, nonprofit status appears to contribute strongly to the quality of services as measured in a range of different data sets we have examined. Partly this greater production of quality occurs because nonprofits make different decisions about inputs (and appear to have higher quality objectives) than for-profits in child care. Nonprofits consistently hire better-trained staff, encourage them to professional development, and remunerate their staff better than for-profit centres. But, partly this greater production of quality appears to go beyond the different input decisions that nonprofits make. Under the right conditions, a culture of quality appears to develop in nonprofit child care organizations, producing a quality level that is more than the sum of its parts. This is what we have labeled “the nonprofit advantage” in the analysis in Chapter 4.
However, things are not quite so simple as they might appear. It is not clear that abolishing for-profit operators and requiring only nonprofit child care is sufficient. First, we have observed that in thin child care markets, nonprofit child care has no special advantage. Nonprofit status is not a magic elixir automatically producing better results.

18
Second, producing quality is not the only child care policy objective. The cost of producing quality also matters a great deal. Good quality early learning and child care is not cheap to produce. Child-staff ratios and staff salary/benefit levels have significant impacts on annual costs. As Cleveland and Krashinsky (2004) have shown, annual costs can vary from $3,700 (at ratios of 15:1 and current wage levels) to $20,700 (at ratios of 3:1 and higher wage levels). Currently, centre-based child care makes social sense when its quality is good, because it is cheaper than the cost of a parent staying home and losing her (or his) annual salary. But that advantage can be lost if the cost of child care were to rise too much.
So, the objective is really to have good quality child care at an affordable cost (both to parents and to taxpayers). Nonprofit child care appears, under the right conditions, to make an important contribution to these twin objectives. While nonprofits do, generally, devote more resources to the production of quality, their production of quality is superior even holding resources constant. The appropriate policy objective of governments, and child care managers, is to find ways to maintain the right conditions under which nonprofits will continue to deliver quality services efficiently.
Thin markets provide one example of this. Our analysis suggests that nonprofit organizations in thin markets do not have the right combination of incentives and resources to produce good quality care, and to develop a culture of quality. Finding this combination should be an important objective of policy development for thin markets.
2.3 Policy Lessons for Managers and Staff in Nonprofit Child Care
There are potentially important implications of this analysis for both policy makers and managers of nonprofit child care centers. Nonprofit managers can draw several implications for their practice. First is a renewed recognition that, under the right conditions, nonprofit status is a good and reliable indicator to consumers of substantial average differences in quality of service. Since consumers are parents who care about child development quality but have inadequate time or ability to judge it, this reliable signal of quality is a considerable advantage that nonprofits in thick markets should use more forcefully. Nonprofits in thin markets should seek to attract the resources and emulate the practices that would allow them to make a similar claim to consumers, governments and donors.
Another implication for nonprofit managers and for staff in nonprofit centers is based on the apparent relationship between wage levels and the nonprofit advantage. Nonprofits do pay higher wages to staff than for-profits. The evidence, both from studies of cost functions and from this report, suggests that these higher wages have generally been associated with higher quality services. If nonprofits are to retain an advantage, it is important that this relationship between compensation and quality levels is maintained. This implies that higher salaries and benefits should go hand in hand with higher qualifications, greater child development knowledge, increased professional development, and enhanced motivation towards stimulating high levels of child development for all children. This is particularly true in nonprofit centres in which quality is currently below the good to excellent level.

19
3. REVIEW OF LITERATURE ON NONPROFIT CHILD CARE2
Since the late 1960s, women have been entering the labour force in ever growing numbers, and the most dramatic expansion has been among mothers with young children. Those children require care while their parents work, and while some countries (France and Sweden, for example) have responded by producing child care through the public sector, many countries (including the United States and Canada) have relied upon the private sector to provide that care. While in market economies, most products are provided for sale exclusively by for-profit firms, child care is generally produced by both for-profit and nonprofit organizations.
This has led naturally to considerable concern among child care advocates about the potential differences between for-profit and nonprofit firms. Since the well-being of children is a matter of great interest, can we rely upon the profit-making motive to generate high quality child care? Is it possible that for-profit firms might divert some of the money paid by parents away from the care of children and towards higher profits?
These issues also arise for governments. Because of that public interest in the welfare of children, governments in most countries provide a variety of subsidies and grants to organizations that provide care to young children. In some countries (the United States, much of Canada), public money is focussed on poorer children; in other cases more general grants are provided for all children cared for outside their families. But in either case, the issue of auspice arises. Can governments trust for-profit firms to provide high quality care, or should they be concerned that these firms might divert government money towards the generation of higher profits? Alternatively, can governments rely on nonprofit organizations to use public money efficiently, or might the lack of market discipline lead nonprofits firms to operate inefficiently or to divert public money to purposes other than what was intended.
These questions have very practical implications. If for-profit firms cannot be trusted, then child care subsidies should be provided only through nonprofit (or even public) institutions. If for-profit firms are more efficient, then parental choice (that is subsidies directed to the demand side) might be used to encourage production that directly meets the needs of working parents and their children.
This debate has been taking place during a period in which there has been considerable theoretical interest in the nonprofit sector. For those interested in organizational choice, the persistence of nonprofit institutions in a fundamentally market-driven economy suggests that nonprofit firms must have particular advantages under certain circumstances. Child care becomes to these academics a most interesting sector, since it is one of the few in which for-profit and nonprofit firms seems to co-exist. The sector, if carefully studied, might reveal interesting insights into how and why nonprofit organizations exist.
2 Material from this chapter and the next also appears in an article submitted for publication by Gordon Cleveland and Michael Krashinsky entitled “The Nonprofit Advantage: Producing Quality In Thick And Thin Child Care Markets” (2006)

20
Public funding for child care in Canada has emerged in a somewhat chaotic fashion over the past 40 years. The highly decentralized nature of the Canadian government (the Canadian Constitution gives responsibility for both education and welfare programs to the provinces, which would seem to suggest that child care is a provincial responsibility) has meant that different funding regimes have emerged in different jurisdictions. Federal funding was provided in the 1960s to the provinces through the Canada Assistance Plan to provide subsidized child care for low income and disadvantaged families (as the constitution has been interpreted, the Federal government can provide conditional funding to the provinces in areas of provincial responsibility). Federal guidelines ensured some common elements early on, but the disappearance of these kinds of conditional grants in the 1970s and 1980s has meant that each province has designed its own child care programs. On one extreme, some provinces provide funding only to low income parents; on the other, Quebec has designed a plan that provides low cost child care to all parents (five-dollar-a-day child care is available to all children) . Some provinces direct funding through for-profit and nonprofit centres; others rely exclusively on nonprofit community-run centres.
In designing a child care program, key questions must be answered. Do non-profit centres provided better quality care than for-profit centres? If they do, would the advantage remain if equal public funding were provided to both kinds of institutions? And finally, if funding were restricted to nonprofit centres, how would the nonprofit child care sector evolve over time? That is, even if we find that nonprofit centres provided higher quality care at a given level of budget, would that advantage remain if funding were limited to nonprofit providers, or would for-profit entrepreneurs infiltrate the nonprofit sector and erode quality even as they “masquerade” as nonprofit providers?
In attempting to answer these questions, we begin by considering some of the considerable literature that deals with the issue of quality in the nonprofit sector. First we look at the general economics literature describing the functioning of nonprofit firms. Then we consider the particular attempts to measure the influence of auspice on the quality of output in the child care sector. Both of these will lead us to hypotheses which we will, in later chapters, attempt to test using Canadian data.
3.1. The General Economic Literature On Nonprofit Institutions
With some limited exceptions (see Newhouse, 1970, and Nelson and Krashinsky, 1973), economists paid limited attention to nonprofit institutions prior to 1980. In neo-classical microeconomics, the inner workings of the firm are eliminated in relatively simple assumptions (profit maximization, for example) about the way firms behave. In models of perfect competition, for example, all firms seek the same goals and produce identical output in pretty much identical ways. Even large competing oligopolists pursue their strategic goals in ways that ignore any conflicts within the firm.
In competitive markets, competition eliminates opportunistic behaviour by producers. Naturally, producers would like to produce lower quality so as to increase profits (lower quality costs less to produce). But consumers can judge what they see in front of them, and will not purchase lower quality goods when other firms offer better quality. Firms cannot lower quality without losing sales, and competition eliminates any firms that try such a strategy. In such a simple world, consumers are getting the best possible output from for-profit firms, so there is no function for nonprofit institutions.

21
Following this logic, Henry Hansmann (1980) in his seminal article, argues that nonprofits develop when “contract failure” makes market production unattractive. By this Hansmann meant that a variety of problems might make it difficult for the consumers of a particular commodity to police the conduct of producers by normal contractual or market mechanisms.
Other authors have attempted to extend Hansmann’s approach. For example, government activity is clearly an alternative to nonprofits when there is contract failure. Weisbrod (1975; extended in 1988) suggests reasons why the nonprofit sector might still play a role in meeting the needs of those with a particular interest in the commodity in question. And Hansmann’s focus on individual consumers ignores the role of the government in choosing to contract out some of its activities to nonprofits (Krashinsky, 1990). Furthermore, some of the motivation for nonprofit activity lies on the supply side. Entrepreneurs who are less motivated by profits than by other considerations may find nonprofits attractive (Young, 1981). In some cases, the religious motivations of those running the organization have generated nonprofit activity ( James, 1987).
The problem that we are left with is that once we accept these arguments, we have lost the easy assumptions in the economic competitive model about the maximization of quality. Remember that for-profit producers did not produce the highest quality because of any altruistic motives. They produce quality because market competition forces them to do so. If we suggest that this competition is not longer effective, then we must revisit the issue of whether producers - either for-profit or nonprofit - will produce the levels of quality that best serve consumers’ interests.
In general, the literature on these matters goes in two separate directions. One direction is favourable to the nonprofit sector, suggesting that nonprofit institutions evolve when they are more effective in providing a particular good or service than other possible institutional arrangements. The second direction is more critical of the nonprofit sector, suggesting that nonprofit institutions may operate inefficiently, either because they lack the normal profit-making incentive to contain costs, or because they have different goals that may skew production in directions that consumers themselves might not favour. This might make for-profit firms, imperfect though they are in a Hansmann world, somewhat more tolerable.
To understand these issues, it is worth revisiting Hansmann’s analysis. Hansmann’s emphasizes the importance of contract failure and informational asymmetries in explaining the nonprofit sector. He restates his earlier theory in a 1987 paper as follows (p. 29):
nonprofits of all types typically arise in situations in which ... consumers feel unable to evaluate accurately the quantity or quality of a service a firm produces for them. In such circumstances, a for-profit firm has both the incentive and the opportunity to take advantage of customers by providing less service to them than was promised and paid for. A nonprofit firm, in contrast, offers consumers the advantage that, owing to the nondistribution constraint, those who control the organization are constrained in their ability to benefit personally from providing low-quality services and thus have less incentive to take advantage of customers than do managers of a for-profit firm.

22
Hansmann understands of course that the nonprofit form has its own problems (including slowness in responding to changes in consumer preferences, and the possibility of overcoming the nondistribution constraint). However, he suggests that there may be situations in which the nonprofit institution will dominate other alternatives.
Hansmann’s examples (1980) suggest that these situations usually require more than just a few problems among consumers in evaluating quality. In particular, he focuses on situations in which buyers are separated from the recipients of the commodity, and on public goods. For example, donors to a charitable organization would have trouble determining whether all of their contribution was used for the purposes for which it was intended. A for-profit charity would have an incentive to skimp on the services it provided and to increase profits; because of the non-distribution constraint, a nonprofit organization is more trustworthy. Similarly, family members who buy education or day care for children or nursing care for the elderly may not be able to monitor what is being done in their absence; nonprofit schools or centres or homes may be more reliable and less likely to degrade the product to increase profits. Hansmann’s ideas are also developed by other writers, including Easley and O’Hara (1986), and Krashinsky (1986).
A second strand in the theories surrounding the nonprofit sector originates with Weisbrod (1975; see also his later work 1988). He suggests that nonprofit institutions are in part a response to the limitations on government provision. Governments respond to median voters; those who have a high demand for public goods will find that government does not supply as much as they would like (Weisbrod calls the differences in the demand for public goods “heterogeneous demand”). In order to increase their utility, these high demand consumers support nonprofit firms which can satisfy their needs.
Like Hansmann, Weisbrod addresses the issue of “market failure”. Public goods are a form of market failure that are classically addressed in economics analysis by public production. But public provision can be expensive: negotiating production in the public sector involves political activity and is hardly an easy way to satisfy demand. Some critics see the public sector as inherently expensive and unresponsive, and some citizens also fear large governments as a threat to freedom. With all this in mind, nonprofit institutions can be a viable alternative.
A third strand in the theory comes from the work of Ben-Ner who, with his co-authors, emphasizes the efforts of consumers in establishing nonprofit organizations in order to maximize control over output in the face of informational asymmetries (see Ben-Ner and Van Hoomissen, 1992, Ben-Ner and Gui, 1993, and Ben-Ner, 1994). Ben-Ner’s statement of the problem is entirely consistent with Hansmann’s view. For example, Ben-Ner states:
Goods and services with such difficult-to-verify attributes will be termed “trust goods.” For-profit firms have an incentive to take advantage of demand-side stakeholders’ limited information concerning trust goods by providing a service of inferior quality or by charging a higher-than-normal price. ... As in the case of collective goods, the market failure here stems from insufficient distribution of information through the market. In both cases, the problem cannot be resolved because demand-side stakeholders do not trust for-profit firms’ motives. (Ben-Ner, 1994, 751-2)

23
Ben-Ner’s approach can be attractive to day care advocates, who are likely to prefer parent-dominated boards for child care centres. Ben-Ner views nonprofit organizations as a type of “backward vertical integration by demand-side stakeholders.” (Ben-Ner and Gui, 1993, 8) He views nonprofits subject to direct consumer control as “bona fide nonprofit organizations, to distinguish them from nonprofit organizations controlled by other parties.” (Ben-Ner, 1994, 753)
The emphasis in all three strands has been on the abilities of the nonprofit form to provide for the needs of private individuals more effectively than alternative forms of organization. These individuals can be buyers purchasing commodities for other family members who have difficulty evaluating the quality of what they are consuming and communicating that evaluation to the purchaser (day care, nursing homes). They can be donors providing goods and services to needy recipients in ways that are difficult to monitor (charities, foreign aid agencies). Or they can be consumers of public goods whose demand is not met effectively by governments (education, social services).
Individuals are however not the only buyers. Governments themselves purchase goods and services from private organizations. Because governments are often providing services that are consumed by other parties, and are often involved in sectors in the first place because of the existence of public goods, they are frequently prone to the same kinds of information problems discussed above. This leads governments to turn to nonprofit providers for the same kinds of reasons as private consumers, and is one of the reasons that governments are often an important source of funds for nonprofit institutions. Discussion of this kind of funding and its implications can be found in Salamon (1987) and Krashinsky (1990).
Of course governments can produce these commodities themselves (a choice that is not usually practical for individual consumers). However, two factors often mitigate against public provision. First, the absence of competition and firm performance indicators may make public production inefficient. Second, since governments are often providing commodities that are politically sensitive, nonprofit providers provide a layer of insulation between the government and potentially awkward decisions (on what to teach, on how much hospital care to provide, and so on).
Finally, it is worth noting that producers themselves may find it useful to deal with nonprofit institutions. In that sense, these producers themselves become demand-side stakeholders. For example, many corporations support a variety of public causes through donations. For the same reasons as were discussed earlier, they usually donate to nonprofit institutions rather than contracting with for-profit firms. Also, for-profit firms may find it in their interest to purchase public goods, and again will find it useful to arrange this through nonprofit organizations (Chambers of Commerce, Better Business Bureaus, and so on; hospitals may be viewed as producer-run nonprofits providing services to physician-firms).
It is also important to consider the interests of those who manage nonprofit institutions, since the demand for nonprofit provision will be unsatisfied unless someone is prepared to set up and run these organizations. In Ben-Ner’s view, those who control the nonprofit organizations often come from among the ranks of the consumers themselves, despite the obvious free-rider problems, or from among professional administrators who see demand for their services and the possibility for pursuing their own goals, and who form alliances with demand-side stakeholders (Ben-Ner and Gui, 1993, 8).

24
An alternative vision would suggest that nonprofit organizations are started by entrepreneurs who have a complex set of goals that do not usually include profit-maximization. Young (1981) identifies a range of motivations for managers - to make money, to be creative, to provide service, to achieve autonomy, and so on - and suggests that entrepreneurs will sort themselves into different fields and sectors of business accordingly (so that those primarily interested in money will not choose the nonprofit sector). In contrast, James (1987) suggests that religious groups will often start nonprofit organizations in order to reach out to those who come to the organization. James and Rose-Ackerman (1986) suggest that some nonprofits are started in order to engage in cross-subsidization (so that, for example, universities make money on undergraduate education to subsidize research and graduate education).
All of the discussion so far has assumed that nonprofits “work well.” But it would be naive to view the nonprofit sector as being without problems. Nonprofit firms may not always produce efficiently, and the unscrupulous entrepreneurs may exploit the nonprofit name in order to take advantage of consumers. These difficulties come out of the very conditions that have been used to justify nonprofit activity.
As was discussed earlier, for-profit production under perfect information and competition will always produce what consumers want at the lowest possible price. Consumers know what they want and what firms are supplying, and shop around, and firms that are either inefficient or earn profits that are too high are forced out of business because of competition. The problems of uncertainty that call this mechanism into question were used to explain the existence of the nonprofit sector. But that means that there is no natural mechanism to ensure that nonprofit firms do not themselves act inappropriately.
One stream of the literature on this issue has focused on the nondistribution constraint. By agreeing not to appropriate any profits for themselves, owners and managers are agreeing to eliminate, at least in part, the incentive to cut quality and to exploit consumers. But all this presumes that such an agreement is enforced by someone. If enforcement is lax, then the advantages of the nonprofit firm disappear.
For example, Steinberg and Gray (1992, 6) use the term “for-profits in disguise” to describe the possibility that managers of nonprofits might violate the nondistribution constraint in order to divert the income of the enterprise to their own purposes. Krashinsky (1995) suggests that this problem may become more serious in exactly those situations where demand-side stakeholders rely more on the constraint. For example, if governments provide subsidies and other benefits to nonprofit institutions, for-profit entrepreneurs will have more incentive to disguise themselves as nonprofit firms. These concerns are probably as old as the sector itself. Hansmann (1980) warns that “in spite of the limitations imposed upon them, nonprofits may succeed in distributing some of their net earnings through inflated salaries, various perquisites granted to employees, and other forms of excess payments.” It is precisely this concern that leads Ben-Ner (1994, 757) to suggest legal reforms which would empower demand side stakeholders by establishing them as legal “members” and by “linking membership to some status of control.”
The problem here arises from the very conditions which make nonprofit production attractive. If consumers could accurately judge what was being produced and could shop around among competing firms, the problem of opportunistic behaviour would disappear; but in that case, the justification for nonprofit organizations would also fall by the wayside. This is the one important limitation on the reforms that Ben-Ner proposes. Control will depend upon members having the information to make that control feasible.

25
Even if one believes that all nonprofit managers are honourable people who would not seek to enrich themselves through an inappropriate diversion of the organization’s income, the issue remains of whether nonprofit institutions act in an efficient manner - that is, whether they respond to consumer demand, minimize costs, and produce the optimal level of quality. Economic theory suggests that the absence of any clear ownership claim of the residual earnings (that is, the profits) of the firm will also eliminate the incentive to produce efficiently (see Alchian and Demsetz, 1972). James and Rose-Ackerman (1986, 37-8) suggest that the absence of incentives may lead in the nonprofit world to “more bureaucratized control mechanisms, more shirking, and higher cost curves.” Steinberg (1986) surveys the literature attempting to measure inefficiencies, but critiques the property rights approach by noting that the for-profit sector is itself not likely to act efficiently in the face of consumer uncertainty.
Even if nonprofits produce efficiently, they may not produce exactly what consumers want. Since profits are not a driving force, nonprofit managers may be slow to respond to shifts in consumer demand, so that excess demand may result in waiting lists instead of additional production (see Nelson and Krashinsky, 1973). And if nonprofit managers value quality, they may produce higher quality output than consumers would otherwise desire (see Newhouse, 1970). As discussed above, nonprofit managers may make profits on some parts of the organization’s output in order to cross-subsidize other outputs which are of value to the manager. This means that the nonprofit will not produce what consumers would regard as the optimal mix of outputs (although of course if some of those outputs are public goods, the resulting mix may in fact be socially optimal, or at least more desirable socially than what would be produced in the absence of such cross-subsidization).
Private donors also have an interest in the output of the organization, and may have the same difficulties as consumers in ensuring that managers produce what is desired. And of course we all have a collective interest in the functioning of nonprofits, both because of the direct grants made by governments to various nonprofits and because of the general tax breaks that divert public moneys across the board to the nonprofit sector. All of this motivates a growing debate both in scholarly journals and in the public press about accountability in the nonprofit sector.
3.2. The Specific Literature On Child Care And Auspice
The general literature on auspice we have presented has focussed on the justifications for the existence of nonprofit enterprises. With some exceptions, the specific literature on child care and auspice has been far more empirical, in most cases directly comparing the performance of for-profit and nonprofit child care centres.
One obvious exception is the early work of Nelson and Krashinsky (1973) which used child care as in interesting example of institutional choice. They suggested that while nonprofits would be more trustworthy and might produce higher quality, for-profits would respond more quickly to changes in consumer demand. They suggested that public regulations would be an important way to keep parents informed about quality, and that mixed provision by various types of auspice might be efficient.

26
Much of the more recent work has purported to show that nonprofits centres are indeed producing higher quality than for-profit centres. There is good evidence that nonprofit child care organizations do, on average, hire a different mix of inputs than for-profit centers. In particular, staff-child ratios, early childhood training levels of staff and wage and benefit compensation of staff are found to be higher in nonprofits in nearly every study. If there is a difference in group sizes, formal education of staff, and education level of center directors, it favors nonprofit centers, but these differences are not always statistically significant. Similarly, on measures of process quality (global observational measures of classroom quality or measures focused on child-caregiver interaction), nonprofits always either have, on average, significantly higher quality or there is no difference. The sole exception to these statements comes when auspice is broken into sub-types; nonprofit church-affiliated centers in the U.S. have been found to score particularly low on measures of quality.
Since these input differences may be accompanied by differential access to government funding and private donations, and because there are not always significant differences in process quality, there remains analytical disagreement about the role of auspice in enhancing child care quality.
There have been five data sets used to evaluate nonprofit/for-profit child care differences in the U.S. Concern with this issue began with the Keyserling study (1972) sponsored by the National Council of Jewish Women with interviews and facility visits conducted in 77 localities where this organization had a chapter. Classifying centers into four categories, this study found 38% of nonprofits and 16% of for-profits provided good or superior quality care, and significant differences in overall quality provided.
Preston (1993) analyzed data from the National Day Care Center Supply Study of 1976-7. She finds that nonprofits occupy a different market niche than for-profits. Nonprofits in the federally regulated sector provide higher quality services (measured by child-staff ratio, maximum staff salary, staff turnover, and parental participation) than do for-profits in that sector, which Preston attributed to higher taste for quality among nonprofit entrepreneurs. Nonprofits in the sector that is not federally regulated provide more social externalities (measured by percentage of black and minority children served, families who do not have to pay a full fee, the lowness of the maximum fee charged to parents) than for-profit centers in that sector.
Kagan and Newton (1989) are the first to use an explicit measure of process quality (a modified version of the Child Development Association checklist) to assess differences between nonprofit and for-profit child care, albeit with a sample restricted to centers in Connecticut. Kagan and Newton find significant differences on quality-related indicators including a number of items on the CDA checklist. However, there are no differences on other measures. Where differences do exist, they consistently favour nonprofit centers, but the authors conclude that the differences were not sufficient in magnitude to judge that for-profits provide unacceptable levels of service. Later, Kagan (1991) summarizing results from four studies of nonprofit vs. for-profit child care (including Kagan and Newton, 1989) concludes that “incentives that support expansion of the private nonprofit sector should be fostered. Private nonprofits avoid the liabilities of other sectors: their costs are lower than government centers and their average quality is higher than for-profit centers.”

27
Whitebook, Howes and Phillips (1989) collected observational data on measures of child care quality from 227 child care centers in five metropolitan areas across the U.S. in the National Child Care Staffing Study. Both church non-profits and independent non-profits had significantly better scores on “developmentally appropriate activity” than independent for-profit centers (but not necessarily better than quality in for-profit chains). Teachers in nonprofit centres were more likely to engage in “appropriate caregiving” than teachers in either type of for-profit centre. On measures of both process and structural quality (including compensation of staff ), the authors find that nonprofits rate better than for-profits, using F-tests and chi-square tests. None of these relations control for differential resources. The strongest test of differences comes on these two measures of process quality when centres are separated into those receiving government funds and those not receiving government funds. The authors find that nonprofits, whether or not they received government funds and for both infant-toddler and preschool classrooms, had scores on both measures that are significantly higher than those in for-profit centres.
Data from the Cost, Quality and Child Outcomes Study (CQO) has been analyzed in five separate studies. The CQO collected data on over 400 classrooms in 4 states, half of them being nonprofit and half for-profit. The key relevant finding in the original technical report (Helburn et al., 1995) was that the observed superiority in process quality of nonprofit centre classrooms was entirely explained by differences in North Carolina, a state with lax quality-related regulations. Otherwise, even with no controls for resource or other differences, nonprofits were not superior to for-profits. Mocan (1997), Morris and Helburn (2000) and Blau and Mocan (2002) cite this same evidence. Analyzing cost and supply behaviour of day care centers, Mocan (1997) and Blau and Mocan (2002) find that, controlling for quality, there are no significant cost differences per unit of output between centers from these different auspices, despite higher compensation to staff in nonprofit centers (i.e., there is no evidence of cost inefficiency in nonprofit centers).
Morris and Helburn (2000) seek to explain the unexpected finding of no difference in quality in the CQO data, hypothesizing that for-profits achieve equal quality by emphasizing easy-to-observe (and cheaper) rather than hard-to-observe (and more important to child development) aspects of overall quality measures. They find that this is true of some sub-types of nonprofits, but not all, except in North Carolina. Morris and Helburn hypothesize that there may be differences in management objectives or practices for different subsectors of both nonprofit and for-profit sectors, leading to provision of different levels of quality by subsector. They find that public centers, independent nonprofits and church-affiliated nonprofits provide higher quality, with church-operated and community centre nonprofits, along with all types of for-profit centers providing lower quality services.
Blau (2000) uses the CQO to estimate production functions for child care quality, broadly similar to work by Cleveland and Krashinsky (2006). Holding constant various measures of teacher education, staff-child ratio, parent and other characteristics, along with a large number of center characteristics, for-profits are found to produce signicantly worse quality than independent nonprofit centres (i.e., those nonprofits without substantial public funding or federal regulation). This result is found in models without fixed effects, and with zip code fixed effects; Blau’s preferred specification is one with center fixed effects, where the positive effect of nonprofit status on the production of quality is merged with and cannot be distinguished from other center-specific effects.

28
Researchers in Canada and other countries generally find that nonprofit centers produce higher quality services (SPR Associates, 1986; Mitchell, 2002; Mill, Bartlett and White, 1997; Lyon and Canning, 1999; Prentice, 1997; Doherty, Friendly and Forer, 2002). For example, Mitchell (2002) suggests that for-profit centers in New Zealand hire staff with lower educational levels. Mill, Bartlett and White (1997) report on a survey of centers in Montreal, Quebec that showed that for-profits had higher fees and generally lower quality. The authors argue that this is due to for-profits diverting resources to profits. Lyon and Canning (1999) report on a sampling of centers in Canada’s four Atlantic provinces in which they found consistently higher quality (measured by ECERS scores) among nonprofits. Prentice (1997) cites general findings in Canada that nonprofits supply better quality, and are more likely to meet regulatory standards. She suggests that the policy issue concerns more than just quality, since for-profit centers serve as a lobby group for lower regulatory standards.
Doherty, Friendly and Forer (2002) explore the differences between nonprofit and commercial child care centers using the same data set we use in this paper. They identify two broad explanations of observed quality differences: that nonprofit centers have greater access to government funding and donated resources, and that there are differences in goals, structures and characteristics between nonprofit and commercial centers. They only look at data from provinces and centers without differential government funding or differences in donated resources and still find important quality differences by nonprofit status. However, in a province with low average incomes and therefore uniformly low prices of child care (New Brunswick), quality rankings by nonprofit and commercial centers are very similar.

29
4. EVIDENCE ON NONPROFITS IN CANADA: THE “YOU BET I CARE!” SURVEY
“You Bet I Care!” (YBIC) is the collective name for a group of linked data sets investigating earnings, working conditions and observed quality in day care centers and licensed family homes in Canada in 1998. Data from staff, center and director questionnaires was collected in the larger Phase I sample; similar data plus on-site observations of child care quality were collected in the smaller Phase II sample. Phase II of YBIC includes data from 234 child care centers in 6 provinces and 1 territory (British Columbia, Alberta, Saskatchewan, Ontario, Quebec, New Brunswick, and the Yukon). 122 of these centers had an infant-toddler room (less than 30 months of age) and 227 had preschool rooms. A total of 325 classrooms had usable data on the dependent variable and key explanatory variables. Data on the quality in all these classrooms plus information on the “observed” staff member for each classroom, other staff members in the center, the director and center characteristics is available in the data set.
The two main measures of classroom quality in this data set are the ITERS (Infant-Toddler Environment Rating Scale) and ECERS-R (Early Childhood Environment Rating Scale – Revised) scores, which are global measures of the developmental potential in the classroom (the environment fostering quality interactions) There are seven subscales of the ITERS and ECERS scores, covering different aspects of classroom and center quality. To simplify the analysis, we treat the 7-point ITERS and ECERS scales as equivalent measures of quality, so that we can pool together both infant/toddler and preschool classrooms. We treat the ITERS/ECERS score as one measure (and for convenience we express this score on a scale from 0 to 100, rather than from 1 to 7)3.
ECERS-R consists of ratings of 43 aspects of the preschool classroom that are combined into 7 categories (space and furnishings, personal care routines, language-reasoning, activities, interaction, program structure, parents and staff ) which are then combined into one overall measure. Each separate category is rated on a 7-point scale (1 to 7 not including zero) where 1 is considered “inadequate quality”, 3 is “minimal quality”, 5 is “good quality”, and 7 is “excellent quality”. The overall ECERS-R rating is on the same 7-point scale; because it averages scores on 43 subscales, it is a continuous variable in this range..
ITERS is a very similar rating system designed for infant-toddler classrooms (most or all children less than 30 months of age). ITERS, like ECERS, assesses the structure, resources, classroom organization and teacher-child interactions of a classroom. ITERS evaluates 35 aspects of the program which are combined into 7 categories (furnishings and display for children, personal care routines, listening and talking, learning activities, interaction, program structure, adult needs) which are then combined into one overall measure. ITERS uses the same 7-point scale as ECERS-R to tabulate its results, with scores varying continuously in this range. Scorings are based primarily on on-site observations (2-3 hours) plus answers to some questions for items not observed.
For the YBIC studies, researchers drew a stratified random sample of all child care centers in several urban and suburban areas in six selected provinces and one territory in Canada providing care for preschool children for at least 6 hours per day, as long as those centers had been in operation for at least 12 months, were not operated by a municipality (municipal centers are excluded), and those centers were not located on a native reserve. First, the Phase II centers were drawn from this pool and then the Phase I centers.
3 On a scale of 0 to 100, 33 is minimal quality, 67 is good, and 100 is excellent quality, corresponding to scores of 3, 5 and 7 on the original ITERS or ECERS scales. The ITERS and ECERS (and the subscales that compose them) are, by construction, treated as cardinal scales. The distance between inadequate and minimal, between minimal and good, and between good and excellent are considered equivalent distances.

30
TABLE 4-1 AVERAGE VALUES OF KEY VARIABLES BY NONPROFIT STATUS VARIABLES FOR-PROFIT
(means)NONPROFIT (means)
DIFFERENCE (non-profit – for-profit)
SAMPLE MEANS
ITERS/ECERS score 55.4 62.0 6.6** 60.1Classroom VariablesChild-staff ratio (0-2 years) 3.4 3.07 -0.33 3.15Child-staff ratio (3-5 years) 5.9 5.76 -0.14 5.79
Group size (0-2 years) 6.1 7.02 0.92 6.82Group size (3-5 years) 11.0 11.1 0.1 11.0Square of Group Size 114.5 113.5 -1.0 113.8Teacher VariablesTraining of main classroom teacher: ECE - none or less than one year (proportion)
0.19 0.15 -0.04 0.16
ECE – college certificate (1 year) 0.31 0.20 -0.11** 0.ECE – college diploma (2 or 3 years) 0.43 0.51 0.08ECE – post-college cert. 0.05 0.07 0.02 0.07
ECE – university 0.01 0.07 0.06** 0.05Professional Development Training in last year 0.60 0.83 0.23** 0.76Center Variables Director - high school graduation or less (proportion)
0.09 0.08 -0.01 0.08
Director - one, two or three years college 0.69 0.55 -0.14** 0.59Director - post-college certificate 0.02 0.08 0.06** 0.06Director - B.A. or more 0.20 0.28 0.08 0.26Financial Resource Variables Estimated monthly revenue per full-time-equivalent child
$445.05 $579.67 $134.62** $537.72
Child VariablesNumber of full-time-equivalent children in center 39.9 43.1 3.2 42.1Percent of infants and toddlers 26.9 38.8 11.9** 35.4Percent of children in center receiving income-related subsidy
36.1 44.6 8.5** 42.1
Percent of special needs children 5.6 6.1 0.5 6.0Other VariablesGross wage per hour – lead teacher $9.14 $11.92 $2.78** $11.13Percent of revenue supplied by government grants 5.24 18.19 12.95** 14.47Rent and/or utilities subsidized (proportion) 0.01 0.44 0.43** 0.32Monthly fee for child aged 3-5a $435.36 $418.53 -$16.83 $423.39Monthly fee for child aged 3-5, outside of Quebec $445.80 $469.62 $23.82** $462.18
Sample size 93 232 - - 325 Notes: The Quebec child care reforms, initiated a year before these data were collected, lowered parent fees in nonprofit centers to $5 per day for children in nonprofit centers in this age range. As a result, the differences outside of Quebec are more representative of the fee levels of nonprofit vs. for-profit centers.

31
The Phase II data that we use in this paper is not therefore based on a purely random sample. First of all, the provinces/territory are not chosen randomly. As the study says “[i]n addition to providing geographic representation, these jurisdictions represent points along the continuum of government regulatory standards, government funding other than fee subsidization, and the relative proportion of non-profit and commercial centers within a jurisdiction.” (Goelman et al., 2000, p. 20). Further, a group of cities and medium sized towns and surrounding areas were selected in the six provinces and one territory as being conveniently accessible to researchers for this intensive form of data collection (see next section for list). From the population of all eligible child care centers and before choosing the Phase I sample, 50 centers in the target cities and towns and surrounding areas of each jurisdiction were chosen to be approached for Phase II. Twenty-five non-profits and twenty-five commercial centers were chosen on an arbitrary basis from the eligible centers in each province. In the Yukon Territory,all 14 centers were invited to participate in Phase II. These centers were reserved for Phase II and work proceeded on Phase I on the other randomly selected centers. In virtually all jurisdictions, some additional centers had to be added to the list of 50 centers in order to get the desired number of centers (the target was 40 centers in each province with half non-profit and half commercial in each province except Saskatchewan (where commercial centers are virtually nonexistent).
In centers in which there were a number of preschool and infant-toddler classrooms with different teachers working in each, the center director chose which classrooms and associated teachers would be observed by trained observers.
Table 4-1 shows the differences and similarities in the average values of key variables by for-profit or nonprofit status.These are variables likely to affect quality provided in the center. Centers have chosen many of these variables deliberately; significant differences shown in this table therefore reflect the different objectives of commercial and nonprofit directors and owners, as well as reflecting resource differences by auspice.
4.1 Modelling the Production of Quality in Child Care Centres
A full model of the child care sector would be relatively complex. In this section, we will sketch out a simplified model, and derive a set of hypotheses that we can test using relevant data. As usual in these cases for economists, the model will involve some discussion of the supply and demand sides, as well as the working out of an equilibrium.
The Supply Side
Child care is produced by both for-profit and nonprofit child care centers (as well as other providers that we ignore in this simplified model). Both have access to roughly the same technology and each center must choose a level of quality. Quality is determined by a variety of inputs, including the child-staff ratio, education of staff, group sizes, combinations of staff, characteristics of the director and management, toys, learning materials and physical capital. Quality also depends upon less tangible factors such as leadership, motivation, enthusiasm, energy and personal staff characteristics. The production function is affected by the characteristics and age of children served. None of the resources used to produce child care, with the possible exception of leadership, is particularly scarce or non-replicable. All of this means that entry into the industry is relatively easy, and competition (or the prospect of competition) puts strong downward pressure on price. A center must choose a level of quality, and this decision will drive cost and hence price. It might seem that for-profit and nonprofit centers could produce any level of quality at equivalent cost, but this need not be the case, largely because of systematic differences between the two types of centers.

32
Commercial child care centers are established to provide child care services that are sold to parents in order to earn profits for the owners of the business4. In contrast, nonprofit child care centers provide child care services on a cost-recovery basis, but with a social objective. Typically, this social objective is to provide a developmental experience for children at a price that families earning moderate incomes can afford.
The profit motive tends to make for-profit centers more aggressive in driving down costs and, other things equal, would give them a cost advantage. This advantage might be eroded if for-profit centers diverted revenues away from quality and towards profits. In that case, consumers would naturally consider nonprofit firms more trustworthy, and would abandon for-profit providers. The existence of for-profit centers in the market suggests that this simple explanation is not enough.
Nonprofit centers however do have another advantage. Private donors or governments interested in subsidizing care would prefer to direct their donation through nonprofit organizations that will focus on higher quality and will not divert those donations towards profits. Furthermore, staff members in centers may have substantial variation in normally unmeasured characteristics (motivation, enthusiasm, dedication to children) that will affect their ability to produce quality services. Staff dedicated to higher quality will seek to work for nonprofit centers where their dedication will be used to improve quality rather than profits. These staff are also “donors” in the sense that they work harder than is absolutely necessary to keep their jobs, so as to improve the quality of care received by children. Donors of all types are naturally drawn to centers that reliably produce higher levels of quality. This suggests that while for-profit centers might have a competitive advantage at lower levels of quality, nonprofit centers will be more effective at the higher end of the quality range.
The Demand Side
We can assume a simple structure for parental demand for child care services. Parents derive utility from the quality of child care. Even base-level quality child care is valuable to parents because custodial care for children permits parents to work. Quality, which provides developmentally-stimulating experiences for the child, requires extra resources. Without subsidies or donations, higher quality implies higher parent fees.
Different families will place different values on higher quality, and in any case will differ in their ability to pay for that quality. The implication is that the market demand for child care quality will be negatively sloped, with families, each of whom can be assumed to purchase one center-based space (or none), being arrayed along the demand curve in descending order of willingness-to-pay based on tastes and income. On the demand curve, inframarginal consumers will receive considerable surplus, while the marginal consumer will be just willing to purchase the last space at the market price.
Market Equilibrium
There are many types of goods and services where different consumers demand different levels of quality. The normal market equilibrium involves different commercial entrepreneurs competing by offering a variety of qualities at different prices. But this may not be the case in the child care market. For one thing, parents may not be able to judge quality differences well, and this may be problematic.
4 Actually, commercial child care centers are somewhat heterogeneous in origin. A minority of the single proprietorships operate more like nonprofits; they make little effort to earn profits and reflect the personal dedication of the owners to improve the welfare of children and families.

33
Even leaving that aside, the cost in time of delivering the child to child care is significant, so that most parents prefer to use providers who are close to either home or work (or right along the way in between). In practice, this means that the effective market for any individual child care provider is geographically small. Even among the population living in geographic proximity to any center, there are only a small proportion of potential demanders who have children of the right age, and are willing and able to afford the relatively high annual cost. Experience suggests that child care centers only operate efficiently when they achieve some minimum size (30 to 50 children, depending on the age ranges served). Thus, unless the population of potential users is fairly large, there will be little room for more than one center in any single geographic “market”.
In small towns and cities, there will often be relatively few potential consumers. The impact of this can be captured by differentiating between “thin” markets (where only a small handful of centers can be sustained spread across a geographic market) and “thick” markets (where a larger number of centers compete to attract business from a more concentrated group of customers).
In thin markets, the marginal consumer will have a relatively low willingness to pay for quality, making it difficult for any center to sell high quality care. Given our earlier discussion, this would suggest that for-profit firms will predominate in thin markets. Nonprofit firms will be free to open up in these markets (and some will do so), but they will have relatively little ability to attract donations because the quality of care will not be high. Nonprofit entrepreneurs who are attracted by the opportunity to produce high quality will not favour such markets, unless for idiosyncratic reasons.In thick markets, where there are a considerable number of potential users in a local child care market, we would expect to observe quality differentiation amongst firms (i.e., some centers will offer higher quality care at a higher price and some will offer lower quality care at a lower price). If the hypothesis about nonprofit advantage is correct, we expect that nonprofit firms will have an edge in being able to credibly signal and produce high quality, and to attract the donations that provide a cost edge in producing that kind of care. For-profit centers would tend to occupy the lower-quality end of the market, exploiting their cost-cutting skills to push prices (and quality) down.
This discussion suggests a series of specific hypotheses that we can test using our data:
Hypothesis 1: Pooling thin and thick markets together, and controlling for resource differences and differences in clientele, there will not necessarily be a significant difference in the production of quality by nonprofits and for-profits, and whatever difference is found will be considerably smaller than the difference without these controls;
Hypothesis 2: the overall quality of child care provided in thin markets will be lower than in thick markets; there will be no significant difference in quality by auspice in thin markets, particularly with resource and clientele differences controlled;
Hypothesis 3: in thick markets, centers will product differentiate, with nonprofits choosing the high quality end of the market (at higher prices); nonprofit centers will hire more and better inputs to produce this quality; nonprofit centers will also benefit from a “pure” nonprofit advantage in producing quality child care services; this nonprofit advantage will be related to unobserved staff characteristics; to attract better staff, nonprofit centers will pay higher wages.

34
4.2. Empirical Strategy
Nonprofit status is, as Table 4-1 suggests, correlated with a host of observable variables that determine quality, and there are no doubt a series of unobserved determinants of quality with which nonprofit status is also correlated. This creates a problem in the interpretation of empirical regression results of the determinants of child care quality. Even if auspice is significant in a regression of measured quality on a set of presumed determinants of quality, this may reflect the correlation between auspice and these unobservable determinants of quality. So, for instance, it could be that it is not auspice itself that affects quality, but the differential access to resources that auspice bestows (through government grants, or donated resources). Or, a negative effect of auspice on quality produced could actually be due to the difference in clientele served by nonprofit vs. commercial centers (nonprofits tend to be located in downtown locations and serve more low-income families). Or, it could be that the organizations with which nonprofits are often affiliated (the sponsoring organization) provides leadership or monitoring which is an important input to quality child care. Or, it could be that nonprofits attract, hire and retain workers with unobservable (to the researcher) quality-producing characteristics, and that a significant coefficient on nonprofit status is due to these unobserved worker characteristics.
To test the three hypotheses described above, we estimate what might be called the production function for child care quality, controlling for a wide range of potentially confounding factors, in an attempt to isolate a pure nonprofit productivity advantage. The dependent variable is a continuous measure of classroom-level quality transformed into a percentage; explanatory variables are measures of quality-generating inputs, financial resources and clientele served. Our strategy is to include successively, in a series of OLS regressions, the different categories of potential determinants of quality and to interpret the effects on the coefficient on nonprofit status. Our objective is both to test and to decompose the gross nonprofit advantage in producing quality.
We perform this analysis first on the entire data set of child care center classrooms across Canada. Then, we separate the sampled child care markets into those in which child care demand is thick and those in which it is thin. Our underlying hypothesis is that the nonprofit advantage should be strong in thick markets and weak in thin markets. We would expect there to be some markets in which nearly all centers (both nonprofit and commercial) are low quality (thin markets) and other markets in which there is considerable quality differentiation, with nonprofits dominating at higher levels of quality. Therefore, in pooled Canada-wide data, we expect to observe average quality to be higher in nonprofit centers than in for-profit centers.
4.3. Thick And Thin Markets
Because of high transportation costs, demand for child care is very localized. Focusing on preschool child care, potential demanders must have a child 0-5 years of age. Since even base quality center-based child care costs at least several thousand dollars per year, local markets with fewer middle and upper income families will have lower demand for center care, especially care of higher developmental quality. Thick child care markets are ones in which the number of potential demanders of high-priced center care for preschool children is relatively large; in thin markets, this potential demand is relatively small.

35
If we rank the markets from which data was collected in the YBIC survey according to the number of children 0-4 years of age in 2001, the larger cities and towns generally have 25,000 children or more. The smaller cities and towns have 15,000 children or fewer (in fact, all but two have fewer than 8,000 children). Since, typically about 10% - 20% of preschool children in any market use center-based child care, the potential market in these smaller cities and towns is likely to be no larger than 3,000 children and usually closer to 800 children in the entire market area. We label those markets with at least 25,000 children in this age range as “thick” markets and those with fewer than 15,000 children as “thin” markets. By this criterion, Montreal, Vancouver, Calgary, Edmonton, Ottawa, Quebec City, and Brampton-Milton-Oakville (considered as one market) are all areas of thick child care demand. Saskatoon, Regina, Abbotsford, St. John, Thunder Bay, Kelowna, Red Deer, Medicine Hat, Moncton, Prince Albert, Fredericton, Moose Jaw and Whitehorse are all areas of thin child care demand.
An alternative indicator of market thickness could be the number of high income families with preschool children in the market. We do not have this data, but average earnings of employed persons in the market will be correlated with it. If we rank the markets in our survey by annual average earnings of employed persons in 2001, they range from about $40,000 down to about $26,000. Drawing a dividing line between thick markets at $31,500 and above and thin markets below gives nearly the same list of thick and thin markets. The only two differences would be that Whitehorse (in the Yukon Territory) would be considered a thick market because of its high average incomes (actually due to its isolation and high costs), while Quebec City would be considered thin.
4.4. The Distribution Of Quality Scores
Measuring the classroom quality score on a scale from 0 to 100, the combined ITERS/ECERS score across all 325 classrooms observed in YBIC is 60.1. Commercial classrooms scored an average of 55.4 and nonprofits an average of 62.0 (i.e., the difference in quality is 6.6 points; average quality is over 10% higher in the nonprofit classrooms). The difference is statistically significant (t = 2.92). The differences taking infants and toddlers separately were somewhat larger, and quality was lower; commercial centers scored 50.2 and nonprofits 59.0 (t = 2.02). Taking preschoolers separately, commercial centers rated at 57.2 and nonprofits at 63.8 (t = 2.51).
In other words, on average there appears to be a substantial difference in quality between commercial and nonprofit centers. This is not to say that every nonprofit has higher quality than every for-profit center; what we have is two overlapping distributions of quality in these two types of centers. There are some poor quality nonprofits; there are some good quality commercial centers. However, commercial centers are disproportionately represented among the lower-quality classrooms and non-profits are disproportionately represented among the better-quality classrooms.

36
Table 4-2 gives a good sense of the comparison between the entire distributions of quality scores, rather than just the average value of those scores. This table is based on the ITERS/ECERS scores, and, in this case, we show the raw score rather than expressing it on a scale of 0 to 100. The ITERS or ECERS score ranges from 1 to 7, with 1 being regarded as inadequate, 3 being minimal, 5 being good and 7 being excellent. Since 1 is the lowest possible score on any subscale, we show any classroom that scored from 1 to 1.99 as having a score of 1. Any classroom that scored from 2.0 to 2.99 is shown as having a score of 2. And so on. In the bottom row Table 4-2 shows that 28.6% of all classrooms observed in this study are in commercial centers, while 71.4% of classrooms are in nonprofits. If quality were randomly distributed across classrooms, we would anticipate about 29% of classrooms at each quality level (1 to 7) would be commercial and about 71% would be nonprofit. However, even though commercial centers span the range of quality levels from 1 to 6, and there are few in the two lowest categories, they are overrepresented in quality levels 1 through 4. Nonprofits span the range of quality levels too, from level 1 through to 6. However, the bulk of nonprofits are in the higher ranges (73% from 4-6 compared to 61% of for-profits), being overrepresented at quality levels 5 and 6.
TABLE 4-2 NUMBER AND PERCENT OF CLASSROOMS BY AUSPICE AT EACH QUALITY LEVELQuality Value of Classroom Commercial Nonprofit Total
1 (Inadequate) 2 (40%) 3 (60%) 5 (100%)
2 9 (47.4%) 10 (52.6%) 19 (100%)
3 (Minimal 25 (33.3%) 50 (66.6%) 75 (100%)
4 33 (32%) 70 (68%) 103 (100%)
5 20 (21.5%) 73 (78.5%) 93 (100%)6 4 (13.3%) 26 (86.7%) 30 (100%)Total 93 (28.6%) 232 (71.4%) 325 (100%)
TABLE 4-3 DISTRIBUTION OF HIGH AND LOW QUALITY, BY AUSPICE, IN THIN AND THICK MARKETS, YBIC 1998Quality Value of Classroom
Thin Markets Thick Markets
Nonprofit For-profit Total Nonprofit For-profit TotalLOW QUALITY 79 (71%) 32 (80%) 111 (73%) 52 (43%) 36 (68%) 88 (51%)HIGH QUALITY 33 (29%) 8 (20%) 41 (27%) 68 (57%) 17 (32%) 85 (49%)
Total 11 (100%) 40 (100%) 152 (100%) 120 (100%) 53 (100%) 173 (100%)Notes:
• Pooling thin and thick markets together, the proportion of high quality classrooms is significantly higher in nonprofits than in for-profits (P > |z| = .0054).
• In thin markets, there is no significant difference in the proportion of high quality classrooms across auspices (P > |z| = .2470)
• In thick markets, the proportion of high quality classrooms is significantly higher in nonprofits than in for-profits (P > |z| = .0029)
• Pooling nonprofits and for-profits together, the proportion of high quality classrooms is significantly higher in thick than in thin markets (P > |z| = 0.0000)
37
Three statements are simultaneously true. First, the distribution of nonprofits shows a mean shift towards higher quality. Second, there is a considerable percentage of both commercial and nonprofit centers offering good quality care (5 or better) – about 26% of commercial centers offer care at this level compared to about 43% of nonprofit classrooms. Third, there is a considerable percentage of both commercial and nonprofit centers offering relatively low quality care (3 or less) – about 39% of commercial classrooms and 27% of nonprofit classrooms.
The distribution of quality scores by auspice in thin and thick markets (shown in Table 4-3) anticipates the overall empirical results. Considering only quality scores that are good (5 or above) and those that are less than good (below 5), the table shows that, in thin markets, there is not much difference (no significant difference) in the proportions of high and lower quality care in nonprofit vs for-profit centers (70-80% lower quality and 20-30% high quality – supporting Hypothesis 2). However, in thick markets there is a significant difference in the proportions of low and high quality care (57% high quality in nonprofits vs. 32% in for-profits – supporting Hypothesis 3).
4.5. Empirical Results And Interpretation
Table 4-4 (following page) analyzes the production of quality in child care classrooms on pooled data, making no distinction between thin and thick markets, and therefore provides information about Hypothesis 1. The first regression (first column of results) estimates the gross value of the nonprofit advantage with dummy variable controls for each market location. Nonprofit status is associated with an increase of 7.79 points in quality (about 13% of the average quality score, or about half of a unit increase in quality on the original seven-point scale).
The second column of results in Table 4-4 controls for differences amongst centers in the revenue available per full-time-equivalent child served and for differences in the child clientele served by the center. Revenue per child is calculated as the sum of fee revenues charged (to either the parents or to the government for subsidized children) for all infants, toddlers, preschoolers and schoolaged children in each center, adjusted for the percent of revenues provided by government operating and wage grants, and adjusted for the deemed subsidy for those centers that have rent and/or utilities assistance from a sponsoring organization.
The composition of children served may reflect the social mission of the nonprofit sector, and may make it more difficult to produce a high level of child care quality. We control for the number of full-time-equivalent children in the center, the percent of children who are infants or toddlers, the percent of children receiving subsidy from government, and the percent of special needs children.
There are clear differences in resources and clientele across child care centers by auspice. Descriptive statistics provided in Table 4-1 show that there are significant differences by auspice in monthly revenue per full-time-equivalent child (made up of significant differences in monthly fee charged for preschool-aged children, percent of revenue coming from government grants [see Appendix B], and probability of receiving donated rent or utilities). The same table shows there are also significant differences in the percent of infants and toddlers served and in the number of subsidized children (both are higher in nonprofits).
The amount of revenues per FTE child has a substantial positive effect on quality (0.02 or about 10 percentage points at the mean value of revenues). The number of full-time-equivalent children in the center has a positive effect on quality, suggesting quality efficiencies with increased center size. More

38
TABLE 4-4 THE EFFECT OF NONPROFIT STATUS ON CHILD CARE QUALITY WITH DATA POOLED ACROSS THIN AND THICK MARKETSEXPLANATORY VARIABLES NONPROFIT STATUS
AND LOCATION VARIABLESCoefficients (t-stats)
ADD FINANCIAL RESOURCES AND CHILD VARIABLES Coefficients (t-stats)
ADD TEACHER AND CENTER INPUTSCoefficients (t-stats)
Non-profit status of center 7.79** (3.78) 5.42** (2.36) 4.20* (1.90)Teacher and Center CharacteristicsChild-staff ratio (0-2 years) -3.04** (2.83)Child-staff ratio (3-5 years) 0.04 (0.01)
Group size (0-2 years) 1.83** (2.48)Group size (3-5 years) 1.14 (1.39)Square of group size -0.06* (1.86)Lead teacher’s training (No ECE is omitted category)ECE – college certificate (1 year) 9.22** (3.47)ECE – college diploma (2 or 3 years)
10.32** (4.05)
ECE – post-college cert. 5.34 (1.40)ECE – university degree 12.35** (2.97)Professional Development Training in last 12 months
3.92* (1.93)
Director’s Education (high school or less omitted)College diploma or certificate 5.77* (1.77)Post-college certificate 1.26 (0.28)University degree 6.82* (1.91)Financial ResourcesRevenue per FTE child 0.02** (2.85) 0.018** (2.37)Child VariablesNumber of FTE children in center 0.10** (2.29) 0.09** (1.97)Percent of infants/toddlers -0.09** (2.06) -0.05 (1.07)Percent of children with special needs
0.05 (0.40) 0.13 (1.04)
Percent of children subsidized 0.02 (0.58) 0.03 (1.08)Constant 63.14** (23.07) 45.94** (7.76) 26.96** (3.36)Number of observations 325 325 325
Explanatory variables 22 27 40Adjusted R-squared .364 .381 .463
Note: Each regression also includes dummy variables controlling for market location but these estimates are not shown. Full regressions available from the authors.** significant at 5% level * significant at 10% level

39
infants and toddlers makes it difficult to improve quality, presumably because they require a large amount of human resources. Other child variables are not statistically significant. The coefficient on nonprofit status is statistically significant even with financial resources and child clientele held constant; nonprofit status counts for between 5 and 6 percentage points of quality. It may be true that the controls for financial resources in column 2 are imperfect. A supplementary way of standardizing resources is to control for differences in teacher and center characteristics that may differ in nonprofit and for-profit classrooms. The third regression (third column) adds controls for teacher, center and director inputs and finds a reduced nonprofit advantage (just over 4 percentage points), implying that a partial explanation of higher quality in nonprofit classrooms is their greater use of quality-enhancing teacher and director inputs.
The regression results in the third column of Table 4-4 show that the ratio of children to staff in the classroom has a negative and statistically significant effect on quality for infants and toddlers but not for preschool-age children (3-5 years) within the range of child-staff variation in the data set. The number of children in the classroom (group size), has a decreasing positive effect (within the range of group sizes observed in the data set) for infant-toddler, but not preschool, classrooms. Education inputs have strong positive effects on quality (a college certificate or diploma or a university degree for the lead teacher in the classroom will increase quality by about 9 to 12 percentage points). Recent professional development training is likewise strongly positive (about 4 percentage points). The director’s educational level also matters. College or university education adds between 5 and 7 percentage points to observed classroom quality. Overall the addition of classroom, teacher, and director inputs adds considerably to the explanatory power of the regression, while reducing the estimated “pure” nonprofit effect (and reducing its statistical significance).
We could simply conclude on the basis of Table 4-4 that nonprofit child care classrooms show a quality advantage over for-profit classrooms. First, nonprofits attract more financial resources, from donors, governments and parent fees, since they appear to be trustworthy and to be providing socially-needed services. This makes it easier for nonprofit centers to produce quality care than for commercial centers. Second, nonprofit centers serve a somewhat different population of children. Third, nonprofits use the resources to make different input choices than commercial centers, with an apparent orientation to the production of higher quality services. Finally, controlling for all these differences, nonprofit status on its own influences quality in ways not fully captured by these explicit variables.
However, we take Table 4-4 simply as a confirmation of Hypothesis 1 – in other words, this evidence shows a modest independent effect of nonprofit status on quality and does not provide unequivocal support for the superiority of nonprofit centers.
4.6. The Nonprofit Advantage in Thin and Thick Markets
Tables 4-5 and 4-6 (following pages) show the same three regressions for classrooms located in thin markets (40 for-profit and 112 nonprofit) and thick markets (53 for-profit and 120 nonprofit). The estimated results are notably different across these two groups of markets. The most striking and important result in Table 4-5 (thin markets), providing confirmation for Hypothesis 2, is that the effect on quality of nonprofit status is neither large nor statistically significant, even in the initial regression before substantial controls are included. In the full regression in the third column of results, early childhood education and training of staff and highest education level of the director are significant and quantitatively substantial determinants of quality. In particular, revenue per full-time-equivalent child

40
TABLE 4-5 THE EFFECT OF NONPROFIT STATUS ON CHILD CARE QUALITY IN MARKETS WHERE DEMAND IS THIN EXPLANATORY VARIABLES NONPROFIT STATUS
AND LOCATION VARIABLESCoefficients (t-stats)
ADD FINANCIAL RESOURCES AND CHILD VARIABLESCoefficients (t-stats)
ADD TEACHER AND CENTER INPUTSCoefficients (t-stats)
Non-profit status of center 1.53 (0.48) -0.52 (0.15) -0.96 (0.28))Teacher and Center CharacteristicsChild-staff ratio (0-2 years) -1.69 (0.89)Child-staff ratio (3-5 years) -0.16 (0.19)
Group size (0-2 years) 0.73 (0.66)Group size (3-5 years) 0.42 (0.33)Square of group size -0.03 (0.50)Lead teacher’s training (No ECE is omitted category)ECE – college certificate (1 year) 12.78** (3.25)ECE – college diploma (2 or 3 years)
14.15** (3.33)
ECE – post-college cert. 10.20* (1.73)ECE – university degree 15.32** (2.28)Professional Development Training in last 12 months
-0.08 (0.02)
Director’s Education (high school or less omitted)College diploma or certificate 9.59** (2.08)Post-college certificate 1.71 (0.25)University degree 11.16** (2.32)Financial ResourcesRevenue per FTE child 0.03** (1.99) 0.03* (1.87)Child VariablesNumber of FTE children in center 0.09 (1.28) 0.10 (1.30)Percent of infants/toddlers -0.08 (1.22) -0.05 (0.68)Percent of children with special needs
0.15 (0.87) 0.29 (1.64)
Percent of children subsidized 0.01 (0.20) 0.01 (0.24)Constant 39.67** (4.88) 48.99** (4.44) 25.76** (2.08)Number of observations 152 152 152
Explanatory variables 14 19 40Adjusted R-squared .412 .420 .472
Note: Each regression also includes dummy variables controlling for market location but these estimates are not shown. Full regressions available from the authors.** significant at 5% level * significant at 10% level

41
TABLE 4-6 THE EFFECT OF NONPROFIT STATUS ON CHILD CARE QUALITY IN MARKETS WHERE DEMAND IS THICKEXPLANATORY VARIABLES NONPROFIT STATUS AND
LOCATION VARIABLESCoefficients (t-stats)
ADD FINANCIAL RESOURCES AND CHILD VARIABLESCoefficients (t-stats)
ADD TEACHER AND CENTER INPUTSCoefficients (t-stats)
Non-profit status of center 12.26** (4.63) 10.76** (3.43) 9.10** (2.94)Teacher and Center CharacteristicsChild-staff ratio (0-2 years) -3.67** (2.67)Child-staff ratio (3-5 years) 0.11 (0.16)Group size (0-2 years) 2.82** (2.64)Group size (3-5 years) 1.94* (1.65)Square of group size -0.09** (2.02)Lead teacher’s training (No ECE is omitted category)ECE – college certificate (1 year) 6.90* (1.71)ECE – college diploma (2 or 3 years)
8.28** (2.40)
ECE – post-college cert. 4.26 (0.78)ECE – university degree 11.48** (2.08)Professional Development Training in last 12 months
6.14** (2.32)
Director’s Education (high school or less omitted)College diploma or certificate 1.52 (0.31)Post-college certificate -4.96 (0.73)University degree 2.81 (0.50)Financial ResourcesRevenue per FTE child 0.02* (1.73) 0.01 (1.01)Child VariablesNumber of FTE children in center 0.12** (2.05) 0.10* (1.76)Percent of infants/toddlers -0.14* (1.83) -0.08 (1.02)Percent of children with special needs
-0.07 (0.34) -0.12 (0.06)
Percent of children subsidized 0.04 (0.91) 0.07 (1.51)Constant 61.24** (22.04) 46.52** (6.20) 28.77** (2.53)Number of observations 173 173 173
Explanatory variables 9 14 27Adjusted R-squared .228 .238 .354
Note: Each regression also includes dummy variables controlling for market location but these estimates are not shown. Full regressions available from the authors.** significant at 5% level * significant at 10% level
42
matters a lot – 3 percentage points of quality for every $100 per month of center revenue per child. Table 4-6 provides the same regression for thick markets and shows important differences in the pattern of the determinants of child care quality. Most noticeable and important from our point of view is the very substantial positive coefficient on nonprofit status – important confirmation for Hypothesis 3. The gross nonprofit advantage is estimated at 12.26 percentage points (an increase of 19 percent relative to the average quality in thick markets, or about a full unit increase in quality on the original seven-point ITERS/ECERS scales). A substantial component of this nonprofit advantage is made up of differences in resource availability and characteristics of children served, reducing the estimated pure nonprofit advantage to about 10.76 percentage points. Controlling for differences in teacher, center and director characteristics (a supplementary control for resource differences) provides an estimate of the pure nonprofit advantage in thick markets of a substantial and statistically significant 9.1 percentage points.
4.7. Analysis And Conclusions
Hansmann and Ben-Ner suggest that nonprofit organizations will have an advantage producing services where quality is particularly difficult for consumers to judge. This would seem to apply well to child care services, where effects on children are intangible and the purchaser does not experience the service directly.
In child care centers in Canada, commercial centers are disproportionately represented amongst the lower quality classrooms and nonprofits are disproportionately represented amongst the good quality classrooms. On average, the overall quality in nonprofit centers is about 13 percent higher (7.78 points higher), controlling for geographical market location. However, there is both poor quality and good quality care in nonprofit centers and in for-profit centers. The key to analyzing the effects of nonprofit status on child care in this data set is to distinguish between thick and thin markets. Child care markets are geographically localized and quality is desired by consumers, but expensive. Therefore, child care quality is produced and sold in monopolistically competitive conditions; quality is not equalized across producers by the force of competition.
When markets are thick enough to support quality differentiation across producers, nonprofits are able and willing to produce higher quality services. They hire staff with more ECE-specific training, encourage additional professional development, and hire directors with more education. They also pay significantly higher wages to equivalently trained staff, which apparently plays an important role in motivating staff and supporting a culture of quality production, generating a substantial pure nonprofit advantage in producing quality services.
However, when markets are thin, demand for high quality child care is insufficient to support quality differentiation across producers, and nonprofits may be willing but are generally not able to produce child care services which are of significantly higher quality than in for-profits. In thin markets, there will be no nonprofit advantage, except to the extent that nonprofit centers may receive extra financial resources through government grants and private donations. The results in Tables 4-5 and 4-6 confirm this analysis.

43
Our results are important for several reasons. They focus on a market-based explanation of nonprofit behavior; market conditions determine whether nonprofit organizations can play the role that Hansmann, Ben-Ner and others have hypothesized. This contrasts with the approach of other authors who have focused attention on the different objectives pursued by different sub-types of nonprofit organization to explain why some nonprofits do not play the Hansmann/Ben-Ner role.
Accordingly, our work suggests an explanation for divergent empirical results when judging the role of nonprofit organizations in child care and perhaps some other markets. Failure to account for heterogeneity in the market conditions faced by different nonprofit organizations is likely to deliver a verdict that nonprofit organizations have no advantage in producing quality.
Our results suggest that nonprofit organizations in thick markets are more readily able to develop a “corporate culture of quality” motivating staff and directors to produce quality beyond the normal contribution of observable inputs. Nonprofit organizations in thin markets face greater challenges; if governments are using nonprofit agencies to deliver service quality, special programs or subsidies directed at quality improvement may be required for agencies in thin markets.


45
5. EVIDENCE ON NONPROFITS IN QUEBEC: THE “GRANDIR EN QUALITÉ” STUDY
The Grandir en Qualité data was collected in Quebec in 2003 to provide a snapshot of the quality of child care provided in CPEs (Centre de Petites Enfances - non-profit child care agencies responsible for providing centre care at reduced fees and also for co-ordinating family child care services), in garderies (generally, for-profit child care centres who also offer reduced-fee child care), and in regulated family child care (co-ordinated by CPEs ). This study, published in 2004, collected data from a large number of CPEs (N=228) providing centre care for preschool children (aged 18 months – 59 months), garderies (N=225) providing centre care for preschool children, CPEs (N=128) and garderies (N=124) providing care for infants, and family child care providers (N=200) affiliated with CPEs and providing care for all ages.
Groups of children from some 650 establishments were chosen at random from a list of child care service providers. At the heart of the study were day-long on-site inspections of the quality of care in these facilities, using an instrument specifically designed to collect data on quality as defined by the new Quebec child care reforms. Quality observers were chosen by the ISQ and underwent intensive 10-day training, with appropriate tests of internal consistency and inter-rater reliability. In addition, data was collected about the characteristics of the main teacher in the classroom, the supervisor of child care services in the centre, and about the centre (including its finances) and the characteristics of the local population. Broadly speaking, the study was similar in design to the You Bet I Care! study of 1998.
5.1. Our Objectives and Methods
Our objective with this data is similar in spirit to what we have done with You Bet I Care! – to determine the effect of nonprofit status on the provision of quality child care services to children. Of course, nonprofit status is only one factor that may influence quality. The quality of services is influenced by the characteristics of the teacher and the classroom – her education, her ECE-specific training, her professional development training, her job experience, her enthusiasm and energy, her attitudes towards children, but also the child-staff ratio, the group size, the ages of children in the group, etc. Quality is likewise affected by the characteristics of the supervisor/director and centre – the education, training and experience of the director, the financial resources available to the centre, the physical resources of the centre, the dedication of the centre to producing quality programming, the integration of parents into program development and delivery, and so on. Finally, the characteristics of the children and families served may influence the ability of the centre to produce quality services.

46
Nonprofit status is not like other factors affecting quality of services provided, in the sense that nonprofit status is not a direct and obvious input to quality. On the one hand, nonprofit status is simply a characteristic of the centre. But nonprofit status is related to many other things as well. Nonprofit status in Quebec is an essential requirement to be a CPE. Nonprofit status is therefore closely related to the amount of financial resources available to the centre. And since there are different staffing rules for CPEs and garderies, nonprofit status is also closely related to amount of trained staff in a classroom. But nonprofit centres also have different fundamental objectives than do commercial centres; commercial centres seek to make a surplus of revenue over costs for their owners, whereas nonprofits are governed by some sort of social mission. This social mission may be to provide services to needy children and families, or it may be the provision of services that will optimally develop children, or some mix of these objectives. These differential objectives may mean that nonprofit centres make different decisions about hiring staff, about the importance of professional development, about the nature of programming, about wage and benefit levels, about the use of financial resources generally.
Our objective is to uncover the role of nonprofit status in the production of quality services. Our strategy, in working with the data set, is therefore to try to hold constant (statistically speaking) the various possible other determinants of quality and see what the net effect of nonprofit status is. This is certainly possible to do, using multiple regression analysis, and the results are shown below. However, the interpretation of the results is potentially tricky.
Some of the factors held constant in the regressions are separable from nonprofit status itself. In particular, it would obviously be possible to give precisely the same amount of government financial resources to nonprofit and commercial centres. Further, it would be possible to establish identical staffing rules for the two types of centres. However, the choices made by nonprofit centres – choices to prioritize highly the production of quality services and to dedicate resources to this objective rather than other objectives (e.g., to prioritize professional development for staff ) – may be regarded, at least by some, as part of the essence of nonprofit status itself.
What this means is that we have to keep our eye on two magnitudes at once. The first is the independent, or net, effect of nonprofit status with all other quality-enhancing factors held constant. The second is the gross effect of nonprofit status, taking nonprofit status and the resource usage choices of the nonprofit centres together to represent this gross effect.
5.2. Caveats
It is important to note that the results reported here, while they are weighted using population or analytical weights from the dataset, have not had standard errors fully adjusted for the complex nature of the sample design. This possibility was unavailable to us at the time of publication of this report, but will be available in the future. We do not expect the patterns of significance or conclusions to change substantially from current results.
The second important caveat is that these results are based only on preschool classrooms from the Grandir data set. However, in the study report (Institut de la Statistique du Quebec, 2004), the differences in quality of the infant classrooms between commercial and nonprofit centres were found to be even larger than in preschool classrooms. As a result, we expect the results for infant classrooms to reinforce our current findings.

47
The third important caveat is that these results represent a tentative or “working paper” result. There is still work to do to refine the specification, especially with respect to financial variables, and we have to obtain corrected standard errors.
5.3. The Quality Measure
The “Echelle d’observation de la qualité éducative” (Bourgon and Lavallée, 2003) was developed specifically to measure conformity with the principles behind the educational program of regulated child care in Quebec. Three versions of the quality measurement instrument were developed – one for infants in centres, one for preschool children in centres and one for family child care. The scales include four main dimensions: physical layout of facilities, organization of activities, interaction between educators and children, and interaction between educators and parents. The first scale has two sub-scales: physical arrangement and materials and equipment. The second scale about activities has four sub-scales: planning, observation, daily schedule, and play activities. The interaction scale has three sub-scales: value placed on learning through play, democratic modes of intervention, and positive communication.
The four scales are averaged in forming the score for each group of children chosen. Each item that makes up the sub-scales and scales is rated on a scale of 1.0 to 4.0, so that the range is essentially a three-point range. Average scores up to the mid-way point of this range (i.e., of 1.0 to 2.49) are considered to represent unsatisfactory quality, with the first third of this unsatisfactory range corresponding to very poor quality, the next third to poor quality and the final third (i.e., 2.00 to 2.49) corresponding to somewhat poor quality (Bourgon and Lavallee, 2003). Average scores of 2.50 to 4.00 are considered to be satisfactory, with the lowest third of this range corresponding to fair quality, the next third (i.e., 3.00 to 3.49) to good quality, and the final third to very good quality.
5.4. Overall Quality Differences
Looking at preschool classrooms only (note that in this data set, preschool is defined as covering 18 months through 59 months), we find substantial gross differences in quality on average across nonprofit and commercial centres. Measured on a scale of 1 to 4, preschool classrooms in nonprofit CPEs rated an average score of 2.93. Preschool classrooms in garderies rated an average score of 2.58. Transforming these scores onto a percentage scale, preschool classrooms in commercial centres scored, on average, 52.5%, whereas, in nonprofit CPEs they scored 64.2%. In other words, there is a difference of about 12 percentage points between these two types of centres (or, the quality in preschool CPEs is, on average, over 22% better than in garderies). This is a very substantial difference, larger than a one standard deviation difference in quality between the two types of centres (s.d. of index quality for CPEs is .26; s.d. of index quality for garderies is .34).

48
We can depict the entire distributions of quality on a graph; the graph shows two histograms of quality scores (in percentage terms). The histogram on the left shows scores for preschool classrooms in the garderies; the one on the right shows scores for CPEs . Somewhat less than half of the mass of the left-hand distribution is below the 50 percent mark on the quality scale (i.e., unsatisfactory). In contrast, only a small part of the right-hand distribution (i.e., CPEs ) lies below 50%. On these graphs, 66.6% represents good quality and 83.3% represents very good quality. Only a small number of preschool groupings in garderies have quality in the good or very good range, compared to a very substantial number of CPEs with measured quality in the good level or above.
5.5. Differences in Inputs
Table 5-1 shows some of the differences in inputs between centre-based CPE services for preschool children and inputs for garderies. Detail on some relevant inputs is not included here and is part of future work.
One of the clearest patterns that appears in these numbers is the differential use and prioritization of trained teachers.
20 40 60 80 20 40 60 80
0
.02
.04
.
06
Dens
ity
percent of quality
Garderies CPEs
Figure 5.1. Distributions of Percent Quality for Preschool Age Children in Garderies (on the left) and CPEs (on the right)

49
For instance, on average 47% of wages in commercial centres go to trained educators, whereas, in nonprofit centres, 70% of wages go to trained teachers. The average wage of teachers is correspondingly different - $12.72 in commercial centres and $15.81 in nonprofit CPEs . 27% of educators in commercial centres have only a high school diploma, but this is true for only 7% of teachers in nonprofit centres. Further, about 55% of staff in garderies have completed professional development training in the last 12 months, compared to 85% of CPE staff. The experience level of CPE staff is higher too – nearly 8 years of centre-based experience – compared to just less than 5 years of experience in garderies.
Of course, garderies and CPEs follow different regulations about staffing. CPEs are required to maintain a ratio of 2 qualified staff out of every 3, 70% of the time. Garderies need only have one out of three staff qualified, 50% of the time (Tougas, 2005). Further, there are differential rates of government subsidization of CPEs and garderies. According to Lefebvre (2004), preschool places in CPEs receive $44 per day for these children, whereas for-profit centres receive from $32 to $49 per day depending on the ages of children served.
There are other differences between commercial and nonprofit centres serving preschoolers, and some similarities reviewed in the rest of Table 5.1.
TABLE 5-1 Differences in Quality-Related Inputs, Commercial and Nonprofit Centres, Quebec 2003Variables Commercial Nonprofit
Quality Percent 52.50 64.20Proportion of total wages going to ECE-trained staff 0.47 0.70Hourly wage of teacher $12.72 $15.81Teacher has high school education 0.27 0.07Teacher has college education 0.52 0.73Teacher has university education 0.21 0.20Professional Development in previous year 0.55 0.85
Teacher’s job experience in centre (years) 4.91 7.68Number new staff in last year 1.89 2.29Supervisor has college education 0.34 0.37Supervisor has university education 0.56 0.58Centre has been established less than 3 years 0.02 0.19Number of spaces in centre 56.20 56.20
Child-staff Ratio 7.05 7.02
Youngest child in group aged less than 2.5 years 0.30 0.24
Percentage of low-income households in area 19.60 21.90
Less than 25% of area- population born outside Quebec 0.68 0.83
Proportion of area-population born outside Quebec 0.20 0.13
Employment rate in local area 65.99 62.98

50
5.6. The Contribution of CPEs to Quality
Table 5.2 analyzes the contribution of nonprofit (CPE) status to quality, holding constant a wide range of differential inputs and resources used by garderies and CPE’s, holding constant various population characteristics in the areas in which centres are located, and controlling for regional differences that may affect quality. The contribution of nonprofit (CPE) status to quality is quite robust across different specifications. Holding other factors constant, nonprofit status contributes over 5 percentage points to quality. Since the gross difference between nonprofits and garderies was found to be 11.7 percentage points, this result can be interpreted as saying that just over half of this difference is explained by differences in the resources and inputs between CPEs and garderies, but nearly half of this difference is a net “nonprofit advantage” of the kind we saw in the You Bet I Care! results.
TABLE 5-2 Determinants Of Quality, Preschool Children, Quebec 2003Variables Estimated Coefficient t-statistic
CPE 5.19** 3.28Proportion of wages for ECE-trained staff 8.83** 2.66Hourly wage of teacher 0.56** 1.99Teacher has college education 1.92 1.17Teacher has university education 1.19 0.67Professional Development in last year 3.82** 2.79
Supervisor has college education -2.31 -1.11Supervisor has university education -1.05 -0.51Supervisor’s experience in centre 0.12 1.48Child-staff ratio (if youngest child > 3 years) -0.58 -1.58Child-staff ratio (if youngest child <= 3 years) -0.58 -1.44Youngest child <2.5 years -3.58** -2.23Centre has been established less than 3 years 3.30** 2.42Proportion of low-income households in area 0.03 0.60
Less than 25% of area- population born outside Quebec -0.86 -0.50
Employment rate in local area 0.04 0.83
Eastern Quebec -1.36 -0.55
Centre-East Quebec 2.17 1.09
Monteregie Region 5.55** 2.96
Western Quebec 5.46* 1.77
Centre-West Quebec 5.05** 2.13
North of Montreal 0.91 0.47
Constant term 39.71** 6.71
N 358
R-squared 0.37

51
6. NONPROFIT AND COMMERCIAL CHILD CARE IN THE CITY OF TORONTO
The City of Toronto has been, for many years, a major force in the provision, regulation, monitoring and assessment of licenced child care services. The City of Toronto Department of Children Services has purchase-of-service agreements with a large number of licenced child care centres as part of the administration of subsidies to low- and middle-income families. A small number of these are municipally-run (public) centres, about 22% of them are commercial (for-profit) centres and about 70% are nonprofit. These centres are not a random selection from all centres in Toronto. These are centres who wish to have subsidized children and are willing and able to comply with the City of Toronto’s requirements to provide services that meet a number of different quality-related criteria.
Over the years, Toronto Children’s Services has developed a set of “Operating Criteria”. These were originally developed and approved by Metro Council in 1990. Since then, the essence of the Operating Criteria have not changed, but the tools used to measure and monitor operators’ performance in meeting these criteria have evolved and improved. There are 10 assessment sections as part of these criteria: administration, nutrition, infant, toddler, preschool, school age, interactions, health and safety, playground and financial. Detailed items under each of these sections measure performance on a five-point scale (where “1” has a particular description for each particular item and is interpreted as “does not meet criteria”, “2” means “needs improvement”, “3” means “meets criteria”, “4” means “exceeds some areas of the criteria” and “5” means “exceeds all areas of the criteria”). These criteria are intended to assess quality and determinants of quality with the understanding that sound management practices, training, experience and stability of caregivers, group size and the ratio of children to caregivers, staff-child interactions, family involvement in the program, the health and safety standards of the physical facility, and program content and development are primary determinants of quality.
The assessment tool which charts each centre’s compliance with these criteria is completed annually by the Children’s Services Consultant, in collaboration with a representative of the child care centre. If a centre fails to comply with the Operating Criteria, sanctions will be imposed progressively.
The annual centre assessments using these Operating Criteria are, potentially, an important source of information about the determinants of quality in child care centres. These data are of particular interest in this current study of the effects of nonprofit status on quality of child care services.
The City of Toronto data are important because they speak to a vital policy issue: “Is it possible to make commercial centres behave like nonprofit centres through careful regulation and monitoring?” In most places that data has been collected, the quality of child care services in nonprofit centres is significantly better than in for-profit services in the same area. However, it is frequently suggested that for-profits can change the quality of their services with adequate support, regulation and monitoring. In other words, the source of this quality difference is two-fold. First, nonprofit centres may have additional resources in the form of government grants or voluntary donations compared to commercial centres. Second, commercial centres will generally seek to find a way to sell a good or service at a low price to attract customers. Therefore, so this argument goes, if it is an important public objective to have higher quality child care, two actions are required. First, make sure that all centres get the same grants and public support. Second, make regulations and monitoring more restrictive so that all centres, including commercial ones, are required to produce child care of the desired level of quality.
52
6.1. The Data Set
With the permission of Toronto Children’s Services, and with strict observance of rules of confidentiality, we have access to a subset of the variables from the 2005 data on compliance with Operating Criteria for the City of Toronto. There are 432 centres represented, essentially the entire population of centres having purchase-of-service agreements with the City of Toronto. For each centre, we have information about a relatively small number of explanatory variables. We do not have the overall score on the Operating Criteria assessment (made up of data from 10 sub-scales, each of which has a list of “essential items” that are averaged to form the score for that sub-scale). However, we do have data on the preschool classroom observation data collected as part of the assessment of Operating Criteria.
In addition, we have information on whether the centre is nonprofit or commercial (or municipal ), the number of preschool spaces provided in the centre, the average wage of ECE-trained teachers, the average wage of unskilled staff, the percent of wages covered by government grants, the percentage of children in the centre who are in receipt of government subsidy, the average monthly net income of families receiving subsidy in the centre, the percentage of subsidized families headed by lone parents, and the range of age groups served in the centre. This is a relatively small number of variables, making it difficult to control adequately for factors that might affect the quality of services provided by centres in order to isolate the effect of nonprofit status independent of other influences.
6.2. The Quality Measure
Operating Criteria are rated on a five-point scale, which means that each item gets a score of 1, 2, 3, 4, or 5. The average score across items will not necessarily take an integer value, so the average may take any value between 1 and 5, including decimals. This is true also for the single scale we have available – observation data from preschool classrooms. For the purposes of this study, it is useful to transform this five-point scale in two ways. Where a continuous variable is required (e.g., for regressions), we transform this variable into a percentage quality measure.
On an item from the Operating Criteria, the value “1” is the lowest score that can be accorded. An average score of “1” across all items would refer to a centre that did not meet standards in any field. This corresponds to a percentage value of zero, whereas a centre that scores “5” on all items will get a percentage score of 100. By this ranking, a score of “3” (meets criteria) is 50% and a score of “4” (exceeds some areas of the criteria) is 75%. The second transformation is for crosstabular analysis (where we need a categorical variable). Here we develop the categories inadequate, acceptable, good and excellent. Inadequate corresponds to scores of 1.0-2.99 on the original scale (below “meets criteria”). Acceptable corresponds to scores from 3.0-3.99; Good (rising to excellent ) corresponds to scores from 4.0-5.00. It should be noted that the Operating Criteria are an imperfect measure of quality, and the City of Toronto is continuing to develop these measures to improve them.
5 Municipal centres have 100% ECE-trained staff and over 90% of children are subsidized, and wages are over $5.00 per hour higher than in nonprofit centres. Because of their public funding, these centres are not directly comparable to nonprofits and commercial centres, so they are omitted from this analysis.

53
6.3. Are Commercial and Nonprofit Centres Different?
Our objective is to determine whether nonprofit status is systematically and positively associated with quality of child care services as measured by the instrument that assesses quality in preschool classrooms. The figures in Table 6-1 provide the first indication.
Viewed as two frequency distributions of quality, it appears that the distribution of quality scores in nonprofit centres is shifted towards higher quality, but also clearly overlapping with the quality distribution of commercial centres. Nonprofit status is not a guarantee of quality, but appears to be a contributor. Some nonprofits provide inadequate care in preschool classrooms, most provide care at the acceptable level, and close to 4 out of 10 provide care that exceeds the City of Toronto’s guidelines for quality.
Table 6-2 shows the average value of variables in the data set for commercial centres and nonprofit centres. The values of these variables are, in general, substantially different between the two types of centres (statistically significantly so, except for the proportion of subsidies going to lone parent families). Commercial centres pay lower wages, have a smaller percent of wages covered by grants, have a substantially lower number of hours provided by ECE-trained teachers, have a greater percentage of subsidized children, have subsidized families with a lower level of net income, and have more preschool spaces than do nonprofit centres. Overall, commercial centres provide child care quality at a lower level (5 percentage points lower or about 7% lower than nonprofit centres).
TABLE 6-1 DISTRIBUTION OF QUALITY LEVELS IN COMMERCIAL AND NONPROFIT CENTRES HAVING AGREEMENTS WITH THE CITY OF TORONTO, 2005 QUALITY LEVEL Commercial Centres Nonprofit Centres Total
INADEQUATE 9.6% 5.6% 7.0%ACCEPTABLE 62.8% 56.1% 57.7%GOOD 27.7% 38.3% 36.0%
TOTAL (NUMBER OF CENTRES) 100.0% (94) 100.0% (303) 100.0% (397)
TABLE 6-2 VALUES OF KEY VARIABLES; COMMERCIAL AND NONPROFIT CENTRES HAVING AGREEMENTS WITH THE CITY OF TORONTO, 2005VARIABLE Commercial Centres Nonprofit Centres
Quality (Percent) 64.3% 69.2%Percent Of Hours Provided By ECE-Trained Teachers 63.3% 72.9%Average Wage Of ECE Teachers $15.52 $19.24
Average Wage of Untrained Teachers $11.27 $13.99Percent Of Wages Covered By Grants 6.2% 22.3%Percentage Of Children In Centre Subsidized 73.9% 43.1%Average Monthly Net Income Of Subsidized Families In Centre ($000’s)
1.692 1.901
Percent Subsidized X Net Income Of Subsidized ($000’s) 121.3 75.0Percent Of Subsidies In Centre Going To Lone Parent Families
72.7% 68.9%
Number Of Preschool Spaces 44.4 34.7

54
From the information in Table 6-2, it appears that nonprofit centres in the City of Toronto have different levels of available resources and make different decisions about use of resources in the production of quality programming and services for young children.
6.4. The Effect of Nonprofit Status Controlling for Resource Differences
Of course, it may be true that nonprofits provide better quality than commercial centres on average primarily because of their greater access to resources. The Province of Ontario and the City of Toronto both provide some grants to support wages and quality and which are not evenly distributed amongst commercial and nonprofit centres. Children on low-income subsidy are another potential source of differences in quality. Perhaps the additional financial resources from increased numbers of subsidized children provides a boost to quality. On the other hand, the differences in clientele may make it more difficult to produce quality services if subsidized children are more likely to have behavioural problems, or learning difficulties (or if having a greater number of subsidized children coming from lone parent families is correlated with a differential burden on staff ).
To account for these possibilities, we can regress the quality of service provided on a series of “resource and clientele” variables to see whether the purported “quality advantage” of nonprofit centres disappears. We can see the results of this exercise in the second column (the first column of numbers) in Table 6-3.
The percent of wages covered by grants does not have a consistent effect on quality, and neither does the percent of subsidized children, or the percent both subsidized and in lone parent families. The average net monthly income level of subsidized families is positively correlated with quality, other factors held constant, but at the mean values in the sample, this only explains about 3⁄4 of a percentage point of quality difference between commercial and nonprofit centres. With resources held constant, nonprofit status is statistically significant, giving a boost of about 4.6 percentage points to quality.
TABLE 6-3 REGRESSION OF CENTRE QUALITY (PERCENT) ON DETERMINANTS OF QUALITY, NONPROFIT AND COMMERCIAL CENTRES WITH AGREEMENTS WITH THE CITY OF TORONTO, 2005
Nonprofit vs. Commercial Nonprofit vs. Commercial
Explanatory Variables Coefficients(t-stats)
Coefficients(t-stats)
Nonprofit Centre 4.59* (1.84) 0.95 (0.35)Grants - % of Wages -0.05 (0.56) 0.002 (0.02)
% subsidized -0.006 (0.20) 0.009 (0.30)% subsidized and lone-parent -0.014 (0.37) -0.013 (0.34)Average income of subsidized families 3.70** (2.09) 2.89* (1.65)% of hours by ECE-trained teachers 0.15** (3.21)Average wage of ECE teachers 0.63** (2.17)Number of preschool spaces 0.04 (0.94)Constant 59.86** (10.14) 38.81** (4.84)N 393 392Adjusted R- squared 0.03 0.06

55
Of course, nonprofits make different decisions about what to do with their resources than do commercial centres. In particular, they pay higher wages to staff (both ECE-trained and untrained staff ) and they use (more expensive) ECE-trained staff for a greater proportion of hours in the child care day. These two variables are, therefore, not independent of what it means to be a nonprofit centre; as Table 6-2 showed, these values differ substantially between commercial and nonprofit centres.
The second column of numbers in Table 6-3 shows the results of a regression of centre quality (in percent) on the previous resource/clientele variables, but also on additional variables. The two main added variables are the percent of hours provided by ECE-trained teachers in the centre, and the average wage of ECE teachers. We also add the number of preschool spaces (although this is not a very meaningful variable – percent of preschool spaces would be preferable).
The results of this second regression show that both hours provided by ECE-trained teachers and the average wage paid to these teachers matter significantly for quality. When these variables are included, the independent effect of nonprofit status disappears (becoming quantitatively much smaller and insignificant statistically).
6.5. Caveats
As discussed earlier, the results of this statistical exercise can only be suggestive, rather than conclusive, about the role of nonprofit status amongst determinants of child care quality in preschool classrooms. The first reason for this is the nature of the quality measure, which gives information about quality in preschool classrooms only, while most of the data are not classroom-specific, but are at the centre level. Quality is produced in interactions between individual children and groups of children and their teachers and caregivers. The specific educational, experience and affective characteristics of individual teachers matter a great deal, as do the particular ages and other characteristics of children in the group, the child-staff ratio, the group size and other factors at the classroom or group level. The City of Toronto measures do not provide this detail, either about determinants of quality, or measures of the quality of interactions.
The second reason, related to the first, is that the detail available about the determinants of quality is inadequate to separate out the influences of different factors. So, for instance, we have grants as a percent of wages, whereas it would be more useful as a percent of all revenues; we do not have information about other sources of revenue, particularly the level of fees, but also donated services; we have number of preschool spaces, whereas the percentage of preschool, school age, toddler and infant children would be more useful (particularly since nonprofit centres may cross-subsidize infant care with resources from services to preschool children), along with the total number of children served by the centre or total number of spaces. We do not have information on the education or experience of individual teachers, nor information on supervisors/program directors etc., etc.

56
6.6. Conclusions
With all the necessary caveats, we can, nonetheless, draw some conclusions from this stage of research (more data will be available in the future). It appears that nonprofit status matters to child care quality in preschool classrooms in the City of Toronto, even amongst the select group of centres that have purchase-of-service agreements with the City of Toronto and are therefore monitored and regulated more thoroughly than other centres. It’s not so much that nonprofits attract differential resources, although they do. Differential resources do not seem to be strongly determinative of quality within the range of data available in this data set. What seems to matter most is way these resources are used - the decision to increase the use of ECE-trained teachers and to hire these teachers at a higher wage (therefore improving their motivation to produce quality, and, perhaps, hiring teachers more selectively). These decisions are strongly associated with nonprofit status, and this explains the observed average differences in quality between nonprofit and commercial child care centres.

57
7. EVIDENCE FROM THE ELDEQ ON CHILD CARE QUALITY6
The Quebec Longitudinal Study of Child Development(or Étude Longitudinale de Développement des Enfants du Québec -ELDEQ) began, in 1998, to collect data on a representative sample of children born in Quebec from October 1997 through July 1998. The study included an evaluation of the quality of child care settings used by these children after they reached the age of 2.5 years. The study included evaluation of the quality of both non-profit and for-profit centre-based settings and regulated family child care (i.e., home-based CPE’s), but also evaluated the quality in unregulated home-based settings. The evaluation of the quality of unregulated care is nearly unprecedented in Canadian studies, making this data source particularly valuable for the study of the quality of child care settings.
There were 2,223 Quebec children included in the sample, but only a total of 1,540 on-site evaluations of child care quality. There was a total of 728 evaluations in centre-based CPE’s, 337 in home-based CPE’s, 296 in for-profit centres, and 179 in unregulated home-based arrangements.
The instruments used to evaluate quality (the Early Childhood Environments Rating Scale – Revised or ECERS-R [Harms, Clifford and Cryer, 1998] and the Family Day Care Rating Scale or FDCRS [Harms and Clifford, 1993]) have frequently been used in studies of this type and provide a global assessment of the quality of the service provided. These measures assess health-related, activity-related, and interaction-related aspects of child care arrangements, along with assessment of the quality of facilities and materials available. Each of the measurement scales is measured on a scale of 1 to 7, where 1 is the lowest possible score that can be given and is termed “inadequate” quality care. A score of 3 is termed “minimal”; 5 is termed “good” and 7 is the highest possible score and is termed “excellent”. As Japel, Tremblay and Coté (2005) describe it, “These scales, whose validity and reliability are well established, measure the parameters elaborated by the NAEYC (note: National Association for the Education of Young Children in the U.S.) to ascertain whether a particular setting is conducive to child development.”
The findings from the ELDEQ study about the quality of child care arrangements in Quebec are summarized in the figures below (from Japel et al., 2004). Figure 7.1 shows that the majority (about 70%) of arrangements score below the level of good developmental quality. However, only slightly over 10% of arrangements can be classified below minimal quality (i.e., inadequate), while the majority are not harmful to children, but neither do they stimulate the development of children in a way that would be considered fully adequate.
6 Charts in this chapter are from Japel, Tremblay and Coté (2004).
Figure 7.1: Global Quality of Settings Visited (N=1,540)
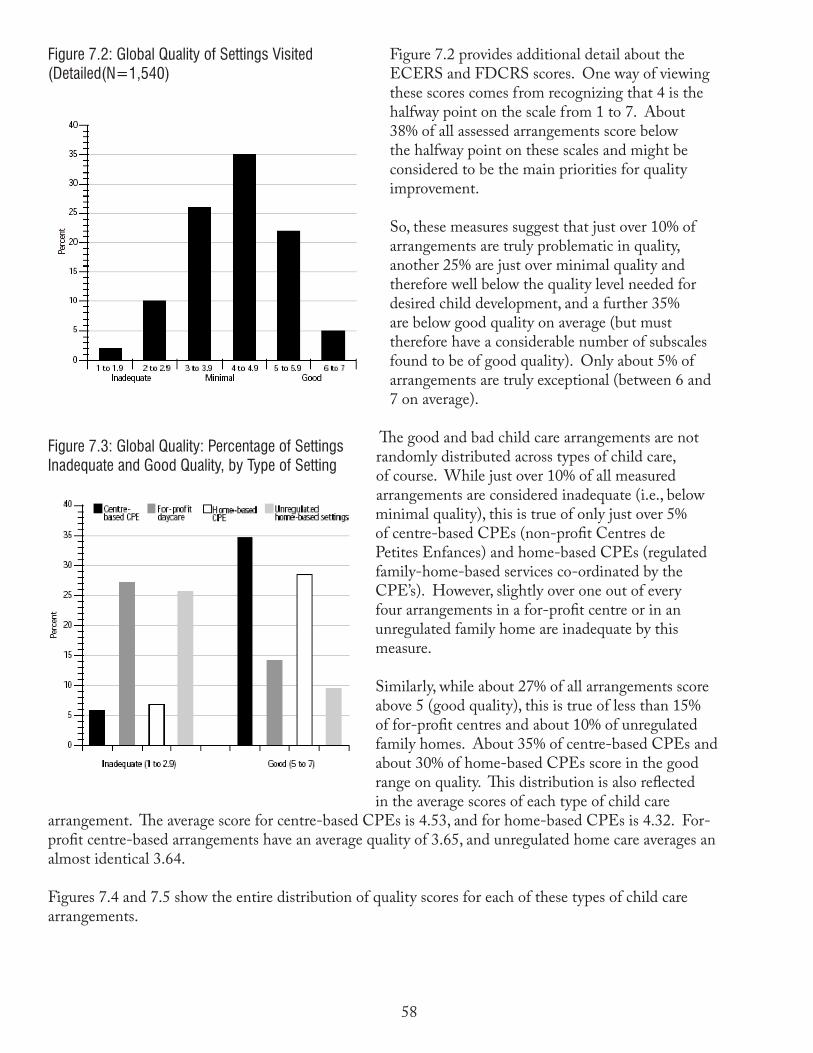
58
Figure 7.2 provides additional detail about the ECERS and FDCRS scores. One way of viewing these scores comes from recognizing that 4 is the halfway point on the scale from 1 to 7. About 38% of all assessed arrangements score below the halfway point on these scales and might be considered to be the main priorities for quality improvement.
So, these measures suggest that just over 10% of arrangements are truly problematic in quality, another 25% are just over minimal quality and therefore well below the quality level needed for desired child development, and a further 35% are below good quality on average (but must therefore have a considerable number of subscales found to be of good quality). Only about 5% of arrangements are truly exceptional (between 6 and 7 on average).
The good and bad child care arrangements are not randomly distributed across types of child care, of course. While just over 10% of all measured arrangements are considered inadequate (i.e., below minimal quality), this is true of only just over 5% of centre-based CPEs (non-profit Centres de Petites Enfances) and home-based CPEs (regulated family-home-based services co-ordinated by the CPE’s). However, slightly over one out of every four arrangements in a for-profit centre or in an unregulated family home are inadequate by this measure.
Similarly, while about 27% of all arrangements score above 5 (good quality), this is true of less than 15% of for-profit centres and about 10% of unregulated family homes. About 35% of centre-based CPEs and about 30% of home-based CPEs score in the good range on quality. This distribution is also reflected in the average scores of each type of child care
arrangement. The average score for centre-based CPEs is 4.53, and for home-based CPEs is 4.32. For-profit centre-based arrangements have an average quality of 3.65, and unregulated home care averages an almost identical 3.64.
Figures 7.4 and 7.5 show the entire distribution of quality scores for each of these types of child care arrangements.
Figure 7.2: Global Quality of Settings Visited (Detailed(N=1,540)
Figure 7.3: Global Quality: Percentage of Settings Inadequate and Good Quality, by Type of Setting

59
The picture provided by these figures is potentially somewhat misleading, however. Naturally, some parents or caregivers refused permission for their arrangements to be evaluated. One expects that these arrangements would be more likely to have provided lower measured quality on average. The omission of these nonrespondents may give us a somewhat biased impression of overall quality. Further, the number of refusals (to permit on-site evaluation) amongst those using home-based unregulated care was particularly high. Failure to account for this also may distort somewhat our impression of the dimensions of the quality problem in child care. To try to correct for these potential biases, we have used statistical techniques to predict the likely quality level of the child care arrangements that were not evaluated. While imperfect, these techniques give us some sense of the probable
true underlying distribution of qualities in Quebec child care arrangements.
The table 7-1 shows the results of this prediction. There were 726 children using Centres de Petites Enfances (CPEs – which are nonprofit centre-based facilities) who had their arrangements evaluated. There were another 1090 children using CPEs who did not have on-site quality inspection. The observed settings had a mean quality level of 4.59. Using family characteristics to predict the quality of the unevaluated settings, we project that the average quality of the unobserved settings in centre-based CPEs was 4.11. On average then, across observed and unobserved, centre-based CPEs would have an average quality of 4.30.
For home-based early learning and child care affiliated with a CPE (also known as home-based CPE’s), the average quality of observed arrangements is 4.40, of unobserved is 3.87, and the average across all is 4.04.
For-profit “garderies” in Quebec are centre-based facilities operating outside the CPE system, but providing subsidized services at $5 (now $7) per day. These for-profits did not have the same regulations on trained-staff applied to them as did the CPE’s. The average value of the quality of the observed centres was 3.70. The average quality of the unobserved facilities was 3.54, and the overall average was 3.64.
Unregulated home-based care has the worst average quality at 3.60. The unobserved arrangements are predicted to have a quality level of 3.22. The overall average quality is 3.26.
Figure 7.5: Global Quality of Settings Visited: Home-Based CPEs and Unregulated Home-Based Settings
Figure 7.4: Global Quality of Settings Visited: Centre-Based CPEs and For-Profit Daycares

60
Table 7-2 and the corresponding graph ( ) show how much difference there is in the underlying distributions of quality. This table and graph show both observed and predicted qualities. The differences are quite stark. In particular, very few unregulated home care arrangements are above the midpoint on the quality scale; the vast majority score below 4.0. Centre-based CPEs have the majority of their observations in the top half of the quality scale. Home-based CPE care is more oriented towards lower quality, with both low and high quality facilities. For-profit child care is even more strongly distributed towards lower quality care.
TABLE 7-1 ASSESSED AND PREDICTED QUALITY MEASURES, BY TYPE OF CHILD CARE PROVIDER, ELDEQType of Child Care Assessed
Levels of Quality
Predicted qualities Combined Actual and Predicted Qualities
Centre-Based CPE N Valid 726 1090 1816Missing 1091 727 1
Mean 4.5901 4.1141 4.3044Median 4.6429 4.0941 4.1621
Std. Deviation 0.93738 0.23466 0.66214Minimum 1.39 3.38 1.39Maximum 6.98 5.62 6.98
Home-Based CPE N Valid 337 712 1049
Missing 712 337 0Mean 4.4054 3.8724 4.0436Median 4.3939 3.8947 3.9679Std. Deviation 0.97457 0.44124 0.70612Minimum 1.76 2.25 1.76Maximum 6.91 5.98 6.91
For profit day-care N Valid 295 169 464Missing 170 296 1
Mean 3.6964 3.5416 3.6400Median 3.7381 3.5416 3.6188Std. Deviation 1.10709 0.38420 0 .91510Minimum 1.08 2.63 1.08Maximum 6.67 4.52 6.67
Unregulated home-based N Valid 179 1559 1738Missing 1559 179 0
Mean 3.5969 3.2217 3.2604Median 3.5938 3.2355 3.2572Std. Deviation 0.94790 0.48935 0.56557Minimum 1.47 1.27 1.27Maximum 6.66 5.85 6.66

61
TABLE 7-2 - DISTRIBUTION OF QUALITY LEVELS, ACTUAL AND PREDICTED COMBINED, BY TYPE OF CHILD CARE PROVIDER, ELDEQ
Type of Child Care Total
Quality Level (Integer Values)
Centre-Based CPE
Home-Based CPE
For profit day-care
Unregulated home-based
1 thru 1.99 Count 4 2 20 21 47% within type 0.2% 0.2% 4.3% 1.2% 0.9%
2 thru 2.99 Count 38 45 71 529 47% within type 2.1% 4.3% 15.3% 30.7% 13.6%
3 thru 3.99 Count 462 500 224 1055 2241% within type 25.5% 48.1% 48.4% 61.2% 44.5%
4 thru 4.99 Count 1046 391 106 95 1638% within type 57.8% 37.6% 22.9% 5.5% 32.5%
5 thru 5.99 Count 215 85 41 20 361% within type 11.9% 8.2% 8.9% 1.2% 7.2%
6 thru 6.99 Count 46 17 1 3 67% within type 2.5% 1.6% 0.2% 0.2% 1.3%Count 1811 1040 463 1723 5037% within type 100.0% 100.0% 100.0% 100.0% 100.0%
Figure 7.6 Distribution of Quality Levels, Actual and Predicted Combined, By Type of Child Care Provider, ELDEQ


63
8. NONPROFIT AND COMMERCIAL CHILD CARE IN OTHER COUNTRIES
8.1 Introduction
This chapter looks at the situation in a number of other countries to provide some context for Canadian developments. There are three different auspices under which child care is delivered in different countries: public, nonprofit (sometimes called semi-private or voluntary sector), and for-profit or commercial. Public sector: covers different levels of government: national/federal, regional, local.Nonprofit sector: (often referred to as the semi-private sector) covers services managed by different types of private associations with a social, educational or cultural purpose (and therefore generally with at least partial government funding). In some countries, the nonprofit sector includes a strong presence of religious institutions, esp. Germany, Italy, Spain. Also co-ops (secular) are major players, e.g., Italy.For-profit private sector: covers services owned and managed by individual entrepreneurs (single proprietorship), partnerships, large companies owning many nurseries (strongest in the UK, US and Australia).
In Europe, publicly-funded educationally-oriented child care services covering children from 3 to schoolage are nearly universal; in the U.S., Australia, New Zealand and Canada, publicly funded services cover most children (part-time) from 4 or 5 years. Provision of these services is mainly by the public and semi-private (nonprofit) sectors, with for-profit services playing a negligible role, in general. Still a big issue, though, is how these services – often only available for school hours – can meet the needs of working parents.
For children under 3 in Europe and for children of working parents in the U.S., Canada and Australia, all countries have the issue of public/private relationships on their agenda. Historically, early learning and child care services were organized by the semi-private sector with the state subsequently playing an increasingly important role through funding, regulation and often direct provision.
In many countries, long-established institutionalization of relations between sectors have today resulted in a lack of differentiation between public and semi-private sectors at an organizational level. For example, in Belgium the key divide is not public/private but subsidized/non-subsidized. In other cases, major regime changes have interrupted continuity in the development of the public/private relationship. For example, in Hungary and other former Soviet countries, services are still largely publicly run and funded. In Spain, the Franco regime in Spain supported private providers. In both cases, it has since proved difficult to diversify the ELCC system. Although most countries have expressed interest in involving more sectors in the management and delivery of early learning and child care services, these experiments have been unevenly applied.

64
8.2 United Kingdom7
Expansion of early learning and child care has been a major government policy goal for the past decade against a historical backdrop of a ‘mixed economy’ of provision. Services in the U.K. have always been provided by a mix of public, private and voluntary sector providers. Governments (left and right) have supported this approach as offering flexibility and choice.
Within this general context, there are variations across the U.K. Levels of public provision are higher in Scotland and Wales than England. Service providers also vary by child’s age: most children under four are cared for in a private (either profit or non-profit) setting; the majority (80%) of four year olds attending early education are in public sector schools.
Local authorities have provided school-based nursery schools for 3 and 4 year olds – mostly part-time as well as a range of community-based services such as children and family centres. Regional authorities also played a commissioning role, paying for services for ‘children in need’ to be provided by other agencies.
A variety of private individuals and companies make up a large private for-profit sector. This includes large companies operating many centres, services attached to private schools, small private nurseries run by individual owners and many family day carers virtually all of whom are self-employed. There is a very high proportion of for-profit provision: 90% of nurseries (child care centres) are provided by businesses – worth 5.14 billion euros (2005).
There is also a substantial voluntary sector. This includes services run by parent groups and charitable organizations, e.g. playgroups, nurseries, family and community centres; 7% of nurseries in UK are run by non-profit providers.
There are significant differences between sectors: staff working in the private sector have, on average, lower qualifications with lower pay and poorer working conditions. Pay levels for equivalent positions in the public sector are around 25% higher, with shorter hours and longer paid holidays. As a result, a nursery worker in Scotland can cost nearly twice as much to employ in the public as in the private sector (of course, productivity may be different, as well).
The private sector is much less stable than the public sector. Closure rates and staff turnover are high even compared to other small businesses.
Two other differences:
1. Public services – particularly nursery schooling – are more likely to be delivered free and on a universal basis but for short hours not geared to parents’ needs. Private sector services, especially for-profit nurseries and family day care, mainly deliver a service specifically for working parents and depend on parents’ ability to pay fees. Fragmentation results. Children often have to use different services for periods of the day and/or week, so their parents can get the care they need for a price they can afford.
7 See Cohen, Bronwen “Private Commodity or Public Good” in Children in Europe, p. 22. ; Examples: p. 24

65
2. Funding varies. Most public funding goes towards a free entitlement to part-time early education for 3s and 4s. The public sector receives most of this. Lower income families receive income-tested payments (tax credits) to subsidize their use of private ‘childcare’ services. Private sector providers receive some time-limited funding to participate in new initiatives, especially in poorer areas, due to implementation of a plan to establish 3500 Children’s Centres by 2010. (intended to provide a wide range of services for children and families in an integrated way).
Current Issues
Government is driven to increase supply primarily by its interest in encouraging maternal employment and reducing high levels of child poverty. It is heavily dependent on the private sector to deliver these goals. But, at the same time, there is more emphasis on integration of policies and services, so that all early childhood services are now, or soon will be, the responsibility of education ministries.
The integration projects will provide challenges for the private sector. Sure Start/Children’s Centres programs are mandated to provide a holistic approach to the needs of young children. This ‘joined-up’ approach is ambitious, identifying the contribution which preschool services can play not only in providing care and stimulating learning but promoting healthy lifestyles and developing citizenship skills. More integration will require new ways of working – particularly in the private sector.
Public sector services are more likely to be linked to other services. Scotland local authority preschool services form part of ‘learning communities’ with primary and secondary schools.
In England, responsibility for driving policy falls on local authorities with new legislation requiring them to ensure availability of services by ‘facilitating’ the childcare market – assessing need and supply, steering providers towards meeting demand and commissioning services where they don’t exist. But policy also limits local authorities’ ability to provide services themselves. Local authorities can only provide services if no other providers are available.
Despite the integration policy, the UK Government still views child care and early education quite differently. It thinks of child care as a private commodity to be sold to parents. But early education is seen as a universal entitlement – a public good guaranteed by the state.
These differences are compounded by structural differences in funding and staffing with the private sector dependent on parental fees and low qualified workers and the public sector with public funding and higher qualified (and paid) staff. The ability of local authorities to intervene on such national issues remains limited making it likely that services will continue to be fragmented, determined largely by what parents can afford to pay, rather than what children need.

66
8.3 France8
In France, early learning and child care is largely public and mostly subsidized by public funds. Provision is dominated by the services of the école maternelle.There are also:
• Private providers, services provided by friends and relatives with no official payment.• Unregulated private providers whose income is often undeclared;• Private family day carers providing a service in their own homes;• Private for-profit companies developed under the policy impetus of the Conference de la Famille.
(2003)• Private non-profit associations mostly receiving public funding• Services provided by local and regional authorities, e.g. nurseries and organized family day care;• Public nursery schooling in which the state plays the major role.
Public and Private Sectors
Almost all children 3-6 (98%) attend early learning and child care services. More than one-third of children aged 2-3 attend (admission varies based on region, e.g. Brittany and Normandy up to 40% attend).System is free except for canteen costs and out-of-school care and leisure provision.87% of schooling is provided by State.Non-public services are mostly those provided by religious associations. These receive public subsidies and are subject to same regulations as the public sector.
Under 3’s
More divided between public and private.Most widely used services are family day carers and nurseries.Family day carers (assistants maternelles) provide for 18% of children under 3.These carers are approved by departmental, maternal and child welfare services and can take up to 3 children each. Some work independently and are paid directly by parents; others are directly employed in organized schemes (crèches familiales) by municipalities, private associations or co-ops.
Nurseries care for 8% of children under 3. There are four main types:1. Local nurseries (crèches de quartier) – most common – take up to 60 children; In 2003 they
provided 93,000 places, offering full working hours2. Some company or workplace nurseries with hours adapted to the working hours of the
workplaces they serve, e.g. hospitals – 15,000 places; offering full working hours; 3. Nurseries managed by parents (crèches parentales); can take up to 20 children; 230 of these
nurseries offer places for 3,500 children and full working hours;
8 See Martin, Claude, “Public Nursery Schooling Dominant” in Children in Europe, p. 20

67
4. Haltes-garderies offer part-time hours; 67,000 places and can take up to 60 children.Most nurseries and organized family day care are provided by the public sector.
2003: 67% managed by local authorities (communes)13% by regional authorities (departments)20% by non-profits90% of family day care managed by communes.Non-profit organizations play a larger role in haltes-garderies (30%)Rarely do profit-making co-ops or workplaces run these services.
Parents using private family day care receive a subsidy (AFEAMA) to cover social security contributions for the workers. A similar subsidy (AGED) is available for carers employed by parents to provide care in child’s own home.All parents can claim tax relief against fees they pay for nurseries or family day care – whether private or public. Many services also receive funding from CAFs – local Family Allowance Funds financed through compulsory employer contributions; all employers therefore pay towards the costs of non-school services.Issues include:
- Insufficient places- Quality and uneven availability of services.- Insufficient supply for non-standard working hours. Experiments are creating more responsive
services, e.g. Bambino in Western France – care for children in own home outside of regular nursery and school hours. Cost is approx 26 euros an hour, the commune pays about 18 euros; provided by non-profit association.
8.4. Netherlands9
Government policy in the Netherlands currently emphasizes the role of private providers and private responsibility. Recent changes have celebrated the development of a market relationship between providers and parents. These developments are under intense scrutiny and debate concerning the effect of changes on the importance of the child-focused relationships.
Nearly all children start school at four. Rapid growth of public involvement only began in the 1990s. After years of funding targeted to increasing supply, the recent Childcare Act ( Jan. 2005) redirects funding from providers to parents.
Employers are expected to pay one-third of cost, but not required to. Parents pay balance. Most parents get a payment from the tax authorities based on income and child care costs. The government covers almost the entire child care costs of low-income families. When the employer doesn’t pay, the state pays an additional allowance – permanent for lower income families and temporary (until 2009) for the rest.
9 See Marangos, Annemarie and Janneka Plantenga, “Introducing Market Forces” in Children in Europe, p.18

68
New funding arrangements have led to lower prices for lower income families but higher prices for others. Higher income families, receiving no employer contribution, have to pay more. These changes have produced many complaints and a drop in demand. As a result, the Government allocated an additional 200 million euros in summer 2005 for medium and higher income families.
Objectives of the reform are to increase parental choice and stimulate the operation of market forces. Child care providers are expected to respond more to parental wishes and become more efficient. The sector uses different strategies to assist consumers to make informed choices. In 2005, about 85% of organizations were either preparing for external accreditation or setting up an internal quality system. As a form of self-regulation, the sector has adopted a quality agreement with rules about a pedagogical plan, child:staff ratios, group size and accommodation.
Conclusion and Discussion
The market for child care is not perfect:
• Parents have limited knowledge about quality and prices;• They are restricted in their choices• They rarely switch.
On the positive side, the same system applies to everyone irrespective of where parents live. Demand-driven funding also provides info about consumer preferences, making the new system more democratic and presumably more efficient.
1. About employer contributions. Approximately 75% of employees receive a contribution from their employer – supposed to grow to 90% in 2008. If not, the contribution will become mandatory and a government bill will be introduced.
2. Quality. 2005 research found that quality had declined in a number of ways including health, safety and activities that stimulate development. Results were controversial, so Government decided to commission further research on the quality of child-staff interaction and availability of activities that promote development.
3. Integration of Services into Hubs. Current policy is mainly targeted to working parents. This proposal is more targeted towards children and their needs – and support for parents and tripartite funding would no longer be relevant for services not defined primarily in labour market terms. A bill to introduce integrated centres has been introduced by the Labour party. The Netherlands now has to make a choice about the future direction for child care.

69
8.5. Denmark10
All children in Denmark are entitled to a place in an early learning and child care service from 6 months of age – as in Sweden and Finland. Denmark has the most extensive publicly-funded early childhood services in the world. The public sector has played a central role in developing these services. Since 1976, early learning and child care services have primarily been the responsibility of local authorities (municipalities) – both for quality and ensuring sufficient places. All municipal facilities have parent boards. Most of the cost of child care is paid for by the municipality, but parents pay some fee.
Changes are now being introduced that may eventually lead to a new relationship between public sector and private profiteers.
Integrated Public Service
ELCC goes back to early 19th Century when ‘shelters’ (asyler) were established for children of working parents. Privately organized and financed, they were seen as social assistance for parents without choices. From 1919 on, they became eligible for government grants provided to children from low-income homes. Throughout 20th Century, sector continued to grow. As government grants increased, institutions developed into pedagogical services moving closer to kindergartens – the first of which opened at the end of the 19th century. They provided not only care but education too. These two types of services have now been merged into an integrated system.
Organization of ELCC Services in Denmark
Municipalities are responsible for services and provide many themselves. About 25% of places are provided by private, non-profit organizations. These organizations make agreements with the municipalities. Standards and funding are identical.
It is also possible to operate private services without municipal grants. If parents choose to send children to these services, they are entitled to an alternative municipal subsidy. These are not widely used. In 2004, less than 2% of children attended ELCC with these arrangements and, of these, less than 20% were cared for in centres.
A debate about ‘outsourcing’ was launched at the beginning of the 1980s at the time of a Liberal-Conservative government. Legislation now permits municipalities some latitude in fulfilling their obligations, including outsourcing.
So far, outsourcing has mainly involved ‘pool schemes’. An agreement is made between the municipality and the provider with the municipality subsidizing the institution based on the number of children attending. The main difference from the long-established practice of municipalities funding services provided by non-profits is that in pool schemes the provider can take out profits – but only those made on the administration of the scheme; the private provider is not entitled to make a profit on the operation of the service.
The first example of this occurred in the mid-1990s, but there have been few other cases and the number has never exceeded 15 programs – compared to 7500 total centres.
More Encouragement for Private Services
10 See: Damgaard, Lise, “Outsourcing Early Childhood Services” in Children in Europe, p.16

70
In October 2005, the rules about private ELCC in Denmark were amended making it easier for private providers to establish and operate services subsidized by the municipality. Unlike the earlier pool scheme the municipality is obliged to give its approval and provide funding as long as the ELCC service meets certain conditions. Private providers can make profits from the service itself not just its administration. Unlike all other options, providers can set the fees they charge and run their own admission system. So far (2006), no services have been established under the new rules.
The Debate on Outsourcing
The main argument in favour of outsourcing has been economic. It is assumed that public services have become too expensive because they haven’t been exposed to competition. However, outsourcing “soft welfare services” is not like “technical services” such as cleaning. The problem is that the precise description of contracted services is not easy to provide; it is difficult to create and maintain standards at arm’s length. It is difficult to measure efficiency gains from outsourcing ELCC, holding quality constant.
The most obvious source of efficiency gains would come from reducing the ratio of pedagogues (i.e., teachers) to children. This would have a negative effect on quality of services as less time would be spent by staff with children. It is unclear that efficiency gains can be achieved from using the staff more intensively; and since staffing represents the main operating costs of ELCC, it may not be possible to achieve any economies in operations without damaging their quality. There would only be minor gains from outsourcing other activities, e.g., cleaning, cooking, administration.
Another argument is that competition between public and private sectors will lead to innovation and development of ELCC, giving citizens more choice of providers and services. But one outcome of free choice may be to increase social and economic inequality. For example. the rules set no upper limit to parental fees so some parents may, for financial reasons, be unable to pick the program of their choice. Well-off parents may take their children out of municipal programs because of decreasing standards (e.g. reduced staff:child ratios). This will increase the risk of social segregation of children on the basis of their parents’ financial position. This contradicts the Danish Government’s intention of paying more attention to socially excluded children.
8.6. Italy 11
Child care is provided by a wide range of public and private organizations. Recently, there have been moves to promote closer public/private partnerships, but decisions are still driven by regional decision-makers.
Nurseries (nidi) for under threes originated in the public sector under the Fascist regime set up by the National Institution for Motherhood and Infancy. This organization closed in 1971 and its responsibilities were transferred to regional and local authorities. Until recently, nurseries were provided exclusively in the public sector.
11 See Benedetti, Sandra, “Towards a Closer Working Relationship”, in Children in Europe: Managing the Mix: public and private sectors in early childhood services, Issue 11, Edinburgh, 2006.

71
In the last 10 years, private nurseries have been opening, provided by companies for their workers or set up as businesses. There’s also been a boom in co-ops that have taken over running local authority (i.e., commune) nurseries – working with communes which set standards and provide funding. At the end of 2005, 39% of nurseries were provided by the private sector – mostly co-ops; the remainder of nursery services is still provided by communes.
Nursery schools (scuole dell’infanzia) for 3-6 year olds originated in the early 20th Century with the private non-profit sector – especially Catholic parishes – to help children living in poverty. In the 1960s, some communes – especially in the North – opened their own schools. In 1971 the State government began to provide nursery schools after fierce Church resistance. Since then, there has been a distinction in terms of legal status, funding and staff pay between State-run and non-State schools – with the State regarding schools provided by communes and social sector organizations as “private”. Today, 59% of nursery schools are run by the State; 25% are run by private organizations – mostly the Catholic Church - and the remainder by communes (local authorities).
In 2000, the importance of the third (social) sector was recognized and the State called for greater collaboration between sectors in implementing and running services. It also implemented the principle of subsidiarity. This opened the door for non-State schools – run both by private organizations and communes – to receive State funding if recognized by the Ministry of Education as meeting certain conditions including buildings, staffing and educational planning.
The Case of Emilia Romagna (ER)
Regional governments in Italy play a leading role in supporting services for young children, though not as providers. Regions vary in the priority they attach to this work.
Services for Children Under 3
730 traditional nurseries in ER: 32% run by private organizations (mainly co-ops); 11% by religious organizations; The rest are provided by communes. They serve 26% of potential users (national rate is 10%).
180 additional supplementary services- “children’s areas”, “play centres”;
Approximately, 45 experimental services (e.g., group home child care); and 21 family support centres:
The Regional Law of 2004 provides a framework:
• Structural and organizational standards• Promoting integration between services• Legal recognition of role of pedagogue (Coordinator)• Promoting a culture and pedagogy of inclusion• Promoting a diverse system of public/private services sharing common conditions and rules
With this law, private providers – both social sector and for-profit – are included in the regional system with full rights while maintaining their own identity and providing families with a guarantee of quality.

72
Private providers must meet standards AND:• Have an educational project• Work with a pedagogue (Coordinator)• Include time for staff training (similar to State employees)• Participate in collaboration initiatives
Services for Children 3-6
The Emilia Romagna region has nearly 1500 nursery schools serving 96% of this age group. Nearly half these children (44%) attend State schools; 35% attend privately-run schools and the remaining 21% attend schools run by communes.
Funding has been concentrated on improving the quality of the system, allocating resources for training and other projects to improve the educational context. Private schools are supported to ensure equal educational opportunities for each child.
A regional law allows for agreements between the region, communes and associations of schools to implement:
• More flexible hours• Encouraging teachers to work alongside each other• Improving the physical environment• Connecting nursery schools, supplementary services and compulsory schools.
8.7. New Zealand
In New Zealand all early learning and child care programs for children from birth to age 5 – when children start school – are regulated and administered through the Ministry of Education. The ministry regulates, provides operating funds (funds up to 85% of basic operating costs for ELCC programs for children 3-6 – parents and fundraising contribute the balance), develops curricula, engages in consultations in the sector, trains teachers, administers subsidy and special needs programs and evaluates quality. As a result, early learning and child care has assumed the same level of importance as elementary education in New Zealand. New Zealand has adopted a 10-year strategic plan outlining the goals of an enhanced early learning and child care system.
At the local level, there are both full and part-day child care centres (called early child development and care centres) for children 0-5 covering 64% of children; kindergarten programs are offered half-day for 3 and 4 year olds. Maori preschool children attend Te Kohanga Reo (language nests) for 6 hours a day. The orientation of these programs is geared towards education and school readiness. There are also home-based care programs and play centres that are run by parent cooperatives. These programs are regulated by the State but can be offered by either nonprofit groups or private businesses. The government takes the view that providing a range of options, whether community-based or for-profit) enables parents more choice in their care arrangement.
New Zealand has established the Education Review Office to review, assess and evaluate the quality of all educational programs, including ELCC, in New Zealand.

73
The mixed delivery system between community-based (schools and non-profit associations) and private businesses appears to be a fixed feature of the system, in which more parents enroll their children in private programs than community-based. The majority of children enrolled in education and care programs attend for-profit services (58% of centre users, 60% of home-based progam users).
8.8. Australia12
Prior to 1991 in Australia, there was a predominantly not-for-profit or publicly owned child care infrastructure. Australia had a national plan to develop a quality, universal, affordable and accessible system. The federal government gave priority to communities most in need of support. Child care received capital funds from government and centres were usually built on government land. Child care was largely non-profit with a parent management committee.
In 1991, a Labour Party government opened up funding to the for-profit sector. Arguments surrounded the issue of choice for families; the current system of supply-side funding to nonprofits was considered not fair for families accessing for-profit services. It was argued that the private sector could deliver higher quality child care at a lower price.
The Australian system is now one of mixed public and private provision. Parent fees are subsidized by a comprehensive Child Care Benefit (CCB). This benefit pays for attendance at approved formal (regulated) services both public and private. It is also paid if a parent uses a registered, informal (unlicensed) service but the benefit is lower. Low-income families receive a higher rate of CCB, which may cover total costs.
More than 70% of the sector in 2005 is now commercially owned. 25% is with one shareholder company. Shareholder child care companies emerged on the stock market in 2000; they’ve moved to 25% control of the sector in just 5 years. The major driver of a publicly-listed company is to make profits for the shareholders – that’s the law.
With centres of about 100 places, a shareholder company makes about $100,000/year or $1,000/place. Now it’s an industry striving to make a profit.
Large companies are reported to spend 50% of revenues on staff; smaller commercial centres spend 60% on staff and non-profits spend 80-85%. The costs to the parents are the same as the costs to parents in non-profit centres. Average fees are $220 a week, but in some wealthy areas, centres charge $100/day - $500/week.
Australia has a compulsory quality assurance system and families cannot receive a subsidy for child care unless it meets the licensing quality assurance requirements. The theory, in Australia, is that the non-profit and for-profit sectors are competing on a level playing field, but the reality is reported to be that the large shareholder companies cut corners by hiring the minimum number of staff and the least qualified and offering less expensive services (not infants and toddlers). This acts as downward pressure on standards and quality.
For children:• 0-1 year: parental and informal care predominate. In 2000 about 4% of infants were enrolled in
regulated services. 12 See Oloman (2006)

74
• 1-4 years: about 22% of children were enrolled in either full-day or part-day care, provided mainly by QIAS (Quality Improvement and Accreditation System) approved private-for-profit long day care (full-time)centres (58%), QIAS approved community-based, non-profit, long day care centres (23%) and community-based, non-profit family day-care schemes (agencies) (18%).
• 4-6 years: early education services are provided through kindergartens or reception (preschool) classes generally attached to schools, for 6-hours daily, during school term. Attendance in the year before compulsory schooling (at 6 years) ranges from 80.4% in Western Australia to 96.3% in Queensland.
Child-staff ratios: child-staff ratios in long day-care centres are: 5:1 for children 0-2 years; 8:1 for children 2-3 years and 10:1 for children 3-6 years (however these ratios vary across States). In general, long day care centres are required (also depending on the State) to have one qualified staff for every 20-25 children.
Staff Qualifications: Staff are not necessarily qualified. The staffing of ECEC varies according to the regulatory requirements of each state and territory. In general, non-school services (child care centres) employ a mix of trained (often two-year vocational) and untrained staff. In the case of family day-care, contact staff (family care providers) are not required to have a qualification, other than a First Aid diploma. In Long Day Care Centres, the need to minimise staff costs so as to limit fee increases has worked against the employment of qualified staff, whenever such staff are not a regulatory requirement. Although they may have longer hours, greater responsibility, fewer holiday and less planning time than teachers, the status and pay of staff in non-school services is low. Turnover rates are high and difficulties in recruiting staff are reported. Men are hardly represented in care services (3.3%) or pre-school (2.3%). In pre-schools, a teaching qualification is required, but not necessarily with an early childhood specialisation. A teaching qualification normally requires a 3 or 4-year university degree. The Commonwealth (federal) and State (provincial/territorial) governments fund a limited number of in-service hours for teachers and staff in the non-school sector, but child care staff report a lack of opportunity for professional development, due to the difficulty of being released from their jobs.
In relation to long day care services (including family day care); multifunctional services and multifunctional Aboriginal services; some occasional care centres; and outside school hours care responsibility for policy and funding is held by the Commonwealth (federal government) as child care has traditionally been seen as an issue of employment and family support, which in Australia is a Commonwealth responsibility.
Pre-school education (for children 4 and 5), is considered the responsibility of the State Governments, although the Commonwealth Government exerts a strong influence through national agenda setting, and provides supplementary funding for indigenous children and children with disabilities. States and Territories are primarily responsible for policy and funding in relation to preschools, schools, and some occasional care centres and they are responsible for regulating and monitoring all services for children under school age.

75
The quality improvement and accreditation system (QIAS) was established to address quality issues in long-day services and now includes accreditation of family day care schemes and outside school hours care services. It is administered by the National Childcare Accreditation Council. QIAS is unique because it is the first quality assurance program for children’s services to be linked to child care funding through legislation and supported by a federal government. Centres undergo both self and external review of their performance in relation to 52 principles and are accredited for between one and three years. The QIAS has recently been reviewed and the system is now more streamlined and said to reduce the administrative effort of centres while retaining quality assurance and continuous improvement. All three QA systems (for centre, family and out of school services follow the same five steps to quality care:
1. Registration 2. Self-study and Continuing Improvement 3. Validation 4. Moderation 5. Accreditation Decision
Each QA system encourages the collective participation of management, staff and families, working together to ensure positive outcomes for children. (Stonehouse, 1997).In the education sector (preschools), a major emphasis is on learning outcomes, especially literacy and numeracy skills, which are seen as vital for equity reasons and for future labour market participation.
The OECD reported “that the low pay, low status and training levels of ECEC staff undermines quality, and may counterbalance the investments governments are making in the sector. In addition, attention was drawn to the poorer work conditions experienced by teachers and staff in the early childhood sector, compared to other education sectors.”
The OECD identified a number of policy concerns facing the provision of ECEC in Australia. These included the appropriateness and effectiveness of quality assurance systems and the impact of funding changes and privatisation in the long day care sector. Private sector investment in child care in Australia has been concurrent with an ideological shift by successive Commonwealth Governments from funding service providers to funding consumers. Accompanying this has been a shift from the construction of child care as a community service, to child care as a business. These policies have been contentious. Critics state that they have not only allowed the corporate sector to proliferate they have also undermined quality in non profit services. Many question the ethics of diverting Government funds to shareholder returns.Historically the culture of community based non-profit child care services has been to exceed the minimum expectations set by standards especially those related to child:staff ratios and staff qualifications and training. They also participated enthusiastically in accountability activities such as the Commonwealth’s regular census of services. They set the price for the cost of care and tended to keep the lid on it. Without the stability of operating grants to maintain quality they have faced difficult choices. Their fees had to increase or quality reducing cost cutting had to take place. Both of these tensions have weakened the non-profit sector.
In June 1991, community-based non-profit centres provided 52% of all centre-based places. As of June 1998, they provided only 27%. More than three-quarters of all child care places are now in private for-profit centres.

76
Commercial providers are generally found in high-income areas, where “customers” can bear high fees. They are less common in rural and remote parts of the country and less likely to provide places for children who are under two years old as the profit margins are less for this age group. With respect to quality there are serious criticisms of the failing of the accreditation system from within the industry. The fact that validation inspections are only made once every 2½ years, and extensive notice is given for those inspections, is seen as a major weakness ... a weakness that is being cynically exploited by corporate childcare companies. There are also allegations that to reduce staffing costs the commercial sector employs people who have
lesser qualification than regulations permit - that they have higher numbers of casual staff. It is also recognized that one of the unanticipated outcomes of the accreditation system is that the state monitoring systems have ‘relaxed’.

77
REFERENCES
Alchian, A., & Demsetz, H. (1972). Production, Information Costs, and Economic Organization. American Economic Review, LXII, 777-795.
Benedetti, S. (2006). Towards a Closer Working Relationship. Children in Europe: Managing the Mix: public and private sectors in early childhood services, Issue 11, Edinburgh.
Ben-Ner, A., & Van Hoomissen, T. (1992). An Empirical Investigation of the Joint Determination of the Size of the For-Profit, Nonprofit and Government Sectors. Annals of Public and Cooperative Economics, 63, 469-494.
Ben-Ner, A., & Gui, B. (1993). The Nonprofit Sector in the Mixed Economy. Ann Arbor, MI: The University of Michigan Press.
Ben-Ner, A. (1994). Who Benefits from the Nonprofit Sector? Reforming Law and Public Policy Towards Nonprofit Organizations. Yale Law Journal, 104(3), 731-62.
Blau, D. (2000). The Production of Quality in Child-Care Centers: Another Look. Applied Developmental Science. 4(3): 136-148. Lawrence Erlbaum Associates Publishers. Mahwah, N.J.
Blau, D.M., & Mocan, H.N. (2002). The Supply of Quality in Child Care Centers. The Review of Economics and Statistics, 84(3), 483-496.
Bourgon, L, Lavallée, C. et collabroateurs (2003) Échelle d’observation de la qualité educative: le service de garde préscolaire. Version utilisée dans l’enquête Grandir en qualité 2003. Québec: Ministère de la Famille et de l’Enfance, Gouvernement du Québec
Cleveland, G. and Krashinsky, M. (2004) Financing Early Learning and Child Care in Canada. Discussion Paper prepared for the Canadian Council on Social Development’s National Conference on Child Care in Canada, Winnipeg November 12-14, 2004.
Cleveland, G. and Krashinsky, M. (2006) “The Nonprofit Advantage: Producing Quality In Thick And Thin Child Care Markets” working paper.
Cohen, B. (2006). Private Commodity or Public Good. Children in Europe, Issue 11.
Damgaard, L. (2006). Outsourcing Early Childhood Services. Children in Europe, Issue 11.
Doherty, G., Friendly, M. & Forer, B. (2002). Child Care by Default or Design? An Exploration of Differences Between Non-profit and For-profit Canadian Child Care Centers Using the You Bet I Care! Data Sets. Occasional Paper No. 18, Childcare Resource and Research Unit, University of Toronto.
Easley, D., & O’Hara, M. (1986). Optimal Nonprofit Firms. In S. Rose-Ackerman, ed., The Economics of Nonprofit Institutions: Studies in Structure and Policy. New York: Oxford University Press.
Goelman H., Doherty, G., Lero D.S., LaGrange, A. & Tougas, J. (2000). You Bet I Care! Caring and Learning Environments: Quality in Child Care Centers Across Canada. Guelph: Center for Families, Work and Well-Being, University of Guelph.

78
Hall, M. H., Barr, C., Easwaramoorthy, M., Wojciech-Sokolowski, S., Salamon, L.M. (2005) The Canadian Nonprofit and Voluntary Sector in Comparative Perspective Ottawa: Imagine Canada
Hansmann, H. (1980). The Role of Nonprofit Enterprise. Yale Law Journal, 89, 835-898.
Hansmann, H. (1987). Economic Theories of Nonprofit Organization. In W.W. Powell, ed., The Nonprofit Sector: A Research Handbook. New Haven, CT: Yale University Press. 27-42.
Helburn, S.W. (ed.) (1995) Cost, Quality and Child Outcomes in Child Care Centers. Denver: Department of Economics, Center for Research and Social Policy, University of Colorado at Denver.
Institut de la Statistique du Québec (2004) Enquête Québécoise Sur La Qualité des Services de Garde Éducatifs. Québec: Gouvernement du Québec.
James, E. (1987). The Nonprofit Sector In Comparative Perspective. In W.W. Powell, ed., The Nonprofit Sector: A Research Handbook. New Haven, CT: Yale University Press. 397-415.
James, E. & Rose-Ackerman, S. (1986) The Nonprofit Enterprise In Market Economies. New York: Harwood Academic Publishers.
Japel, C., Tremblay, R., and Cote, S. (2004). Child Care Quality: Results from the Longitudinal Study of Child Development in Quebec (ELDEQ). IRPP “Choices” Series on Family Policy.
Kagan, S.L., & Newton, J.W. (1989). For-Profit and Nonprofit Child Care: Similarities and Differences. Young Children, November 1989, 4-10.
Kagan, S.L. (1991). Examining Profit and Nonprofit Child Care: An Odyssey of Quality and Auspices. Journal of Social Issues, 74(2), 87-104.
Keyserling, Mary Dublin. (1972). Windows On Daycare: A Report Based On The Findings Of Members Of The National Council Of Jewish Women On Day Care Needs And Services In Their Communities . National Council Of Jewish Women: New York.
Krashinsky, M. (1986). Transaction Costs and a Theory of the Nonprofit Organization. In S. Rose-Ackerman, ed., The Economics of Nonprofit Institutions: Studies in Structure and Policy. New York: Oxford University Press.
Krashinsky, M. (1990). Management Implications of Government Funding of Nonprofit Organizations: Views from the United States and Canada. Nonprofit Management and Leadership, 1(1), 39-53.
Krashinsky, M. (1998). Does Auspice Matter? The Case of Day Care for Children in Canada. In W.W. Powell & E. Clemens, eds., Private Action and the Public Good. New Haven, CT: Yale University Press.
Lyon, M.E. & Canning, P.M. (1999). Auspice, Location, Provincial Location and Funding of Day Care in Atlantic Canada: Relationships with Center Quality and Implications for Policy. Canadian Journal of Research in Early Childhood Education, 6(2), 139-152.
Marangos, A. and Plantenga, J. (2006). Introducing Market Forces. Children in Europe, Issue 11.
Martin, C. (2006)., Public Nursery Schooling Dominant. Children in Europe, Issue 11.

79
Mill, D., Bartlett, N. & White, D.R. (1997). Profit and nonprofit day care: A comparison of quality, caregiver behaviour, and structural features. Canadian Journal of Research in Early Childhood Education, 4(2), 45-53.
Mitchell, L. (2002). Differences Between Community Owned and Privately Owned Early Childhood Education and Care Centers: A Review of Evidence. New Zealand Council for Educational Research Occasional Paper 2002/2, downloaded from http://www.nzcer.org.nz/pdfs/11743.pdf
Mocan, H.N. (1997). Cost Functions, Efficiency, and Quality in Day Care Centers. The Journal of Human Resources, XXXII(4), 861-891.
Morris, J.R. & Helburn, S.W. (2000). Child Care Center Quality Differences: The Role of Profit Status, Client Preferences, and Trust. Nonprofit and Voluntary Sector Quarterly, 29(3), 377-399.
Nelson, R.R. & Krashinsky, M. (1973). Public Control and Organization of Day Care for Young Children. Public Policy, XXII(1), 53-75.
Newhouse, J. P. (1970). Towards a Theory of Nonprofit Institutions: An Economic Model of a Hospital. American Economic Review, LX, 64-74.
Oloman, Mab (2006) Learnings from Down Under: Australian Child Care. Briefing Note for CCAAC
Prentice, S. (1997). The Deficiencies of Commercial Day Care. Policy Options, January-February, 42-46.
Preston, A.E. (1993). Efficiency, Quality, and Social Externalities in the Provision of Day Care: Comparisons of Nonprofit and For-Profit Firms. The Journal of Productivity Analysis, 4, 165-182.
Ruopp, R. Travers, J, Glantz, F. & Coelen, C. (1979) Children at the Center: Summary Findings and Their Implications. Cambridge, MA: Abt Books
S.P.R. Associates. (1986). An Exploratory Review of Selected Issues in For-Profit Versus Not-For-Profit Child Care. A Final Report prepared for the Canadian Special Parliamentary Committee on Child Care.
Salamon, L.M. (1987). Partners in Public Service: The Scope and Theory of Government-Nonprofit Relations. In W.W. Powell, ed., The Nonprofit Sector: A Research Handbook. New Haven, CT: Yale University Press. 99-117.
Steinberg, R. (1986). Nonprofit Organizations and the Market. In W.W. Powell, ed., The Nonprofit Sector: A Research Handbook. New Haven, CT: Yale University Press. 118-138.
Steinberg, R. and B.H. Gray, “The Role of Nonprofit Enterprise in 1992: Hansmann Revisited.” Paper presented at the 1992 Annual Conference of the Association for Research on Nonprofit Organizations and Voluntary Action.
Weisbrod, B.A., 1975. “Toward a Theory of the Voluntary Sector in a Three-Sector Economy.” in E. Phelps, Altruism, Morality and Economic Theory, New York, Russell Sage Foundation, 171-95.
_______, 1988. The Nonprofit Economy. Harvard University Press, Cambridge, Massachusetts.

80
Whitebrook, M., Howes, C. & Phillips, D. (1989) Who Cares? Child Care Teachers and the Quality of Care in America: Final Report – National Child Care Staffing Study. Child Care Employee Project.
Williamson, O.E., 1975. Markets and Hierarchies: Analysis and Antitrust Implications. The Free Press, New York.
Young, D.R. (1981). Entrepreneurship and the Behavior of Nonprofit Organizations: Elements of a Theory. In M. White, ed., Nonprofit Firms in a Three-Sector Economy, Washington, DC: Urban Institute.

81
Appendix A: Provincial/Territorial Grant Programs in 1998
British Columbia had a wage grant, known as the Child Care Compensation Contribution Program, designed to increase the wages of staff in both nonprofit and commercial centers and to assist with additional costs of infant and toddler care. Average percent of center revenue from operating and wage grants = 8.9%. Average percent of center revenue from low-income fee subsidies = 38.5%.
Alberta had operating grants available equally to nonprofit and commercial centers ranging from $17 per child per month for children over 4.5 years to $58 per child per month for children less than 1 year old (these grants had been considerably more generous but were gradually phased out between 1995 and 1999). Average percent of center revenue from operating and wage grants = 7.5%. Average percent of center revenue from low-income fee subsidies = 36.2%.
Saskatchewan has, in effect, no commercial center-based child care; any commercial child care center would have to have a parent advisory committee and would not be permitted to take low-income subsidized children. Saskatchewan had both an operating grant and a wage grant for which only nonprofit centers were eligible. The operating grant ranged from $30 per child per month for toddlers to $40 per child per month for infants. The wage grant totaled $225 per staff member per month. Average percent of center revenue from operating and wage grants = 21.7%. Average percent of center revenue from low-income fee subsidies = 35%. Ontario had both an operating grant and a wage grant with nonprofit centers being differentially favoured. In 1998, eligible nonprofit centers received about $8,000 per staff member and eligible commercial centers received about $3,000 per staff member. Commercial centers had to be in operation before 1987 to be eligible for the direct operating grant component of the grant. Nonprofit centers had to be in operation prior to 1991 to be eligible for the wage grant component. Even eligible nonprofit centers receive wage assistance based on the number of staff employed in 1995. Commercial centers are not eligible for the wage grant. Average percent of center revenue from operating and wage grants = 16.6%. Average percent of center revenue from low-income fee subsidies = 34.1%.
Quebec had an operating grant, available only to nonprofit centers with a board of directors having a parent majority. There was also a grant designed to subsidize health and dental insurance for staff; this was available to both nonprofit and commercial centers. In 1997, Quebec began a major reform of child care financing and provision, with full-day kindergarten being available free of charge and full-day child care being available at $5 per day to parents with 4 year old children. Average percent of center revenue from operating and wage grants = 33%. Average percent of center revenue from low-income fee subsidies = 18.9%.
New Brunswick had no operating or wage enhancement grants to child care centers. Average percent of center revenue from government grants = 1.9%. Average percent of center revenue from low-income fee subsidies = 26.9%.
The Yukon Territory had operating grants available to both nonprofit and commercial child care centers, but only available to centers licensed before September 1995, or to centers replacing a closed center. Average percent of center revenue from operating and wage grants = n.a. Average percent of center revenue from low-income fee subsidies = n.a.

82
THIN MARKETS THICK MARKETS
VARIABLES FOR-PROFIT (means)
NONPROFIT (means)
DIFFERENCE (Non-Profit– For-Profit)
FOR-PROFIT (means)
NONPROFIT (means)
DIFFERENCE (Nonprofit – For-Profit)
ITERS/ECERS score (percent) 50.6 56.3 5.7 59.0 67.4 8.4**
Classroom Variables
Child-staff ratio (0-2 years) 3.5 2.5 - 1.0** 3.4 3.75 0.35
Child-staff ratio (3-5 years) 5.3 5.7 0.4 6.3 5.8 - 0.5
Group size (0-2 years) 5.3 6.1 0.8 6.7 8.0 1.3
Group size (3-5 years) 10.2 11.0 0.8 11.6 11.1 - 0.5
Square of group size 99.8 105.2 5.4 125.7 121.1 - 4.6
Teacher Variables
Training of main classroom teacher: ECE - none or less than one year (proportion)
0.20 0.18 - 0.02 0.19 0.12 -0.07
ECE – college certificate (1 year) 0.43 0.29 -0.14** 0.23 0.12 -0.11*
ECE – college diploma (2 or 3 years) 0.35 0.38 0.03 0.49 0.63 0.14*
ECE – post-college cert. 0.03 0.08 0.05 0.08 0.07 -0.01
ECE – university degree 0.00 0.06 0.06 0.02 0.08 0.06
Professional Development Training in last year (proportion)
0.65 0.83 0.18** 0.57 0.83 0.26**
Center Variables
Director - high school graduation or less (proportion)
0.15 0.08 -0.07 -0.07 0.08 0.04
Director - one, two or three years college 0.60 0.46 -0.14 0.75 0.63 -0.12
Director - post-college certificate 0.05 0.06 0.01 0.00 0.10 0.10**
Director - B.A. or more 0.20 0.39 0.19** 0.21 0.18 -0.03
Financial Resource Variables
Est. Revenue per FTE child $394.80 $523.92 $129.08** $482.94 $631.71 $148.77**
Child Variables
Number of FTE children in center 33.5 38.4 4.9 44.7 47.4 2.7
Percent of infants/toddlers 27.5 42.0 14.5** 26.4 35.8 9.4**
Percent of children in center receiving income-related subsidy
27.6 51.5 23.9** 42.2 38.1 -4.1
Percent of children with special needs 6.2 7.5 1.3 5.5 4.8 -0.7
Other Variables
Gross wage per hour – lead teacher $8.29 $10.71 $2.42** $9.79 $13.05 $3.26**
Percent of revenue supplied by government grants
2.55 11.67 9.12** 7.27 24.24 16.97**
Rent and/or utilities subsidized (proportion) 0.0 0.47 0.47** 0.02 0.42 0.40**
Monthly fee for child aged 3-5 $412.12 $429.18 $ 17.06 $452.91 $408.60 $44.31
Monthly fee for child aged 3-5, outside Quebec
$412.12 $429.18 $ 17.06 $474.46 $527.68 $53.22**
Sample size 40 112 53 120Notes: ** mean differences are significant at 5%, * mean differences are significant at 10%
Appendix B: Average Values of Key Variables in Thin and Thick Markets by Nonprofit Status, YBIC

83