Finalizing Oregon’s School and District Report …...Executive Summary The Oregon Department of...
13
FINALIZING OREGON’S SCHOOL AND DISTRICT REPORT CARDS Parent and Family Engagement Report Oregon Department of Education Abstract The Oregon Department of Education is redesigning school and district report cards. Researchers at the Oregon Department of Education conducted focus groups with parents and families who represent historically underserved student groups in order to create a final, data-driven, parent-friendly report card. This report synthesizes the feedback received from parent and family focus groups.
Transcript of Finalizing Oregon’s School and District Report …...Executive Summary The Oregon Department of...

FINALIZING OREGON’S SCHOOL AND DISTRICT REPORT CARDS
Parent and Family Engagement Report
Oregon Department of Education
Abstract The Oregon Department of Education is redesigning school and district report cards.
Researchers at the Oregon Department of Education conducted focus groups with parents and families who represent historically underserved student groups in order to
create a final, data-driven, parent-friendly report card. This report synthesizes the feedback received from parent and family focus groups.

Report Card Redesign: Focus Group Themes
1
A Special Thank You to Our Partners A sincere thank you to our partners for bringing together parents and families. The feedback we received was insightful, valuable, and directly served to inform the final version of our report
card. Organizations who helped make these conversations possible include:
Black Parent Initiative Migrant Parent Association
Title VI Indian Education Parent Advisory Committee Newberg School District
Salem-Keizer Coalition for Equality Self-Enhancement, Inc.
Woodburn School District Harney County School District
Burns Tribal Parent Group

Report Card Redesign: Focus Group Themes
2
Executive Summary The Oregon Department of Education (ODE) is redesigning school and district report cards. With the passage of the Every Student Succeeds Act (ESSA) in December of 2015, the ODE has an opportunity to make report cards more relevant to parents—especially parents from historically underserved communities. The ODE report card redesign team embarked on several rounds of parent and community engagement—both of which prioritized the voices of parents of students from historically underserved communities. Through the feedback of this first effort, the ODE developed a two-page At-A-Glance report card prototype. The ODE then embarked on a second round with eight focus groups in January and February of 2018, in order to refine and finalize the prototype. The second round of feedback revealed that parents liked the design of the prototype and found it easy to read. However, parents also provided constructive feedback that led to further refinement of the use of color, wording, and content. A final design was created in March of 2018 and submitted to the State Board of Education.
Introduction The Every Student Succeeds Act (ESSA) was passed in December of 2015 which encourages schools and educators to innovate and create systems that address local needs. In Oregon, student demographics are increasingly more diverse in race, ethnicity, and language. At the same time, persistent opportunity and achievement gaps remain between students from historically underserved communities and their white peers. Both in response to ESSA flexibility, and in recognition of the fact that the current education system has historically favored, and continues to privilege, white students over students of color, the Oregon Department of Education (ODE) launched a report card redesign project with the following goals:
• design a report card that is more accessible and meaningful to parents, especially parents from historically underserved communities;
• create a two-page At-A-Glance report designed specifically for parents; and • supplement the At-A-Glance report with a web-based “dashboard” that contains additional data on
schools, including all of the data required by law.
To achieve these goals, the Report Card Redesign team began community engagement efforts in the fall of 2017. The redesign team administered a web-based survey and held focus groups with parents and families from historically underserved communities. This first round of community engagement led to the development of a report card prototype called the At-A-Glance. Once the first prototype was developed, the ODE Report Card Redesign Team embarked on a second round of parent and family engagement in January of 2018 with parents of students from historically underserved communities. The goal of the second round of engagement was to refine and finalize the prototype. The final prototype design was completed March 13, 2018 and submitted to the State Board of Education. Pending State Board approval, the new At-A-Glance will be released to the public in October of 2018.
Background The report card redesign project prioritized parent and community engagement sessions that allowed the team to hear directly from parents and families who represent historically underserved student groups with the goal of creating a report card that is meaningful and accessible to all parents. To accomplish this, the Report Card Redesign project began with ODE staff traveling to 11 communities in September and

Report Card Redesign: Focus Group Themes
3
October of 2017 to meet with parents of students of color (African American, Hispanic and American Indian/Alaska Native) and parents of students in special populations (students with disabilities, students of migrant families, and students attending public charter schools). This first round of parent engagement resulted in more than a hundred parent participants. Parents were asked to talk about what they wanted to know about their child’s school; what information they needed on the school and district report cards; and what design preferences they had (based on three provided sample report cards). ODE staff collected and analyzed parent’s written and verbal feedback.
The ODE redesign team supplemented the parent focus groups with a web-based statewide survey open from mid-August through mid-October. This survey was available in both Spanish and English, and nearly six hundred Oregonians responded to the survey. While the survey respondants were primarily white and highly educated, the survey was broad enough to reveal some of the differences in the views of different groups. These distinctions and an Equity Lens helped to inform the analysis of the results.
The ODE Report Card Redesign team report on the first round of engagement can be found under “Report Card Redesign” on the ODE Rules and Policies, Every Student Succeeds Act page. Results from the first round of engagement revealed the following themes:
1. a desire to know more about how a school or district creates a welcoming, safe, and inclusive environment for all students and their families;
2. a design that is simple, multi-colored, and easy to read and understand; and 3. a report card that emphasizes progress through relevant and actionable, school-specific data.
The ODE Report Card Redesign team, together with an internal graphic designer, used the input from the first round engagement results to develop several prototypes for a new, more parent-friendly At-A-Glance report card.
Prototype Finalization Feedback Sessions During January and February of 2018 ODE staff conducted a second round of parent and stakeholder engagement with a continued focus on input from parents of students from historica underserved communities. Groups were recruited who had participated in the first round of engagement, and new groups were recruited through the help of staff members from the ODE Office of Equity and Inclusion. The purpose of this round of engagement was to receive parent input on the new At-A-Glance prototypes in order to arrive at a final design. Because the goal was to finalize the At-A-Glance in a relatively short period of time, the report card team used an iterative, continuous improvement approach, where focus groups were asked to examine increasingly refined versions of At-A-Glance prototypes and answer the following:
• Did we capture information that is meaningful to you as a parent? • What is difficult to understand? • What other feedback do you have for us about the prototypes?

Report Card Redesign: Focus Group Themes
4
In just two months, ODE staff met with parent groups, advisory committees, and presented the prototypes at conferences. Specifically, ODE staff met with eight groups of parents of students of color (African American, Hispanic, and American Indian/Alaska Native), five of which ODE staff had worked with in prior engagement sessions. The eight parent focus groups had a total of 64 parent participants—averaging eight parents per group with as few as five and as many as ten. The groups contained parents, grandparents, and family members with children in grades kindergarten through 12. A total of five parent focus groups were conducted in English and three were conducted with the help of a Spanish interpreter. ODE staff also gathered feedback from five advisory groups predominantly representing special populations and students of color (students with disabilities and students of migrant families). Finally, ODE staff also gathered feedback at two separate conferences—one of which was comprised largely of parents of students of color. In total, more than a hundred parents provided feedback on the report card finalization sessions.
Data Collection & Analysis Across all of the parent and stakeholder prototype finalization sessions, notes were taken to capture verbal feedback and participants were asked to provide written feedback. These notes were then analyzed in two phases using content analysis procedures. In the first phase, a research analyst conducted exploratory pre-coding to develop an initial list of important themes across all responses. After the initial themes were identified, the research analyst went back through the data and used a combination of focused-coding (looking for further evidence of the initial themes) and open-coding (to allow new themes to emerge). Once the data were analyzed and clear themes emerged, the results were used to inform a new version of a prototype and, using a continuous improvement approach; the new prototype was then presented to the remaining focus groups to gather more feedback until consensus was reached on a final version. A summary of the major themes is outlined below.
Results: Focus Group Themes Did we capture information that is meaningful to you as a parent? Theme: The At-A-Glance prototype contains interesting information that is easy to understand Overall, parents said that the prototypes were a big improvement from the current Oregon school and district report cards. Parents said they generally liked the information included, they liked the use of colors (with some exceptions, see next section), and they liked the use of charts and graphics. Parents liked the inclusion of school goals, state goals, and they liked the inclusion of a narrative section on “safe and welcoming environment”. The following quotes are illustrative of the general feedback:
I like the clear format of information with lots of color and easy to read facts. Good job! -Newberg Migrant Parent Group
I like [the prototype] it’s easier to understand. The graphs with percentages is more comprehensible. The information is good… -Parent from Community Advisory Group

Report Card Redesign: Focus Group Themes
5
Parents also said they thought the report card was well-organized and generally easy to understand.
What is difficult to understand? Despite the generally positive feedback the ODE received, there were also many helpful suggestions on how to improve the clarity, utility, and accessibility. Specifically, parents and stakeholders gave feedback about the use of color, language, and measures.
Theme 1: Color: Be mindful of what the colors signify While parents and stakeholders consistently told said they liked the use of more colors in the prototypes than were used historically on Oregon school and district report cards, they also consistently pointed out when the colors led to a lack of clarity, and when the colors seemed to indicate a relationship. For example, on the elementary and middle school report cards a dial was used to show low, average, and high growth. Each level had a different color—low was light pink, average was a medium pink tone, and high was a dark pink—and parents interpreted this as a key to other indicators on the At-A-Glance that contained the same colors (see Appendix 2). For example a member of the Burns Educator Parent Focus group said:
The first page was confusing. Why the same color for different pieces of info? What do each of the graphics represent? Each means different ideas but looks the same.
Additionally, on an early version of the prototype, demographic charts were multi-colored. Again, parents and stakeholders saw the demographics chart colors as a key to the rest of the At-A-Glance and then thought other charts that had that color were related to race/ethnicity rather than just the measure listed. For example, a member of the State Advisory Council for Special Education (SACSE) had this to say:
With color coding-watch for unintentional bias (red=below average and red=Native American).
And a member from Title VI Indian Education Parent Advisory Committee had this comment:
I like that it is colorful and labeled. I guess I didn’t really understand exactly what the back of the first page was trying to show with all of the different percent bars being different colors. On the side there was info in the same color as a nationality so which is it representing?
With each new prototype design (see Appendices 1-3), the Report Card Team worked with a graphic designer to respond directly to the color and design concerns of parents and stakeholders. The version submitted to the State Board utilized a different color scheme for demographics and dials than was used on other charts and graphics (see Appendix 3).

Report Card Redesign: Focus Group Themes
6
Theme 2: Language and Measurement: Add clear descriptions and detail The first prototypes developed contained charts and graphics with labels but it did not contain definitions (see Appendix 1). Additionally, some of the labels contained terms that were unfamiliar or unclear to parents (see Appendix 2). Parents and stakeholders consistently asked to provide clear, jargon-free definitions on each measure, and they provided guidance over types of language to use. They also requested that there not be too much text in definitions. For example a member of the American Indian, Alaska Native advisory committee said this:
Be sure all of the ‘info’ is either explained or clear enough to understand at a glance.
Aside from adding definitions, parents also wanted more numeric labels. The circle charts on the early prototypes only contained a numeric label indicating quantities for schools, while state average and amount of change from the previous year did not contain a numeric label. Parents and stakeholders said that providing numeric labels would add interest, context, and clarity to the At-A-Glance. For example, a parent from the Oregon Association for Comprehensive Education (OACE) conference had this to say:
I believe there still needs to be improvement. There needs to be added more explaining towards what each column means. What would be better is to add more of the percentage rates with colors and explain how it works briefly. There should be less text and just a brief explanation. Try explaining everything in small column but briefly, something clear.
A participant from the Burns Educator Parent Focus group said this:
Give the definition of regular attender and what things mean on the front page. The layout works and is visually appealing. It is much easier to understand but you need definitions. Friendlier. More exciting than the old one! Add percentages to the arrows and brown circle.
Finally, parents and stakeholders gave feedback about measures to include, measures they wish were included, and concerns about measures used. Most of the feedback received indicated that parents wanted to retain school goals, state goals, and a narrative section on “safe and welcoming environment” of a school. For example, a parent from Self-Enhancement Inc. said:
Explanation of the school goals, state goals, and safe environment is good to know about the school.
However, parents voiced concern over the quality of information that would go into the “safe and welcoming environment” section. Parents were also given a choice over whether they wanted three main measures on the front of the report card or six, and they overwhelmingly asked for six. Lastly, some parent focus groups liked the inclusion of narrative sections where schools and districts can add extra information about additional opportunities such as extracurricular activities, but parents wished
Report Card Redesign: Focus Group Themes
7
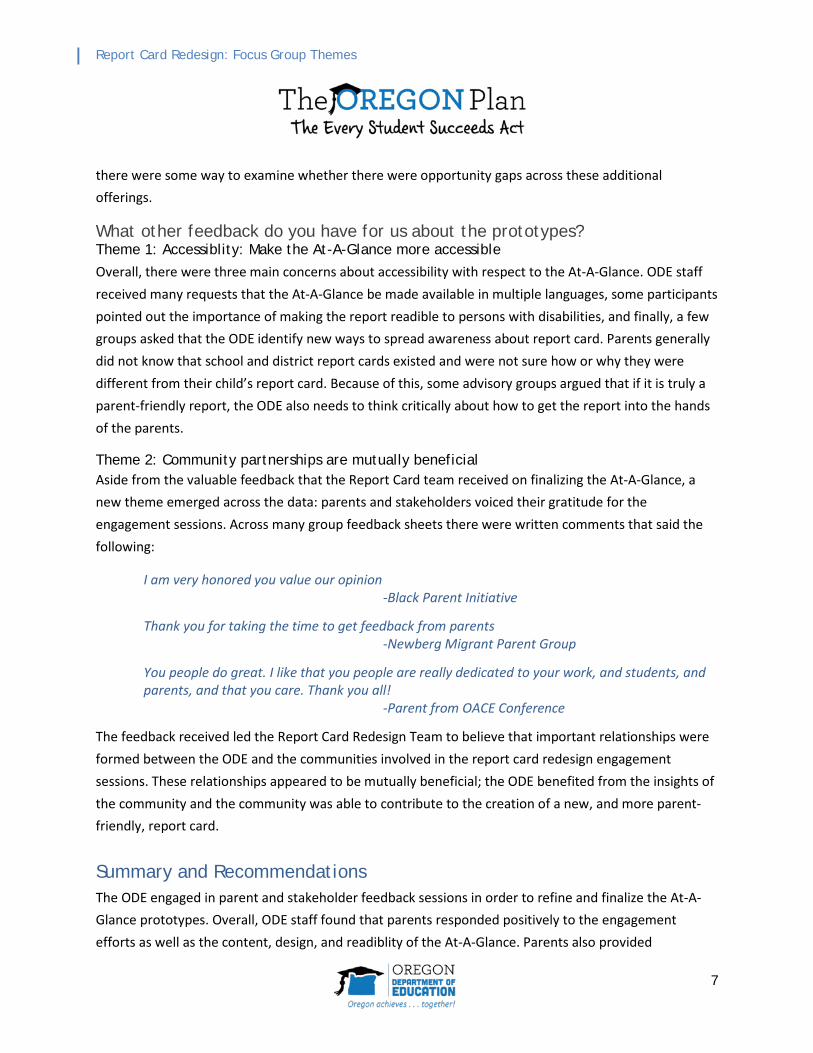
there were some way to examine whether there were opportunity gaps across these additional offerings.
What other feedback do you have for us about the prototypes? Theme 1: Accessiblity: Make the At-A-Glance more accessible Overall, there were three main concerns about accessibility with respect to the At-A-Glance. ODE staff received many requests that the At-A-Glance be made available in multiple languages, some participants pointed out the importance of making the report readible to persons with disabilities, and finally, a few groups asked that the ODE identify new ways to spread awareness about report card. Parents generally did not know that school and district report cards existed and were not sure how or why they were different from their child’s report card. Because of this, some advisory groups argued that if it is truly a parent-friendly report, the ODE also needs to think critically about how to get the report into the hands of the parents.
Theme 2: Community partnerships are mutually beneficial Aside from the valuable feedback that the Report Card team received on finalizing the At-A-Glance, a new theme emerged across the data: parents and stakeholders voiced their gratitude for the engagement sessions. Across many group feedback sheets there were written comments that said the following:
I am very honored you value our opinion -Black Parent Initiative
Thank you for taking the time to get feedback from parents -Newberg Migrant Parent Group
You people do great. I like that you people are really dedicated to your work, and students, and parents, and that you care. Thank you all!
-Parent from OACE Conference
The feedback received led the Report Card Redesign Team to believe that important relationships were formed between the ODE and the communities involved in the report card redesign engagement sessions. These relationships appeared to be mutually beneficial; the ODE benefited from the insights of the community and the community was able to contribute to the creation of a new, and more parent-friendly, report card.
Summary and Recommendations The ODE engaged in parent and stakeholder feedback sessions in order to refine and finalize the At-A-Glance prototypes. Overall, ODE staff found that parents responded positively to the engagement efforts as well as the content, design, and readiblity of the At-A-Glance. Parents also provided

Report Card Redesign: Focus Group Themes
8
constructive feedback. This feedback was incorporated throughout the engagement process until a finalized version was reached. The report card redesign team incorporated feedback in the following ways:
• Changed all colors so that colors used for demographics are not reflected in other graphs • Added labels to key measures using language requested by parents • Included state goals, school goals, and safe and welcoming environment to the front of the At-A-
Glance • Added numeric labels to graphs to provide more information about state performance • Added numeric labels to graphs to specify amount of change • Changed the way we displayed some of the data (demographic section) in order to add clarity
However, important tasks still remain. The ODE needs to address the accessibility issues raised by parents and stakeholders. Specifically, the ODE needs to determine the number of languages the At-A-Glance can be translated to and decisions need to be made on the best ways to make the report accessible to persons with disabilities. Finally, the ODE needs to examine their current distribution practices and work in coordination with the ODE communications team, ESD partners, and district partners, to identify and implement best practices to generate greater awareness of school and district report cards.

Report Card Redesign: Focus Group Themes
9
Appendix 1. Early Prototype 1: Front
Early Prototype 1: Back

Report Card Redesign: Focus Group Themes
10
Early Prototype 2: Front
Early Prototype 2: Back

Report Card Redesign: Focus Group Themes
11
Appendix 2. Intermediate Prototype: Front
Intermediate Prototype: Back

Report Card Redesign: Focus Group Themes
12
Appendix 3. Final Prototype: Front
Final Prototype: Back