Final_fy2013 Ctba Il Budget and Tax Primer
60
The Illinois State Bu dg et and Tax Primer March, 2013 70 East Lake Street, Suite 1700 Chicago, IL •60601 www.ctbaonline.org
-
Upload
reboot-illinois -
Category
Documents
-
view
222 -
download
0
Transcript of Final_fy2013 Ctba Il Budget and Tax Primer

7/28/2019 Final_fy2013 Ctba Il Budget and Tax Primer
http://slidepdf.com/reader/full/finalfy2013-ctba-il-budget-and-tax-primer 1/60
The Ill inois State Budgetand Tax Primer
March, 2013
70 East Lake Street, Suite 1700Chicago, IL •60601www.ctbaonline.org
7/28/2019 Final_fy2013 Ctba Il Budget and Tax Primer
http://slidepdf.com/reader/full/finalfy2013-ctba-il-budget-and-tax-primer 2/60
P a g e | i
©2013, Center for Tax and Budget Accountability
THE ILLINOIS STATE BUDGET
AND T AX PRIMER
Founded in 2000, the Center for Tax and Budget Accountability is a non-profit, bi-partisan research and advocacy
think tank committed to ensuring that tax, spending and economic policies are fair and just, and promoteopportunities for everyone, regardless of economic or social status.
CTBA uses a data-focused, bipartisan approach to work in partnership with legislators, community groups and otherorganizations to help change both public policy and perceptions.
FOR MORE INFORMATION:
Ralph M. Martire
Executive Director
(312) 332-1049
Robert Otter
Education and Fiscal Policy Analyst
(312) 332-2151
Amanda Kass
Policy Research Specialist,
Pensions and Local Government
(312) 332-1103
Jennifer R. Lozano
Research Associate
(312) 332-1348
Center for Tax and Budget Accountability
70 E. Lake Street, Suite 1700
Chicago, Illinois60601
Fax: (312) 578-9258
www.ctbaonline.org
7/28/2019 Final_fy2013 Ctba Il Budget and Tax Primer
http://slidepdf.com/reader/full/finalfy2013-ctba-il-budget-and-tax-primer 3/60
P a g e | ii
©2013, Center for Tax and Budget Accountability
THE ILLINOIS STATE BUDGET
AND T AX PRIMER
TABLE OF CONTENTS
Section 1 Why Care About the Illinois State General Fund Budget? ........................................................................... 1
Section 2 The Scope of the Current Problem ................................................................................................................... 1
Section 3 Key Terms ............................................................................................................................................................... 2
Section 4 How Illinois Stacks Up ........................................................................................................................................... 3
Section 5 The Illinois State Budget at a Glance ............................................................................................................... 7
Section 6 The FY2013 General Fund Budget ..................................................................................................................... 8
Sec tion 7 The Appropriation Process and New Developments in State Budgeting ................................................ 10
Section 8 FY2013 Service Appropriations at a Glance ................................................................................................. 12
Section 9 Spending Trends ................................................................................................................................................. 12
(a) Impact of Inflation ...................................................................................................................................... 12(b) Spending on Services in the FY2013 General Fund
Enac ted Budget C ompared to FY2000 .................................................................................................. 13
Section 10 Illinois’ FY2013 Operating and Ongoing Structural Deficits......................................................................... 14
(a) Ac cumulated Deficit ................................................................................................................................. 15(b) Illinois’ Structural Defic it ............................................................................................................................. 15(c) Looking Forward ......................................................................................................................................... 15
Sec tion 11 FY2013 Enac ted Budget Appropriations by Major Category .................................................................... 17
(a) Human Services .......................................................................................................................................... 17(b) FY2013 Education Appropriations............................................................................................................ 20(c) Higher Education ........................................................................................................................................ 24(d) Healthcare Overall ..................................................................................................................................... 25(e) Medicaid ...................................................................................................................................................... 27
(f) Repayment of Debt Owed to the PensionSystems Strains Existing Fiscal Resources ................................................................................................. 29
Sec tion 12 Bonds and Debt ................................................................................................................................................. 34
Sec tion 13 Illinois Taxes and Fees ........................................................................................................................................ 37
(a) Overview of Primary Revenues Sources Usedto Fund State and Local Governments Generally ............................................................................... 37
(b) The Elements of a Sounds, Modern Tax System..................................................................................... 39(c) Current Illinois Tax Policy is Inadequate to Satisfy the
Principles of Sound, Sustainable Taxation .............................................................................................. 40
Sec tion 14 Income Taxes in Illinois ....................................................................................................................................... 40
(a) Individual Income Tax ................................................................................................................................ 40
(b) As Designed, the Persona l Income Tax is Neither FairNor Responsive from a Tax Policy Standpoint ....................................................................................... 41(c) Corporate Income Tax .............................................................................................................................. 44
Sec tion 15 The Illinois Sales Tax ............................................................................................................................................ 44
7/28/2019 Final_fy2013 Ctba Il Budget and Tax Primer
http://slidepdf.com/reader/full/finalfy2013-ctba-il-budget-and-tax-primer 4/60
P a g e | iv
©2013, Center for Tax and Budget Accountability
Section 16 Other State Revenue Sources .......................................................................................................................... 47
(a) Overview ...................................................................................................................................................... 47(b) Cigarette Tax ............................................................................................................................................... 47(c) Liquor Taxes and Fees ................................................................................................................................ 47(d) Public Utility Taxes ....................................................................................................................................... 48(e) Lottery Transfers ........................................................................................................................................... 48(f) Riverboat Gambling Transfers .................................................................................................................. 49(g) Inheritance Tax ............................................................................................................................................ 49
(h) Insuranc e Taxes and Fees ......................................................................................................................... 49(i) Corporate Franchise Taxes and Fees...................................................................................................... 50(j) Investment Income .................................................................................................................................... 50(k) Federal Transfers ......................................................................................................................................... 51(l) Cook County Inter-Governmental Transfer ........................................................................................... 51
Sec tion 17 Local Government Revenue Sharing ............................................................................................................. 51
Sec tion 18 Tax Expenditures ................................................................................................................................................. 53
Endnotes .............................................................................................................................................................. 54
7/28/2019 Final_fy2013 Ctba Il Budget and Tax Primer
http://slidepdf.com/reader/full/finalfy2013-ctba-il-budget-and-tax-primer 5/60
©2013, Center for Tax and Budget Accountability
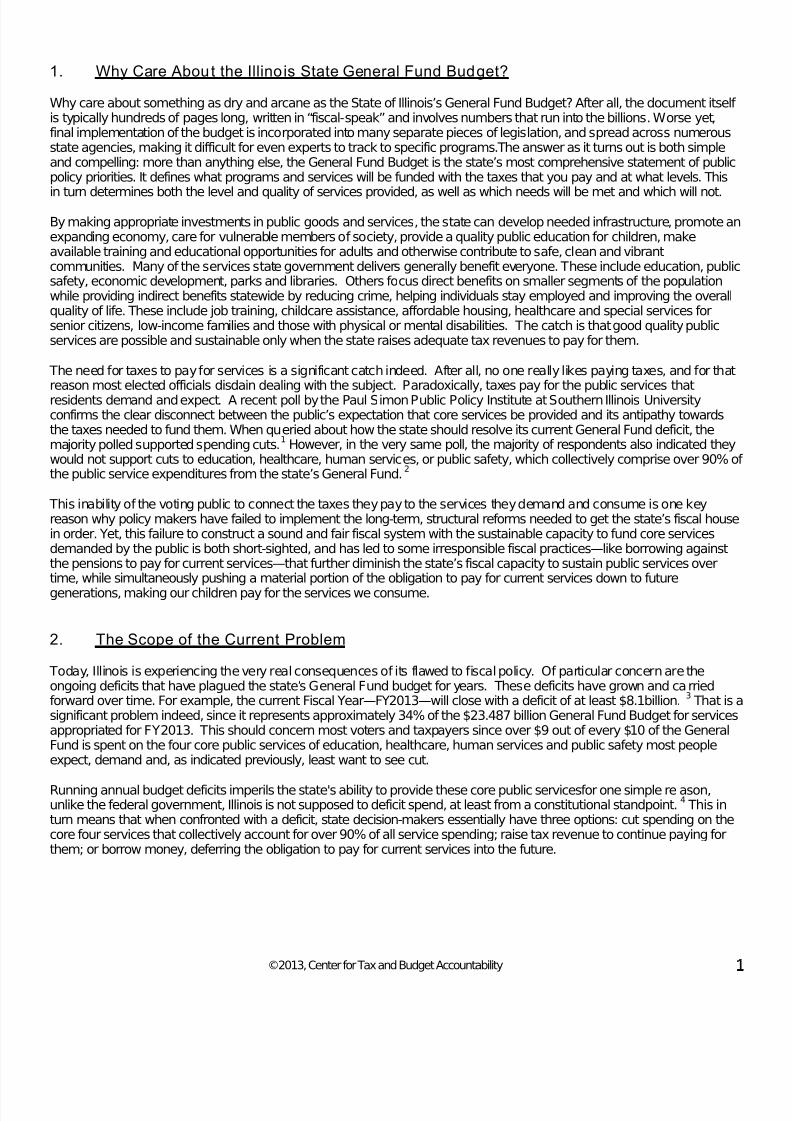
1. Why Care About the Illinois State General Fund Budget?
Why care about something as dry and arcane as the State of Illinois’s General Fund Budget? After all, the document itself is typically hundreds of pages long, written in “fiscal-speak” and involves numbers that run into the billions. Worse yet,final implementation of the budget is incorporated into many separate pieces of legislation, and spread across numerousstate agencies, making it difficult for even experts to track to specific programs.The answer as it turns out is both simpleand compelling: more than anything else, the General Fund Budget is the state’s most comprehensive statement of publicpolicy priorities. It defines what programs and services will be funded with the taxes that you pay and at what levels. This
in turn determines both the level and quality of services provided, as well as which needs will be met and which will not.
By making appropriate investments in public goods and services, the state can develop needed infrastructure, promote anexpanding economy, care for vulnerable members of society, provide a quality public education for children, makeavailable training and educational opportunities for adults and otherwise contribute to safe, clean and vibrantcommunities. Many of the services state government delivers generally benefit everyone. These include education, publicsafety, economic development, parks and libraries. Others focus direct benefits on smaller segments of the populationwhile providing indirect benefits statewide by reducing crime, helping individuals stay employed and improving the overallquality of life. These include job training, childcare assistance, affordable housing, healthcare and special services forsenior citizens, low-income families and those with physical or mental disabilities. The catch is that good quality publicservices are possible and sustainable only when the state raises adequate tax revenues to pay for them.
The need for taxes to pay for services is a significant catch indeed. After all, no one really likes paying taxes, and for thatreason most elected officials disdain dealing with the subject. Paradoxically, taxes pay for the public services thatresidents demand and expect. A recent poll by the Paul Simon Public Policy Institute at Southern Illinois Universityconfirms the clear disconnect between the public’s expectation that core services be provided and its antipathy towardsthe taxes needed to fund them. When queried about how the state should resolve its current General Fund deficit, themajority polled supported spending cuts.
1However, in the very same poll, the majority of respondents also indicated they
would not support cuts to education, healthcare, human services, or public safety, which collectively comprise over 90% othe public service expenditures from the state’s General Fund.
2
This inability of the voting public to connect the taxes they pay to the services they demand and consume is one keyreason why policy makers have failed to implement the long-term, structural reforms needed to get the state’s fiscal housein order. Yet, this failure to construct a sound and fair fiscal system with the sustainable capacity to fund core servicesdemanded by the public is both short-sighted, and has led to some irresponsible fiscal practices—like borrowing againstthe pensions to pay for current services—that further diminish the state’s fiscal capacity to sustain public services overtime, while simultaneously pushing a material portion of the obligation to pay for current services down to future
generations, making our children pay for the services we consume.
2. The Scope of the Current Problem
Today, Illinois is experiencing the very real consequences of its flawed to fiscal policy. Of particular concern are theongoing deficits that have plagued the state’s General Fund budget for years. These deficits have grown and carriedforward over time. For example, the current Fiscal Year—FY2013—will close with a deficit of at least $8.1billion.
3
Running annual budget deficits imperils the state's ability to provide these core public servicesfor one simple reason,unlike the federal government, Illinois is not supposed to deficit spend, at least from a constitutional standpoint.
That is asignificant problem indeed, since it represents approximately 34% of the $23.487 billion General Fund Budget for servicesappropriated for FY2013. This should concern most voters and taxpayers since over $9 out of every $10 of the GeneralFund is spent on the four core public services of education, healthcare, human services and public safety most peopleexpect, demand and, as indicated previously, least want to see cut.
4This in
turn means that when confronted with a deficit, state decision-makers essentially have three options: cut spending on thecore four services that collectively account for over 90% of all service spending; raise tax revenue to continue paying forthem; or borrow money, deferring the obligation to pay for current services into the future.
7/28/2019 Final_fy2013 Ctba Il Budget and Tax Primer
http://slidepdf.com/reader/full/finalfy2013-ctba-il-budget-and-tax-primer 6/60
©2013, Center for Tax and Budget Accountability 2
Over the years, Illinois has increasingly relied on the third option—debt—to cover the cost of funding current services. This is the equivalent of using a credit card to pay for groceries and other essentials and then rolling over that debt to nextmonth and repeating the process. Obviously, a persistent policy of borrowing money to provide current services is not justirresponsible—it is also unsustainable. Whatever is borrowed must be repaid—with interest. Moreover, the debtproceeds used to cover service delivery in a current fiscal year are one-time funds that are not available in following fiscalyears. Illinois has so over-relied on debt to fund services that bond rating agencies have recently been downgrading thecredit worthiness of Illinois as an issuer of debt, making it more expensive for the state to borrow.
There are times when it makes sense to incur debt to maintain important services. For instance, during recessionaryperiods, demand for core public services generally increases while revenues decline. This is diametrically opposed towhat typically happens in the private sector, when increased demand for the products or services sold by a business areaccompanied by increased revenue as that business sells more. Hence, the public sector frequently faces a dilemma thathe private sector does. Moreover, in the private sector, businesses, which have the obligation to remain profitable,respond to declining revenues and demand by cutting back on production and workers. During recessions and periods of declining revenues, the public sector cannot choose to stop educating children, turn loose prisoners, or stop patrollingstreets and putting out fires. In fact, demand for basic services increases during recessions. The choices outside of service cuts are either to borrow money or raise taxes – the latter being especially problematic given taxpayers are copingwith their own financial difficulties. Even when it makes sense to cut some services, the cuts need to be made judiciously
This is because spending cuts may create adverse unintended consequences. This is especially the case if the servicecuts are not made up for by other units of government. In that situation, reduced public sector spending usually reinforceseconomic losses across the state and makes the local effects of the recession even worse. Therefore, incurring limiteddebt to cover operational expenditures on basics like education, health, human services and public safety could makesome sense during poor economic times. That said, this option should be used sparingly, in limited amounts and during
very difficult economic situations, because it is simply not sustainable.
The debt Illinois state government has historically incurred to finance current service delivery has come primarily in threeforms. First, the state borrows money directly from financial institutions, and then uses the loan proceeds to cover thecost of delivering current services or payment of past-due obligations. This practice not only creates an unsustainable wayto fund services, but also misleads the public into believing they can have a greater level of services than what recurringtax revenue can support.
Second, for decades Illinois has borrowed against the five public employee pension systems5it is obligated to fund, by
diverting a portion of the state’s required pension contributions to instead fund current services. In effect, then, for morethan 30 years, Illinois used its pension systems much like a credit card, creating a significant unfunded pension liability,primarily to avoid either raising the tax revenue needed to maintain public service levels from one year to the next, orcutting spending on core services too severely.
6
Third, Illinois state government has delayed payments owed to many businesses that performed services for the state(primarily in the areas of healthcare and human services) from the fiscal year in which they were due to the next fiscalyear.This practice has so greatly increased in recent years that Illinois now ranks as the state with the greatest rate of latepayments to human service providers in the nation.
7
By delaying payments owed to providers, businesses becameinvoluntary lenders to Illinois government for the amount equal to the dollar value of the services they delivered. Thismakes it difficult for these businesses to remain solvent as they are denied the cash to meet payroll, cover rent andutilities and pay other operating costs.
3. Key Terms
This Primer is intended to provide a deeper understanding of the services and programs provided by the state, the inter-relationship of tax policy and spending, the state fiscal system, and the deep-seated challenges that force difficult choices
in resolving the state’s fiscal shortcomings.However, before delving into the budget itself, it will be helpful to define a fewkey terms that are part of the state’s budget process.
“ Appropriation” – An appropriation is simply the dollar amount of spending targeted to a specific program orservice in a given fiscal year. The General Assembly makes annual appropriations subject to the Governor’sapproval, veto or line-item reduction. The General Assembly may choose to override any of the preceding actionsthe Governor takes.
“Balanced Budget Requirement” – Article VIII Section 2 of the Illinois Constitution requires that the stateproduce a balanced budget each year. The specific constitutional language provides, “Appropriations for a fiscalyear shall not exceed funds estimated by the General Assembly to be available during that year.”
7/28/2019 Final_fy2013 Ctba Il Budget and Tax Primer
http://slidepdf.com/reader/full/finalfy2013-ctba-il-budget-and-tax-primer 7/60
©2013, Center for Tax and Budget Accountability
• This means the revenue forecast for a fiscal year must at least equal all budget appropriations for thatyear. Under state law, debt proceeds can be counted as ‘revenue’ for purposes of determiningwhether there is a balanced budget in a given fiscal year.
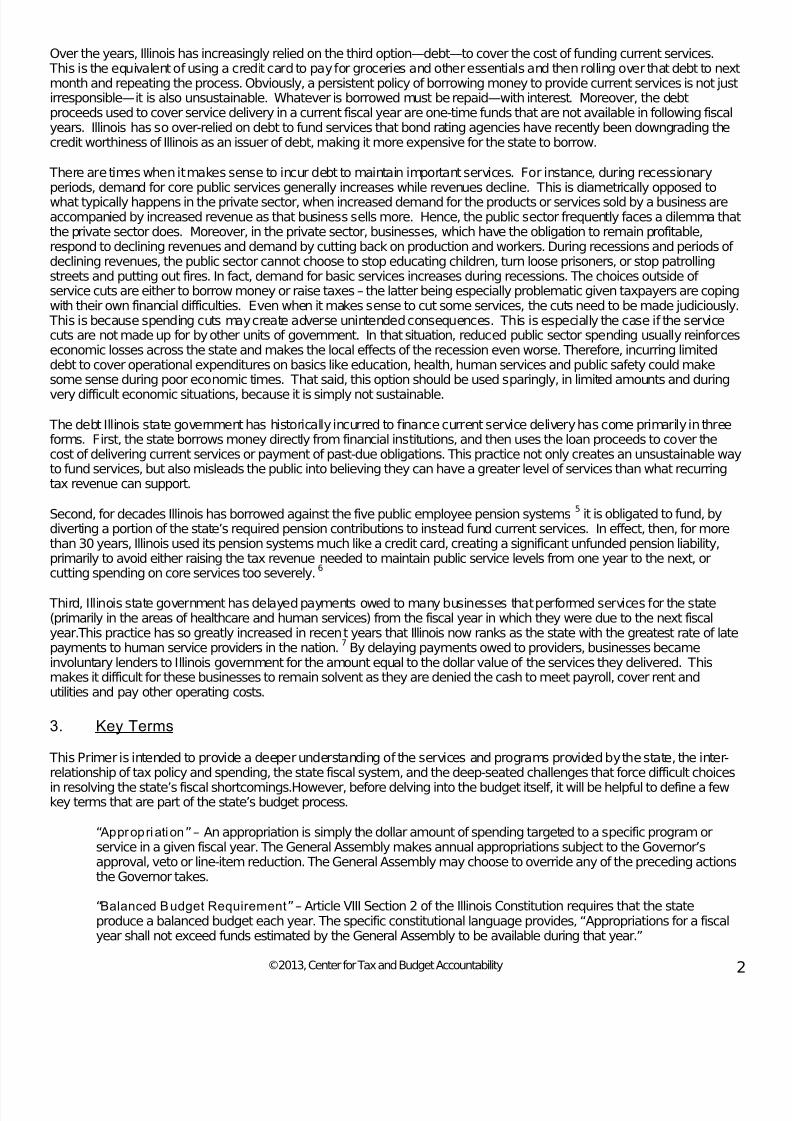
• Actually creating a balanced budget has eluded decision makers for decades. Consider, for instancethe accumulated deficit in the General Fund for the most recently completed fiscal year, FY2012, asshown in Figure 1.
FIGURE 1
FY2012 Accumulated Deficit($ Billions) Category Governor’s
ProposedBudget
(i) Projected FY2012 Revenue $33.17(ii) FY2012 Hard Costs $9.09(iii) Deficit Carry Forward from FY 2011 $8.600(iv) Net FY2012 General Fund Revenue
Available for Services $15.48(v) General Fund Service Appropriations in
FY2012 (Net of “Unspent Appropriations”) $24.491(vi) Accumulated FY2012 General Fund Deficit (-$9.01)
(vii) Deficit as a percentage of General FundService Appropriations -36.8%Source: COGFA FY 2013 Economic Forecast and Revenue Estimateand FY 2012 Revenue Update.
“Deficit” – There are two basic types of deficits. The first is an “Operating Deficit.” An operating deficit simplymeans that in a given fiscal year, government has committed to spend more in appropriations than it has inrevenue to support that spending. Determining whether there is an operating deficit can be complex. Forinstance, in addition to revenue generated from taxes and fees, many states—including Illinois—allow debtproceeds obtained from borrowings to count as “revenue” to support current spending. Obviously, if a state isborrowing to cover current spending, it does not have enough recurring revenue from taxes and fees. In reality,this is deficit spending, although it is not counted as deficit spending for budgeting purposes. Moreover, Illinois isentitled—by law— to defer certain payments from one fiscal year into the next (primarily for Medicaid but thereare other smaller allowances) that may make it appear as if the budget is balanced when in fact it is not.
8
The second type of deficit is a “structural deficit.” This simply means that, after adjusting for inflation andpopulation growth, and assuming a normal economy, the annual rate of revenue growth from the state’s mix of taxes and fees is insufficient to maintain service levels from one fiscal year into the next—even if no new servicesare added and no existing services are expanded.
“Revenue Earmark” – A revenue earmark is the designation of revenue from a specific source to spending on aspecific service. An example of earmarking in Illinois involves the net revenue the state collects from the Lottery(after paying winners and administrative/third party vendor costs) which is primarily earmarked to spending on K-12 education.
“Fiscal Year ” or “FY” – Illinois creates its annual budget on a fiscal, rather than calendar year basis, with eachfiscal year beginning on J uly 1 of a calendar year and continuing until J une 30 of the next calendar year. So thestate’s current fiscal year-FY2013-began on J uly 1, 2012, and will continue through J une 30, 2013.
4. How Illinois Stacks Up
It is also helpful to know how Illinois compares to other states in key areas, such as size of the economy, tax burden,spending on services, pension debt, etc. Following are some basic comparisons of how Illinois ranks nationally.
With 12,869,257 citizens, Illinois has the fifth largest population of any state.9
As shown in Figure 2, Illinois also has thefifth largest economy of any state, with a total state Gross Domestic Product (GDP) of $671 billion in 2011.

7/28/2019 Final_fy2013 Ctba Il Budget and Tax Primer
http://slidepdf.com/reader/full/finalfy2013-ctba-il-budget-and-tax-primer 8/60
©2013, Center for Tax and Budget Accountability
Figure 2Illinois GDP Compared to Other States
Real GDP by State
(millions of chained 2005 dollars)
All industry total
Area 2011 Rank
Vermont 22,968 50
Iowa 128,597 30Wisconsin 221,741 21
Indiana 240,933 17
Michigan 337,427 13
Illinois 582,094 5
California 1,735,360 1
Source: Bureau of Economic Analysis
That said, Illinois’ unemployment rate of 8.7% is significantly worse than most other states, as shows in Figure 3.
Figure 3Unemployment Rate and Rank by State
As of December 2012
State Unemployment Rank
NORTH DAKOTA 3.2% 1
IOWA 4.9% 4
WISCONSIN 6.6% 18
INDIANA 8.2% 37
ILLINOIS 8.7% 45
NEVADA 10.2% 50
Source: Bureau of Labor Statistics
Moreover, as Figure 4 shows, Illinois had the third lowest growth in real, inflation-adjusted GDP of all Midwestern states in2010, the first full year of recovery following the Great Recession.
Figure 4Real GDP Growth in 2010
Indiana 5.9%
Iowa 5.1%
Michigan 4.9%
Wisconsin 4.0%
Illinois 3.0%
Ohio 2.7%
Missouri 2.1%
Source: Bureau of Economic Analysis

7/28/2019 Final_fy2013 Ctba Il Budget and Tax Primer
http://slidepdf.com/reader/full/finalfy2013-ctba-il-budget-and-tax-primer 9/60
©2013, Center for Tax and Budget Accountability 5
This continues a long-term trend for Illinois. Note that, as Figure 5 shows, Illinois’ GDP growth lagged the nation and theMidwest from 1990-2007, the two decades preceding the Great Recession.
Figure 5GDP Growth 1990-2007
Source: Bureau of Economic Analysis, US Department of Commerce
Illinois is right about in the middle of the nation, with 22% of its children currently living in poverty, as shown in Figure 6.
Figure 6
Percentage of Children under the Age of 18 LivingBelow the 2011 Federal Poverty Line
Rank State Percentage
1 New Hampshire 12%
13 Iowa 17%
16 Wisconsin 18%
26 Illinois 22%
30 Indiana 23%
36 Michigan 25%
50 Mississippi 32%Source: Annie E. Casey Foundation Kids Count Database.
http://datacenter.kidscount.org/data/acrossstates/Rankings.aspx?by=a&order=a&ind=43&dtm=322&tf=867
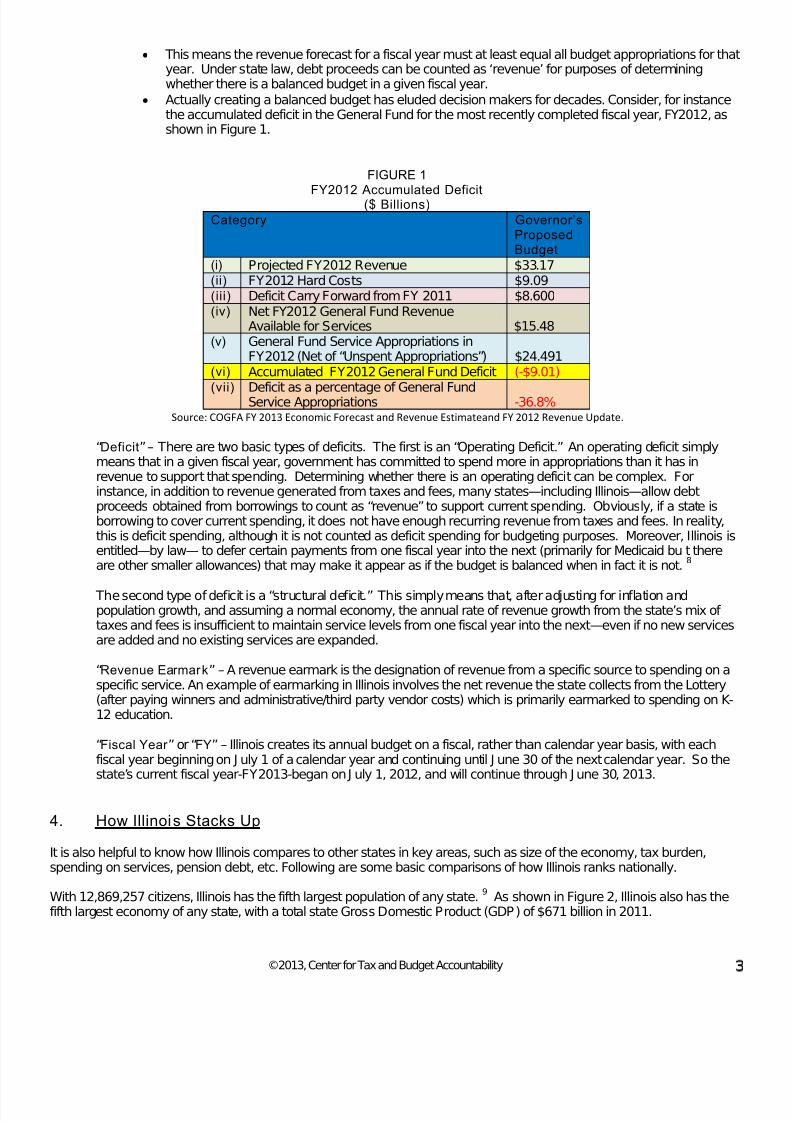
Given that Illinois has lagged the nation in economic growth and has had a worse unemployment rate than most otherstates, growth in personal income in Illinois has also fallen below most other states, as shows in Figure 7.
0.0%
10.0%
20.0%
30.0%
40.0%
50.0%
60.0%
70.0%
80.0%
US MidwestStates
Illinois
71.7%
49.4% 48.1%
7/28/2019 Final_fy2013 Ctba Il Budget and Tax Primer
http://slidepdf.com/reader/full/finalfy2013-ctba-il-budget-and-tax-primer 10/60
©2013, Center for Tax and Budget Accountability
Figure 7State Personal Income Growth and Rank
Third Quarter, 2012
StateQuarter-to-Quarter
ChangeRank
North Dakota 1.4% 1
Indiana 0.9% 4
Wisconsin 0.6% 21
Michigan 0.6% 22New Mexico 0.5% 28
Illinois 0.5% 32
South Dakota -1.6% 50
Source: US Department of Commerce - Bureau of Economic Analysis
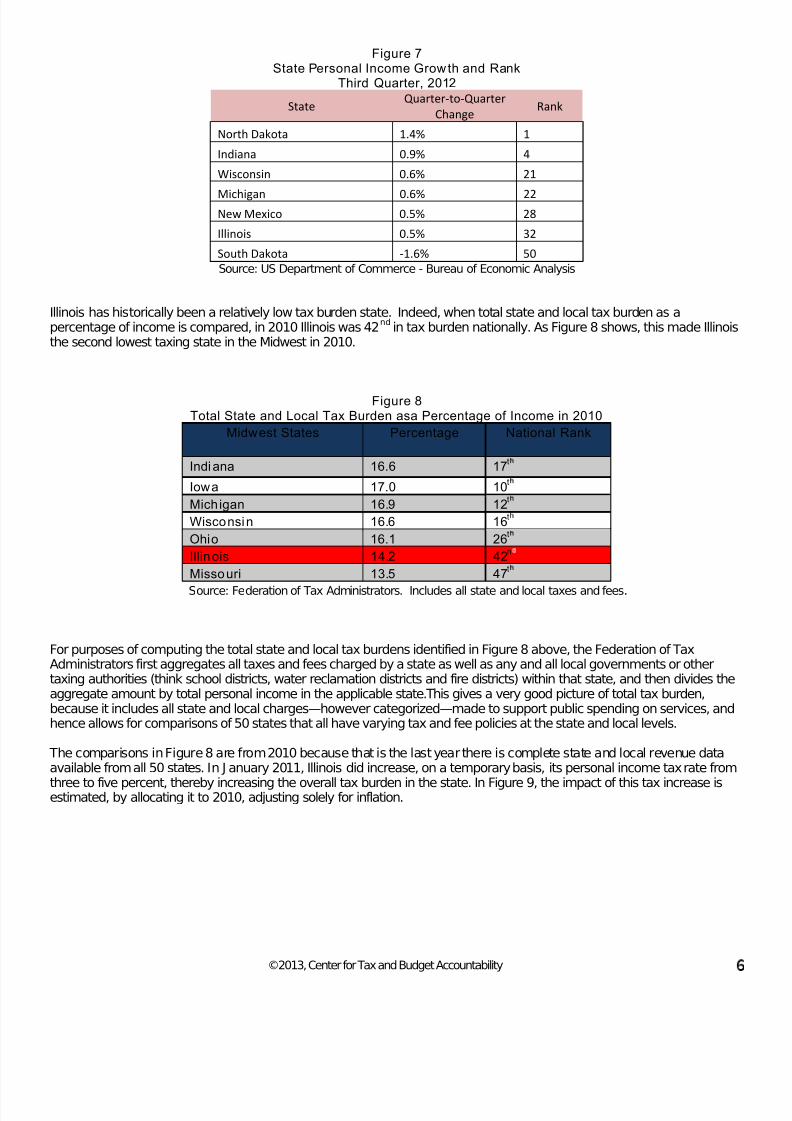
Illinois has historically been a relatively low tax burden state. Indeed, when total state and local tax burden as apercentage of income is compared, in 2010 Illinois was 42
ndin tax burden nationally. As Figure 8 shows, this made Illinois
the second lowest taxing state in the Midwest in 2010.
Figure 8Total State and Local Tax Burden asa Percentage of Income in 2010
Midwest States Percentage National Rank
Indiana 16.6 17t
Iowa 17.0 10t
Mich igan 16.9 12t
Wisconsin 16.6 16t
Ohio 16.1 26t
Illinois 14.2 42n
Missouri 13.5 47t
Source: Federation of Tax Administrators. Includes all state and local taxes and fees.
For purposes of computing the total state and local tax burdens identified in Figure 8 above, the Federation of TaxAdministrators first aggregates all taxes and fees charged by a state as well as any and all local governments or othertaxing authorities (think school districts, water reclamation districts and fire districts) within that state, and then divides theaggregate amount by total personal income in the applicable state.This gives a very good picture of total tax burden,because it includes all state and local charges—however categorized—made to support public spending on services, andhence allows for comparisons of 50 states that all have varying tax and fee policies at the state and local levels.
The comparisons in Figure 8 are from 2010 because that is the last year there is complete state and local revenue dataavailable from all 50 states. In J anuary 2011, Illinois did increase, on a temporary basis, its personal income tax rate from
three to five percent, thereby increasing the overall tax burden in the state. In Figure 9, the impact of this tax increase isestimated, by allocating it to 2010, adjusting solely for inflation.
7/28/2019 Final_fy2013 Ctba Il Budget and Tax Primer
http://slidepdf.com/reader/full/finalfy2013-ctba-il-budget-and-tax-primer 11/60
©2013, Center for Tax and Budget Accountability 7
Figure 9Total State and Local Tax Burden as a Percentage of Income in 2010
(with IL tax Increase)10
Midwest States Percentage National Rank
Indiana 16.6% 17t
Iowa 17.0% 10t
Mich igan 16.9% 12t
Wisconsin 16.6% 16t
Ohio 16.1% 26t
Illinois 16.3% 34t
Missour i 13.5% 47thSource: Federation of Tax Administrators. Includes all state and local taxes and fees.
5. The Illinois State Budget at a Glance
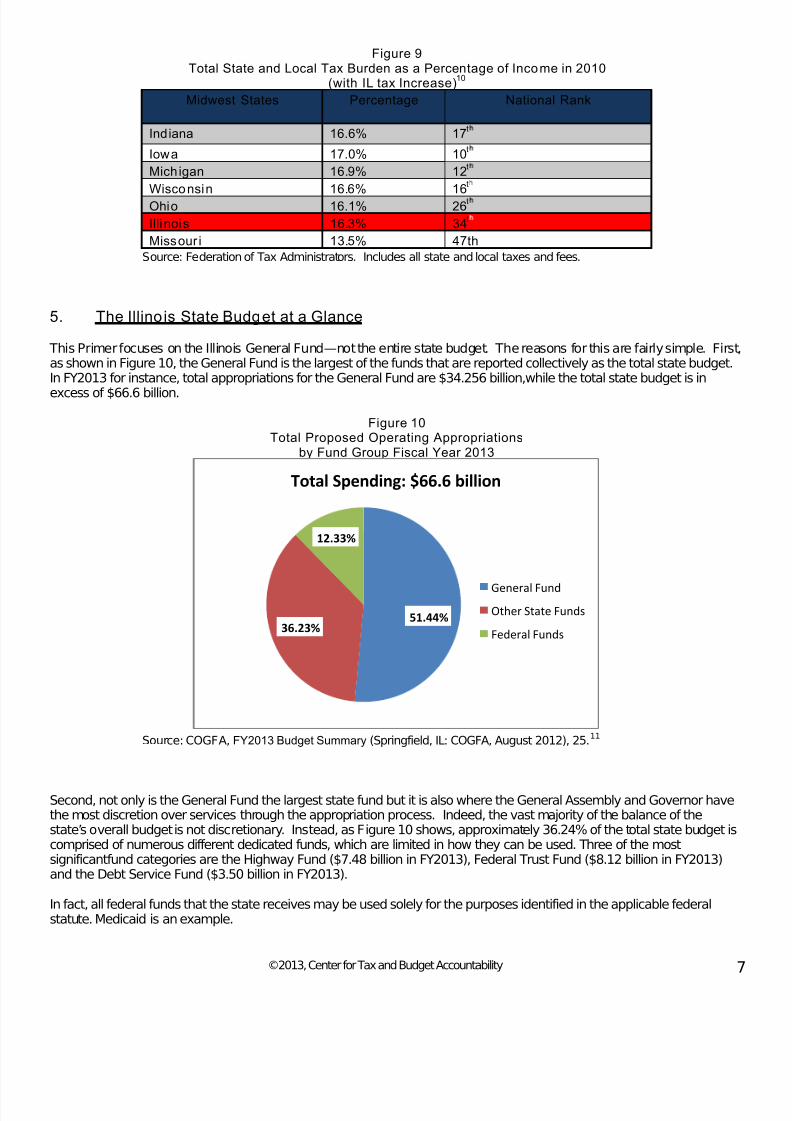
This Primer focuses on the Illinois General Fund—not the entire state budget. The reasons for this are fairly simple. Firstas shown in Figure 10, the General Fund is the largest of the funds that are reported collectively as the total state budget.In FY2013 for instance, total appropriations for the General Fund are $34.256 billion,while the total state budget is in
excess of $66.6 billion.
Figure 10Total Proposed Operating Appropriations
by Fund Group Fiscal Year 2013
Source: COGFA, FY2013 Budget Summary (Springfield, IL: COGFA, August 2012), 25.11
Second, not only is the General Fund the largest state fund but it is also where the General Assembly and Governor havethe most discretion over services through the appropriation process. Indeed, the vast majority of the balance of thestate’s overall budget is not discretionary. Instead, as Figure 10 shows, approximately 36.24% of the total state budget iscomprised of numerous different dedicated funds, which are limited in how they can be used. Three of the mostsignificantfund categories are the Highway Fund ($7.48 billion in FY2013), Federal Trust Fund ($8.12 billion in FY2013)and the Debt Service Fund ($3.50 billion in FY2013).
In fact, all federal funds that the state receives may be used solely for the purposes identified in the applicable federalstatute. Medicaid is an example.
51.44%36.23%
12.33%
Total Spending: $66.6 billion
General Fund
Other State Funds
Federal Funds
7/28/2019 Final_fy2013 Ctba Il Budget and Tax Primer
http://slidepdf.com/reader/full/finalfy2013-ctba-il-budget-and-tax-primer 12/60
©2013, Center for Tax and Budget Accountability
Following is a short summary of the other major fund categories that together with the General Fund collectively constitutethe total state budget:
Highway Fund –receive and distribute special assessments related to transportation, such as the motorfuel tax and fees from vehicle registrations. The Highway Funds support the construction andmaintenance of transportation facilities, roads and bridges.
Federal Trust Fund – are established pursuant to grants and contracts between the state and federalgovernments and are not subject to discretionary appropriation by state decision makers. Instead, thesefunds must be utilized solely for the specific purposes established by terms of the applicable federalgrant. Examples of Federal Trust Funds are Federal DisasterAid and GI Education.
Bond Fund –receive and administer the proceeds of various state bond issues.Bond funds primarily payfor work on capital projects as completed over time (like building construction), but in some instancesfinance other obligations of the state, such as the authorization for the sale of $7.56 billion in pensionobligation bonds made by the state over the FY2010 and FY2011 sequence, the proceeds of which wereused to cover the state’s pension contributions in those fiscal years.
12
Debt Service Fund –receive revenue from general taxes and fees and pay the various state debt serviceobligations due from time to time, including principal and interest, and covering both long and short-termborrowings.
Revolving Fund –pay for the operations of state agencies that render services to other state agencies ona cost reimbursement basis. Appropriation of these funds is dependent upon intra-governmental servicerequirements and funding from other state agencies. Examples include state printing and facilitiesmanagement.
State Trust Fund –are established by statute or under statutory authority for a specific purpose. Thesefunds ensure that required payments are made to recipients typically designated by statute orcourt/administrate order.
University Fund –are revenues such as fees and tuition. These funds are locally held and administeredby the state's public universities and are not subject to appropriation by the state.
Other Special State Fund –are various, smaller funds required to be identified and held in the State Treasury as "special funds" under Section 5 of the Finance Act, restricted in use to the specific purpose(sfor which they were created. There are over 700 of these special state funds that support activities asdiverse as medical assistance and environmental cleanup. They are, for the most part, designed assegregated accounts, restricted in use and funded from specifically earmarked revenue or fee sources.Examples include the Illinois Affordable Housing Trust Fund, the Youth Drug Abuse Prevention Fund andthe Brownfields Redevelopment Fund.
Third, over the past 30 years, the vast majority of the spending on services under the General Fund has gone to just fourcore service areas: education (35%), human services (21%), healthcare (30%) and public safety (5%). The balance of theGeneral Fund goes to services such as environmental protection, economic development and administrative costs. Sincethese are the services elected officials have used their discretion to spend your tax dollars to provide, the General Fundrepresents the most accurate statement of public policy priorities at the state level.
The General Fund itself is comprised of a number of other funds, including the General Revenue Fund, the CommonSchool Fund, the Education Assistance Fund and the General Revenue-Common School Special Account Fund, whichare primarily used for accounting purposes to ensure, for instance, that tax revenue earmarked for a specific serviceprovided under the General Fund is in fact used for that purpose.
Most of the proceeds generated from the three largest sources of state tax revenue--the personal income tax, corporate
income tax and sales tax--are deposited into the General Fund, and for the most part are used to cover the cost of providing the previously mentioned four core services.
6. The FY2013 General Fund Budget
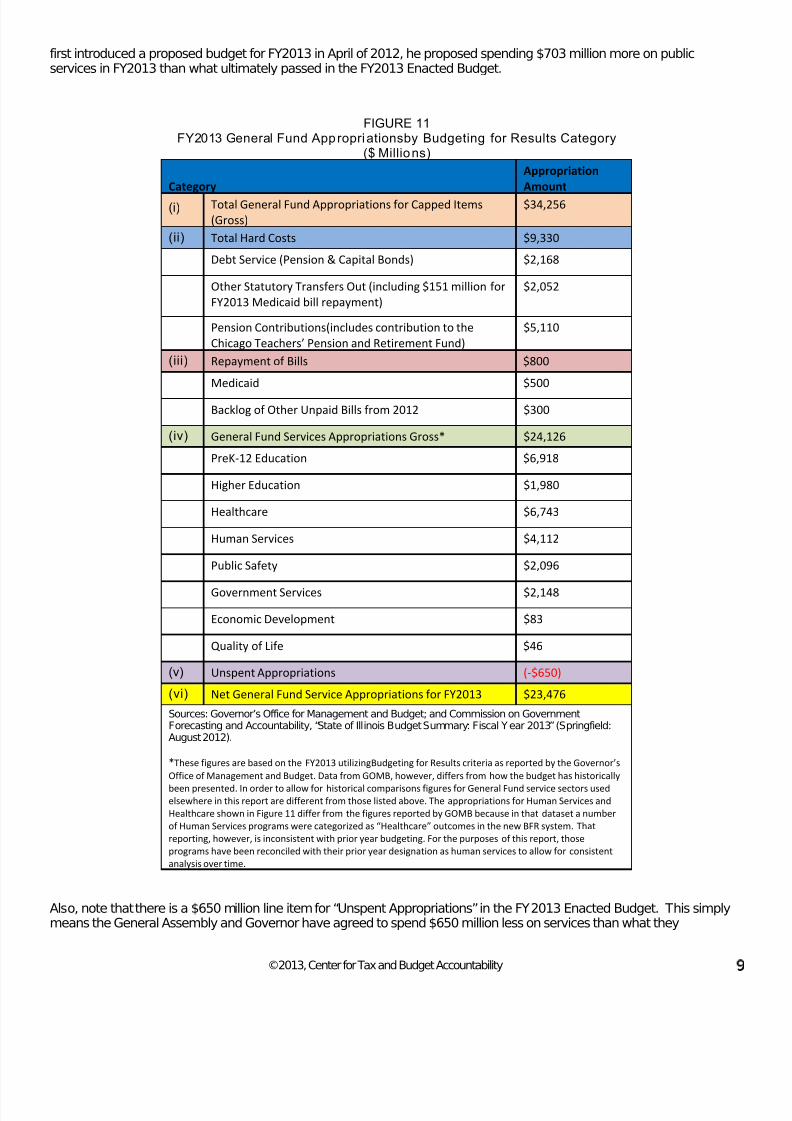
Figure 11 shows FY2013 General Fund budget appropriations by major service category as enacted (theFY2013Enacted Budget). The FY2013 Enacted Budget closely follows the spending plan initially detailed by the House of Representatives in House Resolution 706 (Enrolled), which passed on March 29, 2012 (the House Proposal). Under theHouse Proposal, a total of $23.458 billion would have been spent on current services in FY2013, while the FY2013Enacted Budget will spend $23.476 billion, or $18 million more than the House Proposal. Note that when the Governor
7/28/2019 Final_fy2013 Ctba Il Budget and Tax Primer
http://slidepdf.com/reader/full/finalfy2013-ctba-il-budget-and-tax-primer 13/60
©2013, Center for Tax and Budget Accountability
first introduced a proposed budget for FY2013 in April of 2012, he proposed spending $703 million more on publicservices in FY2013 than what ultimately passed in the FY2013 Enacted Budget.
FIGURE 11FY2013 General Fund Appropriationsby Budgeting for Results Category
($ Millions)
Category Appropriation
Amount
(i) Total General Fund Appropriations for Capped Items
(Gross) $34,256
(ii) Total Hard Costs $9,330
Debt Service (Pension & Capital Bonds) $2,168
Other Statutory Transfers Out (including $151 million for
FY2013 Medicaid bill repayment)
$2,052
Pension Contributions(includes contribution to the
Chicago Teachers’ Pension and Retirement Fund) $5,110
(iii) Repayment of Bills $800
Medicaid $500
Backlog of Other Unpaid Bills from 2012 $300
(iv) General Fund Services Appropriations Gross* $24,126
PreK-12 Education $6,918
Higher Education $1,980
Healthcare $6,743
Human Services $4,112
Public Safety $2,096
Government Services $2,148
Economic Development $83
Quality of Life $46
(v) Unspent Appropriations (-$650)
(vi) Net General Fund Service Appropriations for FY2013 $23,476
Sources: Governor’s Office for Management and Budget; and Commission on GovernmentForecasting and Accountability, “State of Illinois Budget Summary: Fiscal Year 2013” (Springfield:August 2012).
*These figures are based on the FY2013 utilizingBudgeting for Results criteria as reported by the Governor’s
Office of Management and Budget. Data from GOMB, however, differs from how the budget has historically
been presented. In order to allow for historical comparisons figures for General Fund service sectors usedelsewhere in this report are different from those listed above. The appropriations for Human Services and
Healthcare shown in Figure 11 differ from the figures reported by GOMB because in that dataset a number
of Human Services programs were categorized as “Healthcare” outcomes in the new BFR system. That
reporting, however, is inconsistent with prior year budgeting. For the purposes of this report, those
programs have been reconciled with their prior year designation as human services to allow for consistent
analysis over time.
Also, note that there is a $650 million line item for “Unspent Appropriations” in the FY2013 Enacted Budget. This simplymeans the General Assembly and Governor have agreed to spend $650 million less on services than what they
7/28/2019 Final_fy2013 Ctba Il Budget and Tax Primer
http://slidepdf.com/reader/full/finalfy2013-ctba-il-budget-and-tax-primer 14/60
©2013, Center for Tax and Budget Accountability 1
appropriated—but they have yet to determine where those cuts will be made. In effect, this means that the specificappropriation amounts identified for services in the FY2013 Enacted Budget are maximum potential appropriations, whichcollectively will be reduced by $650 million over the course of the Fiscal Year. Since the “Hard Costs” identified in Figure12 have to be paid by law, all spending cuts associated with the “Unspent Appropriation” line will have to come from thepublic service categories listed under item (iv) in Figure 11.
7. The Appropr iation Process and New Developments in State Budgeting
The appropriation process is the legislative mechanism through which state government expends the revenue it collects. Technically, making appropriations for services is a legislative function. However in Illinois, as in most other states, theinitial budget proposal for a fiscal year is usually drafted by the Governor’s office, with recommended appropriations byline item, and then submitted to the General Assembly for consideration and ultimately legislative action.
Prior to FY2013, the appropriation process in Illinois was done on a traditional, line item basis. The Governor’s Office of Management and the Budget (GOMB) would start with the current year’s line-item appropriations and suggest changes toeach line for the next fiscal year.These changes would be based on a combination of factors such as the Governor’spriorities, inflation-based cost growth, and the lobbying efforts of providers. On the plus side, this process created someyear-to-year predictability. On the downside, this incremental approach to making spending decisions rarely consideredthe state’s overall fiscal capacity or how delivery of one service was related to another.
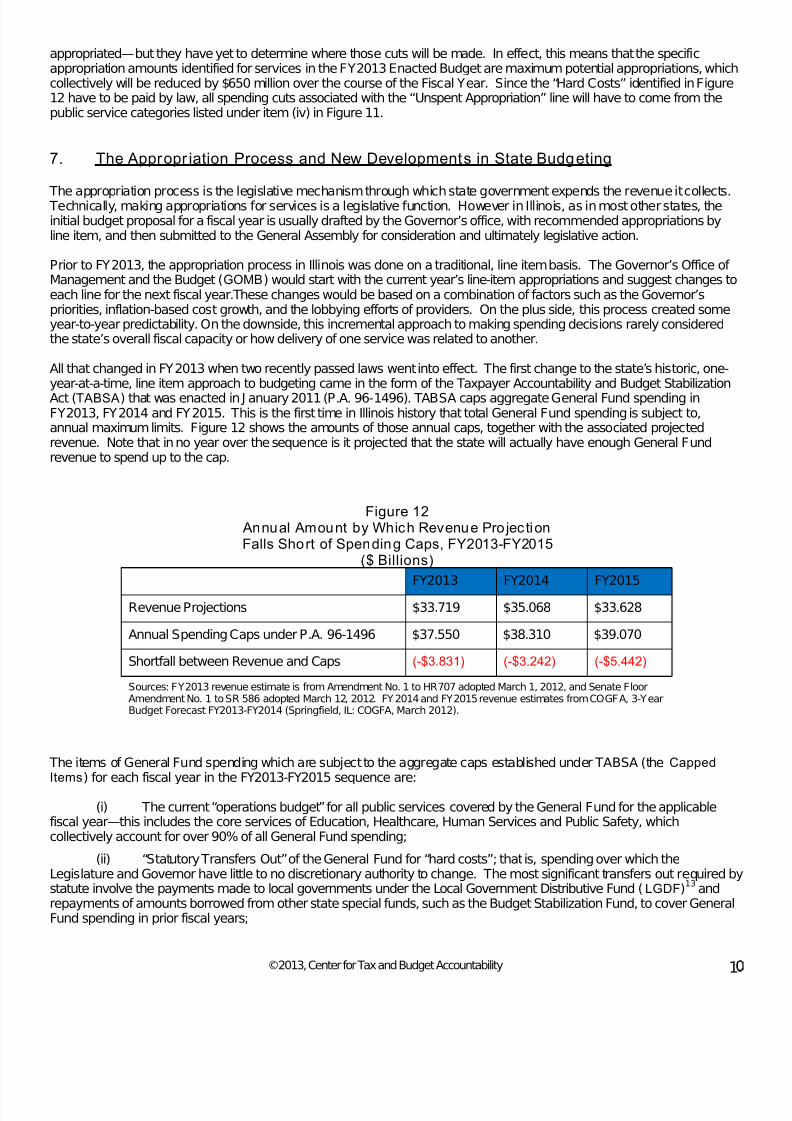
All that changed in FY2013 when two recently passed laws went into effect. The first change to the state’s historic, one-year-at-a-time, line item approach to budgeting came in the form of the Taxpayer Accountability and Budget StabilizationAct (TABSA) that was enacted in J anuary 2011 (P.A. 96-1496). TABSA caps aggregate General Fund spending inFY2013, FY2014 and FY2015. This is the first time in Illinois history that total General Fund spending is subject to,annual maximum limits. Figure 12 shows the amounts of those annual caps, together with the associated projectedrevenue. Note that in no year over the sequence is it projected that the state will actually have enough General Fundrevenue to spend up to the cap.
Figure 12 Annual Amount by Which Revenue ProjectionFalls Short of Spending Caps, FY2013-FY2015
($ Billions)
FY2013 FY2014 FY2015
Revenue Projections $33.719 $35.068 $33.628
Annual Spending Caps under P.A. 96-1496 $37.550 $38.310 $39.070
Shortfall between Revenue and Caps (-$3.831) (-$3.242) (-$5.442)
Sources: FY2013 revenue estimate is from Amendment No. 1 to HR707 adopted March 1, 2012, and Senate FloorAmendment No. 1 to SR 586 adopted March 12, 2012. FY2014 and FY2015 revenue estimates from COGFA, 3-YearBudget Forecast FY2013-FY2014 (Springfield, IL: COGFA, March 2012).
The items of General Fund spending which are subject to the aggregate caps established under TABSA (the CappedItems) for each fiscal year in the FY2013-FY2015 sequence are:
(i) The current “operations budget” for all public services covered by the General Fund for the applicablefiscal year—this includes the core services of Education, Healthcare, Human Services and Public Safety, whichcollectively account for over 90% of all General Fund spending;
(ii) “Statutory Transfers Out” of the General Fund for “hard costs”; that is, spending over which theLegislature and Governor have little to no discretionary authority to change. The most significant transfers out required bystatute involve the payments made to local governments under the Local Government Distributive Fund (LGDF)
13and
repayments of amounts borrowed from other state special funds, such as the Budget Stabilization Fund, to cover GeneralFund spending in prior fiscal years;

7/28/2019 Final_fy2013 Ctba Il Budget and Tax Primer
http://slidepdf.com/reader/full/finalfy2013-ctba-il-budget-and-tax-primer 15/60
©2013, Center for Tax and Budget Accountability 1
(iii) Other “hard costs” such as debt service owed to bond holders and financial institutions in the applicablefiscal year; and
(iv) Payment of all amounts owed to the five public pension systems for the applicable fiscal year.14
The second major legislative change to the state’s budgeting process that became fully effective in FY2013 came in theform of the Budgeting for Results Act (BFR), which was signed into law on J uly 1, 2010. BFR changes how General Fundappropriations are made and reported.
Thispayment to the five pension systems has two distinct components. First is the employer’s normal cost contribution neededto fund the future benefits of current workers, which is approximately $1.58 billion of the total $5.099 billion payment inFY2013. Second is the amortized portion of the repayment of the $83 billion in total pension debt that is due in FY2013,which is approximately $3.51 billion. It should be noted that the debt the state owes to the pension systems was built upover decades as lawmakers and governors from both parties chose to divert payments owed for employer pensioncontributions to instead cover the cost of state services. This practice essentially underfunded the state pension systems
to subsidize then current delivery of public services.This benefited taxpayers in the short term by allowing them toconsume public services without fully paying for those services. It also benefited elected officials politically by allowingthem to avoid both tax increases and the hard choices of picking which services to cut. However, those short-termbenefits resulted in significant long-term costs. Indeed, the price of repaying the pension debt incurred to reduce the costof past services is proving difficult to manage. More information on the state’s pension funding issues is contained inSection 11(f) of this Primer.
15
Among other things, BFR requires the Governor to make three-year projectionscovering both General Fund spending and revenue. BFR also requires GOMB to report proposed appropriations bycategory of service being rendered, as well as by the traditional method of department and agency. The initial sevenservice categories established pursuant to BFR by the Governor are:
(i) Education—Quality Education and Opportunities for Growth and Learning for all Illinois Students;(ii) Healthcare—Primarily Medicaid, but also Group Health Coverage for State Workers and Public Health
Functions;(iii) Human Services—Protection of the Most Vulnerable of our Residents;(iv) Public Safety—Protection of Citizens’ Lives and Property;(v) Economic Development—Enhanced Economic Well-Being of Residents;(vi) Quality of Life—Improved Quality of Life of Residents;(vii)Government Services—Improved Efficiency and Stability of State Government.
This new BFR methodology for categorizing public services complicates historical comparisons of service funding trends,because the new service categories do not fully comport with past practices.
From a practical standpoint, the Budgeting for Results Act makes several fundamental changes to the state’sappropriation process. The most significant of these changes is the new “results-based” budgeting process. This newprocess is intended to link data-driven outcome measures with program goals. The aim is to focus state spending themost effective program initiatives funded under each service category.
This is a significant departure from the past, line-item approach to budgeting utilized in Illinois. Under prior practice, theappropriation budgeted to an agency or program in the preceding fiscal year was used as the baseline for incrementalfunding changes in the current fiscal year. This incremental, line-item approach to budgeting frequently resulted in nearautomatic continuation of programs from year-to-year. Under BFR, that near automatic funding process ends, and isreplaced by setting an aggregate appropriation for the new service categories annually, and then divvying that aggregateappropriation up amongst programs that are best achieving the underlying service objectives, using a data-basedanalysis.
This change in process truly alters how spending decisions are made. Now, instead of starting with specific dollarexpenditures targeted to specific programs, decision makers first identify how much they have to spend, and then makethe policy decision to allocate portions of that total spending to significant service areas, say $6 billion to education and $4billion to social services and so on. Once the policy decision is made about how to divvy up spending by major servicecategory, decisions are then made about how much of a service category’s funding will be used for specific programs thatdeliver the outcomes desired within that service category. These program level spending decisions are supposed to bemade using data and evidence. Also, by grouping programs along common themes, BFR is expected to help root outredundancies and minimize overlap, leading to better coordination across agencies and more efficient and effective use ofstate resources.

7/28/2019 Final_fy2013 Ctba Il Budget and Tax Primer
http://slidepdf.com/reader/full/finalfy2013-ctba-il-budget-and-tax-primer 16/60
©2013, Center for Tax and Budget Accountability 12
Better performance metrics are expected to be developed over the course of succeeding budget cycles, and thesemetricshopefully will inform future appropriations decisions, by measuring program outcomes against the best in the class
That said,it willalso be important that the evaluation metrics address fundamental questions of capacity. For example, aprogram may not be successful simply because it lacks the resources to accomplish its mandate. Under thiscircumstance, inadequate results would not be due to programmatic flaws but rather inadequate funding levels. Hence,further funding cuts would be counterproductive.
8. FY2013 Service Appropr iations at a Glance
Figure 13 displays General Fund public service appropriations in FY2013 as a percentage of total service appropriationsfor the year. It does not include hard costs – costs that are not subject to the authority of the General Assembly andGovernor—and hence highlights the spending priorities of state decision makers.
Figure 13FY2013 Appropriations by Budgeting for Resultsas a Percentage
of Total General Fund Publi c Service Appropr iations(Total General Fund Publi c Service Appropriations = $24.1Billi on)
As Figure 13 shows, in the FY2013 proposed budget, 90.6% of General Fund public service appropriations are foreducation, healthcare, human services, and public safety. Medicaid currently is the biggest single state budget item andis appropriated across several budget categories, including Healthcare and human services.
9. Spending Trends
(a) Impact of Inflation. Frequently, government spending on services is measured solely by annual
changes in expenditures expressed in nominal dollars—that is, total dollars expended without adjusting for inflation.Of course, a nominal dollar comparison does not provide an accurate barometer of whether spending on services is actuallygrowing, staying flat or declining. That is because nominal dollar comparisons do not adjust for either inflation orpopulation growth, both of which make it more expensive to provide the same level of services from one fiscal year intothe next.
27.95%
28.67%8.90%
8.21%
8.69%
17.04%
0.34% 0.19%
Healthcare
Pre K-12 Education
Government Services
Higher Education
Public Safety
Human Services
Economic Development
Quality of Life
7/28/2019 Final_fy2013 Ctba Il Budget and Tax Primer
http://slidepdf.com/reader/full/finalfy2013-ctba-il-budget-and-tax-primer 17/60
©2013, Center for Tax and Budget Accountability 1
There are two major inflation metrics published by the Federal Bureau of Labor Statistics (BLS) that are used todetermine how much the cost of products and services increase over time. The first is the Consumer Price Index or “CPI”
The CPI is a comprehensive inflation measure that broadly covers the change in price for all goods and services in theeconomy. The CPI includes changes in the cost of everyday goods and services, like hair care products, toothpaste andbowling. State government, however, does not purchase most of the items covered by CPI. So while the CPI is anexcellent metric for evaluating the economy from the point of view of a typical consumer, it is not the best choice forevaluating public sector spending.
The second major inflation metric is the Employment Cost Index – Compensation “ECI-C”. As the name implies, the ECI-C is narrower than the CPI, and focuses on changes in the cost of total compensation for workers over time. Publicservices are very labor intensive. More than 80% of public sector expenditures made through the Illinois General Fundcover the compensation paid to the healthcare workers, teachers, police officers, social workers and other civil servantswho actually provide the public services consumed in communities across the state. Hence, the ECI-C is the moreaccurate metric for analyzing the inflationary cost increases that impact public sector expenditures on services.
The way inflation adjustments work over time is easy. Say expenditures on public safety were $100 in year one, and theinflation rate for that year was five percent. In year two, the appropriation for public safety would have to be $105 topurchase the same level of services provided in year one, in what is referred to as “real”—i.e. inflation-adjusted terms. If in year two public safety received an appropriation of $103, then despite the $3 increase in nominal appropriations, in realinflation-adjusted terms, there is actually a $2 cut in what can be delivered in services.
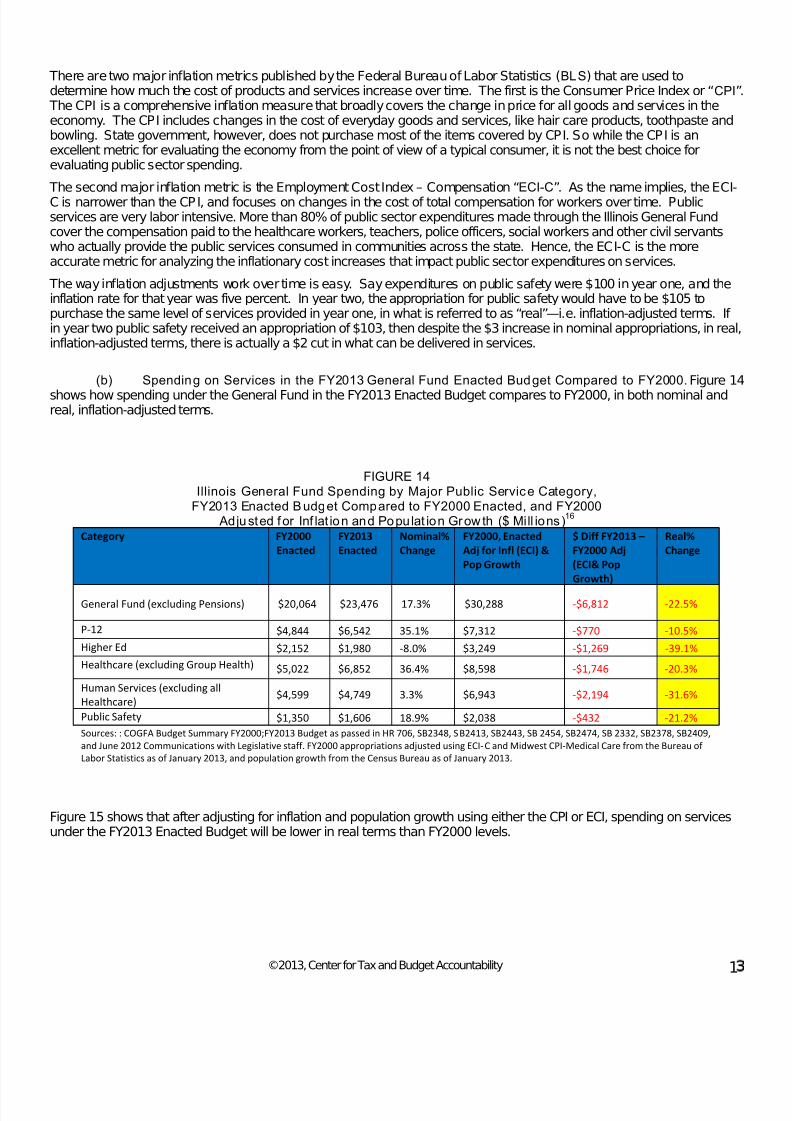
(b) Spending on Services in the FY2013 General Fund Enacted Budget Compared to FY2000. Figure 14
shows how spending under the General Fund in the FY2013 Enacted Budget compares to FY2000, in both nominal andreal, inflation-adjusted terms.
FIGURE 14Illinois General Fund Spending by Major Public Service Category,
FY2013 Enacted Budget Compared to FY2000 Enacted, and FY2000 Adjusted for Inf lat ion and Populat ion Grow th ($ Mill ions)
16
Category FY2000
Enacted
FY2013
Enacted
Nominal%
Change
FY2000, Enacted
Adj for Infl (ECI) &
Pop Growth
$ Diff FY2013 –
FY2000 Adj
(ECI& Pop
Growth)
Real%
Change
General Fund (excluding Pensions) $20,064 $23,476 17.3% $30,288 -$6,812 -22.5%
P-12 $4,844 $6,542 35.1% $7,312 -$770 -10.5%
Higher Ed $2,152 $1,980 -8.0% $3,249 -$1,269 -39.1%
Healthcare (excluding Group Health) $5,022 $6,852 36.4% $8,598 -$1,746 -20.3%
Human Services (excluding all
Healthcare)$4,599 $4,749 3.3% $6,943 -$2,194 -31.6%
Public Safety $1,350 $1,606 18.9% $2,038 -$432 -21.2%
Sources: : COGFA Budget Summary FY2000;FY2013 Budget as passed in HR 706, SB2348, SB2413, SB2443, SB 2454, SB2474, SB 2332, SB2378, SB2409,
and June 2012 Communications with Legislative staff. FY2000 appropriations adjusted using ECI-C and Midwest CPI-Medical Care from the Bureau of
Labor Statistics as of January 2013, and population growth from the Census Bureau as of January 2013.
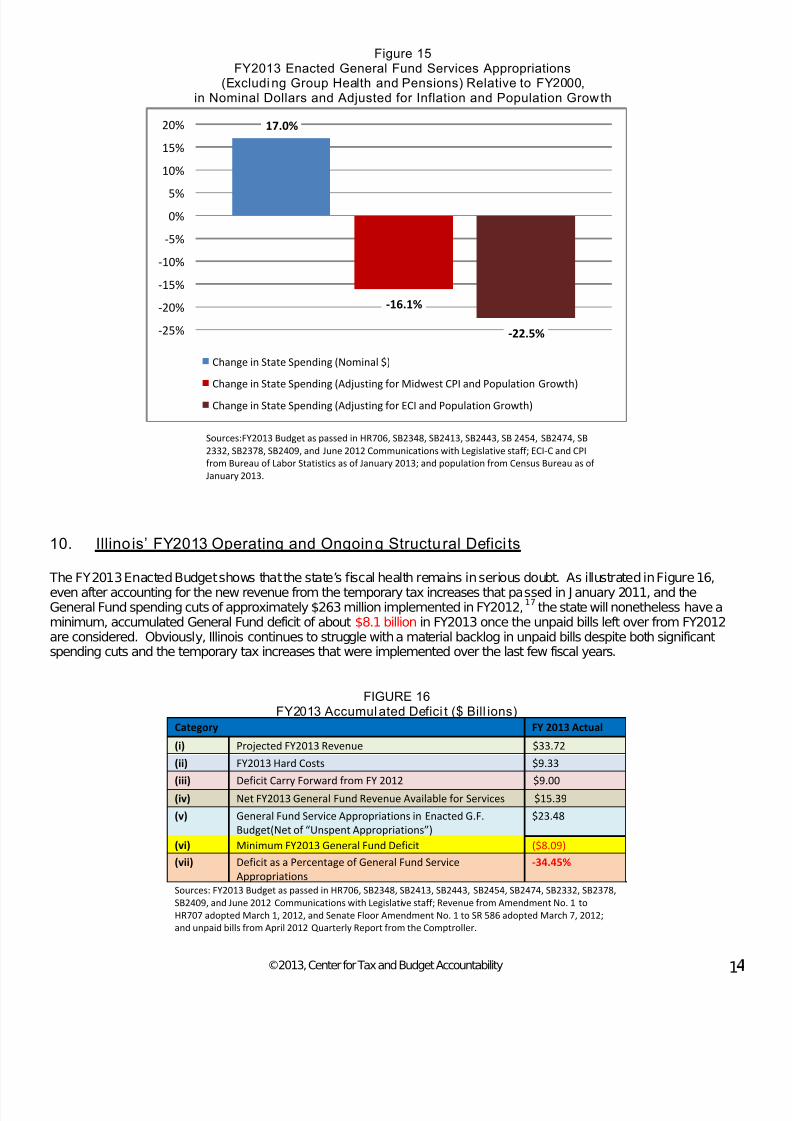
Figure 15 shows that after adjusting for inflation and population growth using either the CPI or ECI, spending on servicesunder the FY2013 Enacted Budget will be lower in real terms than FY2000 levels.
7/28/2019 Final_fy2013 Ctba Il Budget and Tax Primer
http://slidepdf.com/reader/full/finalfy2013-ctba-il-budget-and-tax-primer 18/60
©2013, Center for Tax and Budget Accountability 1
17.0%
-16.1%
-22.5%-25%
-20%
-15%
-10%
-5%
0%5%
10%
15%
20%
Change in State Spending (Nominal $)
Change in State Spending (Adjusting for Midwest CPI and Population Growth)
Change in State Spending (Adjusting for ECI and Population Growth)
Figure 15FY2013 Enacted General Fund Services Appropriations
(Excluding Group Health and Pensions) Relative to FY2000,in Nominal Dollars and Adjusted for Inflation and Population Growth
Sources:FY2013 Budget as passed in HR706, SB2348, SB2413, SB2443, SB 2454, SB2474, SB
2332, SB2378, SB2409, and June 2012 Communications with Legislative staff; ECI-C and CPI
from Bureau of Labor Statistics as of January 2013; and population from Census Bureau as of
January 2013.
10. Illinois’ FY2013 Operating and Ongoing Structural Defici ts
The FY2013 Enacted Budget shows that the state’s fiscal health remains in serious doubt. As illustrated in Figure 16,
even after accounting for the new revenue from the temporary tax increases that passed in J anuary 2011, and theGeneral Fund spending cuts of approximately $263 million implemented in FY2012,
17
the state will nonetheless have aminimum, accumulated General Fund deficit of about $8.1 billion in FY2013 once the unpaid bills left over from FY2012are considered. Obviously, Illinois continues to struggle with a material backlog in unpaid bills despite both significantspending cuts and the temporary tax increases that were implemented over the last few fiscal years.
FIGURE 16FY2013 Accumulated Defici t ($ Bill ions)
Category FY 2013 Actual
(i) Projected FY2013 Revenue $33.72
(ii) FY2013 Hard Costs $9.33
(iii) Deficit Carry Forward from FY 2012 $9.00(iv) Net FY2013 General Fund Revenue Available for Services $15.39
(v) General Fund Service Appropriations in Enacted G.F.
Budget(Net of “Unspent Appropriations”)
$23.48
(vi) Minimum FY2013 General Fund Deficit ($8.09)
(vii) Deficit as a Percentage of General Fund Service
Appropriations
-34.45%
Sources: FY2013 Budget as passed in HR706, SB2348, SB2413, SB2443, SB2454, SB2474, SB2332, SB2378,
SB2409, and June 2012 Communications with Legislative staff; Revenue from Amendment No. 1 to
HR707 adopted March 1, 2012, and Senate Floor Amendment No. 1 to SR 586 adopted March 7, 2012;
and unpaid bills from April 2012 Quarterly Report from the Comptroller.
7/28/2019 Final_fy2013 Ctba Il Budget and Tax Primer
http://slidepdf.com/reader/full/finalfy2013-ctba-il-budget-and-tax-primer 19/60
©2013, Center for Tax and Budget Accountability 15
(a) Accumulated Deficit . Figure 16 shows only the minimum, accumulated deficit for FY2013 for two keyreasons. First, the FY2013 Enacted Budget assumes that Group Health Insurance costs will be reduced by $260 millionfrom FY2012 levels. This may be difficult to attain, given that the average annual increase in healthcare inflation over thelast decade was 4.1%.
18
Second, Figure 17 assumes that the $1.6 billion in Medicaid service cuts, patient fee increases, and providerreimbursement rate reductions, and $1.1 billion inadditional revenue to pay past due Medicaid bills, are all fully realized.
This also may be difficult to attain since Illinois already has some of the lowest Medicaid provider reimbursement rates inthe nation, ranking seventh lowest of all 50 states,
19
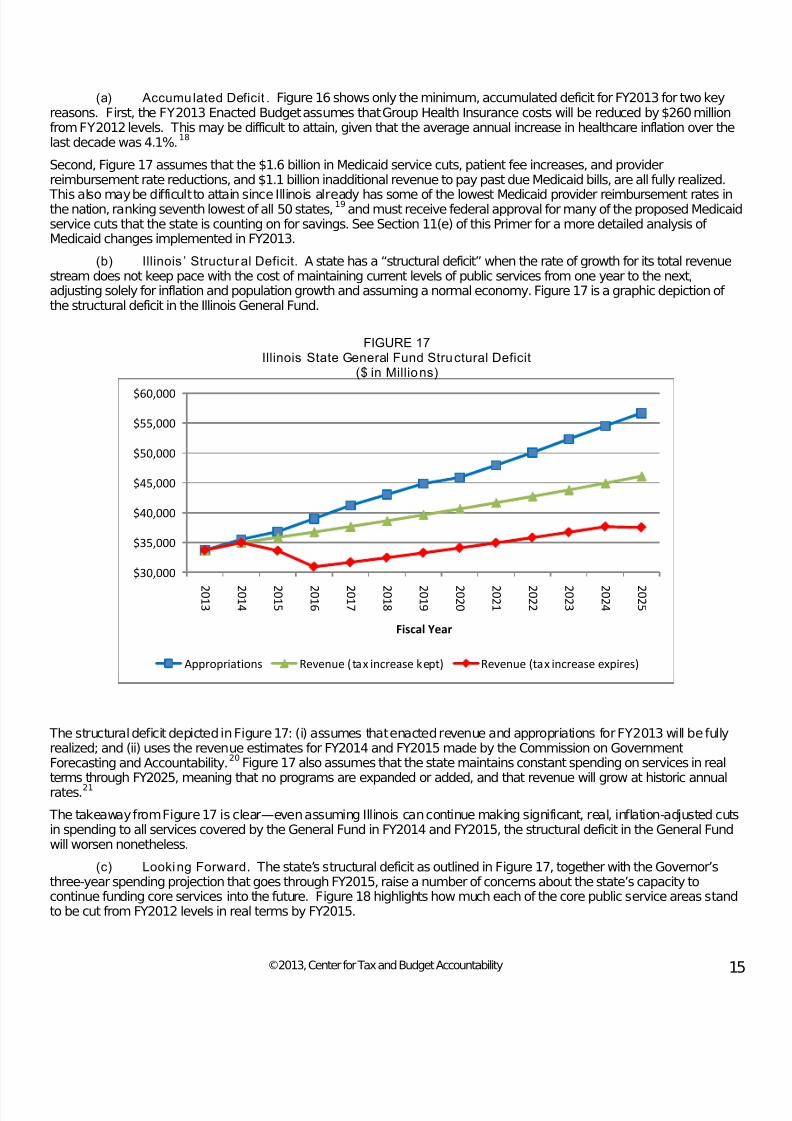
(b) Illinois ’ Structural Deficit. A state has a “structural deficit” when the rate of growth for its total revenuestream does not keep pace with the cost of maintaining current levels of public services from one year to the next,adjusting solely for inflation and population growth and assuming a normal economy. Figure 17 is a graphic depiction of the structural deficit in the Illinois General Fund.
and must receive federal approval for many of the proposed Medicaidservice cuts that the state is counting on for savings. See Section 11(e) of this Primer for a more detailed analysis of Medicaid changes implemented in FY2013.
FIGURE 17Illinois State General Fund Structural Deficit
($ in Millions)
The structural deficit depicted in Figure 17: (i) assumes that enacted revenue and appropriations for FY2013 will be fullyrealized; and (ii) uses the revenue estimates for FY2014 and FY2015 made by the Commission on GovernmentForecasting and Accountability.
20 Figure 17 also assumes that the state maintains constant spending on services in realterms through FY2025, meaning that no programs are expanded or added, and that revenue will grow at historic annualrates.21
The takeaway from Figure 17 is clear—even assuming Illinois can continue making significant, real, inflation-adjusted cutsin spending to all services covered by the General Fund in FY2014 and FY2015, the structural deficit in the General Fundwill worsen nonetheless.
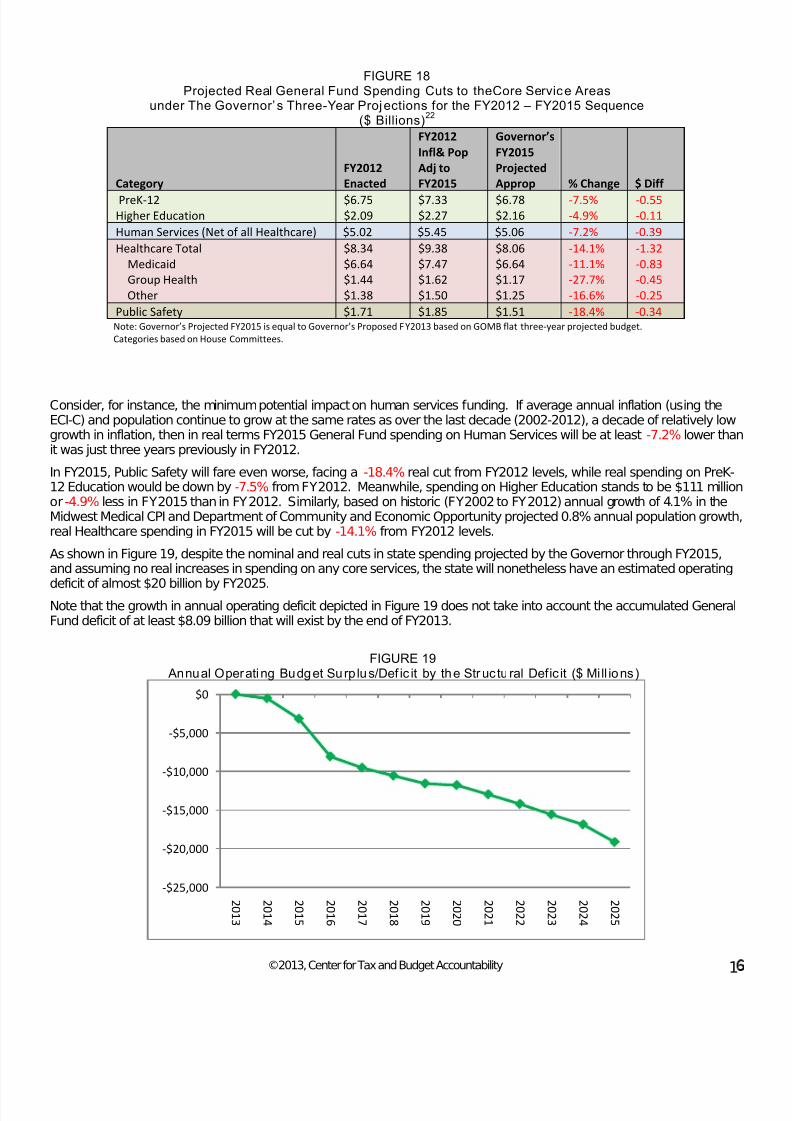
(c) Looking Forward. The state’s structural deficit as outlined in Figure 17, together with the Governor’sthree-year spending projection that goes through FY2015, raise a number of concerns about the state’s capacity tocontinue funding core services into the future. Figure 18 highlights how much each of the core public service areas standto be cut from FY2012 levels in real terms by FY2015.
$30,000
$35,000
$40,000
$45,000
$50,000
$55,000
$60,000
2 0 1 3
2 0 1 4
2 0 1 5
2 0 1 6
2 0 1 7
2 0 1 8
2 0 1 9
2 0 2 0
2 0 2 1
2 0 2 2
2 0 2 3
2 0 2 4
2 0 2 5
Fiscal Year
Appropriations Revenue (tax increase kept) Revenue (tax increase expires)
7/28/2019 Final_fy2013 Ctba Il Budget and Tax Primer
http://slidepdf.com/reader/full/finalfy2013-ctba-il-budget-and-tax-primer 20/60
7/28/2019 Final_fy2013 Ctba Il Budget and Tax Primer
http://slidepdf.com/reader/full/finalfy2013-ctba-il-budget-and-tax-primer 21/60
©2013, Center for Tax and Budget Accountability 17
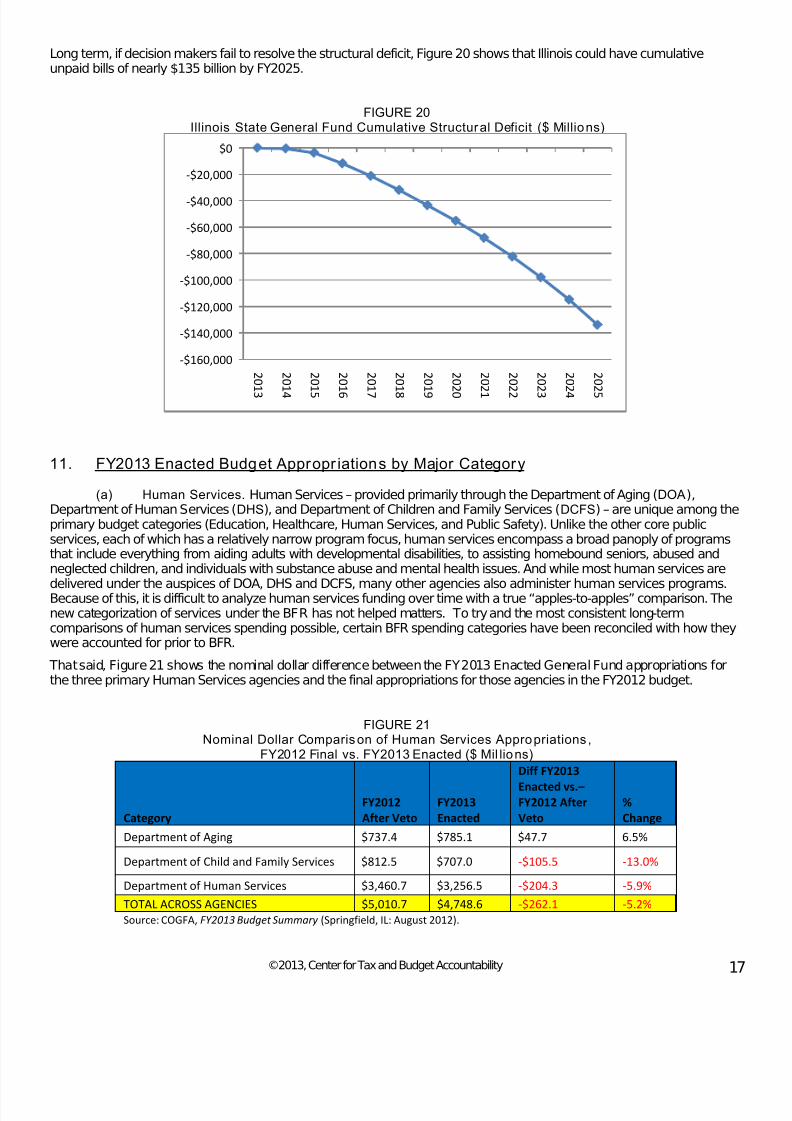
Long term, if decision makers fail to resolve the structural deficit, Figure 20 shows that Illinois could have cumulativeunpaid bills of nearly $135 billion by FY2025.
FIGURE 20Illinois State General Fund Cumulative Structural Deficit ($ Millions)
11. FY2013 Enacted Budget Appropr iations by Major Category
(a) Human Services. Human Services – provided primarily through the Department of Aging (DOA),Department of Human Services (DHS), and Department of Children and Family Services (DCFS) – are unique among theprimary budget categories (Education, Healthcare, Human Services, and Public Safety). Unlike the other core publicservices, each of which has a relatively narrow program focus, human services encompass a broad panoply of programsthat include everything from aiding adults with developmental disabilities, to assisting homebound seniors, abused andneglected children, and individuals with substance abuse and mental health issues. And while most human services are
delivered under the auspices of DOA, DHS and DCFS, many other agencies also administer human services programs.Because of this, it is difficult to analyze human services funding over time with a true “apples-to-apples” comparison. Thenew categorization of services under the BFR has not helped matters. To try and the most consistent long-termcomparisons of human services spending possible, certain BFR spending categories have been reconciled with how theywere accounted for prior to BFR.
That said, Figure 21 shows the nominal dollar difference between the FY2013 Enacted General Fund appropriations forthe three primary Human Services agencies and the final appropriations for those agencies in the FY2012 budget.
FIGURE 21Nominal Dollar Comparis on of Human Services Appropriations ,
FY2012 Final vs. FY2013 Enacted ($ Mil lions)
Category
FY2012
After Veto
FY2013
Enacted
Diff FY2013
Enacted vs.–FY2012 After
Veto
%
Change
Department of Aging $737.4 $785.1 $47.7 6.5%
Department of Child and Family Services $812.5 $707.0 -$105.5 -13.0%
Department of Human Services $3,460.7 $3,256.5 -$204.3 -5.9%
TOTAL ACROSS AGENCIES $5,010.7 $4,748.6 -$262.1 -5.2%
Source: COGFA, FY2013 Budget Summary (Springfield, IL: August 2012).
-$160,000
-$140,000
-$120,000
-$100,000
-$80,000
-$60,000
-$40,000
-$20,000
$0
2 0 1 3
2 0 1 4
2 0 1 5
2 0 1 6
2 0 1 7
2 0 1 8
2 0 1 9
2 0 2 0
2 0 2 1
2 0 2 2
2 0 2 3
2 0 2 4
2 0 2 5
7/28/2019 Final_fy2013 Ctba Il Budget and Tax Primer
http://slidepdf.com/reader/full/finalfy2013-ctba-il-budget-and-tax-primer 22/60
©2013, Center for Tax and Budget Accountability 1
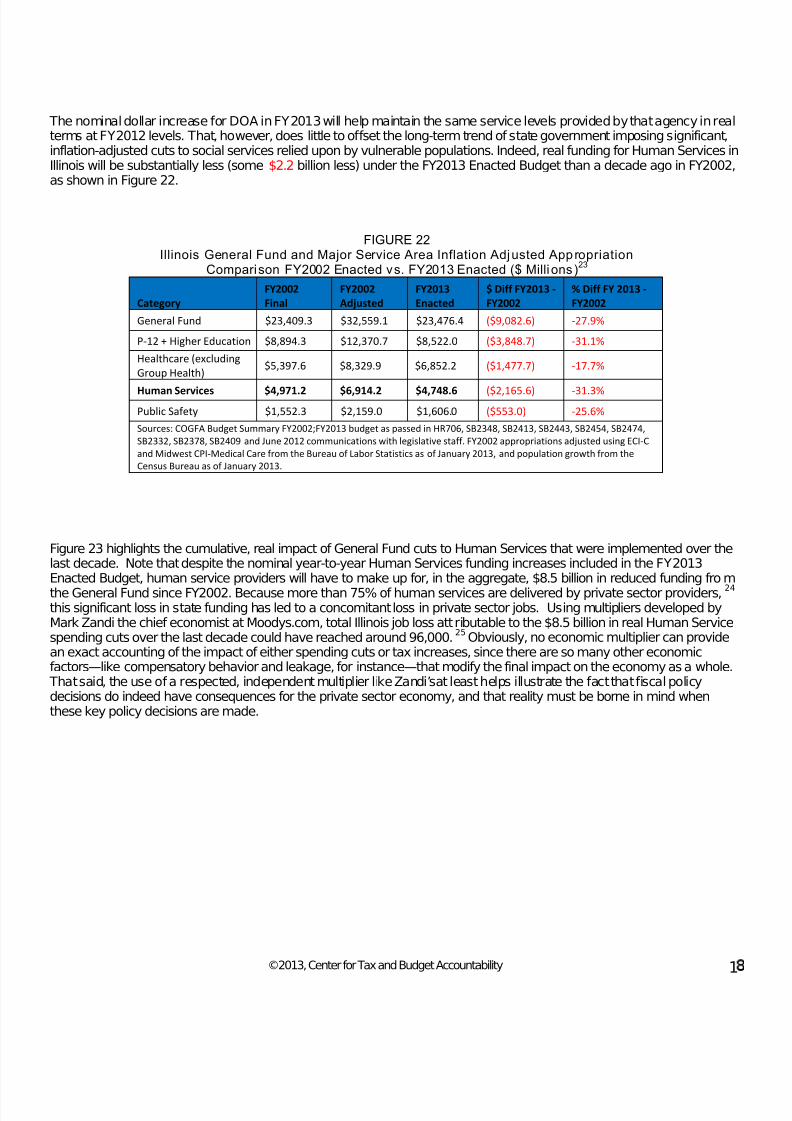
The nominal dollar increase for DOA in FY2013 will help maintain the same service levels provided by that agency in realterms at FY2012 levels. That, however, does little to offset the long-term trend of state government imposing significant,inflation-adjusted cuts to social services relied upon by vulnerable populations. Indeed, real funding for Human Services inIllinois will be substantially less (some $2.2 billion less) under the FY2013 Enacted Budget than a decade ago in FY2002,as shown in Figure 22.
FIGURE 22Illinois General Fund and Major Service Area Inflation Adjusted Appr opriation
Comparison FY2002 Enacted vs. FY2013 Enacted ($ Millions)23
Category
FY2002
Final
FY2002
Adjusted
FY2013
Enacted
$ Diff FY2013 -
FY2002
% Diff FY 2013 -
FY2002
General Fund $23,409.3 $32,559.1 $23,476.4 ($9,082.6) -27.9%
P-12 + Higher Education $8,894.3 $12,370.7 $8,522.0 ($3,848.7) -31.1%
Healthcare (excluding
Group Health)$5,397.6 $8,329.9 $6,852.2 ($1,477.7) -17.7%
Human Services $4,971.2 $6,914.2 $4,748.6 ($2,165.6) -31.3%Public Safety $1,552.3 $2,159.0 $1,606.0 ($553.0) -25.6%
Sources: COGFA Budget Summary FY2002;FY2013 budget as passed in HR706, SB2348, SB2413, SB2443, SB2454, SB2474,
SB2332, SB2378, SB2409 and June 2012 communications with legislative staff. FY2002 appropriations adjusted using ECI-C
and Midwest CPI-Medical Care from the Bureau of Labor Statistics as of January 2013, and population growth from the
Census Bureau as of January 2013.
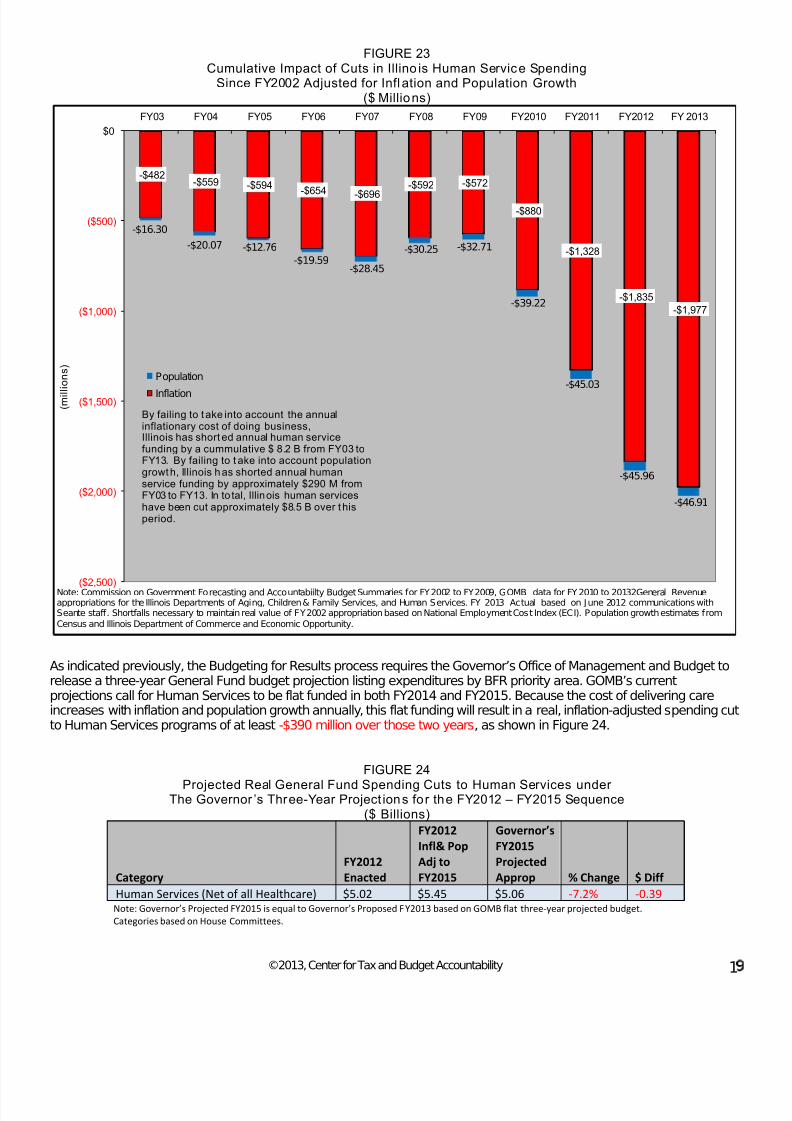
Figure 23 highlights the cumulative, real impact of General Fund cuts to Human Services that were implemented over thelast decade. Note that despite the nominal year-to-year Human Services funding increases included in the FY2013Enacted Budget, human service providers will have to make up for, in the aggregate, $8.5 billion in reduced funding from
the General Fund since FY2002. Because more than 75% of human services are delivered by private sector providers,24 this significant loss in state funding has led to a concomitant loss in private sector jobs. Using multipliers developed byMark Zandi the chief economist at Moodys.com, total Illinois job loss attributable to the $8.5 billion in real Human Servicespending cuts over the last decade could have reached around 96,000.
25
Obviously, no economic multiplier can providean exact accounting of the impact of either spending cuts or tax increases, since there are so many other economicfactors—like compensatory behavior and leakage, for instance—that modify the final impact on the economy as a whole.
That said, the use of a respected, independent multiplier like Zandi’sat least helps illustrate the fact that fiscal policydecisions do indeed have consequences for the private sector economy, and that reality must be borne in mind whenthese key policy decisions are made.
7/28/2019 Final_fy2013 Ctba Il Budget and Tax Primer
http://slidepdf.com/reader/full/finalfy2013-ctba-il-budget-and-tax-primer 23/60
©2013, Center for Tax and Budget Accountability 1
FIGURE 23Cumulative Impact of Cuts in Illino is Human Service Spending
Since FY2002 Adjusted for Infl ation and Population Growth($ Millions)
As indicated previously, the Budgeting for Results process requires the Governor’s Office of Management and Budget torelease a three-year General Fund budget projection listing expenditures by BFR priority area. GOMB’s currentprojections call for Human Services to be flat funded in both FY2014 and FY2015. Because the cost of delivering careincreases with inflation and population growth annually, this flat funding will result in a real, inflation-adjusted spending cutto Human Services programs of at least -$390 million over those two years, as shown in Figure 24.
FIGURE 24
Projected Real General Fund Spending Cuts to Human Services under The Governor ’s Three-Year Project ions for the FY2012 – FY2015 Sequence
($ Billions)
Category
FY2012
Enacted
FY2012
Infl& Pop
Adj to
FY2015
Governor’s
FY2015
Projected
Approp % Change $ Diff
Human Services (Net of all Healthcare) $5.02 $5.45 $5.06 -7.2% -0.39Note: Governor’s Projected FY2015 is equal to Governor’s Proposed FY2013 based on GOMB flat three-year projected budget.
Categories based on House Committees.
-$482-$559 -$594
-$654-$696
-$592 -$572
-$880
-$1,328
-$1,835
-$1,977
-$16.30
-$20.07 -$12.76
-$19.59-$28.45
-$30.25 -$32.71
-$39.22
-$45.03
-$45.96
-$46.91
($2,500)
($2,000)
($1,500)
($1,000)
($500)
$0
FY03 FY04 FY05 FY06 FY07 FY08 FY09 FY2010 FY2011 FY2012 FY 2013
( m i l l i o n s )
Population
Inflation
By failing to take into account the annualinflationary cost of doing business,Illinois has short ed annual human servicefunding by a cummulative $ 8.2 B from FY03 toFY13. By failing to t ake into account populationgrowth, Illinois has shorted annual humanservice funding by approximately $290 M fromFY03 to FY13. In to tal, Illinois human serviceshave been cut approximately $8.5 B over thisperiod.
Note: Commission on Government Forecasting and Accountabiilty Budget Summaries for FY2002 to FY2009, GOMB data for FY 2010 to 20132General Revenueappropriations for the Illinois Departments of Aging, Children & Family Services, and Human Services. FY 2013 Actual based on June 2012 communications withSeante staff. Shortfalls necessary to maintain real value of FY2002 appropriation based on National Employment Cost Index (ECI). Population growth estimates from
Census and Illinois Department of Commerce and Economic Opportunity.
7/28/2019 Final_fy2013 Ctba Il Budget and Tax Primer
http://slidepdf.com/reader/full/finalfy2013-ctba-il-budget-and-tax-primer 24/60
©2013, Center for Tax and Budget Accountability 2
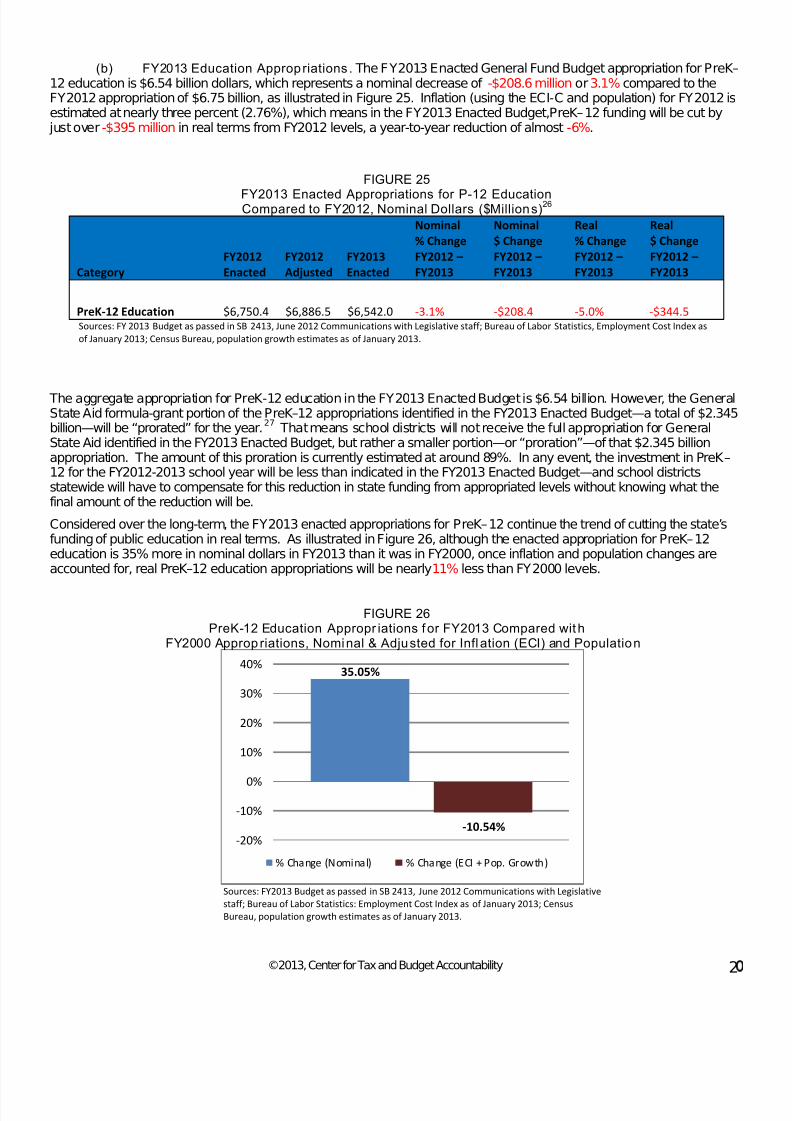
(b) FY2013 Education Appropriations . The FY2013 Enacted General Fund Budget appropriation for PreK–12 education is $6.54 billion dollars, which represents a nominal decrease of -$208.6 million or3.1% compared to theFY2012 appropriation of $6.75 billion, as illustrated in Figure 25. Inflation (using the ECI-C and population) for FY2012 isestimated at nearly three percent (2.76%), which means in the FY2013 Enacted Budget,PreK–12 funding will be cut by
just over-$395 million in real terms from FY2012 levels, a year-to-year reduction of almost-6%.
FIGURE 25
FY2013 Enacted Appropriations for P-12 Education Compared to FY2012, Nominal Dollars ($Millions)26
Category
FY2012
Enacted
FY2012
Adjusted
FY2013
Enacted
Nominal
% Change
FY2012 –
FY2013
Nominal
$ Change
FY2012 –
FY2013
Real
% Change
FY2012 –
FY2013
Real
$ Change
FY2012 –
FY2013
PreK-12 Education $6,750.4 $6,886.5 $6,542.0 -3.1% -$208.4 -5.0% -$344.5Sources: FY 2013 Budget as passed in SB 2413, June 2012 Communications with Legislative staff; Bureau of Labor Statistics, Employment Cost Index as
of January 2013; Census Bureau, population growth estimates as of January 2013.
The aggregate appropriation for PreK-12 education in the FY2013 Enacted Budget is $6.54 billion. However, the GeneralState Aid formula-grant portion of thePreK–12 appropriations identified in the FY2013 Enacted Budget—a total of $2.345billion—will be “prorated” for the year.
27
Considered over the long-term, the FY2013 enacted appropriations for PreK–12 continue the trend of cutting the state’sfunding of public education in real terms. As illustrated in Figure 26, although the enacted appropriation for PreK–12education is 35% more in nominal dollars in FY2013 than it was in FY2000, once inflation and population changes areaccounted for, real PreK–12 education appropriations will be nearly11% less than FY2000 levels.
That means school districts will not receive the full appropriation for GeneralState Aid identified in the FY2013 Enacted Budget, but rather a smaller portion—or “proration”—of that $2.345 billionappropriation. The amount of this proration is currently estimated at around 89%. In any event, the investment in PreK–12 for the FY2012-2013 school year will be less than indicated in the FY2013 Enacted Budget—and school districtsstatewide will have to compensate for this reduction in state funding from appropriated levels without knowing what thefinal amount of the reduction will be.
FIGURE 26PreK-12 Education Appropr iations for FY2013 Compared with
FY2000 Approp riations, Nominal & Adjusted for Infl ation (ECI) and Population
Sources: FY2013 Budget as passed in SB 2413, June 2012 Communications with Legislative
staff; Bureau of Labor Statistics: Employment Cost Index as of January 2013; Census
Bureau, population growth estimates as of January 2013.
35.05%
-10.54%-20%
-10%
0%
10%
20%
30%
40%
% Change (Nominal) % Change (ECI + Pop. Growth)

7/28/2019 Final_fy2013 Ctba Il Budget and Tax Primer
http://slidepdf.com/reader/full/finalfy2013-ctba-il-budget-and-tax-primer 25/60
©2013, Center for Tax and Budget Accountability 2
The trend of real cuts to public education funding in Illinois can be expected to continue. As shown previously, theGovernor’s three-year budget projection calls for flat funding of education in FY2014 and FY2015. Because the cost of delivering education increases each year due to inflation and population growth, this flat funding—if it is attained—willresult in real cuts to PreK–12 education.
Given that the data demonstrate that the state’s General Fund spending on education in Illinois is inadequate, whetherconsidered under national or by the state’s own standards, it can be assumed that future cuts to K-12 funding will havenegative consequences for educating children.
Consider national comparisons first. According to the National Center for Education Statistics (NCES), Illinois ranks deadlast among the states in the portion of education funding covered by state, rather than local resources. Indeed, as Figure27 shows, Illinois only covers 28.4% of public education costs, while the national average is 43.5%. Meanwhile, 59% of PreK–12 education costs are covered by local resources in Illinois.
FIGURE 27
Source: National Center on Education Statistics, 2012. “Revenues and Expenditures
for Public Elementary and Secondary Education: School Year 2009-2010 (Fiscal Year
2010).”
Figures 28 and 29 show how Illinois stacks up with other large states and the Midwest.
FIGURE 28 FIGURE 29
Source: National Center on Education Statistics, 2012. “Revenues and Expenditures for Public Elementary and
Secondary Education: School Year 2009-2010 (Fiscal Year 2010).”
The state’s record of underfunding education from state-based resources has forced local property taxes to cover adisproportionately high portion of education funding in Illinois. The data show that Illinois’ significantover-reliance on localproperty taxes is a material cause of both poor and inequitable educational outcomes in the state.
28
7/28/2019 Final_fy2013 Ctba Il Budget and Tax Primer
http://slidepdf.com/reader/full/finalfy2013-ctba-il-budget-and-tax-primer 26/60
©2013, Center for Tax and Budget Accountability 22
Meanwhile, despite the significant portion of education funding local school districts have assumed, overall educationfunding levels in Illinois remain low compared to national averages. According to the National Association of State BudgeOfficers (NASBO), Illinois r anks 40th in percapita education spending , despite having the 15
thhighest per capita
income among the states.29
In order for Illinois to move up to being just “average” in per-capita spending (a ranking of 25
th) among the states, after adjusting for inflation and population growth, the state appropriation for PreK-12 education in
FY2013 would have to be $10.58 billion, or fully $4.04 billion more than the FY2013 Enacted Budget appropriation.30
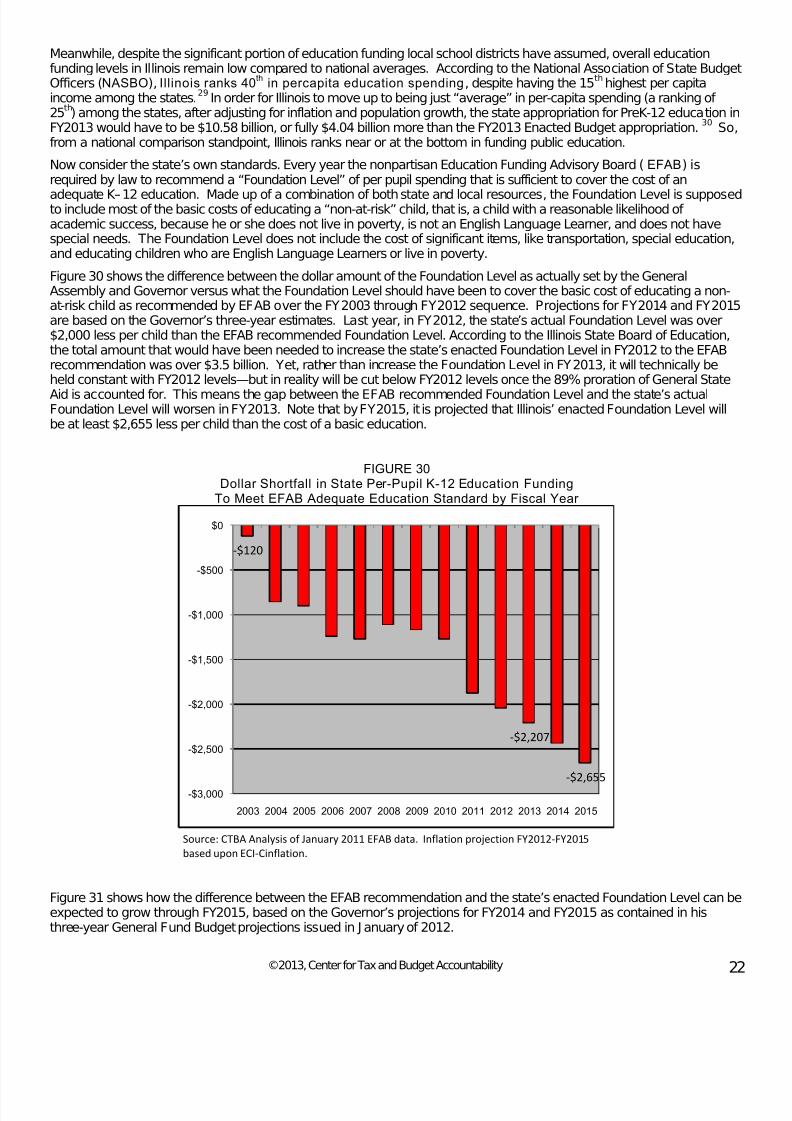
Now consider the state’s own standards. Every year the nonpartisan Education Funding Advisory Board (EFAB) isrequired by law to recommend a “Foundation Level” of per pupil spending that is sufficient to cover the cost of an
adequate K–12 education. Made up of a combination of both state and local resources, the Foundation Level is supposedto include most of the basic costs of educating a “non-at-risk” child, that is, a child with a reasonable likelihood of academic success, because he or she does not live in poverty, is not an English Language Learner, and does not havespecial needs. The Foundation Level does not include the cost of significant items, like transportation, special education,and educating children who are English Language Learners or live in poverty.
So,from a national comparison standpoint, Illinois ranks near or at the bottom in funding public education.
Figure 30 shows the difference between the dollar amount of the Foundation Level as actually set by the GeneralAssembly and Governor versus what the Foundation Level should have been to cover the basic cost of educating a non-at-risk child as recommended by EFAB over the FY2003 through FY2012 sequence. Projections for FY2014 and FY2015are based on the Governor’s three-year estimates. Last year, in FY2012, the state’s actual Foundation Level was over$2,000 less per child than the EFAB recommended Foundation Level. According to the Illinois State Board of Education,the total amount that would have been needed to increase the state’s enacted Foundation Level in FY2012 to the EFABrecommendation was over $3.5 billion. Yet, rather than increase the Foundation Level in FY2013, it will technically beheld constant with FY2012 levels—but in reality will be cut below FY2012 levels once the 89% proration of General State
Aid is accounted for. This means the gap between the EFAB recommended Foundation Level and the state’s actualFoundation Level will worsen in FY2013. Note that by FY2015, it is projected that Illinois’ enacted Foundation Level willbe at least $2,655 less per child than the cost of a basic education.
FIGURE 30Dollar Shortfall in State Per-Pupil K-12 Education Funding
To Meet EFAB Adequate Education Standard by Fiscal Year
Source: CTBA Analysis of January 2011 EFAB data. Inflation projection FY2012-FY2015
based upon ECI-Cinflation.
Figure 31 shows how the difference between the EFAB recommendation and the state’s enacted Foundation Level can beexpected to grow through FY2015, based on the Governor’s projections for FY2014 and FY2015 as contained in histhree-year General Fund Budget projections issued in J anuary of 2012.
-$120
-$2,207
-$2,655
-$3,000
-$2,500
-$2,000
-$1,500
-$1,000
-$500
$0
2003 2004 2005 2006 2007 2008 2009 2010 2011 2012 2013 2014 2015

7/28/2019 Final_fy2013 Ctba Il Budget and Tax Primer
http://slidepdf.com/reader/full/finalfy2013-ctba-il-budget-and-tax-primer 27/60
©2013, Center for Tax and Budget Accountability 2
FIGURE 31EFAB Per-Pupil Funding Recommendation Compared to
the Enacted Per-Pupil Foundation Funding Level by Fiscal Year
Source: CTBA analysis of EFAB data. Inflation projection FY2012-FY2015 based upon ECI-Cinflation.
In any event, the actual shortfall between the Foundation Level set by the state and the EFAB recommendation will begreater than what is shown in either Figure 30 or Figure 31 for FY2012 and FY2013 (and in all likelihood thereafter) due tothe decision to “prorate” General State Aid in FY2012 and FY2013.
Early childhood spending has also been reduced in recent years. As shown in Figures 32 and 33, over the last five yearsstate funding for early childhood declined from $380 million to $300 million.
FIGURE 32Early Education Funding from FY 2009-2013 in Real and Nominal Dollars($ in Millions)
Sources: ISBE FY2010, FY2012, and FY2013 Budget Book Early Education appropriation
This is questionable public policy, given the evidence-based support for the positive correlation between early childhoodprograms and academic success.
31
$342,235.30$325,123.50 $300,192.40
$380,261.40$397,185.28 $407,972.34
$418,799.76 $429,782.19
$0
$50,000
$100,000
$150,000
$200,000
$250,000
$300,000
$350,000
$400,000
$450,000
$500,000
FY 2009 FY 2010 FY 2011 FY 2012 FY 2013(Enacted)
Actual Appropriations Real Dollars (Adj. for ECI & Pop Growth)

7/28/2019 Final_fy2013 Ctba Il Budget and Tax Primer
http://slidepdf.com/reader/full/finalfy2013-ctba-il-budget-and-tax-primer 28/60
©2013, Center for Tax and Budget Accountability 2
-7.99%
-39.05%-45%
-40%
-35%
-30%
-25%
-20%
-15%
-10%
-5%
0%
% Change (Nominal) % Change (ECI + Pop)
FIGURE 33Enacted Appropriations for Early Education
FY2013 Compared to FY2009, Real Dol lars ($ Mil lions)
FY 2009 Enacted FY 2009 Enacted (Adj . for ECI& Pop Growth )
Diff FY 2013 Enacted- FY2009 Enacted (Adj. for ECI&Pop Growth)
% Change
$380,261.40 $403,853.75 -$103,661.35 -27.26%
Sources: ISBE FY2010 and FY 2013 Budget Book Early Education appropriation
(c) Higher Education. The FY2013 Enacted Budget appropriation for Higher Education is $1.97 billiondollars, which is a nominal decrease of -$113 million or -5.4% compared to the FY2012 appropriation of $2.09 billion. Asenacted, the FY2013 appropriation for Higher Education represents a real, inflation-adjusted decrease of -7.9% comparedto FY2012 levels.
FIGURE 34Enacted Appropriations for Higher Education FY2013 Compared With FY2012 ($ Mill ions)32
Category FY2012 EnactedFY2012
Ad justedFY2013
Enacted
Nominal %ChangeFY2012 –FY2013
Nominal $Change FY2012
– FY2013
Real% ChangeFY2012 –FY2013
Real$ ChangeFY2012 –FY2013
Higher Education $2,092.4 $2,134.6 $1,979.9 -5.4% -$112.5 -7.2% -$154.7
Sources: COGFA,FY2012 Budget Summary (Springfield, IL: COGFA, August 2011); and COGFA, FY2013 Budget Summary (Springfield, IL: COGFA, August 2012).
The long-term funding trend for Higher Education is not pretty, as highlighted in Figure 35. Indeed, given the FY2013enacted appropriation, real funding for Higher Education will be significantly less in FY2013 than in FY2000.
FIGURE 35Percentage Change in Higher Education Funding
Between FY2000 and FY2013, in Nominal and Real Terms
Sources: COGFA, FY2013 Budget Summary (Springfield, IL: COGFA, August
2012); June 2012 communications with Senate staff; Bureau of Labor Statistics;
and Census Bureau as of January 2013.

7/28/2019 Final_fy2013 Ctba Il Budget and Tax Primer
http://slidepdf.com/reader/full/finalfy2013-ctba-il-budget-and-tax-primer 29/60
©2013, Center for Tax and Budget Accountability 25
As illustrated in Figure 35, the enacted appropriation for Higher Education in FY2013 represents a nominal dollar cut of 8% below FY2000 levels. Once inflation and population changes are accounted for, however, the enacted HigherEducation appropriation for FY2013 is 39% less than FY2000.
Cuts to Higher Education will make it harder for many Illinois students to attend college at a time when a college degree ismore important than ever when it comes to success in the labor market. Indeed, as shown in Figure 36, the only cohort of workers in Illinois that realized a real increase in wages from 1979 through 2010 had a college degree. Every otherworker saw his or her pay decline in real terms.
FIGURE 36Hourly Wage Comparison by Education Level,
1979 vs 2010 (in real, 2010 $)
Source:EPI Analysis using Current Population Survey data, inflation adjusted using the CPI-U-RS
This is a real problem in Illinois. Consider that the state’s fiscal woes have so hampered its ability to assist low-incomestudents in paying for college that as recently as March 21, 2012, the Chicago Tribune reported that funding for MonetaryAward Program (MAP) grants, which provide this very crucial support, has been exhausted. The consequences of thisare clear: approximately 140,000 Illinois college students will lose up to $4,968 each in state grants that would havehelped pay for college.
(d) Healthcare Overall. There have traditionally been three primary categories of Healthcare spending in thestate’s General Fund: Medicaid for poor, disabled and low-income populations; Group Health Insurance for state workers;and funding for the Department of Public Health. Also historically included in Healthcare funding were the administrativeand related costs of child support services delivered by the Department of Health and Family Services (DHFS). Under thenew Budgeting for Resultsregimen, however, Public Health, Group Health and the administrative costs of child supportservices delivered by DHFS have been re-categorized as “Human Services” spending—and collectively described belowas “Other Healthcare” within the rubric of Human Services.
Given those changes in how funding for these services is categorized, Figure 37 shows the differences between theFY2012 budget and the FY2013 Enacted Budget in nominal dollars.
$
1 4 .
5 3
$ 9 .
7 6
$ 1 5 .
4 6
$ 1
3 .
0 7
$ 1 6 .
4 7
$ 1 4 .
6 1
$21.96
$24.80
$ 1 6 .
5 6
$ 1 6 .
2 1
$0.00
$5.00
$10.00
$15.00
$20.00
$25.00
$30.00
1979 adj to 2010 2010 nominal
Less than High
School
High school
Some College
Bachelor's or
More
All Workers

7/28/2019 Final_fy2013 Ctba Il Budget and Tax Primer
http://slidepdf.com/reader/full/finalfy2013-ctba-il-budget-and-tax-primer 30/60
©2013, Center for Tax and Budget Accountability 2
FIGURE 37Comparison of FY2012 and FY2013
Appropriations for Healthcare ($ Mil lions)
Category FY2012 FY2013
Medicaid $6,639 $6,639
Group Health $1,436 $1,171
Other Healthcare $ 260 $ 213TOTAL $8,335 $8,023
Source: CTBA,Illinois FY 2013 General Fund Enacted Budget Analysis, (Chicago, IL: August 2,
2012). “Other healthcare” includes appropriations to the Department of Public Health and
Department of Healthcare and Family Services per SB2454 of the Illinois 97th
General Assembly.
There has been much concern expressed recently about Healthcare expenditures generally and Medicaid expendituresspecifically. Medicaid will be dealt with at some length in the following Section. However, even after Medicaidexpenditures are taken into account, overall inflation-adjusted General Fund spending on Healthcare Services for thepublic (excluding Group Health Insurance for state workers) in Illinois will be less in FY2013 than it was in FY2000, asshown in Figure 38.
FIGURE 38Healthcare Appropriat ions, FY2013 vs. FY2000,
Adjusted for Inf lat ion and Population ($ Mi ll ions)
Category FY2000
Enacted
FY2000
Infl& Pop
Adj
FY2013 Enacted % Diff FY2013
& FY2000 Adj
Healthcare (including Medicaid, DHFS and
DPH, but excluding Group Health
Insurance)
$5,022 $8,598 $6,852 -20.3%
Sources: Unadjusted historic appropriations from governor’s Final Budget Summary for FY2000; FY2013 appropriation from SB2454 and
as reported by Senate staff, June 2012. FY2000 appropriation adjusted using the Midwest CPI for Medical Care from the Bureau of Labor
Statistics as of January 2013; population growth from the Census Bureau as of January 2013.
The state’s General Fund spending on healthcare can best be understood in context of changes driven by the privatesector. Consider, for instance that between 1980 and 2005, over 16% of Illinois workers in the private sector lost theiremployer-provided health insurance.
33Today, over 46% of full-time workers in Illinois do not have private, employer-
provided health insurance.34
As the private sector scales back this benefit, the demand for the public sector to assist in providing Healthcare coveragefor low and increasingly middle income families will grow. The impact of reduced availability of private health coveragefrom employers is somewhat reflected in Medicaid data.
In 2008, more than 75% of national Medicaid beneficiaries were not on welfare, while fully 94% of Illinois’ Medicaidrecipients were not receiving welfare,
35but were either working or unable to do so due to age or disability.
36
Illinois’ chronic fiscal problems make it increasingly difficult for the state to keep up with both increasing demandforHealthcare and soaring Healthcare costs, which historically grow faster than general inflation.
37
The scope of the problem this creates for Illinois' fiscal system is illustrated by the gap between the increase in liability forIllinois' Medicaid program, which grew at an average annual rate of 6% between fiscal years 2004 and 2013, and theincrease in state tax revenue over that same period, which grew at an average annual rate of only 2.5%.
38 TheCongressional BudgetOffice currently projects that healthcare costs for the public sector will grow by at least 8% annuallyover the next decade.39
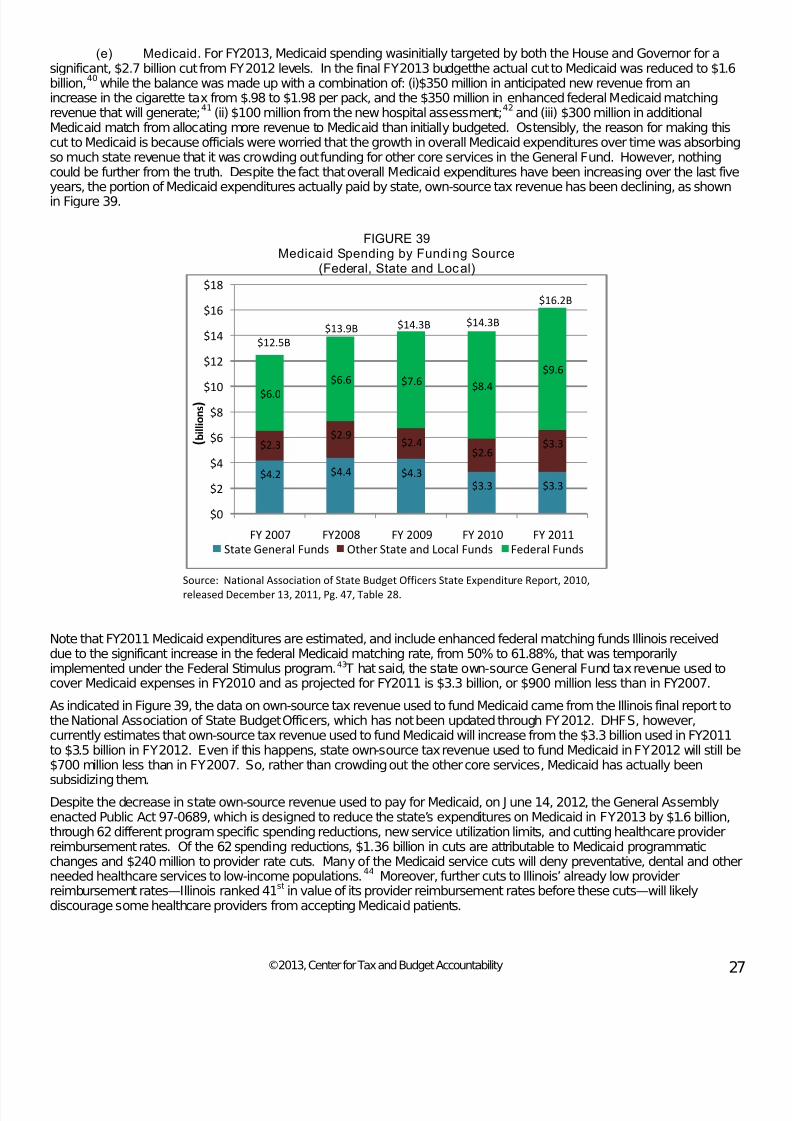
7/28/2019 Final_fy2013 Ctba Il Budget and Tax Primer
http://slidepdf.com/reader/full/finalfy2013-ctba-il-budget-and-tax-primer 31/60
©2013, Center for Tax and Budget Accountability 27
(e) Medicaid. For FY2013, Medicaid spending wasinitially targeted by both the House and Governor for asignificant, $2.7 billion cut from FY2012 levels. In the final FY2013 budgetthe actual cut to Medicaid was reduced to $1.6billion,
40while the balance was made up with a combination of: (i)$350 million in anticipated new revenue from an
increase in the cigarette tax from $.98 to $1.98 per pack, and the $350 million in enhanced federal Medicaid matchingrevenue that will generate;
41(ii) $100 million from the new hospital assessment;
42
and (iii) $300 million in additionalMedicaid match from allocating more revenue to Medicaid than initially budgeted. Ostensibly, the reason for making thiscut to Medicaid is because officials were worried that the growth in overall Medicaid expenditures over time was absorbingso much state revenue that it was crowding out funding for other core services in the General Fund. However, nothingcould be further from the truth. Despite the fact that overall Medicaid expenditures have been increasing over the last fiveyears, the portion of Medicaid expenditures actually paid by state, own-source tax revenue has been declining, as shownin Figure 39.
FIGURE 39Medicaid Spending by Funding Source
(Federal, State and Local)
Source: National Association of State Budget Officers State Expenditure Report, 2010,
released December 13, 2011, Pg. 47, Table 28.
Note that FY2011 Medicaid expenditures are estimated, and include enhanced federal matching funds Illinois receiveddue to the significant increase in the federal Medicaid matching rate, from 50% to 61.88%, that was temporarilyimplemented under the Federal Stimulus program.43
As indicated in Figure 39, the data on own-source tax revenue used to fund Medicaid came from the Illinois final report tothe National Association of State Budget Officers, which has not been updated through FY2012. DHFS, however,currently estimates that own-source tax revenue used to fund Medicaid will increase from the $3.3 billion used in FY2011to $3.5 billion in FY2012. Even if this happens, state own-source tax revenue used to fund Medicaid in FY2012 will still be$700 million less than in FY2007. So, rather than crowding out the other core services, Medicaid has actually been
subsidizing them.
T hat said, the state own-source General Fund tax revenue used tocover Medicaid expenses in FY2010 and as projected for FY2011 is $3.3 billion, or $900 million less than in FY2007.
Despite the decrease in state own-source revenue used to pay for Medicaid, on J une 14, 2012, the General Assemblyenacted Public Act 97-0689, which is designed to reduce the state’s expenditures on Medicaid in FY2013 by $1.6 billion,through 62 different program specific spending reductions, new service utilization limits, and cutting healthcare providerreimbursement rates. Of the 62 spending reductions, $1.36 billion in cuts are attributable to Medicaid programmaticchanges and $240 million to provider rate cuts. Many of the Medicaid service cuts will deny preventative, dental and otheneeded healthcare services to low-income populations.
44Moreover, further cuts to Illinois’ already low provider
reimbursement rates—Illinois ranked 41st in value of its provider reimbursement rates before these cuts—will likelydiscourage some healthcare providers from accepting Medicaid patients.
$4.2 $4.4 $4.3$3.3 $3.3
$2.3$2.9
$2.4$2.6
$3.3
$6.0
$6.6 $7.6 $8.4
$9.6
$0
$2
$4
$6
$8$10
$12
$14
$16
$18
FY 2007 FY2008 FY 2009 FY 2010 FY 2011
( b i l l i o n s )
State General Funds Other State and Local Funds Federal Funds
$12.5B
$13.9B $14.3B $14.3B
$16.2B
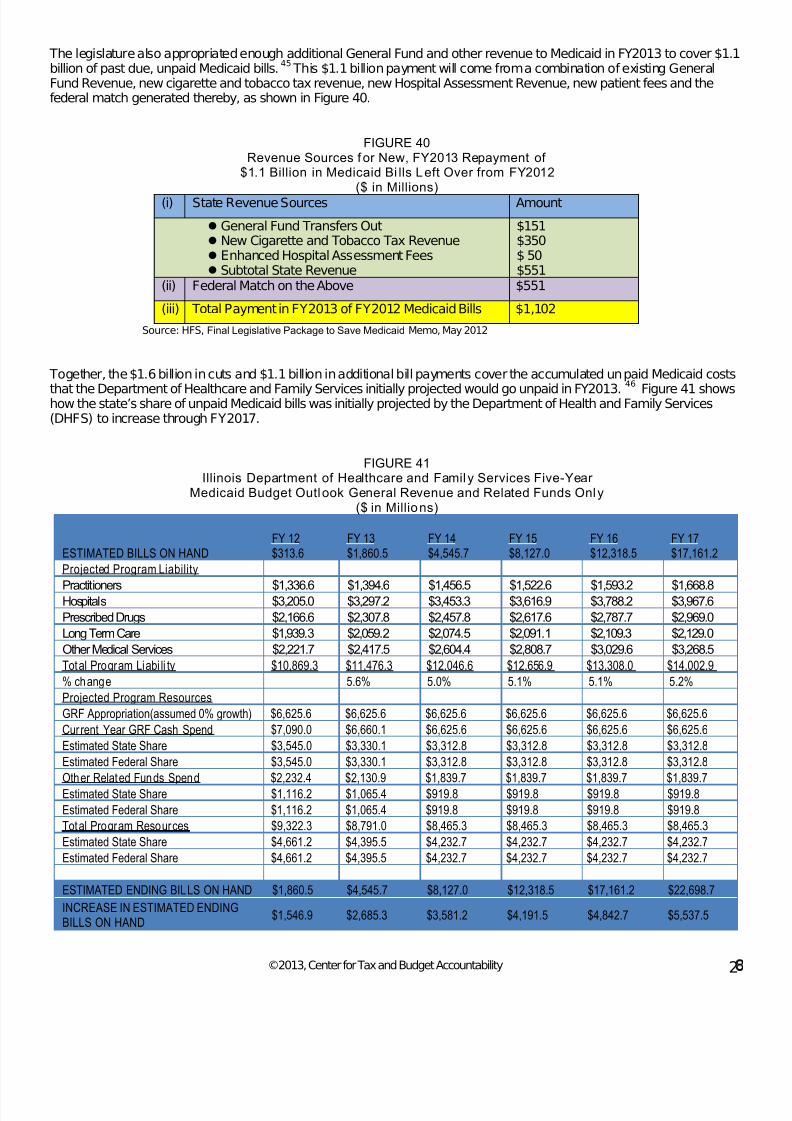
7/28/2019 Final_fy2013 Ctba Il Budget and Tax Primer
http://slidepdf.com/reader/full/finalfy2013-ctba-il-budget-and-tax-primer 32/60
©2013, Center for Tax and Budget Accountability 2
The legislature also appropriated enough additional General Fund and other revenue to Medicaid in FY2013 to cover $1.1billion of past due, unpaid Medicaid bills.
45
This $1.1 billion payment will come from a combination of existing GeneralFund Revenue, new cigarette and tobacco tax revenue, new Hospital Assessment Revenue, new patient fees and thefederal match generated thereby, as shown in Figure 40.
FIGURE 40Revenue Sources for New, FY2013 Repayment of
$1.1 Billion in Medicaid Bi lls Left Over from FY2012($ in Millions)
(i) State Revenue Sources Amount
General Fund Transfers Out New Cigarette and Tobacco Tax Revenue Enhanced Hospital Assessment Fees Subtotal State Revenue
$151$350$ 50$551
(ii) Federal Match on the Above $551
(iii) Total Payment in FY2013 of FY2012 Medicaid Bills $1,102
Source: HFS, Final Legislative Package to Save Medicaid Memo, May 2012
Together, the $1.6 billion in cuts and $1.1 billion in additional bill payments cover the accumulated unpaid Medicaid costs
that the Department of Healthcare and Family Services initially projected would go unpaid in FY2013.46
Figure 41 showshow the state’s share of unpaid Medicaid bills was initially projected by the Department of Health and Family Services(DHFS) to increase through FY2017.
FIGURE 41Illinois Department of Healthcare and Family Services Five-Year
Medicaid Budget Outlook General Revenue and Related Funds Only($ in Millions)
ESTIMATED BILLS ON HANDFY 12$313.6
FY 13$1,860.5
FY 14$4,545.7
FY 15$8,127.0
FY 16$12,318.5
FY 17$17,161.2
Projected Program Liability
Practitioners $1,336.6 $1,394.6 $1,456.5 $1,522.6 $1,593.2 $1,668.8Hospitals $3,205.0 $3,297.2 $3,453.3 $3,616.9 $3,788.2 $3,967.6
Prescribed Drugs $2,166.6 $2,307.8 $2,457.8 $2,617.6 $2,787.7 $2,969.0
Long Term Care $1,939.3 $2,059.2 $2,074.5 $2,091.1 $2,109.3 $2,129.0
Other Medical Services $2,221.7 $2,417.5 $2,604.4 $2,808.7 $3,029.6 $3,268.5
Total Program Liabi li ty $10,869.3 $11,476.3 $12,046.6 $12,656.9 $13,308.0 $14,002.9
% change 5.6% 5.0% 5.1% 5.1% 5.2%
Projected Program Resources
GRF Appropriation(assumed 0% growth) $6,625.6 $6,625.6 $6,625.6 $6,625.6 $6,625.6 $6,625.6
Current Year GRF Cash Spend $7,090.0 $6,660.1 $6,625.6 $6,625.6 $6,625.6 $6,625.6
Estimated State Share $3,545.0 $3,330.1 $3,312.8 $3,312.8 $3,312.8 $3,312.8
Estimated Federal Share $3,545.0 $3,330.1 $3,312.8 $3,312.8 $3,312.8 $3,312.8
Other Related Funds Spend $2,232.4 $2,130.9 $1,839.7 $1,839.7 $1,839.7 $1,839.7
Estimated State Share $1,116.2 $1,065.4 $919.8 $919.8 $919.8 $919.8
Estimated Federal Share $1,116.2 $1,065.4 $919.8 $919.8 $919.8 $919.8Total Program Resources $9,322.3 $8,791.0 $8,465.3 $8,465.3 $8,465.3 $8,465.3
Estimated State Share $4,661.2 $4,395.5 $4,232.7 $4,232.7 $4,232.7 $4,232.7
Estimated Federal Share $4,661.2 $4,395.5 $4,232.7 $4,232.7 $4,232.7 $4,232.7
ESTIMATED ENDING BILLS ON HAND $1,860.5 $4,545.7 $8,127.0 $12,318.5 $17,161.2 $22,698.7
INCREASE IN ESTIMATED ENDINGBILLS ON HAND
$1,546.9 $2,685.3 $3,581.2 $4,191.5 $4,842.7 $5,537.5

7/28/2019 Final_fy2013 Ctba Il Budget and Tax Primer
http://slidepdf.com/reader/full/finalfy2013-ctba-il-budget-and-tax-primer 33/60
©2013, Center for Tax and Budget Accountability 2
In 2011, Medicaid covered over 2 million Illinois residents or 17% of the state population.47
Medicaid is an entitlementprogram for poor and low-income individuals and families who are in need of health coverage. It is jointly funded by boththe federal and state government and is the largest source of federal revenue for states. Medicaid is considered a sourceof revenue for states because of the way it is funded through the Federal Medical Assistance Percentage (FMAP). FMAPis a statutory formula, based on a states’ per capita income, which sets the federal match rate each state will receive, withthe poorest states receiving the highest federal match rate. Under the Social Security Act, the lowest match rate is set at50%, and as of 2012, the highest rate is set at 74%. Since Illinois has one of the highest per capita incomes,
48its match
rate is 50%. This means for every $2 Illinois spends on Medicaid services, the state receives $1 back from the federalgovernment. Similarly,in order to save a $1 in state general fund spending on Medicaid, Illinois has to cut at least $2 inMedicaid spending.49
(f) Repayment of Debt Owed to the Pension Systems Strains Existing Fiscal Resources. The Illinoisstate government has the responsibility to fund five distinct public employee pension systems: Teacher’s RetirementSystem (TRS), State University Retirement System (SURS), State Employee’s Retirement System (SERS), GeneralAssembly Retirement System (GARS) and Judge’s Retirement System (J RS).
So, when the state cuts $2.7 billion in Medicaid spending, it is not really saving that total amountbecause it will lose $1.35 billion in federal matching revenue, leaving net savings at $1.35 billion.
50Presently, all five state-sponsored
retirement systems are significantly underfunded, with a combined unfunded liability of $95 billion and a collective fundedratio of just 40.4%.
51
This means the retirement systems’ assets cover less than 50% of their liabilities. Figure 42 shows the current financialcondition of each retirement system. Since public employee pension benefits are constitutionally guaranteed in Illinois,
52
the state must pay the full $95 billion in unfunded liabilities it owes.
FIGURE 42Summary of State-Sponsored Retirement Systems’
Financial Conditions as o f FY2012 ($ Millions )
System Assets53
LiabilitiesUnfunded
Liability
Funded
Ratio
JRS $601.2 $2,021.7 $1,420.5 29.7%
SERS $11,477.3 $33,091.2 $21,613.9 34.7%
TRS $37,945.4 $90,024.9 $52,079.5 42.1%
SURS $13,949.9 $33,170.2 $19,220.3 42.1%
GARS $56.1 $303.5 $247.4 18.5%
Source: COGFA, Special Pension Briefing (Springfield, IL: COGFA, November2012).
According to GOMB, the state’s FY2012 contribution to the five state-sponsored pension systems will be $4.14 billion. That contribution increases to $5.1 billion under the FY2013 Enacted Budget. Figure 43 provides a breakdown of theFY2012 and FY2013 state pension contributions.
FIGURE 43FY2012 and FY2013
State Pension Contr ibut ions ($ Millions)
FY2012
Enacted
Budgeti
FY 2013
Enacted
Budgetii
Teachers Retirement System $2,406 $2,702
State University Retirement System $980 $1,403
State Employees, Judges & General Assembly
Retirement Systems54
$978 $1,144
Less: Transfers from State Pension Fund (Unclaimed
Property) (-$230) (-$150)
Equals: General Fund Pension Contributions (net) $4,135 $5,099
Source: (i) GOMB, Illinois Budget: Fiscal Year 2013 (Springfield, IL: GOMB, February 2012), Ch. 2-
18; and (ii)Public Act 97-0685
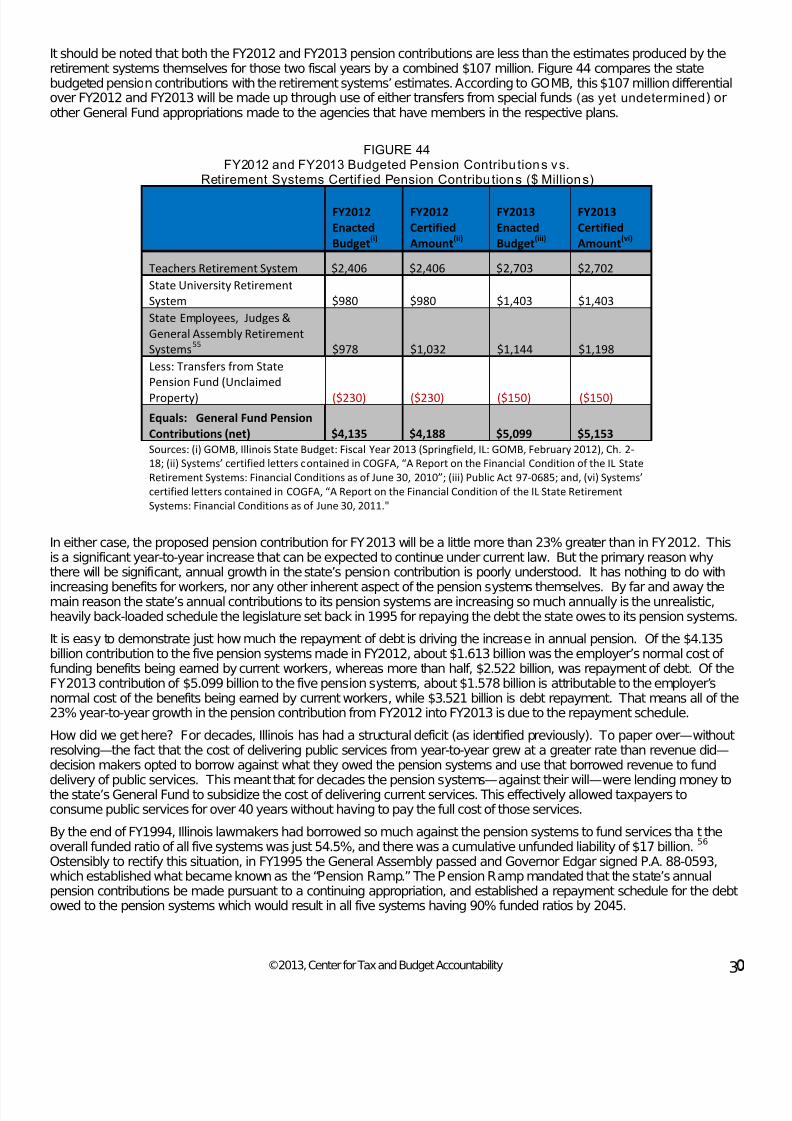
7/28/2019 Final_fy2013 Ctba Il Budget and Tax Primer
http://slidepdf.com/reader/full/finalfy2013-ctba-il-budget-and-tax-primer 34/60
©2013, Center for Tax and Budget Accountability 3
It should be noted that both the FY2012 and FY2013 pension contributions are less than the estimates produced by theretirement systems themselves for those two fiscal years by a combined $107 million. Figure 44 compares the statebudgeted pension contributions with the retirement systems’ estimates. According to GOMB, this $107 million differentialover FY2012 and FY2013 will be made up through use of either transfers from special funds (as yet undetermined) orother General Fund appropriations made to the agencies that have members in the respective plans.
FIGURE 44FY2012 and FY2013 Budgeted Pension Contribu tions vs.
Retirement Systems Certif ied Pension Contribu tions ($ Millions)
FY2012
Enacted
Budget(i)
FY2012
Certified
Amount(ii)
FY2013
Enacted
Budget(iii)
FY2013
Certified
Amount(vi)
Teachers Retirement System $2,406 $2,406 $2,703 $2,702
State University Retirement
System $980 $980 $1,403 $1,403
State Employees, Judges &
General Assembly Retirement
Systems55
$978 $1,032 $1,144 $1,198
Less: Transfers from State
Pension Fund (Unclaimed
Property) ($230) ($230) ($150) ($150)
Equals: General Fund Pension
Contributions (net) $4,135 $4,188 $5,099 $5,153
Sources: (i) GOMB, Illinois State Budget: Fiscal Year 2013 (Springfield, IL: GOMB, February 2012), Ch. 2-
18; (ii) Systems’ certified letters contained in COGFA, “A Report on the Financial Condition of the IL State
Retirement Systems: Financial Conditions as of June 30, 2010”; (iii) Public Act 97-0685; and, (vi) Systems’
certified letters contained in COGFA, “A Report on the Financial Condition of the IL State Retirement
Systems: Financial Conditions as of June 30, 2011."
In either case, the proposed pension contribution for FY2013 will be a little more than 23% greater than in FY2012. Thisis a significant year-to-year increase that can be expected to continue under current law. But the primary reason whythere will be significant, annual growth in the state’s pension contribution is poorly understood. It has nothing to do with
increasing benefits for workers, nor any other inherent aspect of the pension systems themselves. By far and away themain reason the state’s annual contributions to its pension systems are increasing so much annually is the unrealistic,heavily back-loaded schedule the legislature set back in 1995 for repaying the debt the state owes to its pension systems.
It is easy to demonstrate just how much the repayment of debt is driving the increase in annual pension. Of the $4.135billion contribution to the five pension systems made in FY2012, about $1.613 billion was the employer’s normal cost of funding benefits being earned by current workers, whereas more than half, $2.522 billion, was repayment of debt. Of theFY2013 contribution of $5.099 billion to the five pension systems, about $1.578 billion is attributable to the employer’snormal cost of the benefits being earned by current workers, while $3.521 billion is debt repayment. That means all of the23% year-to-year growth in the pension contribution from FY2012 into FY2013 is due to the repayment schedule.
How did we get here? For decades, Illinois has had a structural deficit (as identified previously). To paper over—withoutresolving—the fact that the cost of delivering public services from year-to-year grew at a greater rate than revenue did—decision makers opted to borrow against what they owed the pension systems and use that borrowed revenue to fund
delivery of public services. This meant that for decades the pension systems—against their will—were lending money tothe state’s General Fund to subsidize the cost of delivering current services. This effectively allowed taxpayers toconsume public services for over 40 years without having to pay the full cost of those services.
By the end of FY1994, Illinois lawmakers had borrowed so much against the pension systems to fund services that theoverall funded ratio of all five systems was just 54.5%, and there was a cumulative unfunded liability of $17 billion.
56
Ostensibly to rectify this situation, in FY1995 the General Assembly passed and Governor Edgar signed P.A. 88-0593,which established what became known as the “Pension Ramp.” The Pension Ramp mandated that the state’s annualpension contributions be made pursuant to a continuing appropriation, and established a repayment schedule for the debtowed to the pension systems which would result in all five systems having 90% funded ratios by 2045.
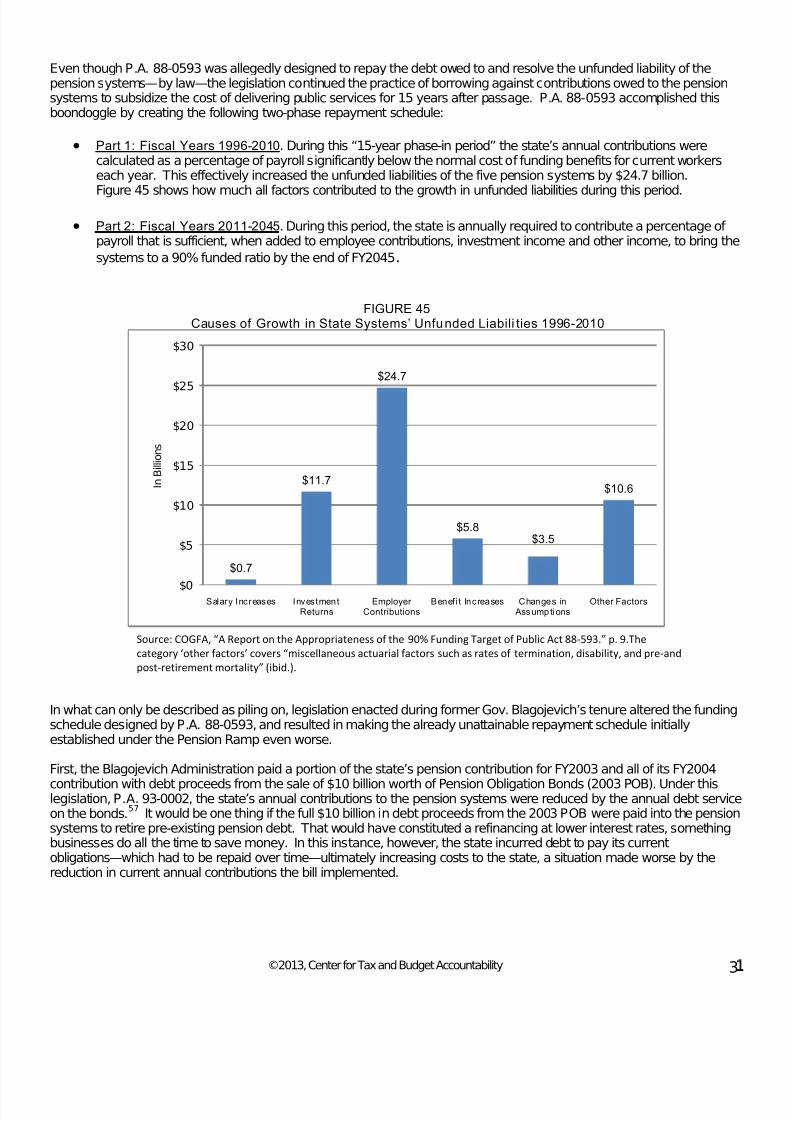
7/28/2019 Final_fy2013 Ctba Il Budget and Tax Primer
http://slidepdf.com/reader/full/finalfy2013-ctba-il-budget-and-tax-primer 35/60
©2013, Center for Tax and Budget Accountability 3
Even though P.A. 88-0593 was allegedly designed to repay the debt owed to and resolve the unfunded liability of thepension systems—by law—the legislation continued the practice of borrowing against contributions owed to the pensionsystems to subsidize the cost of delivering public services for 15 years after passage. P.A. 88-0593 accomplished thisboondoggle by creating the following two-phase repayment schedule:
• Part 1: Fiscal Years 1996-2010. During this “15-year phase-in period” the state’s annual contributions werecalculated as a percentage of payroll significantly below the normal cost of funding benefits for current workerseach year. This effectively increased the unfunded liabilities of the five pension systems by $24.7 billion.
Figure 45 shows how much all factors contributed to the growth in unfunded liabilities during this period.
• Part 2: Fiscal Years 2011-2045. During this period, the state is annually required to contribute a percentage of payroll that is sufficient, when added to employee contributions, investment income and other income, to bring the
systems to a 90% funded ratio by the end of FY2045.
FIGURE 45Causes of Growth in State Systems’ Unfunded Liabili ties 1996-2010
Source: COGFA, “A Report on the Appropriateness of the 90% Funding Target of Public Act 88-593.” p. 9.The
category ‘other factors’ covers “miscellaneous actuarial factors such as rates of termination, disability, and pre-and
post-retirement mortality” (ibid.).
In what can only be described as piling on, legislation enacted during former Gov. Blagojevich’s tenure altered the fundingschedule designed by P.A. 88-0593, and resulted in making the already unattainable repayment schedule initiallyestablished under the Pension Ramp even worse.
First, the Blagojevich Administration paid a portion of the state’s pension contribution for FY2003 and all of its FY2004
contribution with debt proceeds from the sale of $10 billion worth of Pension Obligation Bonds (2003 POB). Under thislegislation, P.A. 93-0002, the state’s annual contributions to the pension systems were reduced by the annual debt serviceon the bonds.
57
It would be one thing if the full $10 billion in debt proceeds from the 2003 POB were paid into the pensionsystems to retire pre-existing pension debt. That would have constituted a refinancing at lower interest rates, somethingbusinesses do all the time to save money. In this instance, however, the state incurred debt to pay its currentobligations—which had to be repaid over time—ultimately increasing costs to the state, a situation made worse by thereduction in current annual contributions the bill implemented.
$0.7
$11.7
$24.7
$5.8$3.5
$10.6
$0
$5
$10
$15
$20
$25
$30
Salary Increases InvestmentReturns
Employer Contributions
Benefit Increases Changes in Ass ump tions
Other Factors
I n
B i l l i o n s
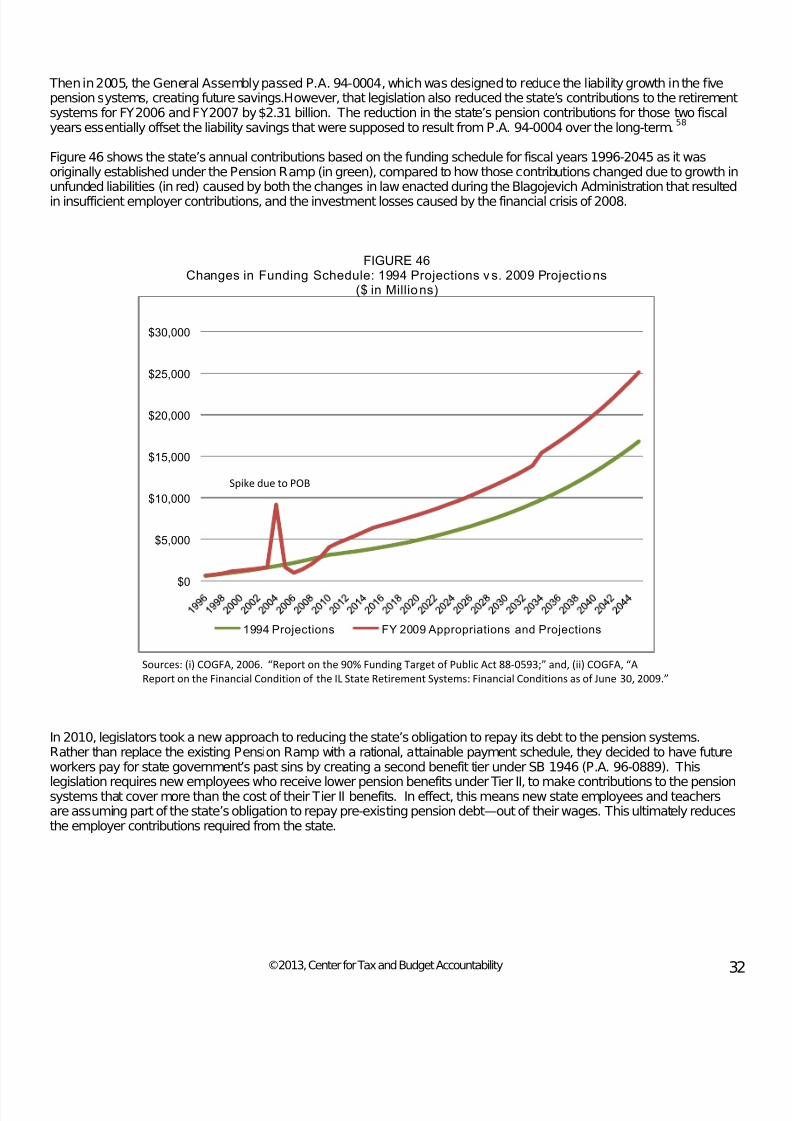
7/28/2019 Final_fy2013 Ctba Il Budget and Tax Primer
http://slidepdf.com/reader/full/finalfy2013-ctba-il-budget-and-tax-primer 36/60
©2013, Center for Tax and Budget Accountability 32
Then in 2005, the General Assembly passed P.A. 94-0004, which was designed to reduce the liability growth in the fivepension systems, creating future savings.However, that legislation also reduced the state’s contributions to the retirementsystems for FY2006 and FY2007 by $2.31 billion. The reduction in the state’s pension contributions for those two fiscalyears essentially offset the liability savings that were supposed to result from P.A. 94-0004 over the long-term.
58
Figure 46 shows the state’s annual contributions based on the funding schedule for fiscal years 1996-2045 as it wasoriginally established under the Pension Ramp (in green), compared to how those contributions changed due to growth inunfunded liabilities (in red) caused by both the changes in law enacted during the Blagojevich Administration that resultedin insufficient employer contributions, and the investment losses caused by the financial crisis of 2008.
FIGURE 46Changes in Funding Schedule: 1994 Projections v s. 2009 Projections
($ in Millions)
Sources: (i) COGFA, 2006. “Report on the 90% Funding Target of Public Act 88-0593;” and, (ii) COGFA, “A
Report on the Financial Condition of the IL State Retirement Systems: Financial Conditions as of June 30, 2009.”
In 2010, legislators took a new approach to reducing the state’s obligation to repay its debt to the pension systems.Rather than replace the existing Pension Ramp with a rational, attainable payment schedule, they decided to have futureworkers pay for state government’s past sins by creating a second benefit tier under SB 1946 (P.A. 96-0889). This
legislation requires new employees who receive lower pension benefits under Tier II, to make contributions to the pensionsystems that cover more than the cost of their Tier II benefits. In effect, this means new state employees and teachersare assuming part of the state’s obligation to repay pre-existing pension debt—out of their wages. This ultimately reducesthe employer contributions required from the state.
$0
$5,000
$10,000
$15,000
$20,000
$25,000
$30,000
1994 Projections FY 2009 Appropriations and Projections
Spike due to POBSpike due to POB
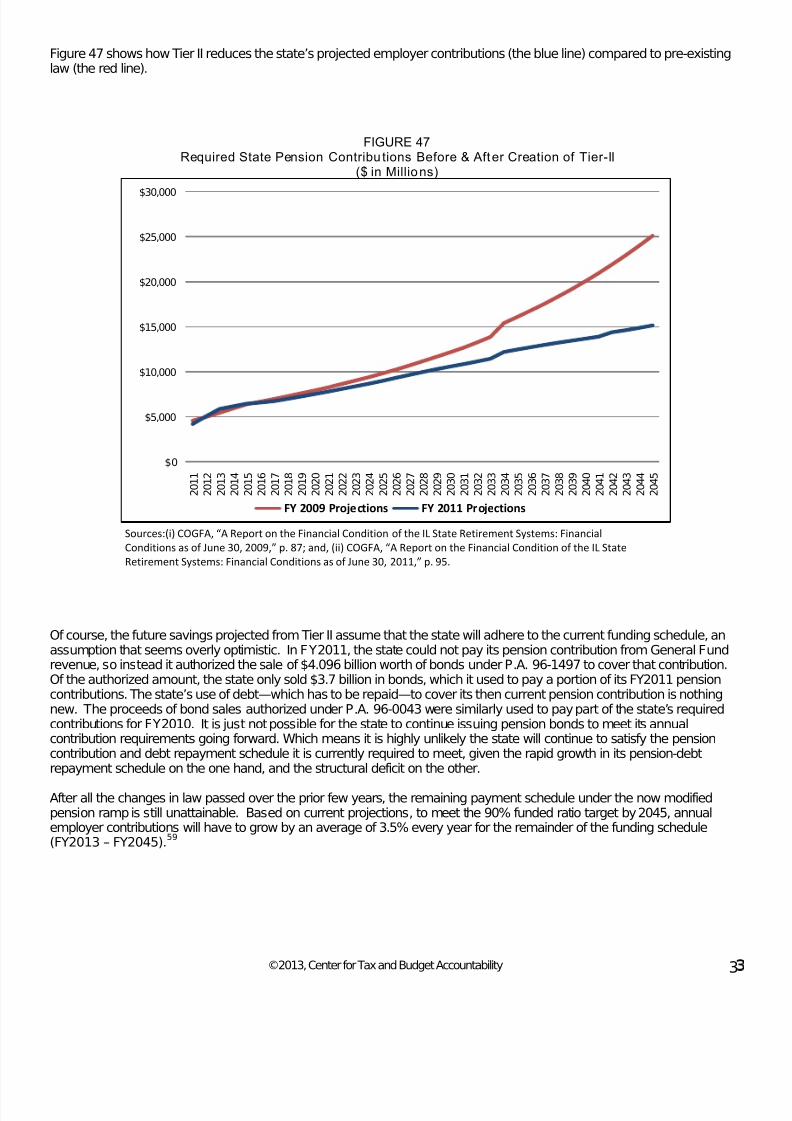
7/28/2019 Final_fy2013 Ctba Il Budget and Tax Primer
http://slidepdf.com/reader/full/finalfy2013-ctba-il-budget-and-tax-primer 37/60
©2013, Center for Tax and Budget Accountability 3
Figure 47 shows how Tier II reduces the state’s projected employer contributions (the blue line) compared to pre-existinglaw (the red line).
FIGURE 47Required State Pension Contribu tions Before & After Creation of Tier-II
($ in Millions)
Sources:(i) COGFA, “A Report on the Financial Condition of the IL State Retirement Systems: Financial
Conditions as of June 30, 2009,” p. 87; and, (ii) COGFA, “A Report on the Financial Condition of the IL State
Retirement Systems: Financial Conditions as of June 30, 2011,” p. 95.
Of course, the future savings projected from Tier II assume that the state will adhere to the current funding schedule, anassumption that seems overly optimistic. In FY2011, the state could not pay its pension contribution from General Fundrevenue, so instead it authorized the sale of $4.096 billion worth of bonds under P.A. 96-1497 to cover that contribution.Of the authorized amount, the state only sold $3.7 billion in bonds, which it used to pay a portion of its FY2011 pensioncontributions. The state’s use of debt—which has to be repaid—to cover its then current pension contribution is nothingnew. The proceeds of bond sales authorized under P.A. 96-0043 were similarly used to pay part of the state’s requiredcontributions for FY2010. It is just not possible for the state to continue issuing pension bonds to meet its annualcontribution requirements going forward. Which means it is highly unlikely the state will continue to satisfy the pensioncontribution and debt repayment schedule it is currently required to meet, given the rapid growth in its pension-debtrepayment schedule on the one hand, and the structural deficit on the other.
After all the changes in law passed over the prior few years, the remaining payment schedule under the now modifiedpension ramp is still unattainable. Based on current projections, to meet the 90% funded ratio target by 2045, annualemployer contributions will have to grow by an average of 3.5% every year for the remainder of the funding schedule(FY2013 – FY2045).
59
$0
$5,000
$10,000
$15,000
$20,000
$25,000
$30,000
2 0 1 1
2 0 1 2
2 0 1 3
2 0 1 4
2 0 1 5
2 0 1 6
2 0 1 7
2 0 1 8
2 0 1 9
2 0 2 0
2 0 2 1
2 0 2 2
2 0 2 3
2 0 2 4
2 0 2 5
2 0 2 6
2 0 2 7
2 0 2 8
2 0 2 9
2 0 3 0
2 0 3 1
2 0 3 2
2 0 3 3
2 0 3 4
2 0 3 5
2 0 3 6
2 0 3 7
2 0 3 8
2 0 3 9
2 0 4 0
2 0 4 1
2 0 4 2
2 0 4 3
2 0 4 4
2 0 4 5
FY 2009 Projections FY 2011 Projections
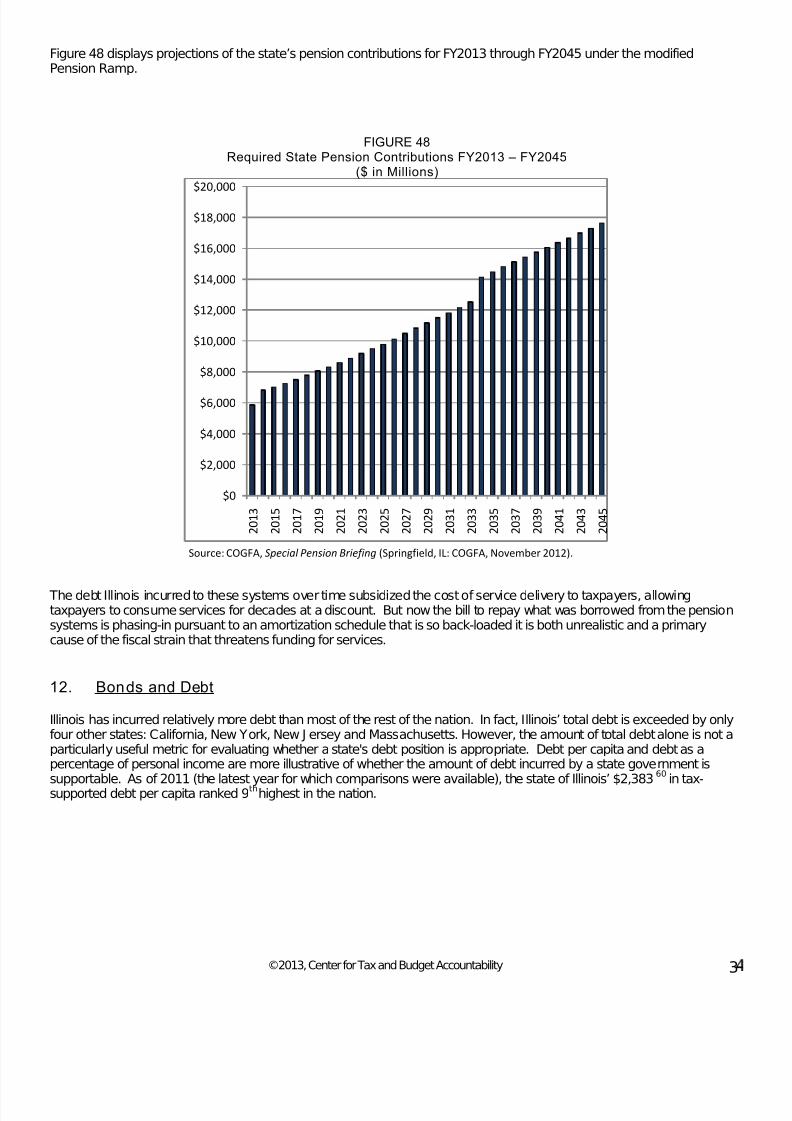
7/28/2019 Final_fy2013 Ctba Il Budget and Tax Primer
http://slidepdf.com/reader/full/finalfy2013-ctba-il-budget-and-tax-primer 38/60
©2013, Center for Tax and Budget Accountability 3
Figure 48 displays projections of the state’s pension contributions for FY2013 through FY2045 under the modifiedPension Ramp.
FIGURE 48Required State Pension Contributions FY2013 – FY2045
($ in Millions)
Source: COGFA, Special Pension Briefing (Springfield, IL: COGFA, November 2012).
The debt Illinois incurred to these systems over time subsidized the cost of service delivery to taxpayers, allowingtaxpayers to consume services for decades at a discount. But now the bill to repay what was borrowed from the pensionsystems is phasing-in pursuant to an amortization schedule that is so back-loaded it is both unrealistic and a primarycause of the fiscal strain that threatens funding for services.
12. Bonds and Debt
Illinois has incurred relatively more debt than most of the rest of the nation. In fact, Illinois’ total debt is exceeded by onlyfour other states: California, New York, New J ersey and Massachusetts. However, the amount of total debt alone is not aparticularly useful metric for evaluating whether a state's debt position is appropriate. Debt per capita and debt as apercentage of personal income are more illustrative of whether the amount of debt incurred by a state government is
supportable. As of 2011 (the latest year for which comparisons were available), the state of Illinois’ $2,383
60
in tax-supported debt per capita ranked 9thhighest in the nation.
$0
$2,000
$4,000
$6,000
$8,000
$10,000
$12,000
$14,000
$16,000
$18,000
$20,000
2 0 1 3
2 0 1 5
2 0 1 7
2 0 1 9
2 0 2 1
2 0 2 3
2 0 2 5
2 0 2 7
2 0 2 9
2 0 3 1
2 0 3 3
2 0 3 5
2 0 3 7
2 0 3 9
2 0 4 1
2 0 4 3
2 0 4 5
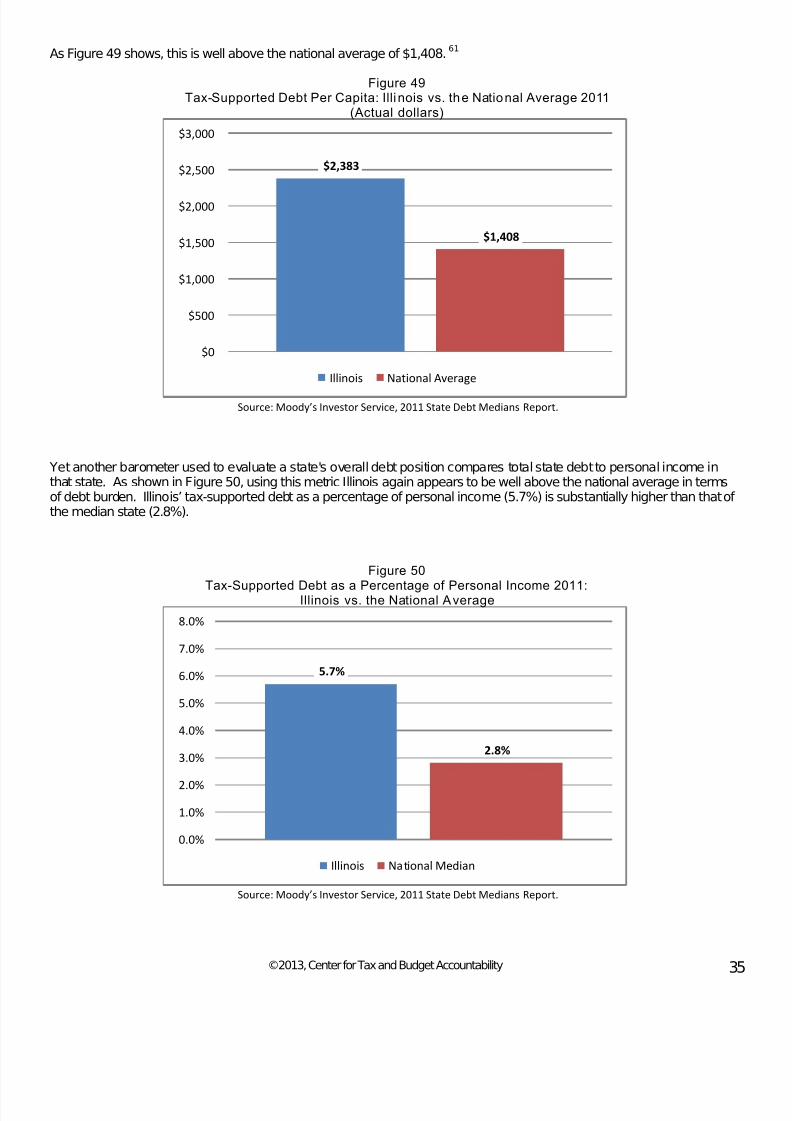
7/28/2019 Final_fy2013 Ctba Il Budget and Tax Primer
http://slidepdf.com/reader/full/finalfy2013-ctba-il-budget-and-tax-primer 39/60
©2013, Center for Tax and Budget Accountability 35
As Figure 49 shows, this is well above the national average of $1,408.61
Figure 49
Tax-Supported Debt Per Capita: Illinois vs. the National Average 2011 (Actual dollars)
Source: Moody’s Investor Service, 2011 State Debt Medians Report.
Yet another barometer used to evaluate a state's overall debt position compares total state debt to personal income inthat state. As shown in Figure 50, using this metric Illinois again appears to be well above the national average in termsof debt burden. Illinois’ tax-supported debt as a percentage of personal income (5.7%) is substantially higher than that of the median state (2.8%).
Figure 50
Tax-Supported Debt as a Percentage of Personal Income 2011:Illinois vs. the National Average
Source: Moody’s Investor Service, 2011 State Debt Medians Report.
$2,383
$1,408
$0
$500
$1,000
$1,500
$2,000
$2,500
$3,000
Illinois National Average
5.7%
2.8%
0.0%
1.0%
2.0%
3.0%
4.0%
5.0%
6.0%
7.0%
8.0%
Illinois National Median
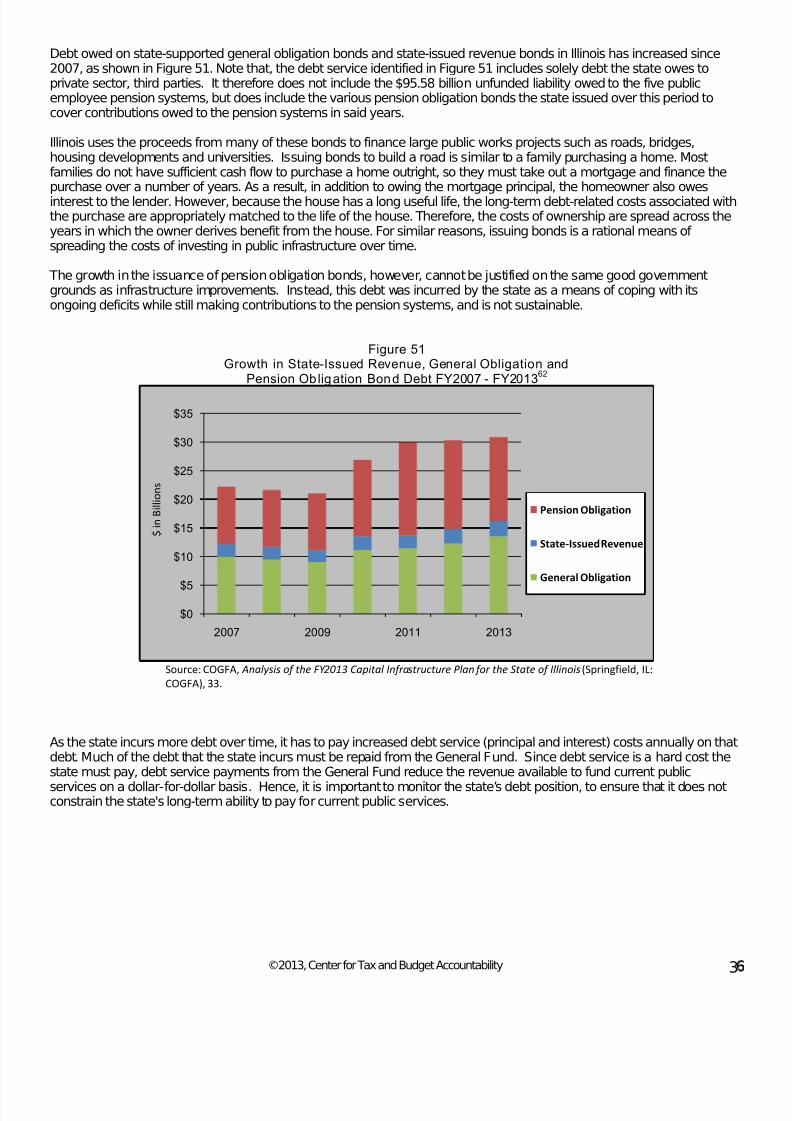
7/28/2019 Final_fy2013 Ctba Il Budget and Tax Primer
http://slidepdf.com/reader/full/finalfy2013-ctba-il-budget-and-tax-primer 40/60
©2013, Center for Tax and Budget Accountability 3
Debt owed on state-supported general obligation bonds and state-issued revenue bonds in Illinois has increased since2007, as shown in Figure 51. Note that, the debt service identified in Figure 51 includes solely debt the state owes toprivate sector, third parties. It therefore does not include the $95.58 billion unfunded liability owed to the five publicemployee pension systems, but does include the various pension obligation bonds the state issued over this period tocover contributions owed to the pension systems in said years.
Illinois uses the proceeds from many of these bonds to finance large public works projects such as roads, bridges,housing developments and universities. Issuing bonds to build a road is similar to a family purchasing a home. Mostfamilies do not have sufficient cash flow to purchase a home outright, so they must take out a mortgage and finance thepurchase over a number of years. As a result, in addition to owing the mortgage principal, the homeowner also owesinterest to the lender. However, because the house has a long useful life, the long-term debt-related costs associated withthe purchase are appropriately matched to the life of the house. Therefore, the costs of ownership are spread across theyears in which the owner derives benefit from the house. For similar reasons, issuing bonds is a rational means of spreading the costs of investing in public infrastructure over time.
The growth in the issuance of pension obligation bonds, however, cannot be justified on the same good governmentgrounds as infrastructure improvements. Instead, this debt was incurred by the state as a means of coping with itsongoing deficits while still making contributions to the pension systems, and is not sustainable.
Figure 51 Growth in State-Issued Revenue, General Obligation and
Pension Obligation Bond Debt FY2007 - FY201362
Source: COGFA, Analysis of the FY2013 Capital Infrastructure Plan for the State of Illinois (Springfield, IL:
COGFA), 33.
As the state incurs more debt over time, it has to pay increased debt service (principal and interest) costs annually on thatdebt. Much of the debt that the state incurs must be repaid from the General Fund. Since debt service is a hard cost thestate must pay, debt service payments from the General Fund reduce the revenue available to fund current public
services on a dollar-for-dollar basis. Hence, it is important to monitor the state’s debt position, to ensure that it does notconstrain the state's long-term ability to pay for current public services.
$0
$5
$10
$15
$20
$25
$30
$35
2007 2009 2011 2013
$ i
n B
i l l i o n s
Pension Obligation
State-Issued Revenue
General Obligation
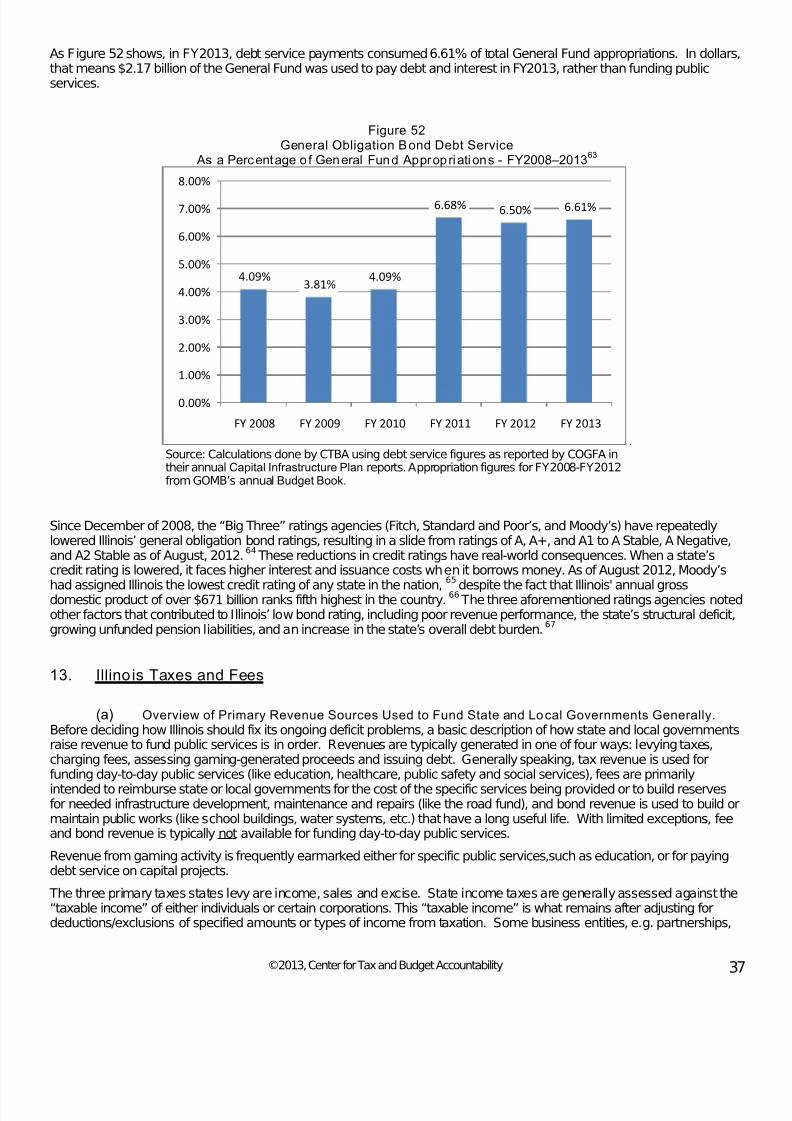
7/28/2019 Final_fy2013 Ctba Il Budget and Tax Primer
http://slidepdf.com/reader/full/finalfy2013-ctba-il-budget-and-tax-primer 41/60
©2013, Center for Tax and Budget Accountability 37
As Figure 52 shows, in FY2013, debt service payments consumed 6.61% of total General Fund appropriations. In dollarsthat means $2.17 billion of the General Fund was used to pay debt and interest in FY2013, rather than funding publicservices.
Figure 52 General Obligation Bond Debt Service
As a Percentage o f General Fund Appropriations - FY2008–201363
. Source: Calculations done by CTBA using debt service figures as reported by COGFA intheir annual Capital Infrastructure Plan reports. Appropriation figures for FY2008-FY2012from GOMB’s annual Budget Book.
Since December of 2008, the “Big Three” ratings agencies (Fitch, Standard and Poor’s, and Moody’s) have repeatedlylowered Illinois’ general obligation bond ratings, resulting in a slide from ratings of A, A+, and A1 to A Stable, A Negative,and A2 Stable as of August, 2012.
64These reductions in credit ratings have real-world consequences. When a state’s
credit rating is lowered, it faces higher interest and issuance costs whenit borrows money. As of August 2012, Moody’s
had assigned Illinois the lowest credit rating of any state in the nation,
65
despite the fact that Illinois' annual grossdomestic product of over $671 billion ranks fifth highest in the country.66
The three aforementioned ratings agencies notedother factors that contributed to Illinois’ low bond rating, including poor revenue performance, the state’s structural deficit,growing unfunded pension liabilities, and an increase in the state’s overall debt burden.
67
13. Illinois Taxes and Fees
(a) Overview of Primary Revenue Sources Used to Fund State and Local Governments Generally. Before deciding how Illinois should fix its ongoing deficit problems, a basic description of how state and local governmentsraise revenue to fund public services is in order. Revenues are typically generated in one of four ways: levying taxes,charging fees, assessing gaming-generated proceeds and issuing debt. Generally speaking, tax revenue is used forfunding day-to-day public services (like education, healthcare, public safety and social services), fees are primarily
intended to reimburse state or local governments for the cost of the specific services being provided or to build reservesfor needed infrastructure development, maintenance and repairs (like the road fund), and bond revenue is used to build ormaintain public works (like school buildings, water systems, etc.) that have a long useful life. With limited exceptions, feeand bond revenue is typically not available for funding day-to-day public services.
Revenue from gaming activity is frequently earmarked either for specific public services,such as education, or for payingdebt service on capital projects.
The three primary taxes states levy are income, sales and excise. State income taxes are generally assessed against the“taxable income” of either individuals or certain corporations. This “taxable income” is what remains after adjusting fordeductions/exclusions of specified amounts or types of income from taxation. Some business entities, e.g. partnerships,
4.09%3.81%
4.09%
6.68% 6.50% 6.61%
0.00%
1.00%
2.00%
3.00%
4.00%
5.00%
6.00%
7.00%
8.00%
FY 2008 FY 2009 FY 2010 FY 2011 FY 2012 FY 2013

7/28/2019 Final_fy2013 Ctba Il Budget and Tax Primer
http://slidepdf.com/reader/full/finalfy2013-ctba-il-budget-and-tax-primer 42/60
©2013, Center for Tax and Budget Accountability 3
“S”–corporations and limited liability companies, by law are not assessed any income taxes no matter how profitable.Instead, the owners of those businesses pay personal income taxes on the profits of the businesses they own, inaccordance with their respective percentage ownership interests in the underlying business. Most states (includingIllinois), piggyback to a great extent on federal law in defining what is and what is not included within taxable income, withsome notable exceptions. For instance, while most retirement income is subject to the federal income tax, it is not subjectto the Illinois state income tax.
68
Sales taxes are generally based on a percentage of the final purchase price of those goods and services included withinthe sales tax “base.” The “base” of a tax is simply what items the tax is assessed against.
Excise taxes are like sales taxes in that they apply to goods or services sold in the economy. They are unlike sales taxeshowever, in one fundamental way. Instead of being based on a percentage of the price of the good or service sold, excisetaxes are usually a fixed charge per unit. Examples of an excise tax would be, for instance, the $1.98 Illinois state tax perpackage of cigarettes. In this case, the $1.98 excise tax per pack remains constant over time, irrespective of any changesin the price of cigarettes.
While a few states levy a property tax (e.g. Michigan), in the vast majority of cases property taxes are purely a localrevenue source levied by local governments such as counties, municipalities, school districts, park districts and the like.Illinois does not impose a state-level property tax.
Unlike taxes, which generate general revenue states can typically use for spending on any services their GeneralAssemblies deem appropriate, fee-based revenue is usually restricted to reimbursing a government entity for the cost of providing a specific service. Illinois is typical in this regard, in that in most cases the state’s constitutionrestricts the value
of fees being charged to the amount reasonably necessary to reimburse the state for the cost of providing specificservices.69
Gaming revenue can come from a variety of sources. For quite some time, Illinois has generated gaming revenue fromboth the operation of a state lottery and from imposing an assessment against the earnings of the horseracing andriverboat casino industries.
70Illinois has recently authorized video gaming,
71which should start generating revenue this
fiscal year. In FY2012, state revenue from all gaming sources totaled $1.056 billion.72
Of that total, 67.0% came from thelottery, 32.2% came from riverboat casinos, and just 0.8% came from horseracing.
73
Roughly, 11.6% of the revenues that make up the General Fund are transfers from the federal government. Figure 53shows the various revenue sources that currently feed the Illinois General Fund.
Finally, there are also transfers of revenue from other governments – like the federal government for instance – and from the many special funds into theGeneral Fund which occur annually.
Figure 53Estimate of FY2013 Illinois General Fund Revenues
by Source as a Percentage of Total Revenues
Source: House Joint Resolution 68 of the 97th
Illinois General Assembly.
Individual
Income Tax
44.9%
Corporate
Income Tax
7.4%
Sales Taxes
21.8%
Public Utility3.2%
Federal
Sources
11.7%
Other
Sources
8.1%
Lottery and
Riverboat
Gaming 2.9%
7/28/2019 Final_fy2013 Ctba Il Budget and Tax Primer
http://slidepdf.com/reader/full/finalfy2013-ctba-il-budget-and-tax-primer 43/60
©2013, Center for Tax and Budget Accountability 3
(b) The Elements of a Sound, Modern Tax System. Knowing the different sources of revenue is helpful,but not enough to make policy decisions about which should be kept, eliminated, increased or decreased. That isbecause a sound tax system depends on a number of factors, such aswhether or not it has a proper mix of tax revenuesources, the base of each tax, and how tax burden is distributed among taxpayers. There are basically four principles touse as guideposts for creating a sound tax system.
74
First, tax policy should be fair . "Fairness" for tax policy purposes is measured in two ways: "horizontally", that iscomparing the tax burden of different taxpayers with similar income levels, and "vertically", that is comparing the taxburden of taxpayers across different income levels.
75Tax policy achieves horizontal fairness if taxpayers with similar
incomes have similar tax burdens. A tax system will have horizontal fairness when it does not contain numerous taxbreaks which favor one taxpayer over another similarly situated taxpayer. Tax policy achieves vertical fairness if the taxburden imposed across different income levels is "progressive", that is, high-income taxpayers havegreater tax burdensthan low and moderate-income taxpayers, when tax burden is measured as a percentage of income.
76
Second, taxes should be assessed to respond to how growth is actually realized and distributed in the economy. Thatmeans taxes should be imposed where economic activity is significant and where it is increasing over time. A responsivetax system generates revenue growth that keeps pace with the inflationary cost growth of providing services overtime,since it responds to growing economic activity. The plus of a very responsive tax is during times of exceptional economicgrowth, it generates significantly more revenue that in turn can be placed in a rainy day fund to help get through down
cycles. Many states have rainy day funds since the downside of a very responsive tax is that it tends to generatesignificantly diminished revenue during poor economic cycles. As with creating tax fairness, a graduated income tax ratestructure that includes most forms of income is one of the best ways to ensure a tax system is responsive to incomedistribution in the modern economy.
A graduatedincome tax rate structure is the favored method of creating vertical fairness in a tax system. Under a graduated incometax rate structure, rather than have one tax rate that applies to all of a taxpayer’s taxable income, variousmarginal incometax rates,which increase as taxable income increases, apply to different ranges of taxable income. The Illinois constitutiononly authorizes a flat-rate income tax; a graduate tax rate is not permitted.
Third, a tax system should have a stable revenue source. A stable tax maintains some decent base revenue generationeven during poor economic cycles. Generally, having a sales tax that is imposed on a broad range of the transactionsactually occurring in the consumer economy is the best way to bring some stability to a state-level tax system. Illinois’sales tax is imposed primarily on the transfer of tangible goods, which is a narrowing portion of the entire consumereconomy. Local property taxes, which are also stable, typically are not levied by a state, but rather by local governments,and therefore provide stability in revenue collection to local, not state governments.
Fourth, tax policy should be efficient. An efficient tax system is one that has minimal impact on important private sector
economic decisions, such aswhere to purchase a home or locate a business.77
Efficiently assessed property taxes should not unduly influence significant private sector location decisions because thedemand for home ownership and/or commercial or industrial facilities is relatively constant over time,
In other words, for the most part, a taxsystem should not distort what should be private, market-based decisions. Generally, a tax becomes more efficient as thesize of the jurisdiction grows. State-based revenue sources, such asincome and sales taxes, are more efficient than localrevenue sources such asproperty taxes, in funding public services. This is because unlike state-based taxes that areassessed at uniform rates throughout a state, local property tax rates vary across that state, resulting in tax competitionbetween and among local governments.
78
Over reliance on property taxes to fund major public services,such aseducation, has the potential to distort economicdecisions made by taxpayers and create great differences in the quality and distribution of such services. This is becausewhen property tax rates are high in comparison to the value of available local services, both businesses and individualshave an incentive to leave the area, and a disincentive to locate in that area. This results in a local community suffering adecrease in its property tax base and values, and forces that community to increase property tax rates even higher, as theservices it can afford to provide decline. Frequently, the resultant higher tax rate is then assessed against the remaininglower income individuals, which, in addition to being inefficient, contributes to regressivity.
so the decision topurchase or sell a tract of property is not greatly influenced by property tax rates, assuming they do not vary significantlyfrom community to community. Moreover, once a taxpayer owns a residence or commercial or industrial facility, thattaxpayer is likely to remain at such location for a significant period of time, and usually relocates for reasons that havenothing to do with tax burden, so long as property tax burden remains fair in light of the associated public services (such
as education, health, sewer, water, transportation and security) it funds.
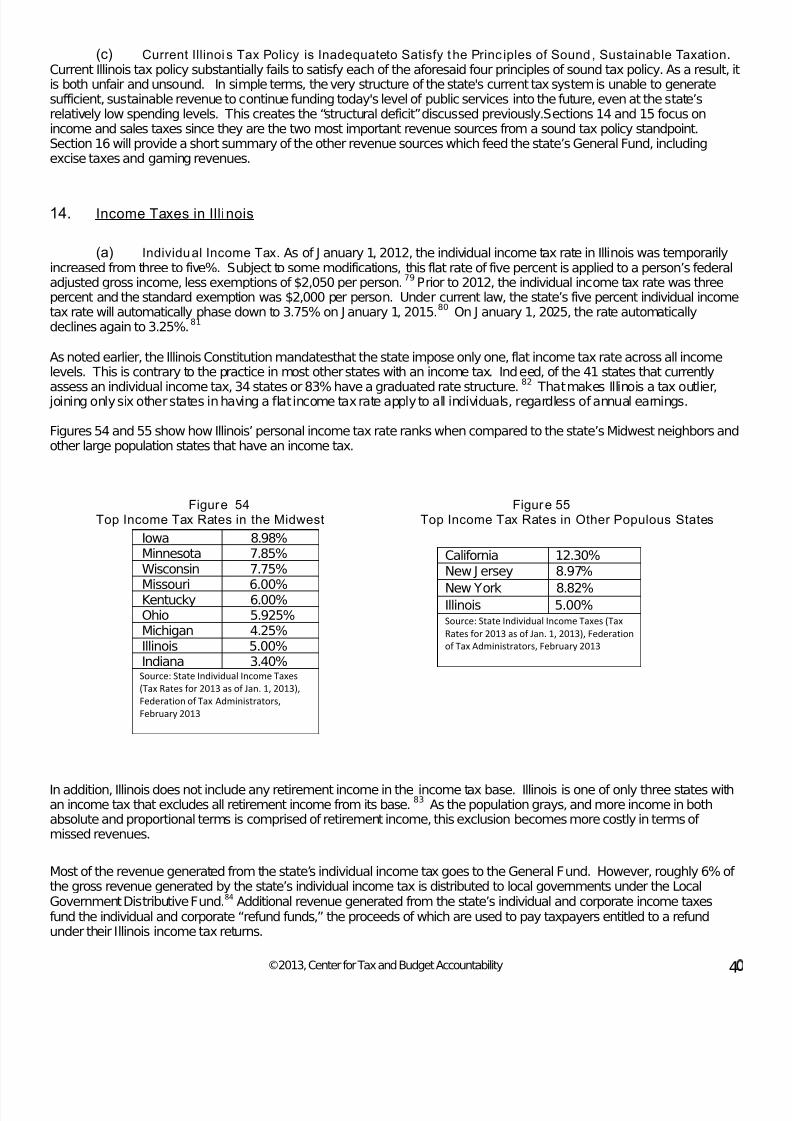
7/28/2019 Final_fy2013 Ctba Il Budget and Tax Primer
http://slidepdf.com/reader/full/finalfy2013-ctba-il-budget-and-tax-primer 44/60
©2013, Center for Tax and Budget Accountability 4
(c) Current Illinoi s Tax Policy is Inadequateto Satisfy t he Princ iples of Sound , Sustainable Taxation .Current Illinois tax policy substantially fails to satisfy each of the aforesaid four principles of sound tax policy. As a result, itis both unfair and unsound. In simple terms, the very structure of the state's current tax system is unable to generatesufficient, sustainable revenue to continue funding today's level of public services into the future, even at the state’srelatively low spending levels. This creates the “structural deficit” discussed previously.Sections 14 and 15 focus onincome and sales taxes since they are the two most important revenue sources from a sound tax policy standpoint.Section 16 will provide a short summary of the other revenue sources which feed the state’s General Fund, includingexcise taxes and gaming revenues.
14. Income Taxes in Illinois
(a) Individual Income Tax. As of J anuary 1, 2012, the individual income tax rate in Illinois was temporarilyincreased from three to five%. Subject to some modifications, this flat rate of five percent is applied to a person’s federaladjusted gross income, less exemptions of $2,050 per person.79 Prior to 2012, the individual income tax rate was threepercent and the standard exemption was $2,000 per person. Undercurrent law, the state’s five percent individual incometax rate will automatically phase down to 3.75% on J anuary 1, 2015.80 On J anuary 1, 2025, the rate automaticallydeclines again to 3.25%.81
As noted earlier, the Illinois Constitution mandatesthat the state impose only one, flat income tax rate across all incomelevels. This is contrary to the practice in most other states with an income tax. Indeed, of the 41 states that currently
assess an individual income tax, 34 states or 83% have a graduated rate structure.
82
That makes Illinois a tax outlier, joining only six other states in having a flat income tax rate apply to all individuals, regardless of annual earnings.
Figures 54 and 55 show how Illinois’ personal income tax rate ranks when compared to the state’s Midwest neighbors andother large population states that have an income tax.
Figure 54 Figure 55Top Income Tax Rates in the Midwest Top Income Tax Rates in Other Populous States
In addition, Illinois does not include any retirement income in the income tax base. Illinois is one of only three states withan income tax that excludes all retirement income from its base.
83
As the population grays, and more income in bothabsolute and proportional terms is comprised of retirement income, this exclusion becomes more costly in terms of missed revenues.
Most of the revenue generated from the state’s individual income tax goes to the General Fund. However, roughly 6% of the gross revenue generated by the state’s individual income tax is distributed to local governments under the LocalGovernment Distributive Fund.
84
Iowa
Additional revenue generated from the state’s individual and corporate income taxesfund the individual and corporate “refund funds,” the proceeds of which are used to pay taxpayers entitled to a refundunder their Illinois income tax returns.
8.98%Minnesota 7.85%Wisconsin 7.75%
Missouri 6.00%Kentucky 6.00%Ohio 5.925%Michigan 4.25%Illinois 5.00%Indiana 3.40%Source: State Individual Income Taxes
(Tax Rates for 2013 as of Jan. 1, 2013),
Federation of Tax Administrators,
February 2013
California 12.30%New J ersey 8.97%
New York 8.82%Illinois 5.00%Source: State Individual Income Taxes (Tax
Rates for 2013 as of Jan. 1, 2013), Federation
of Tax Administrators, February 2013
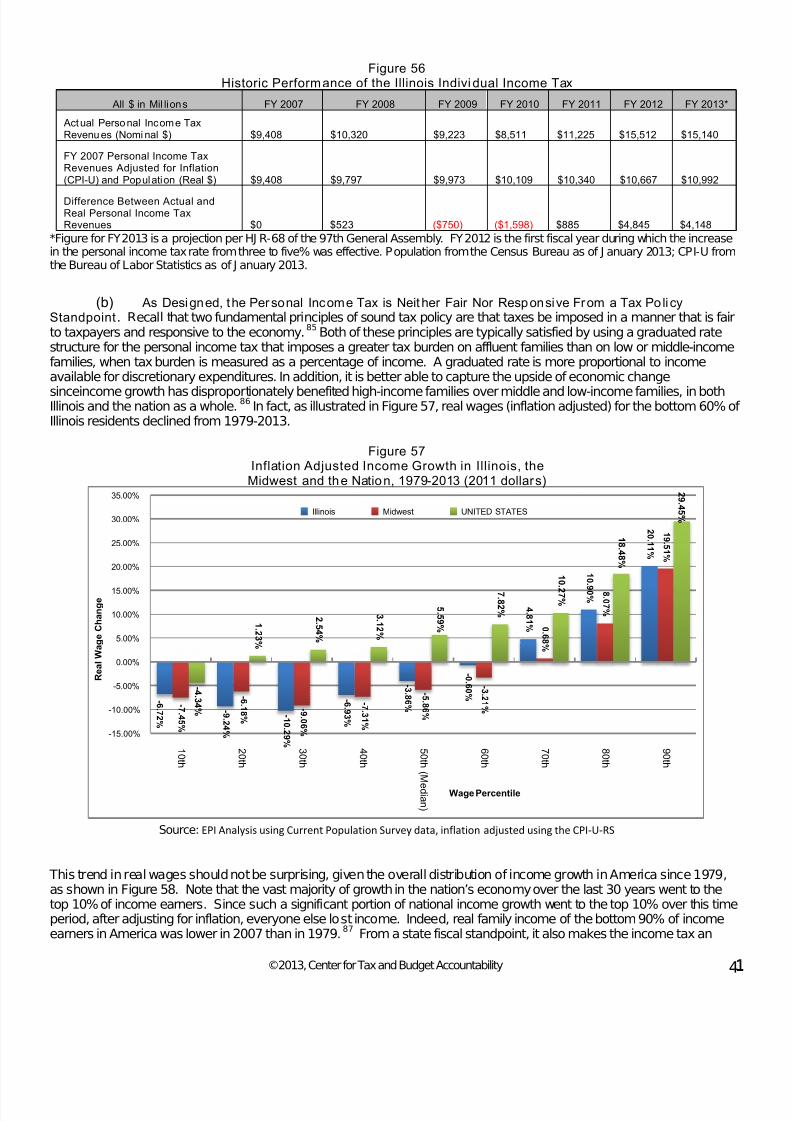
7/28/2019 Final_fy2013 Ctba Il Budget and Tax Primer
http://slidepdf.com/reader/full/finalfy2013-ctba-il-budget-and-tax-primer 45/60
©2013, Center for Tax and Budget Accountability 4
Figure 56Historic Performance of the Illinois Individual Income Tax
All $ in Mil lions FY 2007 FY 2008 FY 2009 FY 2010 FY 2011 FY 2012 FY 2013*
Actual Personal Income TaxRevenues (Nomi nal $) $9,408 $10,320 $9,223 $8,511 $11,225 $15,512 $15,140
FY 2007 Personal Income TaxRevenues Adjusted for Inflation(CPI-U) and Population (Real $) $9,408 $9,797 $9,973 $10,109 $10,340 $10,667 $10,992
Difference Between Actual andReal Personal Income TaxRevenues $0 $523 ($750) ($1,598) $885 $4,845 $4,148
*Figure for FY2013 is a projection per HJ R-68 of the 97th General Assembly. FY2012 is the first fiscal year during which the increasein the personal income tax rate from three to five% was effective. Population from the Census Bureau as of J anuary 2013; CPI-U fromthe Bureau of Labor Statistics as of J anuary 2013.
(b) As Designed, the Personal Income Tax is Neither Fair Nor Responsive From a Tax Po licyStandpoint. Recall that two fundamental principles of sound tax policy are that taxes be imposed in a manner that is fairto taxpayers and responsive to the economy.85 Both of these principles are typically satisfied by using a graduated ratestructure for the personal income tax that imposes a greater tax burden on affluent families than on low or middle-incomefamilies, when tax burden is measured as a percentage of income. A graduated rate is more proportional to incomeavailable for discretionary expenditures. In addition, it is better able to capture the upside of economic change
sinceincome growth has disproportionately benefited high-income families over middle and low-income families, in bothIllinois and the nation as a whole.
86
Figure 57
In fact, as illustrated in Figure 57, real wages (inflation adjusted) for the bottom 60% ofIllinois residents declined from 1979-2013.
Inflation Adjusted Income Growth in Illinois, theMidwest and the Nation, 1979-2013 (2011 dollars)
Source: EPI Analysis using Current Population Survey data, inflation adjusted using the CPI-U-RS
This trend in real wages should not be surprising, given the overall distribution of income growth in America since 1979,as shown in Figure 58. Note that the vast majority of growth in the nation’s economy over the last 30 years went to thetop 10% of income earners. Since such a significant portion of national income growth went to the top 10% over this timeperiod, after adjusting for inflation, everyone else lost income. Indeed, real family income of the bottom 90% of incomeearners in America was lower in 2007 than in 1979.87 From a state fiscal standpoint, it also makes the income tax an
- 6 .7 2 %
- 9 .2 4 %
-1 0 .2 9 %
- 6 . 9 3 %
- 3 . 8 6 %
- 0 . 6 0 %
4 . 8 1 %
1 0
. 9 0 %
2 0 .1 1 %
-7 .4 5 %
- 6 .1 8 %
- 9 . 0 6 %
-7 . 3 1 %
- 5 . 8 6 %
- 3 .2 1 %
0 . 6 8 %
8 . 0 7 %
1 9 . 5 1 %
-4 . 3 4 %
1 .2 3 %
2 . 5 4 %
3 .1 2 %
5 . 5 9 %
7 . 8 2 %
1 0 .2 7 %
1 8 .4 8 %
2 9 .4 5 %
-15.00%
-10.00%
-5.00%
0.00%
5.00%
10.00%
15.00%
20.00%
25.00%
30.00%
35.00%
1 0 t h
2 0 t h
3 0 t h
4 0 t h
5 0 t h ( M
e d i an )
6 0 t h
7 0 t h
8 0 t h
9 0 t h
Illinois Midwest UNITED STATES
Wage Percentile
R e a l W a g e C h a n g e

7/28/2019 Final_fy2013 Ctba Il Budget and Tax Primer
http://slidepdf.com/reader/full/finalfy2013-ctba-il-budget-and-tax-primer 46/60
©2013, Center for Tax and Budget Accountability 42
unreliable source of revenues that is not able to maintain pace with even small inflationary increases in the cost of fundingbasic government operations over time.
Figure 58
Distribut ion of US Income Growth Over Time
Families 1947 - 1979 1979 - 2007
Top 10% 34.10% 63.70%
Bottom 90% 65.90% 36.30%Source: PikettyandSaez, "Striking it Richer: The Evolution of Top Incomes in the United States (Update with 2007estimates),"August 5, 2009, U. C. Berkeley; Calculations from J ohn Schmidt, Challenge, September - October 2010.
Interestingly, none other than Adam Smith, the father of capitalism, anticipated that income distribution would skew to thetop under capitalism. That is why he opined in his seminal workThe Wealth of Nations, that “The subjects of every stateought to contribute toward the support of government as nearly as possible, in proportion to their respective abilities; thatis, in proportion to the revenue which they respectively enjoy under the protection of the state.”
88Smith specifically
endorsed the idea that tax policy should “remedy inequality of riches as much as possible, by relieving the poor andburdening the rich.”89
Unfortunately, the state constitutional mandate that Illinois have only one flat income tax rate that applies to all taxpayersmakes it very difficult to use the state’s income tax to create tax fairness as described by Adam Smith. Indeed, as Figure59 illustrates, overall tax burden in Illinois is regressive, does not adjust for ability to pay and is therefore unfair from a taxpolicy standpoint. Indeed, after adjusting for federal tax offsets, the bottom 20% of income earners in Illinois have statetax burdens that are nearly double the tax burden of high-income earners. That makes Illinois one of the fourth mostregressive taxing states in the nation.
90
Figure 59
Illinois State & Local Taxes Paid as a Share of Family Income for Non-Elderly Taxpayers91
Top 20%
Income Group Lowest 20% Second 20% Middle 20% Fourth 20%Next Next Top
15% 4% 1%
IncomeLess than
$18,000
$18,000 –
$36,000
$36,000 –
$57,000
$57,000 –
$93,000
$93,000 –
$182,000
$182,000–
$445,000
$445,000 or
more
Average Income in
Group$10,100 $26,900 $46,800 $73,500 $124,100 $273,800 $1,489,200
Sales & Excise Taxes 7.40% 5.80% 4.60% 3.70% 2.70% 1.80% 0.90%
Property Taxes 5.20% 4.20% 4.00% 4.30% 4.50% 3.80% 2.10%
Income Taxes 1.20% 2.20% 2.80% 2.90% 2.90% 2.90% 3.10%
TOTAL TAXES 13.80% 12.10% 11.30% 11.00% 10.10% 8.50% 6.00%
Federal Deduction
Offset –0.0% –0.1% –0.5% –0.7% –1.2% –1.0% –1.1%
TOTAL AFTER OFFSET 13.80% 12.10% 10.90% 10.3.% 9.00% 7.60% 4.90%
Source: Institute on Taxation and Economic Policy, Who Pays? A Distributional Analysis of Tax Systems in All50 States, p 52, Fourth Edition J anuary 2013.

7/28/2019 Final_fy2013 Ctba Il Budget and Tax Primer
http://slidepdf.com/reader/full/finalfy2013-ctba-il-budget-and-tax-primer 47/60
©2013, Center for Tax and Budget Accountability 4
Figure 60 illustrates how income inequality in the nation has actually grown significantly in the past 40 years which, froman economic standpoint, the regressive nature of the Illinois tax system actually worsens.
Figure 60 Shares of Household Income by Quinti les:
1971, 1991, and 2011
Source: U.S. Census Bureau, Current Population Survey.
Because the state’spersonal income tax is set at a flat rate across all income levels, it also fails to "respond" to howeconomic growth is distributed in the economy over time. Consider the importance of a responsive fiscal system. If theconcept is to design a system that keeps up with the modern economy and generates adequate revenue to sustainfunding of core services over time, then focusing on low- and middle-income families makes no sense. From a fiscal
standpoint, low and middle income taxpayers are a poor revenue source that remains relatively poor over time. Low- andmiddle-income families not only make less money than their affluent counterparts, historically they also do not gainanywhere near the share in long-term economic growth that more affluent families gain. Put another way, focusing overalltax burden on a demographic that has flat to declining incomes after adjusting for inflation necessarily means annualrevenue growth will be constrained over time.
Furthermore, Illinois’ tax system hinders economic growth. The reason for this is simple. The biggest driver of the privatesector economy is consumer spending, which accounts for over 68% of all economic activity.
92 Low and middle-incomefamilies are the state’s primary consumers. This is because as they gain more income, they tend to spend most of itquickly, putting the money back into the local economy.
93The tendency to consume rather than save is for obvious
reasons, low and middle income families have more basic needs than affluent taxpayers, and much less income over timeto cover those needs. Hence, the wealthy have the earnings capacity to save, while low and middle income familiesconsume. In economic terms, this means low and middle income families have a high “marginal propensity toconsume”.
94
That is, for every additional dollar they receive in income, they are much more likely to spend it—andprimarily in the local economy—than save it. This is why a sales tax affects low and middle income families more than itdoes higher income families—a significantly greater portion of the total income earned by low and middle income familiesis spent on consumption.
Nobel Prize winning economist Joseph Stiglitzfound that modestly increasing income taxes on high-income earners, onthe other hand, does not materially reduce their spending.95 This is because affluent families enjoy such a significantportion of all income growth that they have a very low marginal propensity to consume. Additionally, there is clear, data-based evidence which shows that imposing high marginal state income tax rates on the wealthy does not impede stateeconomic growth over the long-term. A study published by the Institute on Taxation and Economic Policy (ITEP),reviewed how the nine states with the highest marginal individual income tax rates compared to the nine states with no
3.2%
8.4%
14.3%
23.0%
51.1%
22.3%
0%
10%
20%
30%
40%
50%
60%
Lowest 20% Second 20% Third 20% Fourth 20% Highest 20% Top 5%
1971
1991
2011
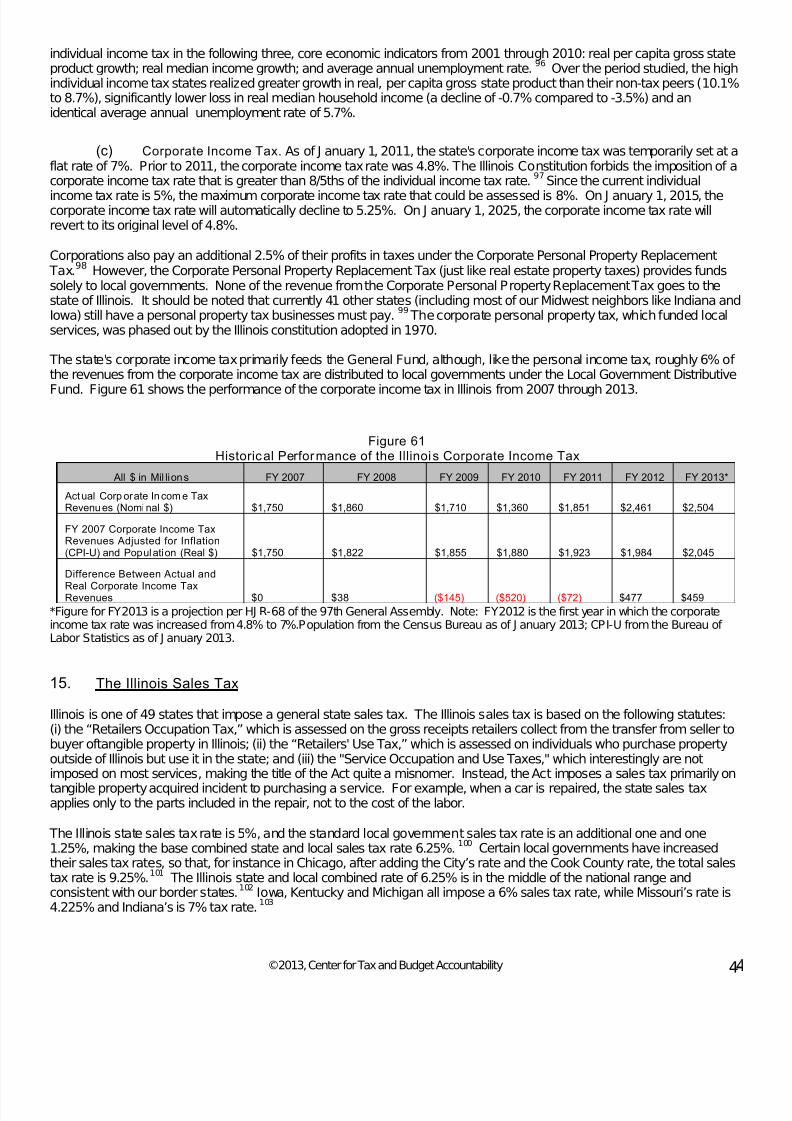
7/28/2019 Final_fy2013 Ctba Il Budget and Tax Primer
http://slidepdf.com/reader/full/finalfy2013-ctba-il-budget-and-tax-primer 48/60
©2013, Center for Tax and Budget Accountability 4
individual income tax in the following three, core economic indicators from 2001 through 2010: real per capita gross stateproduct growth; real median income growth; and average annual unemployment rate.
96
Over the period studied, the highindividual income tax states realized greater growth in real, per capita gross state product than their non-tax peers (10.1%to 8.7%), significantly lower loss in real median household income (a decline of -0.7% compared to -3.5%) and anidentical average annual unemployment rate of 5.7%.
(c) Corporate Income Tax. As of J anuary 1, 2011, the state's corporate income tax was temporarily set at aflat rate of 7%. Prior to 2011, the corporate income tax rate was 4.8%. The Illinois Constitution forbids the imposition of acorporate income tax rate that is greater than 8/5ths of the individual income tax rate.
97
Corporations also pay an additional 2.5% of their profits in taxes under the Corporate Personal Property Replacement Tax.
Since the current individual
income tax rate is 5%, the maximum corporate income tax rate that could be assessed is 8%. On J anuary 1, 2015, thecorporate income tax rate will automatically decline to 5.25%. On J anuary 1, 2025, the corporate income tax rate willrevert to its original level of 4.8%.
98 However, the Corporate Personal Property Replacement Tax (just like real estate property taxes) provides fundssolely to local governments. None of the revenue from the Corporate Personal Property Replacement Tax goes to thestate of Illinois. It should be noted that currently 41 other states (including most of our Midwest neighbors like Indiana andIowa) still have a personal property tax businesses must pay.
99
The corporate personal property tax, which funded localservices, was phased out by the Illinois constitution adopted in 1970.
The state's corporate income tax primarily feeds the General Fund, although, like the personal income tax, roughly 6% of the revenues from the corporate income tax are distributed to local governments under the Local Government Distributive
Fund. Figure 61 shows the performance of the corporate income tax in Illinois from 2007 through 2013.
Figure 61Historical Performance of the Illinois Corporate Income Tax
All $ in Mil lions FY 2007 FY 2008 FY 2009 FY 2010 FY 2011 FY 2012 FY 2013*
Actual Corp orate Incom e TaxRevenues (Nomi nal $) $1,750 $1,860 $1,710 $1,360 $1,851 $2,461 $2,504
FY 2007 Corporate Income TaxRevenues Adjusted for Inflation(CPI-U) and Population (Real $) $1,750 $1,822 $1,855 $1,880 $1,923 $1,984 $2,045
Difference Between Actual and
Real Corporate Income TaxRevenues $0 $38 ($145) ($520) ($72) $477 $459
*Figure for FY2013 is a projection per HJ R-68 of the 97th General Assembly. Note: FY2012 is the first year in which the corporateincome tax rate was increased from 4.8% to 7%.Population from the Census Bureau as of J anuary 2013; CPI-U from the Bureau of Labor Statistics as of J anuary 2013.
15. The Illinois Sales Tax
Illinois is one of 49 states that impose a general state sales tax. The Illinois sales tax is based on the following statutes:(i) the “Retailers Occupation Tax,” which is assessed on the gross receipts retailers collect from the transfer from seller tobuyer oftangible property in Illinois; (ii) the “Retailers' Use Tax,” which is assessed on individuals who purchase propertyoutside of Illinois but use it in the state; and (iii) the "Service Occupation and Use Taxes," which interestingly are notimposed on most services, making the title of the Act quite a misnomer. Instead, the Act imposes a sales tax primarily on
tangible property acquired incident to purchasing a service. For example, when a car is repaired, the state sales taxapplies only to the parts included in the repair, not to the cost of the labor.
The Illinois state sales tax rate is 5%, and the standard local government sales tax rate is an additional one and one1.25%, making the base combined state and local sales tax rate 6.25%.
100 Certain local governments have increasedtheir sales tax rates, so that, for instance in Chicago, after adding the City’s rate and the Cook County rate, the total salestax rate is 9.25%.101 The Illinois state and local combined rate of 6.25% is in the middle of the national range andconsistent with our border states.102 Iowa, Kentucky and Michigan all impose a 6% sales tax rate, while Missouri’s rate is4.225% and Indiana’s is 7% tax rate.
103
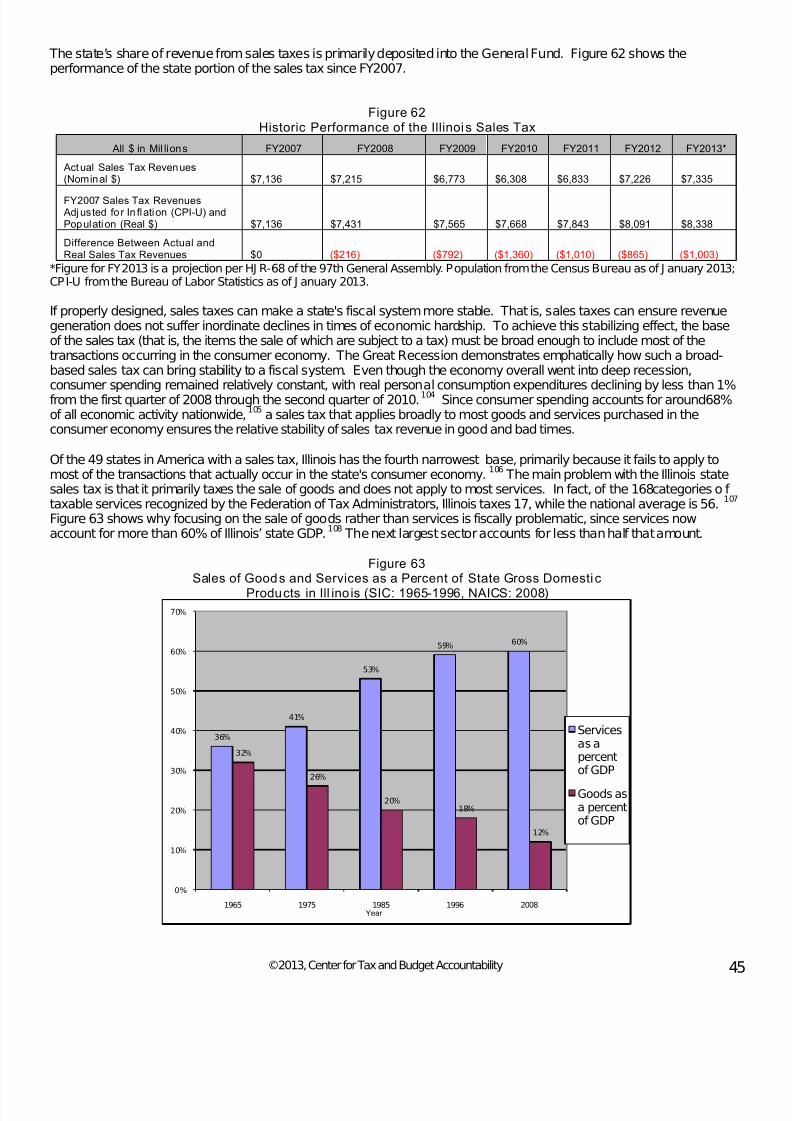
7/28/2019 Final_fy2013 Ctba Il Budget and Tax Primer
http://slidepdf.com/reader/full/finalfy2013-ctba-il-budget-and-tax-primer 49/60
©2013, Center for Tax and Budget Accountability 45
The state’s share of revenue from sales taxes is primarily deposited into the General Fund. Figure 62 shows theperformance of the state portion of the sales tax since FY2007.
Figure 62Historic Performance of the Illinois Sales Tax
All $ in Mil lions FY2007 FY2008 FY2009 FY2010 FY2011 FY2012 FY2013*
Actual Sales Tax Revenues(Nominal $) $7,136 $7,215 $6,773 $6,308 $6,833 $7,226 $7,335
FY2007 Sales Tax Revenues Adjusted fo r In flation (CPI-U) andPopulation (Real $) $7,136 $7,431 $7,565 $7,668 $7,843 $8,091 $8,338
Difference Between Actual andReal Sales Tax Revenues $0 ($216) ($792) ($1,360) ($1,010) ($865) ($1,003)
*Figure for FY2013 is a projection per HJ R-68 of the 97th General Assembly. Population from the Census Bureau as of J anuary 2013;CPI-U from the Bureau of Labor Statistics as of J anuary 2013.
If properly designed, sales taxes can make a state's fiscal system more stable. That is, sales taxes can ensure revenuegeneration does not suffer inordinate declines in times of economic hardship. To achieve this stabilizing effect, the baseof the sales tax (that is, the items the sale of which are subject to a tax) must be broad enough to include most of thetransactions occurring in the consumer economy. The Great Recession demonstrates emphatically how such a broad-based sales tax can bring stability to a fiscal system. Even though the economy overall went into deep recession,consumer spending remained relatively constant, with real personal consumption expenditures declining by less than 1%from the first quarter of 2008 through the second quarter of 2010.104 Since consumer spending accounts for around68%of all economic activity nationwide,
105
Of the 49 states in America with a sales tax, Illinois has the fourth narrowest base, primarily because it fails to apply tomost of the transactions that actually occur in the state's consumer economy.
a sales tax that applies broadly to most goods and services purchased in theconsumer economy ensures the relative stability of sales tax revenue in good and bad times.
106The main problem with the Illinois state
sales tax is that it primarily taxes the sale of goods and does not apply to most services. In fact, of the 168categories of taxable services recognized by the Federation of Tax Administrators, Illinois taxes 17, while the national average is 56.
107
Figure 63 shows why focusing on the sale of goods rather than services is fiscally problematic, since services nowaccount for more than 60% of Illinois’ state GDP.108
Figure 63Sales of Goods and Services as a Percent of State Gross Domestic
Products in Ill ino is (SIC: 1965-1996, NAICS: 2008)
The next largest sector accounts for less than half that amount.
36%
41%
53%
59% 60%
32%
26%
20%18%
12%
0%
10%
20%
30%
40%
50%
60%
70%
1965 1975 1985 1996 2008Year
Servicesas apercentof GDP
Goods asa percentof GDP
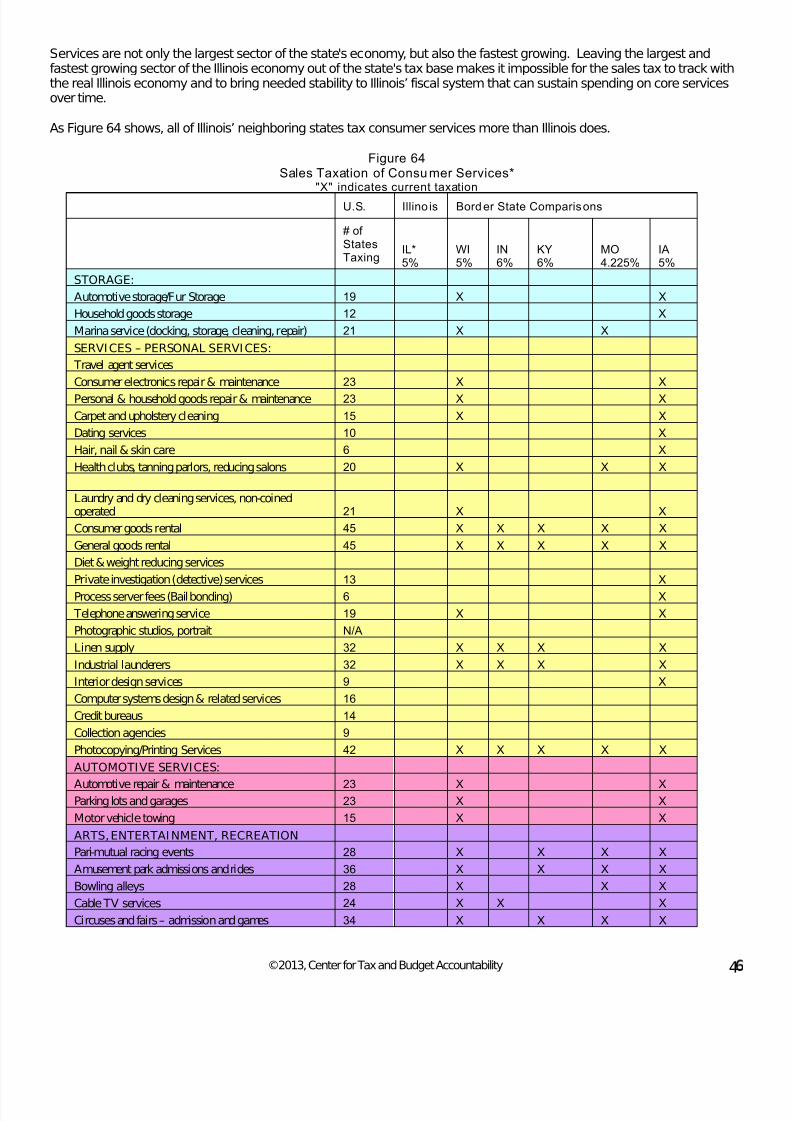
7/28/2019 Final_fy2013 Ctba Il Budget and Tax Primer
http://slidepdf.com/reader/full/finalfy2013-ctba-il-budget-and-tax-primer 50/60
©2013, Center for Tax and Budget Accountability 4
Services are not only the largest sector of the state's economy, but also the fastest growing. Leaving the largest andfastest growing sector of the Illinois economy out of the state's tax base makes it impossible for the sales tax to track withthe real Illinois economy and to bring needed stability to Illinois’ fiscal system that can sustain spending on core servicesover time.
As Figure 64 shows, all of Illinois’ neighboring states tax consumer services more than Illinois does.
Figure 64Sales Taxation of Consumer Services*
"X" indicates current taxation
U.S. Illino is Border State Comparisons
# of StatesTaxing
IL*5%
WI5%
IN6%
KY6%
MO4.225%
IA5%
STORAGE:
Automotive storage/Fur Storage 19 X X
Household goods storage 12 X
Marina service (docking, storage, cleaning, repair) 21 X X
SERVICES – PERSONAL SERVICES:
Travel agent services
Consumer electronics repair & maintenance 23 X X
Personal & household goods repair & maintenance 23 X X
Carpet and upholstery cleaning 15 X X
Dating services 10 X
Hair, nail & skin care 6 X
Health clubs, tanning parlors, reducing salons 20 X X X
Laundry and dry cleaning services, non-coinedoperated 21 X X
Consumer goods rental 45 X X X X X
General goods rental 45 X X X X X
Diet & weight reducing services
Private investigation (detective) services 13 X
Process server fees (Bail bonding) 6 X
Telephone answering service 19 X X
Photographic studios, portrait N/A
Linen supply 32 X X X X
Industrial launderers 32 X X X X
Interior design services 9 X
Computer systems design & related services 16
Credit bureaus 14
Collection agencies 9
Photocopying/Printing Services 42 X X X X X
AUTOMOTIVE SERVICES:
Automotive repair & maintenance 23 X XParking lots and garages 23 X X
Motor vehicle towing 15 X X
ARTS, ENTERTAINMENT, RECREATION
Pari-mutual racing events 28 X X X X
Amusement park admissions and rides 36 X X X X
Bowling alleys 28 X X X
Cable TV services 24 X X X
Circuses and fairs – admission and games 34 X X X X
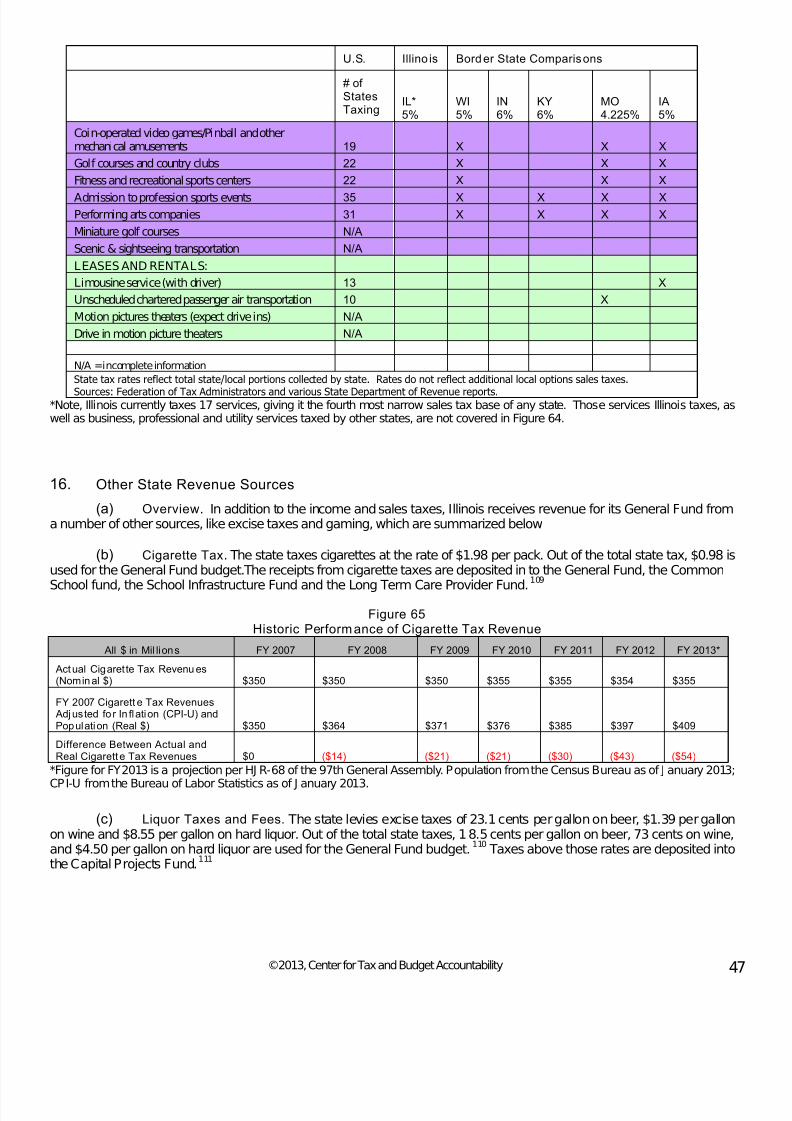
7/28/2019 Final_fy2013 Ctba Il Budget and Tax Primer
http://slidepdf.com/reader/full/finalfy2013-ctba-il-budget-and-tax-primer 51/60
©2013, Center for Tax and Budget Accountability 47
*Note, Illinois currently taxes 17 services, giving it the fourth most narrow sales tax base of any state. Those services Illinois taxes, aswell as business, professional and utility services taxed by other states, are not covered in Figure 64.
16. Other State Revenue Sources
(a) Overview. In addition to the income and sales taxes, Illinois receives revenue for its General Fund froma number of other sources, like excise taxes and gaming, which are summarized below
(b) Cigarette Tax. The state taxes cigarettes at the rate of $1.98 per pack. Out of the total state tax, $0.98 isused for the General Fund budget.The receipts from cigarette taxes are deposited into the General Fund, the Common
School fund, the School Infrastructure Fund and the Long Term Care Provider Fund.
109
Figure 65
Historic Performance of Cigarette Tax Revenue
All $ in Mil lions FY 2007 FY 2008 FY 2009 FY 2010 FY 2011 FY 2012 FY 2013*
Actual Cigarette Tax Revenu es(Nominal $) $350 $350 $350 $355 $355 $354 $355
FY 2007 Cigarett e Tax Revenues Adjusted fo r In flation (CPI-U) andPopulation (Real $) $350 $364 $371 $376 $385 $397 $409
Difference Between Actual andReal Cigarette Tax Revenues $0 ($14) ($21) ($21) ($30) ($43) ($54)
*Figure for FY2013 is a projection per HJ R-68 of the 97th General Assembly. Population from the Census Bureau as of J anuary 2013;
CPI-U from the Bureau of Labor Statistics as of J anuary 2013.
(c) Liquor Taxes and Fees. The state levies excise taxes of 23.1 cents per gallon on beer, $1.39 per gallonon wine and $8.55 per gallon on hard liquor. Out of the total state taxes, 18.5cents per gallon on beer, 73 cents on wine,and $4.50 per gallon on hard liquor are used for the General Fund budget.
110Taxes above those rates are deposited into
the Capital Projects Fund.111
U.S. Illino is Border State Comparisons
# of StatesTaxing
IL*5%
WI5%
IN6%
KY6%
MO4.225%
IA5%
Coin-operated video games/Pinball and othermechanical amusements 19 X X X
Golf courses and country clubs 22 X X X
Fitness and recreational sports centers 22 X X X
Admission to profession sports events 35 X X X XPerforming arts companies 31 X X X X
Miniature golf courses N/A
Scenic & sightseeing transportation N/A
LEASES AND RENTALS:
Limousine service (with driver) 13 X
Unscheduled chartered passenger air transportation 10 X
Motion pictures theaters (expect drive ins) N/A
Drive in motion picture theaters N/A
N/A =incomplete information
State tax rates reflect total state/local portions collected by state. Rates do not reflect additional local options sales taxes.
Sources: Federation of Tax Administrators and various State Department of Revenue reports.
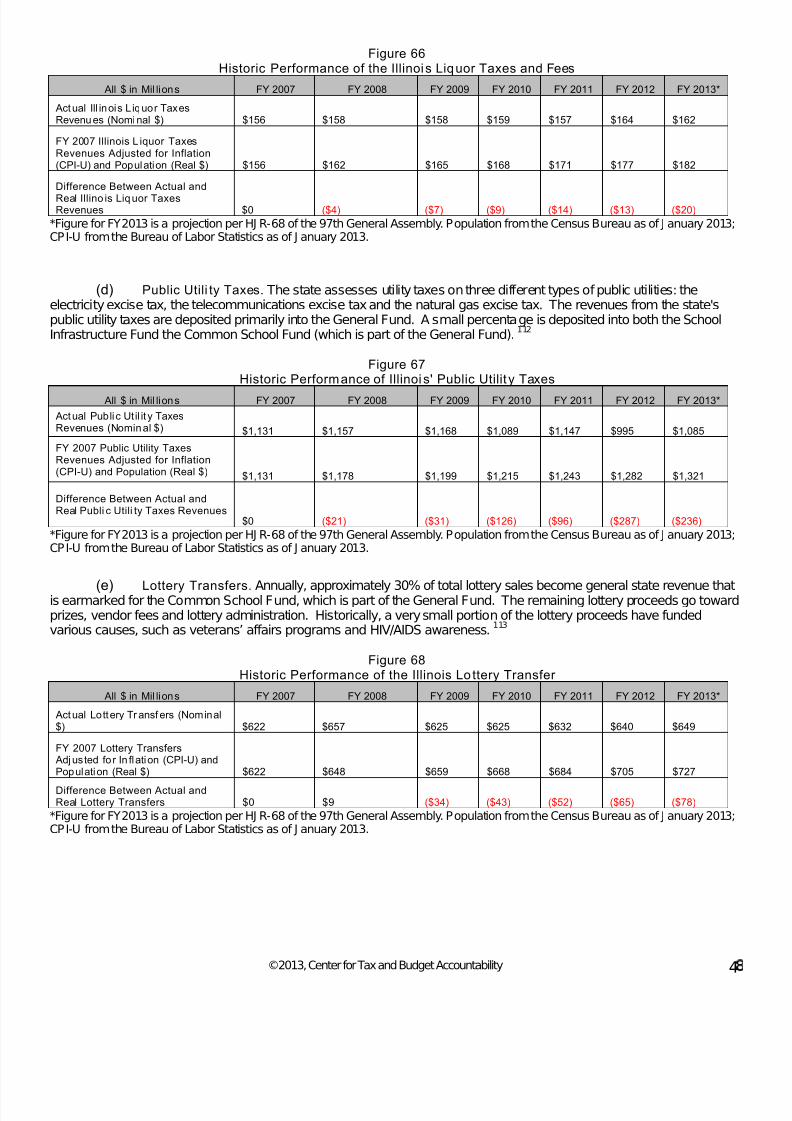
7/28/2019 Final_fy2013 Ctba Il Budget and Tax Primer
http://slidepdf.com/reader/full/finalfy2013-ctba-il-budget-and-tax-primer 52/60
©2013, Center for Tax and Budget Accountability 4
Figure 66Historic Performance of the Illinois Liquor Taxes and Fees
All $ in Mil lions FY 2007 FY 2008 FY 2009 FY 2010 FY 2011 FY 2012 FY 2013*
Actual Ill inois Liquor TaxesRevenues (Nomi nal $) $156 $158 $158 $159 $157 $164 $162
FY 2007 Illinois L iquor TaxesRevenues Adjusted for Inflation(CPI-U) and Population (Real $) $156 $162 $165 $168 $171 $177 $182
Difference Between Actual and
Real Illino is Liquor TaxesRevenues $0 ($4) ($7) ($9) ($14) ($13) ($20)
*Figure for FY2013 is a projection per HJ R-68 of the 97th General Assembly. Population from the Census Bureau as of J anuary 2013;CPI-U from the Bureau of Labor Statistics as of J anuary 2013.
(d) Public Utili ty Taxes. The state assesses utility taxes on three different types of public utilities: theelectricity excise tax, the telecommunications excise tax and the natural gas excise tax. The revenues from the state'spublic utility taxes are deposited primarily into the General Fund. A small percentage is deposited into both the SchoolInfrastructure Fund the Common School Fund (which is part of the General Fund).
112
Figure 67Historic Performance of Illinoi s' Public Utilit y Taxes
All $ in Mil lions FY 2007 FY 2008 FY 2009 FY 2010 FY 2011 FY 2012 FY 2013*
Actual Public Util it y TaxesRevenues (Nominal $) $1,131 $1,157 $1,168 $1,089 $1,147 $995 $1,085
FY 2007 Public Utility TaxesRevenues Adjusted for Inflation(CPI-U) and Population (Real $) $1,131 $1,178 $1,199 $1,215 $1,243 $1,282 $1,321
Difference Between Actual andReal Publi c Utili ty Taxes Revenues
$0 ($21) ($31) ($126) ($96) ($287) ($236)
*Figure for FY2013 is a projection per HJ R-68 of the 97th General Assembly. Population from the Census Bureau as of J anuary 2013;CPI-U from the Bureau of Labor Statistics as of J anuary 2013.
(e) Lottery Transfers. Annually, approximately 30% of total lottery sales become general state revenue thatis earmarked for the Common School Fund, which is part of the General Fund. The remaining lottery proceeds go towardprizes, vendor fees and lottery administration. Historically, a very small portion of the lottery proceeds have fundedvarious causes, such as veterans’ affairs programs and HIV/AIDS awareness.
113
Figure 68Historic Performance of the Illinois Lo ttery Transfer
All $ in Mil lions FY 2007 FY 2008 FY 2009 FY 2010 FY 2011 FY 2012 FY 2013*
Actual Lottery Tr ansf ers (Nominal$) $622 $657 $625 $625 $632 $640 $649
FY 2007 Lottery Transfers Adjusted fo r In flation (CPI-U) andPopulation (Real $) $622 $648 $659 $668 $684 $705 $727
Difference Between Actual andReal Lottery Transfers $0 $9 ($34) ($43) ($52) ($65) ($78)
*Figure for FY2013 is a projection per HJ R-68 of the 97th General Assembly. Population from the Census Bureau as of J anuary 2013;CPI-U from the Bureau of Labor Statistics as of J anuary 2013.
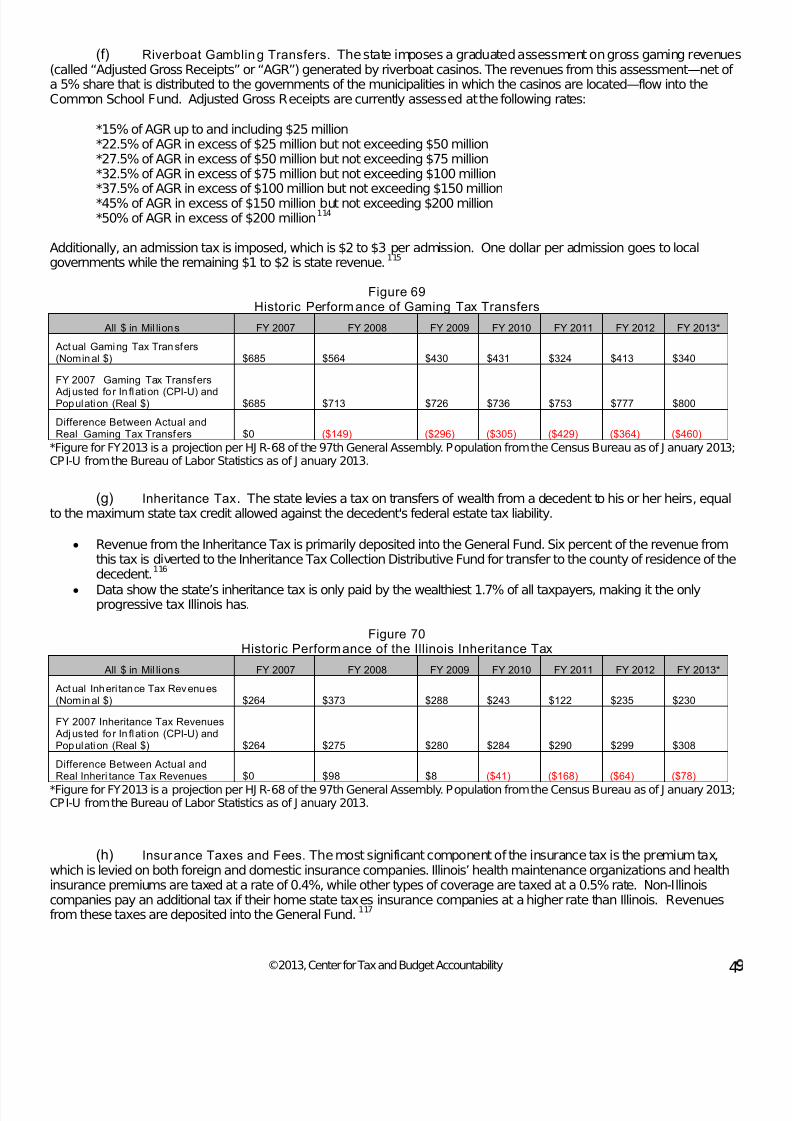
7/28/2019 Final_fy2013 Ctba Il Budget and Tax Primer
http://slidepdf.com/reader/full/finalfy2013-ctba-il-budget-and-tax-primer 53/60
©2013, Center for Tax and Budget Accountability 4
(f) Riverboat Gambling Transfers. The state imposes a graduated assessment on gross gaming revenues(called “Adjusted Gross Receipts” or “AGR”) generated by riverboat casinos. The revenues from this assessment—net of a 5% share that is distributed to the governments of the municipalities in which the casinos are located—flow into theCommon School Fund. Adjusted Gross Receipts are currently assessed at the following rates:
*15% of AGR up to and including $25 million*22.5% of AGR in excess of $25 million but not exceeding $50 million*27.5% of AGR in excess of $50 million but not exceeding $75 million*32.5% of AGR in excess of $75 million but not exceeding $100 million*37.5% of AGR in excess of $100 million but not exceeding $150 million*45% of AGR in excess of $150 million but not exceeding $200 million*50% of AGR in excess of $200 million
114
Additionally, an admission tax is imposed, which is $2 to $3 per admission. One dollar per admission goes to localgovernments while the remaining $1 to $2 is state revenue.115
Figure 69
Historic Performance of Gaming Tax Transfers
All $ in Mil lions FY 2007 FY 2008 FY 2009 FY 2010 FY 2011 FY 2012 FY 2013*
Actual Gaming Tax Transfers(Nominal $) $685 $564 $430 $431 $324 $413 $340
FY 2007 Gaming Tax Transfers
Adjusted fo r In flation (CPI-U) andPopulation (Real $) $685 $713 $726 $736 $753 $777 $800
Difference Between Actual andReal Gaming Tax Transfers $0 ($149) ($296) ($305) ($429) ($364) ($460)
*Figure for FY2013 is a projection per HJ R-68 of the 97th General Assembly. Population from the Census Bureau as of J anuary 2013;CPI-U from the Bureau of Labor Statistics as of J anuary 2013.
(g) Inheritance Tax. The state levies a tax on transfers of wealth from a decedent to his or her heirs, equalto the maximum state tax credit allowed against the decedent's federal estate tax liability.
• Revenue from the Inheritance Tax is primarily deposited into the General Fund. Six percent of the revenue fromthis tax is diverted to the Inheritance Tax Collection Distributive Fund for transfer to the county of residence of thedecedent.
116
• Data show the state’s inheritance tax is only paid by the wealthiest 1.7% of all taxpayers, making it the onlyprogressive tax Illinois has.
Figure 70Historic Performance of the Illinois Inheritance Tax
All $ in Mil lions FY 2007 FY 2008 FY 2009 FY 2010 FY 2011 FY 2012 FY 2013*
Actual Inheri tance Tax Revenues(Nominal $) $264 $373 $288 $243 $122 $235 $230
FY 2007 Inheritance Tax Revenues Adjusted fo r In flation (CPI-U) andPopulation (Real $) $264 $275 $280 $284 $290 $299 $308
Difference Between Actual andReal Inheri tance Tax Revenues $0 $98 $8 ($41) ($168) ($64) ($78)
*Figure for FY2013 is a projection per HJ R-68 of the 97th General Assembly. Population from the Census Bureau as of J anuary 2013;CPI-U from the Bureau of Labor Statistics as of J anuary 2013.
(h) Insurance Taxes and Fees. The most significant component of the insurance tax is the premium tax,which is levied on both foreign and domestic insurance companies. Illinois’ health maintenance organizations and healthinsurance premiums are taxed at a rate of 0.4%, while other types of coverage are taxed at a 0.5% rate. Non-Illinoiscompanies pay an additional tax if their home state taxes insurance companies at a higher rate than Illinois. Revenuesfrom these taxes are deposited into the General Fund.
117
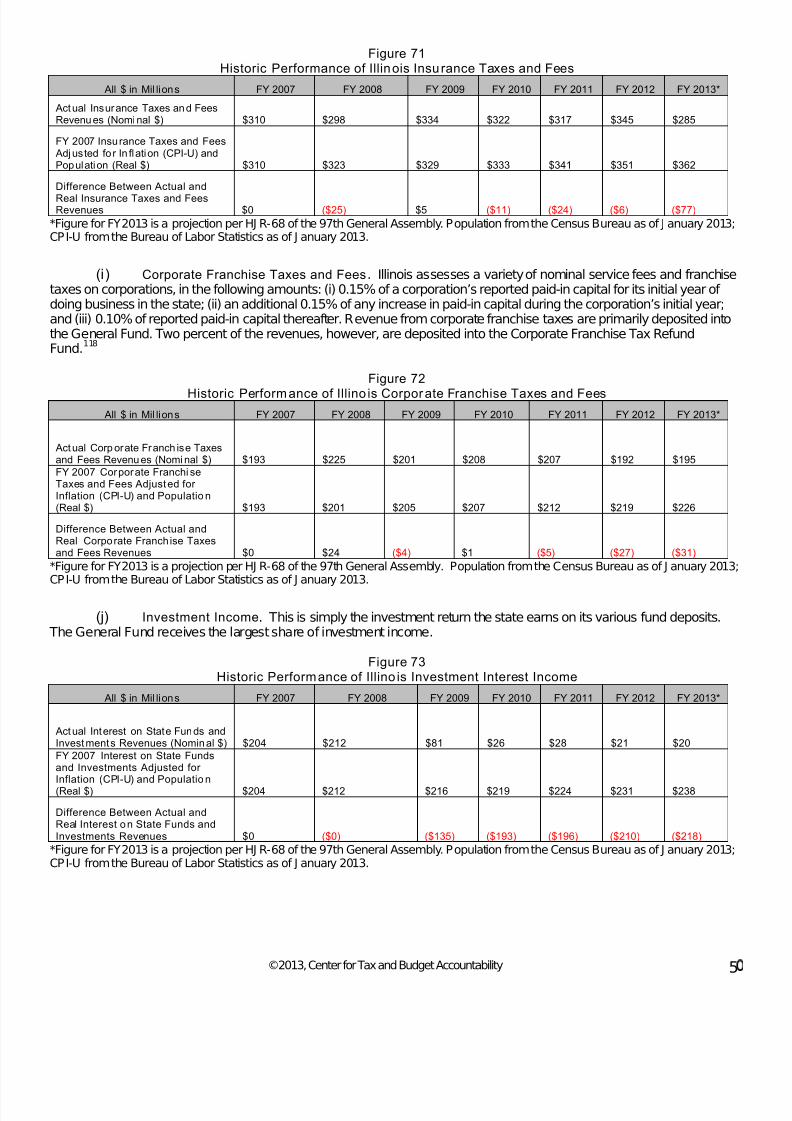
7/28/2019 Final_fy2013 Ctba Il Budget and Tax Primer
http://slidepdf.com/reader/full/finalfy2013-ctba-il-budget-and-tax-primer 54/60
©2013, Center for Tax and Budget Accountability 5
Figure 71Historic Performance of Illinois Insurance Taxes and Fees
All $ in Mil lions FY 2007 FY 2008 FY 2009 FY 2010 FY 2011 FY 2012 FY 2013*
Actual Insurance Taxes and FeesRevenues (Nomi nal $) $310 $298 $334 $322 $317 $345 $285
FY 2007 Insurance Taxes and Fees Adjusted fo r In flation (CPI-U) andPopulation (Real $) $310 $323 $329 $333 $341 $351 $362
Difference Between Actual and
Real Insurance Taxes and FeesRevenues $0 ($25) $5 ($11) ($24) ($6) ($77)
*Figure for FY2013 is a projection per HJ R-68 of the 97th General Assembly. Population from the Census Bureau as of J anuary 2013;CPI-U from the Bureau of Labor Statistics as of J anuary 2013.
(i) Corporate Franchise Taxes and Fees. Illinois assesses a variety of nominal service fees and franchisetaxes on corporations, in the following amounts: (i) 0.15% of a corporation’s reported paid-in capital for its initial year of doing business in the state; (ii) an additional 0.15% of any increase in paid-in capital during the corporation’s initial year;and (iii) 0.10% of reported paid-in capital thereafter. Revenue from corporate franchise taxes are primarily deposited intothe General Fund. Two percent of the revenues, however, are deposited into the Corporate Franchise Tax RefundFund.
118
Figure 72
Historic Performance of Illino is Corporate Franchise Taxes and Fees All $ in Mil lions FY 2007 FY 2008 FY 2009 FY 2010 FY 2011 FY 2012 FY 2013*
Actual Corp orate Franch ise Taxesand Fees Revenues (Nomi nal $) $193 $225 $201 $208 $207 $192 $195FY 2007 Corporate Franchi seTaxes and Fees Adjusted for Inflation (CPI-U) and Populatio n(Real $) $193 $201 $205 $207 $212 $219 $226
Difference Between Actual andReal Corporate Franch ise Taxesand Fees Revenues $0 $24 ($4) $1 ($5) ($27) ($31)
*Figure for FY2013 is a projection per HJ R-68 of the 97th General Assembly. Population from the Census Bureau as of J anuary 2013;CPI-U from the Bureau of Labor Statistics as of J anuary 2013.
(j) Investment Income. This is simply the investment return the state earns on its various fund deposits. The General Fund receives the largest share of investment income.
Figure 73Historic Performance of Illino is Investment Interest Income
All $ in Mil lions FY 2007 FY 2008 FY 2009 FY 2010 FY 2011 FY 2012 FY 2013*
Actual Interest on State Funds andInvestments Revenues (Nominal $) $204 $212 $81 $26 $28 $21 $20FY 2007 Interest on State Fundsand Investments Adjusted for Inflation (CPI-U) and Populatio n(Real $) $204 $212 $216 $219 $224 $231 $238
Difference Between Actual andReal Interest on State Funds andInvestments Revenues $0 ($0) ($135) ($193) ($196) ($210) ($218)
*Figure for FY2013 is a projection per HJ R-68 of the 97th General Assembly. Population from the Census Bureau as of J anuary 2013;CPI-U from the Bureau of Labor Statistics as of J anuary 2013.
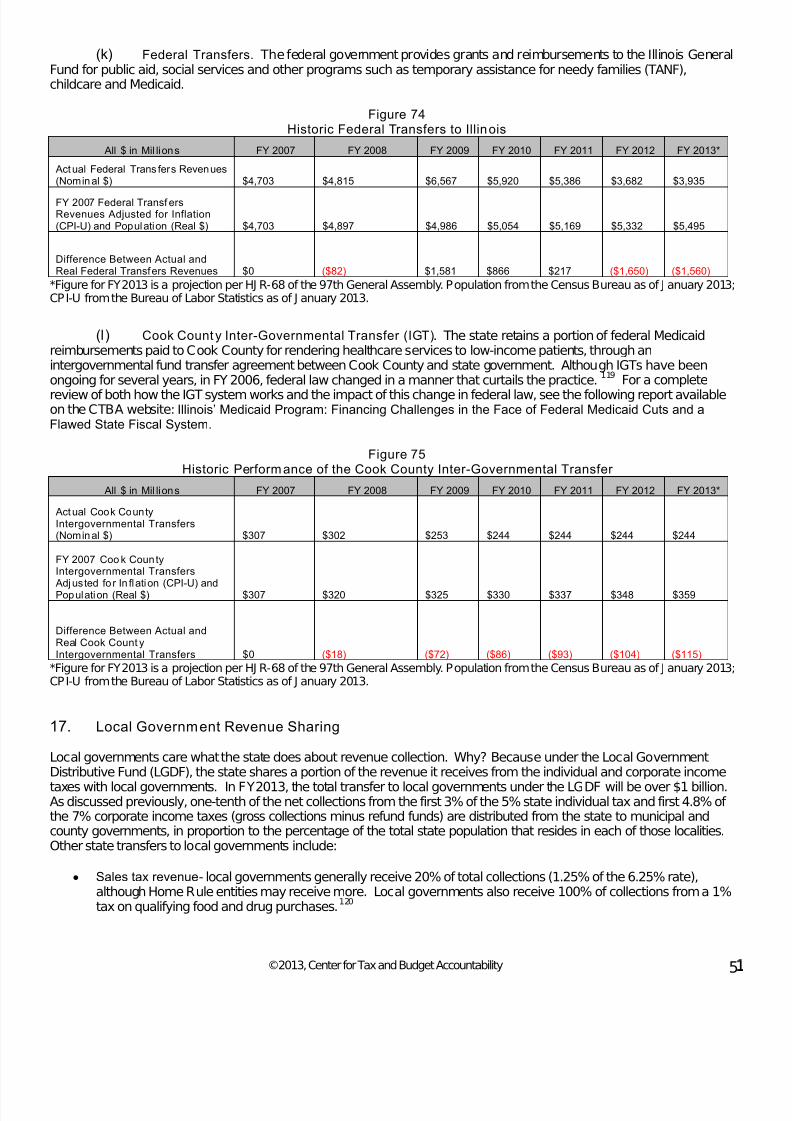
7/28/2019 Final_fy2013 Ctba Il Budget and Tax Primer
http://slidepdf.com/reader/full/finalfy2013-ctba-il-budget-and-tax-primer 55/60
©2013, Center for Tax and Budget Accountability 5
(k) Federal Transfers. The federal government provides grants and reimbursements to the Illinois GeneralFund for public aid, social services and other programs such as temporary assistance for needy families (TANF),childcare and Medicaid.
Figure 74Historic Federal Transfers to Illinois
All $ in Mil lions FY 2007 FY 2008 FY 2009 FY 2010 FY 2011 FY 2012 FY 2013*
Actual Federal Trans fers Revenues(Nominal $) $4,703 $4,815 $6,567 $5,920 $5,386 $3,682 $3,935
FY 2007 Federal Transf ersRevenues Adjusted for Inflation(CPI-U) and Population (Real $) $4,703 $4,897 $4,986 $5,054 $5,169 $5,332 $5,495
Difference Between Actual andReal Federal Transfers Revenues $0 ($82) $1,581 $866 $217 ($1,650) ($1,560)
*Figure for FY2013 is a projection per HJ R-68 of the 97th General Assembly. Population from the Census Bureau as of J anuary 2013;CPI-U from the Bureau of Labor Statistics as of J anuary 2013.
(l) Cook County Inter-Governmental Transfer (IGT). The state retains a portion of federal Medicaidreimbursements paid to Cook County for rendering healthcare services to low-income patients, through anintergovernmental fund transfer agreement between Cook County and state government. Although IGTs have beenongoing for several years, in FY 2006, federal law changed in a manner that curtails the practice.
119
Illinois’ Medicaid Program: Financing Challenges in the Face of Federal Medicaid Cuts and aFlawed State Fiscal System
For a complete
review of both how the IGT system works and the impact of this change in federal law, see the following report availableon the CTBA website:
.
Figure 75Historic Performance of the Cook County Inter-Governmental Transfer
All $ in Mil lions FY 2007 FY 2008 FY 2009 FY 2010 FY 2011 FY 2012 FY 2013*
Actual Cook CountyIntergovernmental Transfers(Nominal $) $307 $302 $253 $244 $244 $244 $244
FY 2007 Coo k CountyIntergovernmental Transfers Adjusted fo r In flation (CPI-U) andPopulation (Real $) $307 $320 $325 $330 $337 $348 $359
Difference Between Actual andReal Cook Count yIntergovernmental Transfers $0 ($18) ($72) ($86) ($93) ($104) ($115)
*Figure for FY2013 is a projection per HJ R-68 of the 97th General Assembly. Population from the Census Bureau as of J anuary 2013;CPI-U from the Bureau of Labor Statistics as of J anuary 2013.
17. Local Government Revenue Sharing
Local governments care what the state does about revenue collection. Why? Because under the Local GovernmentDistributive Fund (LGDF), the state shares a portion of the revenue it receives from the individual and corporate income
taxes with local governments. In FY2013, the total transfer to local governments under the LGDF will be over $1 billion.As discussed previously, one-tenth of the net collections from the first 3% of the 5% state individual tax and first 4.8% of the 7% corporate income taxes (gross collections minus refund funds) are distributed from the state to municipal andcounty governments, in proportion to the percentage of the total state population that resides in each of those localities.Other state transfers to local governments include:
• Sales tax revenue- local governments generally receive 20% of total collections (1.25% of the 6.25% rate),although Home Rule entities may receive more. Local governments also receive 100% of collections from a 1%tax on qualifying food and drug purchases.
120
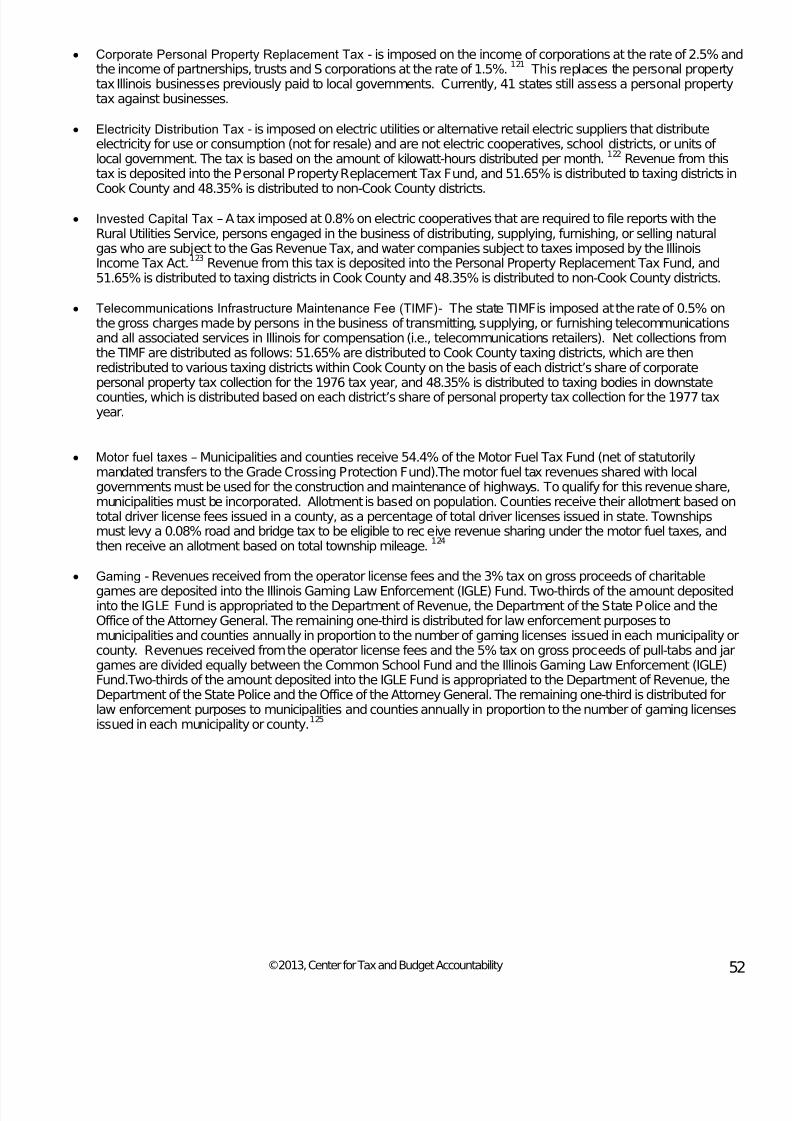
7/28/2019 Final_fy2013 Ctba Il Budget and Tax Primer
http://slidepdf.com/reader/full/finalfy2013-ctba-il-budget-and-tax-primer 56/60
©2013, Center for Tax and Budget Accountability 52
• Corporate Personal Property Replacement Tax - is imposed on the income of corporations at the rate of 2.5% andthe income of partnerships, trusts and S corporations at the rate of 1.5%.121
This replaces the personal propertytax Illinois businesses previously paid to local governments. Currently, 41 states still assess a personal propertytax against businesses.
• Electricity Distribution Tax - is imposed on electric utilities or alternative retail electric suppliers that distributeelectricity for use or consumption (not for resale) and are not electric cooperatives, school districts, or units of local government. The tax is based on the amount of kilowatt-hours distributed per month.122
Revenue from thistax is deposited into the Personal Property Replacement Tax Fund, and 51.65% is distributed to taxing districts inCook County and 48.35% is distributed to non-Cook County districts.
• Invested Capital Tax – A tax imposed at 0.8% on electric cooperatives that are required to file reports with theRural Utilities Service, persons engaged in the business of distributing, supplying, furnishing, or selling naturalgas who are sub ject to the Gas Revenue Tax, and water companies subject to taxes imposed by the IllinoisIncome Tax Act.
123
Revenue from this tax is deposited into the Personal Property Replacement Tax Fund, and51.65% is distributed to taxing districts in Cook County and 48.35% is distributed to non-Cook County districts.
• Telecommunications Infrastructure Maintenance Fee (TIMF)- The state TIMFis imposed at the rate of 0.5% onthe gross charges made by persons in the business of transmitting, supplying, or furnishing telecommunicationsand all associated services in Illinois for compensation (i.e., telecommunications retailers). Net collections fromthe TIMF are distributed as follows: 51.65% are distributed to Cook County taxing districts, which are thenredistributed to various taxing districts within Cook County on the basis of each district’s share of corporatepersonal property tax collection for the 1976 tax year, and 48.35% is distributed to taxing bodies in downstatecounties, which is distributed based on each district’s share of personal property tax collection for the 1977 taxyear.
• Motor fuel taxes – Municipalities and counties receive 54.4% of the Motor Fuel Tax Fund (net of statutorilymandated transfers to the Grade Crossing Protection Fund).The motor fuel tax revenues shared with localgovernments must be used for the construction and maintenance of highways. To qualify for this revenue share,municipalities must be incorporated. Allotment is based on population. Counties receive their allotment based ontotal driver license fees issued in a county, as a percentage of total driver licenses issued in state. Townshipsmust levy a 0.08% road and bridge tax to be eligible to receive revenue sharing under the motor fuel taxes, andthen receive an allotment based on total township mileage.
124
• Gaming - Revenues received from the operator license fees and the 3% tax on gross proceeds of charitable
games are deposited into the Illinois Gaming Law Enforcement (IGLE) Fund. Two-thirds of the amount depositedinto the IGLE Fund is appropriated to the Department of Revenue, the Department of the State Police and theOffice of the Attorney General. The remaining one-third is distributed for law enforcement purposes tomunicipalities and counties annually in proportion to the number of gaming licenses issued in each municipality orcounty. Revenues received from the operator license fees and the 5% tax on gross proceeds of pull-tabs and jargames are divided equally between the Common School Fund and the Illinois Gaming Law Enforcement (IGLE)Fund.Two-thirds of the amount deposited into the IGLE Fund is appropriated to the Department of Revenue, theDepartment of the State Police and the Office of the Attorney General. The remaining one-third is distributed forlaw enforcement purposes to municipalities and counties annually in proportion to the number of gaming licensesissued in each municipality or county.
125
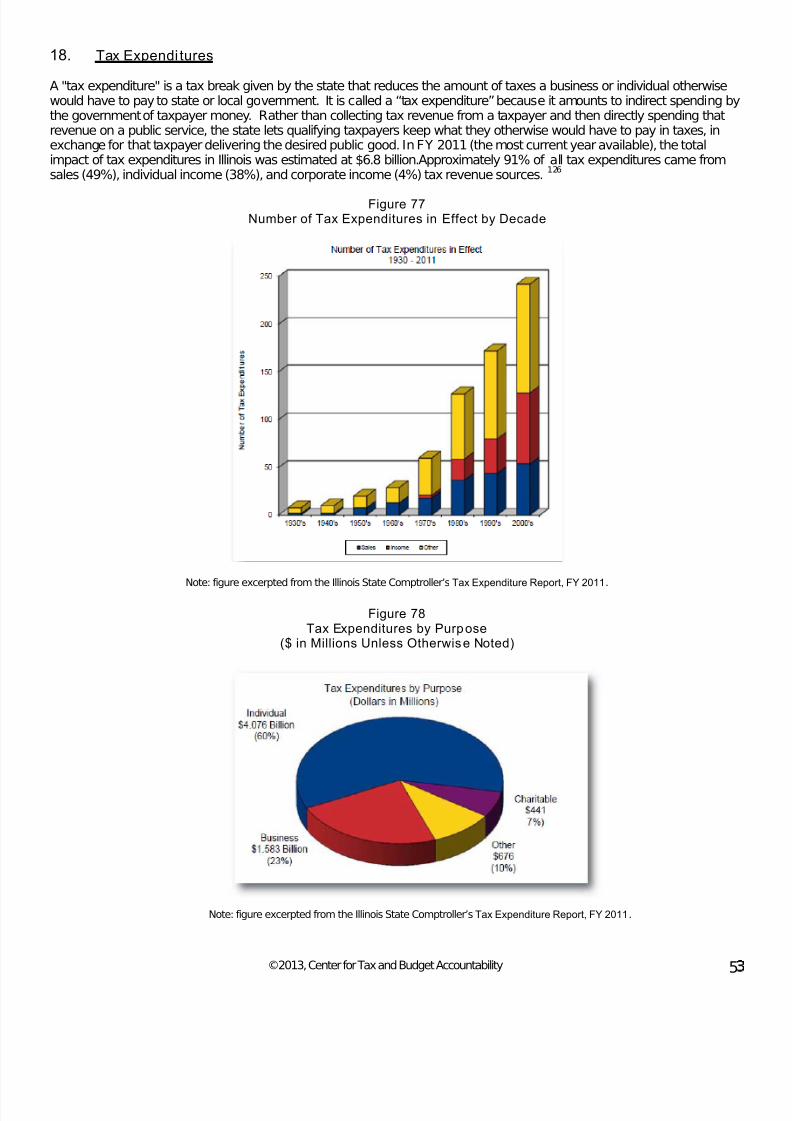
7/28/2019 Final_fy2013 Ctba Il Budget and Tax Primer
http://slidepdf.com/reader/full/finalfy2013-ctba-il-budget-and-tax-primer 57/60
©2013, Center for Tax and Budget Accountability 5
18. Tax Expendi tures
A "tax expenditure" is a tax break given by the state that reduces the amount of taxes a business or individual otherwisewould have to pay to state or local government. It is called a “tax expenditure” because it amounts to indirect spending bythe government of taxpayer money. Rather than collecting tax revenue from a taxpayer and then directly spending thatrevenue on a public service, the state lets qualifying taxpayers keep what they otherwise would have to pay in taxes, inexchange for that taxpayer delivering the desired public good. In FY 2011 (the most current year available), the totalimpact of tax expenditures in Illinois was estimated at $6.8 billion.Approximately 91% of all tax expenditures came fromsales (49%), individual income (38%), and corporate income (4%) tax revenue sources.
126
Figure 77
Number of Tax Expenditures in Effect by Decade
Note: figure excerpted from the Illinois State Comptroller’s Tax Expenditure Report, FY 2011.
Figure 78Tax Expenditures by Purpose
($ in Millions Unless Otherwise Noted)
Note: figure excerpted from the Illinois State Comptroller’s Tax Expenditure Report, FY 2011.
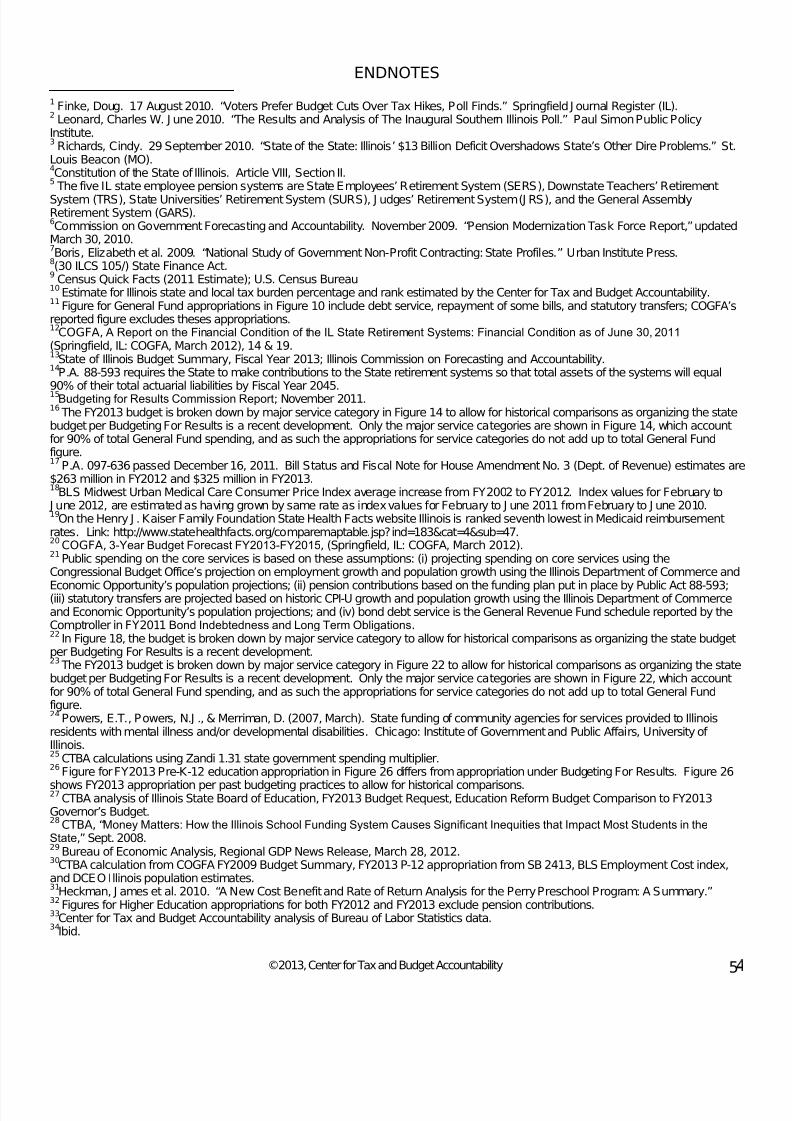
7/28/2019 Final_fy2013 Ctba Il Budget and Tax Primer
http://slidepdf.com/reader/full/finalfy2013-ctba-il-budget-and-tax-primer 58/60
©2013, Center for Tax and Budget Accountability 5
ENDNOTES
1 Finke, Doug. 17 August 2010. “Voters Prefer Budget Cuts Over Tax Hikes, Poll Finds.” Springfield J ournal Register (IL).2 Leonard, Charles W. J une 2010. “The Results and Analysis of The Inaugural Southern Illinois Poll.” Paul Simon Public PolicyInstitute.3 Richards, Cindy. 29 September 2010. “State of the State: Illinois’ $13 Billion Deficit Overshadows State’s Other Dire Problems.” St.Louis Beacon (MO).4Constitution of the State of Illinois. Article VIII, Section II.
5The five IL state employee pension systems are State Employees’ Retirement System (SERS), Downstate Teachers’ Retirement
System (TRS), State Universities’ Retirement System (SURS), J udges’ Retirement System (J RS), and the General AssemblyRetirement System (GARS).6Commission on Government Forecasting and Accountability. November 2009. “Pension Modernization Task Force Report,” updated
March 30, 2010.7Boris, Elizabeth et al. 2009. “National Study of Government Non-Profit Contracting: State Profiles.” Urban Institute Press.
8(30 ILCS 105/) State Finance Act.
9Census Quick Facts (2011 Estimate); U.S. Census Bureau
10Estimate for Illinois state and local tax burden percentage and rank estimated by the Center for Tax and Budget Accountability.
11Figure for General Fund appropriations in Figure 10 include debt service, repayment of some bills, and statutory transfers; COGFA’s
reported figure excludes theses appropriations.12
COGFA, A Report on the Financial Condition of the IL State Retirement Systems: Financial Condition as of June 30, 2011 (Springfield, IL: COGFA, March 2012), 14 & 19.13
State of Illinois Budget Summary, Fiscal Year 2013; Illinois Commission on Forecasting and Accountability.14
P.A. 88-593 requires the State to make contributions to the State retirement systems so that total assets of the systems will equal90% of their total actuarial liabilities by Fiscal Year 2045.15Budgeting for Results Commission Report; November 2011.16
The FY2013 budget is broken down by major service category in Figure 14 to allow for historical comparisons as organizing the statebudget per Budgeting For Results is a recent development. Only the major service categories are shown in Figure 14, which accountfor 90% of total General Fund spending, and as such the appropriations for service categories do not add up to total General Fundfigure.17
P.A. 097-636 passed December 16, 2011. Bill Status and Fiscal Note for House Amendment No. 3 (Dept. of Revenue) estimates are$263 million in FY2012 and $325 million in FY2013.18
BLS Midwest Urban Medical Care Consumer Price Index average increase from FY2002 to FY2012. Index values for February to J une 2012, are estimated as having grown by same rate as index values for February to J une 2011 from February to J une 2010.19
On the Henry J . Kaiser Family Foundation State Health Facts website Illinois is ranked seventh lowest in Medicaid reimbursementrates. Link: http://www.statehealthfacts.org/comparemaptable.jsp?ind=183&cat=4&sub=47.20
COGFA, 3-Year Budget Forecast FY2013-FY2015, (Springfield, IL: COGFA, March 2012).21
Public spending on the core services is based on these assumptions: (i) projecting spending on core services using theCongressional Budget Office’s projection on employment growth and population growth using the Illinois Department of Commerce and
Economic Opportunity’s population projections; (ii) pension contributions based on the funding plan put in place by Public Act 88-593;(iii) statutory transfers are projected based on historic CPI-U growth and population growth using the Illinois Department of Commerceand Economic Opportunity’s population projections; and (iv) bond debt service is the General Revenue Fund schedule reported by theComptroller in FY2011 Bond Indebtedness and Long Term Obligations.22
In Figure 18, the budget is broken down by major service category to allow for historical comparisons as organizing the state budgetper Budgeting For Results is a recent development.23 The FY2013 budget is broken down by major service category in Figure 22 to allow for historical comparisons as organizing the statebudget per Budgeting For Results is a recent development. Only the major service categories are shown in Figure 22, which accountfor 90% of total General Fund spending, and as such the appropriations for service categories do not add up to total General Fundfigure.24 Powers, E.T., Powers, N.J ., & Merriman, D. (2007, March). State funding of community agencies for services provided to Illinoisresidents with mental illness and/or developmental disabilities. Chicago: Institute of Government and Public Affairs, University of Illinois.25
CTBA calculations using Zandi 1.31 state government spending multiplier.26
Figure for FY2013 Pre-K-12 education appropriation in Figure 26 differs from appropriation under Budgeting For Results. Figure 26
shows FY2013 appropriation per past budgeting practices to allow for historical comparisons.27CTBA analysis of Illinois State Board of Education, FY2013 Budget Request, Education Reform Budget Comparison to FY2013
Governor’s Budget.28
CTBA, “Money Matters: How the Illinois School Funding System Causes Significant Inequities that Impact Most Students in theState,” Sept. 2008.29
Bureau of Economic Analysis, Regional GDP News Release, March 28, 2012.30
CTBA calculation from COGFA FY2009 Budget Summary, FY2013 P-12 appropriation from SB 2413, BLS Employment Cost index,and DCEO Illinois population estimates.31
Heckman, J ames et al. 2010. “A New Cost Benefit and Rate of Return Analysis for the Perry Preschool Program: A Summary.”32
Figures for Higher Education appropriations for both FY2012 and FY2013 exclude pension contributions.33
Center for Tax and Budget Accountability analysis of Bureau of Labor Statistics data.34
Ibid.

7/28/2019 Final_fy2013 Ctba Il Budget and Tax Primer
http://slidepdf.com/reader/full/finalfy2013-ctba-il-budget-and-tax-primer 59/60
©2013, Center for Tax and Budget Accountability 55
35Task Force on Access to Benefits and Services, Illinois Department of Healthcare and Family Services as of May 2008.
http://www2.illinois.gov/hfs/agency/Documents/0708_access.pdf 36 The Personal Responsibility and Work Opportunity Reconciliation Act of 1996 created Temporary Assistance for Needy Families
(TANF), which is the current, national welfare program.37
CTBA analysis of the rates of inflation of US healthcare costs and CPI historic rates of inflation. Data obtained from the Kaiser FamilyFoundation, and The Bureau of Labor Statistics.38
State of Illinois, Office of the Comptroller, “Medicaid Continues to Challenge State Budgets,” Budget Summary, Fiscal Focus, May2005 (Medicaid liability growth);Year 2013; Illinois Commission on Forecasting and Accountability revenue data..39
Congressional Budget Office, “A Budget and Economic Outlook,” 2012-2022.40
P.A. 097-068641HFS, Final Legislative Package to Save Medicaid Memo, May 2012; Pearson, R. 30 May 2012. “Lawmakers OK $1-a-pack cigarettetax hike.” Chicago Tribune. 42 HFS, Final Legislative Package to Save Medicaid Memo, May 201243 Recovery.Illinois.gov; Illinois’ official ARRA website explains: Increased federal matching dollars for Medicaid (Title XIX) services,available from February 2009 through December 2010. Enhanced matching rate is 61.88%. Enhanced matching dollars drawn arebased on Medicaid spending.44305 ILCS 5/5-5f 45 In addition to SB2840, the final Medicaid Legislative package includes SB2194, HB5007, and SB3397.46 See “Five Year Medical Assistance Budget Outlook,” DHFS, April, 2012.47 Kaiser State Health Facts, (Washington, D.C.: February 2013)48 Bureau of Economic Analysis News Release; http://www.bea.gov/newsreleases/regional/spi/2012/pdf/spi0312.pdf 49 Kaiser Commission on Medicaid and the Uninsured, “5 key questions about Medicaid and Its Role in State/Federal Budgets andHealth Reform.” May 201250
Article XIII, Section 5 of the Illinois Constitution. See also: Madir, Eric M. “Is Welching on Public Pension Promises an Option for
Illinois? An Analysis of Article XIII, Section 5 of the Illinois Constitution.”http://www.senatedem.ilga.gov/images/pensions/D/Madiar%20Pension%20Abstract%2003-02-11.pdf 51
COGFA, Special Pension Briefing (Springfield, IL: COGFA, November 2012).52
Ibid.53
Assets are calculated using the actuarial value of assets method, which smoothes losses/gains over five years.54
Pension contributions for SERS, J RS, and GARS are lumped together as one category because this is how it appears in the FY2013GOMB Budget Book; however, it should be noted that this category is the sum of three separate pension contributions. In order forcomparisons with GOMB figures, the pension contributions for SERS, J RS, and GARS are lumped together as one category elsewherein this Report.55
Figures for General Fund contributions to SERS for FY 2012 and FY2013 were obtained from SERS by CTBA.56
Illinois Economic and Fiscal Commission. March 1995. “Fiscal Year 1996 Pension Funding Requirements,” p. 3-557
COGFA.2011. “ A Report on the Financial Condition of the IL State Retirement Systems: Financial Conditions as of June 30, 2010,"p.8.58
COGFA.2012. “Report on the Financial Condition of the Illinois Public Employee Retirement Systems," p. i.59
Calculation done by the Center for Tax and Budget Accountability COGFA, Special Pension Briefing (Springfield, IL: COGFA,
November 2012). These projections are total state contributions and include both General Fund and non-General Fund contributions.Current and future employer contributions are re-projected every year, and therefore, actual year-to-year changes in appropriationsmay vary.60
Note however, that this does not include the $3.466 billion and $3.7 billion in pension bonds issued in FY 2010 and 2011,respectively.61
Source: Moody’s Investor Service, 2011 State Debt Medians Report.62
Figures for FY2012 and FY2013 are estimates from the governor’s Office of Management and Budget, as reported by COGFA.63
General Fund appropriations include hard costs and are net of unspent appropriations. General Obligation debt service excludesdebt service paid via the Road Fund, School Infrastructure Fund and Capital Projects Fund.64
Illinois Commission on Government Forecasting and Accountability, Illinois FY 2013; Fitch Ratings, Fitch Affirms Illinois’ G.O. Bondsat ‘A’; Outlook Stable, J anuary 5, 2012; Moody’s Investor Service, Stable Outlook Applies to Current Issue and $32.7 Billion of Outstanding G.O. Debt, April 17, 2012; Standard & Poor’s Rating Services, Illinois; General Obligation, August 30, 2012.65
Garcia, Monique. Chicago Tribune “Illinois' credit rating downgraded after pension reform failure.” August 30, 2012.http://articles.chicagotribune.com/2012-08-30/news/ct-met-quinn-credit-rating-20120830_1_pension-reform-pat-quinn-credit-woes66
U.S. Bureau of Economic Analysis, 2010 Gross Domestic Product by State.67 Illinois Commission on Government Forecasting and Accountability, Illinois FY 2012 Capital Plan.68
Illinois Department of Revenue, Publications Section. “Publication 120 – Retirement Income.”69
Illinois Constitution. Article IX, Sec 2.70
Illinois Compiled Statutes 230 ILCS 5 (Illinois Horse Racing Act of 1975) and 230 ILCS 10 (Riverboat Gambling Act).71 Video Gaming Act, Public Act 096-0034, 96th Illinois General Assembly, (J uly 13, 2009).72
COGFA, Wagering in Illinois (Springfield, IL: COGFA, 2012), 3.73 Ibid.74 Allan, Ian J . “Evaluating Alternative Revenue Sources” Government Finance Research Center, Government Finance OfficersAssociation, J anuary 1992.75
Cordes, J oseph J . 1999. “Horizontal Equity.” The Encyclopedia of Taxation and Tax Policy. Urban Institute Press.76
Stretton, Hugh. 1999. Economics: A New Tradition. (London: Pluto Press, 1999), 623.

7/28/2019 Final_fy2013 Ctba Il Budget and Tax Primer
http://slidepdf.com/reader/full/finalfy2013-ctba-il-budget-and-tax-primer 60/60
77Allan, Ian J . “Evaluating Alternative Revenue Sources” Government Finance Research Center, Government Finance Officers
Association, J anuary 1992.78
McCue, Daniel. 2009. “Using Long-Term Demand Projections to Estimate Short Term Market Imbalances.” J oint Center for HousingStudies, Harvard University.79
Illinois Department of Revenue, in Dec. 2011, the standard exemption was raised from $2000 to $2050.80
Public Act 96-149681
Ibid.82
Op. Cit. ITEP “Who Pays?”83
Illinois Department of Revenue, Publications Section. “Publication 120 – Retirement Income.”84
Senate Bill 250585National Conference of State Legislatures, Principles of a High-Quality State Revenue System, J une 2001.86
Center for Tax and Budget Accountability analysis of historical Internal RevenueService and United States Census Bureau data.87 There was an average 6.4% decline in real family income from 1973 to 2008 for the bottom 90% of families in spite of overall realfamily income growth of 20.6% over the period. Calculations from data provided by Emmanuel Saez, Department of Economics,University of California, Berkeley at: http://www.econ.berkeley.edu/~saez/TabFig2008.xls, Tables A0 and A6.88Adam Smith. Wealth of Nations. Book 5, Chap. 2, Part 2. W. Strahan and T. Cadell, London, 1776.89Op. Cit. Book 5, Chap. 2, Article I, footnote 4.90
Institute on Taxation and Economic Policy, Who Pays? A Distributional Analysis of Tax Systems in All 50 States, Fourth Edition J anuary 2013.91Op Cit. Page 42.92Senator Bob Casey. “How Continuing the Payroll Tax Cut and Federal UI Benefits will Help American Families and Support theRecovery:” A Report by the U.S. Congress J oint Economic Committee. J anuary 24, 2012.93 Center on Budget and Policy Priorities, Aug. 3, 2010. “Extension of High-Income Tax Cuts Would Benefit Few Small Businesses;
J obs Tax Credit Would Be Better.”94“A component of Keynesian theory, MPC represents the proportion of an aggregate raise in pay that is spent on the consumption of
goods and services, as opposed to being saved.” www.dictionary.reference.com. 95 J oseph Stiglitz – “Letter to Governor David A. Paterson,” March 2008, Columbia University Business School.
96Institute on Taxation and Economic Policy, “High Rate” Income Tax States are Outperforming No-Tax States, February 2012
97Illinois Constitution Article IX, Section 3
9830 ILCS 115/12
99Errecart, J oyce, Gerrish, Ed, Drenkard, Scott. States Moving Away From Taxes on Tangible Personal Property. Tax Foundation
October 2012.100
Illinois Department of Revenue. Sales and Use Taxes.http://tax.illinois.gov/Businesses/TaxInformation/Sales/rot.htm 101
Illinois Department of Revenue. Tax-Rate Finder, Location Based Taxes. Retrieved 10-20-2010.102
Federation of Tax Administrators. “State Sales Taxes – Food and Drug Exemptions.” Updated 01-01-2013.103
Ibid.104
Bureau of Economic Analysis, National Income and Product Accounts Division. “Table 2.3.6 Real Personal ConsumptionExpenditures by Major Type of Product.” <http://www.bea.gov/national/nipaweb/SelectTable.asp?Selected=N#S2>Q1 2008 to Q2
2010, PCE has gone down only 0.659%.105Homan, Timothy. April 30, 2010. “U.S. Economy: Spending Picks Up, Sustaining Growth.” Bloomberg BusinessWeek.
106Dennis, J an. November 2009. “Only tax increase can cure Illinois budget woes, study says.” University of Illinois News Bureau.
107Federation of Tax Administrators. “Survey of Services Taxation.” J uly 2008.
<http://www.taxadmin.org/fta/pub/services/btn/0708.html>108
CTBA Analysis of BEA Data, IL GDP by Industry, 2008 <http://www.bea.gov/regional/gsp>109
35 ILCS 130110
235 ILCS 5/8-1 to 5/8-14111
Public Act 96-38112
35 ILCS 615, 630, and 640.113
Illinois Lottery, Where Your Lottery Dollar Goes114
230 ILCS 10/13115
230 ILCS 10/12116
35 ILCS 405117
215 ILCS 5/409118805 ILCS 5/15119
42 C.F.R. § 447.422.120
Illinois Department of Revenue.121
30 ILCS 115/12