
#FinaleDay30 Most important questions Related to Project
17
Page 1 | 17 DATA SCIENCE INTERVIEW PREPARATION (30 Days of Interview Preparation) #FinaleDay30 Most important questions Related to Project
Transcript of #FinaleDay30 Most important questions Related to Project

P a g e 1 | 17
DATA SCIENCE
INTERVIEW
PREPARATION
(30 Days of Interview Preparation)
#FinaleDay30
Most important questions
Related to Project

P a g e 2 | 17
Disclaimer: The answers given here are not generic ones. These answers are given based
on the attendance system that we have developed to do face detection. The answers will vary
based on the projects done, methodologies used and based on the person being interviewed.
Face Recognition and Identification system Project
Q1. Tell me about your current project.
Answer:
The project is called Attendance System using facial recognition.
The goal of the project is to identify the person and mark their attendance. First, the user has to
register himself/herself in the application providing the required details. The application takes
multiple snaps of the user and then stores it into the database. Once the same user comes before the
camera again, the application captures the image, references it against the already stored images in
the database, and then marks the attendance, if the user is present in the database. Reports can be
generated for a particular duration based on the user requirement.
Some snaps from the project are as follows:
1st-time registration:
P a g e 3 | 17
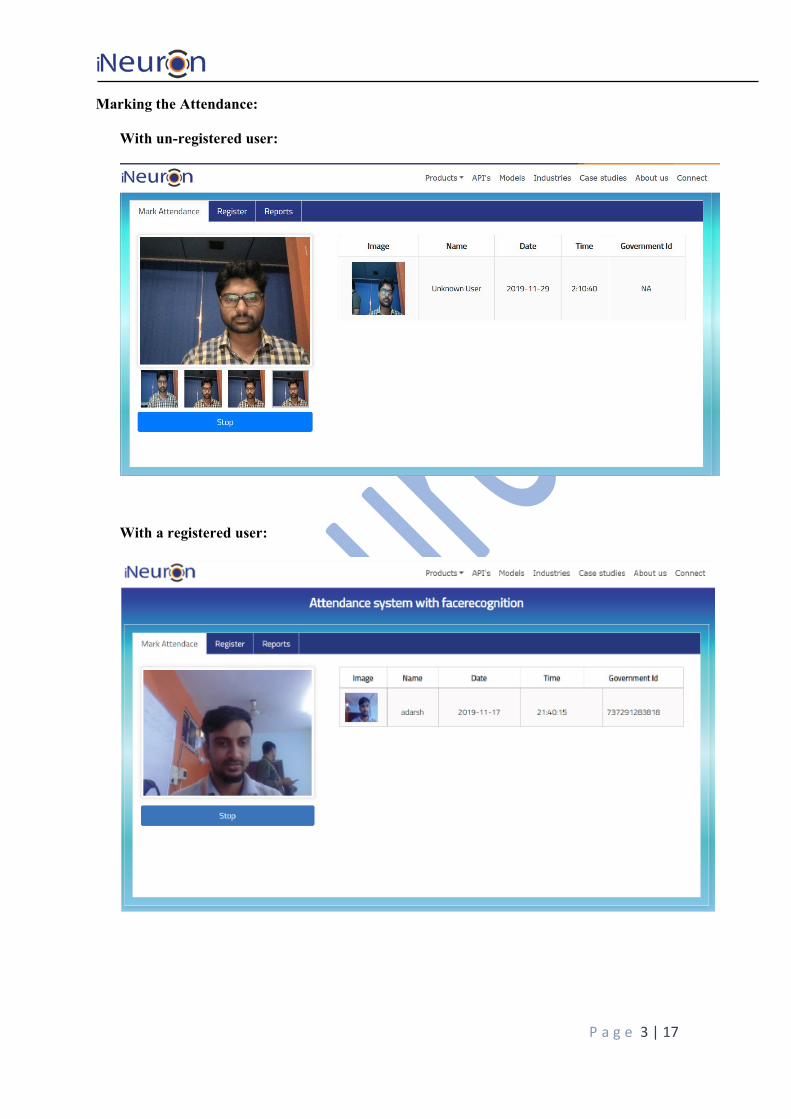
Marking the Attendance:
With un-registered user:
With a registered user:

P a g e 4 | 17
Seeing the reports:
Features:
Works with generic IP cameras with good quality.
Works even with PC, you don’t need high-end systems.
Works in both indoor as well as outdoor environments.
Works with limited pose changes.
Works with spectacles.
Works for people of different ethnicity.
Works for tens of thousands of registered faces.
Works with limited lighting conditions.
Works with partial facial landmarks.
Non-recognition of static input images when provided by the user.

P a g e 5 | 17
Functionalities in the Attendance System
Registration of users in the system.
Capturing the user details during registration using Passport, Adhar Card, and Pan
Card.
All details will be extracted using the in-house OCR technique.
Tracking of the login and logout timings of the users from the system.
Generation of user logs on a temporal basis.
Generation of timely reports.
Deployment/Installation
The application can be easily installed as a web-based API on any cloud platform. This
installation is similar to a plug and play scenario.
The application can also be installed in an edge device (like the Google Coral). This
installation provides realtime streaming capabilities to the application.
Q2. What was the size of the data?
Answer:
The number of images used for training was 12,313.
Q3. What was the data type?
Answer:
The data used for training this model consisted of thousands of images; the images then are converted
to tensor objects, which have a float 32 representation.
Q4. What was the team size and distribution?
Answer:
The team consisted of:
1 Product Manager,
1 Solution Architect,
1 Lead,
2 Dev-Ops engineers,
2 QA engineers,
2 UI developers, and
3 Data Scientists.

P a g e 6 | 17
Q5.What Hadoop distribution were you using?
Answer:
The Hadoop distribution from Cloudera was used as it provides many of the much-needed capabilities
out of the box like multi-function analytics, shared data experience with optimum security and
governance, hybrid capabilities for support to clouds, on-premise servers as well as multi-clouds.
Q6.What is the version of distribution?
Answer:
CDH – 5.8.0
Q7.What was the size of the cluster?
Answer:
The cluster(production setup) consisted of 15 servers with
Intel i7 processors
56 GB of RAM
500 GB of Secondary storage each
Mounted NAS locations
Q8. How many nodes were there in all the Dev, UAT, and Prod
environments?
Answer:
The necessary coding was done on one development server. But as a standalone machine won’t give
enough speed to train the model in a short time, once we saw that the model’s loss is decreasing for
a few numbers of epochs in the standalone machine, the same code was deployed to a cloud-based
GPU machine for training. Once the model was trained there, we used the saved model file for
prediction/classification. The same model file was deployed to the cloud UAT and Production
environments.
In total, we had:
5 nodes in the dev environment,
5 nodes in UAT, and
15 nodes in production.

P a g e 7 | 17
Q9.How were you creating and maintaining the logs?
Answer:
The logs are maintained using MongoDB. The logging starts with the start of the application. The
start time of the application gets logged. After that, there are loggings for entry and exits to the
individual methods. There are loggings for the error scenarios and exception block as well.

P a g e 8 | 17
Q10.What techniques were you using for data pre-processing for
various data science use cases and visualization?
Answer:
There are multiple steps that we do for data preprocessing, like data cleaning, data integration, data
scaling, etc. Some of them are listed as follows:
For Machine Learning:
While preparing data for a model, data should be verified using multiple tables or files
to ensure data integrity.
Identifying and removing unnecessary attributes.
For example,
Here, the user_ID column does not contribute to the customer behavior for
purchasing the products. So, it can be dropped from the dataset.
Identifying, filling or droping the rows/columns containing missing values based on the
requirement.

P a g e 9 | 17
Here, the Product_Category_3 has about 5.5 lac missing values. It can be
dropped using the command df.drop(‘Product_Category_3’,axis=1,
inplace=True)
Or, if the count of null values have been lower, they could have been imputed
using
df['Purchase'] = df['Purchase'].fillna(df['Purchase'].mean())
Identifying and removing outliers

P a g e 10 | 17
In the image above, one point lies very far from the other data points, i.e., it’s an outlier
that is not following the general trend of the data. So, that point can be dropped.
Based on the requirement, form clusters of data to avoid an overfitted model.
Contrary to the example in the previous point, there can be several points that do
not follow a particular pattern or which have a pattern of their own. If those points
are too many, they can’t be considered as outliers. Then we need to consider
those points separately. In that kind of scenario, we create the clusters of similar
points, and then we try and train our model on those clusters.
Scaling the data so that the difference between the magnitudes of the data points in
different columns are not very big.
In the diagram above, the magnitude of the values in the ‘Purchase’ column is
way larger than the other columns. This kind of data makes our model
sensitive. To rectify this, we can do
# Feature Scaling So that data in all the columns are to the same scale
from sklearn.preprocessing import StandardScaler
sc = StandardScaler()
X_train = sc.fit_transform(X_train)
After scaling the data looks like:

P a g e 11 | 17
Converting the categorical data into numerical data.
For example, gender data (Male or Female) is a categorical one. It can be
converted to numeric values, as shown below:
df['Gender']=df['Gender'].map({'F':0, 'M':1})
Replacing or combining two or more attributes to generate a new attribute which serves
the same purpose.
For example, if we use one-hot encoding in the example above, it will generate
two separate columns for males and females. But if we observe, a person who is
not a male is automatically a female(if we consider only two genders). So, the
two columns essentially convey the same information in that case. This is called
the dummy variable trap. So, one column can be conveniently dropped.
Trying out dimensionality reduction techniques like PCA(Principal Component
Analysis), which tries to represent the same information but in a space with reduced
dimensions.
For Deep Learning:
Data augmentation strategies followed by image annotation. Data augmentation
consists of image rotation, contrast, and color adjustments, lighting variations,
random erasing, etc.
Then all the images are made of identical size.
Then image annotation is done.

P a g e 12 | 17
Q11. How were you maintaining the failure cases?
Answer:
Let’s say that our model was not able to make a correct prediction for an image. In that case, that
image gets stored in the database. There will be a report triggered to the support team at the end of
the day with all the failed scenarios where they can inspect the cause of failure. Once we have a
sufficient number of cases, we can label and include those images while retraining the model for
better model performance.
Q12.What kind of automation have you done for data processing?
Answer:
We had a full-fledged ETL pipeline in place for data extraction. Employers already have images of
their employees. That data can be easily used after doing pre-processing for training the image
identification model.
Q13.Have you used any scheduler?
Answer:
Yes, a scheduler was used for retraining the model after a fixed time(20 days).
Q14.How are you monitoring your job?
Answer:
There are logging set-ups done. We regularly monitor the logs to see for any error scenarios. For fatal
errors, we had email notifications in place. Whenever a specific error code, which has been classified
as a fatal error occurs, email gets triggered to the concerned parties.
Q15. What were your roles and responsibilities in the project?
Answer:
My responsibilities consisted of gathering the dataset, labeling the images for the model training,
training the model on the prepared dataset, deploying the trained model to the cloud, monitoring the
deployed model for any issues, providing QA support before deployment and then providing the
warranty support post-deployment.

P a g e 13 | 17
Q16.What was your day to day task?
Answer:
My day to day tasks involved completing the JIRA tasks assigned to me, attending the scrum
meetings, participating in design discussions and requirement gathering, doing the requirement
analysis, data validation, image labeling, Unit test for the models, providing UAT support, etc.
Q17.In which area you have contributed the most?
Answer:
I contributed the most to image labeling and model training areas. Also, we did a lot of brainstorming
for finding and selecting the best algorithms for our use cases. After that, we identified and finalized
the best practices for implementation, scalable deployment of the model, and best practices for
seamless deployments as well.
Q18.In which technology you are most comfortable?
Answer:
I have worked in almost all the fields viz. Machine Learning, Deep Learning, and Natural Language
Processing, and I have nearly equivalent knowledge in these fields. But if you talk about personal
preference, I have loved working in Deep Learning and NLP the most.
Q19.How you rate yourself in big data technology?
Answer:
I gave worked often in the big data computing technology with ample knowledge in distributed and
cluster-based computing. But my focus and extensive contribution have been as a data scientist.
Q20. In how many projects you have already worked?
Answer:
It’s difficult to give a number. But I have worked in various small and large scale projects, e.g., object
detection, object classification, object identification, NLP projects, chatbot building, machine
learning regression, and classification problems.

P a g e 14 | 17
Q21. How were you doing deployment?
Answer:
The mechanism of deployment depends on the client's requirement. For example, some clients want
their models to be deployed in the cloud, and the real-time calls they take place from one cloud
application to another. On the other hand, some clients want an on-premise deployment, and then
they do API calls to the model. Generally, we prepare a model file first and then try to expose it
through an API for predictions/classifications. The mechanism in which he API gets called depends
on the client requirement.
Q22.What kind of challenges have you faced during the project?
Answer:
The biggest challenge that we face is in terms of obtaining a good dataset, cleaning it to be fit for
feeding it to a model, and then labeling the prepared datasets. Labeling is a rigorous task and it burns
a lot of hours. Then comes the task of finding the correct algorithm to be used for that business case.
Then that model is optimized. If we are exposing the model as an API, then we need to work on the
SLA for the API as well, so that it responds in optimum time.
Q23.What will be your expectations?
Answer:
It’s said that the best learning is what we learn on the job with experience. I expect to work on new
projects which require a broad set of skills so that I can hone my existing skills and learn new things
simultaneously.
Q24. What is your future objective?
Answer:
The field of data science is continuously changing. Almost daily, there is a research paper that
changes the way we approach an AI problem. So, it really makes it exciting to work on things that
are new to the entire world. My objective is to learn new things as fast as possible and try and
implement that knowledge to the work that we do for better code, robust application and in turn, a
better user/customer experience.

P a g e 15 | 17
Q25. Why are you leaving your current organization?
Answer:
I was working on similar kinds of projects for some time now. But the market is rapidly changing,
and the skill set required to be relevant in the market is changing as well. The reason for searching a
new job is to work on several kinds of projects and improve my skill set. <Mention about the
company profile and if you have the project name that you are being interviewed for as new
learning opportunities for you>.
Q26. How did you do Data validation?
Answer:
Data validation is done by looking at the images gathered. There should be ample images for the
varied number of cases like change in the lighting conditions, distance from the camera, movement
of the user, the angle at which camera is installed, the position at which the camera is installed, the
angle at which the snap of the user has been taken, the alignment of the image, the ratio of the face
and the other areas in the image etc.
Q27. How did you do Data enrichment?
Answer:
Data enrichment in vision problems mostly consists of image augmentation. Apart from image
augmentation, we tried to train the model with images with different lighting conditions, with b/w
and colored images, images from different angles, etc.
Q28. How would you rate yourself in machine learning?
Answer:
Well, honestly, my 10 and your 10 will be a lot different as we have different kinds of experiences.
On my scale of 1 to 10, I’ll rate myself as an 8.2.
Q29. How would you rate your self in distributed computation?
Answer:
I’d rate myself a 7.7 out of 10.

P a g e 16 | 17
Q30. What are the areas of machine learning algorithms that you
already have explored?
Answer:
I have explored various machine learning algorithms like Linear Regression, Logistic Regression, L1
and L2 Regression, Polynomial Regression, Multi Linear Regression,Decision Trees, Random
Forests, Extra Trees Classifier, PCA, TSnE, UMAP, XG Boost,CAT Boost, ADA Boost, Gradient
Boosting, Light Boost, K-Means,K-Means ++,LDA, QDA, KNN, SVM, SVR,Naïve Bayes,
Agglomerative clustering, DBScan, Hierarchical clustering, TFIDF, Word to Vec, Bag of words, Doc
to Vec, Kernel Density Estimation are some of them.
Q31. In which part of machine learning have you already worked
on?
Answer:
I have worked on both supervised and unsupervised machine learning approaches and building
different models using the as per the user requirement.
Q32.How did you optimize your solution?
Answer:
Well, model optimization depends on a lot of factors.
Train with better data(increase the quality), or do data pre-processing steps more
efficiently.
Keep the resolution of the images identical.
Increase the quantity of data used for training.
Increase the number of epochs for which the model was trained
Tweak the batch input size, the number of hidden layers, the learning rate, rate of
decay, etc. to produce the best results.
If you are not using transfer learning, then you can alter the number of hidden layers,
activation function.
Change the function used in the output layer based on the requirement. The sigmoid
functions work well with binary classification problems, whereas for multi-class
problems, we use a sigmoid model.
Try and use multithreaded approaches, if possible.
Reduce Learning Rate in plateau reasons optimizes the model even further.

P a g e 17 | 17
Q33.How much time did your model take to get trained?
Answer:
With a batch size of 128 and the number of epochs 100000 with 7000 images, it took around 110
hours to train the model using Nvidia Pascal Titan GPU.
Q34. At what frequency are you retraining and updating your
model?
Answer:
The model gets retrained every 20 days.
Q35. In which mode have you deployed your model?
Answer:
I have deployed the model both in cloud environments as well in the on-premise ones based on the
client and project requirements.
Q36. What is your area of specialization in machine learning?
Answer:
I have worked on various algorithms. So, It’s difficult to point out one strong area. Let’s have a
discussion on any specific requirement that you have, and then we can take it further from there.


