Final The Administrator July 2015 - Lal Bahadur Shastri ...
91
THE ADMINISTRATOR Journal of LBSNAA Lal Bahadur Shastri National Academy of Administration July, 2015 Volume 56, Number 2 Editorial Board Mr. Rajeev Kapoor, Director Chairperson Mr. Tejveer Singh, Joint Director Member Ms. Roli Singh, Deputy Director (Sr.) Member Prof. (Dr.) D. P. Uniyal Member Prof. (Dr.) Mononita Kundu Das Member Secretary ISSN 2319-6157
Transcript of Final The Administrator July 2015 - Lal Bahadur Shastri ...

THE
ADMINISTRATORJournal of LBSNAA
Lal Bahadur Shastri National Academy of Administration
July, 2015 Volume 56, Number 2
Editorial Board
Mr. Rajeev Kapoor, Director Chairperson
Mr. Tejveer Singh, Joint Director Member
Ms. Roli Singh, Deputy Director (Sr.) Member
Prof. (Dr.) D. P. Uniyal Member
Prof. (Dr.) Mononita Kundu Das Member Secretary
ISSN 2319-6157

This Journal or any part thereof may not be reproduced in any form without the
written permission of the publisher.
The view expressed and facts stated in the articles contained in this volume are of
the individual authors and are in no way those of either the Editor, the institution
to which he/she belongs, or of the publisher
Copyright © 2015 TRPC
Lal Bahadur Shastri National Academy of Administration, Mussoorie (Uttarakhand)
Published by : TRPC
Lal Bahadur Shastri National Academy of Administration, Mussoorie (Uttarakhand)
Printed in India at Print Vision, Dehradun - 248 001
Mixed system of economy adopted after independence led to the development of
private sector which in turn made a path for urbanization with two factors-push
and pull. To have more income, to give best education or even better employment
is pull factor in India, whereas migration is a push factor. Pull factor majorly
operates in developing countries and India is not an exception.
The pace of urbanization in India puts forward an overwhelming managerial and
policy challenge. The need of the time is a systematic attention to urbanization
about how to handle the seismic shift in the makeup of the nation. The question is
that are the state governments unwilling because of incomplete devolution of thfunctions to the elected bodies by the 74 Constitutional Amendment Act or is it
because very few Indian cities have 2030 master plans taking into consideration
low-income affordable housing, transportation loads and environment as well as
execution of the urban reforms and projects at the municipal and state level which
seems to be insufficient coming from ages past.
We can say that urbanisation is a product of demographic explosion and poverty
induced rural-urban migration. Therefore, policy relates to proper urban planning
of city which includes operational, developmental and restorative planning. For
redirecting migration flows to small and medium cities a strong economic base is a
requirement which would require redirection of investments.
India has build up a dedicated cadre for governance through Indian Civil Services
but now there is a feeling that on the same footing a cadre for governance of cities is
a requirement. Public-private partnership and lateral entry of private-sector
executives should be allowed.
India needs to work on inclusive cities, urban governance, funding, planning,
capacity building and low-income housing to manage its urbanization. A forum
for debate is to be created on urban issues which ought to have the capacity to give
meaningful solutions.
Formulation of a set of policies that will bridge the gap between price and
affordability will help the critical concern for low-income groups for affordable
housing. Rental housing for the poorest of the poor who may not be able to afford a
home even with the incentives is to be encouraged. Local capacity building
through reforms will have to address the development of professional managers
for urban management functions.
Editor’s Note
Dr. Mononita Kundu Das
| ii | The Administrator 56 (2)

We should move towards planning of inclusive cities and urban governance that
caters to reforms and devolution of power and responsibilities from states to the thlocal and metropolitan bodies according to the 74 Amendment Act of the
Constitution of India. Planning can be done through a ‘cascaded’ planning structure.
Large cities having 40-year and 20-year plans at the metropolitan level should be
made binding on municipal development plans. Plans if formulated in detail, are
comprehensive and realistic it will lower the dependence of the cities on Centre.
This issue of ‘The Administrator’ harps on several issues on urban management. The article on City Resource Pool (CRP) examines the reasons for underutilization of CRP by city governments and to identify mobilization agenda for CRP to accelerate supply of municipal finance taking into account innovations as observed among Indian cities and elsewhere. In fact the paper goes on to submit that city resource pool existing as part of urbanization process needs to be duly recognized to raise funds for sustainable habitat.
Regularization of residential colonies in Jaipur city of the State of Rajasthan catering towards urban management in India is an article where the author advocates that the government bodies are to create conducive political and legal environment to facilitate them for better working conditions. Private sector is to operate like a second hand of the government. The relationship between the government and the private sector is to set an example of mutual cooperation and support to each other. Civil society organizations and private sector are also to motivate each other for furthering the socio-political activities in the city of Jaipur.
The Article on SEBI Regulations on Municipal Bonds goes on to examine the regulatory framework to the municipal bond market in India. This article gives a broad understanding of financing of urban infrastructure in India’s cities, salient features of the SEBI regulations and opportunities and challenges arising from the urban local bodies. The author goes on to conclude by saying that municipal bonds offer a unique opportunity to effectively finance a significant proportion of India’s urban infrastructure needs. Greater delegation of financial powers to cities, mandating professional financial management in urban local bodies and undertaking a much broader awareness campaign on municipal bonds among both potential issuers and investors that influences the success of the municipal bond market in India.
The article on improving transport within urban India states major concerns faced by urban transport in India and also provides three strategies to restrain the urban transport problem but the point to be noted here is the author’s stress on administrative championship which can align political will, communicate and arrange the investment needs, and oversee the successful execution of initiatives undertaken.
The author in Mumbai as an international financial centre goes on to comment that there are very few cities in the world which can aspire to become an IFC like London or New York. Mumbai is a city which is blessed with advantages like long coastline, public transport facilities and having offices of most important financial institutions and regulators of the country. Government should facilitate
iv The Administrator 56 (2)
simplification of urban land and property management rules and also municipal governance in the city. Therefore, the author expresses the opinion that Mumbai requires concerted and coordinated efforts of the Government, the sector regulators, private entrepreneurs and most importantly its citizens to remove the obstacles to foster development.
Visualising the ‘Grey’ Area between rural and urban India, this article goes on to analyse the rural-urban definitional paradigm in the Indian political and economic policy spaces which causes one to miss out on important sections of the population, especially those which are defined as rural, but exhibit size and density characteristics of urban population without being able to satisfy the economic criterion. The issue that need to be addressed is to identify the needs of this ‘grey’ population and clearly chart out policies to meet them.
Between 3 and 5 million households in India live in slums that occupy Urban Local Body (ULB) lands. The article on making rental housing work is a case study for slum households and ULBs. The article goes on to justify for diversifying our public housing portfolio on sound economic strategy with significant social benefits.
Inclusive Cities and Participative Development is a case study on Nanded city in the State of Maharashtra where various facets about the city prospects, its problems, policy implementation on the part of government is examined.
With the liberalization of economy in India after 1990’s, it gave rise to the private sector and hence urbanization at a fast pace. If we look into 2011 census there are 53 cities in India with a population of a million or more and by 2031 that number will rise to 87. Some of these metropolitan areas will become major economic powerhouses. Urbanization will lead to economic growth provided it is planned and policy implemented effectively as well as transparently. A potential demographic dividend for India is its young and rapidly growing population. India has to fix its urban operating model. Removal of poverty, slum free India, development of infrastructure, electricity, employment, education, implementation of several schemes and projects initiated by the Government of India from time to time.
Urbanization can be achieved by inclusive planning which will provide affordable transportation, water supply, sewage treatment, solid waste management system and low cost affordable housing. The government of India is also channelling funds to renew its urban spaces through various schemes like JNNURM (Jawaharlal Nehru National Urban Renewable Mission), RAY (Rajiv Awas Yojana for sum free India), PURA (Provisions of Urban Amenities in Rural Areas), NRLM (National Rural Livelihood Mission), and SJSRY (Swarna Jayanti Shahari Rozgar Yojana). Innovative India is now redefining urbanization.
vDr. Mononita Kundu Das
Dr. Mononita Kundu Das, Professor of Law at LBSNAA, Incharge Publications TRPC, Member-Secretary and Editor - 'The Administrator'
The Administrator
Volume 56 July, 2015 Number 2
Editor’s Note iii: Dr. Mononita Kundu Das
City Resource Pool (CRP) for Sustainable Habitat in India 1: Prof. K.K. Pandey
SEBI Regulations on Municipal Bonds: 20potential to finance India’s urban infrastructure
: Srikanth Viswanathan
Improving Transport within Urban India: 30Challenges, Strategies, and Critical First Steps
: Anuj Sharma
Prospects and Challenges Mumbai: 41
: Nidhi Choudhari
Visualising the ‘Grey’ Area between Rural and Urban India 51: Arindam Jana
Making Rental Housing Work: 59
: Swastik Harish
Inclusive Cities and Participative Development: 67
: Nipun Vinayak
Unlocking the
An International Financial Centre
A case for slum households and ULBs
A Case for Discussion
Urban Management in India: 73Regularisation of Residential Colonies in Rajasthan with special reference to Jaipur city
: Dr. Pradeep K. Saxena
vi The Administrator 56 (2)
City Resource Pool (CRP) for Sustainable Habitat in India
K.K PandeyProfessor,Indian Institute of Public Administration, New Delhi.
Abstract
Cities are engines of economic growth, productivity and generate around two third of national income (MoUD 2014). Cities and towns are also expected to promote sustainable habitat through adequate supply of municipal infrastructure, services and amenities. However, it is noted that city governments fail to mobilise revenue from own sources which are formed by a City Resource Pool (CRP). This paper examines the reasons for underutilization of CRP by city governments (hereafter referred as Urban Local Bodies) to identify mobilisation agenda for CRP for sustainable habitat taking into account innovations as observed among Indian cities and elsewhere. The paper concludes that utilization of CRP is directly linked with the promotion of sustainable habitat.
Cities are engines of economic growth, productivity and generate around two third of national income (MoUD 2014). Cities and towns are also expected to promote sustainable habitat through adequate supply of municipal infrastructure, services and amenities. However, it is noted that city governments fail to mobilise revenue from own sources which are formed by a City Resource Pool (CRP). This paper examines the reasons for underutilization of CRP by city governments (hereafter referred as Urban Local Bodies) to identify mobilisation agenda for CRP for sustainable habitat taking into account innovations as observed among Indian cities and elsewhere. It is observed that CRP is established by three types of beneficiaries of municipal assets and services namely (i) City Economy, (ii) Citizens having Land Value Gains (As a result of provision of municipal infrastructure/services) and use/access municipal assets and services. It is also noted that given a chance ULBs can undergo a quantum jump in the utilization of CRP and have revenue account surplus to be able to provide services as per requirement.
Introduction
CRP as a source of municipal finance is a logical development of benefit model indicating that local government services wherever possible should be paid for on the basis of benefits received from the services (Bird, 2001). However, it is noted that (i) revenue base of own sources (coming from CRP) is weak, (ii) there are a few (low) own source revenue (iii) ULBs (Urban Local Bodies) have lack of incentives (encouragement/ guidance) to generate own sources and (iv) the existing revenue potential is not used (UN Habitat 2007). At the same time it is also noted that availability of own sources (utilisation of CRP) is one of the determinants of quality and quantity of municipal services. It is also concluded that supply of municipal services as part of urban development is essential to promote sustainable habitat.
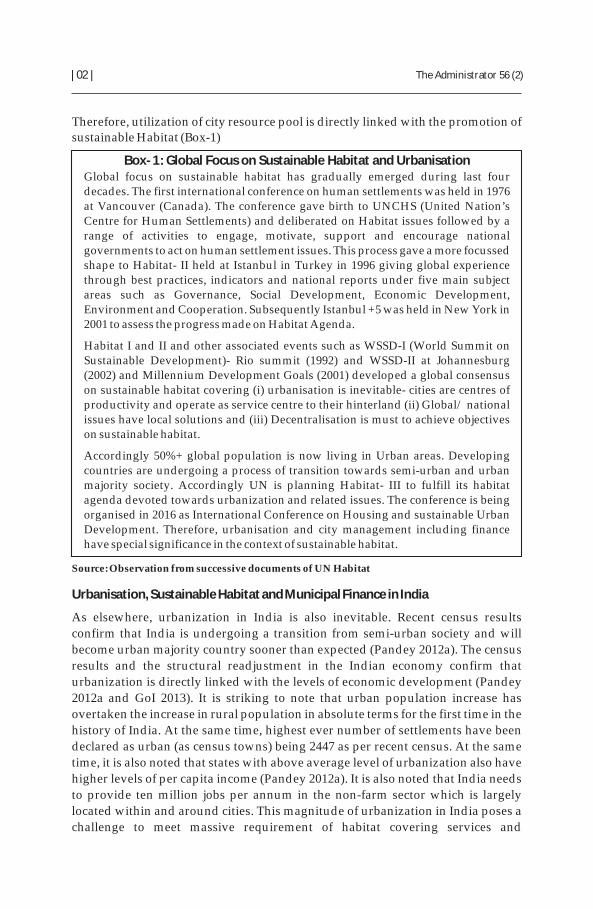
Therefore, utilization of city resource pool is directly linked with the promotion of sustainable Habitat (Box-1)
Box- 1 : Global Focus on Sustainable Habitat and UrbanisationGlobal focus on sustainable habitat has gradually emerged during last four decades. The first international conference on human settlements was held in 1976 at Vancouver (Canada). The conference gave birth to UNCHS (United Nation’s Centre for Human Settlements) and deliberated on Habitat issues followed by a range of activities to engage, motivate, support and encourage national governments to act on human settlement issues. This process gave a more focussed shape to Habitat- II held at Istanbul in Turkey in 1996 giving global experience through best practices, indicators and national reports under five main subject areas such as Governance, Social Development, Economic Development, Environment and Cooperation. Subsequently Istanbul +5 was held in New York in 2001 to assess the progress made on Habitat Agenda.
Habitat I and II and other associated events such as WSSD-I (World Summit on Sustainable Development)- Rio summit (1992) and WSSD-II at Johannesburg (2002) and Millennium Development Goals (2001) developed a global consensus on sustainable habitat covering (i) urbanisation is inevitable- cities are centres of productivity and operate as service centre to their hinterland (ii) Global/ national issues have local solutions and (iii) Decentralisation is must to achieve objectives on sustainable habitat.
Accordingly 50%+ global population is now living in Urban areas. Developing countries are undergoing a process of transition towards semi-urban and urban majority society. Accordingly UN is planning Habitat- III to fulfill its habitat agenda devoted towards urbanization and related issues. The conference is being organised in 2016 as International Conference on Housing and sustainable Urban Development. Therefore, urbanisation and city management including finance have special significance in the context of sustainable habitat.
Source: Observation from successive documents of UN Habitat
Urbanisation, Sustainable Habitat and Municipal Finance in India
As elsewhere, urbanization in India is also inevitable. Recent census results
confirm that India is undergoing a transition from semi-urban society and will
become urban majority country sooner than expected (Pandey 2012a). The census
results and the structural readjustment in the Indian economy confirm that
urbanization is directly linked with the levels of economic development (Pandey
2012a and GoI 2013). It is striking to note that urban population increase has
overtaken the increase in rural population in absolute terms for the first time in the
history of India. At the same time, highest ever number of settlements have been
declared as urban (as census towns) being 2447 as per recent census. At the same
time, it is also noted that states with above average level of urbanization also have
higher levels of per capita income (Pandey 2012a). It is also noted that India needs
to provide ten million jobs per annum in the non-farm sector which is largely
located within and around cities. This magnitude of urbanization in India poses a
challenge to meet massive requirement of habitat covering services and
| 02 | The Administrator 56 (2)
infrastructure and poses a challenge to provide requisite amount of municipal
finance. Yet the availability of municipal finance with a particular reference to CRP
(own source) is fairly low. It is therefore expected that own sources should grow
from current level of 0.5% of GDP to 1.47% during next 10-15 years (HPEC 2010). It
is also noted that there exists a huge sum of Rs. 51 lakhs to 91 lakhs crore to bridge
the gap in the basic services and infrastructure (Pandey 2012a). This backlog
reflects strategic fiscal gap being the difference between funds available and
needed to provide mandated municipal services and amenities.
Fiscal Imbalance and Stress at Municipal Level
There is a fiscal imbalance in the availability of funds to urban local bodies (ULBs)
in a wider context of public/ inter-governmental finance. ULBs together mobilise
only 4.5% of consolidated budget of national, provincial (hereafter referred as
state) and local governments whereas the same is reported to be in range of 20-25%
among several other countries (GoI 2010 and Pandey 2014). Overall mobilisation of
municipal finance is fairly low in India in the context of inter-country experience.
ULBs in India in 2007 mobilised only around 1% of GDP as compared to 13.7% by
China, 5.7% by South Africa, 7.3% by Canada and 2.4% by Australia (UN Habitat
2007). The size of municipal finance in India therefore is fairly low in the inter-
governmental comparison.
This imbalance in the moblisation of municipal finance also leads to existence of
revenue account deficit among ULBs across the size class of cities (Table1). This
type of fiscal stress makes at difficult to augment municipal services and
infrastructure in a regular manner. As per a recent study by IIPA the gap in the
municipal finance in selected towns is fairly high in relation to their receipts and
expenditure requirements. Therefore, ULBs, by and large, carry out a breakdown
or emergency maintenance which makes it difficult for them to maintain existing
levels of efficiency in the delivery of urban services (Pandey, 2014).
K.K Pandey | 03 |

Role of Municipal own sources from City Resource Pool
One important reason in the decline in the municipal revenue is the failure of ULBs to utilise own sources to their full potential. It is also noted that, ULBs fail to mobilise funds from their own sources being only 0.5% as compared to around 20% share by national/ provincial governments. (HPEC 2011 and GoI 2013). It is also noted that by and large ULBs through their own sources mobilise only <1% of city income whereas given a chance the same can be as high as >6% of city income (Pandey 2010).
Table 2: Own Source Mobilisation by ULBs under alternate Scenario in India
Overall
municipal own
sources as % of
GDP in India
Own sources as %
of city Income (for
sample towns in
IIPA study 2011)
Highest mobilisation
of own source as %
of city income among
sample towns
(2008)
Average potential
to enhance own
sources as % of
city income
own sources as %
0.50 1 6.2 (Navi Mumbai) 2.15
Expectations for
of GDP in India
2025
1.17
HPEC
2031
1.47
Source: HPEC 2011 and Pandey 2011
* Except for Bangalore (1.5) and Navi Mumbai (6.2)
| 04 | The Administrator 56 (2)
At a time when India is on a path of rapid economic development and public policies are focusing on investment promotion, skill development, smart cities, Swachh Bharat (Clean India) Mission, Housing for All, the adequacy of municipal finance particularly from municipal own sources becomes essential to enable public policies to achieve overall objectives of inclusive growth.
Identification of City Resource Pool for Municipal Finance
City Resource Pool for own sources follows the benefit model of Municipal
services (UNHABITAT 2007). The own sources include three main areas of
resource pool which are formed by beneficiaries of municipal assets and services
namely (i) city economy (business, industry and trade) (ii) Land Value Gains (Land
value gains) and (iii) consumption of municipal services and assets (Pandey 2011).
As may be seen from Table 3, these three parts of resource pool have immense
potential to provide municipal finance. However, supply of funds from city
resource pool is abnormally low being less than 1% of city income and only 0.5% of
GDP (Pandey 2011 and HPEC 2011). It is further important to note that
mobilisation of own sources has declined considerably during 2002 to 2008 being
63% of total municipal revenue to 53% respectively (HPEC 2011). Table 3 Presents
CRP for municipal finance in terms of beneficiaries’ characteristics and
instruments applied. It is important to note that:
lCity economy part of CRP covers local elasticity, establishments having
economies of scale, pressure groups and community groups. These include
beneficiaries belonging to business, industries, trade, charitable activities and
social concern (Resident Welfare Association and other community groups).
Quite a few instruments are applied across the country to raise municipal
finance from city economy namely: cess, local body tax (Maharashtra),
profession tax, surcharge on electricity consumption (Delhi & Haryana), space
and recognition (for part inputs), seed capital from ULB and participatory
funding.
lBeneficiaries of Land value gains and value added role of municipal
infrastructure cover ownership of land, houses, flats, open spaces, commercial
spaces and industrial space. Property tax, Stamp Duty, Building License fee,
Advertisement fee, Development charges, impact fee, Betterment Levy and
Regularisation charges are the instruments being used to recover part of fiscal
gain to beneficiaries. However, only PT is main instrument and others are
rarely applied.
lThe third area of resource pool is formed by sale, transfer, use and
consumption of municipal assets. These include water, sanitation, solid waste
management’s, Roads, Death and Birth certificates, parking and public
conveniences etc. The instruments cover taxes on vehicles etc. animals, road
cutting charges, user charges, rents, fines and other fee etc.
K.K Pandey | 05 |
2000 -01
2001 -02
2007 -08
14581
15149
23522
0.77
0.73
0.94
4.2
4.1
-
4.5
4.2
-
2.4
2.3
-
Source: (i) Reports of Eleventh and Twelfth Finance Commission
(ii) Economic Survey, GoI 2004-05, (iii) HPEC (2011)
Table 1: Revenue Significance of Municipal Sector in India
Year Municipal
Revenue
(Rs. Crore)
Percentage
of GDP at
Factor Cost
Relative share of Municipal Revenue
(as per cent of Total Revenue of)
Central State Combined
1998 -99
1999 -00
11515
13173
0.72
0.75
4.4
4.2
4.1
4.4
2.5
2.5

Factors causing erosion in the utilisation of city resource pool (base of municipal own Sources)
Factors causing erosion in the base of CRP/ own sources need to be examined in the three parts of CRP and Fiscal structure and financial Management of ULBs (Pandey 2011). This is clearly evident from analysis of these four areas of inadequacies as given in Table 3.
| 06 | The Administrator 56 (2)
Table 3-A: Revenue Base of CRP
Resource Pool Status Adequacy of Municipal Revenue Base
City Economy
(Business Industry & Trade)
1. Abolition of Octroi
2. Unused Local Elasticity
3. Low involvement of Community potential
Beneficiaries of Value added
role or land value gains from
Municipal Infrastructure
1. Weak PT Base - Exemptions and coverage
2. Lack of other Land Based tools
3. Static rates of PT (area method)
4. Poor accounting High Arrears, Low willingness to pay
Access/ Consumption of
Municipal Assets/ services
1. Free/ Subsidised Water
2. Free Riders - Mafia led supply
3. Segregated Assets
Source: Pandey 2011 and Discussions with ULBs
lAbolition of Octroi and non-availability of other suitable fiscal instruments have frozen municipal revenue base from local economy combined with poor and conventional accounting, high arrears, lack of willingness to pay and charge.
lWeak PT base (on account of coverage, low rates, exemptions and lack of other land based tools has locked up land value gains. (Pandey 2011)
lSale/use and consumption of municipal assets is suffering from free riders (Delhi and other cities), Mafia land supply (Parks/ Parking Places and unauthorized colonies), segregated asset covering, inadequate asset accounting without classification, valuation and revenue mobilisation strategy. (HSMI 2006)
Some specific features causing decline in the municipal revenue base under each of the three components of CRP are as follow:
City Economy
Octroi used to be the single most important and largest source of municipal finance providing day today liquidity to the kitty of ULBs. (NIUA, 1983) However, due to it’s impact on fuel and transport (business) efficiency, it was decided to abolish Octori without providing a substitute at ULB level to ensure solvency in the municipal finance (NIUA, 1986). Similarly, local community has consumer surplus among a cross-section of households which by and large remains untapped (Pandey 2011). Therefore, in the absence of suitable instruments, the mobilisation of municipal finance from city economy remains abnormally low.
Land value Gains from Municipal Infrastructure
Property Tax (PT) is the only instrument being used significantly to capture land value gains, Accordingly substantial improvements have taken place in it’s base covering application of unit area method to have transparency and subjectivity in assessment. However, only small fraction of PT base is exploited and the scope of
K.K Pandey | 07 |
Value Added
Role/ Land Value RolesLand, open spaces and Houses
Flats
Commercial
spaces
Industrial
Estates
Property Tax (PT) Other taxes of PT family
Stamp Duty
Building License Fee
Advertisement Fee
Development Charges/ Exaction/ Impact
Fee/ Betterment Levy
Regularisation
Fee
Sale/ Transfer/ Use of
Municipal Sources/ Assets
Water Supply, Sanitation, Roads
Building License
Death
&
Birth
Registration
Parking
Street
cleaning, Public
Convenience
Tax on vehicle/ carriage & carts
Tax on Animals
Road Cutting Charges
User Charges (Water, Sewage, Road)
Fee
Rents/ Fines
Partnerships
City Economy
Economies of
Scale/ settlements Local
Elasticity
Pressure
Group/ community
Groups
Business/ TradeIndustryFiscal Sufficiency (ConsumerSurplus) atIndividual/ group/ community
level
Charitable
Activities/ Socialconcern
CessLocal Body TaxProfession TaxSurcharge on Electricity consumptionSpace & Recognition
Seed
Capital
Participatory Funding
Table 3: Municipal Resource Pool for Own Sources of ULBs
Resource Pool/ Components Characteristics/ Resource Base Instruments Applied
(Beneficiary/ Users of Municipal Infrastructure)

improvement in the tax proceeds is as high as Rs. 22000 - 32000 crores annually in case the current barriers the coverage and collections are removed XIII Finance Commission (GoI 2009). It is observed that coverage of PT net is confined to a part of city areas only which are formally developed. Further overall data base of land and proprieties is not updated (Pandey K.K. 2014).
In addition there are a range of other land based tools which are applied across the
countries such as Valorisation (Columbia), Land Value Increment tax (USA),
Impact fee (USA, Brazil), Betterment Levy, Exactions etc. These are not suitably
tried among Indian cities. PT base as exists in India is also not adequately utilized.
It is also noted that the rates applied under UAM (Unit Area Method) are relatively
low (as may be seen in Municipal Corporations of Delhi) and are not revised
periodically (HSMI 2006). It is further important to note that automation and
online updation of PT data is not fully applied across the cities (Pandey 2016). DCB
statements on PT are not prepared in a realistic manner (HSMI 2006). At the same
time, there appears to be a lack of willingness to charge and pay PT. Many states
such as Punjab, Haryana, Rajasthan hove not recovered PT on owner occupied
properties (Pandey 2011 and Pandey 2015).
Use/ consumption of Municipal Assets and Services
A large part of municipal assets/ services is outside the preview of direct recovery.
This is caused by non-excludability of many of municipal assets/services whereby
it is difficult to determine the use (for example parks, roads, street lighting etc.) and
accordingly charge for respective consumption. In this context, it is important to
note that:
lWater is the single most important municipal service which is directly priced.
In this case also only a part of O&M cost is recovered and fixed costs are
normally subsidised through general kitty of ULBs’ finances. Further, the
extent of leakages in water supply is fairly high. Therefore, the magnitude of
non-revenue water is reported to be in a range 50%. (HSMI 2006 and Pandey
2012 b)
l‘Asset Management’ as such is not applied by most ULBs. It is also noted that,
(i) municipal assets are not updated properly and (ii) complete inventory
along with suitable classification is not prepared, (iii) valuation is not applied
and (iv) revenue stream is not identified. This type of asset management
inhibits mobilisation of resources from municipal assets. (Pandey 2015)
lSolid Waste Management (SWM), despite Municipal Solid Wastes (Management and Handling) Rules 2000 (Govt. of India) and subsequent follow-up is reported to be far from satisfactory. The segregation at source, collection and disposal (including hazardous waste) is not done as per requirement. Deployments of staff on SWM, use of PPP and environment friendly disposal are not done in the light of current innovations. Staff deployment is <1 per 000 population as against a modest norm of 3-5 per 000 population. Disposal of solid waste is mainly done through uncontrolled tipping (open damping), down time of vehicles is 3 to 5 (meaning that only
| 08 | The Administrator 56 (2)
30-50 % vehicles are available for the job) and vast potential of private sector is not used in the process of SWM. (Pandey KK and Jeroen Klink 1996, Pandey 2012 b)
lO&M of roads, parks, play grounds, auditorium/ community hall, gardens, lakes, tanks and other open spaces is particularly poor. It is free for all or free for mafia interest groups which occupy/use as per mutual convenience in a pirate market. (HSMI 2006 and Pandey 2011)
lGovt. of Delhi has recently allowed free access to water upto 20 KL per month per household. This not only extends subsidy to all but also promotes lack of discipline in the consumption.
lPublic grievances on access/ consumption of municipal assets and services are by and large not recorded and attended leading to a quid pro quo and reduction in the tax compliance and willingness to pay in general for municipal assets and services. (Pandey 2002)
Fiscal Structure and Financial Management
Fiscal structure and financial management of ULBs is fairly weak. Fiscal structure covering Powers to levy taxes and fee, manpower deployment and their capacity, freedom to borrow and centralized system of management are important areas of common concern are observed across the ULBs (Pandey and Klink, 1996). Similarly financial management is conventional covering inadequacies in budgeting, auditing and economy in expenditure (Pandey, 2015). Specific points to be noted in this regard are:
lProperty tax is the single most important sources of MF with a heavy erosion of its base caused by a range of issues in the fiscal structure (base, rate and collection mechanism) and accounting and financial reporting. Accordingly coverage and collection are abnormally low (GoI 2009 and Pandey 2014)
lWater supply and land development are not uniformally assigned to ULBs, thalthough, they are recognized as a core municipal function (74 CAA 1993)
and are also interlinked with other municipal functions such as storm water drain, solid waste management, Municipal roads, water to low income areas and building permissions/ management of open spaces upon handing over respective area to ULBs. (MoUD 2011)
lULB suffer from shortage of manpower and requisite skills to their employees. Research and training is not used to upgrade skills as per requirement. (MoUD: 2011)
lULBs need permission from respective State Govts. to borrow money as per respective municipal Acts. Similarly expenditure limits are placed which inhibit implementation of specific projects. (MoUD: 2011)
lBudgeting is still based on line item incremental method which does not give due cognizance to actual requirements. This becomes to a purely ad-hoc exercise without having a systematic impact on the respective backlog. (Pandey 2002)
K.K Pandey | 09 |
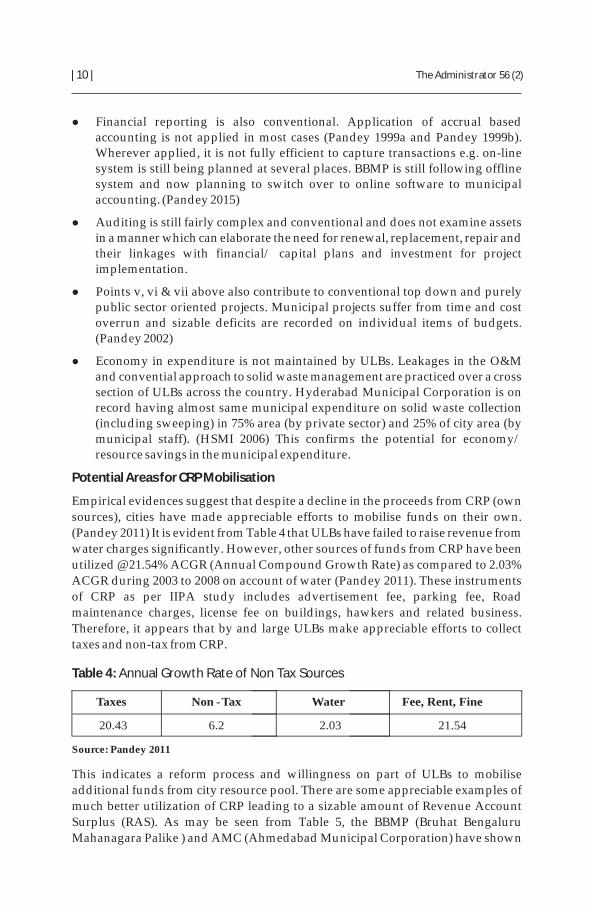
Table 4: Annual Growth Rate of Non Tax Sources
Taxes Non -Tax Water Fee, Rent, Fine
20.43 6.2 2.03 21.54
Source: Pandey 2011
lFinancial reporting is also conventional. Application of accrual based accounting is not applied in most cases (Pandey 1999a and Pandey 1999b). Wherever applied, it is not fully efficient to capture transactions e.g. on-line system is still being planned at several places. BBMP is still following offline system and now planning to switch over to online software to municipal accounting. (Pandey 2015)
lAuditing is still fairly complex and conventional and does not examine assets in a manner which can elaborate the need for renewal, replacement, repair and their linkages with financial/ capital plans and investment for project implementation.
lPoints v, vi & vii above also contribute to conventional top down and purely public sector oriented projects. Municipal projects suffer from time and cost overrun and sizable deficits are recorded on individual items of budgets. (Pandey 2002)
lEconomy in expenditure is not maintained by ULBs. Leakages in the O&M and convential approach to solid waste management are practiced over a cross section of ULBs across the country. Hyderabad Municipal Corporation is on record having almost same municipal expenditure on solid waste collection (including sweeping) in 75% area (by private sector) and 25% of city area (by municipal staff). (HSMI 2006) This confirms the potential for economy/ resource savings in the municipal expenditure.
Potential Areas for CRP Mobilisation
Empirical evidences suggest that despite a decline in the proceeds from CRP (own
sources), cities have made appreciable efforts to mobilise funds on their own.
(Pandey 2011) It is evident from Table 4 that ULBs have failed to raise revenue from
water charges significantly. However, other sources of funds from CRP have been
utilized @ 21.54% ACGR (Annual Compound Growth Rate) as compared to 2.03%
ACGR during 2003 to 2008 on account of water (Pandey 2011). These instruments
of CRP as per IIPA study includes advertisement fee, parking fee, Road
maintenance charges, license fee on buildings, hawkers and related business.
Therefore, it appears that by and large ULBs make appreciable efforts to collect
taxes and non-tax from CRP.
| 10 | The Administrator 56 (2)
This indicates a reform process and willingness on part of ULBs to mobilise
additional funds from city resource pool. There are some appreciable examples of
much better utilization of CRP leading to a sizable amount of Revenue Account
Surplus (RAS). As may be seen from Table 5, the BBMP (Bruhat Bengaluru
Mahanagara Palike ) and AMC (Ahmedabad Municipal Corporation) have shown
Table 5
ULB Utilisation of CRP (Own sources)
Revenue Expenditure
RAS Rs. in Crores Capital Expenditure (CE)
Amount RAS as % of CE
Bruhat
Bengaluru
Mahanagara
Palike
3715 2243 1472 3014 49%
Ahmedabad
Municipal
Corporation
4015* 2697 1318 2967 44%
*includes Rs. 1045 Crores as grant in lieu of Octroi which is a defacto
substitute of CRP potential.
RAS in their budget for 2015-16 to the tune of Rs. 1472 crores and Rs. 2418 crores
respectively. This has enabled the two cities to propose a range of activities to
provide basic services and infrastructure covering mobility, water and sanitation,
lighting, community services, shelter to poor and skill development training and
facilitation to a cross-section of households and city areas. Therefore, utilization of
CRP is directly linked with the promotion of sustainable habitat.
K.K Pandey | 11 |
Following analysis give important innovations taken across the country during past couple of decades to have a systematic utilization of CRP and suitable reforms in Fiscal structure and financial management. These are applied at ULB level in a typical (adhoc and irregular) manner notionally to achieve targets without giving due attention on sealing up and replicability.
City Economy/ Local Elasticity
Municipal services and infrastructure have a high externalities/ rate of return to the economy. As per World Bank Study in early 90’s ERR (Economic Rate of Return) from municipal infrastructure is reported to be as high as 21 (World Bank 1997). In this regard, recent efforts have covered appreciable engagement of city economy covering business, industry, trade, civil society and individuals to contribute towards mobilisation of municipal finance. This includes:
(i) Local Body Tax (LBT) in Maharashtra is a powerful direct instrument which
has immense potential. Local body tax started from abolition of Octroi in Navi
Mumbai which was able to tap 6.4% of city GDP/ income and provided an
equally strong stream of revenue subsequently (Pandey 2011). LBT was
introduced among all the ULBs in the state (other than Mumbai Municipal
Corporation which continued to levy Octroi). The potential role of LBT, in the
mobilisation of city economy, therefore, should be duly recognized.
(ii) In addition Corporate Social Responsibility (CSR) from Corporate Sector,
(both public and private) needs to be extensively utilized within municipal
system.

Committee) had given land to private sector to build five star hotels in the prime locations in Delhi.
Land Value Increment Tax
LVIT is levied in Columbia since 1977. The purpose is to recoup the benefits that are a consequence of urbanization. Under this tax 30-50 percent appropriation is collected from beneficiaries.
Betterment Levy
Betterment levy is collected to recover full cost on the development of selected project. It is levied in a time series to minimize the burden on tax payee.
Valorization Charges
This is levied in Columbia. Unlike betterment levy, this is a lump sum levy to be paid /may be paid in installments to recover part of the project cost
Impact Fee
This tax is used widely in USA, to recover the impact made by construction of real estate on services. It is charged on the builder for future cost of augmentation to be borne by the civic authority. The municipal corporation of Hyderabad levies this tax in India.
Development Charges
This is used to recover the cost of providing services and infrastructure already existing/to be provided in a given area. It is also used in situation of altogether new development. The Municipal Corporation of Delhi has tried to use this in unauthorized colonies without much follow up. Computation of these charges is real issue for adaptation.
Exactions
Exactions are used to get requisite land as part of building permissions to provide necessary amenities / services in the area developed by real estate developer. These are used to provide schools/ hospital/ community services etc. Land pooling scheme of Delhi Development Authority is one of such attempt to recover land from area developed by DDA on land given to DDA for development by respective owners.
Source: Pandey 2014 and UN Habitat 2007
Indian ULBs however depend mainly on Property Tax along with a limited incidence of Impact fee, betterment levy and Development charges, Exactions etc. Main features of Indian experience are as follow:
lA large number of towns as a result of GoI’s reform based allocation have attempted to use GIS to streamline information base on properties. However, expansion of PT net and sizable increase in proceeds are observed as a follow up of GIS and complete listing of properties. (Pandey 2014b and Box 3), although, all the GIS towns have not fully utilized the potential of PT growth.
lSimilarly, GIS data can also be used for wider application of alternate instruments to tap monetisation of land. SFCs (State Finance Commission)
| 12 | The Administrator 56 (2)
(iii) Consumer surplus available with a cross-section of urban society is also being
used by ULBs to finance municipal services covering both cash and in kind
support from the community. Box 2.
Box 2 : Consumer Surplus/ Local Elasticity for Sustainable Habitat
lIndore Municipal Corporation in Madhya Pradesh, ULBs in the states of Andhra
Pradesh and Telangana (through JANAM BHUMI) and Tamil Nadu (through
Namakku Name Thettam) are successfully mobilizing community resources to
supplement municipal finance. In this case, local communities provide part
contribution towards creation of a range of services such as roads, footpath,
social forestry, community centres etc. This collaboration includes both
investment (capital work) and O&M of respective assets. (Pandey 2011)
lBruhat Bengaluru Mahanagar Palike (BBMP) has initiated a scheme (My
Bengaluru My Contribution) which tends to have synergy between CSR, Civil
Society/ individuals in a tripartite manner. Projects pertaining to public space
and community services have been taken up under the scheme.
lBBMP as part of initiative by local councillors has also used ‘Walker’s
Association’ using a lake to have better upkeep and promote safe environment
in the lake area. In this case even labour is accepted to keep a vigil/ monitor
safety and hygiene in the walking area.
lSakhi Mandal and SAATH in Gujarat have also successfully mobilised
community to stimulate productivity of local workforce to maintain basic
services through their support.
lInitiatives such as TDR (Transfer of Development Rights) are also promoted at
Mumbai and Bengaluru etc. to provide extra FSI (Floor Space Index) in lieu of
acquisition of additional public space (HSMI 2006, Pandey 2015). This method
uses land value for the provision of basic/ municipal services.
Source: Discussion and visit to respective cities/ ULBs
Capturing Land Value Gains
Land Value Gains have immense potential to supplement municipal finance. A
series of tax instruments exist to capture land value to public investment. These
include (i) Tax Incremental Finance (ii) Valorisation (iii) Land Value Incremental
Tax (UN Habitatal, 2009). In addition Impact fee, Betterment Levy, Exactions and
Development Charges are also used to recover cost on urban infrastructure and
services. (Box-3)
BOX 3 : Land Value Capture – Taxes/ Levies
Land Value capture taxes and levies are applied on the basis of data on size, use and location of properties/land. GIS application appears to be one of the pre-requisites to effectively levy land value capture taxes and levies.
Leasing (Fee)
City government under this method give government land to private sector on lease for provision of necessary infrastructure. NDMC (New Delhi Municipal
K.K Pandey | 13 |
| 14 | The Administrator 56 (2)
among respective states need to give due cognizance to potential role of alternate instruments to capture land value gains. (NIUA 2010)
lAnother important area of potential to tap land value gains is the profit from land development and allocation. In most cases land does not form part of municipal functions. Successive committees, reports, commissions have recognised the potential role of land to finance ULBs. Moily Commission (The Second Administrative Reforms commission) and XIII Finance Commission (GoI 2009) have recommended either assignment of land function to ULBs or sharing of profit by para-statal/ para-muncipal agencies such as housing boards development authorities, improvement trusts etc. with respective ULBs. However, respective states have not implemented the recommendations and have adopted a GO-SLOW approach on revenue sharing on accumulated profits from land by respective development agencies. (Pandey 2012)
Consumption of Municipal Assets and Services
Consumption of Municipal Assets and Services is another part of city resource pool being mobilized through innovative instruments as follow:
lAssets accounting covering listing, classification, valuation and resource mobilization strategy is emerging as a tool to examine potential of additional resources (Pandey 1999). These revenue assets cover Parks, Playgrounds, Community centres, schools, open spaces and other land and buildings. Municipal Corporations in Delhi have identified several parks and parking places through a quick mapping. (HSMI 2006)
lMunicipal land can be given on lease for creation of assets. NDMC (New Delhi Municipal Committee) has used ‘licensing’ to involve private sector to create 5 star hotels in the prime locations in the capital city of India. Municipal land in Delhi is also given to private sector for creating public toilets on BOT basis (build own and transfer) (HSMI 2002)
lBBMP has used municipal land to involve private sector for development of Solid Waste treatment plant on Operate and Transfer (OT) basis. BBMP has given the O&M of waste treatment @ Rs. 7 lakh per annum for a treatment plant leading to gas and energy generation from kitchen waste which is also used to light the street lamps provided by BBMP on specific roads in the colony. In addition BBMP has also spent a sum of Rs, 21 lakhs towards capital asset of treatment plant. (Pandey 2015)
lGreater Mumbai Municipal Corporation (GMMC) has used TDR (Transfer of Development Rights) to make private land available for public services known as PI (Public Interest) sales scheme. This has generated space equivalent to a sum of Rs. 3000 Crores (HSMI, 2006) This has provided additional road, open spaces in the existing areas to extend necessary services to local community with special reference to poor.
lNational Green Tribunal has instructed Govt. of NCTD to levy sewage charges in proportion to Water and PT bill (whichever is more) and flat rate charge on
K.K Pandey | 15 |
unauthorized colonies in a range of Rs. 100 to Rs. 500 to mobilize funds for th‘Clean Yamuna’ (TOI, 7 May 2015). This once effective will serve dual agenda
to charge for services and clean sewage for wider issue of safe environment.
lAnand Municipal Body (Nagar Seva Sadan) in Gujarat has involved private sector to pay for kitchen waste @ Rs. 90 Paise per killo being collected by private licensee from hotels/ educational institutions.
Fiscal Structure and Financial Management
Several innovations are also emerging in the fiscal structure and financial
management of ULBs. These present a typology of actions which may be
considered for suitable follow as below:
lGIS application to cover large number of properties in Agra Municipal
Corporation for example, has demonstrated a quantum jump of tax proceeds
as a result of wider base created by survey of properties/ GIS application
(Box 4). Properties were added in Agra in the year. (Pandey 2014) Many other
cities have expanded the base in the same manner. BBMP has introduced
Sakrama Akrama paving way to cover properties developed through illegal
land sub-division under the PT net. (Pandey 2015)
lMany states have taken steps to handover water supply to ULBs. However,
allocation of land development function is still not implemented. This needs
to be attended along with grant of legal tile to ULBs (who are reported to be
lacking title on their own land) to widen the scope of municipal finance from
own sources. (Pandey 2014)
lStates such as Maharashtra, Karnataka etc. have introduced separate cadre,
promotions avenues, capacity building for municipal employees to
rationalize urban management for better fiscal structure and financial
management. (MoUD 2011)
lBorrowing per-say is not a problem. Issue is lack of requisite collateral and
commercially viable projects. State Govts. of Rajasthan, Madhya Pradesh etc.
have tried to create intermediary link institution to pool together ULBs’
project and seek loans for these projects. HUDCO has also accepted municipal
stadium as collateral in Ahmedabad. Further Ahmedabad Municipal
Corporation has created SPV (Special Purpose Vehicle) to raise funds for the
projects on conservation and monetisation of river front development
covering Mobility (Jan Marg) and SRFDC (Sabarmati River Front
Development Corporation). (Pandey 2014)
lParticipatory budgeting is emerging gradually, though in an adhoc manner.
The schemes in Bangalore, Indore, Hyderabad etc. using local contribution
can be consolidated to design a systematic pattern/ incidence of participatory
funding. However, we have to recognize this method as applied in Brazil and
keep 10-15% money as seed capital to motivate stakeholders (UN Habitat
2007). BBMP is also mobilising 22.5% budget for weaker sections.

lDouble entry accounting is now applied by couple of hundred towns in a majority of states. However, multiple fund accounting, online accounting, asset accounting are not used as a follow-up of new accounting method. (Pandey 2015)
lAuditing is also undergoing reforms. Environmental Audit (Maharashtra), Energy Audit (Bengaluru), Third Party Audit (Andhra Pradesh) are emerging at different places. Model Municipal Act (MMA) makes special provision for these type of auditing reforms (MMA 2001).
lFinance Commission has widened the size of untied grants. The total allocations has undergone a quantum jump from Rs. 24,000 Crore+ (2010-15) to Rs. 80,000 Crore (2015-20) Similarly other state finance commissions have also initiated allocation of funds to give ULBs an opportunity to identify priorities. (XIV Finance Commission 2015) This leads to preparation of realistic projects which can be implemented within stipulated time.
Box 4 : PT Reforms at Agra Municipal Corporation
Base- Three specific actions were taken to expand the base i.e. (i) survey of properties in 2002 and 2013 (ii) Imposition of Unit Area Method (introduced in 2002) of PT using circle rates, width of road, size and structure; (iii) introduction of self-assessment on user friendly format and (iv) levy of PT on Government properties; http:// www.nagarnigamagra.com/
Rate- PT rates were rationalized through specific actions namely (i) introduction of a consolidated rate of PT replacing multiple attributes of taxes and cess. (ii) Revision of circle rates in 2012 by adding 20% value across the colonies. (iii) computation of annual value giving due incentives and concessions to age of structure, owner occupation, senior citizen, single women, etc.
Collection- Collection system was rationalized covering (i) Online collection
managed by two identified banks; (ii) Manual collections are also done at grass-
root level (camps) and zonal offices; (iii) Panel rate of interest @ 12% on delayed
payment (after September); (iv) Incentives (10%) on payments upto September and
(v) Bank account attachment and media display of names for big defaulters.
Impact of PT Reforms in Agra: Reforms have proved buoyancy, elasticity and
liquidity of the PT revenue.
(i) Per capita PT has gone up from Rs. 31 in 2001 to Rs. 118 in 2014.
(ii) Survey of properties in 2002 and 2012 respectively has added19% and 8% new
properties in the respectively.
(iii) PT has grown by five times (492%) during 2001 to 2014 as compared to 88%
increase in assessed properties and 371% increase in municipal own sources
during the same period. Per property PT has also gone up form Rs. 258 in 2002
to Rs. 675 in 2014.
(iv) PT is a dependable source (increased from 21% in 2001 to 28% in 2014 and
provided 45% own source revenue in 2005-06 when own sources faced a
sudden decline).
| 16 | The Administrator 56 (2) K.K Pandey | 17 |
(v) Special measure such as attachment of Bank account, levy of panel interest,
introduction of attractive rebates and online collection have contributed to
phenomenal increase in the proceeds from PT.
(vi) PT reforms have enabled AMC to have rating (A+) by CRISIL in the year 2004
and promoted borrowing capacity for commercial loan.
Feedback: AMC has collected 90% of target (collectable demand) in 2012-13 fixed
by provincial govt. Yet, the actual demand and potential is substantially high than
the collection and there is a need to rationalize demand data and collection
strategy. Similarly, other land based taxes and sharing of profit from Development
Authority is also needed to accelerate supply of municipal finance.
Municipal Agenda for City Resource Pool
A generic agenda for mobilization of municipal finance from City Resource Pool
(CRP) is emerging from the preceding analysis covering measures causing erosion
of resource base of own sources and innovations emerging on the subject among
urban local bodies taking into account innovations in India and elsewhere.
Eighteen point municipal (action) agenda covers four main areas of actions to
stimulate revenue base from CRP namely: (i) Fiscal structure and Financial
Management (to more effectively tap CRP for municipal finance), (ii) city economy
(iii) Land Value gains and (iv) Consumption of municipal assets and services.
Fiscal structure and Financial Management
lRevisit fiscal powers of ULBs with a particular reference to levy taxes
particularly land value capture taxes (as elaborated earlier), borrow from
market, and expenditure on capital works and O & M of respective services.
lIntroduce participatory, bottom up, performance based budgeting in line with
the budgeting experience in Columbia of similar nature and using a
combination with Indian efforts in Madhya Pradesh, Andhra Pradesh, Tamil
Nadu.
lApply accrual based/double entry accounting giving due cognizance to
arrears (both to be received and paid) and return on capital assets,
depreciation to have transparency and accountability in the municipal
system. Accordingly, modify National Accounting Manual (prepared by
Govt. of India) and apply on line system of accounting software.
lMunicipal auditing should be more focused on (i) pointed analysis of financial
position, (ii) performance (iii) Application of rules and regulations. (iv) follow
up on audit observations (v) incidence of wasteful expenditure and (vi)
compliance of overall budget objectives.
lComptroller and Auditor General of India, state Govts. and local Govts. to
take due cognizance of accounting code, practices and follow up taking into
account overall policy objectives on poverty, environment, equity, quality of
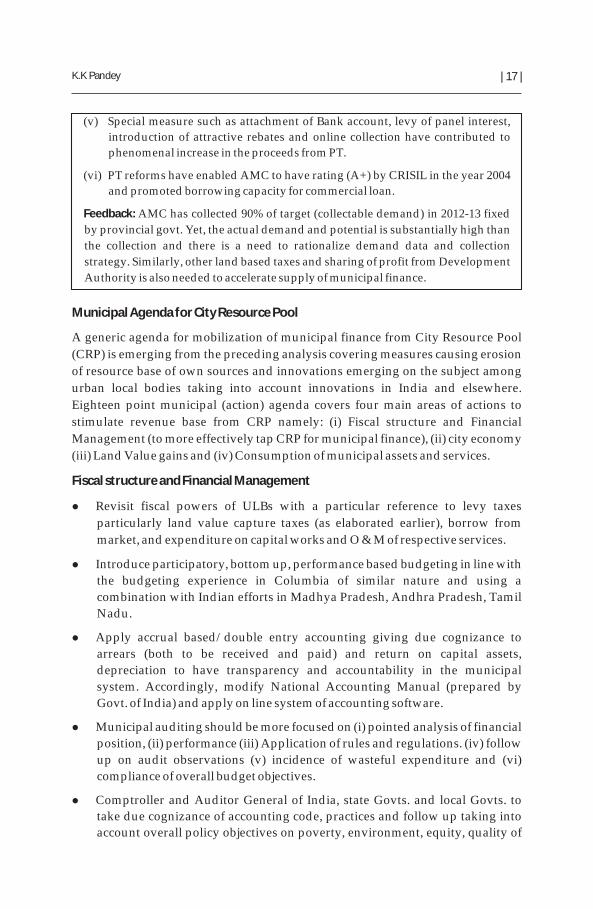
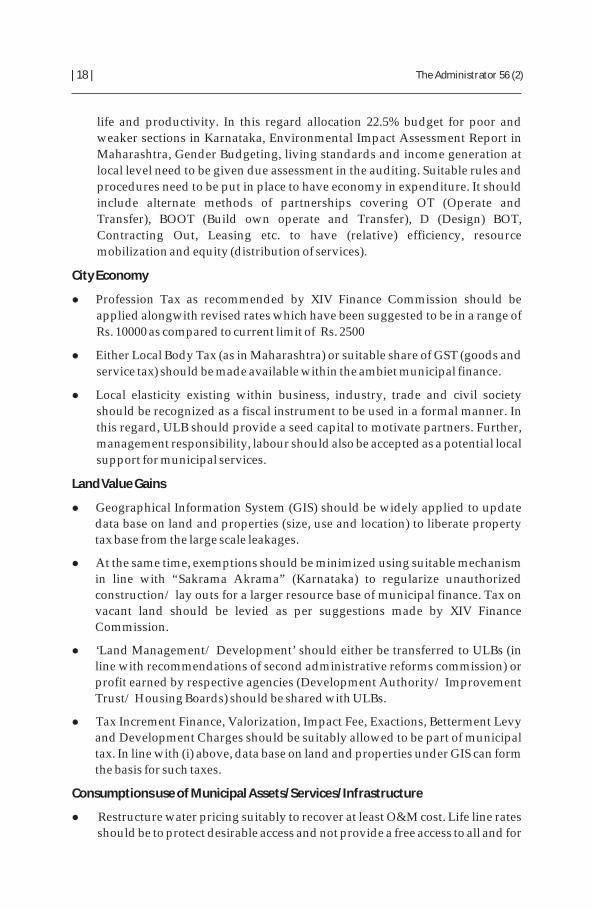
| 18 | The Administrator 56 (2)
life and productivity. In this regard allocation 22.5% budget for poor and
weaker sections in Karnataka, Environmental Impact Assessment Report in
Maharashtra, Gender Budgeting, living standards and income generation at
local level need to be given due assessment in the auditing. Suitable rules and
procedures need to be put in place to have economy in expenditure. It should
include alternate methods of partnerships covering OT (Operate and
Transfer), BOOT (Build own operate and Transfer), D (Design) BOT,
Contracting Out, Leasing etc. to have (relative) efficiency, resource
mobilization and equity (distribution of services).
City Economy
lProfession Tax as recommended by XIV Finance Commission should be
applied alongwith revised rates which have been suggested to be in a range of
Rs. 10000 as compared to current limit of Rs. 2500
lEither Local Body Tax (as in Maharashtra) or suitable share of GST (goods and
service tax) should be made available within the ambiet municipal finance.
lLocal elasticity existing within business, industry, trade and civil society
should be recognized as a fiscal instrument to be used in a formal manner. In
this regard, ULB should provide a seed capital to motivate partners. Further,
management responsibility, labour should also be accepted as a potential local
support for municipal services.
Land Value Gains
lGeographical Information System (GIS) should be widely applied to update
data base on land and properties (size, use and location) to liberate property
tax base from the large scale leakages.
lAt the same time, exemptions should be minimized using suitable mechanism
in line with “Sakrama Akrama” (Karnataka) to regularize unauthorized
construction/ lay outs for a larger resource base of municipal finance. Tax on
vacant land should be levied as per suggestions made by XIV Finance
Commission.
l‘Land Management/ Development’ should either be transferred to ULBs (in
line with recommendations of second administrative reforms commission) or
profit earned by respective agencies (Development Authority/ Improvement
Trust/ Housing Boards) should be shared with ULBs.
lTax Increment Finance, Valorization, Impact Fee, Exactions, Betterment Levy
and Development Charges should be suitably allowed to be part of municipal
tax. In line with (i) above, data base on land and properties under GIS can form
the basis for such taxes.
Consumptions use of Municipal Assets/ Services/ Infrastructure
l Restructure water pricing suitably to recover at least O&M cost. Life line rates
should be to protect desirable access and not provide a free access to all and for
K.K Pandey | 19 |
Professor K.K. Pandey is a professor of Urban Management at the Indian Institute of
Public Administration, New Delhi. The author can be reached at
a large amount of consumption. Accordingly the rates should be differential
and graduated. However, universal metering would be a must to apply
pricing of water.
lAsset Management should be taken up on a regular basis covering listing,
classification, valuation and revenue stream and potential from respective
assets. The potential actions may include renew, replacement, expansion,
retirement (sale/ disposal) of assets.
lAt the same time saleable assets such as land should be examined from the
angle of its legal ownership to provide secure title (which in most cases is not
readily available) to ULBs.
lSpecific approach should be devised to mobilise revenue from non-saleable
assets such as Roads, Parks, Play grounds, community centres etc.
lRates for user charges/ fee should be revised periodically as a routine practice.
lSPV (Special Purpose Vehicle) route should be examined for speedy
implementation and resource mobilization for specific projects-in line with
SRFDS (Sabarmati River Frond Development Corporation, Ahmedabad and
Jan Marg (Ahmedabad).
Finally, it appears that city resource pool has immense potential to provide
municipal finance to meet massive requirements of funds for sustainable habitat.
In addition, fiscal structure and financial management at city government level
need to be reoriented. At the same time suitable instruments and mechanisms have
to be applied in the individual components of city resource pool to initiate and
accelerate availability of funds from respective part of CRP.

Abstract
The Securities and Exchange Board of India (SEBI) has issued the SEBI (Issue and Listing of Debt Securities by Municipality) Regulations 2015 in March 2015. These regulations intend to provide a regulatory framework to the municipal bond market in India and provide more clarity and transparency to both issuers and investors. This paper explores the opportunity of financing urban infrastructure through municipal bonds. The objective of this paper is to understand the context of financing of urban infrastructure in India’s cities, salient features of the SEBI regulations and opportunities and challenges and opportunities arising from the same for Urban Local Bodies (ULBs).
Introduction
The Securities and Exchange Board of India (SEBI) issued the SEBI (Issue and
Listing of Debt Securities by Municipality) Regulations 2015 in March 2015. These
regulations intend to provide a regulatory framework to the municipal bond
market in India covering 1) Regulation of the issuance and listing of municipal
bonds and 2) Disclosures required to be made by issuers of municipal bonds.
These regulations are expected to provide more clarity and transparency to both
issuers and investors thereby promoting municipal bonds as a means to fund
infrastructure in cities. Interest in Municipal bonds is being revived against the
backdrop of the Smart Cities mission of the Government of India an essential
feature of which is to have special purpose vehicles raise funds to finance smart
infrastructure in select cities. Thus, far less than Rs 2,000 crores (approximately
USD 350 million) of municipal bonds have been issued in India since 1997. In
comparison, the United States has outstanding municipal debt of USD 3.7 trillion
(over 200 lakh crores) comprising 1 million municipal bond issues and 44,000
issuers (state and local governments). Countries such as South Africa, Indonesia
and Vietnam too have issued relatively large amounts of municipal bonds for
funding urban infrastructure.
The Context
The Twin Challenges
India’s cities and towns are expected to play a key role in India’s socio-economic
development over the next four decades. India’s urban population is expected to
rise from just over 400 million (30% of total) to over 800 million (50% of total) by
SEBI Regulations on Municipal Bonds: Unlocking the potential to finance India’s urban infrastructure
Srikanth ViswanathanCoordinator Advocacy and Reforms,
Janaagraha Centre for Citizenship and Democracy, Bengaluru.
2050. This addition of 400 million to urban India is expected to be the largest
demographic transition of its kind in this century. There are both opportunities
and challenges that accompany this transition.
Urbanisation is considered to be a necessary ingredient of development and progress in countries. In India, cities and towns are expected to produce over 75% of the country’s Gross Domestic Product (GDP) and over 70% of the new employment during 2011 to 2031 according to a Mckinsey research report on urbanisation in India. On the other hand, the prevalent quality of life, heavily influenced by quality of infrastructure and services, is very poor across urban India.
Table 1: Large Deficit in Infrastructure and Service Delivery in India’s cities and towns
Infrastructure/Service Deficit
Housing and Poverty
Urban Poor c.14%
Slum Population c.17- 24%
Affordable Housing c.19 -25m units
Water 64%, 1- 6 hours
Sewerage
Network deficit 4,861 out of 5,161 cities
Treatment: 20 -30%
Storm Water Drains <20% of urban roads
Transport
Public transport share: c.25%
Source: Planning Commission, High Powered Expert Committee on Urban
Infrastructure, Mckinsey’s Report on India’s urbanisation and other industry reports
The competitiveness of India’s cities and their economic performance is impacted by poor quality of governance and service delivery.
Srikanth Viswanathan | 21 |

Table 2 : Competitiveness of India’s cities
Source: Hotspots 2025 report of The Economist Intelligence Unit
There are therefore two distinct but inter-related challenges facing India’s cities and towns: One of quality of life available to its citizens in terms of physical infrastructure and public services, and two of the economic challenge of India’s cities being able to attract capital and talent to drive economic growth not just of cities but the national economy as a whole.
Both of these challenges have one predominant solution: transformation in quality of infrastructure and service delivery.
Financing India’s Urban Infrastructure
Financing infrastructure and public service delivery in India’s cities and towns alone is estimated to cost upwards of Rs 40 lakh crores during the two decades from 2011 to 2031 according to the Report of the High Powered Expert Committee constituted by the Ministry of Urban development, Government of India. This amount excludes the cost of land acquisition for development, inflation and any time and cost overruns of projects. In contrast, total revenues of urban local bodies (ULBs, also referred to as municipalities) in India may not exceed Rs 100,000-Rs 150,000 crores per annum. Of this, only a modest percentage would be available for financing infrastructure, after accounting for establishment and administrative expenses. Clearly, raising the finances for building infrastructure in India’s cities and towns is a significant challenge confronting us today. It is widely acknowledged that while the Central and State Governments can augment and catalyse projects and reforms, ULBs would need to eventually but soon enough become financially self-sufficient. The Centre and the States have several priorities of which urban is one and there are close to 8,000 cities and towns in India according to Census 2011. Even with the current emphasis on urban development, the flagship central government programme for urban renewal, the Atal Mission for Rejuvenation and Urban Transformation (AMRUT) covers only 500 cities in the country. The Scheme on an average allocates Rs 20 crore per city per annum (Rs 50,000 crores for 500 cities over five years).
The Smart Cities Mission allocates Rs 96 crore per city per annum (Rs 48,000 crores for 100 cities over five years. Notwithstanding the positive move of the 14th Finance Commission and the Central Government to devolve more funds to States, funds from the centre and states for urban infrastructure would not be unlimited or adequate. ULBs would therefore need to explore new ways of augmenting their financial resources. Municipal Bonds have been successfully exploited by several countries to fund their municipal infrastructure needs. India’s cities need to pay closer attention to this opportunity.
The recent SEBI regulations indeed offer such an opportunity. The central government has in the past tried to incentivise municipal bonds through tax-exemptions and by creating a pooled finance scheme.
SEBI (Issue and Listing of Debt Securities by Municipality) Regulations 2015
A. Scope
These regulations cover public issue of municipal bonds and the listing of municipal bonds on stock exchanges.
B. Eligibility
Eligible municipalities shall
lHave powers to issue municipal bonds under respective municipalities act.
lPrepare accounts in accordance with National Municipal Accounts Manual (NMAM) for minimum of three preceding financial years.
lNot have negative Net Worth in any of the preceding three financial years.
lNot have defaulted in repayment of bonds or loans during the last 365 days (where default means principal and/or interest remain overdue for > 90 days).
C. Terms and Conditions for Public Issue
The following terms and conditions shall apply to the issuance of municipal bonds
1. Nature of instrument
A public issue of municipal bonds shall only be of Revenue Bonds.
There are broadly two types of Municipal Bonds: Revenue Bonds and General Obligation Bonds. Revenue bonds are serviced (i.e. interest and principal payments are made) through revenue from specific projects of a municipality whereas General Obligation bonds are not serviced through revenues from specific projects but through the municipality’s overall revenue base (i.e. through fungible sources of revenues). In the case of private placement, either General Obligation bonds or Revenue bonds can be issued.
2. Credit Rating
Minimum investment grade rating to be obtained from a recognised credit rating agency.
3. Tenor
Minimum tenor of three years and maximum tenor of thirty years.
| 22 | The Administrator 56 (2) Srikanth Viswanathan | 23 |

4. Agreements and approvals from Stock exchanges and depositories
lApplication for listing made to stock exchange
lIn-principle approval obtained and
lArrangement with depository for dematerialised (referred to as “demat”)
holding of the bonds
5. Others
lMerchant banker(s) to be appointed
lSeparate escrow account to be created for servicing the bond
lMonitoring agency to be appointed to monitor revenues in the escrow
account
l100% asset cover sufficient to meet principal amount to be maintained at all
times
lBonds shall either be secure by a charge on the assets of the municipality
having sufficient value to repay outstanding amounts, or be backed by a
Central or State Government guarantee or shall have a structured payment
mechanism whereby dues are serviced in advance of due dates
6. Disclosures
Several organisational, operational and financial disclosures have been mandated
in Schedules I and V of the regulation and in Regulation 13-Utilisation of Issue
proceeds.
Additional provisions are contained in the regulations in respect of private
placements and in case of issuances by Corporate Municipal Entities (CME),
which are companies held by municipalities (i.e. CMEs are subsidiaries of
municipalities).
Guidelines for tax-exemption
The Government of India issued guidelines for issue of tax-free municipal bonds in
2001. The guidelines inter alia stipulate that only bonds carrying interest rate upto
8 % per annum shall be eligible for tax exemption. They further limit the maximum
amount of such bonds to lower of 50% of project cost or Rs 300 crores. The
guidelines require the debt equity ratio of the project to be no more than 3:1.
Despite these guidelines, only Rs 680 crores of tax-free municipal bonds has been
issued (in comparison taxable bonds amounting to Rs 445 crores have been issued).
Pooled Finance scheme
In 2006, the Union Ministry of Urban Development rolled out a Pooled Finance
Development Scheme under which a State can designate an entity that will raise
funds for specific projects on behalf of ULBs. These securities were given tax-
exempt status. However only Rs 622 crores have been issued under this scheme.
The Union Government as part of Budget 2014-15 enhanced the budgetary
provision for the pooled municipal debt obligation facility from Rs 5.000 crores to
Rs 50,000 crores and also extended the facility upto 31 March 2019.
Challenges and Way Forward
As seen above, there has been little traction so far in exploiting municipal bonds as
a source for financing urban infrastructure. The general thrust on states and cities
to raise their own funds and the emphasis on Public Private Partnerships (PPP) in
the Smart Cities Mission offer enough incentive for cities to look at municipal
bonds as viable funding avenue. The SEBI regulations and the enhancement of
pooled municipal debt facility limit to Rs 50,000 crores in Budget 2014-15 and
extension of its term upto 2019, provide the right policy environment to catalyse
this. However, there are some key challenges that need to be addressed if
municipal bonds are to become transformative in their impact.
A. Financial self-sufficiency of ULBs
If Municipal Bonds have to emerge as a transformative tool of financing urban
infrastructure, the Central and State Governments need to work together in a
time-bound manner to achieve reasonable and pre-determined levels of financial
self-sufficiency for ULBs. If ULBs do not become financially self-sufficient, they
would be incapable of accessing municipal bond markets effectively and
independently.
There are three principal components of self-sufficiency that need to be addressed.
1. Powers to raise revenues
Most ULBs in India do not have adequate powers under their respective
Municipality Acts to set and collect taxes or to levy user charges and fees. They also
lack the freedom to determine and collect varied sources of revenues. This has
resulted in a situation where they are unable to provide satisfactory service levels
with their current sources of revenues. What can break this regressive status quo is
for cities to be given significantly greater powers over their own finances in a
phased manner.
2. Power to borrow
Out of 21 cities covered under the Annual Survey of India’s City-Systems (ASICS)
2014, an urban governance benchmarking study carried out by Janaagraha, only
four were covered by Comprehensive Debt Limitation Policies (CDLP) under their
Municipality Acts. The CDLP gives ULBs powers to borrow monies within limits
determined under the act/rules by the State Governments.
Type Amt in Rs Cr
Taxable bonds 445 .0
Tax -free bonds 679.5
Pooled finance 622.1
Total 1,746.6
| 24 | The Administrator 56 (2) Srikanth Viswanathan | 25 |

3. Measurement of self-sufficiency
Even where ULBs have powers to raise revenues, ULBs are guilty of one or more of three omissions. 1) They do not utilise their powers and raise revenues 2) They raise revenue, but their assessments are grossly incomplete e.g. where only 60% of assessable properties may be covered under property tax and 3) Very poor collections. Therefore, greater degrees of financial powers should be accompanied by regular monitoring of the degree of financial self-sufficiency achieved by ULBs, with incentives and disincentives attached to the same. Such periodic measurement needs to be based on pre-determined and phased targets.
B. Professional Financial Management
ULBs in India are in crying need of sound professional financial management. Financial Management does not comprise only financial self-sufficiency referred to in A above. For ULBs to become capable of handling instruments such as municipal bonds, they need to have professional finance staff managing the finance function, integrated financial management systems, effective balance sheet and liquidity management and circumscribing all of these, a culture of decision making that is based on data and metrics. Currently, staffing of accounts department of ULBs is woefully below par both in terms of numbers and quality of workforce. In addition, as highlighted by successive Finance Commissions
thincluding the 14 FC, quality of financial information available at ULBs too is a major area of concern. High quality data and disclosures of the same are a cornerstone of modern capital markets. Further, most ULBs only review budgets versus actual and do not use their audited financial statements (and related monthly MIS reports) for balance sheet and cash flow management, resulting in significant inefficiencies (e.g. not having a list of assets exposes a ULB to tangible losses, impedes measurement of return on assets etc.). ULBs need to produce audited financial statements within a reasonable timeframe of the close of the financial year and preferably have them audited by independent Chartered Accountants. Lastly, MIS/Dashboard based review and decision-making processes need to be mandated in ULBs.
C. Brand Positioning and Deepening of Municipal Bond market
Urban infrastructure is a pressing national priority. The current approach to municipal bonds however, is inadequate to kick-start the market. Municipal Bonds need to be made a popular investment option by:
lrunning a large-scale, nation-wide campaign in cities and towns on investor awareness appealing to the citizen-side of investors, to make a strong case for participation in municipal debt market. In the US over 50% of municipal bonds are held by individual investors.
lraising the tax-free interest cap from 8%
lencouraging and incentivising pension funds, insurance funds, philanthropic trusts and foundations etc. to contribute to municipal bonds as part of their mandate.
ladvertising and widely disseminating the public good that each municipal bond issuance aims to achieve, in terms of number of citizens benefited, new infrastructure created, public spaces rejuvenated etc.
lencouraging ULBs to access municipal bond markets on the strength of their own balance sheets, rather than creating Special Purpose Vehicles (SPVs) exclusively for that purpose.
Conclusion
Municipal bonds offer a unique opportunity to effectively finance a significant proportion of India’s urban infrastructure needs, which may otherwise go unfinanced (i.e. will never be carried out). They bring multiple benefits of long-term financing, both individual and institutional participation as well as reducing the stress of infrastructure financing on the banking sector. The steps taken so far by the central government however are not adequate, as evidenced by the past track record. Greater delegation of financial powers to cities (ring fenced by suitable accountability mechanisms), mandating professional financial management in ULBs and undertaking a much broader awareness campaign on municipal bonds among both potential issuers and investors are three key factors that would influence the success of the municipal bond market in India.
Srikanth Vishwanathan is a coordinator of advocacy, research and capacity building at Janaagraha Centre for Citizenship and Democracy, Bengaluru. The author can be reached at [email protected]
| 26 | The Administrator 56 (2) Srikanth Viswanathan | 27 |
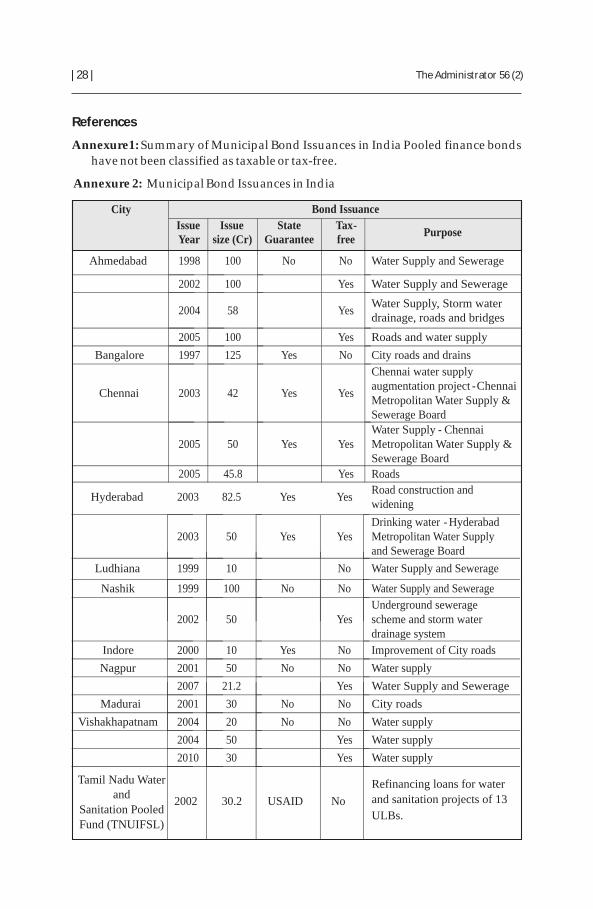
City Bond Issuance
Issue Year
Issue size (Cr)
State Guarantee
Tax-free
Purpose
Ahmedabad 1998
100 No
No
Water Supply and Sewerage
2002
100
Yes
Water Supply and Sewerage
2004
58
Yes
Water Supply, Storm water drainage, roads and bridges
2005
100
Yes
Roads and water supply
Bangalore 1997
125
Yes
No
City roads and drains
Chennai 2003
42
Yes
Yes
Chennai water supply augmentation project -Chennai Metropolitan Water Supply & Sewerage Board
2005 50 Yes YesWater Supply - Chennai Metropolitan Water Supply & Sewerage Board
2005 45.8 Yes Roads
Tamil Nadu Water and
Sanitation Pooled
Fund (TNUIFSL)
2002 30.2 USAID No
Refinancing loans for water
and sanitation projects of 13
ULBs.
Hyderabad
2003
82.5
Yes
Yes
Road construction and widening
2003
50
Yes
Yes
Drinking water - Hyderabad Metropolitan Water Supply and Sewerage Board
Ludhiana
1999
10
No
Water Supply and Sewerage
Nashik
1999
100
No
No
Water Supply and Sewerage
2002
50
Yes
Underground sewerage scheme and storm water drainage system
Indore
2000
10
Yes
No
Improvement of City roads
Nagpur
2001
50
No
No
Water supply
2007
21.2
Yes
Water Supply and Sewerage
Madurai 2001 30 No No City roads
Vishakhapatnam 2004 20 No No Water supply
2004 50 Yes Water supply
2010 30 Yes Water supply
References
Annexure1: Summary of Municipal Bond Issuances in India Pooled finance bonds have not been classified as taxable or tax-free.
Annexure 2: Municipal Bond Issuances in India
1The funds raised by KWSPF on behalf of 8 ULBs on the periphery of Bangalore were meant to part finance the water supply
component of a greenfield project, Greater Bangalore Water Supply and Sanitation project (GBWASP).
Source: Janaagraha
2012 51 No
2013 51 No
Karnataka Water and Pooled Fund
Sanitation 1
2005
100
USAID
Yes
2010
300
Lending to ULBs through Directorate of Municipal Administration
Total 1,746 .59
2008 6.7 Yes
2010 83.19 Yes
Annexure 3: Credit Rating of select ULBs in India
Sl. City Corporate Credit Rating Year Source
1 Ahmedabad
AA-
AA (Is)
2014
2014
CRISIL
CARE
2
Bhopal
BBB- (ind)
2010
Fitch
3
Bhubaneswar
BBB+(Is)
2010
CARE
4
Chandigarh
A+
2010
ICRA
5
Chennai
BBB+
AA(so)
2012
2010
ICRA
CRISIL
6
Dehradun
BBB-
2008
CRISIL
7
Delhi
AA-(ind) 2011
Fitch 8
Jaipur
BBB+(ind)
2010
Fitch
9
Kanpur
BB+(Is)
2010
CARE
10
Kolkata A+ 2014 CRISIL
11
Lucknow
BB (Is)
2010
Care
12
Ludhiana BBB- 2010 ICRA
13
Mumbai
AA (ind)
2010
Fitch
14
Pune
AA(ind)
2010
Fitch
15
Raipur
BBB(Is)
2010
CARE
16 Ranchi BB- 2008 CRISIL
17 Surat AA- 2008 CRISIL
18 Thiruvananthapuram BBB- 2011 ICRA
All of the above are ratings for ULBs covered under ASICS 2014. All ratings of CRISIL are as of May 2015. Fitch ratings for Mumbai, Pune, Jaipur and Delhi have since been withdrawn.
Source: Janaagraha
| 28 | The Administrator 56 (2) Srikanth Viswanathan | 29 |

Abstract
India's GDP has grown at a healthy rate for last decade which along with pride brings a
challenging problem of increasing traffic chaos. Several factors such as growth in urban
population, urban sprawl, heavy investment in motor vehicle centric infrastructure, etc.,
have led to a congestion nightmare in urban cities of India. In absence of concrete
planning and implementation this trend is headed towards urban traffic grid lock,
appalling traffic fatality statistics and degrading environmental. This paper proposes
three broad solutions to break this negative spiral of urban traffic situation, namely, i)
data driven urban transport management, ii) transport supply management and iii)
transportation demand management.
India’s GDP grew at a healthy rate of 5.6% in 2014 and is projected to grow at a rate
of 6.5% to 7.0% in the near future. These statistics, along with a sense of pride, bring
a problem of traffic management as faced by any rapidly growing economy. The
problem is compounded due to a growing urban population at the rate of 2.0%.
The increase in population leads to more demand on public resources and the
resulting increase in GDP can lead to wasteful practices unless curbed by policy,
education and enforcement.
In 2008, cities accounted for 58% of India’s GDP and housed 28% of India’s total
population. This trend is projected to increase to 70% of GDP and 40% of
population by 2030. Urban areas have become a driving force of national growth as
well as the epicenter of population expansion. The exponential urban growth
results in overwhelming demands on the urban transportation networks. In a do-
nothing scenario, grim pictures of urban transport are painted by several national
and international reports.
lPer-capita trip rates are estimated to increase from 0.8-1.5 in 2007 to 1-2 in 2030
for cities. This implies 25 to 33% increase in number of trips made by each
individual of the household leading to more congestion.
lDeclining public transport share from 5 to 46% in 2007 and 2 to 26% in 2030
would imply that most of the increase in trips would be made by personal
vehicles.
Steps Improving Transport within Urban India: Challenges, Strategies and Critical First
Anuj SharmaAssociate Professor, Iowa State University, USA.
lThese trips would be made at excruciatingly slow speeds. It is projected that
average journey speeds on major corridors will fall from 17 to 26 kmph and 6 to
8 kmph. As a reference, average walking speed is around 5 kmph and usual
biking speeds are 19 kmph.
lThe Energy and Resources Institute (TERI) forecasts that India’s commercial
energy demand will increase seven times by the year 2030.
lIn 2013, the traffic crash mortality in India was 11.0 per lakh population,
compared to 2.9 in UK, 5.0 in China and 4.6 in Denmark.
lNearly 100 out of 285 million urban residents live in urban slums. They are
usually dependent on cycling or walking for their daily trips. Nearly 50% of
this sector spends 20 to 30 percent of their salaries on public transport. Any
policies resulting in moving slums away from the income sources or any
increase in public transportation fares will result in pushing nearly 30% of this
urban population into a vicious poverty spiral.
The above discussion makes a strong case that the do-nothing approach would
result in grave crisis and there is a need to implement strategies to buttress the
failing urban transport system. This article lays out a suite of solutions to gradually
improve urban transport in India. The solutions presented in this article are
classified into three major categories: i) data driven urban transport management
solutions, ii) transport supply management solutions and iii) transport demand
management solutions.
Data Driven Urban Transport Management
Any advancement made by science will not be replicable or void of failure unless
the process is documented and the impacts measured and quantified. Data driven
decision making is necessary for long term policy decisions, short term incident
management decisions, real-time traffic control decisions, and well-informed
route choice decisions. To illustrate the importance of data feedback, try balancing
a stick on your fingers, now try it again with your eyes closed. It is difficult to
maintain the balance with open eyes but with closed eyes, when the data feedback
is removed, it is impossible. In a similar sense, data driven techniques are needed
to identify the problem, design tailored solutions, and evaluate their impacts and
effectiveness.
It is fairly evident, that different cities will have different critical transport
problems thus requiring a variety of solutions. A simple data driven exploratory
analysis can easily tease out some of these phenomenon. More rigorous data
driven analytics can be used to perform statistical hypothesis testing and fine
tuning of specific solutions. Figure 1 presents a picture of diversity among 30
Indian cities. It can be seen that peak hour speed ranges from 16 kmph to 30 kmph
and the number of fatalities per lakh of population range from 5 to 70. An
interesting fact to be noted is that safety (as measured by fatality/lakh) is not
highly correlated with congestion (as measured by peak hour speed). The cities of
Anuj Sharma | 31 |
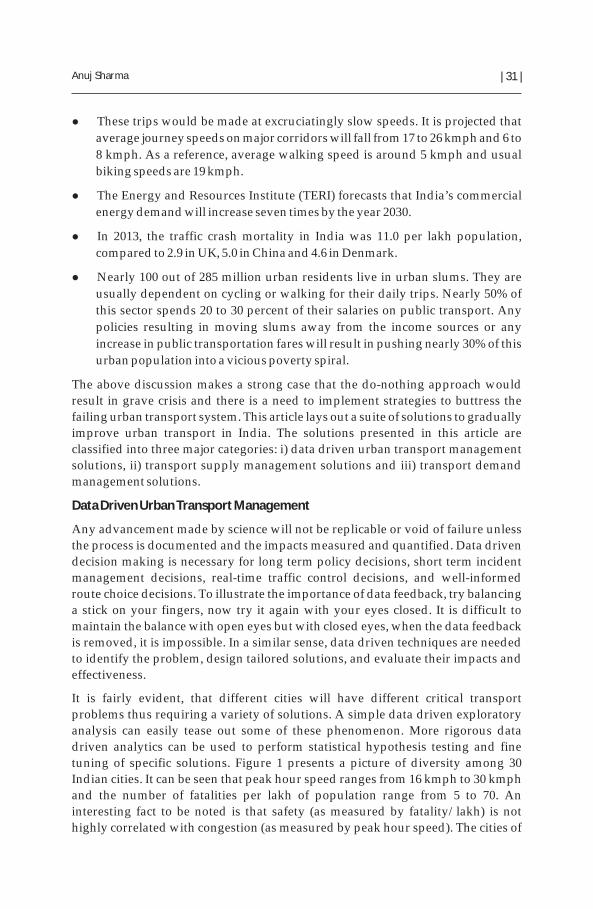
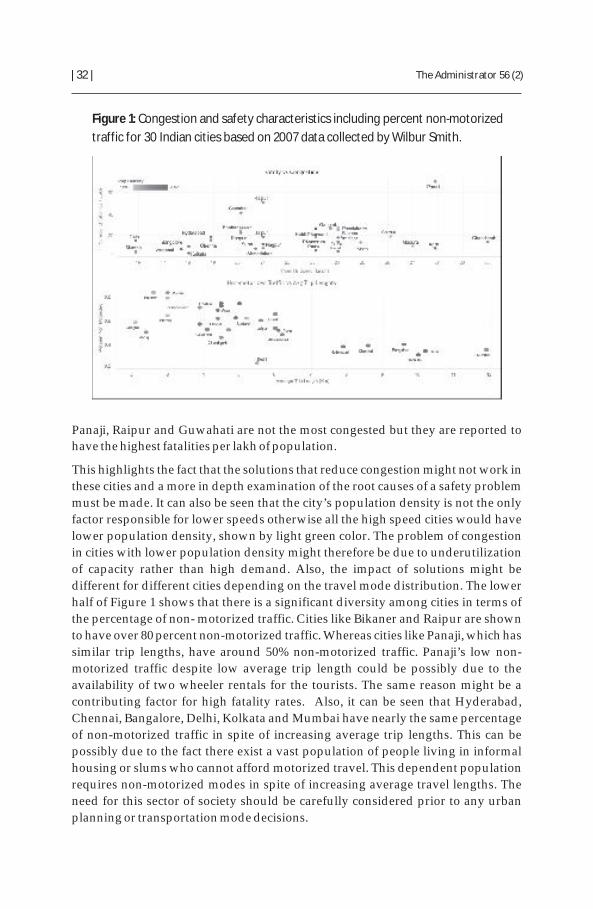
Panaji, Raipur and Guwahati are not the most congested but they are reported to
have the highest fatalities per lakh of population.
This highlights the fact that the solutions that reduce congestion might not work in
these cities and a more in depth examination of the root causes of a safety problem
must be made. It can also be seen that the city’s population density is not the only
factor responsible for lower speeds otherwise all the high speed cities would have
lower population density, shown by light green color. The problem of congestion
in cities with lower population density might therefore be due to underutilization
of capacity rather than high demand. Also, the impact of solutions might be
different for different cities depending on the travel mode distribution. The lower
half of Figure 1 shows that there is a significant diversity among cities in terms of
the percentage of non- motorized traffic. Cities like Bikaner and Raipur are shown
to have over 80 percent non-motorized traffic. Whereas cities like Panaji, which has
similar trip lengths, have around 50% non-motorized traffic. Panaji’s low non-
motorized traffic despite low average trip length could be possibly due to the
availability of two wheeler rentals for the tourists. The same reason might be a
contributing factor for high fatality rates. Also, it can be seen that Hyderabad,
Chennai, Bangalore, Delhi, Kolkata and Mumbai have nearly the same percentage
of non-motorized traffic in spite of increasing average trip lengths. This can be
possibly due to the fact there exist a vast population of people living in informal
housing or slums who cannot afford motorized travel. This dependent population
requires non-motorized modes in spite of increasing average travel lengths. The
need for this sector of society should be carefully considered prior to any urban
planning or transportation mode decisions.
Figure 1: Congestion and safety characteristics including percent non-motorized
traffic for 30 Indian cities based on 2007 data collected by Wilbur Smith.
| 32 | The Administrator 56 (2)
Data driven decision making requires three main ingredients as noted below.
Data Sources
In the past, the most common hurdle for not applying data driven methods was lack of transportation sensors to measure traffic streams. The amount of investment needed to achieve Intelligent Transportations Systems comparable to western nations is exorbitant. Recent development in big data applications has provided a strategy to overcome these hurdles. There are several examples of using big data tools to monitor urban transport through non-traditional sources such as twitter feeds, text logs, community sensing, census data, cell phone data augmented by infrastructure mounted sensor, etc. As an example, data from taxis are being effectively used in Singapore for real-time estimation traffic demand and travel times. Figure 2 shows an example visualization of tweets generated with the word “jam” within India and Delhi using 2 years of tweet history. A quick exploratory analysis of tweets can show the places with higher usage of the word “jam” relative to other tweets. This type of data can be used to identify congestion trends (where and when) at a city level of analysis. Using non-traditional data, at a big data platform, has revolutionized the realm of data driven decision making by providing the ability to curate previously unused data sets. This leads to a reduced dependence on traditional infrastructure mounted sensors. Planned investments can be made in locating the traditional sensor to further augment the quality of data obtained from non-traditional sources. These data sets have been shown to be very effective in bottle neck location, generation of origin destination matrices, traffic incident management, and other intelligent transportation system solutions. In addition to conducting data analytics, a genuine effort should be made to produce well specified and standardized data sets and to share these data sets in open data initiatives, such as data.gov. These activities will allow crowd based knowledge extraction from the data leading to reduction in efforts and resources required by a single agency. Existing data definition and semantic standards should be explored prior to creating any proprietary definitions. Standardized datasets will provide uniformity across agencies and would help in usability of data by multiple agencies.
Along with long term planning and policy decisions, data streams can be used for real-time traffic control, enhanced incident management, and in providing optimal route guidance. Real-time optimal control using sensor streams can significantly increase the efficiency of the existing infrastructure and enhance safety.
Anuj Sharma | 33 |

(a) Twitter heat map for relative usage of word jam in India
(b) Twitter heat map for relative usage of word jam in Delhi
Figure 2: Visualization of Twitter Data with word traffic in vicinity of India using MapD.
| 34 | The Administrator 56 (2)
Generate Performance Measures and Targets
Transportation decision makers need quantitative/qualitative performance measures to evaluate the impact of a given investment in their community. These standardized performance measures should be reported for every project. This will improve the transparency of an agency’s decision making, their
Anuj Sharma | 35 |
accountability, and most importantly their ability to improve decision making over time. The performance measures should be defined for each of the key performance areas, such as access and equality, capacity, cost-effectiveness, efficiency, environment, safety, etc. These performance measures can then be tied to the project level, departmental level and agency level goals. The performance targets can be defined based on self-evaluations and exploration of performances achieved in peer cities. Standardization of performance measures is important to create a uniform playing field across cities, which is required for effective comparisons among peer agencies. A top down approach is needed for achieving standardization in performance measures used by different agencies. As an example, the recent US transportation bill Moving Ahead for Progress in the 21st Century (MAP 21), mandates the development of performance measures and targets for transportation performance management. This bill led to the formation of a nationwide American Association of State Highway and Transportation Officials (AASHTO) standing committee on performance measurement. The committee generated a final report on SCOPM Task Force Findings on MAP-21 Performance Measure Target-Setting. The document defines standardized performance measures for specific performance areas namely safety, pavement conditions, bridges, freight, system performance and congestion mitigation and air quality. A similar approach is needed in India to standardize performance measures and facilitate data driven decision making for investments.
Well - defined performance objectives and performance functions
A decision support framework requires well defined performance objectives that explicitly consider the interests of multiple stake-holders. As an example, the transportation initiative of removing auto-rickshaw’s from a certain stretch of road might have a different impact on different stake holders, such as business owners, auto-rickshaw drivers, auto-rickshaw users, car users etc. Consequently, there is a need to perform a decision analysis involving multiple stakeholders for a multi-criteria decision problem. Trade-offs such as travel time savings versus increases in fares need to be determined using performance functions. These performance functions need to be calibrated to the local conditions. Development of performance functions for different transportation initiatives requires consistent national data sources and statistically sound analytics. If standardized performance measures are collected for every new transportation initiative, a rich history of transportation initiative impacts can be assembled over time. This historical data can then be processed to obtain performance functions to help drive investment.
In essence, data driven transportation management requires both traditional and
non-traditional sources of data which are based on standardized measures. This
information will facilitate solutions that are predicted to alleviate the problem,
assess the impact of chosen solution by quantifying the impacts, and develop
performance functions that tie a given solution to the achieved improvements. A
centralized urban transport database would help significantly in achieving data
driven transport decision making.
Supply Management: Shift towards sustainable modes of transportation
High per-capita income increases the purchasing power of households and

| 36 | The Administrator 56 (2)
generally leads to a choice of faster and more convenient modes of transportation.
In absence of a functional public transport network, cars and two-wheelers become
the preferred choice. In some cultures, household vehicles are deemed as status
symbols which results in a race to buy bigger and bigger vehicles as disposable
income increases. This trend is evident in the increasing number of SUVs in Indian
cities. The share of personal vehicles has gone up by 12% per annum in the last two
decades. Between 31st March 2005 and 31st March 2006, 300,000 motor vehicles
were added in Delhi. This is the equivalent of adding 314 cars and 460 two-
wheelers per day for a year.
Figure 3: Proportion of space occupied by people and vehicle carrying those people.
There are several problems associated with increased reliance on personal
motorized vehicles. Cars occupy more space, as compared to other common
modes of transportation, to transport the same number of individuals. As is clear
from Figure 3, the road area occupied by cars is much more than that of a bus or
cycle when transporting the same amount of individuals. Thus more road space is
needed to transport 60 passengers via cars as compared to buses or cycles. Also,
cars produce nearly 6 times more greenhouse gases for each passenger kilometer
compared to a bus running on diesel. Despite the facts supporting the case for
public transit and non-motorized traffic, a huge proportion of transportation
investment have been made to expand the road space for private vehicles, such as
construction of interchanges, and increasing the number of lanes. There is an
imminent need for a multi-pronged approach to shift the transportation mode
choice from personal vehicles to public mass transit, and non-motorized modes.
Any infrastructure initiatives for promoting public transport should involve a careful planning process for the last mile of connectivity. Technology driven initiatives should be pursued to provide a seamless travel experience for an individual from origin to destination of the trip. The intermodal connectivity should be seamless from route planning tools to the purchase mechanism and real time tracking of trips. Innovative business models, such as Uber, have proven that
out-of-the-box thinking and technological innovation can enhance the user travel experience. Successful integration of an intermediate para-transit mode in social mobile applications has provided a platform to improve the last mile connectivity. Even while choosing public mass transit options, there is a need for careful economic planning. Bus rapid transit systems are relatively cheaper than rail/subway systems and should be given due consideration for small and medium sized cities. The investment schemes should not end at providing money for purchase of buses but a corridor level plan should be prepared that evaluates, traffic signal timings to provide bus priority, providing bus priority lanes, automated bus location systems to support real-time information in terms of optimal scheduling and headway maintenance. Recent issues including security breaches, careless driving, and overall poorly maintained vehicles has shaken the confidence of general public towards bus transit systems. There is a need to change the image of the bus systems by increasing the professionalism of the sector, maintaining good coaches, beefing up security, and earning an image of reliability and safety. Indore’s bus rapid transit system has been a recent success story for properly planned and managed transit system. This real life example shows that an administrator can play a significant role in improving urban transport systems of a city.
A significant portion of any urban population will still walk or bike to their destinations. This needs to be promoted at all levels of society. Two common deterrents of non-motorized travel are safety and security of the individuals. Both of which are critical and depend on providing connected bikeways and walkways. The security can be enhanced by providing appropriate street lighting, regular maintenance of the infrastructure, installing CCTV cameras, mixed use development, increasing enforcement, and using other technological initiatives such as web apps for finding walk-buddies. The City of Portland, Oregon has been very successful in promoting the biking culture within the city. Some of the successful strategies used by the city to promote bike culture are: i) a comprehensive bike plan is a part of their transportation planning document. The bike plan aims at linking origins and destinations using a systematic network of biking routes instead of a piece meal approach, ii) Bike Bill, passed by Oregon in the late 1970s, requires that in any given fiscal year a minimum of 1% of state highway fund received by the department, a city or county shall be expended to provide bikeway and walk ways, iii) unique traffic signal operation strategies are implemented to promote the usage of bikes on certain network of roads, iv) Nearly all offices provide bike parking and shower facilities, and iv) there are several events which are organized around bikers, thus promoting biking as a life style choice rather than necessity oriented choice. Similar culture needs to be developed in cities to promote the usage of bikes. Footpaths should not be just designed as a purpose to travel but instead designed street spaces where a person can walk, jog, sit and enjoy. This concept of streets as places rather than routes has been gaining momentum in several regions. Cities with a significant number of tourists, and smaller trip lengths, can utilize walking markets, river walks, and bike share programs to promote non-motorized traffic. Cities can also promote biking and walking by programs such as car free days for certain roads.
Anuj Sharma | 37 |

Professor Anuj Sharma is an associate professor of civil, construction and environmental engineering at the Iowa State University, USA. The author can be reached at [email protected]
The modal shift can also be promoted by adopting policies that deter personal vehicle usage. Cities like Singapore and London have adopted congestion pricing to reduce congestion in their downtown areas during peak periods of travel. Singapore also uses registration quotas where only a certain number of personal vehicles can be registered throughout the island. Higher parking fees, and higher fuel taxes can be levied to deter personal vehicle usage.
Demand management: mixed use planning and zoning regulations
Figure 4 compares the expanse of urban area for the city of Ahmedabad (Figure 4a) and the city of Bangalore (Figure 4b) from 1975 to 2010. The blue region in the left two images represents the expanse of urban areas for the given year. It is clear by looking at the two images that both the cities have expanded significantly since 1975. This problem of expansion of city boundaries is also referred to as urban sprawl. The urban sprawl is usually triggered when the house prices within the city become prohibitively expensive and individuals are willing to travel more distances to commute to work and live in affordable houses. As expected, urban sprawl leads to an increase in average commute distances which in turn necessitates the use of motorized vehicles. Urban sprawl takes a heavier hit on low income populations as they are forced to move to the outer fringes of the city which places them further away from their jobs. Transportation costs represent a significant amount of their incomes thus making them cut corners on other basic needs.
| 38 | The Administrator 56 (2)
Integrated land use, transport, and transit oriented planning is needed to reduce the average travel distances and promote travel by transit, if and when needed. The mixed land use that accommodates more than one land use functions such as residential, commercial, recreation etc., should be promoted. This creates a sustainable community where individuals are able to walk to their jobs and fulfill other basic needs. Careful consideration should be made such that lower income housing co-exists within a urban growth plan instead of being pushed further out to the city fringes. A good example of temporal mixing of the same space for different activities is how Sarafa gali, in Nagpur, is being used as a jeweler market during day time and is then converted to a place for eating and social gathering during the evening. In addition to planning solutions, other demand mitigation strategies such as office flexi-times, car pool, work from home etc. should be promoted for travel demand mitigation.
Conclusion
This article states major concerns faced by urban transport in India. There is a drop in commuting speeds, increase in the number of fatalities, shift toward personalized vehicles and a growing problem of urban sprawl. These problems if left unchecked can result in a complete grid lock and have already become a serious environmental concern for cities. This article proposes three major strategies to restrain these impending urban transport problems. The first strategy is to use a data driven decision making process for long term, near real-term and real term transportation decisions. The data can be collected from non-traditional sources which take advantage of big data platforms and provide the ability to arrive at quantified insights. The use of non-traditional data sources can significantly reduce the investment needed for dedicated sensor networks. The second strategy is to aggressively promote and shift the mode of travel from private to public transit and non-motorized modes. Finally, the article proposes integrated land use planning for mixed use and transit oriented development for demand mitigation.
In conclusion, it should be noted that a successful strategy will require an administrative champion who can align the political will, communicate and arrange the investment needs, and oversee the successful execution and operation of these critical initiatives.
Anuj Sharma | 39 |
Figure 4: Infrared satellite imagery comparing the urban land mass for Ahmedabad and Bangalore from 1975 to 2010.
(b) City of Bangalore
(a) City of Ahmedabad

Abstract
The paper examines the prospects and challenges of having an International Financial
Centre in Mumbai. The first half of the paper introduces International Financial Services
and International Financial Centre (IFC) and features of IFC. It elaborates on the
advantages of an IFC as to how it adds to the national prestige, employment generation,
increase in FDI, improvement in GDP mix and foreign mix. Thereafter, the paper explores
the advantages of having Mumbai as an IFC and the challenges of having Mumbai as IFC.
After a broad analysis of the prospects and challenges, the author suggests viable
recommendations as to how to make Mumbai as an IFC. The paper concludes suggesting
ways to make Mumbai as the IFC instead of Gujarat, highlighting the need for concerted
and coordinated efforts of the government, sectoral regulators, private entrepreneurs
and the citizens to remove obstacles and harness Mumbai in a manner that it can be
converted into a nationally and internationally desirable destination for business, trade
and investment.
Finance, due to its very character, is mobile and has always been ‘international’.
Ancient civilizations have interacted through trade routes and have exchanged
currency, gold and other precious metals freely across borders. However, this free
trade and financial mobility was curtailed remarkably during the Bretton Woods
regime, which imposed capital controls on war-ravaged, capital starved
economies. Since 1970s capital controls were reduced across countries and with
fall of communism in most countries, national economies started integrating with
global economy. With this, finance again resumed its natural character and
became international with emergence of international financial centers (IFC) at
New York, London, Hong Kong etc. India has also been projecting Mumbai as an
IFC since the new economic reforms. In this direction, the government of India set
up a high powered expert committee under the chairmanship of Percy Mistry to
recommend measures for making Mumbai an IFC. The committee submitted its
report in the year 2007. Mumbai having an undisputed stature of India’s economic,
financial, trade, commercial and entertainment capital besides being the most
cosmopolitan city of the country was rightly chosen for being an IFC however; the
recent proposal of shifting IFC from Mumbai to Gujarat Industrial and Finance Tec
(GIFT) city in Gujarat has generated lots of interest in the topic.
Prospects and Challenges Mumbai: An International Financial Centre
Nidhi Choudhari, IAS
References
http://databank.worldbank.org/data/views/reports/tableview.aspx (Accessed 5/11/2015)
McKinsey Global Institute, 2010, India’s urban awakening; Building inclusive cities, sustaining economic growth.
National Transport Development Policy Committee (NTDPC) Final Report. 2012
Traffic and Transportation Policies and strategies for urban areas, Wilbur Smith Associates, 2008.
Road Accidents in India, 2013, http://morth.nic.in/ writereaddata/ mainlinkFile/ File1465.pdf (accessed 5/12/2015)
http://lsecities.net/media/objects/articles/urban-transport-in-indian-cities/en-gb/ (accessed 5/12/2015)
http://www.data.gov/local/open-data-census/ (accessed 5/12/2015)
Kristian Kloeckl, Oliver Senn & Carlo Ratti, “Enabling the Real-time City: Live Singapore! Journal of Urban Technology, Volume 19, Issue 2, 2012
SCOPM Task Force Findings on MAP-21 Performance Measure Target-Setting
Re-visioning Indian Cities, The urban renewal mission, K.C. Sivaramakrishnan
Government of India. 2009. ‘Road Transport Year Book (2006-2007)’. Ministry of Shipping, Road Transport and Highways, New Delhi.
http://blog.cellbikes.com.au/2012/09/australia-re-creates-world-famous-transport-photo/(accessed 5/12/2015)
http://en.wikipedia.org/wiki/Indore_BRTS (accessed 5/12/2015)
NTDPC on Urban Transport-Final Report. National Transport Development Policy Committee (NTDPC). 2012
http://changematters.esri.com/compare
| 40 | The Administrator 56 (2)

lIT Infrastructure: An IFC has good quality of IT and telecom infrastructure to
ensure speedy transactions across parties. Financial architecture of an IFC
requires good quality IT and telecom infrastructure.
lPhysical Infrastructure: An IFC also has world class physical infrastructure in
terms of good quality of roads, transport services, housing and commercial
accommodation etc.
Advantages of an IFC
The IFC status brings about international distinction, increased employment
opportunities and transforms the economy into a high value, service based
economy. The key advantages of an IFC are as following:
lNational Prestige: Any country with an IFC gets international standing in the
world of finance. It is because of this reason that most countries vie for
upgrading their financial capitals to the status of IFC to get a larger share of
global financial services.
lEmployment Generation: An IFC results in expansion of financial services
which creates employment opportunities for skilled and semi-skilled
personnel in financial sector. Being highly technology driven, finance has
potential to create employment in associated sectors like software and
telecommunications. Additionally, having an IFC enables sectors such as
tourism; transport etc. to get a boost, by giving international exposure to other
parts of the country.
lIncreased FDI: With IFC, a country receives increased FDI inflows as all
transactions in the IFC take place in international currencies. In addition, due
to international prominence the global investor confidence in the country
having IFC also increases resulting into higher FDI for the country.
lCompetition for Domestic Institutions: An IFC imparts valuable international
experience to local banks and financial institutions on account of its proximity
to world class institutions. It increases depth and scope of financial services
available to importers, exporters, industry and investors.
lImproved GDP Mix: Financial services do not have negative externalities on
environment and at the same time adds immensely to GDP. Therefore, having
an IFC expands high value tertiary sector in a country and provides better
GDP mix.
lForeign Exchange: Any IFC requires intellectual capital generation in financial
sector and export of value added financial services brings in significant
foreign exchange in much the same manner as ITeS (IT enabled Services)
contributes to the economy.
Mumbai as an IFC
Mumbai has been de-facto financial capital of India since independence and is
often termed as ‘Maximum City’ for being the city of maximum opportunities and
What is an IFC?
A cross-border market for international financial services (IFS) has existed since
millennia but it has been transformed in the 19th and 20th centuries and grown
quite differently and more dramatically since 1980. It has also become extremely competitive, with buyers and sellers around the world now having a choice of procuring IFS
1from competing international financial centres (IFCs) . An international financial
centre (IFC) is a place where financial institutions from many different
jurisdictions come together to carry out financial intermediation of an
international dimension. Any financial centre that caters to clients from all over the
world in the provision of the widest possible array of international financial
services (IFS) can be termed as an IFC. Examples include London, New York,
Singapore etc.
Features of an IFC
An IFC offers a variety of financial services on an international scale. An IFC is
different from any other financial centre in terms of various factors that are integral
in providing necessary infrastructure for international financial services. These
factors include:
lDemand for Financial Services: There should be a strong intrinsic demand for
financial services in the domestic country. Centres which do not have this
intrinsic demand are not able to upscale to the level of IFC like happened in
case of Frankfurt.
lSophisticated Financial Markets: Any IFC needs to provide deep, liquid and
sophisticated capital, money and debt market which offer wide range of
products and services like venture capital, wealth management services, risk
management etc. It should provide cheapest sources of capital for industries
and also provide best risk management practices.
lEfficient Regulatory Regime: A centre from which international financial
business can be conducted profitably, easily and efficiently requires efficient
regulatory regime.
lFinancial Architecture: An IFC should provide all facets of financial services such
as senior traders, regional headquarters, treasury operations, data processing,
support functions and call centers etc at one place.
lSkilled and Innovative Workforce: Any IFC has skilled management and
intellectual workforce in the areas of business, finance, law and accounting, to
provide multi-disciplined teams that facilitate large cross border transactions
in the shortest possible time frame. A centre that can add significant value to
financial services provided from it, through a workforce that can respond
promptly and in an innovative manner.
lCompetitive Tax Regime: An IFC offers competitive tax regime that attracts
foreign investment and offshore business flow. It is tax competitive but not a
tax haven which are attracting wrath from global regulators.
| 42 | The Administrator 56 (2) Nidhi Choudhari | 43 |

lCosmopolitan Way of Life: Mumbai's cosmopolitan life style, attract migrants
from all over India. In this respect, what Mumbai can offer to global investors
cannot be found in any other city in the country. Despite cultural suffocation
on account of some regional parties, Mumbai is largely a culturally welcoming
city and GIFT may provide world-class infrastructure but cannot imitate
Mumbai’s way of life.
lWealth Centre: Mumbai is the wealthiest city in the country and has been
ranked third in its categories as an “Alpha world city” in the year 2009 by the
Globalization and World Cities Study Group (GaWC). Mumbai has also been thranked 7 in the list of “Top Ten Cities for Billionaires” by Forbes magazine
(April 2008), and first in terms of those billionaires' average wealth.
lIndustrial Hub: The key sectors contributing to the city's economy are finance,
gems & jewellery, leather processing, IT and ITES, textiles, and entertainment.
India's numerous conglomerates like Larsen and Toubro, Tata, Godrej and
Reliance and five of the Fortune-500 companies are based in Mumbai. Any IFC
can succeed only when there is domestic demand for financial services and
here, not city in India can beat Mumbai.
lCommercial Capital: It is one of the world's top ten centres of commerce in
terms of global financial flow, generating 6.16% of India’s GDP and
accounting for 25% of industrial output, and 70% of capital transactions to
India's economy. This is facilitated by the presence of RBI, SEBI, BSE, NSE etc.
lEconomic Potential: Mumbai is the prime economic engine of India and
contributes to one-fifth of GDP of the country. The budget of MCGM is larger
than 9 state government budgets. The Mumbai port along with JNPT
contributes over 70% of maritime trade. The city pays one-third of the income-
tax of the nation, contributes 10% of factory employment, 25% of industrial
output, 60% of customs duty collections, 20% of central excise tax collections,
40% of India's foreign trade and Rs. 4000 crore in corporate taxes. With this
economic potential, Mumbai deserves the stature of an IFC.
lStrong Money & Forex Market: Mumbai's presence is overwhelming both in
money market and the foreign exchange market transactions. Its share in the
forex market is as high as four-fifths of the total turnover.
lVibrant Secondary Market: Mumbai, being a home to the NSE and BSE,
dominates the turnover and total market capitalization of the Indian stock
market with nearly 80% of registered MFs, nearly all FII investments, and over
90% of merchant banking transactions which make Mumbai a favorable place
for IFC.
lEntertainment Capital: Mumbai is the celluloid capital of India with Hindi and
Marathi film and television industry. Every year, it produces more than 1000
movies which is a major source of revenues for the city. Bollywood gives
Mumbai an international standing as the potpourri of cultures and glamour
which can help in its status as IFC.
has been projected as an IFC since 2000. For this, the Union Government set up a
committee for making Mumbai an IFC which submitted its report in 2007.
However, due to lack of political will and various other reasons, the
recommendations of the Committee could not be implemented so far. Meanwhile
with the change in regime at the Centre, Government has mooted the idea of
setting up a Gujarat International Finance Tec- city (GIFT) as an IFC. Promotion of
GIFT in place of Mumbai as an IFC has generated political debate. The following
points strongly support Mumbai as an IFC:
lHinterland Advantage: Mumbai is the financial capital of the 7th largest
economy in the world in terms of nominal GDP and third largest in terms of
purchasing power parity (PPP). India’s economic growth since reforms has
increased two-way cross border financial flows which have induced high
growth in IFS demand.
lDemographic Dividend: It is the most populous city in India and the 8th most
populous city in the world, with an estimated city population of 18.4 million
and metropolitan area population of 20.7 million as of 2011. By 2020, Mumbai ndwill become 2 most populous city in the world after Tokyo. This gives
Mumbai an advantage of demographic dividend over any other city in the
country.
lGeographical Advantage: Mumbai lies on the west coast of India and has a
deep natural harbor which accounts for 70% of maritime trade in India at
Mumbai Port Trust and JNPT which gives it an edge over any other city in the
country.
lFinancial Capital: The reputation of Mumbai as the financial capital of the
country has remained undisputed and therefore, Mumbai should be the
natural choice when it comes to setting up an IFC. The city houses important
financial institutions such as the RBI, the BSE, the NSE, the SEBI and the
corporate headquarters of numerous Indian companies and multinational
corporations. Mumbai has two major financial centers at Nariman Point and
Bandra Kurla Complex (BKC).
lBanking Centre: Most of India’s scheduled commercial banks have their head
offices in Mumbai while the banking regulator RBI also has its central office in
the city. Mumbai accounts for a significant share in deposits mobilization
(14 per cent of total deposits) and deployment of credit (21 per cent of total
credit) of scheduled commercial banks. In terms of cheque transactions,
Mumbai's share is as much as three-fourths of the total clearances.
lEnglish Speaking Population: Mumbai has a large population of highly skilled
English speaking workers and a reputation for attracting the best managerial
talent in India. The reason why Tokyo and Frankfurt could not raise to the
standard of an IFC was lack of operating in a global language. Therefore,
Mumbai can garner benefits due to setting up an IFC which operates in
English and thus, can attract investments from across the globe.
| 44 | The Administrator 56 (2) Nidhi Choudhari | 45 |
lTransport: Mumbai’s biggest problem is heavy traffic congestion on roads. Mumbai local trains serve as its lifeline but these trains are very old and suffer from issues of water logging during monsoon on tracks, frequent delays, strike by motor men, running at 4-5 times of the seating capacity, frequent accidents on stations, encroachments on railway stations and railway lands.
lDisease Burden: As per a report of the MCGM, there can be a substantial rise in diarrhoeal deaths due to water contamination in the coming years in suburban Mumbai. It also suggests that deaths due to Malaria, dengue and vector borne diseases will rise by 2017 due to poor pest control and sewerage problems. Without addressing the issues of water, sanitation and healthcare, the city cannot become an IFC.
lUrban Administration Issues: The annual report on Working of Ward Committees of MCGM expressed concerns about the slow grievance redrassal mechanism. In the year 2014, the councilors took an average of 17 days to resolve a complaint, says the report. It is very important that Mumbai set high standards of urban good governance to attract global investors and promote city as an IFC.
lLack of Financial Reforms: Government has not yet separated public debt management from the RBI which is key for development of bond market in the country. Similarly no significant steps have been taken in the areas of capital account convertibility, GST, DTC, GARR, banking reforms which are essential for any IFC to come up in the country.
lLack of Integrated Financial Markets: In India, 85% of the paper in the bond market is issued by government of India and its instrumentalities. Mumbai cannot become an IFC without a deep domestic bond market. For any IFC, India needs a sophisticated, integrated and consolidated bond, currency, and derivative and commodity market.
lRule Based Regulation: The recent global financial crisis has reduced the pace of economic reforms in the country as our policy makers are convinced that the present set of primitive, micro-managed, state-controlled, rule based financial system directed by MoF/RBI has saved the country from the crisis. The present rule based regulation needs to be replaced by principal based regulation for having any IFC in the country.
How to Make Mumbai an IFC
The Mistry Panel Report recommended that Mumbai’s financial integration with global markets and capacity building of the city to compete with the three established IFCs i.e. New York, London or Hong Kong for international financial services. Here, a few general recommendations for making Mumbai an IFC are discussed:
lStrong Regulatory Structures: Government should by law empower all financial sector regulators to act independently with autonomy. The regulatory objective should be geared towards developing a resilient, competitive and dynamic financial system with best practices.
lIT Industry: Despite competition from Bangalore, Hyderabad and Pune,
Mumbai has carved a niche for itself in the IT industry due to vibrancy of the
Santacruz Electronic Export Processing Zone (SEEPZ) and the Navi Mumbai
International Infotech Park.
lOther Factors: It is also home to some of India's premier scientific and nuclear
institutes like BARC, NPCL, IREL, TIFR, AERB, AECI, and the Department of
Atomic Energy.
Challenges before Mumbai
There is no doubt that Mumbai has the greatest potential of emerging as an IFC
amongst all the existing cities in India but in comparison to IFCs like London, New
York or Singapore; Mumbai appears to be facing several challenges such as given
below:
lPolitical Violence: Mumbai is a city in which political violence has been
legitimized by rising regional forces. There is strong nexus between criminals,
builders, bureaucrats and politicians which is hampering any strong action
against encroachment and is responsible for decay of the city..
lSlum Capital: According to census data, only about 10-15% of Mumbai’s
people live in apartments or bungalows, while almost 54% of the Mumbai's
inhabitants live in shanties, another 25-30% life in chawls and on footpaths. As
per reports, around 22.5 million people will be living in slums in Mumbai by
2025. It is often termed as slum capital of the country and experts claim that it
will soon become slum capital of the world.
lProblem of Migration: According to some estimates, Mumbai receives 100-300
new families every day who land up in slums or erect shanties on the nearest
available footpath which makes the city look over-crowded, unmanaged and
filthy. This unregulated migration results in rising crimes, incidence of AIDS,
rise in unorganized sector employment and law & order problem which
hamper organized growth of the city.
lCollapsing Infrastructure: The city is dwindling under a collapsing
infrastructure due to overpopulation. Mumbai has become an unpleasant and
unlivable city with population, pollution, privation and public filth that is
hardly conducive to the emergence of an IFC.
lCultural Suffocation: The multi-ethnicity and multiculturalism that made
Mumbai what it was, is now under daily attack and suffers mindless cultural
suffocation by growth of regional political parties.
lExpensive City: Several corporate houses prefer other cities because the cost of
land or office is too high in Mumbai which has been ranked as the third most
expensive office market in the world as per a recent report. Owing to high
prices, many office complexes remain vacant which lead to inefficient use of
available space.
| 46 | The Administrator 56 (2) Nidhi Choudhari | 47 |

has huge land under its possession in Navi Mumbai which is lying idle.
Similarly, there is ample idle land with the Mumbai Port Trust which can be
explored for setting up financial hub under the proposed eastern water-front
development.
lFacilitating Tax Regime: We need a fairly comprehensive tax framework for
Mumbai which is different from the rest of country and thus provides, tax
exemptions within the city to make it competitive vis-à-vis other IFCs and still
do not make it a tax haven like Bermuda, British Virgin Island etc.
Conclusion
There are very few cities in the world which can aspire to become an IFC like
London or New York. However, Mumbai is one such city which is blessed with
advantages that put it in a position to evolve into an IFC due to its already
established position as India’s financial capital, its long coastline, descent air
quality, public transport facilities, and because of having head offices of most
important financial institutions and regulators of the country.
Sidelining the idea of Mumbai as an IFC on the ground of unavailability of land or
difficulties in land acquisition does not hold good because, Mumbai has some large
tracts of land under government ownership which can be optimally used for
setting up big commerce and business centers. In addition, there are many
dilapidated buildings in the core city which can release ample space if demolished.
If only, the government facilitates simplification of urban land and property
management rules and improves municipal governance in the city, Mumbai can be
made a global city similar to Singapore, London and New York.
To conclude, I would like to say that Mumbai requires concerted and coordinated
efforts of the Government, the sector regulators, private entrepreneurs, and most
importantly its citizens to remove the obstacles to foster development to ensure
that Mumbai can be made a nationally and internationally desirable destination
for business, trade and investment.
Nidhi Choudhari is an IAS officer of 2012 batch, allocated to Maharashtra cadre. The author can be reached at [email protected]
lGood Governance: For making Mumbai an IFC, the city should concentrate on
improving the quality of immigration, social infrastructure, entertainment
facilities and global linkages. The role of government must be stability,
integrity, diversity and efficiency enabling with minimum intervention in
financial markets. Government should facilitate policies concerning financial
infrastructure, financial intermediation and regulatory regime.
lCompetitive Market: A range of financial products and services should be
offered at the lowest cost to both institutional and individual investors which
require improvement in productivity and higher returns on assets through
greater penetration of efficient and low cost delivery channels and leveraging
on world-class skills.
lRobust Payment Systems: An efficient payments system is key to forming the
backbone infrastructure of the IFC which can be achieved through
institutional development and capacity building, increasing the competitive
environment, the continuous improvement in the existing payments and
settlement system, and instituting a more market-driven consumer protection
framework.
lDifferential Rupee Convertibility: Mumbai IFC cannot be modeled on
Singapore or Hong Kong because Indian rupee is not fully convertible like
their currencies and therefore, India can follow Malaysian model because
Malaysian currency like Indian rupee, is not fully convertible. Like Malaysia,
exchange control regulations should apply only to domestic entities and not
to foreign entities in Mumbai.
lRange of Products: The availability of a broad range of products and services is
essential to meet the needs of global investors. In an increasingly competitive
market, innovation and improved services will be introduced through the
existence of innovative players and a more conducive operational
environment.
lPublic Debt Management Authority (PDMA): In order to develop bond market
in India, it is important that public debt management function is severed from
RBI and PDMA is established. Without a deep, vibrant bond market Mumbai
would not be able to provide sophisticated financial services to the investors.
lImproving Transport Facilities: In recent years, some steps have been taken by
government to provide quality transport services like Mumbai Metro, Mono
Rail, Sea Plane services etc. Nevertheless these efforts are miniscule if not up-
scaled. Mumbai stills lives on local trains which requires massive
transformation.
lEfficient Land Management: Major change needs to be brought about in the
urban land use regulations, rent and tenancy laws to improve quality and
availability of housing and office accommodation in Mumbai. Additionally,
land under government ownership in and around Mumbai should be
optimally used for setting up commercial complexes. For example, CIDCO
| 48 | The Administrator 56 (2) Nidhi Choudhari | 49 |

Abstract
Do official levels of urban population in India truly capture the extent that lives in dense, highly populated conditions with significant non-agricultural earning opportunities commonly associated with “urban” contexts? According to the Census of India, the country is about one third urban – 27 per cent in 2001 and 31 per cent in 2011. However, these figures fail to capture those sections of the population that live in urban-like settlements but are not counted due to the strict dichotomous nature of “rural” and “urban” definitions in India. In this paper, we bring focus on the patterns and geographies of the grey area between “rural” and “urban”, thereby shedding light on future trends of urbanisation in India, and underlining policy implications in terms of resource allocation and governance.
Introduction
The standard narrative of the Indian urbanisation story can be summed up by
three main assertions. First, the country is about one third urban with 27 per cent of
its population residing in urban areas in 2001, and 31 per cent in 2011. Second,
urbanisation in India is top-heavy, with most urban population living in larger 1cities . Third, urbanisation is localised to states like Maharashtra, Gujarat and
Tamil Nadu, which are currently the most urbanised states in the country. In this
article, I argue that this narrative is constrained by the strict dichotomous nature of
the Indian 'rural' and 'urban' definition, and as a result, is unable to truly capture
those sections of the population that live in settlements that already exhibit urban
characteristics.
Such underestimation matters. The standard narrative of urbanisation has
contributed to the manner in which resource allocation for large-scale urban
policies and programmes has been planned, with a consistent focus on larger cities.
An example of this is the choice of cities in which investments were made during
Jawaharlal Nehru National Urban Renewal Mission (JNNURM) Phase I.
Furthermore, when considering rural areas for programmes like the National
Rural Employment Guarantee Scheme (NREGS), it is unclear if regions with
population residing in urban-like settlements were considered.
Some scholars have attempted to redefine or extend the definition of the 'urban' in India- particularly by including those settlements that are officially classified as rural but fall within the peri-urban areas of larger cities. However, this article will
Visualising the ‘Grey’ Area between Rural and Urban India
Arindam JanaSenior Associate,Indian Institute for Human Settlements, Bengaluru.
References
Annual report on Working of Ward Committees, Mumbai Municipal Corporation
Report of the Bombay First Transport Committee on Comprehensive Transport Strategy for Mumbai
Report of the Global Financial Centres Index (GFCI), 2014
Report of the High Powered Expert Committee on Making Mumbai an India Finance Centre, 2007
RBI Occasional Paper No. 80, Mumbai as an India Financial Centre: A Roadmap
Mckinsky Report (September, 2003) Vision Mumbai- Transforming Mumbai into a World Class City, advances a multi-pronged strategy
Notes
1 Report of the High Powered Expert Committee on Making Mumbai an International Financial Centre
(2007)
| 50 | The Administrator 56 (2)

When compared with the defining parameters of the census town, the above size
classifications raise one pertinent definitional question: what is the difference
between Large and Very Large Villages, and Class IV, V and VI towns? From the
above table, it is obvious that in terms of population size there is none, and
assuming that the density of towns and villages are similar, it follows that the
labour force criteria must be the only differentiating factor between their urban-
and rural-ness.
In other words, we can assume that Large and Very Large Villages are probably
considered villages because less than 75 per cent of their labour force is involved in
non-agricultural pursuits. This implies that there is a significant proportion of the
Indian population that resides in settlements that have some urban characteristics,
but is defined as rural, thereby creating a grey space of 'potential urban’. All
settlements that exist in this grey space will be defined as 'potential urban centres'.
Where the people are living-an analysis of settlement structures
Simply put, settlement structure of a state is the distribution of total population by
settlement size and type, as defined in Table 1 above. For this analysis, national
level settlement structures were generated for all post-independence censuses
(1951-2011). Inter-decadal changes in settlement structures have been highlighted
in Chart 1 below to explain where the population resides, and whether there are
factors that encourage such residence patterns.
Tracing the evolution of the settlement structure since 1951, we see a few clear
trends. To begin with, the proportion of the population living in million-plus cities
has increased four times since independence, from 3% of total population to 12%,
and as per Census 2011, 50-odd million-plus cities in our country account for
nearly 12% of the national population; but they account for only 0.3% of the total
landmass of the country.
The other clear trends in population distribution by urban settlement size classes
are that of Other Class I Cities, which have increased from accounting for 1% of
total population in 1951 to 10% in 2011; Class II and III Cities maintain an almost
steady level of proportion of total population, increasing marginally from 5% in
1951 to 7% in 2011; Class IV, V and VI Cities, too, maintain a steady proportion of
total population, between 4-5%.
This is supplemented by a proportionate decline in rural population from nearly
85% in 1951 to approximately 65% in 2011. Most strikingly, hamlets and smaller
sized settlements have declined from accounting for 43% of the total population to
less than 12%. This decline has been steadily matched by increases in medium
sized and larger villages 38%, of the country’s population resides in these
settlements now. This indicates a clear movement from being 'rural' to being
'potential urban' and these trends are symptomatic of the economic transition
witnessed over the period of 1951-2011: India has been evolving from a rural-based
agrarian economy to a predominantly urban-based industrial and services led
economy.
highlight that such attempts are not as crucial as understanding the inherent implications of the current definitional parameters. In what follows, I introduce the concept of 'potential urban centres' -settlements that exhibit urban characteristics but are classified as rural and use this as a lens to unsettle the standard narrative of Indian urbanisation.
Mapping potential urban centres dramatically changes our understanding of Indian urbanisation. This article shows this in two ways: (a) by locating them within the settlement structure of Indian urbanisation, that is, what size of settlement different people live in; and, (b) how these settlements are distributed across states. The sections that follow lay out this analysis, and the conclusion draws out implications for the results.
Uniqueness of Indian definitions-what constitutes urban India
In India, a settlement can be classified as a town in one of two ways: (a) if it satisfies a set of government defined parametric cut-offs, it is called a census town; or, (b) if a settlement is notified by the government as a town, it becomes a statutory town. For the former, the defining parameters are: (a) population greater than 5,000; (b) population density greater than 400 persons per square kilometre; and, (c) 75 per cent or more of male main workers engaged in non-agricultural pursuits. It should be noted here that statutory towns need not satisfy the defining criteria for census towns, implying that not all statutory towns are census towns.
Conversely, not all census towns get notified by the government, and therefore, do not become statutory towns. However, when compared to statutory towns, which are only created by government notifications, a census town can be considered a 'true' new town in the sense that they are large villages, or a collection of small villages, which grow and transform to satisfy the three criteria mentioned above.
On the other hand, the definition of ‘village’ is not as clearly laid out, and it is assumed that all settlements that are not towns are villages. Further, towns and villages are classified according to their population size, ranging from Class I to Class VI for towns, and from Very Large Villages to Small Hamlets for villages as described in the following table.
Towns Villages
Classification Population Range Classification Population Range
Class I >100,000 Very Large Villages >10,000
Class II >50,000 and <100,000 Large Villages >5,000 and <10,000
Class III >20,000 and <50,000 Medium-sized Villages >2,000 and <5,000
Class IV >10,000 and <20,000 Small Villages >1,000 and <2,000
Class V >5,000 and <10,000 Hamlets >500 and <1,000
Class VI <5,000 Small Hamlets <500
Table 1: Size classification of towns and villages
Source: Census of India 2001
| 52 | The Administrator 56 (2) Arindam Jana | 53 |

However, while Maharashtra accounts for 6.5 per cent of the country’s towns
(approximately 500), it houses nearly 12% of the country’s urban population
(approximately 28 million persons). This amounts to an average of little over
54,000 persons per town. Tamil Nadu, on the other hand, has nearly 14 per cent of
all towns in India (approximately 1,100), housing 8% of the total urban population
(approximately 7 million persons) amounting to an average of about 6,300 persons
per town. This indicates that Maharashtra has fewer but larger towns in which
population is concentrated, with the average town being a Class II town size
equivalent; and Tamil Nadu has many relatively smaller towns, with the average
town being a Class V town size equivalent. These two states highlight the lop-sided
spectrum of the spatial distribution of India’s urban population across the country:
ranging from population distributed across a large number of small towns to a
small number of large towns.
Chart 2: Distribution of towns by state/UT, 2011
Source: Census of India, 2011
Source: Census of India, 2011
Chart 3: Distribution of urban population by state/UT, 2011
Chart 1: Distribution of population by settlement size
Source: Census of India, 1951-2011; IIHS Analysis 2014
These trends raise an important policy question. How will the rural to urban transition play out: a)as the growth of urban population increases, b) absolute numbers of new urban population in a decade outgrows that of the rural population (as it happened in the decade 2001-2011), and c) the proportion of population in potential urban centres increases? Is there going to be a steady absorption of 'potential urban centres' into 'urban'? The implications are the gravest for the Large and Very Large Villages, which have achieved population size and possibly density criteria of being classified as cities or towns but have not been able to make the labour market transition.
As a follow-up, it can be deduced from the definitional parameters of rural and urban in India, urban areas are created when a large scale movement of workers away from agriculture takes place. Hence, potential urban centres could be looked at as the interim phase of transition from rural to urban, implying that if they were to become 'urban', they would require employment generation in formal non-agricultural sectors, which in turn implies that the future of Indian manufacturing and services sectors could potentially lie in this class of settlements. Therefore, policies to encourage specific investments in physical and human capital will be tested in the coming decades in these potential urban centres.
Where the towns are located
As per the Primary Census Abstract 2011, the total urban population of India stands at 377 million and resides in a total of 7,935 towns. The spatial distribution of Indian towns by state and union territory as shown in Charts 2 and 3 below indicates that Tamil Nadu accounts for the largest proportion of towns and Maharashtra accounts for the largest proportion of urban population.
| 54 | The Administrator 56 (2) Arindam Jana | 55 |

Arindam Jana is a part of the research team at Indian Institute for Human Settlements,
where he contributes towards the development of the urban Atlases and supports
various urban informatics projects. The author can be reached at [email protected]
programmes like the erstwhile JNNURM. Conversely, in the case of Bihar, there
could be enormous implications in resource allocation for employment generation
and guarantee, since no urban counterpart to the erstwhile NGREGA currently
exists.
Therefore, priorities of the spatial distribution of resource allocation to urban
programmes like the upcoming Atal Mission for Rejuvination and Urban
Transformation (AMRUT), stands to change significantly when one views the
spatial distribution of existing and potential urban. Should preferential allocation
be handed out to existing urbanised states, or focus on upcoming urban centres,
especially in states like Bihar which has a large proportion of population in
potential urban centres?
Conclusion
The dichotomy of the rural-urban definitional paradigm in the Indian political and
economic policy spaces causes one to miss out on important sections of the
population, especially those which are defined as rural, but exhibit size and density
characteristics of urban population without being able to satisfy the economic
criterion. Researchers have stressed upon the necessity to take a new look at the
definition of the 'urban' in India. However, it might not be as crucial as simply being
able to identify a clear grey section of the population those residing in 'potential
urban centres' which is possible with the current set of definitions in this article.
The issue that needs to be addressed is to identify the needs of this 'grey'
population and clearly chart out policies to meet them, specifically since this 'grey'
area has the potential to dramatically change the spatial distribution of what is
viewed as urban in India. In this article, the analysis has been carried out at the
national scale, but if one replicates this analysis at the state level, identification of
'potential urban centres' could be carried out at the district level, and policy
targeting could be disaggregated by one more level.
Therefore, at the national level, it is about identifying the right population groups such that future and 'potential urban' populations receive correctly targeted policies, and are provided the opportunity to transition out of the primary sector into secondary and tertiary sectors; in other words, that future specific investments in physical and human capital are made in the right locations. Furthermore, in situations where such investments or plans cannot be implemented, for example due to geographical limitations, alternatives to the standard urbanisation model need to be considered. It might not be feasible for every state or region in the country to become highly urbanised. In such cases, perhaps an increased focus on agricultural sector employment and output needs to be seriously considered.
In conjunction with Chart 2, the above chart suggests that some states have a great
potential for increase in the number of urban settlements. For example, the case of
Bihar: as of 2011, the state accounted for only 2 per cent of all towns, but nearly 19
per cent of all potential urban centres. If these settlements were considered to be
'urban', Bihar would comfortably account for the largest proportion of Indian
towns. Similarly, Maharashtra accounts for nearly 7 per cent of all potential urban
centres and Tamil Nadu for nearly 8 per cent. Comparing these with figures from
Chart 2, we can further deduce that Maharashtra and Tamil Nadu, assuming
ample availability of non-agricultural formal employment opportunities, stand to
gain a large 'new' urban population in the coming decade. Extrapolating this to the
national scale, as seen in Chart 1, a large proportion of population approximately
38 per cent lies in this grey definitional area of potential urban centres, thereby
making it important to identify these areas.
Relaxation of certain parameters can lead to massive restructuring of the
quantitative and spatial distribution of population into the rural and urban
categories and across geographical regions, thereby having immense policy
implications: especially since the distribution of urban population could
potentially change from being concentrated in larger towns or more urbanised
states to being concentrated in smaller, new towns in states with large sections of
population living in ‘potential urban centres’. This could in turn result in an
increased bias of investment area selection in the case of large national
Chart 4: Distribution of urban population by state/UT, 2011
Source: Census of India, 2011; IIHS Analysis 2014
To extend the above argument, let us again consider the definition of Large and Very Large Villages. As discussed earlier, these are settlements which have fulfilled the population size criterion for being classified as towns, and assuming that the density criterion holds, they fall short on the labour market criterion. As discussed earlier, let us label these villages as 'potential urban centres' there were approximately 24,000 of these in 2011, in which about 190 million persons reside and analyse their distribution across states and union territories.
| 56 | The Administrator 56 (2) Arindam Jana | 57 |

Abstract
Between 3 and 5 million households in India live in slums that occupy Urban Local Body (ULB) lands. These households lack security of tenure and are liable for eviction, a condition that discourages them from investing in their own socio-economic development. Unless the land which these slums are occupying is hazardous, or required for critical city infrastructure, ULBs can extend a “Land Rental” model to these communities. This paper argues for the conversion of slums occupying ULB lands to rental housing, thus redefining the household as tenant and the ULB the social landlord that rents land to the household. Such a model will provide much-needed security of tenure to these vulnerable households. At the same time, ULBs can recover a nominal rent on the land, creating a win-win situation. An added advantage will be that the tenants, usually more than a third of the households in a slum, can also continue their life without disruption as the housing unit continues to be recognised as an asset of the slum household. ULBs can gain a significant source of revenue even at nominal rental rates, enabling them to raise market finance when required and thus increasing their fiscal autonomy. The following sections outline the case for this proposition, strategic options for its implementation and potential threats and opportunities.
Introduction
Between 9 and 14 million households live in about 33,500 slums in India (Census of India, 2011a; MoSPI, 2013). At the same time, scholars argue that the Census numbers may be an undercount because the Census counts only settlements that have 60-70 huts in slum-like conditions as slums (Bhan & Jana, 2013). Nevertheless, it is evident that a massive number of households live with myriad forms of housing poverty, a situation that needs to be addressed by policy and practice. What options are available to address this problem?
Background and Context
One of the biggest challenges that slum households face is the security of their tenure. If a slum household does not have the legal right to stay on the land it is occupying, it is liable for eviction a phenomenon not so uncommon in large cities and metropolises. Evictions critically separate households from their livelihoods and socio-economic networks. Insecurity of tenure also discourages households from investing in health, education and other development actions, as any such investment is at risk of being lost in the event of displacement or forceful eviction.
Converting Slums on ULB Land to Rental Housing
Swastik HarishConsultant, Indian Institute for Human Settlements, Bengaluru.
Notes
Uchida, H., Nelson, A., Agglomeration Index: Towards a new Measure of Urban Concentration, World
Development Report 2009. Denis, E., Marius-Gnanou, K., Toward a Better Appraisal of Urbanisation in India,
European Journal of Geography, 2011.
As per the Census of India definitions, main workers are those who have worked for more than six months in a
financial year.
Though the village directories suggest that on average the area of villages is much greater than that of similarly
sized towns, it must be noted that the administrative boundary of a village includes all agricultural land
holdings of the inhabitants of the village. Demarcation of the residential area of a village and the agricultural area
of a village indicates compactness of residential areas comparable to towns with similar population levels.
For this analysis, statutory and census towns have been considered individually. This implies Urban
Agglomerations, which are collections of statutory towns, census towns and villages, have not been considered,
but their constituents have been accounted for. This was done to ensure that each town and village got counted
only once.
1 Kundu, A., Trends and Processes of Urbanisation in India, IIED, 2011.
| 58 | The Administrator 56 (2)

evident that households have provided the largest majority of housing for themselves, through self-built houses and local contractors and labour. This includes gaining access to suitably located land for their houses, and occupying it through legal or illegal means. Government policies and programmes are increasingly acknowledging this fact and tending towards in-situ slum upgradation as one of the key pathways for housing provision and urban development.
However, any policy or programme intervention by the government will have to provide for a massive financial outlay considering the scale of the deficit. The feasibility of large-scale housing intervention in urban areas can be enhanced by rental housing mechanisms that can address access to land, questions of tenure as well as operations and maintenance of housing assets. Rental housing is also associated with higher workforce participation, since it enhances labour mobility through the provision of diverse housing options for low-income households at various life stages.
Can slums occupying ULB lands and ULBs form a mutually beneficial relationship in this context?
The Proposition
As mentioned before, this paper argues for the conversion of slums occupying ULB lands to rental housing, thus redefining the household as tenant and the ULB the social landlord that rents land to the household.
Let us analyse the asset classes of slums on ULB lands. A slum which is on ULB land is made of two asset classes. First, the ULB's land, and second, the housing unit, which is clearly an investment made by the household. In this context, the ULB can give a 'no-eviction guarantee' to the household for 10 years or more, and
Illustration 2: Positive co-relation means more rental housing is associated with higher
So, who owns the lands that slums are occupying? Nearly 60 per cent of slums across urban India are on government owned lands, in which 40 per cent are on lands that belong to Urban Local Bodies (ULBs) - municipalities, municipal corporations, town panchayats, municipal councils, etc. If we estimate about 14 million households living in slums in India, it can be calculated that between 3 million and 5.5 million households are living in slums on lands which belong to these ULBs. In some states such as Karnataka, almost 65 per cent of slums are on lands owned by locally elected urban governments (MoSPI, 2010).
Illustration 1: 40 percent of Slums in India are ULB lands
At the same time, the ULBs whose lands these slums are occupying are disempowered institutions in most states and cities. Despite having considerable planning, financial and executive authority as per the 74th Constitutional Amendment Act of 1992, most ULBs are financially unsound. Most ULBs depend heavily on central and state finance commission grants for development and operations. They are also unable to raise finance from the market, and their inability to effectively claim ownership of occupied lands that are on their books, is one of the reasons. Yet at the same time, they are under increasing pressure to generate their own revenues and contribute a significant part of the investment required to improve urban life, governance and infrastructure.
Central and state governments are committed to the goal of housing for all, within a stipulated time-frame. However, even a cursory analysis of government provision of housing for low-income households will show that there is little chance that it can catch up with the current deficit in housing, let alone cater to future demand. The organised private sector and the real estate market are certainly not targeting households that can afford housing only below a certain value (Agarwal, Jain, & Karamchandani, 2013). In light of the fact that actual homelessness is not massive in the country (Census of India, 2011b), it becomes
| 60 | The Administrator 56 (2) Swastik Harish | 61 |
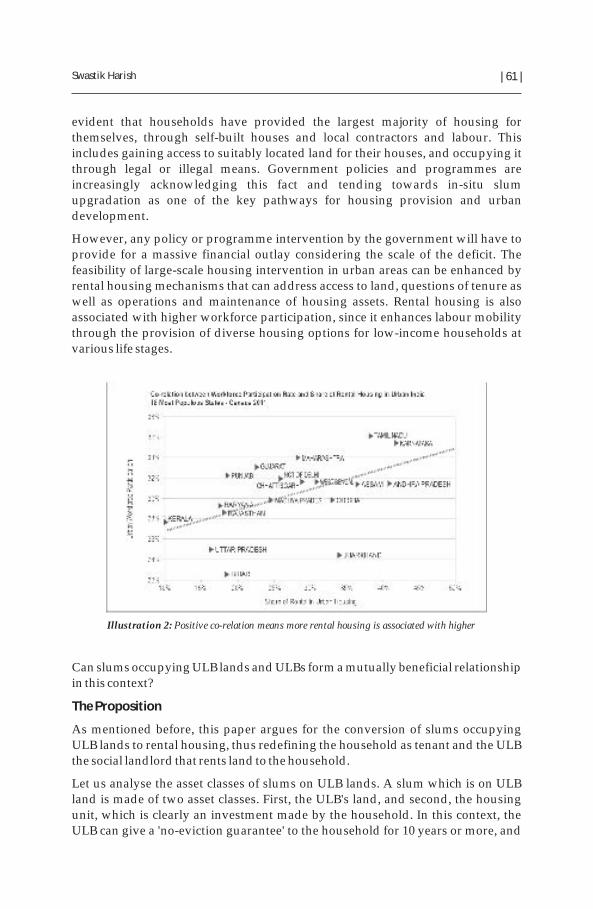

SWOT Analysis
This proposition acknowledges the fact that land ownership in slums is a complex issue and is cognisant that adding a layer of rental housing claims will not necessarily be an easy task. The following is a SWOT analysis of this proposition:
gain rent revenue from the household in exchange for the utilisation of the ULB land. The ULB can also upgrade the unit, and recover the investment on this through rent on land.
Occupying households pay rent on the land occupied, in exchange for a time-bound no-eviction guarantee. They retain ownership of the housing unit itself.
Illustration 3: A win-win situation for slum households and ULBs.
They can invest further in the house and associated services since they have security of tenure for a definite time period. Existing renters in slums maintain their relationship with their landlords, as these landlords continue to be the owners of the housing unit, and only become renters of the land.
Operational AspectslULB gives a 10 year no-eviction guarantee in exchange for rent revenue on
land, can provide services and up-gradation; also gains actual claim/possession of land.
lSlum households, including petty landlords maintain ownership of the housing unit/structure and pay rent on land (only) in exchange for security of tenure.
lTenants and tenant households in slums maintain their relationship with petty landlords as they are occupiers of the housing unit owned by the landlord.
lSlum lords could be absorbed as rent agents for the ULB based on incentive structures and community acceptance;
lModel options: Rent, lease or 'Leave and License' models available and can be applied based on tenability analysis and projected land-use.
lRent-price (subject to local-level maximum) could be based on land area occupied, and could be indexed to:
i) Local rent levels, and;
ii) Depreciation value of any infrastructure or unit up-gradation provided
| 62 | The Administrator 56 (2) Swastik Harish | 63 |
Strengths
1. Enhanced security of tenure to slum dwellers on ULB lands, including tenants that are usually excluded from social housing programmes
2. Reconfigured use of existing ULB land asset without changing ownership or need to acquire
3. Revenue and financial independence for ULB
• Direct operational revenue from rent
• Possibility of raising capital through markets/bonds
4. Increased labour mobil i ty and productivity for residents and the city
5. Works with existing policy provisions
5. Works with existing policy provisions
Weaknesses
1. Challenges in conforming to local bye-laws and development control regulations since it will primarily accept or upgrade existing settlements as they are
2. Current capacity in rental housing management
Opportunities
1. Significant step in providing housing for all-especially upon up-gradation
2. Multiple models possible based on tenability and projected land-use, as well as individual households' choices-pure rental or leave and license or long-term lease
3. Entrepreneurship opportunity for slum lords as rent 'agents' for ULB, based on community acceptance and incentive structures
4. Rent revenues can fund:
• Operations and maintenance of settlement
• Insurance of ULB and community assets
Threats
1. Resistance from existing slum lords and slum overlords, especially politically linked power groups
2. Waiving of rents and possibility of 'grants': Governments may be tempted to 'donate' these assets to slum dwellers and/or remove rent-price as sops during elections
3. Tenure security could induce escalation in existing rents and leases, leading to eviction of some tenants
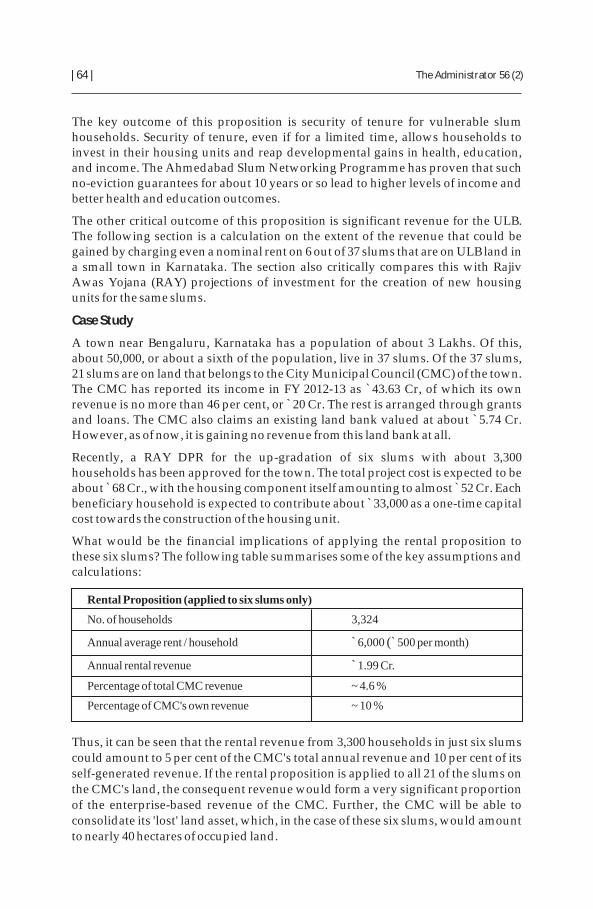
The expenditure in this model will in fact be fractional compared to the proposed redevelopment under RAY. Over a period of about 10 years, the beneficiary household would have spent about 60,000 as rent, but would have continued their life and livelihood pursuits with nearly zero interference.
Similarly, calculations using government data show that for other cities, this model could generate between 15 and 25 per cent of the ULBs’ revenue. It is interesting to note, that a recent communication by the Pimpri-Chinchwad Municipal Corporation (PCMC) stated that their experience of giving ownership to beneficiaries in in-situ redevelopment or EWS housing projects on ULB lands has not been fruitful. Beneficiaries tend to move out due to changing circumstances and economic mobility, and let out their property to others, who are often of higher income categories. The report suggests that there should be a policy of providing this housing at a nominal rent for 15 years, along with a provision of extension of lease if the original allottee has not moved out after this time period (PCMC, 2013).
Conclusion
Diversifying our public housing portfolio is a sound economic strategy with significant social benefits. Implementing this proposition could have multiple strategic advantages. It provides security of tenure and legitimacy to a huge number of vulnerable households. It does this without displacement, and includes both owners and tenants in slums. It is an alternative to capital-intensive and heavily subsidised public housing projects. It allows ULBs to recoup 'lost' land assets and generate revenue. In time, it is possible that other public and private land-owners could apply this model for slums on their own lands. As the idea gains ground, a vibrant legal social rental market could emerge for the urban poor, which is known to increase labour mobility, and therefore, the overall productivity of the city. Investment in rental housing, therefore, is not charity but sound urban economic development strategy.
The key enablers to rental housing that need to be expedited are listed below:
lThere is diversity in the demand in urban housing markets. Policy needs to diversify public housing portfolios, enable use of public lands for these, and encourage fiscal equity between owned and rented housing.
lThe greatest challenge to be addressed is the knowledge and capacity gaps to manage rental housing.
lConverting existing slum pockets on ULB lands to social rental housing can give tenure security to millions of households and generate significant revenues for ULBs.
lRental housing can function only in a political climate that encourages fiscal responsibility from all stakeholders.
`
Swastik Harish is a part of the design and implementation team for the IIHS Urban Practitioners’ Programme, the executive and continuing education function at IIHS. The author can be reached at [email protected]
The key outcome of this proposition is security of tenure for vulnerable slum households. Security of tenure, even if for a limited time, allows households to invest in their housing units and reap developmental gains in health, education, and income. The Ahmedabad Slum Networking Programme has proven that such no-eviction guarantees for about 10 years or so lead to higher levels of income and better health and education outcomes.
The other critical outcome of this proposition is significant revenue for the ULB. The following section is a calculation on the extent of the revenue that could be gained by charging even a nominal rent on 6 out of 37 slums that are on ULB land in a small town in Karnataka. The section also critically compares this with Rajiv Awas Yojana (RAY) projections of investment for the creation of new housing units for the same slums.
Case Study
A town near Bengaluru, Karnataka has a population of about 3 Lakhs. Of this, about 50,000, or about a sixth of the population, live in 37 slums. Of the 37 slums, 21 slums are on land that belongs to the City Municipal Council (CMC) of the town. The CMC has reported its income in FY 2012-13 as `43.63 Cr, of which its own revenue is no more than 46 per cent, or 20 Cr. The rest is arranged through grants and loans. The CMC also claims an existing land bank valued at about 5.74 Cr. However, as of now, it is gaining no revenue from this land bank at all.
Recently, a RAY DPR for the up-gradation of six slums with about 3,300 households has been approved for the town. The total project cost is expected to be about 68 Cr., with the housing component itself amounting to almost 52 Cr. Each beneficiary household is expected to contribute about 33,000 as a one-time capital cost towards the construction of the housing unit.
What would be the financial implications of applying the rental proposition to these six slums? The following table summarises some of the key assumptions and calculations:
``
` ``
Rental Proposition (applied to six slums only)
No. of households 3,324
Annual average rent / household 6,000 ( 500 per month)
Annual rental revenue 1.99 Cr.
Percentage of total CMC revenue ~ 4.6 %
Percentage of CMC's own revenue ~ 10 %
` `
`
Thus, it can be seen that the rental revenue from 3,300 households in just six slums could amount to 5 per cent of the CMC's total annual revenue and 10 per cent of its self-generated revenue. If the rental proposition is applied to all 21 of the slums on the CMC's land, the consequent revenue would form a very significant proportion of the enterprise-based revenue of the CMC. Further, the CMC will be able to consolidate its 'lost' land asset, which, in the case of these six slums, would amount to nearly 40 hectares of occupied land.
| 64 | The Administrator 56 (2) Swastik Harish | 65 |

Abstract
This paper is a discussion on the infrastructural development of Nanded, a city in Maharashtra. It focuses on the implementation of government schemes, like Basis Services for Urban Poor and Rajiv Awas Yojna, to make cities slum free. The Paper examines the approach used, to involve people in the development of the city. The paper also discusses the problems faced during the implementation of these schemes and the methods used to deal with them.
Nanded is a medium sized city with a population of about little more than 5 lakhs. The city is the native place of Ex CM of Maharashtra, Sh. Ashok Chavan. The city is also a very famous pilgrimage place for the Sikhs. Last few years, the city witnessed massive infrastructure boost as it received thousands of crores for celebration of Guru ta Gaddi Programme. Jnnurm is a scheme for cities more than 10 lakh population normally. But Nanded being a ‘heritage’ city got included in it and was approved a massive programme for infrastructure (Jnnurm sub mission
11) and for slum up gradation (BSUP , Jnnurm sub mission 2). A total of about 26,000 houses in 100 (approx) slums are to be constructed along with infrastructure in these slums including roads, drains, sewerage, water supply and community building. Although the number of slums in the city is close to about 200, and another
2100 slums remain to be covered, the city may still dream to become slum-free .
A total of 10 DPRs were approved in around 2008. A consultant, an architect and a PhD was appointed for the survey and DPR preparation. The consultant did a pretty good job at survey except for accommodating factors beyond his control. The survey was done to the best of her knowledge. The city has also tried to achieve transparency by putting the entire data on web.
Out of 26,000 houses, about 5000 houses are on National Textiles Corporation Land and although an in principle agreement to upgrade them and return unencroached land to NTC with TDRs has been achieved, a formal GOI approval has taken more than two years now and is in waiting. Of the remaining, houses (DPR wise each
3consisting of few thousand houses) were tendered out. About 70 % of remaining houses were tendered to a single contractor. The tenders are approved by the Standing Committee.
The house designs-eight models were designed to suit local conditions were made by the consultant. The house construction and infrastructure has been tendered out.
Inclusive Cities and Participative Development: A Case for Discussion
Dr. Nipun VinayakDeputy Secretary, Department of Rural Water Supply and Sanitation, Government of India.
References
Agarwal, A., Jain, V., & Karamchandani, A. (2013). State of the Low-Income Housing
Market: Encouraging Progress & Opportunity to Realize Dreams of Millions. Mumbai.
Bhan, G., & Jana, A. (2013). Of Slums or Poverty Notes of Caution from Census 2011.
Economic and Political Weekly, xlviiI (18), 2011–2014.
Census of India. (2011a). HH-4: Slum Households by Ownership Status of the Census
Houses, Size of the Household and Number of Dwelling Rooms. New Delhi.
Census of India. (2011b). Primary Census Abstract Data for Houseless. New Delhi: Office of
the Registrar General and Census Commissioner, India. Retrieved from
http://www.censusindia.gov.in/2011-Documents/PCA_HL_2011_Release.xls
MoSPI. (2010). Some Characteristics of Urban Slums 2008-09 (Vol. 534). New Delhi.
MoSPI. (2013). Key Indicators of Urban Slums in India. New Delhi.
PCMC. (2013). Pimpri Chinchwad Experience in Implementing Affordable Housing
Projects National Symposium on Affordable Housing. Pimpri-Chinchwad.
| 66 | The Administrator 56 (2)

The passing of resolution, as also any policy dictating formation of such local level bodies/committees does not translate fully into a representative structure. Being a representative means being ‘powerful’ and the power equations, as they are, may not allow a true representative character. A legal basis for the same nevertheless was put into place.
Afraid of Vasarni experience, a strong need is felt to ‘engage communities’. Engineers’, consultants’, bureaucrats’ capacities to engage communities may not be very well developed. We are used to implementing ‘schemes’ in which ‘beneficiaries’ are to be helped.
Community engagement is a skill that may be God gifted but needs to be learnt. It can be learnt as a professional skill, which may also be encashed may be a good business model. It may also flow out of a genuine love for people.
Media Matters is a participative theatre group that has worked on various social issues. They had earlier successfully delivered an adolescent girl skill development module. They were approached and the issue of engaging slum dwellers debated, discussed.
Once modalities were clearer, Media Matters refused to participate in bidding process. The bid management process is a technical issue (manageable?). The final decision making lies with the Standing Committee. Without bidding also, for reasons recorded in writing, Standing Committee may approve a proposal. Media Matters’ proposal was approved. Their work is fairly restrictive conducting participative theatre workshops in about 25 slums. Each workshop is for 5 days with about 30-40 participants from 3-4 slums. During the workshop, all issues related to BSUP work in their community are discussed. They rehearse and make a small act which is enacted the sixth day in the community itself. A dialogue is established with this group and some trust is also developed.
Till now about 15 communities have gone through this exercise. It is now possible to talk to these ‘communities’ as a group. It is some change from the attitude a few months back when a boy from one of these communities remarked, “Saheb, kuch hone waala nahin hai……hamari basti mein sab mahilaayein toh bartan ghisti hain, kaam karti hain, jaanwaron jaisa jeewan hai……aadmi log light ke neeche baith ke daaru peete hain, patte khelte hain….”
The people who are coming ahead in this are mostly the same that have taken up the work of cleanliness of their own communities. Nanded is seeing the vision of being the first ‘clean’ city of India. NWCMC has partnered with two organizations-Knowledge Links and Feedback Infrastructure-to implement CLTS-Community Led Total Sanitation. The approach looks at sanitation as a public good rather than individual good and uses triggering techniques to induce collective behavioral change.
Lack of cleanliness being an issue mainly in slums, there is a natural reason for convergence among community mobilization efforts for these two programmes.
In BSUP, people were supposed to pay 10% of the cost of houses as their share. As most people paid on an average about 5000 Rs as against the required 23000-28000 Rs, many
Over the last about two years, close to 4000 houses have been covered. About 10 slums have been upgraded fully. Another 20-30 are on the verge of completion.
All the projects except the one on NTC land are ‘in-situ’ projects.
Out of the identified slums, the ‘slum’ character varies between slums. Officially about 30% of Nanded population is in slums. While some are actual slums, some were ‘kutcha’ houses in between better houses. Some were rural in character. They were all liberally called slums.
After the DPR approval and tenders, work orders are issued and works start. The engineers of the corporation are supposed to monitor the work. The consultant plays role of quality check. There are about 5-6 engineers of corporation for this work. Consultant also engages some engineers.
Most of the slums are on land owned by slum dwellers and there are very few encroachments on Government land. In the scheme, kutcha houses are being replaced by pucca houses, without changing the existing title. Where possible, land ownership is also being facilitated to the community.
BSUP scheme also talks of reforms keeping a percentage of budget for poor, giving them property rights and amending the DP plans for reserving housing and business sites for the LIG and MIG.
Vasarni is a slum that has been fully upgraded. It has got newer houses, newer roads, sewerage and water has also started flowing from taps in houses. A visit to this slum might be desirable by those who have implemented. We may expect we have brought about change. The visit does not give you that satisfaction and happiness. People say, street lights have not been done.
With 4000 in-situ houses completed and bagging ‘community mobilization’ award at the National Level does not obviate this lacuna.
Who is to be talked to in slums? What is community? It is the few who ‘claim’ representation or the few who can shout. If the rest are not participating, whose fault is this?
We can look at institutional mechanisms for representation. The local body, Municipal Corporation has 79 elected members, one per ward. Every ward may have an average of 1000 households and 5000 population. Each member’s area may have a few slums. He may or may not (use not) be a slum dweller himself.
In rural areas PRI structure, it is a three tier system Zilla Parishad at the district level, Panchayat Samiti at block level and Gram Panchayat at the village level. Does the second and third tier exist in most cities?
ndThe Municipal Act (BPMC) allows for 2 tier (called Prabhag Samitis, which is a cluster of about 20 wards). The resolution to establish these was passed by the General Body in December, 2010. Today Prabhag Samities are in place with one of the Councillors elected as Chairman. Maharashtra Government also amended Act to make provision for ‘Area Sabhas’ bodies of all electors of 1-5 polling stations that is akin to Gram Sabhas, the lowest tier in rural areas. The Act is not notified yet. However, Nanded resolved in its General Body to form Area Sabhas.
| 68 | The Administrator 56 (2) Dr. Nipun Vinayak | 69 |

The community is going through an agni-pariksha. They have seen over so many years now development being showered (or promised to be showered) upon them. They have seen it all as a bystander. A house, though constructed for me, is being looked by me as a Government house. The road, drain, streetlight, water is all of Government, not mine! Can they now come in role of partners and deliver, not complain?
Mhalja Tekdi, another slum has this charged team now. They call themselves 4‘Pudhari’ group. They are the ones who have stopped open defecation in their
areas, picking up fights with community not to put kachra in drains and discussing BSUP issues openly. They felt bad when in their community street lights were broken by people themselves. Someone’s feeling bad, someone will take charge soon.
We are also engaging with contractors. It is no easy work for a contractor to work in a slum. His material may get stolen, his may be bashed to pay up to some and he is also held accountable for delays by the Government. Without local support, his work is inefficient and with delays.
The contractors are agreeing to allow people to join hands with them and take up part of constructing their own houses. A Mehboob Nagar is doing its compound walls itself. Through agni-pariksha, confidence will increase and bigger works will be taken up. Works may happen faster.
The scheme comes to an end in March 2010. There is a long way to go. The 20-25 slums out of hundred where this community mobilization work has happened are the ones where a genuine transparency is emerging as also empowerment. This may not be liked much by one and all. Next year is elections and everything is looked at from political perspective. However, till now, work is on track and everyday we feel this is the only approach. How soon is the only question?
Dr. Nipun Vinayak is an IAS officer of 2001 batch of Maharashtra cadre. He is currently posted as Deputy Secretary, Department of Rural Water Supply and Sanitation, Government of India. The author can be reached at [email protected]
houses work was ordered to be stopped by the Corporation about a year back. Realizing that this was not leading anywhere, house construction has been commenced.
An attempt to collect 10% as ‘beneficiary contribution’ has been put on hold to a time when more trust has developed between us and the people. Convergence between different programmes is emerging; however, the slum upgradation work being linked to layout regularization, title issues etc., requires a lot of inter-department coordination as well.
Shanti Nagar is another typical slum where newer houses and roads have been built. The slum today gives a picture of slum dwellers cooking on roads. They say they could cook earlier in their houses as it was kutcha; now they can’t have black soot of chulha discoloring their houses. They are demanding LPG from Government now.
In Pakiza Nagar, the outside 5 ft space which was to be left open as per the ‘design’ has been closed by tin plates. It is a Muslim community and does not prefer a house where living room opens directly on to the street.
Many of the slum dwellers go out for labour on houses / roads of others. The idea of constructing their own houses has not occurred; SPARC is an NGO that has demonstrated in Pune on a small scale that community if engaged from day one can construct their own houses.
Nanded has engaged SPARC for partnership with it in its ‘slum free’ goal. SPARC’s key people are Sheela Patel and Jockin. Jockin calls himself a slum dweller. The basic principles of SPARC are direct community engagement, giving opportunity to participate, avoiding friction with existing power groups and accommodating for the eventual good.
After BSUP, the next new scheme Government has floated is ‘Rajiv Awas Yojana’. This scheme, they say is ‘beneficiary centric’, allows for innovation, is harsh on reforms (such as Enactment as Property Rights) and uses a whole city approach. Under this scheme, a participative survey is to be conducted. For that, but mainly for community engagement, we have requested SPARC to work in about 20-25 slums (mostly overlapping with Media Matters).
SPARC with its vast experience brought its team (mainly women who were slum dwellers but are now successful contractors!) to talk to our ‘natural leaders’ from communities. The idea was floated, motivation and trust is beginning to be developed. The challenge is to ‘do’ rather than ‘complaining’.
A series of discussion have happened and are happening with our own staff, the community people and the contractors to explore potential for this new approach where people take up their own work in their hands.
Our own team of engineers and administrators and consultant has to be first convinced of this approach. That ‘Slum work’ is a noble, doable work and in its purity beyond ‘my credit’, ‘designs’, ‘money’ is being hammered. The loosening of controls is not coming easily.
| 70 | The Administrator 56 (2) Dr. Nipun Vinayak | 71 |

Abstract
The paper critically reviews the role of private and public sector in facilitating urban management in cities in India. With the help of examples of other cities in Asia, it discusses the various issues involved in implementation of government policies. The government bodies have to create conducive political and legal environment to facilitate them for better working conditions. Private sector has to operate like a second hand of the government. The relationship between the government and the private sector should set an example of mutual cooperation and support to each other. In particular, the paper focuses on the political issues involved in regularization of residential colonies in Jaipur, Rajasthan.
If someone is to travel around globe, it can be observed easily that most of the cities are managed by the residents, their organizations, joint committees and also by direct participation in the urban local bodies. When I travelled across several cities in the World, I find that urban management is a part of citizens daily life through various means, resources, habits, attitudes, behavior etc. The reasons attributed to the urban governance system in which the urban agencies, organizations, civic sense and local leadership, voluntary organizations etc were mainly performing the task of urban management. The urban local bodies were not alone responsible for urban management. The government bodies are to create conducive political and legal environment to facilitate them for better working conditions. Private sector is to operate like a second hand of the government. The relationship between the government and the private sector is to set an example of mutual cooperation and support to each other. Civil society organizations and private sector are also to motivate each other for in furthering the socio-political activities in the city. Further, it could easily be seen that the key elements of urban management: rule of law, transparency, responsiveness, consensus, equity, efficiency and effectiveness, accountability and a clear vision of city’s future design are rigorously followed. Looking at Manila, Bangkok, Jakarta, the metropolitan form of government administers the affairs. Bangkok is divided into 50 districts with local offices, Jakarta is to consist of 5 districts, Manila is composed of 17 cities where Manila Metropolitan Development Authority exists. These cities are the examples of the best urban management system in Asia with single administering system. In these cities, the government is to perform four fold functions (i) social contract-defines citizenship of the city (ii) local authority to control and exist force, (iii) responsibility of basic services and (iv) creating an environment of sustainable urban development. In other words, government is the key agency to meet out the
Urban Management in India: Regularisation of Residential Colonies in Rajasthan with special reference to Jaipur city
Dr. Pradeep K. SaxenaAssociate Professor (Retd.),University of Rajasthan.
Notes
1 BSUP, Basic Services for Urban Poor is a sub mission of Jnnurm that includes components such as construction
of dwelling units for the slum dwellers, infrastructure in slums, besides other components.
2 Although few DPRs were not approved, the earlier DPRs with inflated numbers are sufficient to cater to entire
city slums
3 Most figures are approximations only but indicative.
4 Pudhari means ‘leader’ in Marathi.
| 72 | The Administrator 56 (2)

many ways. The citizens’ initiatives to construct residential houses/ apartments were at so large scale that the urban development agencies like municipal corporations, development authorities etc. could not expect the phenomenal growth of residential colonies, consequently, illegal residential colonies have emerged in all directions of the Indian cities without any basic facilities like water, electricity, sewerage, security etc. In creating such colonies, illegal cooperative societies, land. Mafia (which includes bureaucratic peoples also) individual land owners and house owners have made important contributions. Beside this, illegal residential colonies have also attracted the capital market like bank, financial institutions and private capital to provide easy loan facilities to individual land owners for houses which expended the urban areas rapidly. In the last but not least, such residential colonies have also become a source of easy - money making. On the whole, the residential colonies irrespective of legal or illegal have emerged in the Indian cities. The expansion of urban areas has generated several problems like voter’s list, Residence Certification, ownership of land house, flat etc. Civil cases related to land entitlement, ownership of land areas, crime cases and configuring of residential areas, postal distribution, neighbourhood problems and cases, security of area and so many other problems which have forced the state government and the urban bodies to regularise the illegal houses/ places/ land/ construction etc. in order to eliminate such problems. The local bodies or the development authorities have considered such colonies as a revenue generation mechanism and politicians have considered them as a vote bank during the time of elections. The state government has capitalised the situation both for popularity and earning and therefore intervened in the regularisation of such matters through a regulation act which permits the urban bodies to assess the regularisation cases on colony to colony basis, individual cases, and land for residential localities. However, the act was found insufficient in due time and several committees were formed to make a perspective policy for the regularisation of residential colonies. Inspite of these efforts, no concrete and sound policy for regularisation of residential colonies could be evolved. The reasons may be attributed to political interests and influences, pulls and pressures of land mafia, pressures of local residents, and of capital market agencies, bureaucratic politics, political interests of political organisation, judicial interventions and failures of local urban bodies to command the residential localities. Beside this, the local residents of the illegal colonies have also not shown interests in regularising their areas due to financial burden. Citizens’ apathy has generated overriding problems of non regularisation of residential colonies. The trend to not to regularise the residential colonies was promoted by the government, bureaucracy, citizens and also by the financial institutions. The long term effect of it could be seen in terms of illegal activities, crimes, terrorist activities, and also several outsides people and institutions. It must be mentioned here that although local police thana (Station) keep vigilant eye on these colonies but do not intervene in it due to their own vested interests.
Looking on the other side of this problem, the colonies which were either
regularised or semi regularised by the local urban bodies are now in very bad
shape. The local government institutions or the development agencies/ bodies did
not pay attention to these colonies after regularisation. Consequently, these such
challenges of urbanization and address the needs and concerns of the large number of urban population by increasing their opportunities in the urban areas. Further the governments are to make efforts to protect environment, socio-economic conditions, public health, and safety at affordable cost, maintaining essential services, infrastructure and social system. Beside this, coordination among the citizens, government agencies and the private sector is seen at a very expected level. The example of such coordination can be seen in South Korea where I experienced it during my several visits. The foremost thing is the peoples, habits, attitudes, and personal touch to the urban solutions. These Asian countries like Thailand, Malaysia, Singapore, South Korea, Indonesia, Taiwan, Japan, etc have also passed through the economic transformation and global effects but have
rd thredesigned several times the urban management system alike 73 and 74 Constitutional amendments which have yet not been implemented in many states and cities of India. India’s Prime Minister’s programme of “Swatch Bharat” has got wide level support due to failure of urban local bodies to manage the cities properly. Urban management around the world is basically citizens’ centred choices, commitments and loyalty to the city. SU Chun Pin, Chamlong Poboon, Hasnah Ali and el, Eric J. Heikkila, Hendry Kroukamp, Yok-Shiu F. Lee, Naohiro Kitano, and Rogerio F. Pinto in their case studies on urban management in various countries have clearly indicated that efforts of private and non-governmental provisions of public services as well as citizens’ performance are to make more sense in urban management than the political campaigns. Moreover, a sense of belongingness in the residents of the cities is to dominate in the urban management. Migrants and economic parasites of the changing cities are to be educated and managed in such a way that their working should not affect the culture of the city and environment of the country. They have also argued that urban management agencies should innovate new techniques of urban problems with the help of the corporates, industrialists, investors and the political parties to serve the people particularly in the infrastructure services. It is also seen that cities can best be managed by the local residents by their donations, contributions and preservations more efficiently than the government services. Governments may take opportunity to involve the local residents in various socio-cultural services of the city and in turn governments may provide them several relaxations, motivational incentives and by other means. Last but not least, business opportunities, tourists, and technology parks must be increased to enhance the quality urban services in the cities. On the whole, it has been argued that urban management is to require innovative means and methods rather than traditional institutions, bureaucratic practices, political opportunists, fake slogans and movements and political activities. In India, politics of urban management have generated more fake activities with financial wastages aimed to gain political mileages rather than serving the local residents. Most of the urban activities are geared up at the time of general elections either of state legislatures or local municipal institutions, In between one election to another election, urban services are reduced to minimum level.
After the adoption of new economic policy 1991, a massive change in the Indian cities can be witnessed both in terms of industrial and residential activities. Industrial development has generated residential development and problems in
| 74 | The Administrator 56 (2) Dr. Pradeep K. Saxena | 75 |

On the whole, regularisation of residential colonies is a very complex politico-
administrative problem which involves several infrastructural facilities as well as
administrative capacities to resolve (Von). Lack of political will and administrative
insights and future vision has complicated the problem. Basically the joint
ventures of land mafia and actively involved politicians have aggravated the
situation in which the administration due to lack of knowledge and vision and over
determined by personal choices and interests, have tried to capitalise the situation
in the shadow of administrative interests. Political initiatives like in Delhi, Kejriwal
government is going to regularize the 814 illegal colonies, have motivated the
illegal settlers and land mafia to aggravate the problem of regularization of
residential colonies. Similarly, the Rajasthan government’s initiatives to regularize
more than 800 colonies have created the problems of crimes on the one hand and
escalation of land prices. Further, The Apartment Act, 2015 in Rajasthan state has
also generated several factors in the regularization. The Act is basically, to provide
rights of flat holders in the land/plot, however, the multi-story flat’s plot are small
in size and cannot accommodate all the flat holders in sharing the plot and thereby
raising the problem in regularization of flats. Moreover, the environmental
clearances are also hurdles in the regularization of residential colonies. (In Jaipur
city, there is no marked green belt around the city). It is also to be noted that it is
very difficult to obtain environmental clearances from the Central or state
government. At the state level, the problem of getting clearances from many
departments like Registrar of the Cooperative society, Forest Department, Land
And Building Department, Law Department, Police Department, Revenue
Department, Tehsildar, Patwari, and then Jaipur Development Authority (JDA) is a
critical issue and it is related to issue Patta of the land to the concerned institution or
person.
Next, we are describing the story of the Niyaman camp held at various times in the
premises of the JDA. The story tells how the Camps are organized, their
administrative procedures and practices, behavior of the camp, responses from the
public and difficulties in getting patta from the JDA. This also reflects that such
camps are means of earning of the JDA or the facility to the public or securing vote
bank for the politicians or something else. The story also visualizes how much
bureaucratic mentality prevails in these camps rather than public service, citizens’
centric administration, or public choice administration. Last but not least, it also
shows that urban management is still dominated by personal discretion,
administrative choices and other considerations rather than rule of law.
Regularisation (Niyaman) Camp in Jaipur City
Jaipur Development Authority (JDA) is to organise regularisation camps after a
careful study of the area ,necessity, no objections from different authorities of the
Central and the state government and necessary reports from different
departments of the state government. A camp is organised when all formalities of
the JDA are completed. Then a notification is published in the daily newspapers of
Jaipur and also through local leaders of the colonies. On the day of the camp, a team
colonies have not only lost their original structures and designs but also converted
them into slum areas (for example, the housing board colony Jawahar Nagar)
Moreover, these regularised colonies, which could pay a high dividend to the
urban local bodies for business and commercial activities as well as penalties for
exploiting the original art and architecture of these areas, are becoming burden on
the state government and the urban local bodies due to drinking water, electricity,
sewerage, roads, and other local problems and are becoming a big headache to the
law and order agencies. Last but not least, regularisation or non-regularisation of
residential areas is not only question but is also a question of governance
mechanism or are in unruly state of affairs? The regularization of residential
colonies can be understood in terms of the “acceptance” of the state government.
The acceptance is to depend upon the political viability, residents’ political
influence, and type of people, locality’s importance in the area, caste, kinship, and
religion etc. of the locality and personal benefits of the politico-bureaucratic
people. There have been thousands of colonies which have not been regularized
for over 30-40 years on either pretext but are well developed in posh areas of the
city or there have been many colonies which have been regularized even before the
construction of the houses or have been regularized due to colonizers pressures
while there have been many colonies which have been well established and
designed but are not being regularized. The existing situation is due to the
involvement of capitalists-turned politicians or the black money being invested or
foreign investment through various routes and illegal means. The housing sector
in India is highly neglected, ignored deliberately by the government and is also
passing through a phase of anarchy, unruliness, controlled by criminals, mafia and
goondaism. Therefore, government is to avoid regularization process as it is not
easy to find routes of money invested in the residential colonies. The most
worrying thing is that it is being done with the support of high-positioned
bureaucracy, politicians and also with the consent of law and order machinery.
Since land is the source of fast-money making, therefore, every section of the
society is to involve himself in this juncture. The second worry is that the real estate
sector is losing its grip in the Indian economy as the real owners or users are not as
much as the investors and the buying capacity is limited due to high
unemployment rate In this situation, the housing sector may be in danger zone and
the prices may fall to alarming rate as has already happened in Peoples Republic of
China (PRC) South Korea, Bangkok, Dubai etc. which would indirectly affect the
infrastructural industries like cement, steel, and other related industries like the
capital market, financial institutions and banks and also the real needy institutions.
Moreover, it may generate civil war in the urban areas in long run due to increasing
gap between the poor and the rich. The gap between the urban rich and poor is as
per the calculations of the NEAER, reached to 1:562. The poor people are observing
the palatial houses and residential places very closely and may turn violent at any
moment. Since the gap is widening at a very rapid speed it may erupt in civil war.
Last but not least, the illegal structures are creating polluting hazards and civil
problems. This would also be proved high risk to the human life in case of natural
calamities as has happened in Surat, recently in Kathmandu and other risky zones.
| 76 | The Administrator 56 (2) Dr. Pradeep K. Saxena | 77 |
back to the Zone section to get the patta issuing clerk who enrol the patta in the register and then hand it over to the plot holder. In this whole process, a plot holder is to keep his important documents in his hands and money in a leather bag for the whole day. If anything lost, the plot holder has to bear.
Now, there have been various issues involving the utility of such camps by the JDA.
lSuch camps are organised for the benefit of the common men and resolving difficult cases on priority basis while the JDA issued land patta to those whose cases were clear cut and involving no difficulties in order to get popularity in the eyes of the Chief Minister rather than serving the masses;
l These camps were organised without any preparations, administrative outlook, untrained clerks and officers, resulting into failures or grievances or problems and harassment of the masses
l The administrative procedures are lengthy, over bureaucratic and tiring for both the administrative officials and the public
l Top rank officers are to avoid to attend the camp except signing the files and patta and do not evolve a practical and viable system probably due to untrained in management and lack of authority;
l There was no trust and belief between the JDA and the public on simple matters;
l Why such camps are not organised with the help of private sector agencies while most of the tasks are performed in the JDA by the private sector agencies?
l Why the JDA has not prepared the case wise files before that camp either due to lack of administrative machinery or lack of skill or otherwise?
l Why local colony samiti or patta allocation housing society was not called at the camp in order to sort out complicated matters;
l Why no top rank officer above the level of Dy. Commissioner is to visit the camp and look into the matters. And lastly
l As one can observe that the JDA officials are seemed more interested in those patta camps which are commissioned by the private land developers than the colonies developed by the public? There have been many examples when patta allocation camps were organised suddenly in the private land developers but those colonies which have been developed by the public, no camps were organised for more than 15-20 years.
The story of such regularisation camps shows that the urban management is more
centralised in the hands of the bureaucracy rather than in political or public
leaders. Further, the bureaucratic officials are not to take part in such camps
willingly and they are forced by the top officials. Therefore, they try to avoid
deciding the matters on the spot in order to gain something extra for personal
benefits. It is also clear that the camp officials have no vision of urban development
of at least 8 persons of the concerned Zone consisting of 2 clerks of the section, one
draftsman, two Tehsildars and two accounts clerks and under the leadership of the
Deputy Commissioner of Zone is to sit there from 9 a.m. to 6.30p.m.
Now, see the realities of the Camp. On the day of the Camp, at least 200 or more people with their ladies and children assemble in the premises of the JDA with their files and necessary documents. First, there is crowd to register the files with the Zone clerks while JDA has files of their houses or plots. People are making their all efforts to get first register their file and chaos is seen. After registering the file, one clerk is to examine the documents carelessly and forward to another senior clerk who is to put file before the draftsman. At these levels, full of manipulations can be seen, people are making calls to their known persons in the JDA to get first clearance, two peons who are managing files are changing the serial order of the files on the table just to get some favour or money from the people. The old draftsman with weak hands and memory is calculating the plot area and comparing with the reports of the JDA surveyor (this work could be done before organising the camp by the draftsman). In this process, the draftsman is to take at least 45 minutes to more than one hour to calculate and measure the plot and road width. Such as, on the whole day, he is able to clear 10 to15 files of the colony. Then file goes to the Tehsildar ladies who start work from all documents and raises several questions to the plot holders and then return the file just by saying we will see these files after a few days as and when find time. Out of 10 files, 2 or three files are cleared by the tehsildars and plot holders are asked to deposit the regularisation money with the accounts clerks. Then the accounts clerk is to start looking at documents and measuring the area which has already been measured by the draftsman and find some queries and return the file with the note to get reviewed by the draftsman. Then, the plot holder is to go back to the draftsman who is already reviewing other files where a plot holder has to struggle with his neighbours to get file again reviewed. In this process, the plot holder is to spend at least one or more hour to get it cleared again by the draft-man. After this, he again come to accounts clerk who starts to calculate the total amount on the basis of different charges of the urban development. thereafter, go to the challan clerk who would prepare the challan from the computer in the Zone office and then come back to the accounts clerk and deposit the money to the accountant and take back the file along with the deposit money receipt and back to the tehsildar who again look into the documents and raises further questions, if she is satisfied then go to the senior clerk of the zone, then various level of clerks to get it signed. If a plot holder is successful, then again go the section clerk to get blank regularisation patta form and also being asked to bring necessary revenue stamps from the stamp vendors from the different places .Some of the stamps have no utility and charges but are being levied in order to generate funds for the state government. All stamps must be attested by the notary and a fee of minimum Rs. 20 to the cost of the stamp is paid to the notary. Again come to the Patta issuing clerk who would fill the blank patta form with his own knowledge and writing. Then again go to the various levels of the clerks to get sign of them under the seal of the Deputy Commissioner along with the file. In the last, the plot holder is to go to the Deputy Commissioner to get the patta and file to be signed by him himself. Thereafter plot holder has to come
| 78 | The Administrator 56 (2) Dr. Pradeep K. Saxena | 79 |

collectorate. It is very difficult to find and meet them on any critical issues of urban
problems. The elected Members of State legislatures themselves could be heard
that nobody listen our voice in the JDA. There have been instances that even the
directions of the urban development ministers are ignored by the JDA officials. It is
commonly known that the JDA and its urban management are remotely controlled
by the CM office and not by any one. Colonisers’ residential premises are
regularised on priority basis while the general public colonies or plots are ignored
for long time to regularise.
Now, the story does not end here, One has to register the Patta in the Office of the
Registrar, Revenue Department located in the JDA Campus. The Registrar is again
to inspect the whole papers and Patta and determine the registration fee according
to transfer of land ownership or Society Patta transfer to different parties which is
to come in thousands or lakhs of Indian currency depending upon the area of the
land and transfer ship of land. After the registration of Patta (within 120 days from
the date of issue otherwise Patta would be invalidated), the story is to end. But in
this process, a person is to pass through the administrative harassment, process
questions, queries and many psychological pressures. Such type of JDA’s
regularization (Niyaman) camps raise several questions i) JDA is a statutory
administrative body, how could it be treated as “authenticated” signatory of
government by other institutions as the similar other institutions like universities,
companies and corporations are not treated equally by other institutions?
(ii) JDA’s task could also be handled by similar private institutions like in
education sector, private universities are doing then why JDA is alone
authenticated by the government? (iii) How JDA could be a dictator of land
allotment as it (land allotment) is being done by several other institutions?
(iv) Niyaman Camps of JDA are over bureaucratic and full of harassment; why
such camps have not been converted into "Single Window" system in place of
several windows for the public? No efforts have been done even in the modern
information technology era. (v) Why the Niyaman Camps are not organized with
full and complete preparations and people are harassed in such camps? (vi) Why
the task of Draftsman in Niyaman camps are not done before the declaration of the
camp ? (vii) Why several revenue stamps are being levied in such camps over the
Patta releasing ? (viii) Why it is required to get Patta registered in Registrar of the
Registration of the state government? It means that the sanctity of the Patta is
doubtful? Why such registration practice be not adopted in education or other
sectors where degree diplomas are awarded by the institutes and Universities
whose (degree/diplomas) registration is made compulsory/mandatory? And,
why JDA is not to issue notification of regularized houses/land/plot on its website
in place of issuing Patta through such Niyaman camps.
In the modern times, it seems that governments have not gone through the
land/house allotment system all over the world where such things have been
discarded long before. Even the IAS peoples, who are trained abroad on the public
exchequer money, do not take pains to study the land/houses allotment system in
different countries. Secondly, in the modern democratic system, JDA like
of the city except to show earning of the JDA before the Political masters. The
residential colonies emerging in the pink city are poorly managed by the JDA and
the politics of vote bank and capital of land mafias dominates. Beside this, top rank
officials and political masters are found over busy in their daily routine matters
than public grievances. Those officers, who are sent for training in urban
management abroad and lot of money spent on their training, are not consulted; In
urban management, private agencies, university officials, event managers etc are
not involved in such regularisation camps and activities. No lessons are taken by
the administrators from abroad or local areas to reform the activities of the JDA
which is purely a administrative body run by a super ti8me scale IAS officer at his
own experiences, political linkages, and vision rather than realities. It is pity that
development task is fully given in the hands of the administrators rather than the
public man while state government is to propagate the theory of development
through decentralised bodies of the public. Nagar Nigam, an elected body, is a
poor and weak organisation of elected people and has no authority to intervene in
the JDA tasks because it is not backed by the Chief Minister while the JDA is openly
supported by her office. The reason may be attributed to several reasons namely,
JDA's close connections with the land builders, mafias, influential industrialists,
local administrative and capitalists who are also connected with the chief
ministers’ office, top bureaucracy and ruling party persons both at the centre and
state level, beside this, JDA is more empowered by law and administrative
machinery than the Nagar Nigam; further, the authority in Nagar Nigam is fused
in its democratic setup while the JDA is highly centralised by the top rank
bureaucrat who enjoys the confidence of the CM. Urban management in the
Capital of Rajasthan is managed by the bureaucracy rather than by the democracy.
All evils of bureaucracy can be seen in this administrative institution, therefore,
urban management is administrative management of the JDA.
The byelaws relating to building construction, road designing, malls, commercial
complex, business centres, residential flats etc are made by the JDA’s bureaucracy
and enforced by it without any publicity, notifications and circulations. The Public
Relations office of the JDA is seemed more autocratic and non cooperative with the
public. Every task relating to regularisation of residential colonies is performed by
it but little work is seen with the masses. People are frustrated with the operating
system of the JDA. In the present IT time, old ways of writing everything in British
period registers, ledgers and records are still rigorously followed, a person has to
move at least 20 times from one desk to another desk than another desk for many
days, therefore, lot of crowd can be seen in the JDA building. Touters, middlemen,
suppliers are to operate conveniently in the corridors of the JDA and tasks are
performed by them more comfortably than yourself. The old British period system
of officers in their rooms with a peon posted outside their chambers can be seen
who (peons) are also serve as middlemen or touters in the offices. No modern
management techniques have been adopted, no modern information technology
adopted, no modern bureaucracy is seen and no modern procedures have been
introduced to serve the purpose of the urban management. Top rank officers are
found always busy in meetings either in the building or in secretariat or in
| 80 | The Administrator 56 (2) Dr. Pradeep K. Saxena | 81 |

up for the systemic changes like escalated roads, special economic Zones, new
constructions for old localities in the walled city, reconstructions of old
monuments, creation of modern sculptures, art and architecture, bazars, various
types of Mundy like vegetables, fruits, clothes, electronics etc. Many international
IT companies, games and sports brands, food chains and many international hotels
are looking to invest in India, but are hesitant as the bureaucratic attitude;
procedures and tactics are to exist. The state government should take a liberal and
open mind decision to develop a modern urban system in Rajasthan; Jaipur is a
most promising city for the international investors. The state government should
take the help of many residents of Jaipur particularly, jewellers, university
teachers, architectures, designers, historians etc and not to depend upon solely the
JDA Bureaucracy which has become redundant and old in its operation,
functioning, thinking and vision. Such time will not come back to Mrs. V. Rajes
government in Rajasthan because the public is critically watching the state
government.
Dr. Pradeep K. Saxena is a retired professor of Public Administration, University of Rajasthan. He is also an Emeritus Fellow and Senior Fellow at UGC and ICSSR respectively. He can be reached at saxenapradeep522@ gmail.com
administrative institutions are not required while there is constitutional elected
body of Municipal Corporation which is itself a government not an administrative
institution like JDA. The existence of JDA is to prove that India is an administrative
state and its democratic institutions even after 68 years of independence are weak,
incapable and inefficient. Further, such institutions like JDA are not in the
command of the elected representatives (since last so many years no Chairman of
the JDA has been appointed either by Congress or BJP government). It is also to be
noted that the Commissioner system of JDA is to increase bureaucratic procedures
and excess rather than service to the residents. In the last ten years, no systemic
changes have been brought in the JDA by enactment in the legislature. Basically,
JDA like institutions have become the instruments of CM’s power enhancement
and revenue generation. Multiplicity of urban bodies at the state level is itself a
problem and JDA like institutions are complicating the urban management.
Keeping aside these basic questions, it is also required to look into the functioning
of the JDA in land regularization task which is more difficult than people oriented
or urban development. Most of the Niyaman Camps are organized under the
pressure of the colonizers, colony samiti, or political persons. JDA itself is not to
initiate Niyaman camps. In the era of modern IT and various system of
communication like GPRS, Skype, websites etc, it looks that such things (Niyaman
camps) are obsolete or outdated or old things which can be replaced by many other
things. Look around the World, anyone can find that housing is basically governed
by the modern laws of the city and are not by bureaucratic discretion. In
developing urban housing system, many precautions like highways, roads,
industries, agriculture, connectivity, location etc. are important and a clear vision
of city is required. In India, most of cities/urban areas are being developed without
any vision, perspective, linkages etc. The wings of the city are increasing day-by-
day in any direction and no vision or action is there. Last but not least,
politicization of housing is a critical issue. In the housing sector, there is need of a
regulatory body to keep a watch on housing colony development and regulation.
The Tribunal system in JDA does not seem effective and dominated by the
bureaucratic perspective. Regularisation of land and houses are two different
things but are not treated different in Rajasthan. Regularisation of land is
considered as the regularization of house and land. The state government should
consider these issues seriously in order to provide better services to the people of
Rajasthan. The State government under the leadership of Mrs. V. Raje, with great
majority (169 out of 200 seats in State Vidhan Sabha) should take initiative to bring
systemic changes rather than to bring different laws, taxes and bureaucratic
organizations in the state. Cities should be designed in a more modern ways rather
than bureaucratic ways. The time has come as funding is not a problem to cities in
Rajasthan (ADB, WB, and many countries, organizations are providing lot of funds
to the state for urban development). Foreign direct investment in housing sector is
also coming from different ways, why the state is not preparing itself for gearing
| 82 | The Administrator 56 (2) Dr. Pradeep K. Saxena | 83 |
Von Einsiedel N. and Allport R. (1986) “An Innovative Approach to Metropolitan Management in the Philippines” in Public Administration and Development, Jan-March, John Wiley.
Wescott C. and Porter D. (2002) “Fiscal Participation and Citizen Participation in East Asia” in Inter-American Development Bank.
References
Ali, Hasnah (1999) “Municipal Solid Waste Management: An Experience with Minimisation of Household Solid Waste Generation in Malaysia”.
ADIPA Conference Paper, Bangkok.
Drakakis-Smith D. (1995), “Third World Cities: Sustainable Urban Development, Part I in Urban Studies 32(4-5).
H. De Soto (2000), “The Mystery of Capital: Why Capitalism Triumphs in the West and Falls Everywhere Else.”NY-Basic Books.
Heikkila, Eric J. (1999) “Sustainable Cities Indicators” Key note address in ADIPA Conference, Bangkok.
Kroukamp, Hendri (1999), “The Culture of Non-Payment of Services as a Constraint in Financial Policy Management for Local Authorities in South Africa”, ADIPA Conference Paper, Bangkok.
Kitano, Naohiro (1999), “Urban Development and Housing Sector in Vietnam”, ADIPA Conference Paper, Bangkok.
Lee, Yok-SHIU F. (1999), “Environmental and Infrastructure services in Asia”, ADIPA Conference Paper ,Bangkok.
Mattingly. M (1994), “Meaning of Urban Management”, in Cities 11(3).
Pinto,Rogerio F.(1999), “What Kind of Private and Non-Governmental Provision of Public services/Program Makes More Sense Politically and Economically?”, ADIPA Conference Paper ,Bangkok.
Poboon, Chamlong, “Is Bangkok’s Traffic Crisis Unavoidable” ADIPA Conference Paper, Bangkok.
Pruhome R. (1995), “Megacities Management: Institutional Dimensions in Megacities Management in the Asian and Pacific Region” ADB, Manila.
Srivarmakrishanan, K.C. and Green L. (1986), “Metropolitan Management: The Asian Experience”, Oxford Univ. Press.
Saxena, Pradeep (1999), “Urban Management in India: How far we succeeded?”ADIPA Conference Paper, Bangkok.
Saxena, Pradeep (1988), “Affordable Housing in India: Is it Possible?”
World Urban Development Forum Conference, San Antonio (USA) Conference Paper.
Saxena, Pradeep (1994) “Urban Management and Policy Designs: 74th Constitutional Amendment Implications” Toluka (Mexico) IIAS & IASIA Conference Paper.
Saxena, Pradeep (2014), “Institutional Reforms in India” in K.S. Chalam, “Governance in South Asia” Delhi: SAGE.
Saxena, Pradeep (2003), “Politics of Democratic Decentralisation in Developing Countries: Lessons from India” International Journal of Policy Evaluation & Management, Vol. I No. I, Seoul (South Korea).
SU, Chun-Pin, (1999), “The Decentralisation and Reforms of Local Governments in Japan and Taiwan” Adipa Conference Paper, Bangkok.
Von Einsiedel N. (1995) “Asia’s Megacities: The Management Challenge of the 21st century” ADB seminar on Megacities, Manila.
| 84 | The Administrator 56 (2) Dr. Pradeep K. Saxena | 85 |