Final Technical Report of SP2 Freight Submission date: 05...
76
D3.1.1 – Review of existing practices to improve capacity on the European rail network CAPACITY4RAIL SCP3-GA-2013-605650 Final Technical Report of SP2 Freight Submission date: 05/10/2017 Deliverable 24.4
Transcript of Final Technical Report of SP2 Freight Submission date: 05...

D3.1.1 – Review of existing practices to improve
capacity on the European rail network
CAPACITY4RAIL
SCP3-GA-2013-605650
Final Technical Report of
SP2 Freight
Submission date: 05/10/2017
Deliverable 24.4

D24.4 – Final Technical Report of SP2 Freight
CAPACITY4RAIL
SCP3-GA-2013-605650
CAPACITY4RAIL PUBLIC Page 2
Lead contractor for this deliverable:
• UNEW
Contributors:
• Trafikverket
• KTH
• DICEA
• NEWOPERA
Project coordinator
• International Union of Railways, UIC

D24.4. Final Technical Report of SP2 Freight
CAPACITY4RAIL SCP3-GA-2013-605650
30/09/2017
CAPACITY4RAIL PUBLIC Page 2
Revision Date Description
Final 2017-09-30 Final version
Reviewed YES
Foreword
The “Final Technical Report” is a synthesis report for the Work Package 24 under ‘SP2 Freight’ of Capacity4Rail of project. The project is financed by the EU and is organized into six SPs and many Work Packages. As a synthesis report, it has taken main outputs from WP21, WP22, WP23 and WP24 with the active contribution from the following organizations and persons:
1. UNEW Dr Dewan Islam [email protected]
2. UNEW Clare Woroniuk [email protected]
3. Bo-Lennart Nelldal [email protected]
4. DICEA Stefano Ricci [email protected]
5. DICEA Marco Antognoli [email protected]
6. NEWOPERA Armand Toubol [email protected]
7. Trafikverket Micael Thunborg [email protected]
All these organizations and people have contributed to the report in different capacity, but other people (e.g. participants in the online survey) and organizations (e.g. UIC, the Project Coordinator, Trafikverket as SP2 Leader) involved have contributed in some ways as well.
Dr Dewan Islam, UNEW , has been the leader for this WP24 and was responsible for synthesizing and editing the report. The work has been very interesting with many fruitful findings from the four work packages and survey findings on the market up-take of the Rail Freight System of the Future. I wish to thank all members of the project team and those who have made other contributions for their excellent cooperation.
Dr Dewan Islam, Newcastle University, 29 September 2017
D24.4. Final Technical Report of SP2 Freight
CAPACITY4RAIL SCP3-GA-2013-605650
30/09/2017
CAPACITY4RAIL PUBLIC Page 3
Table of content
1 Table of Figures ............................................................................................................................... 5
2 Table of Tables ................................................................................................................................. 5
3 Executive Summary ......................................................................................................................... 7
4 Requirements toward the freight system of 2030-2050 ................................................................. 9
4.1 Introduction ............................................................................................................................. 9
4.2 Future demand and the market’s requirements ................................................................... 10
4.3 Core network and capacity for freight .................................................................................. 11
4.4 Technical and operational development ............................................................................... 13
4.5 More efficient inter modal systems ...................................................................................... 16
4.6 A sustainable wagon load system ......................................................................................... 20
4.7 The most important needs for development ........................................................................ 21
5 Novel rail vehicles .......................................................................................................................... 23
5.1 Introduction ........................................................................................................................... 24
5.2 Market and transport decision makers requirements .......................................................... 24
5.3 Main Innovations proposed .................................................................................................. 25
5.3.1 Wagon Design ................................................................................................................ 25
5.3.2 Train Equipment ............................................................................................................ 27
5.3.3 Train connectivity .......................................................................................................... 28
5.3.4 Train operation equipment ........................................................................................... 31
5.4 Impacts, Prioritization, Roadmap for deployment ................................................................ 33
6 Co-modal transhipment and interchange/logistics ....................................................................... 36
6.1 Introduction ........................................................................................................................... 36
6.2 Definition of Future scenarios ............................................................................................... 37
6.3 Analysing the effects of innovative technologies and operational measures ...................... 40
a. Rail-Road: inland freight interchanges ...................................................................................... 40
b. Rail-Sea: containers port terminals ........................................................................................... 43
c. Rail-Rail: marshalling yards........................................................................................................ 44
6.4 business cases and cost-benefit analyses ............................................................................. 45
d. Financial feasibility analysis ....................................................................................................... 45
e. Cost-benefit analysis ................................................................................................................. 46
7 Long Term Comprehensive Network ............................................................................................. 47
7.1 Key Innovation Processes, Technologies related to a long term comprehensive network .. 47
D24.4. Final Technical Report of SP2 Freight
CAPACITY4RAIL SCP3-GA-2013-605650
30/09/2017
CAPACITY4RAIL PUBLIC Page 4
7.2 Industry Survey- Long Term Comprehensive Network ......................................................... 48
7.2.1 industry survey results & recommendations ................................................................ 48
8 Traffic management systems ........................................................................................................ 51
8.1 Key Innovation Processes &Technologies for Traffic Management Systems ....................... 51
8.2 Industry Survey- RAIL Traffic Management System .............................................................. 52
8.2.1 Industry Survey Results & Recommendations .............................................................. 52
9 Multimodal Transport Information ............................................................................................... 56
9.1 Key Innovation Processes & Technologies in Multimodal Transport Information................ 56
9.2 Barriers to an EU Multimodal Transport Information system............................................... 58
9.3 Industry Survey- Multimodal Transport Information ............................................................ 59
9.3.1 Industry Survey Results & Recommendations .............................................................. 59
9.4 summary of the Main Findings from WP24 .......................................................................... 62
10 MAIN FINDINGS ON STANDARDS .............................................................................................. 65
10.1 Proposed standards for wagons, locomotives, gauge, infrastructure design, train management, infrastructure management ....................................................................................... 65
10.2 Review of the impact on the technical standards for interoperability ................................. 69
10.3 Summary on standards .......................................................................................................... 69
11 Summary and Conclusion .......................................................................................................... 70
12 Appendix .................................................................................................................................... 73
13 References ................................................................................................................................. 74

D24.4. Final Technical Report of SP2 Freight
CAPACITY4RAIL SCP3-GA-2013-605650
30/09/2017
CAPACITY4RAIL PUBLIC Page 5
1 Table of Figures
Figure 1Development of rail market share 1995-2014 for freight (left) and passenger (right) transports in EU 15, west Europe, and in EU 13, eastern Europe and total in EU28. Source: EC (2016) statistics, processed by KTH. ................................................................................................................. 10 Figure 2Left: Rail Freight Corridors in Europe. Right: High Speed Rail network in Europe ................... 12 Figure 3 Principles for optimising wagons, trains and infrastructure ................................................... 13 Figure 4 System change for inter modal: Horizontal transfer equipment to handle containers under the contact wire. The terminal can be on a siding and the train can make short intermediate stops at many stations. The market will be wider and the feeder distances shorter. Source KTH. ................... 19 Figure 5Most of the trailers are not liftable, therefore roll-on off/roll on technique is an alternative. Left: The Modalohr system with special ramps on each wagon. Middle: Trailer Trains only need a ramp at the end of the train but a low wagon and a high loading gauge. Righ a Trailer Train are more space efficient than a train with a pocket wagon. Source KTH in Capacity4Rail Deliverable D23.2. .... 19 Figure 6 Conventional hub and spoke system (left) and liner system with the same market (right). Source: Efficient train systems for freight transport - A systems study, KTH Railway Group 2005. ..... 19 Figure 7Capacity gains for different freight train measures. Source: TRANSFORUM freight road map (Nelldal 2014). ....................................................................................................................................... 23 Figure 8 Reduction of transportation costs depending on different measures for rail freight. Extended train length from 650 to 750 m will reduce the cost for long haul by 6 % for trainload and taken terminal- and feeder transports into account by 4 % for wagon load and intermodal. Higher axle load from 22.5 to 25 ton will reduce the cost by 10% for heavy freight and extended loading gauge from G2 to GC by 25%. Reduction of terminal costs for 30 to 10 € per container will reduce the door to door cost by 15% for intermodal. Source KTH cost models. ................................................................. 23 Figure 9 Introduction of 45’ container on a train composed of standard wagons for 40’ containers . 26 Figure 10 5 bodies- wagons with 6 axel for finished cars ..................................................................... 26 Figure 11 12 axel wagons with 5 bodies for 45’ containers or 40’ containers with 4 Jacobs bogies ... 26 Figure 12EOT device to be placed at the end of the train Source Freinrail (Knorr- Bremse) ............... 28 Figure 13EOT impact on LCF for a train of 750m .................................................................................. 28 Figure 14 MESH Network for Smart Boxes concentrating Devices informations ................................ 30 Figure 15 Road-Rail engine for last mile and private sidings operations .............................................. 31 Figure 16 Level of importance of 3PL operating train services ............................................................. 49 Figure 17 Level of confidence in deployment of ERTMS level 2 EU wide by 2030. .............................. 53 Figure 18 Level of confidence in ERTMS level 3 deployment EU wide by 2030 .................................... 54 Figure 19 Simplified overview of data flow at a combined terminal .................................................. 57 Figure 20 DATA LABELS ON A TYPICAL MULTIMODAL TRANSPORT UNIT ............................................. 58 Figure 21 Respondent awareness of online brokerage systems ........................................................... 59 Figure 22 Level of Information Sharing in a potential online database ................................................ 60
2 Table of Tables
Table 1 Today´s and future transport networks in Europe. .................................................................. 12 Table 2 Key Factors by Market segment defined by type of Transport ................................................ 25 Table 3 LPWAN Characteristics ............................................................................................................. 30

D24.4. Final Technical Report of SP2 Freight
CAPACITY4RAIL SCP3-GA-2013-605650
30/09/2017
CAPACITY4RAIL PUBLIC Page 6
Table 4 Standards proposed in the various fields ................................................................................. 34 Table 5 Possible timing for Market Uptake ........................................................................................... 35 Table 6 INNOVATIVE OPERATIONAL MEASURES AND TECHNOLOGIES INCLUDED IN SCENARIOS FOR MUNICH RIEM ....................................................................................................................................... 38 Table 7 INNOVATIVE OPERATIONAL MEASURES AND TECHNOLOGIES INCLUDED IN CONSOLIDATED SCENARIO FOR ANTWERP COMBINANT, HUPAC AND ZOMERWEG ..................................................... 39 Table 8 INNOVATIVE OPERATIONAL MEASURES AND TECHNOLOGIES INCLUDED IN SCENARIOS FOR VALENCIA PRINCIPE FELIPE ................................................................................................................... 39 Table 9 INNOVATIVE TECHNOLOGIES INCLUDED IN SCENARIOS FOR HALLSBERG ............................... 40 Table 10 MUNICH RIEM TERMINAL KPIS RESULTS ................................................................................ 41 Table 11 ANTWERP COMBINANT TERMINAL KPIS RESULTS ................................................................. 41 Table 12 ANTWERP HUPAC TERMINAL KPIS RESULTS ........................................................................... 42 Table 13 ANTWERP ZOMERWEG TERMINAL KPIS RESULTS .................................................................. 42 Table 14 INTERMODAL RAIL - ROAD LINEAR TERMINAL KPIS RESULTS ................................................ 43 Table 15 VALENCIA PRINCIPE FELIPE KPIS RESULTS .............................................................................. 44 Table 16 HALLSBERG MARSHALLING YARD KPIS RESULTS .................................................................... 45 Table 17 TOTAL RESPONSES ASSIGNED TO EACH ASPECT OF THE BIG DISRUPTION PROCESS ............ 55 Table 18 Weighted ranking of most critical aspects of the big disruption process .............................. 55 Table 19 Timing for potential market update of different innovations ................................................ 67 Table 20 Standards proposed in the various fields ............................................................................... 68 Table 21Today´s common standard, incremental change and system change. Source: D21.2 ............ 73

D24.4. Final Technical Report of SP2 Freight
CAPACITY4RAIL SCP3-GA-2013-605650
30/09/2017
CAPACITY4RAIL PUBLIC Page 7
3 Executive Summary
On 28 March 2011 the European Commission (EC) published a White Paper entitled “Roadmap to a
Single European Transport Area – Towards a competitive and resource efficient transport system”.
The EC has a vision of a long-term-sustainable transport system with the aim of attaining the goals
set for reducing the transport sector’s emissions. Important goals and measures for the rail mode
are:
• 30% of road freight over 300 km should shift to other modes such as rail or waterborne
transport by 2030, and more than 50% by 2050, facilitated by efficient, green freight corridors.
• By 2050, a European high-speed rail network should be completed. Triple the length of the
existing high-speed rail network by 2030 and maintain a dense railway network in all Member
States. By 2050, the majority of medium-distance passenger transport should go by rail.
The aforesaid EC goals for a competitive and resource efficient transport system have been well documented, with modal shift targets and necessary measures for rail emphasized. To achieve these goals, the challenges identified in the White Paper includes;
Traffic Management
• Development of new technologies for vehicles and traffic management to contribute towards lowering EU transport emissions.
• An increase in efficiency through the improvement of traffic management and information systems
• A decrease in last mile freight journeys, employing intelligent transport systems to reduce delivery times and decrease last mile congestion.
EU wide high-speed network
• An increase in the operation of high speed rail services- it is anticipated that high-speed rail will absorb much of the medium distance traffic.
• Enhancement of infrastructure, an increase in high-speed services will require support from an adequate high-speed network.
Freight, modal shift from road to rail
• Encourage the shift of freight volumes over 300km to more sustainable modes such as rail and waterborne. (30% by 2030 and 50% by 2050).
• Infrastructure investment to accommodate modal shift to rail.
• Development of rolling stock including brakes and automatic coupling.
Multimodal TEN-T core network
• Optimisation of multimodal logistics chains
• Increase in the consolidation of large freight volumes together with an increase in freight multimodal solutions, enhancing the use of waterborne and rail for long haul.
• The development of freight corridors offering reliability, high capacity and low costs leading to optimised energy use, decreased emissions, minimised environmental impacts by shift from road to rail on longer distances
Long-term comprehensive network
• Equal enhancement of non-core infrastructure across Eastern and Western EU.

D24.4. Final Technical Report of SP2 Freight
CAPACITY4RAIL SCP3-GA-2013-605650
30/09/2017
CAPACITY4RAIL PUBLIC Page 8
Multimodal Transport Information
• Development of information technology to enhance more reliable multimodal transfers.
• By 2020, establish a framework for European multimodal transport information, management and payment system.
This deliverable will produce the Final Technical Report of SP2 Freight. In doing so, we will synthesise and consolidate all the findings, conceptual designs, technical and operational developments produced so far, as a result of our collaborative work under SP2. This includes material from; Progress Beyond State of the Art, Novel Rail Freight Vehicles, Co-modal transshipment and interchange/logistics, assessment of potential market uptake of new designs through an industry survey, proposal of standards for fully integrated rail freight systems.
Following consolidation of the rail freight system designs developed during the course of ‘SP2 freight’, the remaining technological innovations required to meet the White Paper challenges will be identified.

D24.4. Final Technical Report of SP2 Freight
CAPACITY4RAIL SCP3-GA-2013-605650
30/09/2017
CAPACITY4RAIL PUBLIC Page 9
4 Requirements toward the freight system of 2030-2050
4.1 INTRODUCTION
On 28 March 2011 the European Commission published a White Paper entitled “Roadmap to a Single
European Transport Area – Towards a competitive and resource efficient transport system”. The EC
has a vision of a long-term-sustainable transport system with the aim of attaining the goals set for
reducing the transport sector’s emissions. Important goals and measures for the rail mode are:
- 30% of road freight over 300 km should shift to other modes such as rail or waterborne
transport by 2030, and more than 50% by 2050, facilitated by efficient, green freight corridors.
- By 2050, a European high-speed rail network should be completed. Triple the length of the
existing high-speed rail network by 2030 and maintain a dense railway network in all Member
States. By 2050, the majority of medium-distance passenger transport should go by rail.
The consequences for the transport sector and especially for rail of this target are important and we
will try to quantify the demand for rail when this is implemented. There are at least three critical
questions for the rail sector:
• How can rail offer the quality that is needed to attract customers to fulfil the targets?
• How can rail offer its customers a price that is competitive with road?
• How can rail offer the capacity to meet the demand from a modal shift?
In this report, we will try to determine how to develop the rail system from a technical and operational
point of view to fulfil the targets from today and beyond state of the art.
The main objective of this work package WP2.1 is:
• To describe today’s and future demand for rail freight through existing forecasts and describe
scenarios for freight flows up to 2050
• Analyse existing and expected future customer requirements for different goods segments
• Analyse beyond state of the art for vehicles, intermodal systems and operation principles and
identify gaps that remain to be successively bridged up to 2030/2050.
• To specify the requirements an efficient freight rail freight system by 2050 that can fulfil the
EU targets
The scope of this work has been to report the most important trends in freight rail demand, customer
requirements and technical and operational development. Then we intend to evaluate these trends
and conclude what is the most important development and if something is missing to reach the EU
target by 2030 and 2050. This will be input to the other projects.

D24.4. Final Technical Report of SP2 Freight
CAPACITY4RAIL SCP3-GA-2013-605650
30/09/2017
CAPACITY4RAIL PUBLIC Page 10
4.2 FUTURE DEMAND AND THE MARKET’S REQUIREMENTS
The market share for rail freight has decreased in last decades in EU28 but stabilized over the last 5
years. In EU15 it has increased slightly but in EU13 it has continue to decrease but is still a little bit
higher than in EU15. In more deregulated countries, like in Germany, UK, Austria and Switzerland and
Sweden it has increased or remained stable at a high level. This is partly due to new private companies
entering the market but also to a more efficient state railway as a result of deregulation. In some
countries, truck-fees and investments in rail may also have affected the modal split.
For passenger transport, rail has increased its market share as well in EU15 as in EU28. However in EU
13 it is still decreasing and the market share is now lower than in EU15, se figure 1. To some extent,
the explanation is a fast-growing private car ownership but it is also due to lack of investment and
deregulation of rail. In countries which have invested heavily in rail infrastructure or in new trains, rail’s
market share has gradually increased. This is the situation in France, Sweden, the UK, Austria and
Switzerland.
Two targets in the EU White Paper at 2011 was that 30% of road freight over 300 km should shift to
other modes such as rail or waterborne transport by 2030, and to triple the length of the existing high-
speed rail network by 2030. The development of freight is not in line with the target and at present
there are no indications that it will be fulfilled. For high speed rail the target seems to be achievable.
Rail deregulation has not been implemented in practice in all countries while at the same time truck
deregulation has been implemented fully and resulted in a low-cost truck market, which sometimes is
totally unregulated. At the same time rail deregulation has resulted in more bureaucracy for rail
leading to additional costs. New operators often compete more with other rail operators than with
truck. The market prices have been lowered and many freight rail operators are not profitable enough
to develop the systems. The question is how to reverse the development so rail really can make a
contribution to solve the climate crises.
FIGURE 1DEVELOPMENT OF RAIL MARKET SHARE 1995-2014 FOR FREIGHT (LEFT) AND PASSENGER (RIGHT) TRANSPORTS IN EU 15,
WEST EUROPE, AND IN EU 13, EASTERN EUROPE AND TOTAL IN EU28. SOURCE: EC (2016) STATISTICS, PROCESSED BY KTH.

D24.4. Final Technical Report of SP2 Freight
CAPACITY4RAIL SCP3-GA-2013-605650
30/09/2017
CAPACITY4RAIL PUBLIC Page 11
The customer’s requirements
Customer needs can be summarized in a few points: a competitive cost for a reliable service that is
easy to access and gives accurate information about the Estimated Time of Arrival (ETA) in real time,
and can react quickly to variations in volume, more precisely (Spectrum 2012 and others):
• Reliability of service: rail transit time and frequency have to be competitive with road.
However, consistently and unfailingly reliable transport (i.e. arriving at the agreed time) is for
many shippers even more important than the transit time itself.
• Costs of door-to-door delivery: if the quality targets are fulfilled there is often tough
competition on lowest cost. Rail must be competitive with road transport throughout the
transport chain.
• Service availability: service availability at the origin point seems to be only slightly more
important than at the destination point.
• Safety and security: reducing the chance of losses, theft and damage. This is especially
important for the transport of high value goods.
• Environmentally friendly transport: Many customers want environmentally friendly
transportation but are unwilling to pay so much more for it, but here rail has an advantage.
Current logistics trends are outsourcing, offshoring and centralisation. The resulting design of the
logistics network is mainly based on a cost perspective. Outsourcing of production activities means to
subcontract a process to a third-party who can take advantage of economies of scale. Offshoring
describes the dislocation of a production activity to a far-distant country in order to reduce operational
costs. Physical centralisation means that the number of production, procurement or distribution sites
is reduced, whereby the main goal is to pool risk, reduce inventory and exploit economies of scale. For
instance, offshoring leads to a reduction of total logistics costs by 25-40%. But important “soft” factors,
like delivery time, flexibility and risks of a logistics network can lead to a considerable reduction of this
cost advantage. Furthermore, stricter regulations and increased awareness of customers with respect
to the environment support a reconsideration of a company’s strategy.
4.3 CORE NETWORK AND CAPACITY FOR FREIGHT
The future demand for freight will be very much dependent on whether the White Paper targets will
be fulfilled. If so, the demand for freight will de 3-4 times as great as today and at the same time
passenger demand will also increase in the same order.
Figure 2 shows the planned rail freight corridors to the left and the planned High Speed Rail lines (HSL)
and other fast connections to the right. As can be seen, there are great similarities between the freight
and passenger networks, because demand for both passenger and freight is high in these corridors.
The EU’s target in the 2011 White Paper was to triple the HSL network by 2030. If we take the HSL lines
in 2010, figures that were available when the White Paper was published, it was 6,161 km, triple this,
we will get 18,483 km. In November 2016 the HSL in service has increased to 8,269 (UIC 2016) and
2.677 km were under construction most of them until 2020, a total of 10,946. Moreover 11,605 km
were indicated as planned in short or long term with variety of time frames. In total this will sum up to
22,551 km, see table 1. This means that if the construction of HSL will continue and 65% of the plans
will be realized the EU target of approximately 18,500 km of HSL in 2030 seems to be realistic.

D24.4. Final Technical Report of SP2 Freight
CAPACITY4RAIL SCP3-GA-2013-605650
30/09/2017
CAPACITY4RAIL PUBLIC Page 12
If the planning and building of HSL continues at the same yearly rate between 2030 and 2050 as
between 2016 and the EU-target for 2030, there will be another 11,275 km of HSL in Europe by 2050
and a total of 33,000 km HSL-lines. If this is implemented it is also positive for freight because removing
the fastest trains from the conventional lines will free capacity for freight trains and regional trains. It
is however important that capacity be reserved for future demand for freight trains and not from the
beginning be fully occupied by regional trains even if this is possible at present.
The six first rail freight corridors have a length of 13,505 km and together with the three that have also
been proposed, the length of the RFCs will be approximately the same as the planned HSR in 2025
(approx. 18,000 km, table 1). However, no common investment programme exists for the rail freight
corridors and no common target to increase the standard.
TABLE 1 TODAY´S AND FUTURE TRANSPORT NETWORKS IN EUROPE.
FIGURE 2LEFT: RAIL FREIGHT CORRIDORS IN EUROPE. R IGHT: H IGH SPEED RAIL NETWORK IN EUROPE
Infrastructure At year Km % of tot Infrastructure At year Km % of tot
Railways Roads
Total km in EU 28 2014 220 673 100% All roads approx. 2013 5 000 000 100%
Electrified 2014 115 068 52% Motorways 2013 74 341 1,5%
High-speed Rail
High-speed in service 2016 8 269 4%
Incl. under construction 2016 10 946 5% EU-target in white paper: Triple HSR from 2010 to
Incl. planned to ca 2035 22 551 10% 2030 = 3x6,160 km (length 2010)=18,483 km o.k.
Estimated projection to 2050 33 826 15%
Rail freight Corridors Inland waterways and pipelines
The 6 first RFC 2013 13 505 6% Inland waterways 2013 42 043
The 9 RFC estimated 2015 18 000 8% Pipelines 2013 36 814

D24.4. Final Technical Report of SP2 Freight
CAPACITY4RAIL SCP3-GA-2013-605650
30/09/2017
CAPACITY4RAIL PUBLIC Page 13
4.4 TECHNICAL AND OPERATIONAL DEVELOPMENT
A system approach of infrastructure, wagons and trains
The development of freight rail must have as its starting point optimised freight transportation on the
basis of a system view of the railways: from the customer’s transportation needs that put demands on
the wagons – the wagons are coupled together into trains where available tractive power is taken into
account – the train utilises the infrastructure with a certain performance along a link and ultimately in
a network from origin to destination, se figure 3.
FIGURE 3 PRINCIPLES FOR OPTIMISING WAGONS, TRAINS AND INFRASTRUCTURE
The most important customer needs are sufficient quality and low cost. Then it is also an advantage if
the transport solution is environmentally friendly. The technical development must therefore lead to
lower cost and higher capacity. Higher capacity often also leads to lower cost, energy consumption
and GHG emissions in the rail system. But it is also important that the rail system can increase market
share and by this reduce energy consumption in the transport system as a whole. The rail system can
be improved by a combination of these measures:
• The line capacity – the infrastructure:
o the track system
o the signalling system
The train capacity by the locomotives and the wagon performance
• The locomotives:
o Higher tractive effort
o Higher axle load and adhesive weight
o Duo-locomotives with both electric and diesel traction
• The train capacity by improved wagons:
o Higher axle load and meter load
o Extended gauge
o Better length utilization
D24.4. Final Technical Report of SP2 Freight
CAPACITY4RAIL SCP3-GA-2013-605650
30/09/2017
CAPACITY4RAIL PUBLIC Page 14
o Lighter wagons
o Higher speed
o More track friendly running gear
o Electronic braking systems
o Automatic couplers
• Information systems, interoperability and deregulation
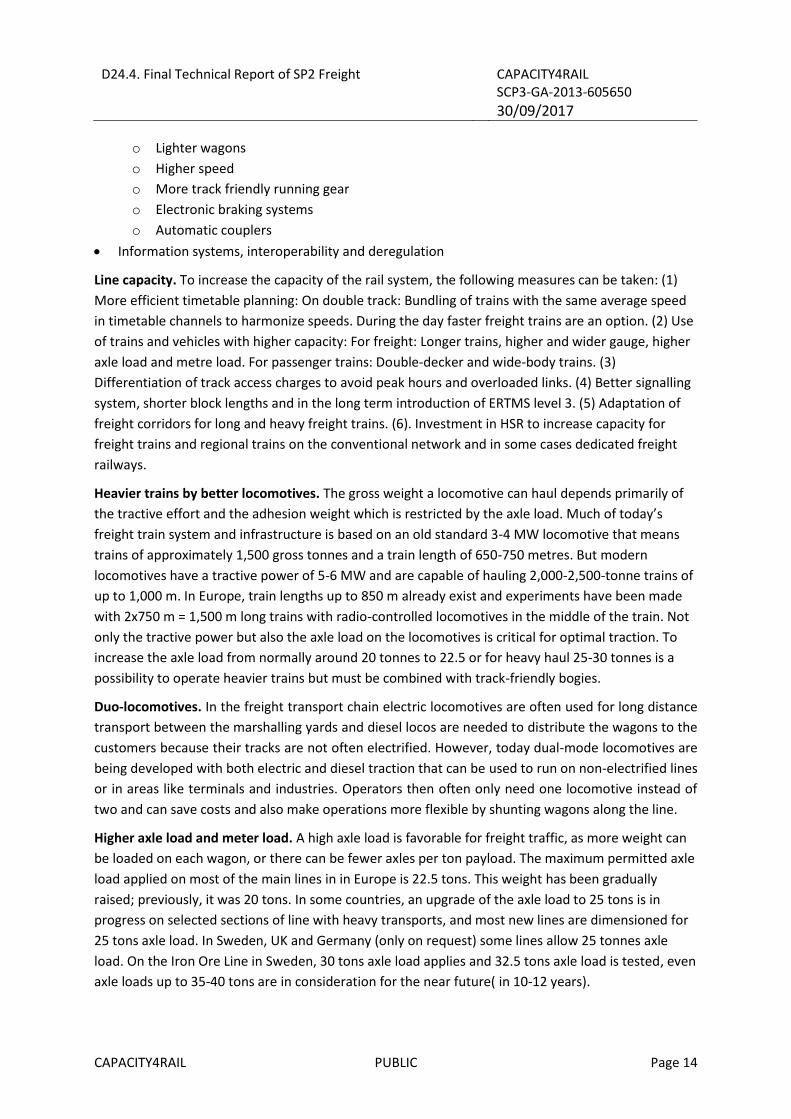
Line capacity. To increase the capacity of the rail system, the following measures can be taken: (1)
More efficient timetable planning: On double track: Bundling of trains with the same average speed
in timetable channels to harmonize speeds. During the day faster freight trains are an option. (2) Use
of trains and vehicles with higher capacity: For freight: Longer trains, higher and wider gauge, higher
axle load and metre load. For passenger trains: Double-decker and wide-body trains. (3)
Differentiation of track access charges to avoid peak hours and overloaded links. (4) Better signalling
system, shorter block lengths and in the long term introduction of ERTMS level 3. (5) Adaptation of
freight corridors for long and heavy freight trains. (6). Investment in HSR to increase capacity for
freight trains and regional trains on the conventional network and in some cases dedicated freight
railways.
Heavier trains by better locomotives. The gross weight a locomotive can haul depends primarily of
the tractive effort and the adhesion weight which is restricted by the axle load. Much of today’s
freight train system and infrastructure is based on an old standard 3-4 MW locomotive that means
trains of approximately 1,500 gross tonnes and a train length of 650-750 metres. But modern
locomotives have a tractive power of 5-6 MW and are capable of hauling 2,000-2,500-tonne trains of
up to 1,000 m. In Europe, train lengths up to 850 m already exist and experiments have been made
with 2x750 m = 1,500 m long trains with radio-controlled locomotives in the middle of the train. Not
only the tractive power but also the axle load on the locomotives is critical for optimal traction. To
increase the axle load from normally around 20 tonnes to 22.5 or for heavy haul 25-30 tonnes is a
possibility to operate heavier trains but must be combined with track-friendly bogies.
Duo-locomotives. In the freight transport chain electric locomotives are often used for long distance
transport between the marshalling yards and diesel locos are needed to distribute the wagons to the
customers because their tracks are not often electrified. However, today dual-mode locomotives are
being developed with both electric and diesel traction that can be used to run on non-electrified lines
or in areas like terminals and industries. Operators then often only need one locomotive instead of
two and can save costs and also make operations more flexible by shunting wagons along the line.
Higher axle load and meter load. A high axle load is favorable for freight traffic, as more weight can
be loaded on each wagon, or there can be fewer axles per ton payload. The maximum permitted axle
load applied on most of the main lines in in Europe is 22.5 tons. This weight has been gradually
raised; previously, it was 20 tons. In some countries, an upgrade of the axle load to 25 tons is in
progress on selected sections of line with heavy transports, and most new lines are dimensioned for
25 tons axle load. In Sweden, UK and Germany (only on request) some lines allow 25 tonnes axle
load. On the Iron Ore Line in Sweden, 30 tons axle load applies and 32.5 tons axle load is tested, even
axle loads up to 35-40 tons are in consideration for the near future( in 10-12 years).

D24.4. Final Technical Report of SP2 Freight
CAPACITY4RAIL SCP3-GA-2013-605650
30/09/2017
CAPACITY4RAIL PUBLIC Page 15
A high permitted linear load is important for freight with high density, and allows for high loading
factors on shorter wagons. A high linear load is important for efficiency, especially for ore, steel and
paper product industry transports.
Extended gauge. A larger loading gauge is at least as important as a higher axle load/weight per
metre and the greatest effect is often obtained by combining the two. The loading gauge in Europe
varies very much. One standard is G1/UIC 505-1 also known as the Berne Gauge which is 3.150 x
4.280 (m width x height). In U.K. the loading gauge is smaller than in the European continent. On the
contrary, in Sweden, a very generous loading profile (C) has been introduced which is 3.600 x 4.830.
On many lines, it has proven to be possible to enlarge the loading gauge by relatively simple means.
For trailer transportation, it is very important to have a high rectangular loading gauge by removing
the bevelled corners. In the continent of Europe, truck height of 4.00 metre is common and a loading
gauge of P/C 400 is preferable which can load a 4.00 m high trailer on a low floor pocket wagon.
Better length utilization. The length utilization of wagons and trains can be improved. One example
is the VEL wagon which is a 24m long wagon with two bogies that can load two 40 ft containers or
other combinations of unit loads on an 80 ft loading area. It implies better loading factors of trains,
10% more TEU per length on fewer axles, and thus lower energy consumption, less maintenance and
lower transport cost.
In WP2.2 new wagon concepts with better length utilization has been developed. The 6-axle car
transport wagon is the most efficient with 9% better length utilization than a conventional 3 or 4-axle
wagon. The 12-axle wagon for five 45 foot containers will improve the capacity with 3 % compared
with a 6-axle wagon for two containers. Other measures are short-coupled wagons with draw-bars or
automatic couplers without buffers.
Lighter wagons. By using high sustainable steel and make the wagon lighter it is possible to increase
the payload. If the tare weight of the 4-axle freight wagon will decrease from 26 to 24 tons, the cost
per ton kilometre will decrease by 3.5% and the capacity of the train will increase by 3.1% in a 2000
ton train.
Higher speed. To reach a higher average speed it is most important is to avoid stops for overtaking
by passenger trains and stops at borders and marshalling yards. By higher top speed it is possible to
avoid overtaking especially on day time and often possible to get one more turn of a trainset or
locomotive per day. Many wagons and most freight locomotives are prepared for 120 km/h top
speed, so this may be the next step in increasing speed for some freight trains. The step to 140-160
km/h is more demanding because there is a request for more advanced braking systems, i.e. disc-
breaks.
More track friendly running gear. The dynamic stresses when running the freight trains are the
dimensioning factors and these can be reduced using modern wagons. Better running gear with “soft”
running gears and better checks and measuring methods might allow higher axle loads to be permitted
on existing track, though perhaps with certain restrictions.
Longer trains. The train lengths in Europe varies and has successively been increased. The normal
maximum train lengths in Europe are 550-750 m. There are exceptions, some lines in Denmark and
France allows 835-850 m long trains. 1,050 m long trains has been tested in Netherlands and Germany

D24.4. Final Technical Report of SP2 Freight
CAPACITY4RAIL SCP3-GA-2013-605650
30/09/2017
CAPACITY4RAIL PUBLIC Page 16
at the Betuwe line. In the Marathon project trains of 2x750 = 1,500 m has been operated as an
experiment in France. In US train lengths of 2,000-3,000 m are common but the operational
prerequisites are different compared with Europe. Train lengths of 740 – 1,050 m has been
recommended in Europe in TSI and for building of new lines and on the TEN-T network 740 m train
lengths has been stipulated to be introduced until 2030.
By lengthening the train to 1,050 m incl. the locomotive with freight wagons weighing around 2 tonnes
per metre like inter modal, a train of 1,050 m weight ≈2,000 tonnes. This can be hauled by one modern
high power 4-axle locomotive and is thus optimal from an economic point of view. The capacity will
increase by 76 % compared with a 650 m long train and the cost will decrease with 21 % for a 1,050 m
train with one loco.
Electronic braking systems. The problem with the conventional air brakes in rail is that the brake
propagates from the locomotive and it takes some time to reach the last wagon. EOT brake the last
wagon at the same time as the first. It is a portable unit which hung on the last wagon. EP is a wire-
or wirelessly-controlled braking device on the wagon which brake all wagons at simultaneously. The
advantages of EOT and EP are:
• Shorter braking distance which can increase the line capacity
• Smoother braking which lower maintenance costs for wheels on wagons
• Easier to operate longer trains and reduced forces between wagons
Automatic couplers. The most important advantages with automatic couplers are that they:
• allows higher tractive power and compressive forces in curves and less risk of derailment
• permits heavier and longer trains and higher speed by that higher transportation capacity
• coupling of electric/signalling line opens up for EP brakes and intelligent freight trains
• decrease the need for staff in shunting and marshalling movements and by that the costs
• decrease the risk for the staff to be injured during the shunting work
• make it possible to introduce new traffic concepts i.e. liner trains with coupling and
uncoupling wagons on intermediate stations and sidings and by that the revenues
The problem to implement the automatic couplers in Europe is that all railway companies must agree
and that it is hard to finance in a business with low profitability. Starting by fitting the equipment on
captive fleet of wagons dedicated to regular flows of traffics on fixed routes could enable to
demonstrate all direct and indirect benefits linked to automatic couplers and thus raise the interest of
stakeholders to reach a common agreement across Europe.
4.5 More efficient inter modal systems
Conventional large end-point terminals are relatively expensive, as regards both investment and
operation costs. On the other hand, they can handle all types of loading units (LUs) and have a high
handling capacity. However, because they use gantry cranes or reach stackers with top lift, they cannot
be electrified and trains must be shunted by diesel locomotives. Furthermore, several tracks are for
parking wagons waiting to be loaded and unloaded. The consequence is that they cover a relatively
large area, where reach stackers and other lifts for high axle loads operate. Large intermodal terminals

D24.4. Final Technical Report of SP2 Freight
CAPACITY4RAIL SCP3-GA-2013-605650
30/09/2017
CAPACITY4RAIL PUBLIC Page 17
are therefore cost- and space-intensive and the cost per LU handled, is relatively high even with large
freight volumes.
There are different methods to make terminal access easier with electric hauled trains. One is to let
the train roll through the terminal with pantograph in down position. Another is to have an electrified
section to the border of the terminal so the loco can push the train to loading position. However, in
the latter case the loco must change place first. A third method is to use duo-locomotives which both
have electric and diesel propulsion.
Linear trains with horizontal transfer. A liner traffic terminal is located on a track siding, where the
train can drive straight in and out onto the line again, see figure 4. The electrified track does not require
switching the train in which in turn requires a handling technology that can function under the
overhead contact wires. The train must be able to be loaded and unloaded during a stop of 15-30
minutes, which obviates the need to park wagons. The terminals can be more compact and with the
horizontal transferring system do not need dimensioning for high axle loads. They require less space
and will be more cost-effective than conventional terminals and the following is achievable in the
logistics system:
• Containers and swap-bodies can be reloaded under a live catenary;
• The terminal can be located on a siding where the train will make a short stop for transhipment;
• No requirement for a diesel shunting engine to handle the train at the terminal;
• No need to park wagons and the terminal can be very compact;
• Possibility to have more small terminals to widen the market and shorten the feeder transport;
• The train and the truck can be independent of each other.
This means lower logistics costs for both customers and society.
Fully automated terminals. There are already fully automated terminals in service in various ports and
for inland terminals in Germany. So far, these systems are rather complex, expensive, and used on very
large terminals. What rail requires are automated terminals for smaller demand, profitable on shorter
distances and more relations.
The cost of handling units with a reach stacker at conventional end-point terminals is approximately
30 €/unit. With liner traffic and automatic horizontal transfer system like AMCCT the cost is estimated
to be around 10 €/unit. An example of measurable achievements estimated for a future system for
automatic horizontal terminal handling in combination with liner trains are as follows:
• Cost for terminal handling of a unit will be reduced by approximately 60%;
• Break-even point for intermodal will be reduced from 500 km to 300 km;
• Energy consumption will be reduced by 93%;
• CO2 emissions in kg per unit will be reduced by 99% with electric propulsion;
Roll-on/roll off terminals for trailer handling. Most trailers today are not suitable to lift onto a railway
wagon. The trailer market is in practice, very limited even at conventional intermodal terminals that
have lifting equipment. It is therefore a great advantage if trailers can roll on and off the wagons:
solutions where trailers do not need lift, which can thus widen the market considerably. One example
is the Modalohr system in France, which has the possibility to handle trailers without lifting; however,
it needs a rather complicated wagon and special ramps at the terminal. Another is Megaswing which

D24.4. Final Technical Report of SP2 Freight
CAPACITY4RAIL SCP3-GA-2013-605650
30/09/2017
CAPACITY4RAIL PUBLIC Page 18
not needs any special terminal for loading. A development project is Trailer Train which only needs a
ramp at the end of the train but a lower wagon and a high loading gauge which can achieve high length
utilization, see figure 5.

D24.4. Final Technical Report of SP2 Freight
CAPACITY4RAIL SCP3-GA-2013-605650
30/09/2017
CAPACITY4RAIL PUBLIC Page 19
FIGURE 4 SYSTEM CHANGE FOR INTER MODAL: HORIZONTAL TRANSFER EQUIPMENT TO HANDLE C ONTAINERS UNDER THE CONTACT
WIRE. THE TERMINAL CAN BE ON A SIDING AND THE TRAIN CAN MAKE SHORT INTERMEDIATE STOPS AT MANY STATIONS. THE
MARKET WILL BE WIDER AND THE FEEDER DIST ANCES SHORTER. SOURCE KTH.
FIGURE 5MOST OF THE TRAILERS ARE NOT LIFTABLE , THEREFORE ROLL-ON OFF/ROLL ON TECHNIQUE IS AN ALTERNATIVE. LEFT: THE
MODALOHR SYSTEM WITH SPECIAL RAMPS ON EACH WAGON. MIDDLE: TRAILER TRAINS ONLY NEED A RAMP AT THE END OF THE
TRAIN BUT A LOW WAGON AND A HIGH LOADING GAUGE. RIGH A TRAILER TRAIN ARE MORE SPACE EFFICIENT THAN A TRAIN WITH A
POCKET WAGON. SOURCE KTH IN CAPACITY4RAIL DELIVERABLE D23.2.
Figure 6: Automation of marshalling yards and automatic couple Source: A.C. Zanuy 2014.
FIGURE 6 CONVENTIONAL HUB AND SPOKE SYSTEM (LEFT) AND LINER SYSTEM WITH THE SAME MARKET (RIGHT). SOURCE:
EFFICIENT TRAIN SYSTEMS FOR FREIGHT TRANSPORT - A SYSTEMS STUDY, KTH RAILWAY GROUP 2005.

D24.4. Final Technical Report of SP2 Freight
CAPACITY4RAIL SCP3-GA-2013-605650
30/09/2017
CAPACITY4RAIL PUBLIC Page 20
4.6 A sustainable wagon load system
Today´s system has many disadvantages compared with road and has lost market share in many
countries. Structural problems include closing of industrial sidings and feeder service and at the same
time a more concentrated system with fewer destinations and market coverage. One reason is the
terminal handling, which for SWL is crucial to handle trains to, from and between marshalling yards.
Automation of marshalling yards. There are many possibilities for further automation of marshalling
yards, i.e. radio-controlled hump-locomotives, primary hump and secondary-retarders, piston
retarders in the sorting tracks, wagon-movers, movable stopping devices and automatic brake test
equipment, see figure 6. Complemented with an IT system to control all movements and an advanced
planning system, marshalling can be automatic. There are also new network strategies, which mix full
trainloads and wagonloads to achieve a unified system based on the blocking principle.
Intelligent automatic couplers. The ultimate solution is to introduce automatic couplers so the
wagons can be coupled and decupled automatically. The process will demand a minimum of staff and
not be so dangerous for the workers. If this also is radio-controlled there will be further cost savings
in the operations and it will also widen the market for wagonloads through more efficient operations
on sidings and stations.
Liner trains instead of node systems. Instead of a conventional hub and spoke system, a system of
liner trains can be used, where the trains run on a main route and wagons are picked up and dropped
at the stations along the way. In many cases, feeder trains can be avoided and the wagons no longer
need to be shunted at a marshalling yard and hauled by feeder trains, see figure 7. A calculation shows
that transportation costs are reduced by 17% in the case of wagonload traffic. If duo locomotives are
used, the transportation costs can be reduced by a further 5%.
Information and communication technologies and services. It is much easier to order a truck
transport than to order a rail transport, especially for smaller customers and consignments. The time
for planning new transport systems with rail as a base is too long. Here the rail transport companies
have to use IT-system for filling the trains with consignments and fulfill all customer needs.
Real-time monitoring systems for traffic are vital to today’s rail freight service and can be split into on-
board and wayside-mounted systems. The on board tracking and tracing system provides real-time
information using RFID (Radio Frequency Identification) on wagons where radio transmission of data
between a reader by the track and a tag/transponder will provide the real-time information.
Interoperability. Freight transport demand is often trans-European and thus crossing member states
borders must be seamless in all aspects. The standards must be common and for a quick market
uptake of the standards that are proposed, a realistic implementation roadmap will ensure success.
Deregulation and market orientation. One important driving force is the market orientation of
railway companies and forwarders pushed by the deregulation of rail stipulated by EU. In
Capacity4Rail mainly technical and operational measures to improve the freight rail system have
been analyzed, but there is still big potential for market adoption.
D24.4. Final Technical Report of SP2 Freight
CAPACITY4RAIL SCP3-GA-2013-605650
30/09/2017
CAPACITY4RAIL PUBLIC Page 21
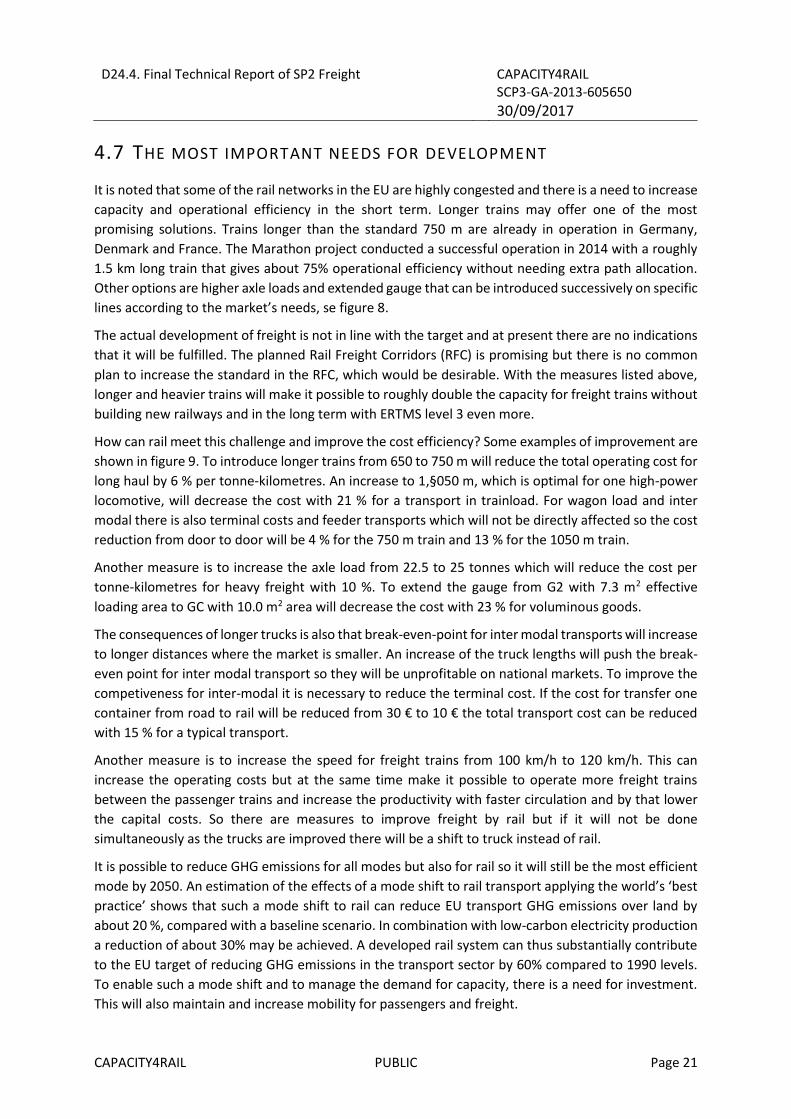
4.7 THE MOST IMPORTANT NEEDS FOR DEVELOPMENT
It is noted that some of the rail networks in the EU are highly congested and there is a need to increase
capacity and operational efficiency in the short term. Longer trains may offer one of the most
promising solutions. Trains longer than the standard 750 m are already in operation in Germany,
Denmark and France. The Marathon project conducted a successful operation in 2014 with a roughly
1.5 km long train that gives about 75% operational efficiency without needing extra path allocation.
Other options are higher axle loads and extended gauge that can be introduced successively on specific
lines according to the market’s needs, se figure 8.
The actual development of freight is not in line with the target and at present there are no indications
that it will be fulfilled. The planned Rail Freight Corridors (RFC) is promising but there is no common
plan to increase the standard in the RFC, which would be desirable. With the measures listed above,
longer and heavier trains will make it possible to roughly double the capacity for freight trains without
building new railways and in the long term with ERTMS level 3 even more.
How can rail meet this challenge and improve the cost efficiency? Some examples of improvement are
shown in figure 9. To introduce longer trains from 650 to 750 m will reduce the total operating cost for
long haul by 6 % per tonne-kilometres. An increase to 1,§050 m, which is optimal for one high-power
locomotive, will decrease the cost with 21 % for a transport in trainload. For wagon load and inter
modal there is also terminal costs and feeder transports which will not be directly affected so the cost
reduction from door to door will be 4 % for the 750 m train and 13 % for the 1050 m train.
Another measure is to increase the axle load from 22.5 to 25 tonnes which will reduce the cost per
tonne-kilometres for heavy freight with 10 %. To extend the gauge from G2 with 7.3 m2 effective
loading area to GC with 10.0 m2 area will decrease the cost with 23 % for voluminous goods.
The consequences of longer trucks is also that break-even-point for inter modal transports will increase
to longer distances where the market is smaller. An increase of the truck lengths will push the break-
even point for inter modal transport so they will be unprofitable on national markets. To improve the
competiveness for inter-modal it is necessary to reduce the terminal cost. If the cost for transfer one
container from road to rail will be reduced from 30 € to 10 € the total transport cost can be reduced
with 15 % for a typical transport.
Another measure is to increase the speed for freight trains from 100 km/h to 120 km/h. This can
increase the operating costs but at the same time make it possible to operate more freight trains
between the passenger trains and increase the productivity with faster circulation and by that lower
the capital costs. So there are measures to improve freight by rail but if it will not be done
simultaneously as the trucks are improved there will be a shift to truck instead of rail.
It is possible to reduce GHG emissions for all modes but also for rail so it will still be the most efficient
mode by 2050. An estimation of the effects of a mode shift to rail transport applying the world’s ‘best
practice’ shows that such a mode shift to rail can reduce EU transport GHG emissions over land by
about 20 %, compared with a baseline scenario. In combination with low-carbon electricity production
a reduction of about 30% may be achieved. A developed rail system can thus substantially contribute
to the EU target of reducing GHG emissions in the transport sector by 60% compared to 1990 levels.
To enable such a mode shift and to manage the demand for capacity, there is a need for investment.
This will also maintain and increase mobility for passengers and freight.

D24.4. Final Technical Report of SP2 Freight
CAPACITY4RAIL SCP3-GA-2013-605650
30/09/2017
CAPACITY4RAIL PUBLIC Page 22
D24.4. Final Technical Report of SP2 Freight
CAPACITY4RAIL SCP3-GA-2013-605650
30/09/2017
CAPACITY4RAIL PUBLIC Page 23
FIGURE 7CAPACITY GAINS FOR DIFFERENT FREIGHT TR AIN MEASURES. SOURCE: TRANSFORUM FREIGHT ROAD MAP (NELLDAL
2014).
FIGURE 8 REDUCTION OF TRANSPORTATION COSTS DEPENDING ON DIFFERENT MEASURES FOR RAIL FREIGH T. EXTENDED TRAIN
LENGTH FROM 650 TO 750 M WILL REDUCE THE COST FOR LONG HAUL BY 6 % FOR TRAINLOAD AND TAKEN TERMINAL- AND FEEDER
TRANSPORTS INTO ACCOUNT BY 4 % FOR WAGON LOAD AND INTERMODAL. H IGHER AXLE LOAD FROM 22.5 TO 25 TON WILL REDUCE
THE COST BY 10% FOR HEAVY FREIGHT AND EXTENDED LOADING GAUGE FROM G2 TO GC BY 25%. REDUCTION OF TERMINAL COSTS
FOR 30 TO 10 € PER CONTAINER WILL REDUCE THE DOOR TO D OOR COST BY 15% FOR INTERMODAL. SOURCE KTH COST MODELS.
5 Novel rail vehicles

D24.4. Final Technical Report of SP2 Freight
CAPACITY4RAIL SCP3-GA-2013-605650
30/09/2017
CAPACITY4RAIL PUBLIC Page 24
5.1 INTRODUCTION
The objective of WP22 was to develop innovations on wagon design and wagon and train operations and connectivity solutions answering present and future needs of the market and of the decision makers. Market trends and competition environment evolution were to be described in WP21.
WP22 had also to develop road maps for introducing realistically such innovations assessing the possibility of a viable business model.
SP2-SP5 on the basis of the changes of the characteristics of the trains were to appreciate the possible introduction of such future freight trains on the network.
5.2 MARKET AND TRANSPORT DECISION MAKERS REQUIREMENTS
The market being composed of variable market segments has variable requirements.
For the mass transport by block trains, which is a mature market competitiveness, reliability and flexibility are the key factors.
For the combined transport, facing direct road competition competitiveness, punctuality, reliability and transit time are key factors. The inclusion of rail links in the supply chain, the development of Horizontal collaboration, the best possible use of the transport vector capacity and a smooth and efficient transfer at interfaces or terminals, implies an increasing high quality level of connectivity.
For wagon load transport which rejuvenation is necessary for a long term sustainable transport, the same key factors as for the combined transport are necessary with an increased level of automation at transfer points as well as in the last mile links.
Moreover sustainability inducing new constraints on wagon cost with the use of more silent but costly braking shoes competitiveness by all means is an overwhelming issue to be dealt with. Automating the various operations all along the journey of a wagon load shipment is absolutely paramount.
These requirements are not sufficient for a final positive decision in favour of rail freight transport. It is still necessary to add the easiness to get quotations, the global offer door to door to involve a single contact person, the absence of specific investments that would hinder the transport efficiency in case of a transfer back to road. For that reason Rolling motorways capable to offer horizontal transfer on wagons for standard (non-modified and of standard size) semi- trailers are gaining market share if full use of real infrastructure gauge is safely possible.
Among the barriers the investments on wagons to progress in term of satisfaction of any of these key factors must be paid back in a reasonable period of time. For that reason the role of the IMs may be fundamental in order to distribute the added value to remunerate the investors.
All these elements are summarized in the following table.

D24.4. Final Technical Report of SP2 Freight
CAPACITY4RAIL SCP3-GA-2013-605650
30/09/2017
CAPACITY4RAIL PUBLIC Page 25
KEY FACTOR->
Market Segment
Competitiveness Reliability Transit Time
Connectivity Automation Other
Mass Transport by block trains
++
++
N
+
At loading / unloading
points
Flexibility in Volumes
Combined transport
+++
+++
Equivalent to road or
better
+++
+++
Wagon load transport
+++
+++
Punctuality
+++
++
+++
++++
Flexibility in Volumes
Rolling Motorway
+++ +++ Better than road
++ +++ Capacity to transport
P400 SemiTrailers
TABLE 2 KEY FACTORS BY MARKET SEGMENT DEFINED BY TYPE OF TRANSPORT
5.3 MAIN INNOVATIONS PROPOSED
WP22 has mainly dealt with innovations on wagons and trains and on their impacts on infrastructure and train management. It should be noted that progress of Locomotives in the field of hybrid locomotives or duo-locomotive should enhance the efficiency of rail freight transport.
5.3.1 WAGON DESIGN
5.3.1.1 Structural Design
The new design proposed for the wagon aimed at reducing the number of axels by introducing Jacobs bogies for the same payload taking into account the type of cargo to be carried or the average load of the ILU. At the same time these multi-body wagons increase the usable train length without changing significantly the safety limits for running the trains.
These innovations have an interesting impact on most of intermodal trains carrying containers, on car carriers and not on bulk trains where the full carrying capacity of the 4 axel wagons is used. For heavy semitrailers carried on pocket wagons the impact is marginal.
The flexibility required by certain operators to carry 40’ containers and 45’ containers or swapbodies could be answered partly (30% 45’ and 70% 40’) by a simple and very cheap innovation which can be seen on the picture here after.

D24.4. Final Technical Report of SP2 Freight
CAPACITY4RAIL SCP3-GA-2013-605650
30/09/2017
CAPACITY4RAIL PUBLIC Page 26
FIGURE 9 INTRODUCTION OF 45’ CONTAINER ON A TRAIN COMPOSED OF STANDARD WAGONS FOR 40’ CONTAINERS
FIGURE 10 5 BODIES- WAGONS WITH 6 AXEL FOR FINISHED CARS
FIGURE 11 12 AXEL WAGONS WITH 5 BODIES FOR 45’ CONTAINERS OR 40’ CONTAINERS WITH 4 JACOBS BOGIES
These innovations enable, without significant restrictions in operation, to gain in capacity for the same train length. This gives an increased competitiveness and flexibility for those having mixed 45’/40’ traffics.
5.3.1.2 Couplings design
As regards the wagon design the introduction of central automatic couplers replacing the classical UIC 85T manual couplers is a significant step forward. Unfortunately at this stage the cost of such equipment is too high to build a viable business case. It would be a significant gain of efficiency for the wagon load activity enabling a large automation of marshalling operations. The possible solution would be to couple wagons by pair linked by a drawbar and equip both ends with automatic couplers.
The analysis of a logistics by couple of wagons should be made to assess the validity of such a solution. However it is highly important to maintain the structural constraint on all new building of wagons to have the ability to install in the future central couplers which will definitely appear in the long term.
Example of 40’ wagonWith foldable pins rotating downards to disappear and be attached to the beamunder
Proposal a 40’ wagon with overlap of 2,5’ over buffers
Foldable support at the right level close to the previous pin positon
New fixed pins on the light extensions for blocking the 40’ container and support not the weight but the sliding efforts
Rectangles de Berne

D24.4. Final Technical Report of SP2 Freight
CAPACITY4RAIL SCP3-GA-2013-605650
30/09/2017
CAPACITY4RAIL PUBLIC Page 27
Incidentally reinforcing UIC couplings up to 135T will allow an increased global weight of the train specifically interesting for bulk trains equipped with end of train device (EOT) described here after.
5.3.1.3 Axel carrying capacity
For bulk traffics or heavy stuff traffics increasing the carrying capacity of axels from 22,5T to 25T would give a significant gain of competitiveness. This progress will spread slowly because of reviewing all bridges structures to guarantee the capacity of supporting trains of 100T wagons and the corresponding braking efforts. It will definitely be a long term progress but for some specific routes linking ore ports and steel plants where it is already authorized under specific requests.
5.3.1.4 Braking system
Presently European freight wagons are braking with pneumatic systems whether it is disk brakes or shoe braking. This introduces longitudinal forces in the train due to the slow progression of the depression in the brake pipe. Some front wagons are already braking when others further away from the locomotive are still pushing forward due to inertia. These longitudinal compression forces create a risk of derailment introducing limitation on the speed and weight of the train according to the type of wagons. The idea of a synchronous braking with electronic valves powered by an electric information would be a significant progress as it opens many field of progress:
• Possibility of lengthening the train safely until the limit due to the coupling breaking because
of traction forces.
• Possibility of carrying a bus of information all along the train with energy opening large
possibilities for predictive maintenance and operations before departure..
• Possibility of releasing the brakes instantly giving an unknown maneuverability to freight
trains thus enabling to request better paths.
• Possibility of shortening the stopping distance or of increasing the train load for the same
stopping distance.
All these positive impacts do not offset the major difficulties: a high cost, no positive effect if a wagon is not equipped in the train and major difficulty to spread the added value for the investor to get the return on its investment. More over some of the positive effects may be obtained with new connectivity methods which allow a progressive implementation in the wagon fleet.
5.3.1.5 Sensors and detectors
Reliability of the wagon involves an improved knowledge on its status specifically for the critical subsystems impacting the safety. For that reason sensors installed on the braking system and on running gear are the most important in terms of safety. At the same time the sensors placed on the braking system enabling also to perform from the locomotive the brake test before departure will impact very positively the operation costs. Based on specific connectivity solutions allowing certain non-equipped wagons to be included in the train consist and using long life batteries (5 to 10 years) this development appears to be the most promising with a light investment and an immediate return on this investment.
5.3.2 TRAIN EQUIPMENT
5.3.2.1 End of Train Device EOT
D24.4. Final Technical Report of SP2 Freight
CAPACITY4RAIL SCP3-GA-2013-605650
30/09/2017
CAPACITY4RAIL PUBLIC Page 28
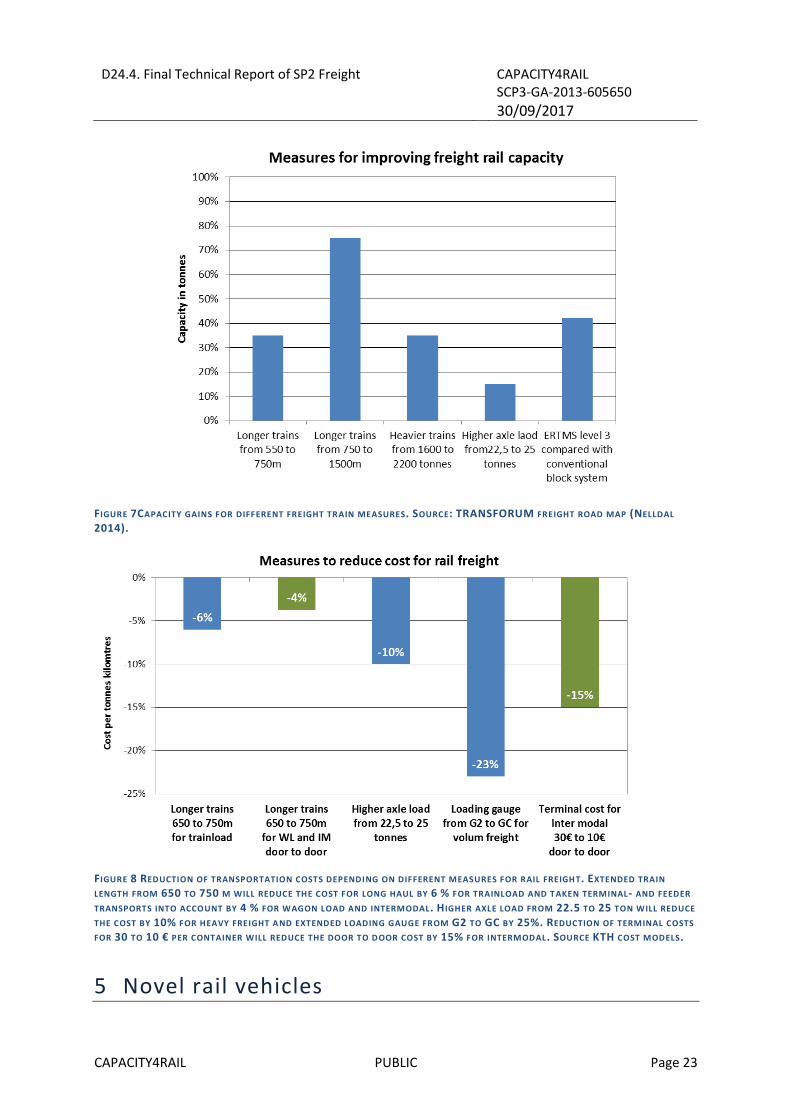
The principle of this device (picture 4) placed at the end of the train, connected to the brake pipe
Is
FIGURE 12EOT DEVICE TO BE PLACED AT THE END OF THE TRAIN SOURCE FREINRAIL (KNORR- BREMSE)
is to check the pressure in the pipe and when ordered by the driver of the train to open the brake pipe from the end in order to speed up the braking of the train and reduce the longitudinal forces during the braking phase. It receive its orders by radio, and by the brake pipe.
The impacts of this device are to reduce the stopping distance of the train or to allow a higher global weight of the train and to guarantee the train continuity. For National Safety authorities it is necessary to have safe back-up situation in case of one mean of communication being out of order. It seems that recent progress of research are demonstrating that low frequency waves in the brake pipe could carry reliably some bits of information. This could allow NSA to formally validate the impacts of the EOT. Due to the relatively low cost of the device and to the immediate benefits expected, the deployment of such equipment should be quick after its formal certification.
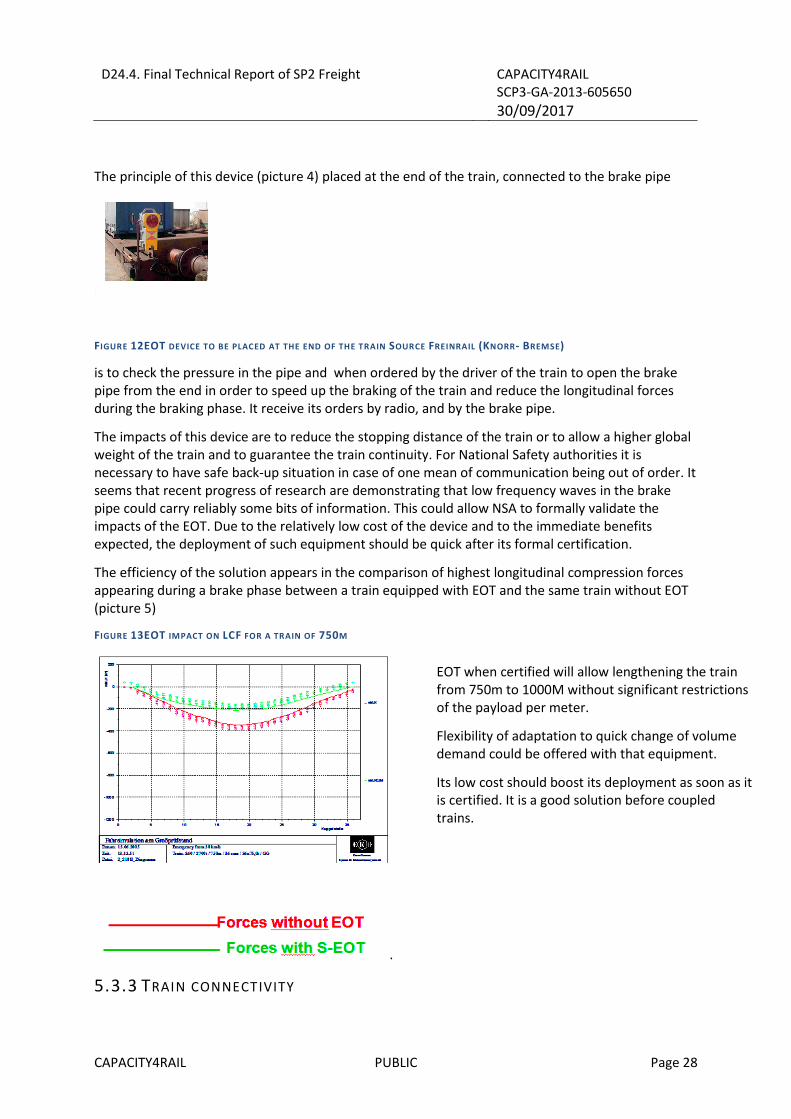
The efficiency of the solution appears in the comparison of highest longitudinal compression forces appearing during a brake phase between a train equipped with EOT and the same train without EOT (picture 5)
FIGURE 13EOT IMPACT ON LCF FOR A TRAIN OF 750M
.
5.3.3 TRAIN CONNECTIVITY
EOT when certified will allow lengthening the train from 750m to 1000M without significant restrictions of the payload per meter.
Flexibility of adaptation to quick change of volume demand could be offered with that equipment.
Its low cost should boost its deployment as soon as it is certified. It is a good solution before coupled trains.

D24.4. Final Technical Report of SP2 Freight
CAPACITY4RAIL SCP3-GA-2013-605650
30/09/2017
CAPACITY4RAIL PUBLIC Page 29
Train connectivity has taken an increasing importance to develop the competitiveness, the reliability, the filling coefficient of the train through horizontal collaboration and attractiveness for the customer through an updated and accurate information on the shipment position, its ETA and the status of the cargo. The challenges to be overcome were the absence of energy onboard wagons and the different level of equipment of the wagons incorporated inconsistent.
The connectivity was divided in two separate fields: on-train connectivity and train-to-ground connectivity.
5.3.3.1 On-Train connectivity
The two ways to ensure on-train connectivity are the following ones:
• By wire all along the train enabling to transfer energy to the wagons enabling to feed the
various sensors and other equipment needing a certain amount of energy and to convey a
bus of information gathered in the locomotive and sent to the base by the train-to-ground
system. The main drawback of that solution is the risk of having a non-wired wagon in the
consist and the fragility of the wire connection at the couplings. New automatic couplers
would largely overcome this risk but their cost will refrain their deployment on the short-
medium term. However on consists of wagons dedicated to a regular shuttle train where
wagons are linked by draw bars the solution may become viable specifically for feeding
reefers on temperature controlled traffics.
• By wireless system needing sufficiently low energy so that long life batteries may ensure
periods of use between 5 to 10 years. This system ensures a communication from wagon to
wagon able to jump over some non-equipped wagons to reach progressively the
concentrator on the locomotive. The drawback is the limited energy available on the wagon
forbidding permanent and voluminous transfer of information. For that reason a MESH
network is the solution used to reach a reliable communication along the train with the
lowest energy consumption. However energy harvester are installed onboard certain wagons
to ensure some recharging of the battery. Generally the GPS positioning is mainly done from
the locomotive but hubs of the Mesh system installed on board wagons to concentrate
information may connect not frequently but directly to the GSM network or to LPWA
Networks enabling a less accurate but useful positioning specifically if the wagon is isolated
on a siding alone for various reasons. This solution is developing rapidly because of its low
cost of communication and it’s relatively low cost of installation if the devices are pre-
equipped with internet of things (IoT). (Picture 6)
• The use of Ultra Narrow Band width of LPWA Networks is the solution totally in line with the
IoT of the various devices installed.

D24.4. Final Technical Report of SP2 Freight
CAPACITY4RAIL SCP3-GA-2013-605650
30/09/2017
CAPACITY4RAIL PUBLIC Page 30
FIGURE 14 MESH NETWORK FOR SMART BOXES CONCENTRATING DEVICES INFORMATIONS
5.3.3.2 Train to Ground connectivity
The target is to provide stakeholders with the updated information requested with the necessary frequency and accuracy.
The main demands from the shippers/consignees or their representatives relate to positioning the shipment and more important updating the ETA at the right time to be able to reorganize economically the following links of the supply chain. The status of the cargo are also requested at the same time. The main demands from the operators and wagon keepers are the same as regards positioning and ETA but they also need the status of the wagon to organize predictive maintenance efficiently and smart wagon fleet management.
To satisfy these various demands while saving energy as much as possible analysis of the necessary frequency and accuracy show that for predictive maintenance and wagon fleet management real time information is not necessary but for specific alarms impacting the safety at short notice(hot box onboard detection for instance). Specific devices detecting such alarms will send their information to its wagon smartbox with a specific code inducing an immediate transmission to the ground base by the GSM of the smart box of the Mesh network that has the highest level of remaining energy. As long as the train continuity is guaranteed by the last wagon smartbox (device detecting brake pipe pressure sending no alarm) positioning is given by the GPS of the locomotive. If the wagon is alone on a siding regular information is important to find it but also to urge the consignee to unload the wagon which is not bound to be a storage and to send it back for use. These information will use not very accurate positioning but sufficiently to enable algorithm using the communication network to position it after a certain delay. These information limited in volume will use LPWA Networks very cheap in yearly fee and data transfer.
TABLE 3 LPWAN CHARACTERISTICS

D24.4. Final Technical Report of SP2 Freight
CAPACITY4RAIL SCP3-GA-2013-605650
30/09/2017
CAPACITY4RAIL PUBLIC Page 31
The information sent by the sensors equipped with IoT will allow identification of wagon and components or Cargo identity to be forwarded to the ground base and transferred to interested and authorized stakeholders.
These types of Networks competitive and efficient must work on a common interface standard which is not yet the case but will happen in the near future after the end of the battle to become the world standard. Compatibility with system used for containers during their sea voyage is compulsory.
5.3.4 TRAIN OPERATION EQUIP MENT
Among the main barriers to reach competitiveness for wagon load activities marshalling and last mile operations are to be improved drastically.
5.3.4.1 Last mile operations
The basic ideas, already developed in ViWas project is to use a road –Rail engine that avoids most switches in the private siding area, enables mostly forward traction, enables remote controlled backward movements, can be mutualized with other private sidings and can be used for internal wagon movements. Picking the wagons at the national network shunting area at the end of the main rail connection is the objective presently under certification in Germany. The expected cost reduction may reach 40%.
FIGURE 15 ROAD-RAIL ENGINE FOR LAST MILE AND PRIVATE SIDINGS OPERATIONS

D24.4. Final Technical Report of SP2 Freight
CAPACITY4RAIL SCP3-GA-2013-605650
30/09/2017
CAPACITY4RAIL PUBLIC Page 32
5.3.4.2 Automation
The next major step expected for which WP22 has elaborated some components is automation. Automating marshalling operations and train driving firstly on single track lines for last mile deliveries would bring a significant step in rail freight transport. It would cut down the costs and introduce more flexibility for the last mile operations.
5.3.4.3 Marshalling yards
Automation on marshalling yards would become possible with the introduction of the automatic couplers, quoted here above, that can be decoupled either by radio command or by a robot executing the necessary two moves. Automatic couplers continue to remain decoupled if they are still compressed which is the case when climbing the hump. The enhanced connectivity described before allows to identify precisely the wagon, its characteristics and its destination enabling the software of the yard to organize the shunting automatically as the wagons have already been decoupled. The braking systems of the yard take care of the smooth kiss at the end of the departure tracks to recouple the wagons. In case of failure to recouple automated shunter will finalize the operation. As explained before the cost of the automatic couplers will not allow such progress in the short term.
5.3.4.4 Automated driving
Confronted to the fierce competition arising from the future platooning of road trucks, rail has started to develop research to automate the driving. The ERTMS system gives very accurate positioning and speed knowledge. New detector of all types of obstacles should allow progress towards automation. This development will have to overcome the usual way of analyzing the safety by comparison with existing methodologies. A complete risk analysis will have to be made to show if the new system will globally improve the rail freight transport safety.
The impacts of such a development is important on competitiveness, flexibility and reliability. Harmonizing the driving behaviours, it increases the Network capacity by standardizing more accurately the paths on the graphic.
This development should be expected after 2030.
5.3.4.5 Gauge for Roll ing motorways

D24.4. Final Technical Report of SP2 Freight
CAPACITY4RAIL SCP3-GA-2013-605650
30/09/2017
CAPACITY4RAIL PUBLIC Page 33
Progress has been made on the wagon side to be able to put semi-trailers on a very low floor of pocket wagons. Solutions for horizontal transfer have been developed to avoid any specific investments by the road haulier in order to boost the attractiveness of this transport. Certain countries have restricted infrastructure gauge (Gauge B) and moreover restrictive regulations for the loading gauge. IMs responsibility is to make the best use of their infrastructure and for that purpose to check the precise dynamic clearance profile they can offer to their customers which responsibility is to remain inside in any traffic situation. This progress is essential as the potential market of non craneable semitrailers is huge in Europe and long rolling motorway trains offer a viable business model specifically for long distance runs. Tests have been made showing that the margin for infrastructure maintenance and the type of wagon presently used in the UIC leaflet to define the loading gauge penalize wagon owners which have invested in very efficient wagons to fully use the real dynamic clearance profile. New methodology in this matter would create immediately a significant increase in rail freight traffics in that market segment.
5.3.4.6 Train characteristics
With the equipment described here above the main change to train characteristics is the length which appears possible in the near future with the EOT up to 1000M and with the coupling of two trains with distributed traction in the short-medium term up to 1500m on main routes joining important European hubs.
The equipment with sensors connected to the drivers cab will allow in the very near future a significant reduction of time and resources to perform the brake test allowing an increase of asset utilization and more efficient human resources utilization.
In the medium term Electronic braking will offer a significant improvement of the train maneuverability in order to obtain better paths impacting positively the competitiveness and the Network capacity.
5.4 IMPACTS, PRIORITIZATION , ROADMAP FOR DEPLOYMENT
The impacts and the prioritization are summarized in the table 3 and 4 describing the proposed standards and the time to market for these innovations.
It is useful to note that most of these innovations do not need a significant change in the TSIs but only some adaptations to take into account the impacts of the extra length on the infrastructure. For the wagons the requirements of the TSI should be fully respected as regards the safety aspects.
For new traction solutions like road-railers on the Network specific rules should be written.

D24.4. Final Technical Report of SP2 Freight
CAPACITY4RAIL SCP3-GA-2013-605650
30/09/2017
CAPACITY4RAIL PUBLIC Page 34
TABLE 4 STANDARDS PROPOSED IN THE VARIOUS FIELDS
TOPIC TARGETS MOTIVATION IMPACT
Wagons
Multi-body wagons
Connected wagons equipped with sensors
Structure designed for development of central couplers.
EP brakes equipment
Automatic couplers
Better use of train length, monitor of wagon and cargo status, track and trace of the shipments
No change in TSIs but for EP Brakes and central automatic couplers
Increased competitiveness, reliability, safety and information for customers
Loco-
motives
Multi-current, track friendly , with high axle load (normal 22,5 T) duo or hybrid locomotive
Connected to base servers
Interoperability, best use of the power, possibility to serve non electrified sidings
Track and trace
Remote technical support
Increased interoperability; seamless door to door service; increased punctuality, reliability and competitiveness
Transfer of train information to base servers
Gauge
Accurate and updated information on real infrastructure existing gauge and gauge C for new routes
Optimize the use of existing clearance profiles for semitrailer transport with efficient wagons, harmonize gauge on corridors to northern and eastern Europe
Enter the non craneable semitrailer transport segment and the oversized containers and swap bodies. Infrastructure TSI to be reviewed.
Trains
Trains up to 1000M with one locomotive.
Coupled trains with distributed traction up to 1500M.
Network capacity saving, increased competitiveness
Increased competitiveness. Infrastructure design to be reviewed on authorized routes for efficient and safe traffic management.
Infra-structure design
Gauge C for new routes, adaptation of terminals, sidings and critical points to trains of 1000m with one locomotive and 1500m with distributed traction
Ensure safe and efficient train management
Increased competitiveness, open new market segments
Train manage-ment
ERTMS L3 low cost for freight trains
Interoperability
affordability
Seamless cross border transport.
Infra-structure manage-ment
Maintenance works by tracks (for double track lines), coordination of works to preserve continuity of itineraries, diverted routes with 6 month notice, new structure to reduce maintenance periods and costs.
Preserve traffics
Competitiveness, reliability

D24.4. Final Technical Report of SP2 Freight
CAPACITY4RAIL SCP3-GA-2013-605650
30/09/2017
CAPACITY4RAIL PUBLIC Page 35
TABLE 5 POSSIBLE TIMING FOR MARKET UPTAKE
The road map to reach these targets is quite challenging because of divergent interests of the stakeholders involved in the supply chain. For instance large availability of existing amortized wagons hinder the investments in new buildings specifically because wagons are rented on a daily basis and their lower efficiency increase the number of days of renting. It appears clearly that there must be a major progress to make ancient wagons totally obsolete to push forward new investments. New rules issued by authorities can speed up some changes like noise reduction with the risk of pushing rail freight transport out of competition with road transport. The IMs intervention to modulate the tolls in a way favouring the innovations and rewarding the investors is wishable. Toll policies may also have a negative effect if for instance they are dragging out the productivity created by the operators or the wagon keepers. For instance longer trains creating capacity on the Network can be neutralized by a toll based mainly on ton-km carried. Evolutions in that direction should be prohibited.
A sound road map is clearly to develop connectivity and EOT (for lengthening the trains up to 1000M and 2000T) to start getting efficiency in operation, reliability and competitiveness as well as attractiveness for transport decision makers getting updated and accurate information. At the same time for captive fleet of wagons dedicated to shuttle services it should be possible to introduce EP Braking systems and multi-body wagons, thus demonstrating all the positive effects induced. Knowing and using fully the precise infrastructure gauge will boost Rolling Motorways development.
Preserving the central coupling capability on new buildings is vital for future installation of central automatic couplers.
Increasing the infrastructure gauge and the axel weight will constitute the next step in this roadmap.
In the meantime automated driving for trains will develop firstly on last mile deliveries and marshalling yards shunting and finally on long distance journey on main lines.

D24.4. Final Technical Report of SP2 Freight
CAPACITY4RAIL SCP3-GA-2013-605650
30/09/2017
CAPACITY4RAIL PUBLIC Page 36
6 Co-modal transhipment and interchange/logistics
6.1 INTRODUCTION
Objective of WP 23 is the conceptual design of transhipment technologies and Interchanges of the future 2030 and 2050 (rail yards, intermodal terminals, shunting facilities, rail-sea ports, etc.), according to their role in co-modal transhipment to influence freight demand distribution, both by operation improvements and logistic advantages, and following the market’s requirements.
These technologies, described in Wp 21 and Wp 22, are grouped in different scenarios, representing two temporal horizons.
WP23 tested, from the point of view of both technical aspects and economic/financial aspect, the application of these scenarios within the case study terminals belonging to various families of terminal:
• Rail to road for shorter range units transfer (Riem, Combinant, Hupac and Zomerweg);
• Rail to waterways for rail feeding from ports (Principe Felipe Railway Terminal);
• Rail to rail for shunting wagonloads (Hallsberg).
The evaluation of the performances of the terminals concerned and the influence on them of innovative operational measures and technologies is based on a selected combination of tested analytical methods based on sequential application of algorithms (e.g. from queuing theory) and discrete event simulation models, capable to quantify different KPI. The implementation of new technologies and operational measures lead to a general increase of the terminals performances when measured by KPI.
The first case study selected for the pilot application of methods and models and the evaluation of future scenarios is the terminal located in Munich Riem, operated by the DB owned company DUSS.
The set of road-rail terminals considered as case studies includes three intermodal terminals located in Antwerp: Combinant, Hupac and Zomerweg. Moreover it is also studied a small scale linear intermodal terminal.
The Port of Valencia’s Principe Felipe Railway Terminal has been the selected as a case study for sea-rail terminals.
Finally, Hallsberg case study is the largest marshalling yard in Sweden, both in the number of wagons handled and surface extension.
For each case study, the identification of suitable innovations, like technical measures, data exchange and operational measures, allows migration towards the future trough the definition of tree different scenario: 2030, consolidated and 2050.
Duss terminal in Munich Riem, Port of Valencia’s Principe Felipe Railway Terminal and hallsberg’s marshalling yard have been taken as case study for the financial and economic evaluation of the selected innovative measures, grouped in the defined scenario.
Therefore, the following paragraphs recall and summarize the major results of WP 23 in terms of scenario definition, technical evaluation and financial and economic evaluation.

D24.4. Final Technical Report of SP2 Freight
CAPACITY4RAIL SCP3-GA-2013-605650
30/09/2017
CAPACITY4RAIL PUBLIC Page 37
6.2 DEFINITION OF FUTURE SCENARIOS
Based on the innovative operational measures and technologies, identified in WP 21 for the terminal side and in WP 22 for vehicles side, combination of elements are made to obtain future scenarios for certain case studies, taking into account a progressive temporal implementation of some measures and technologies. Therefore, each scenario represents a different temporal step of the application of these innovations.
The main scenarios are the temporal scenarios (1 and 2), related to conventional time horizons respectively of 2030 and 2050. Beside these, a third scenario (Consolidated Scenario) has been considered for all case studies. Consolidated Scenario is not temporarily defined and includes both elements of innovative operational measures and technologies better suited for case studies, normally temporarily located between the two above-mentioned scenarios.
For Rail - Road and Rail - Sea intermodal terminals, both innovative operational measures and technologies are included in scenarios. For marshalling yards, innovative technologies only are included.

D24.4. Final Technical Report of SP2 Freight
CAPACITY4RAIL SCP3-GA-2013-605650
30/09/2017
CAPACITY4RAIL PUBLIC Page 38
TABLE 6 INNOVATIVE OPERATIONAL MEASURES AND TECHNOLOGIES INCLUDED IN SCENARIOS FOR MUNICH
RIEM
Rail - Road terminal Munich Riem
Scenario 1 (2030)
Scenario 2 (2050)
Consolidated Scenario
Innovative operational measures
Innovative
technologies
Innovative operational measures
Innovative
technologies
Innovative operational measures
Innovative
technologies
Faster and fully direct handling
Automatic ITU and vehicles control and data exchange
No locomotive change
Long train (1500 m)
H24 working time
Automated fast transtainer
Intermodal complex spreader
Duo loco
Fast automated gate
Horizontal and parallel handling
Faster and fully direct handling
Automatic ITU and vehicles control and data exchange
No locomotive change
Long train (1500 m)
H24 working time
Automatic systems for horizontal parallel handling
Duo loco
Fast automated gate
Automatic ITU and vehicles control and data exchange
Partial and fast locomotive change
Long train (670m)
H24 working time
Fast transtainer (+30-40% RMG performances)
Fast Automated gate
Automatic coupling loco

D24.4. Final Technical Report of SP2 Freight
CAPACITY4RAIL SCP3-GA-2013-605650
30/09/2017
CAPACITY4RAIL PUBLIC Page 39
TABLE 7 INNOVATIVE OPERATIONAL MEASURES AND TECHNOLOGIES INCLUDED IN CONSOLIDATED SCENARIO
FOR ANTWERP COMBINANT, HUPAC AND ZOMERWEG
Rail - Road terminal Antwerp Combinant
Rail - Road terminal Antwerp Zomerweg
Rail - Road terminal Antwerp HUPAC
Consolidated Scenario Consolidated Scenario Consolidated Scenario
Innovative operational measures
Innovative
technologies
Innovative operational measures
Innovative
technologies
Innovative operational measures
Innovative
technologies
Automatic ITU and vehicles control and data exchange
Partial and fast loco change
Long train (670 m)
H24 working time
Fast transtainer
Duo propulsion loco
Automatic coupling loco
Automated gate (based on OCR and RFID)
Partial automatic ITU and vehicles control and data exchange
Fast loco change
Long train (670m)
H24 working time
Partial Automated gate (based on RFID and manual procedure)
Automatic coupling loco
Long train (670 m)
H24 working time
Automatic ITU and vehicles control and data exchange
Fast loco change
Long train (670 m)
H24 working time
Automatic systems for horizontal parallel handling
Automatic coupling loco
Automated gate
TABLE 8 INNOVATIVE OPERATIONAL MEASURES AND TECHNOLOGIES INCLUDED IN SCENARIOS FOR VALENCIA
PRINCIPE FELIPE
Rail - Sea terminal Valencia Principe Felipe
Scenario 1 (2030)
Scenario 2 (2050)
Consolidated Scenario
Innovative operational measures
Innovative
technologies
Innovative operational measures
Innovative
technologies
Innovative operational measures
Innovative
technologies
Automatic ITU and Vehicle. control and data exchange
No locomotive change
Tracks operative length 1500 m
H24 working time
Automated fast transtainer
Intermodal complex spreader
Duo propulsion loco
Automated gate
Horizontal and parallel handling
Automatic ITU and vehicles control and data exchange
No locomotive change
Long train
H24 working time
Duo propulsion loco
Automated gate
Automatic ITU and vehicles control and data exchange
Long train (850-1000 m)
H24 working time
Multi lift spreader handling
Fast Automated gate
Automatic coupling loco
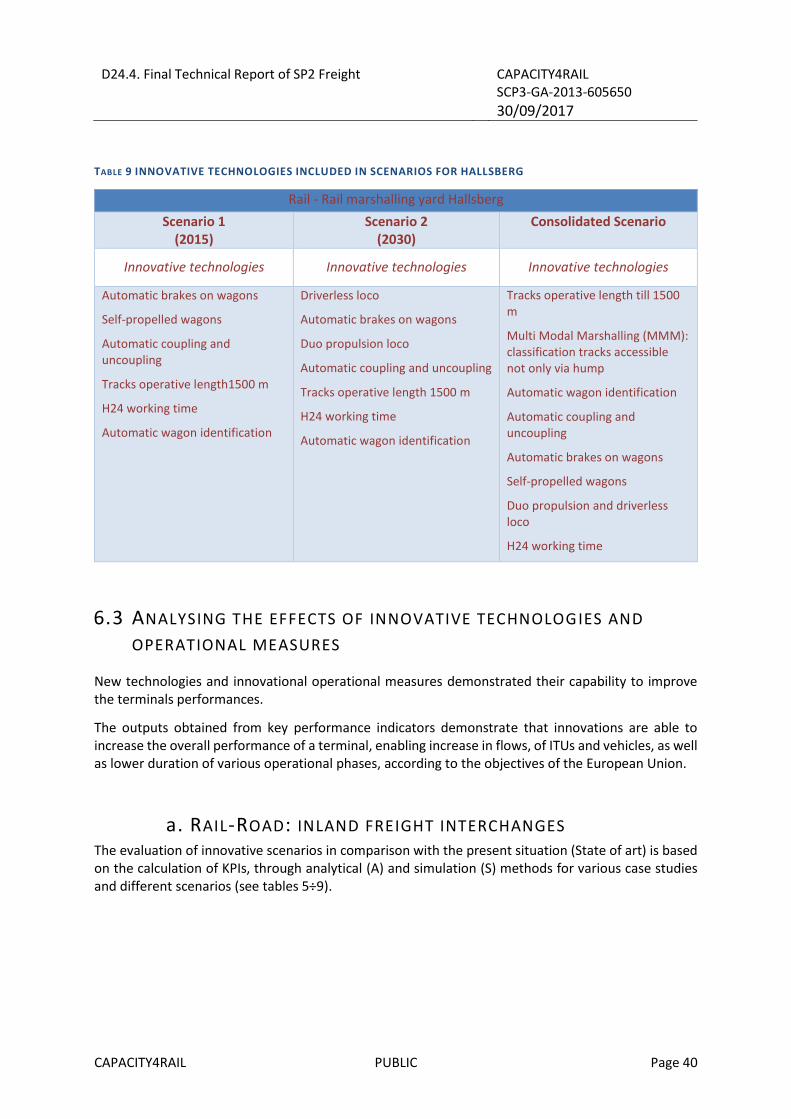
D24.4. Final Technical Report of SP2 Freight
CAPACITY4RAIL SCP3-GA-2013-605650
30/09/2017
CAPACITY4RAIL PUBLIC Page 40
TABLE 9 INNOVATIVE TECHNOLOGIES INCLUDED IN SCENARIOS FOR HALLSBERG
Rail - Rail marshalling yard Hallsberg
Scenario 1 (2015)
Scenario 2 (2030)
Consolidated Scenario
Innovative technologies Innovative technologies Innovative technologies
Automatic brakes on wagons
Self-propelled wagons
Automatic coupling and uncoupling
Tracks operative length1500 m
H24 working time
Automatic wagon identification
Driverless loco
Automatic brakes on wagons
Duo propulsion loco
Automatic coupling and uncoupling
Tracks operative length 1500 m
H24 working time
Automatic wagon identification
Tracks operative length till 1500 m
Multi Modal Marshalling (MMM): classification tracks accessible not only via hump
Automatic wagon identification
Automatic coupling and uncoupling
Automatic brakes on wagons
Self-propelled wagons
Duo propulsion and driverless loco
H24 working time
6.3 ANALYSING THE EFFECTS OF INNOVATIVE TECHNOLOGIES AND
OPERATIONAL MEASURES
New technologies and innovational operational measures demonstrated their capability to improve the terminals performances.
The outputs obtained from key performance indicators demonstrate that innovations are able to increase the overall performance of a terminal, enabling increase in flows, of ITUs and vehicles, as well as lower duration of various operational phases, according to the objectives of the European Union.
a. RAIL-ROAD: INLAND FREIGHT INTERCHANGES The evaluation of innovative scenarios in comparison with the present situation (State of art) is based on the calculation of KPIs, through analytical (A) and simulation (S) methods for various case studies and different scenarios (see tables 5÷9).

D24.4. Final Technical Report of SP2 Freight
CAPACITY4RAIL SCP3-GA-2013-605650
30/09/2017
CAPACITY4RAIL PUBLIC Page 41
TABLE 10 MUNICH RIEM TERMINAL KPIS RESULTS
SCENARIO
KPI State of
art Consolidated
Scenario 1 (2030)
Scenario 2 (2050)
unit method
Total Transit Time (ITU)
TRUCK_TRAIN 7.69 6.62 2.56 2.44 h A
TRAIN_TRUCK 3.65 5.26 2.79 1.62 h
Total Transit Time (vehicle)
TRAIN 5.3 2.15 2.89 2.63 h A
TRUCK 0.97 0.33 1.55 1.34 h
Equipment Performance CRANE 13.6 17.0 58.0 70.0 ITUs/h S
System utilization rate
TRAIN 0.43 0.22 0.14 0.80 - S
TRUCK 0.38 0.31 0.64 0.66 -
The implementation of new technologies and operational measures allows a general increase of the terminal performances.
In particular:
• Reduction of ITUs transit time in truck-train direction (14% in Consolidated Scenario);
• General reduction of train transit time respect to State of art application;
• Increase of equipment performances (25% in Consolidated Scenario);
• Important decrease of trains and tracks utilization rate in Consolidated Scenario.
TABLE 11 ANTWERP COMBINANT TERMINAL KPIS RESULTS
SCENARIO
KPI State of art Consolidated unit method
Total Transit Time (ITU)
TRUCK_TRAIN 7.50 6.67 h A
TRAIN_TRUCK 3.75 3.36 h
Total Transit Time (vehicle)
TRAIN 3.58 2.55 h A
TRUCK 0.82 0.46 h
Equipment Performance
CRANE 25 48 ITUs/h S
System utilization rate
TRAIN 0.15 0.1 - S
TRUCK 0.24 0.08 -
In Antwerp Combinant terminal (table 6), the adoption of new technologies and innovative operational measures shows an improvement of the general performances, without relevant negative effects:
• Reduction of vehicles transit time: 44% for trucks and 29% for trains;

D24.4. Final Technical Report of SP2 Freight
CAPACITY4RAIL SCP3-GA-2013-605650
30/09/2017
CAPACITY4RAIL PUBLIC Page 42
• Reduction of ITUs transit time: 11% in truck-train direction and 10% in train-truck direction;
• Increase of equipment performances: 92%;
• Reduction of systems utilization rate: 67% for trucks and 33% for trains.
TABLE 12 ANTWERP HUPAC TERMINAL KPIS RESULTS
SCENARIO
KPI State of art Consolidated unit method
Total Transit Time (ITU)
TRUCK_TRAIN 6.93 3.55 h A
TRAIN_TRUCK 2.99 2.88 h
Total Transit Time (vehicle)
TRAIN 5.08 2.33 h A
TRUCK 0.8 0.56 h
Equipment Performance
CRANE 30 42 ITUs/h S
System utilization rate
TRAIN 0.31 0.15 - S
TRUCK 0.15 0.11 -
For HUPAC terminal as well (table 7), the results achieved are all largely positive.
In particular:
• Reduction of vehicles transit time: 30% for trucks and 54% for trains;
• Reduction of ITUs transit time: 49% in truck-train direction and 4% in train-truck direction;
• Increase of equipment performances: 40%;
• Reduction of system utilization rate: 27% for trucks and 52% for trains.
TABLE 13 ANTWERP ZOMERWEG TERMINAL KPIS RESULTS
SCENARIO
KPI State of art Consolidated unit method
Total Transit Time (ITU)
TRUCK_TRAIN 8.39 3.15 h A
TRAIN_TRUCK 2.59 4.76 h
Total Transit Time (vehicle)
TRAIN 5.09 2.58 h A
TRUCK 0.77 0.22 h
Equipment Performance
CRANE 22 33 ITUs/h S
System utilization rate
TRAIN 0.39 0.12 - S
TRUCK 0.19 0.25 -
The Zomerweg terminal consolidated scenario (table 8) includes a parallel horizontal handling technology. In this case, the applications of new technologies and operational measures have a largely positive effect on terminal performances.
In particular:

D24.4. Final Technical Report of SP2 Freight
CAPACITY4RAIL SCP3-GA-2013-605650
30/09/2017
CAPACITY4RAIL PUBLIC Page 43
• Reduction of vehicles transit time: 71% for trucks and 49% for trains;
• Reduction of ITUs transit time in truck-train direction: 62.5%;
• Increase of equipment performances: 50%;
• Reduction of train’s utilization rate: 69%.
The negative effects are dependent on the increased flows of trucks, in particular:
• Increase of ITUs transit time in train-truck direction: 84%;
• Increase of trucks utilization rate: 31%.
The small-scale intermodal Rail - Road linear terminal is basing on CarCon Train (CCT) horizontal ITUs handling system. The methodological framework, including analytical method and simulation model provided results also for this typology of terminal, though a comparison with a State of art situation is not applicable in this case (Table 9).
TABLE 14 INTERMODAL RAIL - ROAD LINEAR TERMINAL KPIS RESULTS
KPI Analytical Method Simulation Model unit
Total Transit Time
ITU 3.33 6.72 h
TRAIN 2.65 2.08 h
TRUCK 0.47 0.85 h
The results are in line with other studies carried out on terminal with these features. The calculated transit time allows trains doing more than one stop during the day and serving more than a single area along a line.
A further development to encourage road- rail modal shift, is the development of fully automated terminals, to decrease terminal handling costs. Fully automated terminals exist now, but only for very large terminals. If this could be developed and applied to terminals with smaller demand, which run services over shorter distances, it may address the issue of high costs for ILU transfer. Currently ILU transfer is one of the largest contributors to overall intermodal transport costs, with ITU handling alone totaling circa €30. Measurable achievements estimated for a future system for automatic horizontal terminal handling in combination with liner trains include:
• Cost reduction of terminal handling per unit by approximately 60%;
• Break-even point for intermodal will be reduced from 500 km to 300 km;
• Energy consumption for terminal handling will be reduced by 93% CO2 emissions in kg per unit will
be reduced by 99% with electric propulsion
For further information, refer to WP21, D21.2.
b. RAIL-SEA: CONTAINERS PORT TERMINALS The application of both analytical method and simulation model provided the results shown in Table 10 for the selected KPIs.

D24.4. Final Technical Report of SP2 Freight
CAPACITY4RAIL SCP3-GA-2013-605650
30/09/2017
CAPACITY4RAIL PUBLIC Page 44
TABLE 15 VALENCIA PRINCIPE FELIPE KPIS RESULTS
KPI
SCENARIO
Stat
e o
f ar
t
Co
nso
lidat
ed
Sce
nar
io 1
(20
30
)
Sce
nar
io 2
(20
50
)
unit method
Total Transit Time (ITU) TRAIN-SHIP 40.64 36.91 37.17 38.88 h
A SHIP-TRAIN 15.33 10.87 11.07 12.11 h
Total Transit Time (vehicle) SHIP 8.96 5.89 5.89 5.89 h
A TRAIN 4.94 1.31 2.84 1.55 h
Equipment Performance
PORTAINER 23.1 23.1 23.1 23.1 ITUs/h
S REACH STACKER 18.5 - - - ITUs/h
RTG 23.5 77.0 49.0 - ITUs/h
HORIZONTAL HANDLING - - - 91.0 ITUs/h
System utilization rate SHIP 0.57 0.61 0.76 0.76 -
S TRAIN 0.96 0.47 0.83 0.80 -
Analysis of the results obtained for common standards, future technologies and operational measures for the Principe Felipe Terminal in Consolidated Scenario:
• Not negligible reductions of ITUs transit time in train-ship direction: about 9%;
• Important reductions of ITUs transit time in ship-train direction: about 29%;
• Reductions of vehicles transit time: 34% for ships and 74% for trains;
• Huge increase of maximum equipment performances: 230% for RTG crane;
• Moderate increase of ships utilisation rate: 7%;
• Relevant decrease of train utilisation rate: 51%.
c. RAIL-RAIL: MARSHALLING YARDS
The application of both analytical and simulation methods provided the results summarised in Table 11 and described in more details in Figures 29-32 compared with present (State of art) situation.

D24.4. Final Technical Report of SP2 Freight
CAPACITY4RAIL SCP3-GA-2013-605650
30/09/2017
CAPACITY4RAIL PUBLIC Page 45
TABLE 16 HALLSBERG MARSHALLING YARD KPIS RESULTS
KPIs
SCENARIOS
Stat
e o
f ar
t
Co
nso
lidat
ed
Co
nso
lidat
ed
(Lo
ng
Trai
n)
Sce
nar
io 1
(20
15
)
Sce
nar
io 2
(20
50
)
Unit Method
Average wagon transit time 4.57 1.73 4.46 4.50 4.44 h S
Tracks utilisation rate
Arrival Group 0.63 0.63 0.93 0.93 0.93 - S
Direction Group 0.70 0.70 0.93 0.93 0.93 - S
Departure Group 0.62 0.62 0.93 0.93 0.93 - S
Maximum flow through the yard 161 161 275 203 275 Wagons/h A
Average number of wagons in the yard 1152 607 1033 1666 1662 Wagons A
From the analysis of the results, it is possible to derive some considerations about the scenarios. New technologies and innovational operational measures demonstrated their capability to improve terminal performance. The outputs obtained in terms of Key Performance Indicators demonstrate that innovations are able to increase the overall performances of the marshalling yard, enabling an increase in flows, of both wagons and train, as well as a reduction in duration of various operational phases, in line with the objectives of the European Union.
6.4 BUSINESS CASES AND COST-BENEFIT ANALYSES d. FINANCIAL FEASIBILITY ANALYSIS
The financial feasibility analysis compares costs with potential revenues. This approximates the
profitability because there is no perfect market for terminal handling, which is an activity in the
transport chain not always priced separately and not even for the full cost considering all capital
costs.
For calculations, the demand levels are:

D24.4. Final Technical Report of SP2 Freight
CAPACITY4RAIL SCP3-GA-2013-605650
30/09/2017
CAPACITY4RAIL PUBLIC Page 46
• Actual demand at 2014: starting point with factor 1.00;
• Modal shift low scenario 2030: next level with increase factor of 1.34;
• Modal shift high scenario 2050: highest level with increase factor of 3.06.
For conventional terminals, with reach-stackers and gantry cranes, the cost per loading unit is in the range 20-30 €/TEU, which is also a common market price for terminal handling. This is the operating cost and the capital cost for the technical equipment, which normally the terminal operator is responsible for. The cost models include also the basic investments, which is the long-term cost for building new terminals. The total cost is in the range of 30-50 €/TEU. This is normally not included in the market price, because some of the investments have been done long time ago by the state and are not allocated to each terminal.
The cost for a small-scale automatic linear terminal has been calculated to 12 €/TEU for operation and capital costs for technical equipment; including the rail infrastructure the total cost will be 14 €/TEU. The low cost for the liner terminal is due to the absence of shunting engines and dedicated personnel. It ensures a very high benefit/cost ratio.
Finally, handling wagons on a marshalling yard is quite different: the operating cost in Sweden is 15 € per wagon. By adding the yearly maintenance and operational cost for the infrastructure manager it will be 52 € per wagon. Calculating the whole cost, it will be very expensive: in this case 96 € per wagon, which reflects the cost to build a new marshalling yard. For marshalling yards, automatic couplers, automatic brakes on wagons, automatic wagon identification, duo locos and driverless locos improved KPI.
e. COST-BENEFIT ANALYSIS The Cost Benefit Analysis covers a 30-year period. CBA Net Present Value (NPV) has been calculated using three different values of the rate of return: 5% (near to 5.5% fixed as maximum value by the EU Guide to Cost Benefit Analysis for Investment Project) and a couple of lower values (3% and 2%), to investigate the variability of the NPV to change in the discount rate. As a general remark, higher rate of return gives a lower NPV for all three infrastructural scenarios considered. For each scenario, lower growth gives lower NPV, as expected for projects involving a cash flow with big investments at the beginning of the period and benefits delayed to the end of the evaluation period.
For Riem Rail - Road terminal, there is an increase in the NPV between 37% and 47%, switching the rate of return from 5% to 3% and between 61% and 78% for a 2% rate of return, depending upon the scenarios considered.
The linear terminal shows the same trend where the decrease of rate of return from 5% to 3% increases the NPV between 32% and 39% and the decrease of the rate of return from 5% to 2% increase NPV between 54% and 65%.
For the Rail - Sea terminal of Valencia, the decrease of rate of return to 3% increases the NPV between 36% and 40%, while a rate of 2% increase the NPV between 61% and 67%.
Finally in Rail - Rail marshalling yard in Hallsberg, the highest rate of return provides the best values since NPV is always negative, while a rate of return of 3% leads to a deterioration in the NPV between 26% and 31% and a rate of return of 2% between 43% and 51%.
All scenarios show negative NPV values due to the high investment and maintenance costs, on the other hand, time savings and volumes are not enough to pay back costs. However, the yard is not as a stand-alone business unit, but a pre-requisite for the rationalization of wagonload’s transport system within the service production chain. A fully automated marshalling yard is technically possible and

D24.4. Final Technical Report of SP2 Freight
CAPACITY4RAIL SCP3-GA-2013-605650
30/09/2017
CAPACITY4RAIL PUBLIC Page 47
potentially strongly effective: the automatic coupler is an ultimate solution for WL, especially if it can be radio-controlled, making longer trains easier to operate and, even if it is a big investment, it can lower long-term costs.
7 Long Term Comprehensive Network
7.1 KEY INNOVATION PROCESSES , TECHNOLOGIES RELATED TO A LONG
TERM COMPREHENSIVE NETWORK
The planning, development and operation of TEN-T networks contribute to the attainment of major European Union objectives. These objectives include allowing the seamless, safe and sustainable mobility of persons and goods, ensuring accessibility and connectivity for all regions, and contributing to further economic growth and competitiveness in a global perspective and should be achieved by establishing interconnections and interoperability between national transport networks in a resource-efficient and sustainable way. For example, rail interoperability could be enhanced by innovative solutions aimed at improving compatibility between systems, such as on-board equipment and multi-gauge rail tracks.
EU Regulation 1315/2013 establishes guidelines for the development of a TEN-T network, comprising a dual-layer structure consisting of the ‘comprehensive network’ and the ‘core’ network, the latter being established on the basis of the former. The comprehensive network (specified in the maps and listed in Annex I and Annex II part 2 of the regulation) consists of all existing and planned transport infrastructures of the TEN-T network, as well as measures promoting the efficient, socially and environmentally sustainable use of such infrastructure (e.g. railway and waterways). The Regulation stipulates that it shall be identified and developed in accordance with Chapter II of the development of the comprehensive network that stipulates the provisions and priorities. The dual-layer TEN-T network structure includes:
• The gradual development of the TEN-T network shall be achieved, in particular, by implementing a dual-layer structure for that network with a coherent and transparent methodological approach, comprising a comprehensive network and a core network.
• The comprehensive network shall consist of all existing and planned transport infrastructures of the TEN-T network as well as measures promoting the efficient and socially and environmentally sustainable use of such infrastructure. It shall be identified and developed in accordance with Chapter II of the Regulation.
• The core network shall consist of those parts of the comprehensive network which are of the highest strategic importance for achieving the objectives for the development of the TEN-T network. It shall be identified and developed in accordance with Chapter III of the Regulation.
Chapter II elaborates (in Articles 10 to 37) the general provision and priorities of comprehensive networks consisting of infrastructure for all modes: air road, rail, waterways, maritime and multimodal as well as other aspects such as telematics, sustainable transport, urban nodes, environmental protection etc.
Particular attention can be given to Article 10 that sets General Priorities:

D24.4. Final Technical Report of SP2 Freight
CAPACITY4RAIL SCP3-GA-2013-605650
30/09/2017
CAPACITY4RAIL PUBLIC Page 48
1) In the development of the comprehensive network, general priority shall be given to measures that are necessary for:
(a) ensure enhanced accessibility and connectivity for all regions of the Union;
(b) ensure optimal integration of the transport modes and interoperability within transport modes;
(c) bridge missing links and removing bottlenecks;
(d) promote the efficient and sustainable use of infrastructure and increasing capacity;
(e) improve or maintain the quality of infrastructure in terms of safety, security, efficiency, climate, and the quality of services and continuity of traffic flows; and
(f) implement and promote innovative technological development.
2. In order to complement the measures set out above, particular consideration shall be given to measures that are necessary for:
(a) ensuring fuel security through increased energy efficiency, and promoting the use of alternative and, in particular, low or zero carbon energy sources and propulsion systems;
(b) mitigating exposure of urban areas to negative effects of transiting rail and road transport;
(c) removing administrative and technical barriers, in particular to the interoperability of the TEN-T network and to competition.
The key innovations on TEN-T Core network and time horizon for their implementation is elaborated in Section 6.1 AND 6.2 of D24.2 Final Catalogue Rail freight systems of the future, these are applicable across the comprehensive network as well.
7.2 INDUSTRY SURVEY- LONG TERM COMPREHENSIVE NETWORK
7.2.1 INDUSTRY SURVEY RESULTS & RECOMMENDATIONS
The EC has defined clear guidelines for the development of a TEN-T corridor network with a dual layer structure of ‘core’ and ‘comprehensive’ network. To gain an understanding of the industry viewpoint of 3PL/integrator within a comprehensive network, participants were asked; how important is it that 3PL/integrator operates train services rather than contracting to a separate operator? The results are illustrated in Figure 16

D24.4. Final Technical Report of SP2 Freight
CAPACITY4RAIL SCP3-GA-2013-605650
30/09/2017
CAPACITY4RAIL PUBLIC Page 49
FIGURE 16 LEVEL OF IMPORTANCE OF 3PL OPERATING TRAIN SERVICES
o Figure 16 reveals that over 40% of respondents viewed this as either ‘very’ or ‘extremely’ important, while a further 36% identified it as moderately important.
These figures suggest that from an industry perspective, high value is placed on an integrator or 3PL across the comprehensive network, this is supported by the following comments;
➢ This is important to ensure an intermodal approach, not only from the wagon perspective. ➢ 3PLs and similar bodies have the necessary experience and customer base to allow full length,
fully loaded trains, which is necessary to be affordable to customers. Only a full train will, in effect, be cost effective at today's road /rail cost differentials. 3PLs have a big role in doing that. It does not follow that they then have to drive the train themselves- all kinds of different partnership models ought to be available, this is something, which commercial parties could look into.
➢ There is a role for a 3PL but this is not the only model. The key challenge is who takes the risk of filling the train for new services.
As the EC targets a long term comprehensive network, industry members were asked what they view as the main barriers to this. Responses can be categorized into 4 subtopics as follows;
Economic barriers
o Infrastructure cost and contingency v road o Costs such as track access o Competition from road- low cost road transport from Eastern Europe o A high number of interfaces, slow down the speed and increases the costs o Sub optimizing- too many parties involved which destroys small margins
Political barriers
o Pressure of local politicians Europe wide, for regional passenger trains everywhere o Road is cheap, governments prefer to prioritise passenger services o Political differences which shape railway decisions and can lead to a lack of market opening o Unhelpful national operators and a lack of competent bureaucrats in the EU

D24.4. Final Technical Report of SP2 Freight
CAPACITY4RAIL SCP3-GA-2013-605650
30/09/2017
CAPACITY4RAIL PUBLIC Page 50
o The interference between a strong business case of upgrading some other line than fully committing to upgrade the comprehensive network.
o Differences in legislation and train path allocation processes that differ from country to country- lack of unified regulations
o Competition from the national network- a clear separation of infrastructure and operations is required
Barriers caused by Infrastructure Development
o Lack of investment in the less used regional lines o An imbalance in infrastructure development o Lack of high quality infrastructure and the existence of missing links within the
comprehensive network o Lack of IT integration o More efficient SWL traffic with automated processes
Freight Demand
o Lack of certainty of rail capacity across a calendar year- this makes it more difficult to obtain investment from the private sector
A logical subsequent question asked participants what benefits they would like to achieve or gain from a long term comprehensive network, responses can be categorized into 3 subtopics;
A large number of respondents referred to a change in market share for rail as an advantage of an improved comprehensive network;
• Being able to shift demand from road to rail
• Diversion of routes, would lead to potentially new market shares
• An increase in the volume of goods transported
• Development of rail market share
• An increase in the volume of traffic and satisfied customers
• The possibility to better address the demand of existing and potential new customers without the direct connection to the core network
Economic benefits
• An increased fill rate of train leading to lower unit costs
• A reduction in costs and time savings
• Ease of capacity planning, efficiency and hence lower costs
Increase in efficiency & reliability
• Efficient operating schedules offering huge gains for RUs (reduction of costs, better service leading to increase in revenues)
• An increase in logistics efficiency
• The fulfillment of the timetable, just in time
• More reliable journey times
• An increase in efficiency offers a bigger possibility of investment
• Better reliability with improved possibilities to monitor trains and it is easier to establish new rail services

D24.4. Final Technical Report of SP2 Freight
CAPACITY4RAIL SCP3-GA-2013-605650
30/09/2017
CAPACITY4RAIL PUBLIC Page 51
8 Traffic management systems
The EC challenges for the development of traffic management systems (TM) includes the development of a multimodal transport chain where rail, as a partner, will play a major role between terminals/hubs to terminal/hubs and the final customer will be connected by another transport mode, particularly pickup and delivery, for example by road. In this case, the hubs will be a modal (or intra-modal) transfer point. To achieve an efficient and effective transport system to meet the needs of the modern supply chain, all of the actors of the chain must be linked with a traffic management and information system that will ensure safety, optimal asset (vessels/vehicles and infrastructure) utilisation and overcome the barriers during the modal transfer including interoperability issues.
8.1 KEY INNOVATION PROCESSES &TECHNOLOGIES FOR TRAFFIC
MANAGEMENT SYSTEMS
ERTMS – European Rail Traffic management System The European Rail Traffic Management System (ERTMS) is a traffic management system developed to greatly enhance safety, increase train efficiency and enhance rail cross-border interoperability. This will establish and develop TEN-T as well as comprehensive networks in Europe by replacing signalling equipment with digitized mostly wireless versions and by creating a single Europe-wide standard for train control and command systems. ERTMS consists of two main components: the European Train Control System (ETCS) - a standard for in-cab train (i.e. vehicle on-board) control, and GSM-R- the GSM mobile communications standard for railway operations (Infrastructure Manager i.e. IM). Interoperability is an essential element of rail freight competitiveness, which implies a strong coordination between infrastructure managers and a standard control command system. Two factors should also to be taken into consideration, the timing of the coordination and the cost of the ERTMS. One of the problems that the multimodal transport system faces is the introduction of information and communication technology (ICT) based services: Shippers and freight forwarders require real-time tracking & tracing (T&T) information about the position of their consignments while on a multimodal transport haul. In addition to track and trace, condition monitoring and security issues need to be addressed to position rail at a level where it can compete with the road transport sector on product and service grounds. T&T and monitoring technologies constitute the core of such automated real-time information systems. While a range of different technologies for the tracking, tracing and monitoring of mobile resources is provided, only limited systematically compiled information is available about their performance and suitability for multimodal transport. In this respect, the best-known T&T technologies are the Global Positioning System (GPS) and Automatic Equipment Identification (AEI) and their localization within the Global System for Mobile Communication (GSM). For 2030/2050, one approach may be the coordination of tracking and tracing systems together with terminal operations in particular intelligent entry/exit gates. This would allow the possibility to increase automation throughout the transshipment process and decrease terminal opening hours, as terminal operations could be based on train arrival times collected through real time train monitoring. For rail freight services, transport operators are obliged to reply to the requests of the shippers quickly, in the short term, requests can be very varied with no average, this should be considered during traffic management system development. A system, which has the capability to address this and to elaborate trans-European paths rapidly, would be beneficial. Alongside this, harmonizing the

D24.4. Final Technical Report of SP2 Freight
CAPACITY4RAIL SCP3-GA-2013-605650
30/09/2017
CAPACITY4RAIL PUBLIC Page 52
process and the software to elaborate new paths between IMs is important with a system, which has the ability to adjust slightly certain passenger paths, to avoid important disruptions of paths on long distance transport. The second important point is the cost of ERTMS which appears very heavy to keep freight competitive, specifically when it is to be adapted on existing locomotives which have a long life. The connections between the corridors and the industrial clusters, which may be apart from the corridors, have to be equipped with dual signaling system to enable a smooth delivery. FTMS – Freight Transport Monitoring System One example of a model for rail-multimodal traffic management system, was presented in WP21 wherein the findings from the completed project FTMS - Freight Transport Monitoring System (EC funded D2D project – implemented during 2002-5) were investigated. An FTMS will gather information about the movement of cargo through a position data network utilising a number of different sensors. This will ensure that information is available in the appropriate formats in all transport chains. The system can be used to monitor the actual transport operations and to provide feedback if schedules are not adhered to. The FTMS system has been designed to be a European global commercial service that will be able to provide status information to a number of subscribers, i.e. by many TCMS installations and other systems used for intermodal transport chain management. By being generic, the FTMS should be envisioned as a service that could be used by anyone transporting cargo in the physical infrastructure monitored by the FTMS. The FTMS should also be an open system and should have the capability to receive status information from a number of sensor technologies such as Automatic Equipment Identification, position sensors for cargo and load units, and transport means. TCMS - Transport Chain Management System (D2D project) The Transport Chain Management System will be provided with transport status information by the FTMS to be used for managing multimodal door-to-door transport operations. The main functions of the TCMS are: • Organize and initiate transport • Monitor and control operations • Visualize the transport status (including position of cargo, ETA, etc.). • Exchange product- and transport documentation (product certificates, quotations, proof of delivery, invoicing information, etc.). TCMS can handle all types of information related to managing such operations efficiently and handles all types of documents that are necessary to perform the transport and to evaluate the performance over time.
8.2 INDUSTRY SURVEY- RAIL TRAFFIC MANAGEMENT SYSTEM
8.2.1 INDUSTRY SURVEY RESULTS & RECOMMENDATIONS
ERTMS is a system, which aims to enhance safety, increase efficiency and decrease time spent at border crossings. Initially the EC aimed for 50% implementation across nine corridors by 2030. However, in January 2017 the EC acknowledged that these targets were unrealistic (rail technology magazine, 2017) and set a new deadline to install ERTMS on 50% of routes covered by nine core network corridors by 2023 with the final deadline 2030.
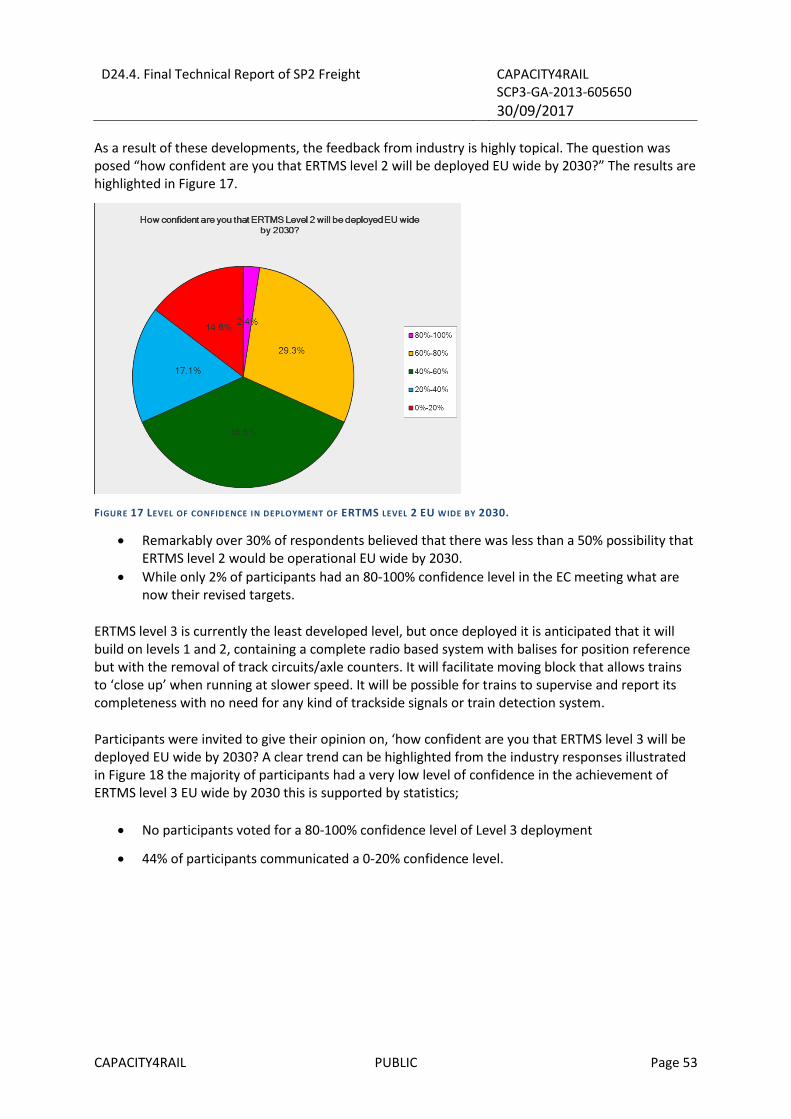
D24.4. Final Technical Report of SP2 Freight
CAPACITY4RAIL SCP3-GA-2013-605650
30/09/2017
CAPACITY4RAIL PUBLIC Page 53
As a result of these developments, the feedback from industry is highly topical. The question was posed “how confident are you that ERTMS level 2 will be deployed EU wide by 2030?” The results are highlighted in Figure 17.
FIGURE 17 LEVEL OF CONFIDENCE IN DEPLOYMENT OF ERTMS LEVEL 2 EU WIDE BY 2030.
• Remarkably over 30% of respondents believed that there was less than a 50% possibility that ERTMS level 2 would be operational EU wide by 2030.
• While only 2% of participants had an 80-100% confidence level in the EC meeting what are now their revised targets.
ERTMS level 3 is currently the least developed level, but once deployed it is anticipated that it will build on levels 1 and 2, containing a complete radio based system with balises for position reference but with the removal of track circuits/axle counters. It will facilitate moving block that allows trains to ‘close up’ when running at slower speed. It will be possible for trains to supervise and report its completeness with no need for any kind of trackside signals or train detection system.
Participants were invited to give their opinion on, ‘how confident are you that ERTMS level 3 will be deployed EU wide by 2030? A clear trend can be highlighted from the industry responses illustrated in Figure 18 the majority of participants had a very low level of confidence in the achievement of ERTMS level 3 EU wide by 2030 this is supported by statistics;
• No participants voted for a 80-100% confidence level of Level 3 deployment
• 44% of participants communicated a 0-20% confidence level.

D24.4. Final Technical Report of SP2 Freight
CAPACITY4RAIL SCP3-GA-2013-605650
30/09/2017
CAPACITY4RAIL PUBLIC Page 54
FIGURE 18 LEVEL OF CONFIDENCE IN ERTMS LEVEL 3 DEPLOYMENT EU WIDE BY 2030
Several respondents offered valuable comments on this topic;
▪ No need of ERTMS for Freight ▪ Depends on which system and when Germany install, and if operators can finance ETCS. ▪ There is a lack of understanding as to what Level 3 offers. There is an illusion that it is all
about moving block. It isn't. It is about capital cost saving, flexibility, sustainability (less copper etc) and reliability. Therefore people don't have the right business plan. Similarly, there is a lack of understanding about so-called ERTMS Regional. It is merely a way of reducing the infrastructure capital costs even more
▪ At present no real technical solutions for ERTMS Level 3 are existing - therefore implementation by 2030 cannot be expected
▪ There is no business case for comprehensive deployment on all lines - likely on main lines only ▪ If we continue like this, it will takes us another 20-30 years to roll out ETCS. L2 has typically
less performance than traditional systems due to more restrictive braking curves! L3 requires end of train devices which railways are not willing to buy.
Addressing a different aspect of traffic management, participants were asked for their viewpoint on which aspect of the big disruption process is most critical for freight services. Big Disruption was classified as; unplanned events that required a change to the way in which resources were originally planned and managed. The management of large disruptions involves RUs and in some cases several IMs. Respondents were requested to rank aspects of the big disruption process in order of which are the most critical for freight services. Where 1 is Most critical and 6 is Least critical. This supports some of the research undertaken in SP3. TR is equal to total responses and P stands for position as where two numbers in the position column are the same they received an equal number of responses.

D24.4. Final Technical Report of SP2 Freight
CAPACITY4RAIL SCP3-GA-2013-605650
30/09/2017
CAPACITY4RAIL PUBLIC Page 55
TABLE 17 TOTAL RESPONSES ASSIGNED TO EACH ASPECT OF THE BIG DISRUPTION PROCESS
Table 17 reveals the number of responses assigned to each aspect of the big disruption process, where two numbers in the position column are the same they received an equal number of responses. Table 17 demonstrates that withdrawal of a path because of track works without reasonable notice is considered the most critical aspect of the big disruption process for freight by industry stakeholders as it has received the highest number of ‘1’ responses. This result is in line with industry response to an earlier question about the implementation of an EU wide high speed network where maintenance and a lack of maintenance coordination was highlighted as of importance to industry members.
In order to determine a comprehensive view, and demonstrate the overall ranking among the aspect most critical for freight services, a weighted ranking was calculated. Wherein 6 points were awarded for each response where the improvement had been ranked most urgent. 5 points for a ranking of 2, 4 points for a ranking of 3 etc. and 1 point awarded for each response where the improvement had been ranked 6 or least urgent, the results are displayed in Table 18.
TABLE 18 WEIGHTED RANKING OF MOST CRITICAL ASPECTS OF THE BIG DISRUPTION PROCESS
The results display that from an industry viewpoint, the two aspects of the big disruption process most critical for freight services are; infrastructure degradation and path withdrawal because of works without reasonable notice. Also of note, the aspect ‘Other’ received the highest number of
Ranking for Most Critical in order
TR P TR P TR P TR P TR P TR P
Crew delay or
unavailability6 3 7 2 4 4 10 1 5 3 5 3
Train failure in station 1 5 6 3 3 5 9 2 9 1 9 2
Train failure during
journey7 2 6 3 9 2 6 4 5 3 3 5
Infrastructure
degradation6 3 8 1 11 1 7 3 2 4 3 5
Withdrawal of a path
because of track works
without reasonable
notice
12 1 6 3 3 5 4 5 8 2 4 4
Other causes- Strikes,
external factors such
as weather
5 4 5 4 7 3 1 6 9 1 10 1
Aspect of big
disruption process Ranking Ranking Ranking Ranking Ranking Ranking
Aspect of big
disruption
process
Infrastructure
degradation
Withdrawal of a
path because of
track works
without
reasonable
notice
Train failure
during journey
Crew delay or
unavailability
Other causes-
Strikes, external
factors such as
weather
Train failure in
station
Total points 148 146 139 132 114 102
Overall
Ranking1 2 3 4 5 6
D24.4. Final Technical Report of SP2 Freight
CAPACITY4RAIL SCP3-GA-2013-605650
30/09/2017
CAPACITY4RAIL PUBLIC Page 56
responses for 6 least critical, yet in the overall ranking it was ranked 5th. Alongside this, infrastructure degradation collected the highest number of responses for the critical ranking ‘3’ yet in the overall ranking it was first.
9 Multimodal Transport Information
In the EU Transport White Paper (2011), the EC outlined their vision for an overall framework for information exchange between different actors, where logistics stakeholders along the supply chain are linked electronically by standardised electronic documents (Multimodal e waybill). Together with this, administrative procedures would be streamlined with the implementation of a single window (single access point) and one stop shop for administrative and legal procedures.
Today, a number of Multimodal Transport Information (MTI) systems exist which can be categorised into; freight resource management systems, terminal and port information communication systems, freight and fleet tracking and management systems and applications and integrated operational informational/information exchange platforms. Across the transport chain, MTI consists of a variety of needs for a freight purchaser, railway undertaking and terminal operator consists of a variety of different needs. The possibility of real time tracking and tracing of where is cargo currently is located and when it could be expected to arrive (the ETA) is critical. Meaning that MTI needs to provide information not only on the basis of where the cargo is currently located but also in a wider context including relevant information to the rail operator and the arrival terminal. This should include information regarding type of cargo, type of loading unit, type of wagon.
Currently, this kind of information is sent between the various stakeholders (freight purchaser, undertaking, terminal operator) “manually” by various forms of EDI-solutions for example; Hermes VPN, COTIF/CIM, CIM/SMGS, ORFEUS, ISR, USE-IT, Rolling Stock Reference Database, Train Information System, X-Rail. For further information please refer to D21.2 (2017).
9.1 KEY INNOVATION PROCESSES & TECHNOLOGIES IN MULTIMODAL
TRANSPORT INFORMATION
To visualise the operational process at a terminal for combined transport and the data flow consider the illustration below.

D24.4. Final Technical Report of SP2 Freight
CAPACITY4RAIL SCP3-GA-2013-605650
30/09/2017
CAPACITY4RAIL PUBLIC Page 57
FIGURE 19 SIMPLIFIED OVERVIEW OF DATA FLOW AT A COMBINED TERMINAL
For several of the sub processes illustrated in Figure 19innovations and technologies have been proposed to streamline the flow of transport information. During ‘arrival data collection’ if relevant data could be gathered and compiled when an intermodal loading unit (ILU) arrives to the terminal, the time it takes to load the ILU onto a pre-planned dedicated wagon would decrease.
For the transfer of ‘departure data’, to increase efficiency if data could be transmitted automatically on train departure without any errors to the receiving terminal, this would also increase the efficiency at the receiving terminal. Streamlining both the arrival and departure data processes would lead to a decrease in the dwell times for trains, trucks and ILU as a whole.
It is widely recognised, that incorrect ILU data at the terminals creates major bottlenecks within the freight chain and is a key barrier to improving the speed and efficiency of multimodal rail freight transport. An innovation to address this would be the development of intelligent entry and departure gates at the terminals together with establishing a common standard/interface to transmitting data between the terminals. This would incorporate intelligent gates equipped with cameras that not only have the capability to take a photograph of the ILU but are also able to analyse the information obtained and use this information appropriately.
It is anticipated that intelligent entry and departure gates would provide a benefit to terminal operators during the centralized load planning of the departing train as this would simplify the process, together with accelerating the availability of in-/outbound train documentation. Alongside this, as a result of the train documentation being available more quickly an automatic comparison could be carried out between the pre-defined data sent from the forwarder to the terminal meaning that deviation reports could be created instantly. As a result, if corrective action was required this could be deployed much more quickly. Another benefit to terminal operators of this improvement would be on train departure, as when the loaded train departs relevant data could be sent immediately to the terminal of arrival. This would improve efficiency at the arrival terminal, both for unloading the units and it would allow earlier planning of the best use of the wagons once they have been unloaded.
For example, today when entering certain car parks your car plate is automatically read and the barrier opens. The same should apply at train entrance as well as the truck entrance with the reading of the swapbody or container number and code and the identification of the truck and the wagon; with the identification of the ILU all transport data should become available to enable a smooth process to start. Pre-arrival information should have been given at the departure yard for the train with an ETA updated during the travel progression in order to prepare actions in the terminal. During

D24.4. Final Technical Report of SP2 Freight
CAPACITY4RAIL SCP3-GA-2013-605650
30/09/2017
CAPACITY4RAIL PUBLIC Page 58
the process in the terminal the data concerning the travel of the ILU should be updated and sent to the operator of the next link of the transport chain and to the customer for their information.
FIGURE 20 DATA LABELS ON A TYPICAL MULTIMODAL TRANSPORT UNIT
Figure 20 illustrates some of these data attached to a typical multimodal transport unit. Currently this information is registered and forwarded on manually at the departing terminal and forwarded on manually to the arrival terminal.
If the information attached to the ILU could be gathered and analysed automatically, the estimated time of arrival (ETA) to the final point of delivery would be much more easily predicted and the time from departure to ETA would be shorter. This would be advantageous to all the stakeholders along the transport chain. Another benefit would be a decrease in the number of manual errors, which today affects the transit time, the loading- and unloading time required at the terminals.
9.2 BARRIERS TO AN EU MULTIMODAL TRANSPORT INFORMATION
SYSTEM
Despite EC investment in numerous research and development projects (Belogic, Freightwise, Viwas, Comcis, Welcom, FMan, MTrade, Themis), several barriers remain before a fully automatic system for freight can be realised. Barriers are varied and depend on geographic location, transport mode, and stakeholders, however the main barriers inhibiting MTI can be categorised as user based, technology based, policy and operational.
In section 9.1 it was highlighted that multimodal transport unit data is currently captured and transferred manually. From a technology perspective, it can be argued that the main barrier is not a lack of technology, the obstacles lie within interoperability and compatibility between different transport modes and IT platforms along the multimodal chain. This was stressed in the EC e-Freight Roadmap developed in May 2013, highlighted as a lack of coordination of developments across modes, countries and stakeholders.

D24.4. Final Technical Report of SP2 Freight
CAPACITY4RAIL SCP3-GA-2013-605650
30/09/2017
CAPACITY4RAIL PUBLIC Page 59
Another issue can be identified as a lack of standardisation both in the format of data and in the method by which it is transferred leading to the problem of low compatibility and a lack of interconnectivity. As highlighted in the Freight and Logistics Action Plan, (2007) another technological barrier is data security. Insufficient standardisation, data security and privacy issues were emphasised, this raises questions such as who owns these data at each point along the transport chain and who is responsible for it? Subsequent to data security is the issue of data sharing, this was an issue explored during the industry survey to gain a consensus on the willingness to share data so that other customers could book remaining capacity. The results are presented in 9.3.
From a user perspective, one of the restraints identified is the size of the company, as in comparison to large multinationals, smaller companies are restricted by the financial and human resources they can contribute to deploying MTI systems. Alongside this, a progressive attitude is required by company management with regards to investment, as it will also require recruitment of specialist staff to operate the system, which may be another obstacle for smaller businesses. It should be noted that all barriers have close links for example user perspective problems are closely linked to policy barriers, as a lack of standardisation across countries, between technology interfaces and amongst infrastructure, ultimately influences user operation of MTI systems. From a policy perspective, improved policy coordination is required to overcome the barrier of an individual approach to multimodal transport by each member state. For the EC to reach their target of a one stop administrative shop, a transnational policy is required including standards on privacy, data sharing and data transfer which considers all modes, stakeholders and countries.
9.3 INDUSTRY SURVEY- MULTIMODAL TRANSPORT INFORMATION
9.3.1 INDUSTRY SURVEY RESULTS & RECOMMENDATIONS
To gain an insight from rail operators, infrastructure managers, terminal operators etc. on this topic, a series of questions were presented. Firstly ‘numerous platforms exist which act as an online brokerage system for multimodal transportation. Please list any that you are aware of below’
FIGURE 21 RESPONDENT AWARENESS OF ONLINE BROKERAGE SYSTEMS
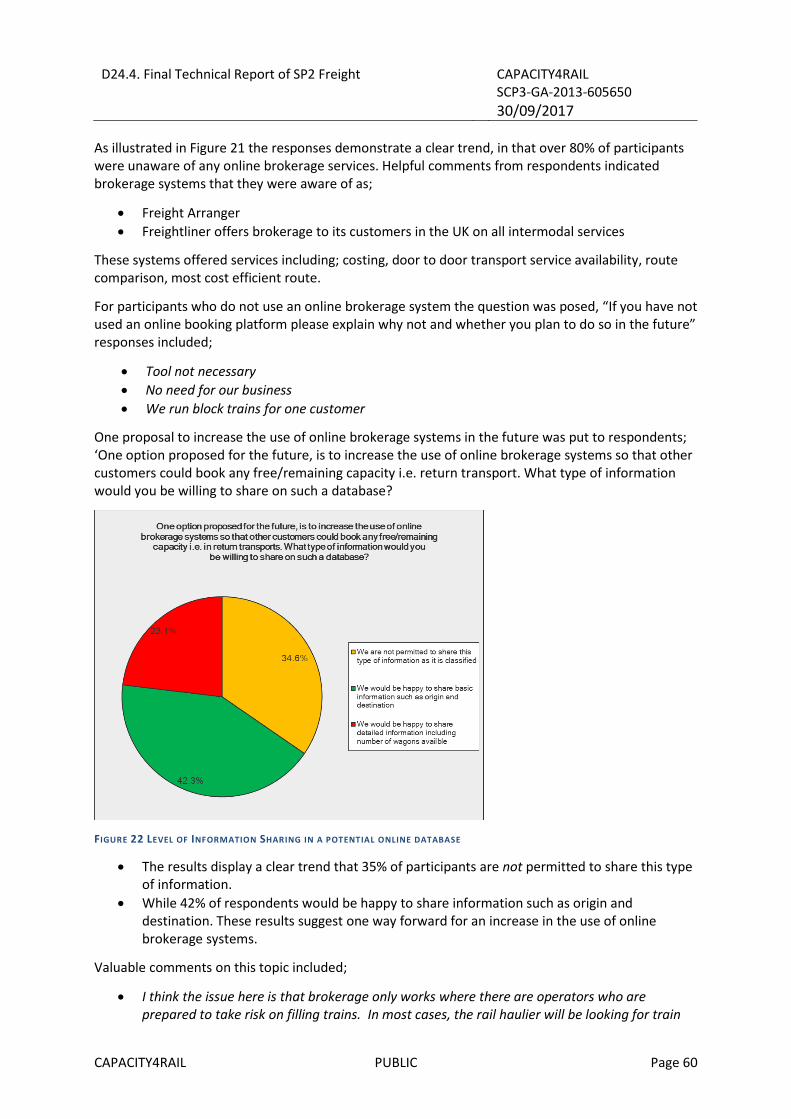
D24.4. Final Technical Report of SP2 Freight
CAPACITY4RAIL SCP3-GA-2013-605650
30/09/2017
CAPACITY4RAIL PUBLIC Page 60
As illustrated in Figure 21 the responses demonstrate a clear trend, in that over 80% of participants were unaware of any online brokerage services. Helpful comments from respondents indicated brokerage systems that they were aware of as;
• Freight Arranger
• Freightliner offers brokerage to its customers in the UK on all intermodal services
These systems offered services including; costing, door to door transport service availability, route comparison, most cost efficient route.
For participants who do not use an online brokerage system the question was posed, “If you have not used an online booking platform please explain why not and whether you plan to do so in the future” responses included;
• Tool not necessary
• No need for our business
• We run block trains for one customer
One proposal to increase the use of online brokerage systems in the future was put to respondents; ‘One option proposed for the future, is to increase the use of online brokerage systems so that other customers could book any free/remaining capacity i.e. return transport. What type of information would you be willing to share on such a database?
FIGURE 22 LEVEL OF INFORMATION SHARING IN A POTENTIAL ONLINE DATABASE
• The results display a clear trend that 35% of participants are not permitted to share this type of information.
• While 42% of respondents would be happy to share information such as origin and destination. These results suggest one way forward for an increase in the use of online brokerage systems.
Valuable comments on this topic included;
• I think the issue here is that brokerage only works where there are operators who are prepared to take risk on filling trains. In most cases, the rail haulier will be looking for train

D24.4. Final Technical Report of SP2 Freight
CAPACITY4RAIL SCP3-GA-2013-605650
30/09/2017
CAPACITY4RAIL PUBLIC Page 61
fill from contracted customers, or see previous comments on 3PLs. So we need to get the structure of services right before online brokerage can really find its feet.
• I have my clear doubts about the potential for on line brokerage system - the market needs to decide to go intermodal or not!

D24.4. Final Technical Report of SP2 Freight
CAPACITY4RAIL SCP3-GA-2013-605650
30/09/2017
CAPACITY4RAIL PUBLIC Page 62
9.4 SUMMARY OF THE MAIN FINDINGS FROM WP24
Output produced under SP2 has been consolidated to develop a catalogue for rail freight systems for 2030/205 D24.2 Final Catalogue Rail freight systems of the future. Wherein rail freight system designs have been presented under six subtopics; freight modal shift from road-rail, EU wide high-speed network, Multimodal TEN-T core network, Long term comprehensive network, Traffic management systems in all modes, Multimodal Transport Information in line with the EC White Paper (2011) challenges.
The results from a comprehensive industry survey to determine the potential market up take of the new designs developed during the course of SP2 freight, offer an informative overview from industry on the level of receptivity and acceptance of the system designs in relation to performance, operational and technical characteristics.
Freight modal shift from road to rail and other environmentally friendly modes, was identified as one of the central challenges of the White Paper (2011). From SP2, important innovations put forward to encourage modal shift related to wagon design, included;
• For car carrier wagons, 5 bodies with 6 axles for an overall length of 62m
• For container wagons, a standard train composed of slightly rebuilt wagons capable to carry 40’ containers or 20’ containers plus on every third wagon a 45´container.
• For container wagons, a new design of a five bodies wagon with six bogies for five 45´containers with an overall length of around 72m. This solution aims to reduce the number of bogies and hence the maintenance cost.
• For crane-able semitrailers with a 4 bodies wagon with 6 bogies for four trailers with an overall length of around 67m.
• To reduce significantly the preparation time before the departure of the train with the introduction of an EOT (End Of Train) device.
Analysis of industry feedback identified from current wagon designs; Special flat wagon with bogies, Ordinary flat wagon with bogies, Tank Wagon as the three wagons which would be utilised most frequently to facilitate modal shift from road to rail. These results offer an indication of the type of goods industry representatives believe will be captured by rail during modal shift; flat wagons to carry boxes, trailers, food, containers and swap bodies together with tank wagons to transport fuels.
Industry participants were asked to rank wagon improvements for 2030/2050. It can be concluded that the improvement identified as ‘most urgently’ required by industry was the design of lighter freight wagons. The list below highlights all the wagon improvements as ranked in order of importance by industry participants.
1. Lighter wagons 2. Maintenance detectors 3. Track friendly running gear 4. Automatic couplers 5. End of Train Device 6. EP Brakes
To achieve an EU wide high-speed network, SP2 recognised the need to adapt freight rolling stock and infrastructure to operate at high speed. For rolling stock this included; adaptation of curtain siders to high speed, brake capacity of the wagon, achievement of automatic coupling. While infrastructure adaptations included; implementation of new technologies, solution to the current
D24.4. Final Technical Report of SP2 Freight
CAPACITY4RAIL SCP3-GA-2013-605650
30/09/2017
CAPACITY4RAIL PUBLIC Page 63
lack of standardisation and axle load. Alongside this, a lack of targeted infrastructure investment was highlighted by a number of respondents as one of the barriers to attaining a high-speed freight network.
Important conclusions from the industry survey analysis indicated;
• 120km/h as an achievable high-speed for freight services across the network by 2030
• It is notable that only 4.5% of participants were 80-100% confident that this would be achieved
Terminals play a vital role to ensure the connection between different modes within a multimodal TEN-T core network. WP23 explored case studies of various terminal typologies each located along TEN-T multimodal corridors and proposed innovations to increase terminal efficiency. Innovations for Rail-Road and Rail-Sea Terminals included;
• Handling typologies
• Handling equipment
• Handling layout
• Terminal Access- ICT technologies
• Internal Moving Vehicles- Locomotive
• Technological Systems: Control and Security
• Terminal Working Hour
• Conceptual Train Side Layout
• Conceptual Horizontal Handling
While for rail-rail terminals/marshalling yards, the following innovative operational measures and innovative technologies were put forward;
• Rolling Stock Equipment
• Marshalling Yard layout- track operative length
• Terminal Access ICT technologies: Vehicle identification and transport documentation exchange.
Feedback from industry concluded that the innovations for rail-road and rail-sea terminals most urgently required are;
• Automatic ITU and Vehicle control and data exchange
• Longer Trains
• 24 hour working time
For Rail-Rail Terminals;
• Automatic coupling and decoupling
• Automated vehicle identification
• Longer operative track length
Finally the option of automated terminals for liner services with horizontal transfer of containers has been explored including potential benefits such as;
• Cost reduction of terminal handling per unit by approximately 60%;
• Break-even point for intermodal will be reduced from 500 km to 300 km;
• Energy consumption for terminal handling will be reduced by 93% CO2 emissions in kg per unit will
be reduced by 99% with electric propulsion

D24.4. Final Technical Report of SP2 Freight
CAPACITY4RAIL SCP3-GA-2013-605650
30/09/2017
CAPACITY4RAIL PUBLIC Page 64
Increased automation across all terminal typologies is of high importance to industry for the rail terminal design of 2030/2050.
EU regulation stipulates that TEN-T network development will follow a dual layer approach, alongside the core network, a comprehensive network with equal enhancement of non-core infrastructure across Eastern and Western Europe will be developed.
To achieve this, interconnections and interoperability between transport networks, transport modes and different countries are required. For rail, interoperability can be enhanced through;
• Improving compatibility between multimodal transport systems
• Standardisation of rail gauge
• Standardisation of traffic management systems
• Standardisation of legislation and track access charges
It can be concluded that the main benefits of a comprehensive network for the freight industry would be the potential to increase market demand, economic benefits such as cost reduction and increase in efficiency and reliability.
Looking towards 2030/2050 barriers to a comprehensive network still to be addressed were classified by industry as;
• Economic- Infrastructure and track access costs
• Political- prioritisation of freight services
• Infrastructure- Lack or imbalance of investment
• Demand for freight services- lack of certainty of freight services
The development and implementation of new technologies to increase efficiency in multimodal transport was recognised in the White Paper as a challenge for traffic management systems. WP21 explored and reviewed numerous systems for traffic and operational development and operations and planning including the impact of ERTMS on freight capacity.
It was concluded that;
• A better signalling system, shorter block lengths and in the long term introduction of ERTMS level 3 as one of the most important needs for operational development 2030/2050.
• The main barriers to developing information and communication technologies and services are; a lack of training, the conservative attitude of incumbents and low profitability in the sector. To address this, these gaps must be addressed to achieve modal shift.
• Real-time monitoring systems including both on board and wayside mounted systems should be considered vital for rail freight services 2030/2050.
Notable findings from industry regarding ERTMS implementation include;
• 36% of participants were 40-60% confidents that ERTMS level 2 will be deployed EU wide by 2030
• Notably, only 2% of respondents were 80-100% confident of the achievement of EU wide deployment
For deployment of ERTMS, level 3
• No participants were 80-100% confident of EU wide deployment of ERTMS level 3 by 2030
• 44% of respondents communicated a 0-20% confidence level

D24.4. Final Technical Report of SP2 Freight
CAPACITY4RAIL SCP3-GA-2013-605650
30/09/2017
CAPACITY4RAIL PUBLIC Page 65
To increase efficiency along multimodal transport chains, the EC are targeting new technologies for multimodal transport information (MTI) and a framework for a MTI management and payment system by 2020. Within WP21 a review of several systems for freight train monitoring and real time information management was carried out and an example of a Freight Transport Monitoring system developed and implemented during the EC funded D2D project (2002-2005) was presented. The FTMS has the functions of; organise and initiate transport, monitor and control operations, visualise the transport status and exchange product and transport documentation. Looking towards 2030/2050 it was concluded that;
• For rail to compete with road it has to take advantage of the IT and MTI possibilities to ensure it has an efficient means of transport control
• Rail continues to develop as a new intermodal transport mode consequently the development of MTI technologies are of high importance.
Important findings from industry regarding multimodal transport information systems;
• 81% of respondents were not aware of any online brokerage systems
• 35% of participants would not be permitted to share any information in a database of an online brokerage system which could be implemented to book free or remaining capacity on rail services.
10 MAIN FINDINGS ON STANDARDS
10.1 PROPOSED STANDARDS FOR WAGONS , LOCOMOTIVES , GAUGE,
INFRASTRUCTURE DESIGN, TRAIN MANAGEMENT , INFRASTRUCTURE
MANAGEMENT
The main objective is to propose new vehicle designs able to improve the main KPIs of rail freight transport: competitiveness, reliability, capacity of transport, network capacity and sustainability. These improvements were to be checked on the basis of their ability to be introduced on the network as regards general train management, of their market uptake and of a realistic deployment roadmap.
The safety of the proposed innovative wagons or of innovative devices to be fitted to the wagons had to be checked. Their running safety was tested by simulation by KTH university of Technology and certain recommendations were issued for movements in very tight curves in shunting areas.
A cost benefit analysis has been performed for the various proposals comparing the cost increase for such wagons to the capacity increase, assuming that today existing wagons were operating profitably. However a check made among wagon keepers showed that as long as existing amortized wagon fleet was available and that no new legal requirements were preventing their utilization the investment decision would be postponed.
The main innovations that would be welcomed, are those needing minor investments without mobilizing wagons outside their regular overhaul periods, generating immediate operational gains in competitiveness, in market attractiveness, in reliability and in network capacity.

D24.4. Final Technical Report of SP2 Freight
CAPACITY4RAIL SCP3-GA-2013-605650
30/09/2017
CAPACITY4RAIL PUBLIC Page 66
The main innovations fulfilling these criteria are: the lengthening of the trains with the EOT, the flexibility of carrying 30% of 45’ containers on trains optimized for 40’ containers, the connectivity devices linking sensors incorporated to certain components to the locomotive via a smart box enabling to provide customers with track and trace of their shipments with a control of crucial elements like temperature and security for example. The connectivity devices which allows the compulsory brake test before each departure to be performed directly by the train driver, will appear rapidly. The possible increase of axel load from 22,5T up to 25T for wagons carrying heavy stuff should be recommended for new buildings.
Important investments like automatic couplers do not have a valid business case currently, until logistics by a couple of wagons can demonstrate its viability.
However if a certain fleet of wagons are dedicated to shuttle trains, for a long period investments on EP braking systems could be envisaged. This is for a number of reasons; the asset utilization will be improved as more efficient paths will be attributed due to the capacity of such trains to adapt their speed without long delays, as the risk of deterioration of wheel tread due to new composite brake shoes, necessary for noise reduction, is reduced .
The standard wagon of 2030 is interesting to define, as it should provide guidelines for the new building, avoiding designs incompatible with a probable evolution.
Multibody wagons will certainly appear if the rail freight transport increases, as expected in the White Papers of the EU. This implies that central connections by draw-bars must remain possible as well as the installation of central couplers. The structure of the new wagons must preserve that possibility and it must be compulsory in the TSIs. This is a strong recommendation as this obligation has been recently waived.
The standard wagon in the short term will be connected to the central base via smart boxes on wagons, enabling to create a train network or in case of isolated wagons on a shunting area to connect directly by GSM with the central base. The train network enables the locomotive to transfer information coming from the train network to the central base, thus saving energy of the smart boxes placed on the wagons. The use of LPWAN on the wagon and a mesh system on the train enable to have long life batteries lasting 8 years for the smart box.
The use of the EOT will spread rapidly, as soon as new communication solutions via the brake pipe will increase the safety of the system. This may become a standard if this process is successful.
The future of rail freight implies gains of competitiveness and reliability as well as the best use of the network capacity.
The improved knowledge of the network characteristics in real time may allow RUs and wagon keepers to optimize the use of the network and enter some major potential markets like semi-trailer transportation by horizontal transfer implying no investments by the road haulier. The existing solutions will benefit immediately from this up-to-date knowledge and new buildings will be required on which the innovations proposed in WP22 like multi-body wagons could be applied. The potential of development in that respect is important.
At the same time, if automated transfer of ILU develops in dry ports, shuttle trains may link them to automated hubs and terminals and competitive new wagons may be dedicated to such traffic, as long as predictive maintenance based on connected devices is developed on such fleets.
For wagon load traffic, as explained here above, competitiveness requires a very high level of punctuality, automated marshalling implying automatic couplers (by couple of wagons), duo-

D24.4. Final Technical Report of SP2 Freight
CAPACITY4RAIL SCP3-GA-2013-605650
30/09/2017
CAPACITY4RAIL PUBLIC Page 67
locomotives, road-rail engines to perform the last mile runs (homologation is progressing in Germany). This will only be possible with guaranteed paths obtainable for trains equipped with EP Braking.
The table below suggests a possible timing for the deployment of these innovations.
TABLE 19 TIMING FOR POTENTIAL MARKET UPDATE OF DIFFERENT INNOVATIONS

D24.4. Final Technical Report of SP2 Freight
CAPACITY4RAIL SCP3-GA-2013-605650
30/09/2017
CAPACITY4RAIL PUBLIC Page 68
TABLE 20 STANDARDS PROPOSED IN THE VARIOUS FIELDS
TOPIC TARGETS MOTIVATION IMPACT Wagons
Multi-body wagons Connected wagons equipped with sensors Structure designed for development of central couplers. EP brakes equipment Automatic couplers
Better use of train length, monitor of wagon and cargo status, track and trace of the shipments
No change in TSIs but for EP Brakes and central automatic couplers Increased competitiveness, reliability, safety and information for customers
Locomotives
Multi-current, track friendly with high axle load (normal 22,5T), duo-locomotives or hybrid locomotive Connected to base servers
Interoperability, best use of the power, possibility to serve non electrified sidings Track and trace Remote technical support
Increased interoperability; seamless door to door service; increased punctuality, reliability and competitiveness Transfer of train information to base servers
Gauge
Accurate and updated information on real infrastructure existing gauge and gauge C for new routes
Optimize the use of existing clearance profiles for semitrailer transport with efficient wagons, harmonize gauge on corridors to northern and eastern Europe
Enter the non craneable semitrailer transport segment and the oversized containers and swap bodies. Infrastructure TSI to be reviewed.
Trains
Trains up to 1000M with one locomotive. Coupled trains with distributed traction up to 1500M.
Network capacity saving, increased competitiveness
Increased competitiveness. Infrastructure design to be reviewed on authorized routes for efficient and safe traffic management.
Infrastructure design
Gauge C for new routes, adaptation of terminals, sidings and critical points to trains of 1000m with one locomotive and 1500m with distributed traction
Ensure safe and efficient train management
Increased competitiveness, open new market segments
Train management ERTMS L3 low cost for freight trains
Interoperability affordability
Seamless cross border transport.
Infrastructure management
Maintenance works by tracks (for double track lines), coordination of works to preserve continuity of itineraries, diverted routes with 6 month notice, new structure to reduce maintenance periods and costs.
Preserve traffics Competitiveness, reliability

D24.4. Final Technical Report of SP2 Freight
CAPACITY4RAIL SCP3-GA-2013-605650
30/09/2017
CAPACITY4RAIL PUBLIC Page 69
10.2 REVIEW OF THE IMPACT ON THE TECHNICAL STANDARDS FOR
INTEROPERABILITY
The impact on the TSIs
The global impact on the TSIs will result from the final vision of the future freight train.
The train length extension will become unavoidable in the near future because of the scarcity of money for new investments and the difficulty to execute these investments because of the restrictions on the traffic. This implies that solutions enabling an increase in capacity with the smallest and the least traffic constraints will become major drivers.
For that reason, all connectivity developments inducing optimal capacity and asset utilization will become priorities. Solutions such as Marathon trains or trains with end of train device (EOT) or better use of existing train length requiring only extension of sidings to keep a smooth train management, in line with the increase of number of such trains will be second priority. Improvement of transfer points with increased automation will have a high priority to enhance competitiveness, as well as horizontal collaboration between actors to ensure the best use of train transport capacity.
Increased train performance with safe maneuverability will have high priority as for infrastructure managers this immediately enhances network capacity use.
Alongside these developments, higher axle load where possible on door to door routes will be interesting if investments do not hamper capacity during the works.
Solutions to enhance structure clearance profile are extremely urgent and should be carried out at critical points with as short as possible interruptions of traffics.
10.3 SUMMARY ON STANDARDS
The future freight train vision: longer, more maneuverable, connected, more reliable, will impact TSIs on certain points:
• Authorizing longer trains on certain routes with the adequate number of longer sidings and
adaptations to the control command system, as long as their performance on acceleration,
braking are the same as today or even better. (No issue with ERTMS level 3)
• Reinforcement of energy availability will be most urgent and TSIs should be adapted
accordingly
• Definition of real structure gauge with adequate and updated information is urgent
• Introduce the EOT device equipped trains in the TSIs
• The speed of the train will still be in-between 100km/h and 120km/h
• The 25T axel load will be authorized on certain door to door runs
• Many modifications will happen simultaneously in the commercialization with web
platforms to exchange data on transport offers and demand, in order to find those that can
be matching under trustees to control and optimize the use of the train capacity both in
length, volume and weight.
• Liner trains with inter-mediate small-scale automatic terminals with horizontal transfer of
containers and swap-bodies

D24.4. Final Technical Report of SP2 Freight
CAPACITY4RAIL SCP3-GA-2013-605650
30/09/2017
CAPACITY4RAIL PUBLIC Page 70
• Rolling motorways will develop largely with long trains or coupled trains as long as it
enables to match the road competitive prices.
• For high speed traffic demand for less than wagon load transport, some trains running at
160km/h or more up to 200km/h will be equipped with ABS to avoid damaging
infrastructure. This potential development, will be dependent on the toll policy of the IMs.
• For wagon load traffic, automatic couplers for groups of wagons (for one destination) will
enable total automation of marshalling. Final delivery to private sidings or terminals will be
done by Rail road engines. All wagons will be connected which will enable full automation
of marshalling, efficient train loading and optimized organization of distribution and data
sharing.
• All this progress will only be possible if the reliability of transport matches the road
transport level above 90%.
• Final progress will be achieved with automated train for final delivery on single tracks,
before wider automation of freight trains on certain tracks which will be properly equipped.
For these new trains, a fundamental adaptation of TSIs will be unavoidable as soon as
responsibility problems resolved.
11 Summary and Conclusion
This report has combined the main outcomes from WP21 Progress beyond State of the Art on Rail Freight System, WP22 Novel Rail Vehicles, WP23 Co-modal Transhipment and Interchange/Logistics. Together with the outcomes of previous Tasks of WP24 in particular Final Catalogue of Specification – Rail Freight System of the Future and Standards including the survey to explore the potential of market up-take of the future rail freight system proposed in previous SP2 deliverables. This deliverable combines the results from the extensive industry survey that took place between 15 November to 19 December 2016, together with the main technical findings from each of the SP2 work packages, to produce a unique and thought provoking set of results for each aspect of the rail freight system of the future.
Our study in WP21 finds that most previous forecasts demonstrate an increase of 60% in total freight demand by 2050 and approximately constant market share with a business-as-usual scenario. To fulfil the targets in the EU White Paper, it is necessary to roughly double rails’ market share from 18% in 2011 to at least 36% in 2050. This means that the tonne-kilometres will be 3.6 times as much as today and 2.4 times as much as in a business-as-usual scenario in 2050.
To reach the White Paper target of modal shift to rail, it is necessary to both increase quality and capacity and lower the cost of rail freight. The customers must be able to trust the delivery time to meet the requirements of their logistic chain and the cost must be competitive with road freight. A system approach is therefore needed and the critical development lines must be identified.
Under WP22, several designs have been studied, for car carrier wagons reaching 5 bodies with 6 axels for an overall length of around 62m. For container traffic, two ideas have been studied. Firstly, to introduce in a standard train composed of wagons capable to carry 40’containers or 40’ plus 20’ containers a partial flexibility to transport a third container type of 45’ without lengthening the trains

D24.4. Final Technical Report of SP2 Freight
CAPACITY4RAIL SCP3-GA-2013-605650
30/09/2017
CAPACITY4RAIL PUBLIC Page 71
and with minimal changes on the wagons. The second idea studied was a new design of a 5 bodies wagon with 6 bogies for an overall length of around 72m. This solution was aiming to reduce the number of bogies and hence the maintenance cost. Another idea was to develop the same concept for transport of crane-able semitrailers with a 4 bodies wagon with 6 bogies for an overall length of around 67M. For the new wagon designs the cost benefit analysis (CBA) show interesting progress for the car carrier wagon and the container wagon but not for the pocket wagons. The flexibility of putting a third of the number of container with a length of 45’ without lengthening the train may be very promising. Finally, an extremely promising field is to significantly reduce the preparation time before the departure of the train with the introduction of an EOT (End of Train) device. It is expected that this will have a short lead for delivery, with the introduction of these new designs on the Network and with a possible roadmap to mobilize investors to create these new wagons.
Terminals are a key element of transport services and the C4R consortium considered three types of terminals. The main goal of WP23 was to suggest suitable methods to evaluate terminal performance for the following terminal types;
• Rail to road for shorter range units transfer;
• Rail to waterways for rail feeding from ports.
• Rail to rail for shunting wagonloads;
The evaluation of the terminal performance and the influence on them of innovative operational measures and technologies is based on selected case studies, combining analytical methods based on sequential application of algorithms (e.g. from queuing theory) and discrete event simulation models, capable to quantify different KPI. Our study found that the implementation of new technologies and operational measures lead to a general increase of the terminals performances when measured by KPI.
The first case study selected for the pilot application of methods and models and the evaluation of future scenarios is the terminal located in Munich Riem, operated by the DB owned company DUSS. The set of road‐rail terminals considered as case studies includes three intermodal terminals located in Antwerp: Combinant, Hupac and Zomerweg. The Port of Valencia’s Principe Felipe Railway Terminal has been the selected as a case study for sea-rail terminals. Finally, Hallsberg is the largest marshalling yard in Sweden, both in the number of wagons handled and surface extension. This was used as the case study for rail-rail terminals. For marshalling yards, automatic couplers, automatic brakes on wagons, automatic wagon identification, duo locos and driverless locos were tested and the KPI improved. However for Hallsberg, the cost‐benefit analysis gives a negative result because of the huge investments. However, the yard is a prerequisite for the rationalization of wagonload’s transport system.
Our study indicates that automation of terminals and terminal functions seems to be the most efficient way to reduce costs and increase benefits in future terminals. There are many ideas how to implement this, but many of the systems are not yet ready for market use. That means that strong effort will be required (i.e. in Shift2Rail) to implement automated systems in the real operation.
We noted before, that rail freight will have to play an important role as part of a multimodal transport chain and that to make rail freight effective and competitive a multimodal transport information system is an essential element; but our survey finds that about 81% of respondents were not aware of any online brokerage systems. Another important finding is that over 30% of respondents believed that there was less than a 50% possibility that ERTMS level 2 would be operational EU wide by 2030. We strongly urge the rail industry to take into account the findings from this survey on the use online information and traffic management system and take actions so that rail freight operators can be part of the total transport chain.

D24.4. Final Technical Report of SP2 Freight
CAPACITY4RAIL SCP3-GA-2013-605650
30/09/2017
CAPACITY4RAIL PUBLIC Page 72
Regarding the key operational and technological innovations for terminal typologies to increase the level of automation at terminals, survey data indicates that ‘Automatic ITU and vehicle control and data exchange’ were ranked as most urgently required with the highest number of responses for ranking ‘1’ and ‘2’. Regarding novel rail vehicles, the study finds that ‘automated vehicle identification and automatic coupling and decoupling’ are two most urgently required technological and operational terminal improvements.
There is a perception that information on rail pricing or costing is not as straightforward as some of its competitors (e.g. road or maritime). On this, the study determines that about 84% of participants view the prospect of producing a unit freight price per origin (O)/ destination (D) for multimodal goods as at least moderately achievable by 2030. Of these 50% of respondents, believe that it could be very feasible.
Faster and on-time delivery of service are very important aspects for rail freight operators to remain competitive in the market. On these essential service criteria, the industry survey analysis indicated that rail freight train speed of 120km/h is an achievable high-speed for freight services across the European network by 2030.

D24.4. Final Technical Report of SP2 Freight
CAPACITY4RAIL SCP3-GA-2013-605650
30/09/2017
CAPACITY4RAIL PUBLIC Page 73
12 Appendix
TABLE 21TODAY´S COMMON STANDARD, INCREMENTAL CHANGE AND SYSTEM CHANGE. SOURCE: D21.2
Equipment Common standard Incremental change* System change*
Wagons
Running gear Brakes Brake control Couplers Max Speed Max Axle load Floor height lowest IT-system
Different Cast brakes Pneumatic Screw couplers 100 km/h 22.5 tonnes 1,200 mm Way-side
50% Track-friendly LL brakes Radio controlled EOT Automatic couplers on some trains 120 km/h 25 tonnes 1,000 mm Some in wagons
All track-friendly Disc brakes Fully electronic Automatic couplers on all trains 120-160 km/h 30 tonnes
800 mm All radio controlled
Locomotives
Tractive effort kN Axle load Propulsion Fuel Drivers
300 20 tonne Electric Diesel Always drivers
350 22,5 tonne Some duo-locos LNG/Diesel Some driverless
400 25 tonne All duo-locos LNG/electric All driverless
Trains
Train lengths in RFC Train weight
550-850 m 2,200 tonnes
740-1050 m 4,400 tonnes
1050-2100 m 10,000 tonnes
Infrastructure
Rail Freight Corridors Signalling systems Standard rail weight Speed. ordinary freight Speed, fast freight
18,000km Different UIC 60 kg/m 100 km/h 100 km/h
25,000km ERTMS L2 in RFC 70 kg/m 100-120 km/h 120-160 km/h
50,000km ERTMS L3 in RFC 70 kg/m 120 km/h 120-160 km/h
Traffic system
Wagonload Marshalling - feeder Marshalling – feeder Some liner trains
Automatic marshalling Liner trains – duo-loco
Trainload Remote controlled All remote controlled
Intermodal Endpoint-trains Endpoint-trains Liner trains with stops at siding
Endpoint-trains Liner trains fully automated loading
High Speed Freight National post trains International post and parcel trains
International post and parcel train network
IT /monitoring systems
Some different Standardized Full control of all trains and consignments
*) Adapted to market needs in each product and line

D24.4. Final Technical Report of SP2 Freight
CAPACITY4RAIL SCP3-GA-2013-605650
30/09/2017
CAPACITY4RAIL PUBLIC Page 74
13 References
• EU Transports in figures, statistical pocketbook 2013
• ERRAC WORK PACKAGE 02: Encouraging modal shift (long distance) and decongesting transport corridors, Freight Roadmap July 2012.
• Nelldal, B-L and Andersson, E, Mode shift as a measure to reduce greenhouse gas emissions.
Paper 635 at Transport Research Arena in Athens 2012.
• D-RAIL, 2012, Rail Freight Forecast to 2050, Deliverable D2.1, D-RAIL- ‘Development of the
Future Rail Freight System to Reduce the Occurrences and Impact of Derailment’ PROJECT,
July.
• SPECTRUM, 2012, Logistics and market analysis, Deliverable D1.1 SPECTRUM – ‘Solutions and
Processes to Enhance the Competitiveness of Transport by Rail in Unexploited Markets,
February.
• EC (2011): Roadmap to a Single European Transport Area – Towards a competitive and
resource efficient transport system, EC White Paper, Brussels, 28.3.2011.
• TOSCA (2011): www.toscaproject.org
• NEWOPERA, 2008, NEWOPERA - THE RAIL FREIGHT DEDICATED LINES CONCEPT, THE
EUROPEAN FREIGHT AND LOGISTICS LEADERS FORUM(F&L), 270 Avenue de Tervueren –
1150 Brussels, Belgium
• VEL-Wagon - Versatile, Efficient and Longer Wagon for European Transportation -
Implementation and migration strategy. EU Grant agreement no: 265610. Deliverable report
31.12.2012.
• Study on the Effects of the Introduction of LHVs on Combined Road-Rail Transport and Single
Wagonload Rail Freight Traffic. KP Transport Consultants in co-operation with Fraunhofer,
Freiburg/Karlsruhe, October 5th 2011.
• Dachs B, Ebersberger B, Kinkel S, Waser BR (2006): Offshoring of production – a European
perspective, Bulletin European Manufacturing Survey, URL:
http://www.systemsresearch.ac.at/getdownload.php?id=154, 2009/02/26
• Ferreira J and Prokopets L (2009): Does offshoring still make sense, Supply Chain
Management Review 13(1), pp. 20-27
• ILOG (2009): ILOG Supply Chain Applications - Customer Success Briefs, URL:
http://www.ilog.com/products/supplychain/casestudies/, 2008/12/13
• Toubol, A (editor), 2016, Novel Freight Vehicles, Capacity for Rail report D22.1.
• Boysen, H. (2012 ), General model of railway transportation capacity, 13th International
Conference on Design and Operation in Railway Engineering (Comprail), New Forest.
• D-RAIL, 2013, Future Rolling Stock breakdown to 2050, D-RAIL Project - Development of the
Future Rail Freight System to Reduce the Occurrences and Impact of Derailment, Deliverable
D2.2, FP7.
• KTH, 2013, Roadmap for development of rail and intermodal freight transportation: HIGH
CAPACITY TRANSPORTS FOR RAIL – GREEN FREIGHT TRAIN, KTH Railway Group 16/04/2013,
Stockholm, Sweden.

D24.4. Final Technical Report of SP2 Freight
CAPACITY4RAIL SCP3-GA-2013-605650
30/09/2017
CAPACITY4RAIL PUBLIC Page 75
• SUSTRAIL, 2013, Outline design of an optimised, low impact, sustainable freight bogie,
Deliverable 3.1, p.8. FP7
• TU Dresden, TU Berlin: White Paper Innovative Rail Freight Wagon 2030 – The “5 L” future
initiative as a basis for growth in rail freight transportation, 1st edition, September 2012.
• SUSTRAIL: http://www.sustrail.eu
• Marathon: http://www.marathon-project.eu
• KTH Railway Group et al.: Efficient train systems for freight transport – A systems study,
Principal Report 0505, 2005. (Also Report 0508 on braking systems)
• European Commission: Technical specifications of interoperability relating to the subsystem
“rolling stock – noise” of the trans-European conventional rail system, Brussels, April 2011.
• IEA/UIC: Railway Handbook 2013 Energy Consumption and CO2 Emissions - Focus on Energy
Mix
• García Álvarez, A. (2011). In García González-Román L. (Ed.), Energía y emisiones en el
transporte por ferrocarril (Fundación de los Ferrocarriles Españoles ed.). Madrid.
• González Franco, I; García Alvarez, A; Pérez Martínez, P.J. (2012): “Carbon Dioxide Emissions
in Rail and Road Freight Transport in Spain: A Case Study of Car Carriers and Bulk
Petrochemicals”. Journal of Intelligent Transportation Systems. Taylor Francis.
• Marin Marinov, M., Ismail Sahin, I., Stefano Ricci, S., and Gordana Vasic-Franklin, G., 2012,
Railway operations, time-tabling and control, Research in Transportation Economics,
• Kordnejad, B., 2013: Regional Intermodal Transport Systems – Analysis and Case Study in the
Stockholm-Mälaren region. Licentiate Thesis, 2013, KTH TRITA-TSC-RR 13-006.
• Railway-technology.com (2014) European Rail Traffic Management System (ERTMS), last
retrieved on 07/02/2014 from http://www.railway-technology.com/projects/european-rail-
traffic-management-system-ertms/
• M. Grudén, M. Hinnemo, D. Dancila, F. Zherdev, N. Edvinsson, K. Brunberg, L. Andersson, R.
Byström and A. Rydberg, "Field Operational Testing for Safety Improvement of Freight Trains
using Wireless Monitoring by Sensor Networks," Wireless Sensor Systems, IET, December
2013.
• Politecnico di Milano, “RFID technology in a container port: an activity-based model to assess
costs and benefits”;
• European Commission, “E-FREIGHT, D1.2 - Assessment and forecasting of e-Freight
technologies”, 2011;
• EUROPEAN COMMISSION, “FREIGHT VISION, Deliverable 3.1 Relevance of infrastructure and
ITS, vehicle and engine and logistics technologies on long distance freight transport in
Europe, 2009;
• TRANSFORuM Transport 2050: Long distance freight - Road Map 2014-12-08.
http://www.transforum-project.eu/