Final Summer Report of Pepsi
113
ACKNOWLEDGEMENT An endeavor to transform itself into success needs efforts. These efforts are individual, standing in isolation. Such individual efforts require three things for their further development. These three things being- “reason, rationality, and self esteem”. The combination of these three basic traits delivers productivity. However, time and again this productivity requires encouragement and guidance. This much requisite support comes in the form of individuals who are now professionals and helps us to be professionals from amateurs. This acknowledgement is an effort to recognize these professionals who have made this project a combination of the three fundamental traits. This project would not have been possible without the monumental support from my my industry guides Mr Srinivas Raj (Territory Development Manager) Chandigarh and Mr Navneet Bhagat (Area Development Coordinator) Chandigarh. Therefore, it is a great pleasure to acknowledge the support of these people who have always been there at all times during my wonderful journey of this 7 weeks at the prestigious company named PepsiCo India Pvt. Holdings.
-
Upload
harpreet-singh -
Category
Documents
-
view
132 -
download
2
Transcript of Final Summer Report of Pepsi
ACKNOWLEDGEMENT
An endeavor to transform itself into success needs efforts. These efforts are individual,
standing in isolation. Such individual efforts require three things for their further
development. These three things being- “reason, rationality, and self esteem”. The
combination of these three basic traits delivers productivity. However, time and again this
productivity requires encouragement and guidance. This much requisite support comes in
the form of individuals who are now professionals and helps us to be professionals from
amateurs. This acknowledgement is an effort to recognize these professionals who have
made this project a combination of the three fundamental traits.
This project would not have been possible without the monumental support from my my
industry guides Mr Srinivas Raj (Territory Development Manager) Chandigarh and Mr
Navneet Bhagat (Area Development Coordinator) Chandigarh.
Therefore, it is a great pleasure to acknowledge the support of these people who have
always been there at all times during my wonderful journey of this 7 weeks at the
prestigious company named PepsiCo India Pvt. Holdings.
These past seven weeks were of utmost importance as they added value towards my path
of knowledge. I would like to end this acknowledgement by thanking the customer
executives, route agents and helpers at large with whom I have interacted during the
course of my training.
I am grateful for each and every valuable interaction that helped me to get a better
understanding of the workings forming the crux of my report.
Date : Simriti Kohli

PREFACE
The purpose of taking training in organizations is to expose management students in
various functional areas and management like Finance, Marketing, Human Resource and
International Business. Holding a degree is not the ultimate objective of the students like
MBAs. Industrial Training is only the practical knowledge, which makes a man perfect in
the desirable area in which we want to be a specialist. So any professional degree remains
unfulfilled without getting practical knowledge.

ABSTRACT
I have done my Summer Internship in Aradhana Food & Beverages Ltd. (Pepsi Co. India
Holdings Ltd.), Chandigarh. The topic of my project is “Every Dealer survey Report
(EDSR)/Outlet Mapping.
The project starts with the brief introduction about the Objectives, Methodology of the
project followed by a brief introduction about Pepsi Co. Ltd, what is the scope of Every
Dealer Survey Report (EDSR) and what is Outlet Mapping.
After the Introductory part of the project, I have discussed about the various sectors of the
Chandigarh where a survey of the retailers was done by me and the list of Retailers was
provided to me by the Company. In all 300 outlets were surveyed with the help of the
EDS(Every Dealer Survey) Form provided by the company. This form consists of
variables ranging from Name, Address, Phone No. of the retailer then the channel of the
outlet, availability of signage’s, Visi’s, sale of 300ml, PET, 2ltr and slim cans of Pepsi
and Coke, industry volume and the percentage share of Pepsi. Observations of the market
and suggestions were also given to the Company.
The main task was to physically approach the retailers and conducting a survey by
observations & interviewing the retailers, also while doing the survey it was kept in mind
to cover each and every outlet of every area.
After collecting the data, it was being punched in MS Excel 2003 to find out the share of
Pepsi, Availability of Brands, Industry Volume, Signages and Visi’s that were provided
to the outlets.

Table of Contents
Chapter no. Title Page no.
1
2
3
4
5
AcknowledgementPrefaceAbstractCertificate
1.1 Company Profile:1.1.1Brief History of Company1.1.2 Pepsico in India1.1.3 New Pepsico1.1.4 Mission statement1.1.5 Visison Statement1.1.6 Pepsico values1.1.7 Pepsico business1.1.8 Brand Power1.1.9 Product info. of Pepsi cola brands1.1.10 SWOT analysis1.1.11 Porters five force model
1.2 Introduction to the Project.
1.2.1Supply and Distribution Model1.2.2 Trade Channel1.2.3 Distribution Plant Working model1.2.4 Scope of every Dealer Survey Report1.2.5 Outlet Mapping
Review of Literature
Need Scope and objective of the Study
Research Methodology
Data Analysis and interpretation

6
7
Findings
Recommendations and Conclusion
References
Annexure

Table of Tables
Chapter no. Title Page no.
1.1
1.2
5.1
5.2
5.3
5.4
5.5
5.6
5.7
5.8
5.9
5.10
5.11
5.12
5.13
5.14
5.15
5.16
Brand Power
Porter’s five force model
Brands available in the Outlet
Factors that motivate to buy Pepsi Products
Daily sale of Pepsi 300ml
Daily sale of Coke 300ml
Daily sale of Pepsi Pet 600ml
Daily sale of Coke Pet 600ml
Daily sale of Pepsi 2ltr
Daily sale of Coke 2ltr
Daily sale of Pepsi Slim Cans
To know regarding visicoolers
Visi’s owned by the Retailers
Signages of Pepsi on the Outlet
Signages of Coke on the Outlet
Awareness regarding schemes of Pepsi
Schemes that attract the Retailers
Company schemes that satisfy the Retailers


Table of Figures
Chapter no. Title Page no.
1.1
1.2
1.3
5.1
5.2
5.3
5.4
5.5
5.6
5.7
5.8
5.9
5.10
5.11
5.12
5.13
5.14
5.15
5.16
Channel of Distribution
Trade Channel
Hierarchy of sales division
Brands available in the Outlet
Factors that motivate to buy Pepsi Products
Daily sale of Pepsi 300ml
Daily sale of Coke 300ml
Daily sale of Pepsi Pet 600ml
Daily sale of Coke Pet 600ml
Daily sale of Pepsi 2ltr
Daily sale of Coke 2ltr
Daily sale of Pepsi Slim Cans
To know regarding visicoolers
Visi’s owned by the Retailers
Signages of Pepsi on the Outlet
Signages of Coke on the Outlet
Awareness regarding schemes of Pepsi
Schemes that attract the Retailers
Company schemes that satisfy the Retailers


1.1 COMPANY PROFILE
1.1.1 INTRODUCTION
PepsiCo is the “Most Admired” Beverages corporation in the world and is ranked in the
Top 20 “Most Admired” Star Corporations across the Globe.Pepsico Headquartered in
Purchase, New York, with Research and Development Headquarters in Valhalla, NY,
The Pepsi Cola Company began in 1898, but it only became known as PepsiCo when it
merged with Frito Lay in 1965. In 1998 it bought Tropicana and in 2001 merged with
The Quaker Oats Company, including Gatorade. PepsiCo offers a wide variety of product
choices to meet needs and preference -- from fun-for-you items to product choices that
contribute to healthier lifestyles. It takes into consideration the preferences of the
consumers.
PepsiCo entered India in 1989 and has grown to become one of the country’s leading
food and beverage companies. One of the largest multinational investors in the country,
PepsiCo has established a business which aims to serve the long term dynamic needs of
consumers in India.
PepsiCo India and its partners have invested more than U.S.$700 million since the
company was established in the country. PepsiCo provides direct employment to 4,000
people and indirect employment to 60,000 people including suppliers and distributors.
PepsiCo nourishes consumers with a range of products from treats to healthy eats, that
deliver joy as well as nutrition and always, good taste. PepsiCo India’s expansive
portfolio includes iconic refreshment beverages Pepsi, 7 UP, Mirinda and Mountain Dew,
in addition to low calorie options such as Diet Pepsi, hydrating and nutritional beverages
such as Aquafina drinking water, isotonic sports drinks - Gatorade, Tropicana100% fruit
juices, and juice based drinks – Tropicana Nectars, Tropicana Twister and Slice. Local
brands – Lehar Evervess Soda, Dukes Lemonade and Mangola add to the diverse range
of brands.

PepsiCo’s foods company, Frito-Lay, is the leader in the branded salty snack market and
all Frito Lay products are free of trans-fat and MSG. It manufactures Lay’s Potato Chips,
Cheetos extruded snacks, Uncle Chips and traditional snacks under the Kurkure and
Lehar brands. The company’s high fiber breakfast cereal, Quaker Oats, and low fat and
roasted snack options enhance the healthful choices available to consumers. Frito Lay’s
core products, Lay’s, Kurkure, Uncle Chipps and Cheetos are cooked in Rice Bran Oil to
significantly reduce saturated fats and all of its products contain voluntary nutritional
labeling on their packets.
PepsiCo, Inc. is one of the world's largest food and beverage companies. The company's
principal businesses include:
Frito-Lay snacks
Pepsi-Cola beverages
Gatorade sports drinks
Tropicana juices
Quaker Foods
1.1.2 PEPSICO IN INDIA
India forms a key market in PepsiCo's global strategy. However, despite a huge market
of a billion people, the soft drink industry, with a per capita consumption of two bottles,
was vastly underdeveloped. Moreover, India was also the only market in the world to
have shown the door to the other soft drink brand in the late1970s.
None other than Philip Kotler mentions in 'Mega marketing', Harvard Business Review,
March-April 1986: "After Coca-Cola was asked to leave India, Pepsi began to lay plans
to enter this huge market. Pepsi worked with an Indian business group to seek
government approval for its entry over the objections of both domestic soft-drink
companies and anti-multinational legislators…Clearly. Pepsi's strategy was to bundle a
set of benefits that would win the support of various interest groups in India. Thus
Pepsi's marketing problem went beyond the normal 4Ps of operating effectively in a
market. To enter India, Pepsi faced a 6P marketing problem, with Politics and Public
opinion constituting the two additional P’s. Winning over the Indian government and
the public to gain admission is a much tougher challenge."
Pepsi played the 6Ps very effectively. It delivered an export/import surplus to the then
foreign exchange starved government by offering to develop agricultural exports from
Punjab. In this way, it was able to offset the cost of importing concentrate into the
country. Parallel, with its trend-setting advertising, innovative on-ground marketing and
intrusive distribution system, Pepsi, today, has brought to its fold a staggering 200
million consumers. Brand Pepsi is the largest single soft drink brand in India. Pepsi is
recognized as 'The' iconic youth brand in this part of the world. After deeply penetrating
cities and large towns, Pepsi is now exploding the rural market.
Launched in 1990, on India's Independence Day, Pepsi brought to India its global
legacy - vibrancy and youthful dynamism. Its launch announced to the youth of India,
the freedom of being what they want to be, freedom of thought, expression and choice.
The group has built an expansive beverage and foods business. To support its operations,
PepsiCo has 43 bottling plants in India, of which 15 are company owned and 28 are
franchisee owned. In addition to this, PepsiCo’s Frito Lay foods division has 3 state-of-
the-art plants. PepsiCo’s business is based on its sustainability vision of making
tomorrow better than today. PepsiCo’s commitment to living by this vision every day is
visible in its contribution to the country, consumers and farmers.
1.1.3 THE NEW PEPSI CO.
• A $27 billion Company - World’s fifth largest food & beverage Company.
• Quaker & PepsiCo, two of world’s strongest & most successful food & beverage
businesses.

• Consistent growth opportunity - vast market of convenient foods & drinks that
provides great taste, nutrition & fun.
• Portfolio of big, successful brands, manufacturing strength, powerful selling &
distribution systems & exception innovation capabilities.
• 135,000 bright, dedicated people turning ambitions into reality.
1.1.4 MISSION STATEMENT
"To be the world's premier consumer products company focused on convenience foods
and beverages. We seek to produce healthy financial rewards to investors as we provide
opportunities for growth and enrichment to our employees, our business partners and the
communities in which we operate. And in everything we do, we strive for honesty,
fairness and integrity."
1.1.5 VISION STATEMENT
“To be the best consumer products company in the eyes of our suppliers, Customers,
consumers, employees and shareholders”
1.1.6 PEPSICO VALUES
COMMITMENT
OUR COMMITMENT
To deliver
SUSTAINED GROWTH
through
EMPOWERED PEOPLE
acting with
RESPONSIBILITY and building TRUST
Our Commitment
Our commitment is to deliver sustained growth, through empowered people, acting with
responsibility and building trust. Here what does it mean:-
Sustained Growth is fundamental to motivating and measuring our success. Our quest
for sustained growth stimulates innovation, places a value on results, and helps us
understand whether today’s actions will contribute to our future. It is about growth of
people and company performance. It prioritizes making a difference and getting things
done.
Empowered People means we have the freedom to act and think in ways that we feel
will get the job done, while being consistent with the processes that ensure governance
and being mindful of the rest of the company’s needs.

Responsibility and Trust form the foundation for healthy growth. It’s about earning the
confidence that other people place in us as individuals and as a company. Our
responsibility means we take personal and corporate ownership for all we do, to be good
stewards of the resources entrusted to us. We build trust between ourselves and others by
walking the talk and being committed to succeeding together.
Pepsi Co. Guiding Principles
We must always strive to...
Care for customers, consumers and the world we live in
Only sell products we can be proud of
Speak with truth and candor
Balance short term and long term
Win with diversity and inclusion
Respect others and succeed together
Guiding Principles
This is how we carry out our commitment.
We must always strive to:
Care for customers, consumers and the world we live in: We are driven by an intense,
competitive spirit in the marketplace, but we direct this spirit toward solutions that
achieve a win for each of our constituents as well as a win for the corporation. Our
success depends on a thorough understanding of our customers, consumers and
communities. Caring means going the extra mile. Essentially, this is a spirit of growing
rather than taking.
Sell only products we can be proud of: The test of our standards is that we must be able
to personally endorse our products without reservation and consume them ourselves. This

principle extends to every part of the business, from the purchasing of ingredients to the
point where our products reach the consumer’s hands.
Speak with truth and candor: We speak up, telling the whole picture, not just what is
convenient to achieving individual goals. In addition to being clear, honest and accurate,
we take responsibility to ensure our communications are understood.
Balance short term and long term: We make decisions that hold both short-term and
long-term risks and benefits in balance over time. Without this balance, we cannot
achieve the goal of sustainable growth.
Win with diversity and inclusion: We leverage a work environment that embraces
people with diverse backgrounds, traits and different ways of thinking. This leads to
innovation, the ability to identify new market opportunities, all of which helps develop
new products and drives our ability to sustain our commitments to growth through
empowered people.
Respect others and succeed together: This company is built on individual excellence
and personal accountability, but no one can achieve our goals by acting alone. We need
great people who also have the capability of working together, whether in structured
teams or informal collaboration. Mutual success is absolutely dependent on treating
everyone who touches the business with respect, inside and outside the company. A spirit
of fun, our respect for others and the value we put on teamwork make us a company
people enjoy being part of, and this enables us to deliver world-class performance
1.1.7 PEPSI CO. BUSINESS
• Pepsi Cola Company
Net Sales : US $ 10.5 Billion
Only one major competitor

Market leader in > 50 countries
• Frito Lay Company
Net Sales : US $ 12.6 Billion
World’s largest Snack Food company
• Tropicana
Net Sales : US$ 2.4 Billion
Employee Strength : > 4,000
Dominant market share in U.S.
Operations in > 29 countries
1.1.8 THE BRAND POWER
Pepsi Co. has 13 brands that each generates over $1 billion in retails sales. Another
four brands that each generate more than $500 million.
Table1.1 Brand Power
Brand Name Value (in billion)
Pepsi $15.6
Tropicana Pure Premium $2.3
7 UP $1.6
Mountain Dew $5.0
Cheeetos $1.4
Doritos $2.2
Mirinda $1.1
Diet Pepsi $4.3
Quaker $1.9
Lipton Tea $1.1
Aquafina $1.9
Lay’s $4.1
Ruffles $1.8
Tostitos $.9
Gatorade $3.1
Fritos $.7
1.1.9PRODUCT INFORMATION OF PEPSI COLA BRANDS
Pepsi (8fl.oz)
Contains: Carbonated water, high fructose corn syrup, caramel color, phosphoric
acid, caffeine, citric acid and natural flavors
Mountain Dew (8 fl. oz)
The fastest-growing soft drink of the decade, Mountain Dew currently ranks as the
nation's leading soft drink in retail outlets. Doing the "Dew" is like no other soft drink
experience because of its daring, high-energy, high-intensity, active, extreme citrus taste.
Contains: Carbonated water, high fructose corn syrup, concentrated orange juice and
other natural flavors, citric acid, sodium benzoate (preserves freshness), caffeine, sodium
citrate, gum arabic, yellow 5, erythorbic acid (preserves freshness), calcium disodium
EDTA (to protect flavor) and brominated vegetable oil
DietPepsi(8fl.oz)

Contains: Carbonated water, caramel color, aspartame, phosphoric acid, potassium
benzoate (preserves freshness), caffeine, citric acid and natural flavors.
MirindaOrange(8fl.oz)
Contains: Carbonated water, high fructose corn syrup, citric acid, purity gum, potassium
benzoate and potassium sorbate (preserves freshness), ester gum, natural flavor, yellow 6,
ascorbic acid and calcium disodium EDTA (to protect flavor), sodium citrate.
Mirinda Lemon (8fl.oz)
Contains: Carbonated water, high fructose corn syrup, natural flavors, phosphoric acid,
potassium benzoate (preserves freshness), potassium citrate, citric acid, caffeine
Aquafina
Enjoy the crisp, refreshing taste of Aquafina – 100% pure, non-carbonated, purified
drinking water. The consistent purity and great taste of Aquafina are guaranteed by
means of a state-of-the-art purification process that includes reverse osmosis and
carbon filtration. Since its debut in 1995, Aquafina has won over consumers with its
great taste and purity. Aquafina is currently America's #1 selling bottled water brand in
measured retail channels.
1.1.10 SWOT ANALYSIS
Strengths of the Company
• Has dominant presence in India.
• It has a good goodwill in the market.
• Good share in urban areas
• Innovation
• Has a good brand imageBrand Name
• Has a World wide Presence
• More Key Accounts
• Youth Icon
• More Margin given to the Retailers.
Weaknesses
• Brand Maintenance becomes very expensive.
• Less reach in rural areas.
• Weak supply chain in rural areas.
• Very low share in rural areas.
• Sales only on cash basis.
• No proper billing system is there.
Opportunities
To launch Milk Products.
More promotion of lemon flavors.
Introduction of Food products (Quaker etc.)
Upcoming healthy drinks (Diet Mountain Dew etc.)
Threats
• Coca Cola
• Rc Cola
• Top Cola
• Local Juices

• Local Drinks, Local Brands
• Health Conscious Consumers
• Govt. Policies
• High Excise, Taxes, Octroi
• Local Lemon drinks
• Future threat from Reliance.
1.1.11PORTER’S FIVE FORCES MODEL
New Market Entrants
High Initial Cost Processes protected by Regulations and Patents Very High competition Products are not unique No Switching Costs Access to customers is easy
BUYER POWER
High Competition High Switching Cost Availability of local
Brands Low degree of
Customer Loyalty Customers can easily
switch to other brands
Availability of similar brands at lower cost
SUPPLIER POWER
Concentrate manufactured on it’s own
Suppliers can’t sell directly to consumers
No difficulty in switching to another supplier
Plastic Bottles, Cans manufactured by the company on it’s own
Competitive Rivalry
Coca Cola AVI Bottoms Up Rc Cola Top Cola

INTRODUCTION TO THE PROJECT
Porter's 5 forces analysis is a framework for the industry analysis and business strategy
development developed by Michael E. Porter of Harvard Business School in 1979 . It
uses concepts developed in Industrial Organization (IO) economics to derive 5 forces that
determine the competitive intensity and therefore attractiveness of a market
1.2 INTRODUCTION TO THE PROJECT
Known internationally for its architecture and urban planning, Chandigarh is home to
numerous architectural projects of Le Corbusier, Pierre Jeanneret, Matthew Nowicki, and
Albert Mayer. The city boasts a high standard of living with the highest per capita income
in the country and tops the list of Indian States and Union Territories with a Human
Development Index of 0.674.
India census, Chandigarh had a population of 900,635, making for a density of about
7900 persons per square kilometer. Males constitute 56% of the population and females
44%. The sex ratio is 777 females for every 1,000 males – which is the lowest in the
country. Chandigarh has an average literacy rate of 73%, higher than the national average
of 59.5%; with male literacy of 76% and female literacy of 68%. About 12% of the
population is under 6 years of age. The main religions in Chandigarh are Hinduism
(78.6%), Sikhism (16.1%), Islam (3.9%), and Christianity (0.8%).[5] Punjabi and Hindi
are the main languages spoken in Chandigarh, but English is also quite prevalent.
Threats Of Substitutes
Easy for consumers to switch Customers have low loyalty Health Conscious consumers Availability Of Local Lime Water Home Made Lemon Water Fresh Juices Milk Products ( Flavoured Milk, Lassi etc.)

Like every city of India there are many areas within the city and same is in the case of
Chandigarh it has different sectors and that were covered by me physically on my own.
Each sectors has its own demographic features with different size of population, different
income level etc.These sectors have many Retail Outlets selling Pepsi and Coca-Cola and
Coca-Cola is having high share as compare to Pepsi in almost all the sectors due to
reasons like:
Regular Supply by the Warehouse.
Good Brand Image.
Regular Follow Up by Coke.
Positive Aggressiveness of the Coke Employees.
Good Relations Maintained with the Retailers.
1.2.1 SUPPLY AND DISTRIBUTION MODEL
A Flowchart giving an insight into sales and distribution model has been provided.
Channel of Distribution
Fig1.2.1: Channel of Distribution

As in every city it is the Company vehicle that supplies the product in every area
and every Outlet same is in the case of Pepsico. Firstly the packed Pepsi bottles
are supplied to the warehouse through the heavy vehicles from the bottling plant.
Then from this warehouse further distribution to the various Retail Outlets take
place. Urban Spokes i.e. surrounding rural areas of Chandigarh is also covered.
But it is difficult for the Company vehicle to go inside the areas so Company has
appointed various agencies to make the Pepsi available in every nook and corner.
The distribution is much simpler in main city as compared to the rural areas.
In every Company’s vehicle there is one route agent provided with one helper.
Route Agents is allotted with the different sectors and they have the list of Retail
Outlets in which they have to supply the soft drink daily. The route agent has the
sole responsibility to supply and sell the products every day and he also needs to
PepsiCo
Manufacturing unit (COBO/FOBO)
Warehouse
Retailers Retailers Retailers

be regular with his supply in order to avoid any shortage of the stock in the
Outlets under him and he becomes the mediocre or the medium of communication
between the Retailers and the Company. All the complaints, needs and
requirements of these outlets have to be communicated by the Agent to the
Company. Generally each RA covers apprx. (60-80) retail outlets of their area.
Route Agents sole responsibility is also to communicate the schemes properly too
the Retailers. Schemes that are offered to the Retailers are not same always they
keep on changing according to the demand and considering some seasonal
changes also. It is the Route Agent only who comes in actual interaction with the
Retailers.
1.2.2 TRADE CHANNEL
Fig1.2: Trade Channel
The Company has categorized its Retailers on the basis of two channels
Traditional Trade
Modern Trade
Traditional Trade is what the company is following when it made its entry in the Indian
market. Generally it caters whole of the market. But with the globalization and
liberalization many food chains started their operations in Indian market and company
added one more channel to catch those customers.Modern Trade generally includes
retailers like KFC, Mc Donald, Reliance, Subhiksha SAMT’s and many more.
Traditional Trade includes:
1. Grocery Program:
This is a retail initiative for the Grocery Shops. These shops are most common store
format. Generally consumers prefer take away from these stores. In grocery program
there are points to be earned by the shops. Points are given for display, availability of
flavors, monthly target etc. If the outlet fulfills these criteria it is entitled to incentives
and gifts. Incentives are given in terms of flavors of Pepsi products. Gifts are like bags,
tea sets, water filter etc.
2. Space Club/Convenience stores:
TRADE CHANNEL
TRADITIONAL TRADE MODERN TRADE
CONVENIENCE
EATERIES
GROCERY

This is an initiative for the convenience stores. These are stores which sells daily
necessities like from General Store to Panwala shop. These are the stores where
consumers prefer both take away and on premises consumption. In space club also there
are some criteria to be fulfilled. Here display plays major role and the monthly targets are
also higher than grocery program. Here also the outlet gets gifts on fulfillment of criteria.
Here the gifts are like Cordless Phone, DVD Player, Coffee maker etc.
3. Food and Fizz/Eatery:
This is an interesting initiative for the eatery channel i.e. Restaurants, Food Joints, Fine
Dine. This channel is very important and here consumers generally prefer on premises
consumption. In this program the outlet is encouraged to sell Pepsi products with all its
orders. Here the shop provides Combo meals with Pepsi and fixes a price for it. Company
also provides customized Menu Card, Pictures of Popular Combos, Napkin Holders and
Waiters are provided with Pepsi Badges. Here the waiters are encouraged to ask for Pepsi
with Every Order. If during a Surprise Visit the waiter asks the Visitor “Would You Like
to have a Pepsi with Your Order”. He gets an instant gift in Hand. Here the outlet gets
monthly target fulfilling which it is entitled for incentives and the waiters get gifts like T-
Shirts, Cap, Key Chain and Bottle Opener.
1.2.3 DISTRIBUTION PLANT WORKING MODEL
A flowchart giving an insight into the hierarchical working structure of the distribution
plant model have been provided.
Hierarchy of sales division

Fig1.2.3: Hierarchy of sales division
Role of ADC Area Development Coordinator
ADC is the Mr. Growth of the TDM team’
Key Account Management
– Accountable for the “Territory Key accounts”
VPVice president
TDM (territory development manager)
ADC (area development coordinator)
CE (customer executive) CE
RA (route agent) RA
Helper Merchandiser
GMGeneral manager
TDM
ADC

– Responsible for relationship and share.
– Volume (for current and new).
– Execution of account specific promotions.
– Equipment and presence decisions.
Role of CE Customer Executive
Responsible for :
Volume development
Customer service.
Coach and train the salesmen
Accountabilities:
Selling/Merchandizing
• Assist the RA/ PSR in selling as per Plan
• Obtain best selling position in the account through the Salesman
• Track stock levels first in first out( FIFO)
• Ensure maintenance of displays and equipment as per standards
Objective Setting
• Assist the TDM in converting Unit goals.
• Clearly communicate pricing, promotions and deals to Salesmen and the trade
• Plan deployment of marketing equipment: Visi / OYC / Ice Chests / Signages etc.
• Recommend distributor appointment/change based on evaluation of performance.
Tracking Measures
• Own and review progress of objectives.
• Update the Territory Scoreboard on work With days; ensure regular updating
• Lead by example and solve salesman`s issues / problems

• Ensure non-deliveries and flavor mismatch are minimum
• Ensure distributor systems are in place
• Collate and report competitive activities to the TDM
Coaching
• Provide recognition and feedback to the RA/ PSR and Delivery Agent
• Spend time in field as per plan to Coach and guide the team
• Maintain records of Route Planners /EP/ WorkWiths and One with Ones
Customer Support
• Support successful execution of core work
• Maintain a physical presence in the territory to ensure understanding of
customer’s need
and resolve complaints.
Role of RA Route Agent
Responsible for:
Evolving the distribution network for the sectors.
Ensure customer service and to maintain and develop execution standards.
Accountabilities:
Distribution:
• Conduct EDS for the territory
• Identify potential outlets
• Ensure delivery on time; as per plan
Selling:
• Ensure all products and SKU`s stock keeping units are sold as per outlet potential
• Track outlet level opportunities ensure placement of product.

1.2.4 SCOPE OF EVERY DEALER SURVEY REPORT (EDSR)
Pepsi has a low share in Urban areas of Chandigarh as compared to Coca Cola so in
order to design and implement strategies in these areas to increase the share, Every
Dealer Survey Report(EDSR) was conducted which is a very helpful tool for the
company, as it will help in answering many questions like which sectors are covered ,
what’s their population, where are they, what is the potential of each sector, how to
prioritize, what will be the cost to serve, what are the promotional opportunities, where
are the weekly markets etc. These can be classified under the following headings.
Identify Population Cluster
1. Which sectors are covered ?
2. What’s their population ?
3. Where are they ?
Identify Potential
1. What is the potential of each sector?
2. How to prioritize?
3. What’s the distance between areas?
4. What will be the cost to serve ?
Identify Promotional Opportunities
1. What are the promotional opportunities?
2. Where are the weekly markets, etc?
1.2.5 OUTLET MAPPING
Outlet Mapping or Every Dealer Survey involves identifying all CSD selling outlets in
the urban areas of Chandigarh and for each outlet it captures details of sales of the
various outlets, ownership of the outlets, signages on the outlet, coverage, Stock Keeping
Units (SKU), etc. As discussed earlier the usefulness of this survey it further highlights
the potential of the CSD outlet universe in the town, Identifies the weak markets and

weak outlets of the area which lead to low market share, to recognize the potential areas
of sales improvement, Facilitates Route Structuring and further provides data for
Route structuring
Design routes on geographical basis and other routing principles
• Identify expected volumes per route
Service frequency
• Finalize desired service frequency on the basis of competitive
environment
Fleet planning
• No. of routes
• Service frequency
• Calculate number and type of vehicles required
• Volumes : existing and expected
• Competitive coverage mode
Weak Area Plan( WAP)
• Identify WAP markets basis share/volume data
• Identify WOP outlets basis share/industry volume data
Brand/pack strategy
• Calculate brand/pack mix and shares
• Prioritize focus brands, packs and growth drivers
• Plan glass purchase and deposit strategy
Chilling strategy
• Visi/OYC own your cooler infusion strategy – numbers and sizes
• Visi redeployment plan
Signage strategy

• What is the targeted signage index?
• Which elements of signage to focus upon?
Discount strategy
• Which outlets to be focused?
• What is existing D&A cost per case?
• What should be our D&A strategy?


Numbers of studies has been conducted in this area but due to shortage of time &
inability to cover all the past studies some of the studies have been considered in
this section that has provided a base for this research
1. Bommer & O’neil (2001) conducted research which has shown that Competition
in the beverage industry is increasing on all fronts (advertising, price, product
proliferation, service, etc.). As a result, distributors need to understand what is
important to retailers and assess how they and their competitors are meeting those
needs in the supply chain. In this paper a performance system is proposed to
assess the distributor-retailer interface based on the integration of a number of
concepts including customer service, relationship exchanges, competitive
benchmarking, order winners (consumer preference perceptions), and portfolio
analysis.Various performance matrices are constructed which indicate the
importance level and service effectiveness for categories of service provided to
retailers. These importance/ performance matrices provide a basis for distributors
to develop marketing strategies for categories of retailers, as well as for individual
retailers.
2. Chakarvarthi, Gupta at al (2006) have done a longitudinal study of a beverage
distributor who initiated a customer satisfaction program with its entire customer
base of different types of Retailers. They used a broad-based measure of
customer satisfaction tailored to the company’s operations and we compute
customer profitability through activity-based Cost measures. They investigate the
economic outcome of a satisfaction program in distributor-retailer context
focusing on individual retailer level satisfaction and profitability measures. After
carefully accounting for costs of launching the satisfaction program and allocating
them equally carefully to individual retailers using Activity Based Costing (ABC)
principles, we analyze the link between changes in satisfaction and changes in
profitability. The net profit measure of CP, derived after careful allocation of
costs based on activities, shows a complex and non-linear pattern of relationship
with customer satisfaction.

3. kruger (2007) has conducted study which showed that there are ample reasons
that geographic variation in brand share persists. This comment highlights
intentional strategies and feedback loops. Trade promotion, advertising, coupons,
and special events are likely to be differentially allocated on the basis of market
position and may have different effectiveness. Distribution is highly correlated
with share, and distribution can be easier to get and maintain in strong markets.
The interaction between retailers and manufacturers at the category level can be
strong and persistent and can be observed in market-level data as a market effect.
4. Venkatraman (….) has conducted study which showed that how does a large
corporation rethink and transform itself in an increasingly competitive
environment? This corporate-strategy case could be described as how PepsiCo
stopped worrying about competing with Coke and figured out what its real
business was and how to build its future. A new CEO wants to grow PepsiCo into
a major global corporation by figuring out what it is good at, where its markets
are strongest, and how to achieve growth through innovation and corporate
transformation. Redefining itself as a beverage and snack business, PepsiCo sheds
the restaurant business and acquires Quaker Oats and Tropicana. Then, by
rethinking the synergistic relationships between the complementary, combined
strengths (technological expertise in nutrition, flavor, packaging, distribution,
etc.) of the merged companies, it strategizes to develop innovative products that
will compete in a changing demographic, cultural, and geographical world. Will
this strategy work in an increasingly competitive environment? ovation s.
venkatraman.
5. Gomez Miguel, Mclaughin Edward, Wittink Dick (2003)9 In this research the
links between store attribute perceptions and customer satisfaction, and between
customer satisfaction and sales performance, in the food retail sector. Our data set
consists of six waves of customer satisfaction and sales information for about 250
stores over the period 1998-2001 for a publicly held supermarket company. We

construct a statistical model to address nonlinearities and asymmetries in the
satisfaction-sales performance links, and we illustrate how food retailers can
affect store revenues by managing customer satisfaction. Contributions of our
study include the analysis of behavioral consequences of customer satisfaction in
the food retail sector, the measurement of complexities of the satisfaction-sales
performance links based on an empirical model of first differences, and a
discussion of how managers can use such results for customer satisfaction
policies.

NEED OF THE STUDY
The need for research on every retailer is to fill the gap on various studies that
were done on the retailers in the past. Previous studies had shown the consumer
preferences regarding Coke over Pepsi. In the literature, the major emphasis have
been laid on various things like to know the SKU’s in the outlets, factors and
schemes that motivates retailers to buy Pepsi and its products, schmes with which
retailers know the retailers preferences regarding Pepsi Cola, schemes that were
offered to the retailers and signage’s of the Company that were available in the
outlet and to have a track of daily sales
SCOPE OF THE STUDY
This study has covered the survey of all the retailers of Chandigarh who are
selling Pepsi.
OBJECTIVES OF THE STUDY
The main objectives of the study are:
To know the various brands of Pepsi those are available in the retail outlets.
To have an estimate of daily sales of Pepsi 300ml, Pet 600ml, 2ltr bottle and slim
cans in terms of Crates as well as of coke.
To know the factors that prompts Retailers to buy Pepsi and its Products.
To know that whether the retailers are well communicated with the schemes of
Pepsi and whether they are satisfied with it or not.
To know the kind of signage’s available in the Outlets.
To know whether the retailers are provided with the visicoolers


RESEARCH METHODOLOGY
Research: Research is a common parlance which refers to search for knowledge. It is a
procedure of logical and systematic application of the fundamentals of science to the
general and overall questions of a study and scientific technique, which provide precise
tools, specific procedures, and technical rather philosophical means for getting and
ordering the data prior to their logical analysis and manipulating different type of
research designs is available depending upon the nature of research project, availability
of manpower and circumstances.
Research Design is an arrangement of conditions for collection and analysis of data in a
manner that aims to combine relevance to the research purpose with economy on
procedure. The research problem having been formulated in clear-cut term helps the
researcher to prepare a research design. The preparation of such a design facilitates in
conducting it in an efficient manner as possible. It is a blue print for the fulfillment of
objectives and answering questions.
An exploratory survey was designed and executed among 100 Retailers of Urban areas
i.e. various sectors of Chandigarh broadly categorized under three channels namely
Eatery, Convenience and Grocery in the months of June and July 2008.Exploratory
research is used principally to gain a deep understanding of something. And in my project
I had thoroughly studied the market of Pepsi, their relation with their retailers, schemes
that are being offered to them and in return their satisfaction level, purity of the Visi’s
and the signage’s.
DATA COLLECTION
Secondary Data: Secondary data are those which have already been collected by
someone else and which have already been passed through the statistical process.

Secondary data either is published data or unpublished data. In this study
secondary source used were mainly company websites and journals.
Primary Data: Primary data are those, which are collected afresh and for the first
time, and thus happen to be original in character. A well structured questionnaire
was used a s a data collection tool. The questionnaire was administered through
various Eatery, Grocery, and Convenience shops. The questionnaire comprised of
mainly closed ended questions. The informal interview was also conducted with
the retailers which helped to have many observations.100 retail outlets where
Pepsi and its products were supplied belonging to the channels namely Eateries,
Groceries and Convenience became qualified for generating primary data for the
purpose of the study.
SAMPLING PLAN
The following factors have to decide within the scope of sample design:
i) Universe of study: Universe of the study means all the retailers who are
selling Pepsi. Further it is divided as follows:
Theoretical: It covers Retailers selling Pepsi all over the world.
Accessible: It covers all the Retailers of Pepsi, which are within our
reach. In this study accessible population is all the retailers of Pepsi all
over India.
Sampling Universe: sampling universe of our study was the retailers
of Chandigarh.
ii) Sample Size: A sample of minimum respondents will be selected from
various sectors of Chandigarh. An effort has been made to select
respondents evenly. The survey was carried out on 100 respondents.
iii) Sample Unit: It indicates who is to be surveyed. The researcher must
define the target population that will be sampled. In this project sampling
unit was all the retailers of Pepsi in Chandigarh.
iv) Sampling Technique: For the purpose of research convenient and
judgement sampling is being used. We catch the different people from
Different areas of Chandigarh. Every respondent has his different view
point about the topic and they fill the questionnaire accordingly. The entire
respondents are chosen randomly.
v) Sampling Frame: It consists of various sources from which information
about the respondent has been collected. In my study the name of the retail
outlets was with the Company and it was a sampling frame.
DATA ANALYSIS
Tools of analysis
Tools of Analysis means what all tools are used to present data in a meaningful way so
that it becomes easily understandable. In this Research tools used are Average and
percentage.
Tools of Presentation
In this study tools of presentation used were tables, graphs and pie charts.

LIMITATIONS OF THE STUDY
Closed Outlets: There were many outlets that were either closed or had stop
selling Cold Drinks, also during the afternoon most of the outlets were closed.
Lack of Retailers interest: in disclosing the information as most of them were
busy selling the products of their shops and many of them were not ready to
disclose the exact data.
Biased Retailers: Retailers were biased and had a bend towards the Coke
employees mainly because of the relations with them and there was warm
welcome for Coke employees but opposite was the case for Pepsi employees.
Lack of Cooperation: from Opposite Gender At many instances the females
were either shy or never wanted to disclose any information to an unknown
researcher and at some of the Outlets behavior of males were very indifferent.
Some of the outlets were located by the researcher on her own and as these areas
were not familiar to the researcher it was a big challenge to locate each and every
outlet on her own.


Which of the following do you usually buy/stock?
To know the availability of different brands of Pepsi and Coke that are available on the Retail Outlet.
Table5.1: Brands available in Outlet
Brands Available No. of OutletsPBI Mirinda 58CCX S&M 65CCX Fanta 68CCX Limca 75CCX Cola 82PBI Cola 87PBI S&D 92
Fig5.1: Brands available in Outlet
65 6875
8287
92
0
10
20
30
40
50
60
70
80
90
100
brands available
no
. o
f o
utl
ets
CCX S&M
CCX Fanta
CCX Limca
CCX Cola
PBI Cola
PBI S&D
Analysis & Interpretation: The Pie chart depicts that Slice and Dew are available in 92
outlets followed by Pepsi in 87 outlets then Coca Cola in 82 outlets, Limca in 75 outlets,
Fanta in 68 outlets and Sprite and Mazaa in 65 outlets. In Majority of the Outlets S&D is

available followed by Pepsi, Coke, Limca and Fanta.Pbi Mirinda is least available in the
Outlets. Pepsi is leading the market in S&D and Pbi Cola.
Note: But, it should be noted that even a single empty bottle of a flavor leads to the
availability of that flavor in that outlet

Rank the following factors that motivates you to buy Pepsi and its Products? (5 being the highest and 1 being the lowest)
To know the factors that motivate the Retailers to buy pepsi and its Products
Table5.2: Factors that motivate to buy Pepsi Products
Factors Points RankSchemes 202 1Signages 245 2Visi/Fridge 284 3Consumer Demand 358 4Regular Supply 411 5
Fig5.2: Factors that motivate to buy Pepsi Products
Factors that motivate to buy Pepsi products
202245
284
358
411
0
50
100
150
200
250
300
350
400
450
Points
Schemes
Signages
Visi/Fridge
Consumer Demand
Regular Supply
Analysis & Interpretation: From the above table and graph it has been interpreted that
out of 1500 Points 411 pts have been given to regular supply by the retailers followed by
Consumer Demand 358 pts, Visi/Fridge 284 pts, Signages 245 pts and Schemes 202 pts.
From the above it has been interpreted that the main factor that motivates the retailers to

buy Pepsi and its Product was Regular supply.Consumer demand was the second
motivating factor followed by Visi and signages.Schemes was the least rated factor that
motivates the retailers to buy Pepsi and its Products.

How much stock of 300 ml crates do you sell (approx.) in a day of Pepsi?
To know the daily sales of Pepsi 300ml in the Retail Outlets.
Table5.3: Daily sale of Pepsi 3ooml
Sale of 300ml No. of Respondents PercentageNIL 18 18%0-1.5 Crates 45 45%1.5-3 Crates 29 29%3-4.5 Crates 5 5%4.5-6 Crates 3 3%More Than 6 0 0%Total 100 100%
Fig5.3: Daily Sale of Pepsi 300ml
SALE OF PEPSI 300ml
18
45
29
5
3
0
NIL
0-1.5 Crates
1.5-3 Crates
3-4.5 Crates
4.5-6 Crates
More Than 6
Analysis & Interpretation: From the above table and graph it is interpreted that 18% of
the Retail Outlets were not selling 300ml glass bottles of Pepsi.45% of the Outlets were
selling 0-1.5 Crates daily of Pepsi.29% of the Outlets were selling 1.5-3 Crates of daily.
Outlets that were selling more than 6 Crates were 0%. From the above it can be
interpreted that majority of the Retailers were selling 0-1.5 Crates of Pepsi that means
they were selling 35(approx) Crates a day. There were few Retailers that were selling 1.5-
3 Crates of Pepsi daily.Very few Retailers were selling 3-4.5 Crates per day.Also there

were some Outlets that were not selling even a single Crate of Pepsi that was due to
Retailers avoidance to stock the Glass bottles.

How much stock of 300 ml crates do you sell (approx.) in a day of Coke?
To know the daily sales of Coke 300ml in the Retail Outlets compared to Pepsi
Table5.4: Daily sale of Coke 300ml
Sale of 300ml No. of Respondents PercentageNIL 18 18%0-1.5 Crates 30 30%1.5-3 Crates 40 40%3-4.5 Crates 7 7%4.5-6 Crates 2 2%More Than 6 2 2%Total 100 100%
Fig5.4: Daily sale of Coke 300ml
SALE OF COKE 300ml
18
30
40
7
2
2
NIL
0-1.5 Crates
1.5-3 Crates
3-4.5 Crates
4.5-6 Crates
More Than 6
Analysis & Interpretation: From the above table and graph it is interpreted that 18% of
the Retail Outlets were not selling 300ml glass bottles of Coke.30% of the Outlets were
selling 0-1.5 Crates daily of Coke.40% of the Outlets were selling 1.5-3 Crates of daily.
Outlets that were selling more than 6 Crates were 2%. From the above it can be
interpreted that majority of the Retailers were selling 1.5-3 Crates of Coke. There were

few Retailers that were selling 0-1.5 Crates of Coke daily. Very few Retailers were
selling 3-4.5 Crates per day. Also there were some Outlets that were not selling even a
single Crate of Coke.

How much stock of PET 600 ml crates do you sell (approx.) in a day of Pepsi?
To know the daily sales of Pepsi Pet 600ml in the Retail Outlets.
Table5.5: Daily sale of Pepsi Pet 600 mlSale of Pet 600ml No. of Respondents Percentage
NIL 10 10%0-1.5 Crates 50 50%1.5-3 Crates 35 35%3-4.5 Crates 3 3%4.5-6 Crates 2 2%More Than 6 0 0%Total 100 100%
`
Fig5.5: Daily sale of Pepsi Pet 600ml
SALE OF PEPSI PET 600ml
10
50
35
3
2
0
NIL
0-1.5 Crates
1.5-3 Crates
3-4.5 Crates
4.5-6 Crates
More Than 6
Analysis & Interpretation: From the above table and graph it can be analyzed that 10%
of the Retail Outlets were not selling Pet 600ml bottles of Pepsi.50% of the Outlets were
selling 0-1.5 Crates daily of Pepsi.35% of the Outlets were selling 1.5-3 Crates daily of
Pepsi. Outlets that were selling more than 6 Crates were 0%. Therefore it can be

interpreted that majority of the retailers were selling 0-1.5 crates of Pepsi. There were not
many retailers who were selling 1.5-3 Crates of Pepsi daily and very few retailers were
selling 3-4.5 Crates per day. Also there were some retailers that were not selling 600ml
bottles and they mainly comprised of paanwalas.

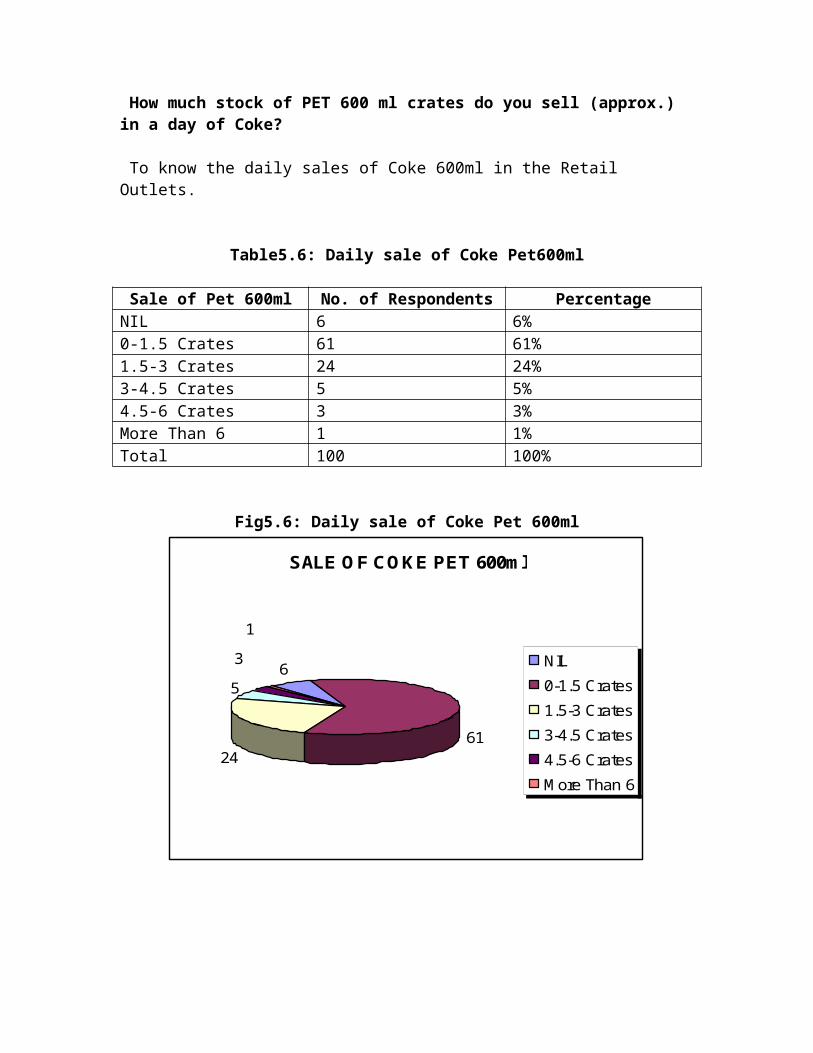
How much stock of PET 600 ml crates do you sell (approx.) in a day of Coke?
To know the daily sales of Coke 600ml in the Retail Outlets.
Table5.6: Daily sale of Coke Pet600ml
Sale of Pet 600ml No. of Respondents PercentageNIL 6 6%0-1.5 Crates 61 61%1.5-3 Crates 24 24%3-4.5 Crates 5 5%4.5-6 Crates 3 3%More Than 6 1 1%Total 100 100%
Fig5.6: Daily sale of Coke Pet 600ml
SALE OF COKE PET 600ml
6
6124
5
3
1
NIL
0-1.5 Crates
1.5-3 Crates
3-4.5 Crates
4.5-6 Crates
More Than 6
Analysis & Interpretation: From the above table and graph it has been interpreted that
6% of the Retail Outlets were not selling pet 600ml bottles of Coke.61% of the Outlets
were selling 0-1.5 Crates daily of Coke.24% of the Outlets were selling 1.5-3 Crates of
daily.Outlets which were selling 3-4.5 Crates were 5% and Outlets which were selling
more than 6 Crates were only 2%. Therefore it can be interpreted that majority of the

Retailers were selling 0-1.5 Crates of Coke. There were few Retailers that were selling 0-
1.5 Crates of Coke daily andVery few Retailers were selling 3-4.5 Crates per day. Also
there were some Outlets that were not selling even a single Crate of Coke.

How much stock of 2L crates do you sell (approx.) in a day of Pepsi?
To know the daily sales of Pepsi 2l in the Retail outlets.
Table5.7: Daily sale of Pepsi 2ltr
Sale of 2ltr No. of Respondents PercentageNIL 28 28%0-1.5 Crates 56 56%1.5-3 Crates 11 11%3-4.5 Crates 4 4% More Than 4.5 1 1%Total 100 100%
Fig5.7: Daily sale of Pepsi 2ltr
SALE OF PEPSI 2ltr
28
56
11
4
1
NIL
0-1.5 Crates
1.5-3 Crates
3-4.5 Crates
More Than 4.5
Analysis & Interpretation: From the above table and graph it is interpreted that 28% of
the Retail Outlets were not selling 2ltr bottles of Pepsi.56% of the Outlets were selling 0-
1.5 Crates daily of Pepsi.11% of the Outlets were selling 1.5-3 Crates of daily. There

were 4% of Outlets that were selling 3-4.5 Crates daily and only 1% of the Outlets were
selling more than 4.5 Crates. Therefore it can be interpreted that majority of the Retailers
were selling 0-1.5 Crates of Pepsi. There were few Retailers that were selling 1.5-3
Crates of Pepsi daily. Very few Retailers were selling 3-4.5 Crates per day. Also there
were some Outlets that were not selling even a single Crate of Pepsi 2ltr just because of
big in size and the Visi’s provided to them by the Company was small in size. The 2ltr
bottles were not kept by eateries due to not much demand of it.

How much stock of 2L crates do you sell (approx.) in a day of Coke?
To know the daily sales of Coke 2l in Retail Outlets.
Table5.8: Daily sale of Coke 2ltr
Sale of 2ltr No. of Respondents PercentageNIL 17 17%0-1.5 Crates 58 58%1.5-3 Crates 20 20%3-4.5 Crates 3 3% More Than 4.5 2 2%Total 100 100%
Fig5.8: Daily sale of Coke 2ltr
SALE OF COKE 2ltr
17
5820
3
2NIL
0-1.5 Crates
1.5-3 Crates
3-4.5 Crates
More Than 4.5
Analysis & Interpretation: From the above table and graph it has been interpreted that
17% of the Retail Outlets were not selling 2ltr bottles of Coke.58% of the Outlets were
selling 0-1.5 Crates daily of Coke.20% of the Outlets were selling 1.5-3 Crates of
daily.Outlets which were selling 3-4.5 Crates were 3% and Outlets which were selling

more than 4.5 Crates were only 2%. Therefore it can be interpreted that majority of the
retailers were selling 0-1.5 Crates of Coke. There were few retailers that were selling 0-
1.5 Crates of Coke daily and Very few retailers were selling 3-4.5 Crates per day. Also
there were some Outlets that were not selling even a single Crate of Coke.
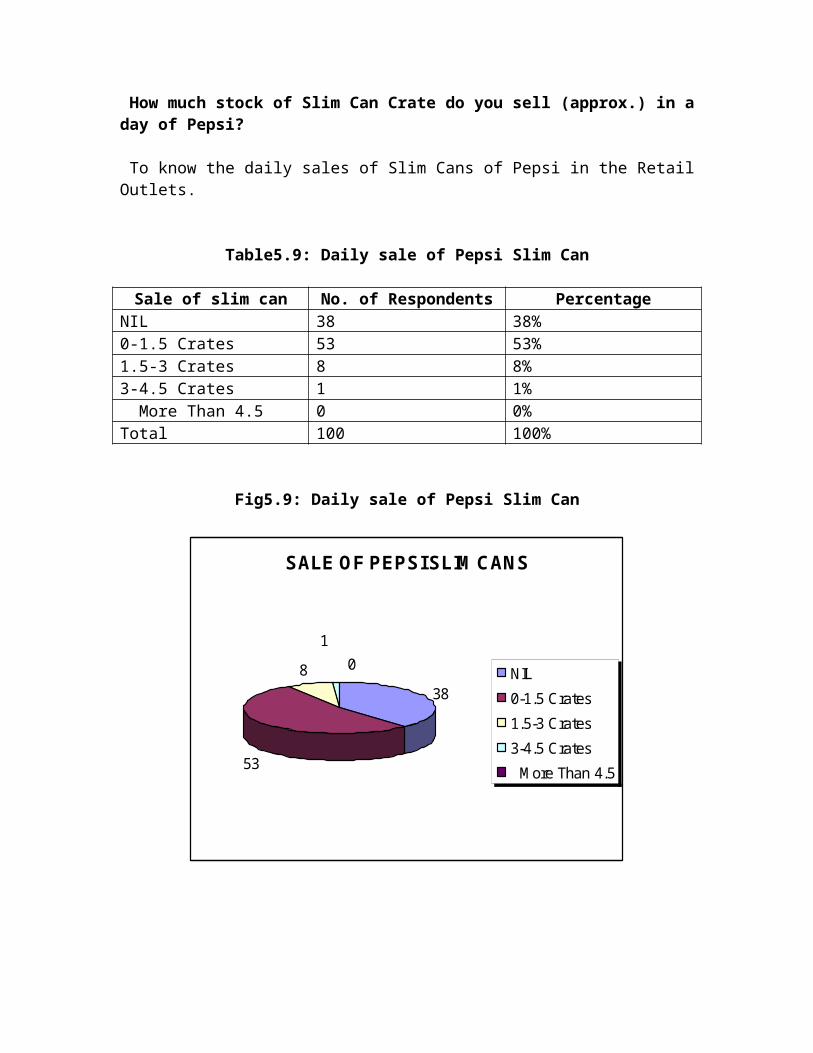
How much stock of Slim Can Crate do you sell (approx.) in a day of Pepsi?
To know the daily sales of Slim Cans of Pepsi in the Retail Outlets.
Table5.9: Daily sale of Pepsi Slim Can
Sale of slim can No. of Respondents PercentageNIL 38 38%0-1.5 Crates 53 53%1.5-3 Crates 8 8%3-4.5 Crates 1 1% More Than 4.5 0 0%Total 100 100%
Fig5.9: Daily sale of Pepsi Slim Can
SALE OF PEPSI SLIM CANS
38
53
8
1
0NIL
0-1.5 Crates
1.5-3 Crates
3-4.5 Crates
More Than 4.5
Analysis & Interpretation: From the above table and graph it has been interpreted that
38% of the Retail Outlets were not selling Slim Cans of Pepsi.53% of the Outlets were
selling 0-1.5 Crates daily of Pepsi.8% of the Outlets were selling 1.5-3 Crates of daily.
There was 1% of the Outlet that was selling 3-4.5 Crates daily and 0% of the Outlet was
selling more than 4.5 Crates. Therefore it can be interpreted that majority of the Retailers
were selling 0-1.5 Crates of Slim Cans. There were few Retailers that were selling 1.5-3

Crates of Pepsi Slim Cans daily and very few Retailers were selling 3-4.5 Crates per
day.Also there were many Outlets that were not selling even a single Crate of Pepsi Slim
Can just because of lack in demand and Price factor.

Do you have a Visi/Fridge?
To know that how many retailers are having Visi/Fridge in their Outlets.
Table5.10: To know regarding Visicoolers
Visi in outlets No. of Respondents Percentage
Yes 90 90%
No 10 10%
Total 100 100%
Fig5.10: to know regarding Visicoolers
TO KNOW REGARDING VISI
Yes, 90
No, 10
Yes
No
Analysis & Interpretation:: From the above table and pie chart it can interpreted that
90% of retailers are having Visi/Fridge at their Outlet and only 10% are not having any
Visi in their Outlet. Therefore it can be interpreted that majority of retailers are having
Visi’s in their outlet. There are very few Retailers that are not having Visi’s in their
Outlets. Being a beverage Company it is the necessity to promote the Product by
providing Visi’s in the Outlet.

Which Fridge do you own?
To know the brand of Visi/Fridge that are owned by the Retailers.
Table5.11: Visi’s owned by the Retailers
Visi owned No. of Respondents PercentageOwn 4 5%Coke Visi 9 10%Pepsi Visi 16 17%Both 61 68%Total 90 100%
Fig5.11: Visi’s owned by the Retailers
TYPE OF VISI's OWNED BY THE RETAILERS
49
16
61
Own
Coke Visi
Pepsi Visi
Both
Analysis & Interpretation: From the above table and graph it has been depicted that
61% of the retailers are having both the Visi’s of Pepsi and Coke.16% Retailers are
having the Visi’s of Pepsi and there are 9% of retailers that are having the Visi’s of Coke.
There are 4% retailers that do not owe any Visi. Therefore it can be interpreted that most
of the retailers are having both the Visi’s of Pepsi and Coke in their Outlet. Retailers who

owe Visi’s of Pepsi alone are more in number then that of Coke. There are very few
Outlets which owe their own Visi’s.


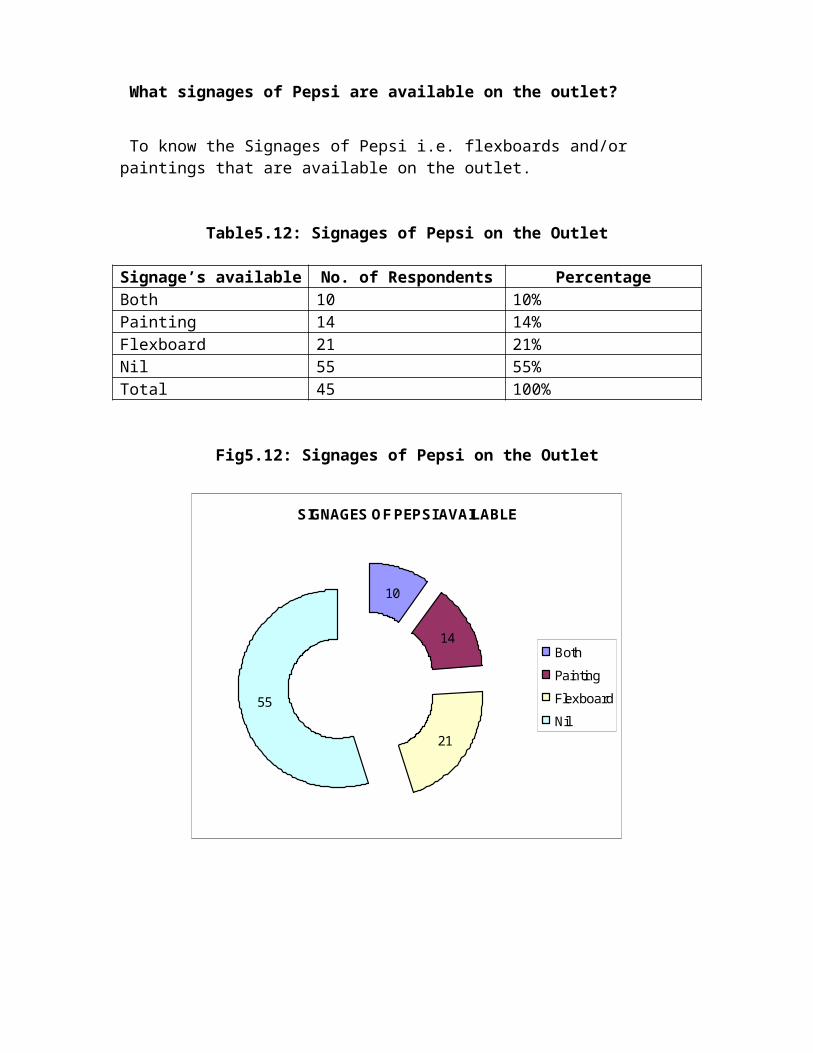
What signages of Pepsi are available on the outlet?
To know the Signages of Pepsi i.e. flexboards and/or paintings that are available on the outlet.
Table5.12: Signages of Pepsi on the Outlet
Signage’s available No. of Respondents PercentageBoth 10 10%Painting 14 14%Flexboard 21 21%Nil 55 55%Total 45 100%
Fig5.12: Signages of Pepsi on the Outlet
SIGNAGES OF PEPSI AVAILABLE
10
14
21
55
Both
Painting
Flexboard
Nil
Analysis & Interpretation: From the above table and graph it can be analyzed that only
22% of the outlets are having both flexboard and paintng.Out of 100 Outlets covered
21% are having flexboards and 14% of the Outlets are having painting.There are 55% of
the Outlets which are without signages. Therefore it can be interpreted that many of the

Outlets are having flexboards. Paintings are found in very few outlets. The Outlets in
which both flexboards and paintings are found are also very less in number. This shows
that Pepsi has very poor signages.

What Signages of Coke are available at the outlet?
To know the signages of Coke i.e. flexboard and/or painting that are available on the Outlet.
Table5.13: Signages of Coke on the outlet
Signage’s Available No. of Respondents PercentageBoth 14 14%Flexboard 21 21%Painting 22 22%Nil 43 43%Total 100 100%
Fig5.13: Signages of Coke at the outlet
SIGNAGES OF COKE AVAILABLE
14
21
22
43Both
Flexboard
Painting
Nil
Analysis & Interpretation: From the above table and graph it can be interpreted that
only 12% of the outlets are having both flexboard and paintng.Out of 100 Outlets covered
21% are having flexboards and 22% of the Outlets are having paintings. There are 43%
of the Outlets which are without signages. Therefore it can be interpreted that many of

the Outlets are having flexboards. Paintings are found in very few outlets. The Outlets in
which both flexboards and paintings are found are also very less in number. Though
Coke has also poor signages but that are better than the Pepsi.
Are you well communicated of the schemes that are available of Pepsi?
To know whether the Retailers are well communicated with the schemes of pepsi.
Table5.14: Awareness regarding schemes of pepsi
Schemes No. of Respondents Percentage
Yes 42 42%
No 58 58%
Total 100 100%
Fig5.14: Awareness regarding schemes of pepsi
AWARENESS FOR SCHEMES OF PEPSI
42
58
Yes
No
Analysis & Interpretation: From the above table and graph it can be analyzed that 58%
of the Retailers were not well communicated with the schemes of Pepsi. There are 42%
Retailers who were well communicated with the Schemes of Pepsi. Therefore it can be
analyzed that majority of the Retailers were not well communicated by the Schemes of
Pepsi. Few of them were well communicated with the Schemes of Pepsi. This showed
that Route Agents were not communicating the schemes properly in every Outlet.
Rank the following schemes which you think motivates you to buy Pepsi and its
Products.(1 being the lowest and 5 being the highest)?
To know about the Company schemes which motivates the Retailers to stock the Pepsi
and its Products.
Table5.15: Schemes that attract the Retailers
Factors Points Rank
Coupons 209 1
Free Gifts 257 2
Cash Discount 301 3
UTC(under the crown) 344 4
Extra Quantity(bottle/crate) 389 5
Fig5.15: Schemes that attract the Retailers
chemes that attract the retailers
209257
301344
389
050
100150200250300350400450
Points
schemes
Coupons
Free Gifts
Cash Discount
UTC(under the crown)
ExtraQuantity(bottle/crate)

Analysis & Interpretation: From the above table and graph it can be analyzed that 389
pts were being given to the scheme Extra Quantity followed by UTC 344 pts, Cash
Discount 301 pts, Free Gifts 257 pts and Coupons 209 pts..Therefore it is interpreted that
many of the retailers were very influenced by the Scheme Extra Quantity they think that
they earn more when Company offers them that Scheme. UTC was also preferred by
them as sales of the Pepsi are more under this Scheme. They were not satisfied with the
Schemes Free Gifts and Coupons.

With which company schemes are you more satisfied?
To know the satisfaction level of Retailers regarding the schemes of Pepsi and Coke.
Table5.16: Company schemes that satisfy the Retailers
Company Schemes No. of Respondents Percentage
None 2 2%
Pepsi 39 39%
Coke 59 59
Total 100 100%
Fig5.16: Company schemes that satisfy the Retailers
SATISFACTION REGARDING PEPSI & COKE SCHEMES
2 39
59
None
Pepsi
Coke
Analysis & Interpretation: From the above table and graph it can be interpreted that
62% of the Outlets were satisfied with the Schemes of Coke.32% of the Outlet were
satisfied with the Schemes of Pepsi. There were 2% of Outlets who were neither satisfied
from the schemes of Pepsi nor with the Coke. Therefore it can be interpreted that
majority of the Retailers were satisfied with the Schemes of Coke and very few Retailers
were satisfied with the schemes of Pepsi. This showed that Coke Schemes are highly

preferred than that of Pepsi Schemes. There are very few outlets whose satisfaction level
is nil regarding the Schemes of both the Companies.
FINDINGS
Research is incomplete without the findings. From the above study we have
come across the following findings:
Slice and Dew, Pepsi Cola and Coca Cola are the brands that are available in
almost all the outlets.Slice and Dew was available in 92 outlets
Regular supply is the main factor that motivates retailers to buy Pepsi and its
products.
45% of the retailers sell 0-1.5 crates of 300ml daily and 29% retailers sell 1.5-
3 crates daily of Pepsi.
30% of the retailers sell 0-1.5 crates of 300ml daily and 40% sell 1.5-3 crates
of Pepsi.
Coke 300ml has more sales than that of Pepsi.
Some of the outlets are not selling any glass bottles of Pepsi & Coke it is
because they are difficult to stock.
50% of the outlets are selling 0-1.5 crates of Pet 600ml of Pepsi daily while
61% of the outlets are selling 0-1.5 crates of coke daily which shows that
Coke has more sales.
58% of the outlets are selling 0-1.5 crates of Pepsi 2ltr while 53% are selling
that of Coke which shows Pepsi is leading Coke in 2ltrs.
In case of slim cans 53% of the outlets are selling 0-1.5 crates of Pepsi and it
has no competition with Coke.
90% of the Retailers are having visi’s at their outlet.
61% of the retailers are provided with the visi’s of both the companies that is
Coke and Pepsi.16% of the outlets are having only Pepsi vis’s and 9% of the
outlets are having Coke Visi’s.
55% of the outlets are without any signages which shows that company is not
advertising its products.
Flexboards are more common in the outlets as compared to the paintings.
43% of the outlets are there without any signages of Coke.
58% of the retailers are not well aware with the schemes of the Pepsi.
The route agent does not communicate the schemes properly to the retailers
who act as a major interface between the company and the retailers.
Most of the retailers are satisfied with the scheme of Extra Quantity and they
are least interested in coupons.
62% of the retailers are satisfied with the schemes of Coke and 32 % are
satisfied with that of Pepsi.


CONCLUSION
Pepsi has built a reputation around the world as a major player in the soft drink market as
well as the leader in the snack food industry. This has been done by creating a
wholesome environment for their customers all the while maintaining its integrity.
PepsiCo is performing very well in India it has 43 bottling plants in India, of which 15
are company owned and 28 are franchisee owned. The Company offers variety of
products in one umbrella i.e. soft drinks. The project was more of a market survey it was
to collect the information about the retailers. The main objective behind this study was to
know about the factors that motivate the retailers to buy Pepsi products, promotions
offered by the company, presence of visi’s at the outlet, schemes that were available to
the retailers and their satisfaction to the same.
As nothing has been studied earlier related to this so my research was exploratory and the
study was conducted in different sectors of the Chandigarh. from the studies it was found
that signage’s of Pepsi are not that good as compared to that of Coke and retailers are not
satisfied with the schemes. Relation of the company with the retailers are not satisfactory
and manipulation of schemes is a very common practice in most of the outlets.
Company is facing stiff competition from Coca-Cola. To become competent it is
recommended to improve its relation with the retailers as they are the backbone of the
company, regular follow up should be done by the company emplaoyees and more
emphasis should be laid on promoting the product.

RECOMMENDATIONS
From the above study following suggestions are being recommended to the
company which they should consider to improve their brand image and
increase in sales so that they can maintain their share in the market:
Regular follow-up and visits will boost the sales of the Company and will
further build healthy relation with the Retailers.
An open session with the Route agents can be held on monthly basis and
they should be given proper training to how to communicate the Schemes
to the Retailers.
It is important to create a competitive spirit among the Route Agents.
Incentives on the basis of the highest share of an agent should be provided
if possible.
Aggressive Schemes should be adopted on those Outlets in which
Company’s share is less.
Different schemes should be adopted in areas where the sale of Coke’s
PET is very high as compared to that of Pepsi(2 bottles scheme with 2ltr
case and with every 5 cases 5 bottles of 600ml + 2 bottle scheme) etc.
To increase the sales of Mirinda more stress should be done on its
aggressive advertising and it should be given to the Retailers with some
good Schemes.
Slim Cans should be advertised well to sustain in the market as it is not
having much competition with the Coke.

Complaints of the Retailers regarding the Visi’s should be handeled
properly.
Old Signages should be replaced with the good one’s.(Chota Pepsi Rs 6/-)
Visi’s should be kept in front so that consumers can have a easy access
and can know the product range.
Surprise visits should be done on the outlets and the Retailers having pure
Visi’s should be rewarded.

APEEJAY INSTITUTE OF MANAGEMENT
As the student of Apeejay Institue Of Management, I am doing a research on “Micro
Profiling Of Pepsi Retailers In Urban Areas Of Chandigarh”. This study is done For The
Partial Fulfillment Of the MBA Degree. Your responses will be kept confidential and
used only for statistical purpose.
SECTION –A
Personal Details
1) NAME
2) GENDER: M_____ F_______
3) ADDRESS
4) CONTACT NO. ____________________
SECTION B
Q1) Which of the following do you usually buy/stock?
a) Pepsib) Diet Pepsic) Mountain Dewd) Slicee) Mirinda Orangef) Mirinda Lemong) 7up

Q2) Rank the following factors that motivates you to buy Pepsi and its Products? (5 being the highest and 1 being the lowest)
a) Regular Supplyb) Signagesc) Visi/Fridged) Schemese) Consumer Demand
Q3) How much stock of 300 ml crates do you sell (apprx.) in a day of Pepsi?
a) Nilb) 0-1.5 Cratesc) 1.5-3 Cratesd) 3-4.5 Cratese) 4.5-6 Cratesf) More Than 6
Q4) How much stock of 300 ml crates do you sell (apprx.) in a day of Coke?
a) Nilb) 0-1.5 Cratesc) 1.5-3 Cratesd) 3-4.5 Cratese) 4.5-6 Cratesf) More Than 6
Q5) How much stock of PET 600 ml crates do you sell (approx.) in a day of Pepsi?
a) Nilb) 0-1.5 Cratesc) 1.5-3 Cratesd) 3-4.5 Cratese) 4.5-6 Cratesf) More Than 6
Q6) How much stock of PET 600 ml crates do you sell (approx.) in a day of Coke?
a) Nilb) 0-1.5 Cratesc) 1.5-3 Cratesd) 3-4.5 Cratese) 4.5-6 Cratesf) More Than 6

Q7) How much stock of 2L crates do you sell (approx.) in a day of Pepsi?
a) Nilb) 0-1.5 Cratesc) 1.5-3 Cratesd) 3-4.5 Cratese) More than 4.5
Q8) How much stock of 2L crates do you sell (approx.) in a day of Coke?
a) Nilb) 0-1.5 Cratesc) 1.5-3 Cratesd) 3-4.5 Cratese) More Than 4.5
Q9) How much stock of Slim Cans crates do you sell (approx.) in a day of Pepsi?
a) Nilb) 0-1.5 Cratesc) 1.5-3 Cratesd) 3-4.5 Cratese) More Than 4.5
Q10) Do you have a Visi/ Fridge ?
a) Yes b) No
Q11) Which Fridge do you own?
a) Pepsi Visib) Coke Visic) Bothd) Own
Q12) What signages of Pepsi are available on the outlet?
a) Flexboardb) Paintingc) both

Q13) What signages of Coke are available on the outlet?
a) Flexboardb) Paintingc) Both
Q14) Are you well communicated of the schemes that are available of Pepsi?a) Yesb) No
Q 15) Rank the following schemes which you think motivates you to buy Pepsi and its
Products. (1 being the lowest and 5 being the highest)?
a) Extra Quantity (bottle/crate)b) Free Giftc) UTC (under the crown)d) Cash Discounte) Coupon
Q16) With which company schemes are you more satisfied?a) Pepsib) Cokec) None