Final Report: Solidification / Stabilization Bench … Report. Solidification / Stabilization...
59
Final Report Solidification / Stabilization Bench-Scale Treatability Study for the Mohawk Tannery Site, Nashua, New Hampshire Prepared by: Shaw Environmental, Inc. Technology Applications Laboratory 304 Directors Drive Knoxville, TN 37923 Contract No. EP-C-05-056 Work Assignment No. 2-75 Shaw Project No. 128836-75 Prepared for: U.S. Environmental Protection Agency National Risk Management Research Laboratory Cincinnati, OH 45268 December 2009 T/PROJECTS/Project Files/Mohawk/Final Mohawk Tannery SS Report.doc
Transcript of Final Report: Solidification / Stabilization Bench … Report. Solidification / Stabilization...
Final Report
Solidification / Stabilization Bench-Scale Treatability Study for the Mohawk Tannery Site,
Nashua, New Hampshire
Prepared by:
Shaw Environmental, Inc. Technology Applications Laboratory
304 Directors Drive Knoxville, TN 37923
Contract No. EP-C-05-056 Work Assignment No. 2-75
Shaw Project No. 128836-75
Prepared for:
U.S. Environmental Protection Agency National Risk Management Research Laboratory
Cincinnati, OH 45268
December 2009
T/PROJECTS/Project Files/Mohawk/Final Mohawk Tannery SS Report.doc
Table of Contents
List of Tables ................................................................................................................................... i List of Figures ................................................................................................................................. ii List of Acronyms............................................................................................................................ iii
1.0 Introduction......................................................................................................................... 1
1.1 Site Description....................................................................................................... 1
1.2 Site Media Characterization and Description ......................................................... 1
1.3 Remedial Technology Description.......................................................................... 1
2.0 Treatability Study Approach ............................................................................................... 2
2.1 Test Objectives and Rationale ................................................................................ 2
2.2 Experimental Design and Procedures ..................................................................... 2
2.2.1 Treatability Samples ....................................................................................3
2.2.2 Composite Sample Characterization............................................................3
2.2.3 Formulation Development ...........................................................................3
2.2.4 Solidification / Stabilization Treatment Verification Testing......................6
2.3 Equipment and Materials ........................................................................................ 6
2.3.1 Equipment ....................................................................................................6
2.3.2 Materials ......................................................................................................6
2.4 Sampling and Analysis............................................................................................ 6
2.5 Data Management ................................................................................................... 7
2.5.1 Data in Bound Laboratory Notebooks .........................................................7
2.5.2 Analysis Reports ..........................................................................................7
2.5.3 Computer Print-outs.....................................................................................7
2.5.4 Data Review.................................................................................................7
2.5.5 Data Analysis and Interpretation..................................................................7
2.6 Deviations from Work Plan .................................................................................... 7
3.0 Results and Discussion ..................................................................................................... 10
3.1 Characterization .................................................................................................... 10
3.2 Formulation Screening Testing..............................................................................11
3.3 Soil Solidification / Stabilization Verification Testing......................................... 17
4.0 Conclusions and Recommendations ...................................................................................... 20
4.1 Conclusions........................................................................................................... 20
4.2 Recommendations..................................................................................................23
T/PROJECTS/Project Files/Mohawk/Final Mohawk Tannery SS Report.doc i
T/PROJECTS/Project Files/Mohawk/Final Mohawk Tannery SS Report.doc i
List of Tables
Number Title
2-1 Parameters for Characterization of the Mohawk Treatability Samples2-2 Parameters for Characterization of the Treatability Composite Samples3-1 Characterization Results for the Mohawk Tannery Treatability Samples3-2 Initial Baseline SPLP Leachability Results for the Mohawk Tannery Treatability
Composite Samples3-3 Results for the Mohawk Tannery Area 1 Tier 1 Formulations3-4 Results for the Mohawk Tannery Area 1 Tier 2 Formulations3-5 Area 1 Percent Volume Increase3-6 Results for the Mohawk Tannery Area 1 Tier 3 Formulations3-7 Results for the Mohawk Tannery Area 1 Tier 4 and 5 Formulations3-8 SPLP Leaching Results for the Mohawk Tannery Area 1 Tiers 4 and 5
Formulations3-9 Results for the Mohawk Tannery Area 2 Tier 1 Formulations3-10 SPLP Leaching Results for the Mohawk Tannery Area 2 Tier 1 Formulations3-11 Results for the Mohawk Tannery Area 2 Tier 2 Formulations3-12 Results for the Mohawk Tannery Area 2 Tier 3 Formulations3-13 Area 2 Percent Volume Increase3-14 SPLP Leaching and Permeability Results for the Mohawk Tannery Area 2
Tier 3 Formulations3-15 Results for the Mohawk Tannery Areas 1 and 2 Combined Sample Formulations3-16 Results for the Mohawk Tannery Area 1 Water Modified Screening Test
Formulations3-17 Results for the Mohawk Tannery Areas 1 and 2 Verification Formulations3-18 SPLP Leaching, UCS and Permeability Results for the Mohawk Tannery
Area 1 Verification Formulations3-19 SPLP Leaching, UCS and Permeability Results for the Mohawk Tannery
Area 2 Verification Formulations
T/PROJECTS/Project Files/Mohawk/Final Mohawk Tannery SS Report.doc ii
List of Figures
Number Title
1 Areal View of Mohawk Tannery2 Areal View of Mohawk Tannery3 Site Layout4 Mohawk Area 1 Pond5 Mohawk Tannery Other Cross Sections6 Mohawk Tannery Other Cross Sections7 Mohawk Area 1 Formulations Pocket Penetrometer Values
T/PROJECTS/Project Files/Mohawk/Final Mohawk Tannery SS Report.doc iii
List of Acronyms
ASTM American Society for Testing and MaterialsBFS blast furnace slagcm/sec centimeter per secondCr chromiumCr(III) trivalent chromiumCr(VI) hexavalent chromiumDES Department of Environmental ServicesFAC Fly ash Class CFAF Fly ash Class FHL hydrated limekg kilogrammg/kg milligrams per kilogramsmg/L milligrams per literPAHs polynuclear aromatic hydrocarbonPC Portland cementpH -log[H+]PP Pocket Penetrometerpsi pounds per square inchS/S solidification / stabilizationSPLP Synthetic Precipitation Leaching ProcedureSVOCs semivolatile organic compoundstsf tons per square footUCS unconfined compressive strengthUSEPA United States Environmental Protection Agencyv/v volume to volume
T/PROJECTS/Project Files/Mohawk/Final Mohawk Tannery SS Report.doc 1
1.0 Introduction
1.1 Site DescriptionThe Mohawk Tannery site is located in the City of Nashua, New Hampshire. The site is
bordered by the Nashua River to the west, a closed landfill to the north, and residential areas tothe east and southeast. The site is a former leather tannery facility, operated as Mohawk Tanneryand Granite State Leathers from 1924 to 1984. While in operation, the site used several
hazardous substances in the preparation and tanning of animal hides. Over the course of itsoperational history, the Mohawk Tannery utilized waste lagoons. See Figures 1 through 3 for
aerial views of the Mohawk Tannery site and an USEPA figure showing the site layout. InFigures 1 and 2, the site is next to the river, below the bend in the river.
1.2 Site Media Characterization and DescriptionDisposal Area 1 is located on the west side of the site, along the Nashua River, and is an openlagoon that was part of the facility’s wastewater treatment system. Disposal Area 2 is a formerlagoon that has since been covered with soil, and is located adjacent to the river. Previous site
investigations have indicated that the sludges in Disposal Areas 1 and 2 are impacted withpolynuclear aromatic hydrocarbons (PAHs) and metals. Figures 4, 5, and 6 show theapproximate locations for the Area 1 sample collection and approximate cross-section
information for Areas 1 and 2.
1.3 Remedial Technology Description
The technology selected for the bench-scale treatability study is solidification / stabilization
(S/S). The structural integrity and durability are often enhanced when the material is solidified.The solidification increases the material compressive strength, load-bearing capacity anddecreases its permeability. By decreasing the permeability of the solidified material, the rate of
contaminant release is decreased. Stabilization, or chemical fixation, transforms contaminantsinto their least toxic and/or mobile form, thereby reducing their impact on the environment andhuman health.
T/PROJECTS/Project Files/Mohawk/Final Mohawk Tannery SS Report.doc 2
2.0 Treatability Study Approach
2.1 Test Objectives and Rationale
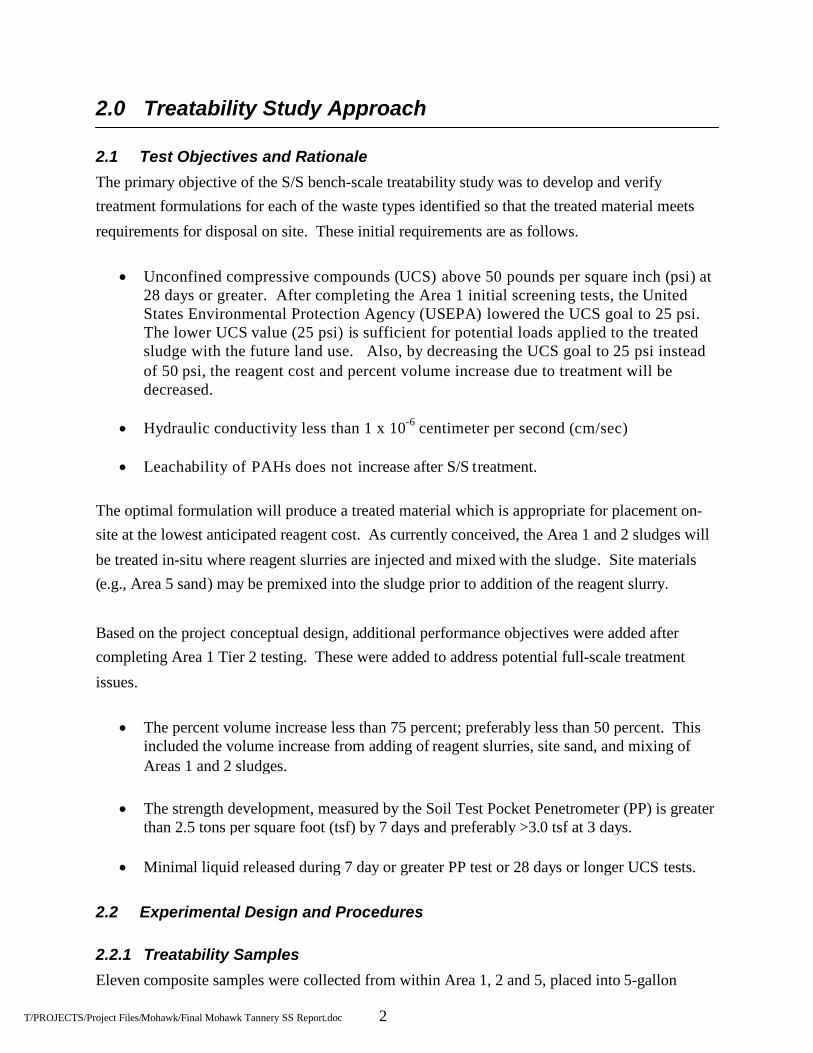
The primary objective of the S/S bench-scale treatability study was to develop and verifytreatment formulations for each of the waste types identified so that the treated material meets
requirements for disposal on site. These initial requirements are as follows.
Unconfined compressive compounds (UCS) above 50 pounds per square inch (psi) at28 days or greater. After completing the Area 1 initial screening tests, the UnitedStates Environmental Protection Agency (USEPA) lowered the UCS goal to 25 psi.The lower UCS value (25 psi) is sufficient for potential loads applied to the treatedsludge with the future land use. Also, by decreasing the UCS goal to 25 psi insteadof 50 psi, the reagent cost and percent volume increase due to treatment will bedecreased.
Hydraulic conductivity less than 1 x 10⁻⁶ centimeter per second (cm/sec)
Leachability of PAHs does not increase after S/S treatment.
The optimal formulation will produce a treated material which is appropriate for placement on-site at the lowest anticipated reagent cost. As currently conceived, the Area 1 and 2 sludges will
be treated in-situ where reagent slurries are injected and mixed with the sludge. Site materials(e.g., Area 5 sand) may be premixed into the sludge prior to addition of the reagent slurry.
Based on the project conceptual design, additional performance objectives were added aftercompleting Area 1 Tier 2 testing. These were added to address potential full-scale treatment
issues.
The percent volume increase less than 75 percent; preferably less than 50 percent. Thisincluded the volume increase from adding of reagent slurries, site sand, and mixing ofAreas 1 and 2 sludges.
The strength development, measured by the Soil Test Pocket Penetrometer (PP) is greaterthan 2.5 tons per square foot (tsf) by 7 days and preferably >3.0 tsf at 3 days.
Minimal liquid released during 7 day or greater PP test or 28 days or longer UCS tests.
2.2 Experimental Design and Procedures
2.2.1 Treatability Samples
Eleven composite samples were collected from within Area 1, 2 and 5, placed into 5-gallon
T/PROJECTS/Project Files/Mohawk/Final Mohawk Tannery SS Report.doc 3
buckets and shipped to Shaw’s Technology Development Laboratory in Knoxville, Tennessee fortreatability testing. The samples are listed below:
Area 1 composite A, B and C Pit 2 (Area 2) sludge composite A and B Pit 2 (Area 2) fill surface Pit 2 (Area 2) lower black sand Pit 2 (Area 2) upper 4 ft black sand Pit 2 (Area 2) chromium (Cr) sand (Sand from the P2 area that was assumed to be
contaminated with chromium. Gravel pit fill Area 5 sand.
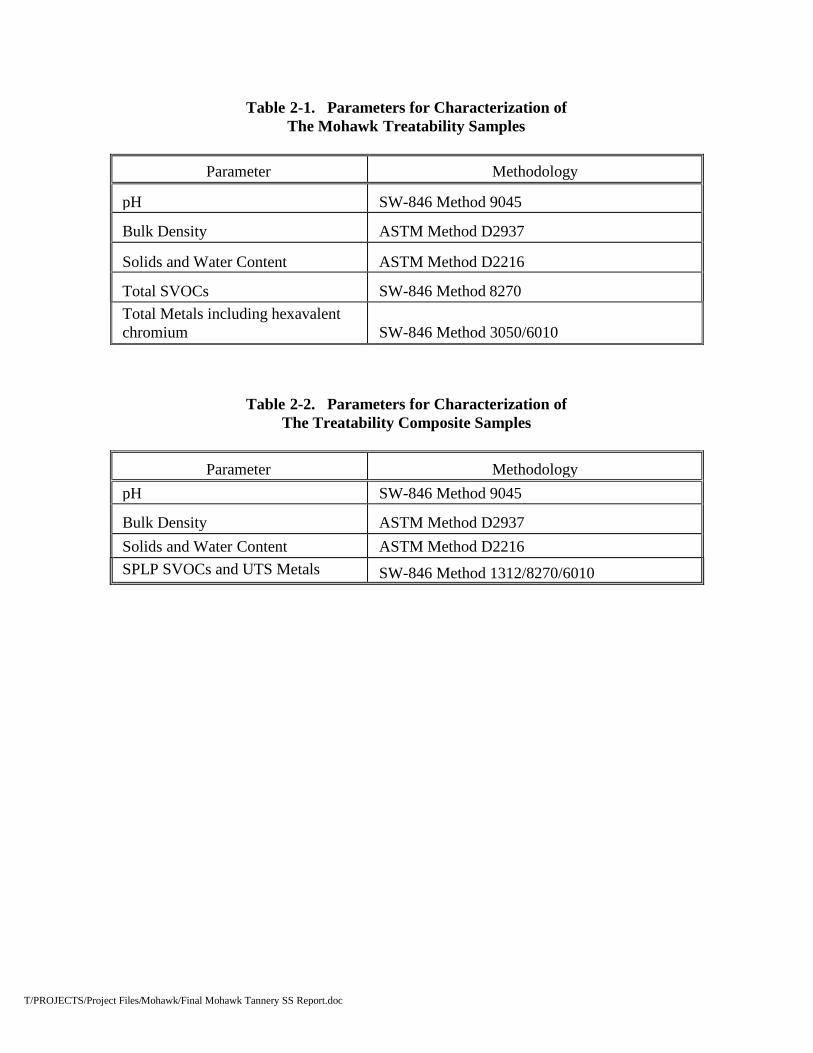
Each sample was individually homogenized before being tested for the analyses listed in Table2.1.
Results (Table 3-1) from these initial characterization analyses were used to determine which ofthe samples would be used for the S/S treatability study. The selected samples were considered
to be representative of the average contamination found within Areas 1 and 2.
2.2.2 Composite Sample Characterization
Based largely on the results for hexavalent chromium [Cr(VI)]) and organic compoundconcentrations (Table 3-1), samples were selected for further study. Areas 1 (A, B, and C) and
Area 2 (A and B) composite samples were prepared and homogenized. Each of the homogenizedarea composite samples was analyzed for the parameters listed in Table 2-2.
2.2.3 Formulation Development
Treatment TierThere were five and three tiers of formulations development for Areas 1 and 2, respectively. Inthese tests, the binder and organic adsorbent mix ratio, water to binder ratio and the addition of
ferrous sulfate heptahydrate were varied to determine formulation to meet the performancespecification (Section 2.1). The formulations investigated are shown in Section 3. In general,
the reagent dose rate was increased and the water to binder ratio decreased as the subsequent tiersprogressed. Treated sample preparation followed the procedure described above.Treatment Procedure
S/S treatments were investigated on Areas 1 and 2 composite samples. The following regentswere used in this treatability study. Reagents and reagent combinations were chosen that hadbeen proven successful for previous S/S projects.
T/PROJECTS/Project Files/Mohawk/Final Mohawk Tannery SS Report.doc 4
Portland cement (PC) Lafarge blast furnace slag (BFS) Hydrated lime (HL) Fly ash Class C (FAC) Fly ash Class F (FAF) Ferrous sulfate heptahydrate Spill King™ absorbent Nochar’s Petro Bond N910 polymer.
The first five reagents were binders to S/S the sludges. Ferrous sulfate heptahydrate was added
to chemically reduce hexavalent to trivalent chromium [Cr(III)]. The last two reagents wereorganic adsorbents added to decrease the impact of the organic contaminant on the binderreactivity.
Portions of composite (~1 kilogram [kg]) were measured and used for each formulation. Reagentadmixtures were weighed and dry mixed based on the wet weight of the samples. Water was
added to the reagent admixtures to prepare reagent slurries. For Area 1, Area 5 sand was mixedwith the untreated material prior to the addition of the reagent slurry. Area 5 sand was added on
a percentage of the Area 1 sample volume. The reagent slurry was added and the treated materialwas mixed using an orbital planetary mixer with a spade mixing blade for about 2 minutes oruntil the material was visually homogeneous. The mixer was operated on one of its lowest two
mixing speeds. The treated material was then compacted into 2-inch by 4-inch plastic rightcylinder molds in three lifts using 25 blows of a tamping rod for each lift. Specimen cups werealso filled in the same manner for each treated material.
Lids were placed onto and tightly sealed on each cylinder mold and specimen container.Cylinder molds were placed into a room temperature humidity chamber to cure until further
testing. Samples in specimen containers were allowed to cure at room temperature on the bench-top until further testing.
The treated material from each formulation was subjected to daily strength development testingusing a SoilTest CL-100 PP for the first 7 days. Based on the PP strength development results
and comparison to objectives in Section 2.1, promising formulations were selected for UCStesting [American Society for Testing and Materials (ASTM) D1633] and Synthetic PrecipitationLeaching Procedure (SPLP) testing (for SVOCs and metals) after 7 days of curing. Based on the
7-day UCS and SPLP results, selected formulations were subjected to UCS testing after 14 and28 days of curing and to permeability testing (ASTM D5084) after 28 days of curing.Observation of free liquids was made during the ASTM D1633 UCS testing.
T/PROJECTS/Project Files/Mohawk/Final Mohawk Tannery SS Report.doc 5
Combined Area 1 and Area 2 Formulation Screening MixSome excavation work was performed at the Mohawk site during the time of the treatability
testing. This work involved excavating some Area 2 material and moving it on top of Area 1.An Area 1 - Area 2 composite formulation was prepared since it was unknown the impact ofadding in Area 2 sludge into Area 1. The formulation was prepared using a composite sample
consisting of 10 parts by volume Area 1 material to 1 part by volume Area 2 material. This ratiowas based on a rough estimate of the amount of excavated Area 2 material placed into the Area 1
pond. Sample preparation and testing followed the same procedures used in the initialformulation screening samples as described above. The formulation investigated is listed below.
0.30 mix ratio PC + 0.10 mix ratio BFS + 0.06 mix ratio HL + 0.23 mix ratiowater + 50 volume percent Area 5 sand where mix ratio is the weight of thereagent to as-is weight of sludge and 50 volume percent is one-half volume ofArea 5 sand to one volume of sludge.
Impact of Treating Water on Top of Area 1 SludgeThroughout the screening process it became apparent that the treatment of the Area 1 sludge washighly contingent on moisture content of the treated product. This is significant due to possiblesite changes, water levels and the necessity of adding stabilization reagents as a slurry blend.
The following formulations were prepared to determine the amount of reagent necessary to treatthe Area 1 sludge along with an additional volume of 1.5 feet of excess standing water above it.With these tests, only enough material was prepared to conduct PP tests. Approximately 100
grams of sludge was hand mixed with dry sand and then reagent slurry. The resulting productwas transferred into 8-ounce specimen cup and hand compacted. The specimen cups were
capped except during PP measurements. These formulations were tested for PP strengthdevelopment. The 0.47 mix ratio PC formulation was based on the selected Area 1 Tier 5formulation but added in more reagents (PC/BFS/HL) to react with the additional free-standing
water. As an approximation, the amount of PC/BFS/HL was increased by approximately onepound dry reagent for each pound water floating on top of Area 1 sludge. The 0.40 and 0.64 PCmix ratio formulations were leaner and richer reagent formulations than the baseline formulation
(0.47 Pc mix) to estimate the bounds of treatment.
T/PROJECTS/Project Files/Mohawk/Final Mohawk Tannery SS Report.doc 6
Area 1 Water Modified Formulation Screening Mixes
0.40 mix ratio PC + 0.13 mix ratio BFS + 0.08 mix ratio HL + 0.45 mix ratiowater + 50 volume percent Area 5 sand
0.47 mix ratio PC + 0.16 mix ratio BFS + 0.09 mix ratio HL + 0.50 mix ratiowater + 50 volume percent Area 5 sand
0.64 mix ratio PC + 0.21 mix ratio BFS + 0.13 mix ratio HL + 0.64 mix ratiowater + 50 volume percent Area 5 sand
2.2.4 Solidification / Stabilization Treatment Verification TestingBased on formulation results in Tiers 1, 2, 3, 4 and 5, one formulation from Area 1 and oneformulation from Area 2 were chosen for verification testing. The selected formulations werefreshly prepared in triplicate and tested for PP strength development, UCS, permeability andSPLP leachability.
2.3 Equipment and Materials
2.3.1 Equipment
The equipment for the stabilization treatability testing included, but not limited to
Dual-shaft helical mixer 1000 m L glass jars 2-inch diameter x 4-inch high plastic molds 2-quart Kitchen-Aid planetary mixer 2-quart stainless steel mixing bowls 2000 mL glass jars Metal spatulas and mixing blades Lars Land TCLP tumbler
2.3.2 MaterialsThe S/S treatment reagents investigated were PC, Lafarge BFS, HL, FAC, FAF, ferrous sulfateheptahydrate, Spill King™ absorbent and Nochar’s Petro Bond N910 polymer.
2.4 Sampling and AnalysisRepresentative samples of the selected homogenized soil and sludge were collected and analyzed
for the parameters described in Sections 2.2.1 and 2.2.2. Solidified samples of the soil andextraction leachates from formulation screening and verification testing produced during the
treatability testing were analyzed for UCS, permeability, and SPLP leachability.
T/PROJECTS/Project Files/Mohawk/Final Mohawk Tannery SS Report.doc 7
2.5 Data Management
All raw data from the bench-scale treatability study resides in bound laboratory notebooks,analytical reports from Shaw’s Technology Applications Laboratory or outside analyticallaboratories, or computer-generated print-outs from computer-controlled equipment.
2.5.1 Data in Bound Laboratory Notebooks
All entries in bound laboratory notebooks were made in black ink and will be considered rawdata. At the end of each entry, the initials of the laboratory personnel responsible and date were
entered. All corrections were initialed and dated at the time of correction and a note explainingthe correction included.
2.5.2 Analysis Reports
All analytical reports from Shaw’s Technology Applications Laboratory or outside analytical
laboratories will be maintained as raw data. Any corrections or additions to analytical reportspreviously received must be accompanied by a written explanation from the analytical laboratory.Only qualified Shaw personnel are allowed to make corrections to analytical reports from the
Technology Applications Laboratory.
2.5.3 Computer Print-outs
Computer printouts from computer-controlled equipment will be maintained as raw data. The
initials of the equipment operator and the date of generation were added to each page of all suchcomputer printouts. Regenerated printouts will be identified as such and any corrections noted.
2.5.4 Data Review
Prior to issuing a final report, all pertinent raw data was reviewed to ensure the data quality. The
Treatability Program Manager or the Treatability Laboratory Manager reviewed all relevantlaboratory notebook pages, computer printouts, and analytical reports. Any discrepancies in theraw data uncovered in this or any review were immediately brought to the attention of the
appropriate laboratory personnel and corrected.
2.5.5 Data Analysis and InterpretationBased on the UCS, SPLP metals and permeability results for the five tiers of formulationscreening samples, Shaw determined the admixtures and mix ratios for verification testing. Theverification testing results were used to select applicable full-scale treatment conditions for thesite soil.2.6 Deviations from Work PlanSection 4.0 and subsequent sections 4.1, 4.2 and 4.3 of the “Solidification / Stabilization Bench-
T/PROJECTS/Project Files/Mohawk/Final Mohawk Tannery SS Report.doc 8
Scale Treatability Study Work Plan for the Mohawk Tannery Site” states that samples from“Disposal Area 1, Area 2, and Areas 3, 4, 6, and 7 at the Mohawk Tannery Site will be sampledfor S/S bench-scale treatability testing.” Based on observations of Ed Bates of USEPA and Paul
Lear formally of Shaw, samples were only taken in Areas 1 and 2 for treatability testing. Notreatability testing was performed for Mohawk Tannery Site Areas 3, 4, 6 or 7.
Section 5.2 of the “Solidification / Stabilization Bench-Scale Treatability Study Work Plan forthe Mohawk Tannery Site” states, “The sample material in each bucket from Disposal Areas 1and 2 will be individually homogenized using a dual-shaft helical mixer and an aliquot removed
for characterization. The homogenized samples will be characterized for solids and moisturecontent, bulk density, PAHs, and pH.” All of tests listed above were performed as stated. Inaddition metals were analyzed using SW- 846 methods 3050 and 6010B.
Section 5.3 of the “Solidification / Stabilization Bench-Scale Treatability Study Work Plan for
the Mohawk Tannery Site” states, “The pentachlorophenol analysis will be conducted intriplicate to assess homogeneity.” Following the sampling event, it was determined thatpentachlorophenol was not considered to be a concern on the site; and therefore, was not used as
a marker for the sample homogeneity. The measurement of the leachable SVOC by SPLP wasdropped from the scope under the direction of Ed Bates.
Sections 5.3.1, 5.3.2 and 5.3.3 of the “Solidification / Stabilization Bench-Scale TreatabilityStudy Work Plan for the Mohawk Tannery Site” states, “Based on results of these initialformulations, one or two additional tiers of formulation development and testing may be required
to optimize reagent addition.” Additional tiers of testing (five for Area 1 and 3 for Area 2) wereperformed due to difficulties in reaching the stabilization goals outlined in Section 2.1 of thisreport. The UCS performance goal was decreased from 50 to 25 psi at the direction of Ed Bates.
Testing was performed using this tier approach in order to minimize the use of sample andcontrol testing costs. All formulations were tested under the consultation and guidance of the
USEPA, and the New Hampshire Department of Environmental Services (DES).

T/PROJECTS/Project Files/Mohawk/Final Mohawk Tannery SS Report.doc 9
Section 5.3.3 of the “Solidification / Stabilization Bench-Scale Treatability Study Work Plan forthe Mohawk Tannery Site” states “Portions (~1,000 grams each) of the Disposal Areas 3, 4, 6,and 7 composite samples will be mixed with various reagents known to be proficient in the S/S
of PAH-contaminated materials.” Based on observations of Ed Bates of USEPA and Paul Learformally of Shaw, samples were only taken in Areas 1 and 2 for treatability testing. No
treatability testing was performed for Mohawk Tannery Site Areas 3, 4, 6 or 7.
T/PROJECTS/Project Files/Mohawk/Final Mohawk Tannery SS Report.doc 10
3.0 Results and Discussion
3.1 Characterization
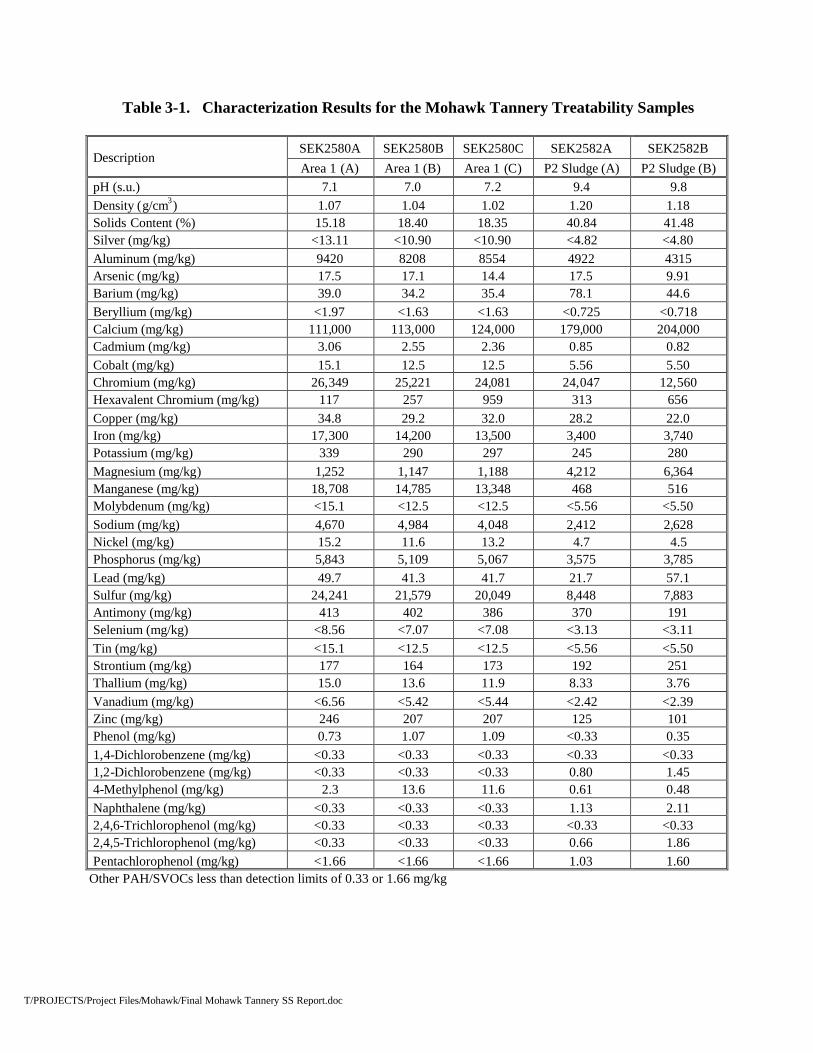
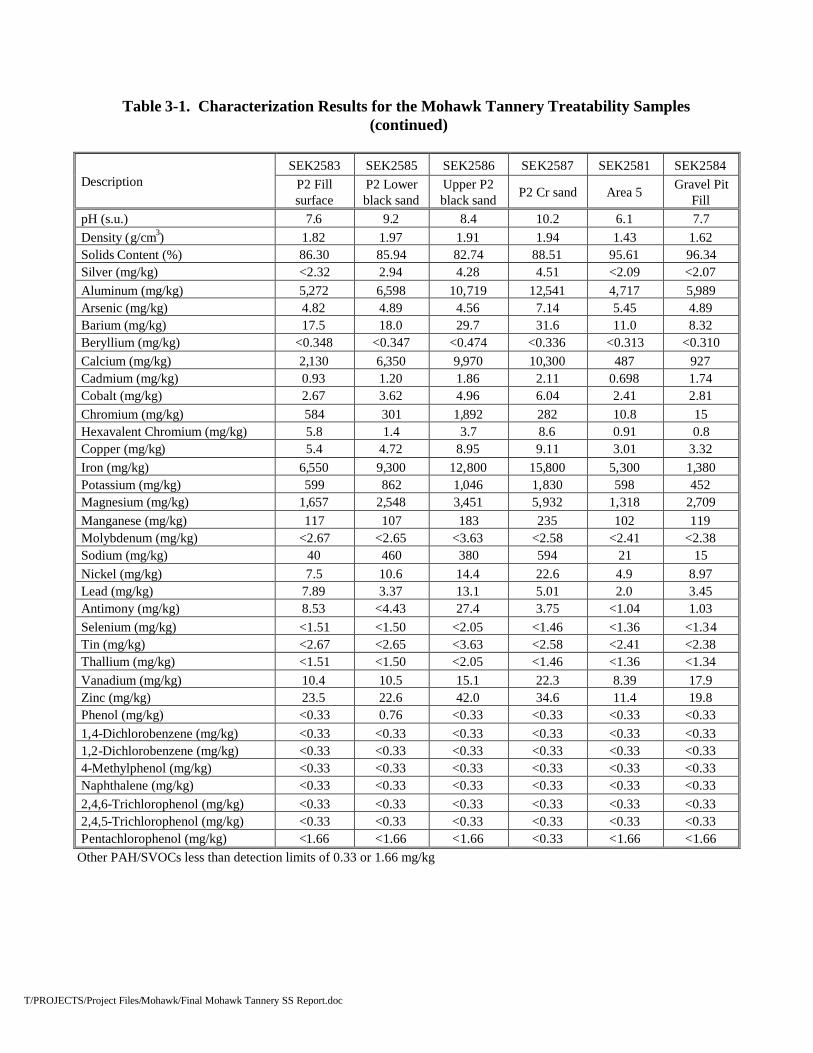
The initial characterization data for the Mohawk Tannery samples are summarized in Table 3-1.
Solid Content
The initial solids content for the Mohawk Tannery site materials ranged from 15.18 to 96.34percent for the three Area 1 sludges, two Area 2 (P2) sludges, the P2 fill (surface), P2 lowerblack sand, P2 upper black sand, P2 Cr sand, the Area 5 sand, and the gravel pit fill. The average
Area 1 sludge solid content (about 17 percent) was had less than half the solids content of Area 2sludge (about 41 percent).
Metals AnalysisTotal metals analysis of the samples indicated total Cr concentrations of 26,349; 25,221; and24,081 milligrams per kilograms (mg/kg) for the Area 1 A, B, and C sludges, respectively. The
total hexavalent Cr concentrations of these samples were 117, 257 and 959 mg/kg. The two Area2 sludge samples had total and Cr(VI) concentrations of 24,047 and 12,560 mg/kg and 313 and656 mg/kg, respectively. The P2 fill (surface), P2 lower black sand, P2 upper black sand, P2 Cr
sand, the Area 5 sand, and the gravel pit fill had total Cr concentrations of 584, 301, 1,892, 282,10.8 and 15 mg/kg, respectively. The Cr(VI) concentrations for these samples were 5.8, 1.4, 3.7,8.6, 0.91, and 0.8 mg/kg, respectively. Analyses of these results show that the majority of total
Cr and Cr(VI) were in the Areas 1 and 2 sludges. Since the majority of Cr (Table 3-1) and SPLPleachable organic compounds (Table 3-2) were in Areas 1 and 2 sludges, they were selected for
S/S treatability testing.
Organic Analysis
Total PAH analyses indicated measureable concentrations of phenol and 4-methylphenol insamples from Area 1. The concentrations of these constituents were 0.73, 1.07 and 1.09 mg/kgphenol and 2.3, 13.6 and 11.9 mg/kg 4-methyl phenol, respectively.
Samples from Area 2 contained measureable amounts of 1, 2 dichlorobenzene, 4-methylphenol,Naphthalene, 2, 4, 5-trichlorophenol and pentachlorophenol. 1, 2 Dichlorobenzene was found at
0.80 and 1.45 mg/kg. 4-methylphenol was found at 0.61 and 0.48 mg/kg. Naphthalene wasfound at 1.13 and 2.11 mg/kg. 2, 4, 5-Trichlorophenol was found at 0.66, and 1.86 mg/kg andpentachlorophenol was found at 1.03 and 1.60 mg/kg, respectively. Of the other six samples
T/PROJECTS/Project Files/Mohawk/Final Mohawk Tannery SS Report.doc 11
only the P2 lower black sand contained a measureable amount of phenol, 0.76 mg/kg, none of theother organics were detected in these samples.
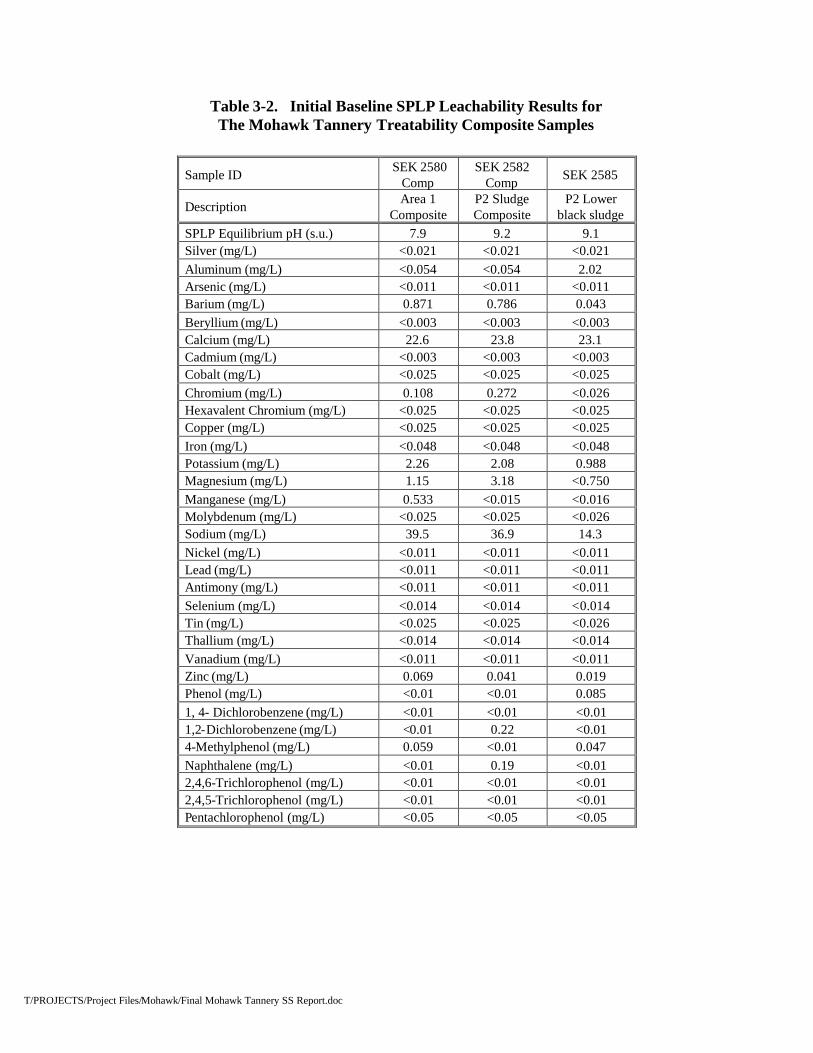
SPLP LeachabilityThe three Area 1 and two Area 2 individual samples were composited to make Areas 1 and 2composites. These Areas 1 and 2 composites and the P2 lower black sludge were each subjected
to an SPLP to determine baseline leaching. The leachates were analyzed for metals and PAHs.Each of the leaching tests and analyses were performed in triplicate. Results are found in Table
3-2.
The baseline SPLP-leachable metals analysis indicates that the composite Area 1, Area 2 and the
P2 lower black sludges had leachable total Cr concentrations of 0.108, .272 and <0.026milligrams per liter (mg/L), respectively. The leachable Cr(VI) for each sample was determinedto be <0.025 mg/L.
Leachable 4-methyl phenol at a concentration of 0.059 mg/L was detected in the Area 1 SPLPleachate. The SPLP leachate for the Area 2 sludge contained 1, 2 dichlorobenzene at 0.22 mg/L
and naphthalene at 0.19 mg/L. The SPLP leachate for the P2 lower black contained phenol at0.085 mg/L, and 4-methylphenol at 0.047 mg/L.
3.2 Formulation Screening Testing
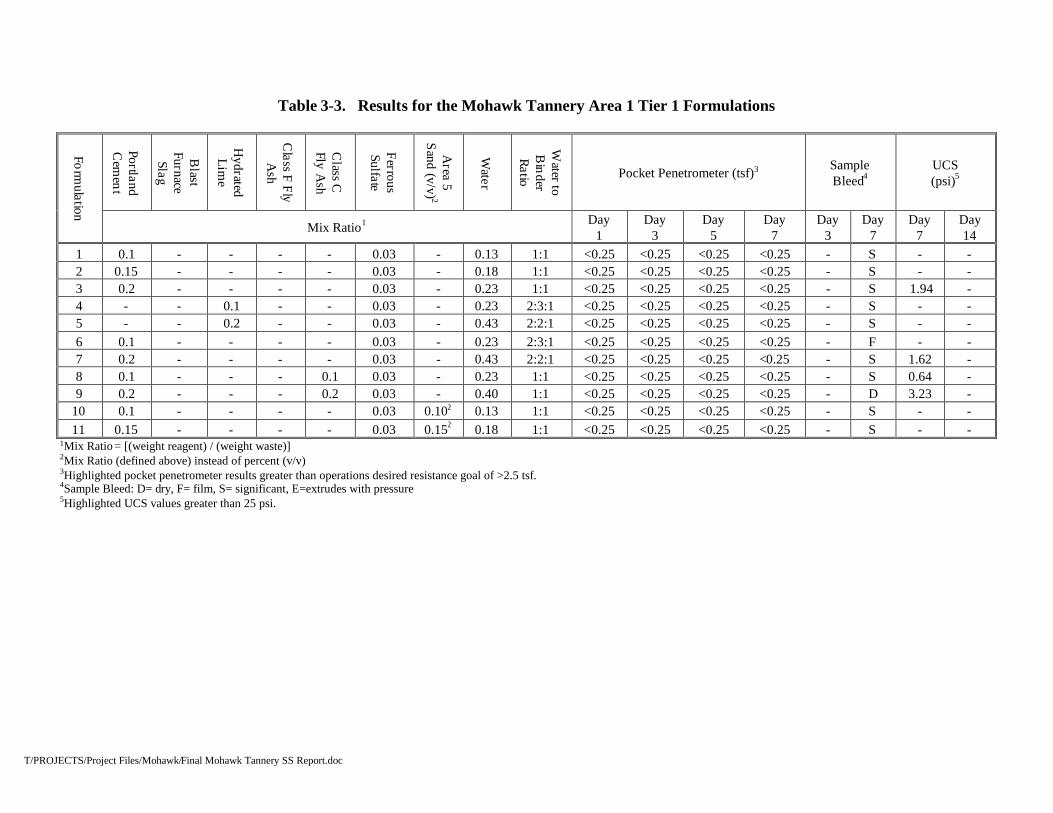
Area 1 Tier 1The first eleven Area 1 pond sludge formulations found on Table 3-3 were prepared utilizing
various mix ratios (m.r.) of PC, HL, FAC and Area 5 sand. These reagents were added toincrease the solid content of the sludge and to S/S the sludge. Each of the formulations alsocontained 0.03 mix ratio of ferrous sulfate heptahydrate and water. Ferrous sulfate heptahydrate
was added to chemically reduce Cr(VI) to Cr(III). The dry reagents, with the exception of theArea 5 sand, were added as 1:1 or about 2.3:1 water to reagent slurry.
Analysis of PP Strength GainAnalysis of the results indicates that none of the first eleven Area 1 formulations developed anymeasureable strength above 0.25 tsf within the first 7 days after mixing. UCS testing on Area 1
formulations 3, 7, 8 and 9 indicated strengths of 1.94, 1.62, 0.64 and 3.32 psi after 7 days,respectively. Based on the PP and the UCS results being less than the performance objectives,no further testing was performed on these formulations.
T/PROJECTS/Project Files/Mohawk/Final Mohawk Tannery SS Report.doc 12
Area 1 Tier 2Since Cr(VI) did not leach from the untreated materials above the detection limits, ferrous sulfateheptahydrate addition was omitted from all tests past Tier 1. SPLP Cr was analyzed in latter
promising formulations to ensure Cr(VI) was not an issue. Nine formulations were tested in Tier2. Based on results from previous sludges with organic studies, BFS was added to the Tier 2formulations to improve strength formation. The Area 5 sand content was increased to provide
more body feed and improve the strength characteristics.
Data from the Tier 2 strength formation testing are found in Table 3-4. Analysis of the PP resultsshows, except for Formulation 13, there was no strength development by day seven. This latterformulation used a 0.20 mix ratio of 75/25 PC/BFS. PP measurements were continued until day
62 to determine if the treated sludge would set up and harden with longer cure times. The PPvalues at 62 days showed some strength formation in Formulations 13, 15, 18 and 19. The UCSresults for these samples were 15.1, 11.7, 36.2 and 24.6 psi for each of these formulations,
respectively, none of which met the initial performance goal of 50 psi. The two Formulations 18and 19, which had the largest 62-day PP and UCS values, had the largest overall binder dose rate.Their UCS values were close to 25 psi UCS goal.
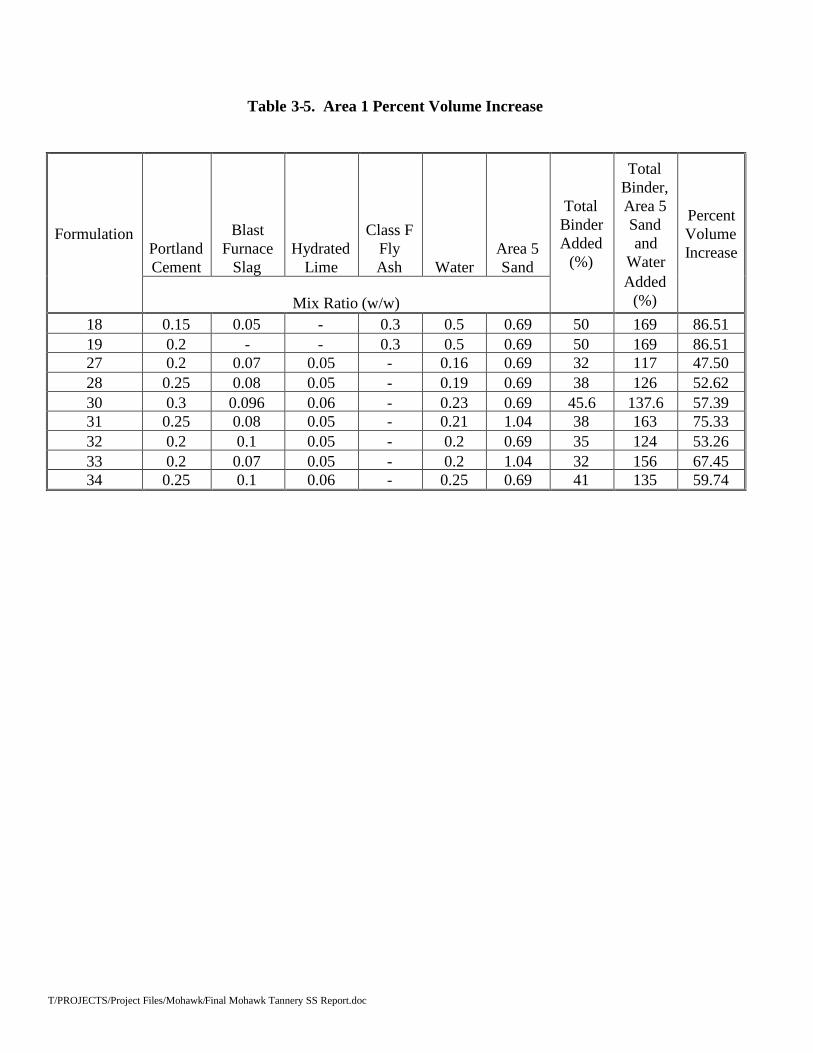
The percent volume increase was calculated for several formulations. The Area 1 percentvolume increase results are in Table 3-5. Formulations 18 and 19 percent volume increase
exceeded the 75 percent volume expansion goal.
As none of the formulations met the PP and UCS goals, no leaching tests were performed sincenone of the formulations met the performance criteria for strength.
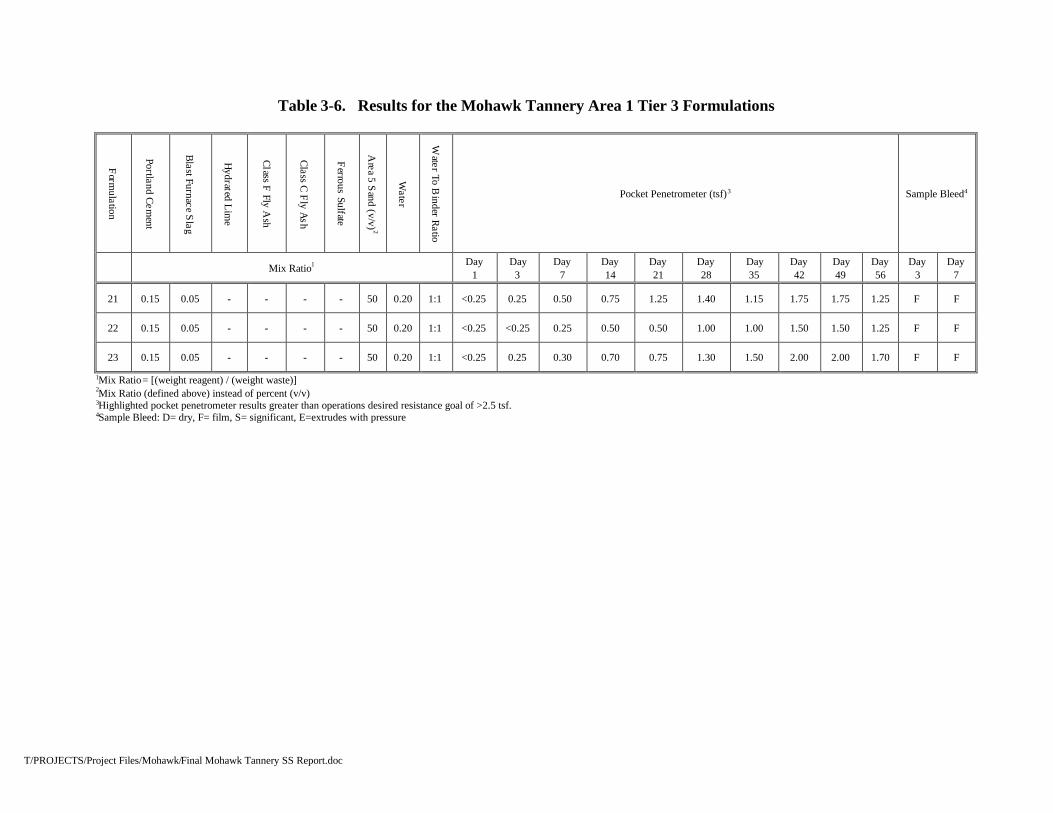
Area 1 Tier 3Three Tier 3 formulations were prepared. Formulation containing Spill King and Petrobondabsorbents were added in an attempt to further adsorb organic constituents that may be inhibitingthe cement-based strength development reactions. Previous studies at other sites had shown
these adsorbents may improve cement-based S/S when treating an organic containing material.These absorbents and the Area 5 sand were mixed into the sludge prior to the addition of the PC-
based reagent slurries. PP results measured over a 56-day period, found in Table 3-6, indicatelittle strength formation for these three formulations. The maximum PP strengths were 2.00 tsf.With the Tier 3 7-day PP results, the addition of the organic adsorbents did not improve the PP
measured strength development. No leaching tests were performed on these formulations as thePP values were too low.
T/PROJECTS/Project Files/Mohawk/Final Mohawk Tannery SS Report.doc 13
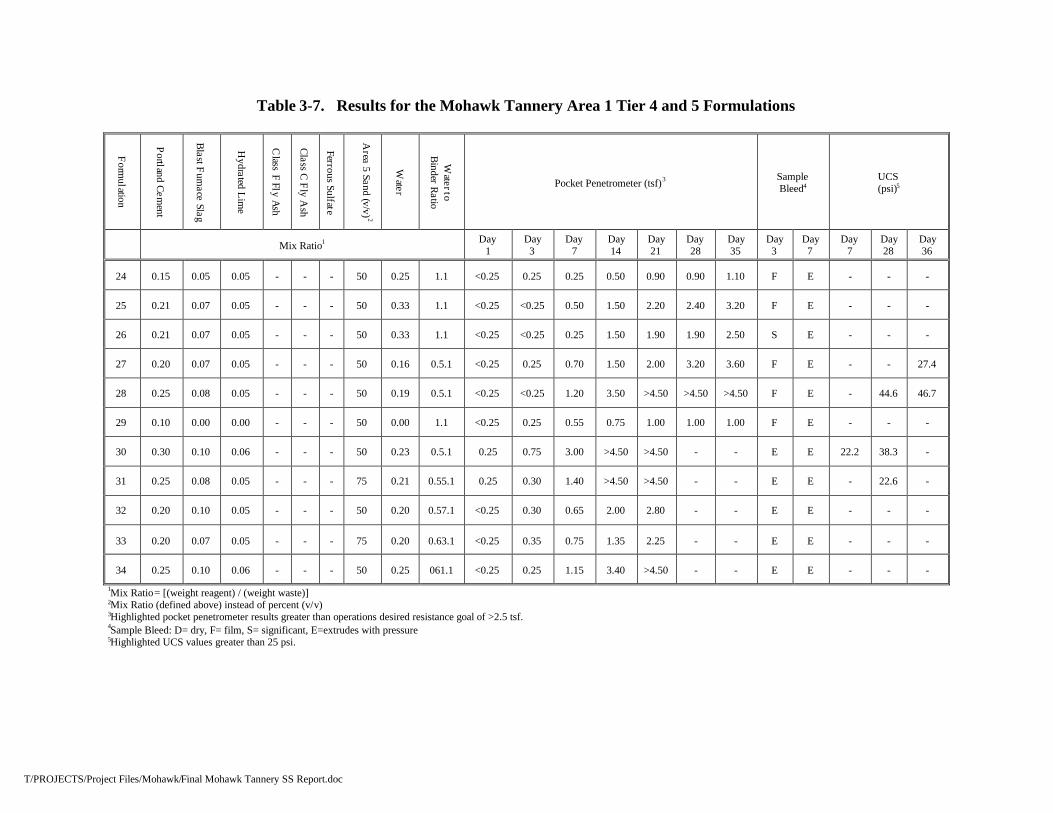
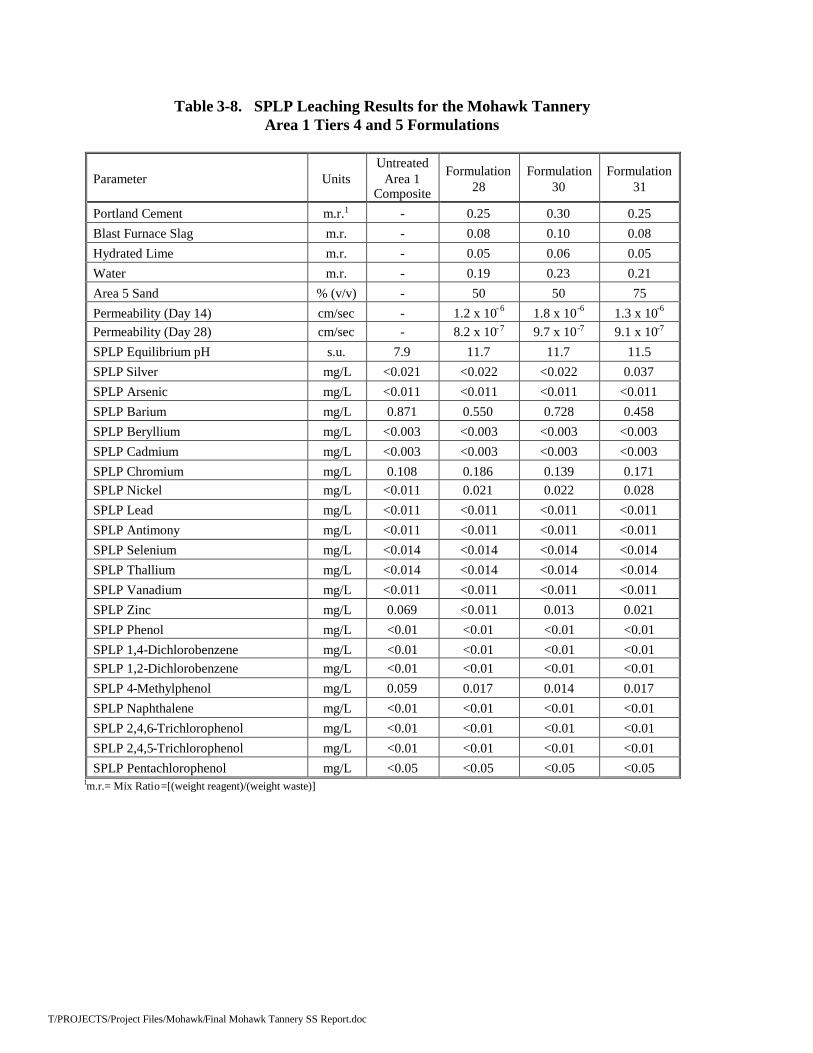
Area 1 Tiers 4 and 5Tiers 4 and 5 consisted of eleven additional Area 1 formulations. All formulations used PC andBFS blends. HL was added to increase solid content. The water to binder ratio was varied in
these tests. Additional formulations containing the Spill King Reagent, Formulations 24 and 25,were also tested. Results for Tiers 4 and 5 are found in Tables 3-7 and 3-8. Formulations with atleast 33 percent of combined PC plus BFS dose rate had PP values >3.4 tsf within 14 days. The
PP results improved with lower water to binder ratios. Formulation 30 with the highest totaldose rate of PC and BFS and HL and water to binder ratio of about 1:2 showed the most rapid
rate of PP strength gain. Figure 4 shows the PP results for nine Area 1 formulations. Analysis ofthe figure shows that Formulation 30 develops PP strength faster than the other formulations.Formulations 28, 31, and 34 have similar day 7 PP results; however, Formulation 31, which had
some PP strength development in 14 days, exceeded the percent volume expansion goal.
In the previous tiers, addition of Area 5 sand had little to no impact on the PP results. At these
higher Tier 4 and 5 binder dose rates, addition of Area 5 sand did improve the PP results slightly;however, the volume increase with a 75 percent volume to volume (v/v) Area 5 sand additionwas unacceptable (Table 3-5).
UCS measurements were taken at 7 and 28 days for Formulation 30 and were found to be 22.2and 38.3 psi, respectively. Formulation 28 was tested at days 28 and 36 and had UCS values of
44.6 and 46.7 psi, respectively. Formulations 27 and 31 were tested at 36 and 28 days and werefound to have strengths of 27.4 and 22.6 psi, respectively. None of the Tier 4 and Tier 5 Area 1
formulations had UCS strength greater than the original 50 psi goal formulations; however,Formulations 28 and 30 met the revised 25 psi goal.
Formulations 28, 30 and 31 were also tested for permeability at 14 and 28 days and SPLPleaching at 28 days of cure. The permeability and leaching results are found in Table 3-8.
Permeability results indicate permeability values of 8.2 x 10⁻⁷, 9.7 x 10⁻⁷, and 9.1 x 10⁻⁷ cm/sec at28 days of cure for Formulations 28, 30 and 31, respectively all of which exceed the 1 x 10⁻⁶
cm/sec criteria.
SPLP leaching results indicate a slight increase of Cr leaching in all three formulations.
Formulation 28 contained 0.186 mg/L SPLP leachable Cr. Formulation 30 contained 0.139 mg/LSPLP leachable Cr, and Formulation 31 contained 0.171 mg/L SPLP leachable Cr while theuntreated Area 1 sludge contained 0.108 mg/L SPLP leachable Cr. 4-Methylphenol was the only
organic constituent detected in any of the SPLP leachates at concentrations of 0.017, 0.014, and
T/PROJECTS/Project Files/Mohawk/Final Mohawk Tannery SS Report.doc 14
0.017 mg/L respectively for Formulations 28, 30 and 31. Each was less than the SPLP leachable4-methylphenol concentration in the untreated sludge material at 0.059 mg/L.
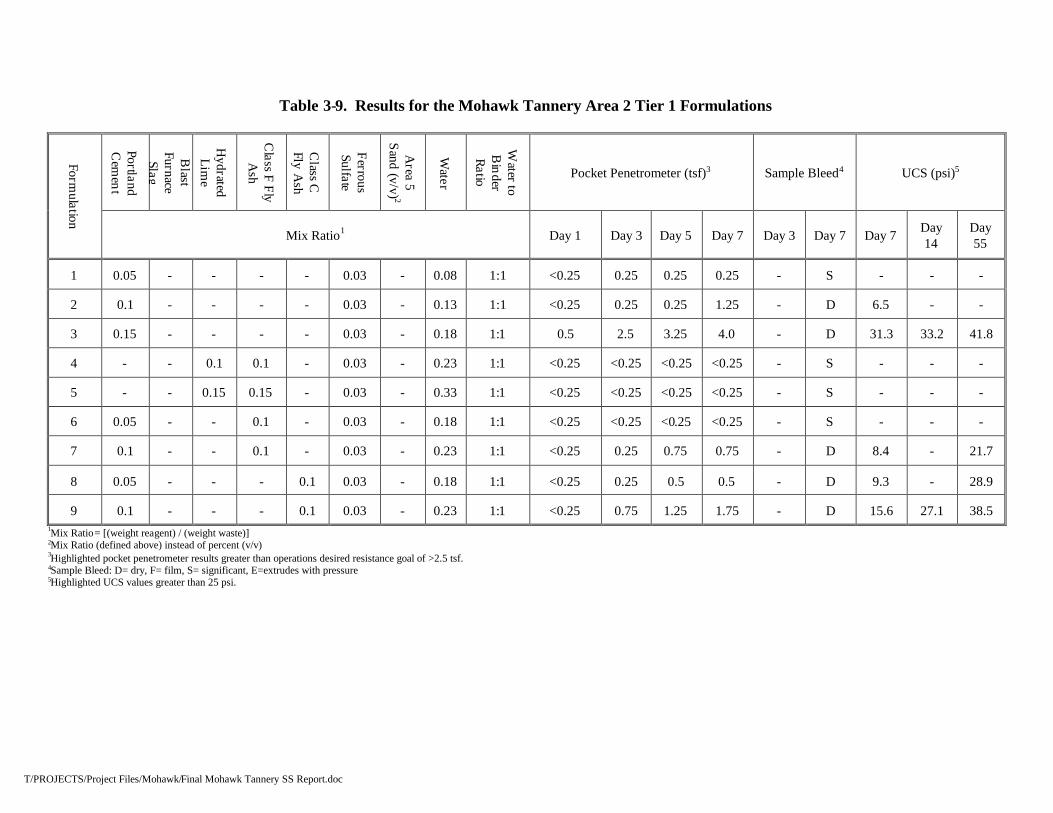
Area 2 Tier 1The Area 2 sludge Tier 1 Formulations (1-9) are found in Table 3-9. These formulations wereprepared utilizing various mix ratios of PC, HL, FAC, and FAF. Each formulation also
contained 0.03 mix ratio of ferrous sulfate heptahydrate and water. The dry reagents wereslurried (1:1) with water prior to being mixed with the sludge.
Formulation 3 met the PP goal of 2.5 tsf by day 3. UCS was determined on formulations with PP>0.5 tsf. Formulations 2, 3, 7, 8 and 9 had UCS of 6.5, 31.3, 8.4, 9.3 and 15.6 psi after 7 days of
cure, respectively. None of these formulations had UCS values greater than the original 50 psigoal; however, Formulation 3 had an acceptable strength (31.3 psi) above the revised UCS goalof 25 psi. Additional UCS tests were conducted on days 14 and 55. None of these formulations
reached the original performance criteria of 50 psi at day 55. Formulations 3, 8, and 9 all hadUCS values above 25 psi.
Based on the first 7 days of PP and the 7-day UCS testing results, Area 2 Formulations 3 and 9were chosen for SPLP analysis after 7 days of curing. Results are found in Table 3-10. SPLPresults for Area 2 Formulations 3 and 9 indicated an increase of organic constituent leachability
in the treated samples compared to the SPLP organic leachable concentrations found in theuntreated Area 2 materials. The leachable concentration of phenol, 4-methyl phenol, and 2, 4, 5
trichlorophenol were less than the detection limit in the untreated sludge. Their SPLPconcentrations increased to >0.10 mg/L in the treated materials. Pentachlorophenol was alsobelow the detection limit in the untreated material at a concentration of less than 0.05 mg/L, but
was found at concentrations of 0.20 mg/L in the SPLP leachates for both formulations. The twoother compounds found in SPLP leachate of the untreated material, 1, 2-dichlorobenzene at 0.22mg/L and naphthalene at 0.019 mg/L also increased in the SPLP leachates for Formulations 3 and
9 to 0.26, 0.27 0.25 and 0.22 mg/L, respectively.
Area 2 Tier 2Two Tier 2 formulations were prepared for the Area 2 sludge. Results are shown in Table 3-11.Formulations included a formulation with a higher cement dosage, 0.20 mix ratio, and aformulation using a 0.20 mix ratio of a 72/25 PC BFS blend. Higher dose rates were used to
increase the rate of PP strength gain from those in Tier 1. The dry reagents were slurried withequal amounts of water prior to being mixed with the sludge. Formulations 10 and 11 reachedsignificant PP strength formation at 3 days. Formulation 11 had a PP value of 3.75 tsf while
T/PROJECTS/Project Files/Mohawk/Final Mohawk Tannery SS Report.doc 15
Formulation 11 had a PP value of 4.25 tsf. At seven days of cure both formulations reached >4.5tsf. UCS for these formulations was 50.9 and 109 psi at 28 days, respectively, which weregreater than the original performance criteria of 50 psi. The percent volume increase was about
25 percent which is essentially the same as for Formulations 3 and 8 with 15 percent binder doserates. No leaching tests were performed on Area 2 Formulations 10 and 11.
Area 2 Tier 3Seven formulations were prepared for the Area 2 Tier 3 screening tests. These formulations were
prepared to further optimize reagent loadings based on the previous screening results.Formulations 3b, 10b and 11b were repeats of previously prepared Formulations 3, 10 and 11;however ferrous sulfate heptahydrate was omitted in the repeated Formulation 3b. Formulations
3b, 10b, and 11b used binder ratios of 15 and 20 percent at water to binder ratios ofapproximately 1:1. Formulations 12 through 15 used binder ratios from 13 to 16 percent;however, the water to binder ratio in the reagent slurry was decreased by about 50 percent.
Results are found in Table 3-12.
PP results were all greater than 2.5 tsf at 3 days cure. In addition, each formulation increased
strength over the first seven days of cure. UCS was tested at 7 days for all formulations and at 28days for Formulations 13, 14 and 15. Of these formulations, only Formulation 15 had a UCSvalue that exceeded the original 50 psi performance criterion at 7 days. At 28 days, the UCS
results for Formulations 13, 14 and 15 exceeded the 50 psi criteria. Analysis of the PP and UCSresults further show that decreasing the water to binder ratio improved the PP and UCS results.
The percent volume increase for Formulations 13, 14, and 15 were all less than 11 percent. (SeeTable 3-13.) Decreasing the water to binder ratio also decease the percent volume increase.
Formulations 13, 14 and 15 were tested for permeability at 14 and 28 days and SPLP leaching at28 days. The permeability and leaching results for Formulations 13, 14 and 15 are found inTable 3-14. The permeability results were 2.0 x 10⁻⁷, 7.6 x 10⁻⁷, and 2.0 x 10⁻⁷ cm/sec for
Formulations 13, 14 and 15, respectively, all of which exceed the 1 x 10⁻⁶ cm/sec criterion.
Analysis of SPLP leaching results indicated a decrease of Cr leaching in Formulation 13, 0.195
mg/L compared to the SPLP leachable Cr concentration of 0.272 mg/L found in the untreatedArea 2 sludge. The SPLP leachable Cr concentrations for Formulations 14 and 15 were slightly
T/PROJECTS/Project Files/Mohawk/Final Mohawk Tannery SS Report.doc 16
above the untreated materials at 0.701 and 0.324 mg/L respectively. SPLP leachable organicconstituents were the same or less than the untreated sludge.
Combined Areas 1 and 2 MaterialIn addition to the various tiers of formulations for the Area 1 and Area 2 sludges, a combinedArea 1 and Area 2 formulation was prepared primarily to determine whether the addition of some
of the Area 2 sludge would affect the set characteristics of the treated material. [Note: SomeArea 2 sludge was placed within Area 1 following collection of the original treatability study
samples as a result of the City of Nashua’s work to upgrade the sewer line near Areas 1 and 2during the summer of 2009.] The reagent dosage rate was chosen based upon the strength resultsfor the Area 1 Tiers 4 and 5 formulations. The percentage of reagent added was based on Area 1
Formulation 30; however, it was tested on the combined Area 1, 10 parts by volume, and Area 2,1 part by volume sample. Since Area 2 sludge was added to Area 1, the total mass of binder andArea 5 sand was increased from treating only Area 1 sludge. This formulation was analyzed for
PP strength gain. Results are found in Table 3-15.
Analysis of the results from Formulation 30, using the combined Areas 1 and 2 samples,
indicated a strength profile similar to that of Formulation 30 for Area 1 alone. After 3 days ofcure, the combined sample Formulation 30 had a PP value of 0.75 tsf and after 7 days thestrength improved to 3.5 tsf. Initially, after 24 hours, there was standing water above the sample,
but the water was adsorbed within 48 hours after sample preparation. After 7 days of cure, themold had no standing water above it, but water could still be expelled when exerting pressure on
the mold surface with the PP testing devise.
Impact of Treating Water on Top of Area 1 Sludge
Throughout the screening process it had become apparent that the treatment of the Area 1 sludgewas highly contingent on moisture content. This is significant due to possible site changes, waterlevels and the necessity of adding S/S reagents as a slurry blend. Three modified water content
formulations were prepared based on Area 1 Formulation 30, 0.30 mix ratio PC + 0.10 mix ratioBFS + 0.06 mix ratio HL + 0.23 mix ratio water + 50 volume percent Area 5 sand, to determinethe amount of reagent necessary to treat the Area 1 material with an additional 1.5 foot of free-
standing water above the sludge surface. These tests were designed to estimate lower and upperbounds on reagent dosage. Formulation 30 M1 was a formulation which contained 0.93 lbs ofreagent per pound of standing water, Formulation M2, 1.29 lbs/lb and Formulation M3, 0.69
lbs/lbs. The ratio of BFS to cement was kept constant (having the same ratio as in the original
T/PROJECTS/Project Files/Mohawk/Final Mohawk Tannery SS Report.doc 17
Formulation 30) between the three formulations as well as the ratio of Area 1 material to theArea 5 sand. Results are found in Table 3-16.
Analyses of the results showed that the Area 1 sludge with a water cap can be solidified.Formulations 30 Ml and M3 are similar to Formulations 30 except more binder was added to
react with the free water. Formulation 30 Ml PP results were similar to the original Formulation30, but PP strength gain is more rapid. Formulation 30 M3 sets a lower bound on reagentaddition as the treated samples no longer met the performance goals. Formulation 30 M2 well
exceeds the PP performance goals.
Analysis of the total mass of reagents to treat Area 1 plus a water cap showed that it will take
significantly more reagent to treat the combined stream compared to treating a “dewatered” Area1 sludge.
3.3 Soil Solidification / Stabilization Verification TestingBased on the 5 tiers of formulation screening for Areas 1 and the 3 tiers of formulation screening
for Area 2, formulations were chosen for each area for verification testing. Area 1 Formulation30, 0.30 mix ratio PC, 0.10 mix ratio BFS, 0.06 mix ratio HL, 0.23 mix ratio water and 50
percent (v/v) Area 5 sand, and Area 2 Formulation 15, 0.12 mix ratio PC, 0.04 mix ratio BFS and0.08 mix ratio of water, were chosen for verification testing. The verification formulations wereprepared similarly to the screening formulations except each formulation was prepared in
triplicate to access variability between mixtures. Each formulation was tested for PP strengthgain during the first 7 days of cure. UCS, permeability and leaching using the SPLP procedurewere each tested at 28 days of cure. The tested formulations and the PP results are found in
Table 3-17. The remaining results are found in Tables 3-18 and 3-19.
Area 1PP results were similar to the previous Formulation 30 results; however, the rate of PP strengthdevelopment was slightly slower than with the previous Formulation 30 tests. It took about 7days to meet the 2.5 tsf goal. One equipment vendor (Lang Tool Company
(http://www.langtool.com/)) who was contacted recommended a PP result of 3.0 tsf to supportthe weight of their heavy equipment in the full-scale process. After 7 days of cure, the PP valuesfor the triplicate samples were 2.85, 2.35 and 3.3 tsf which were less than the vendor’s desired
value. It is expected that slightly higher reagent dose rate would increase the rate of strengthgain. Alternatively longer than 7 day cure times may be appropriate.

T/PROJECTS/Project Files/Mohawk/Final Mohawk Tannery SS Report.doc 18
Samples were allowed to cure for 28 days prior to analysis for UCS, SPLP leaching method andpermeability. UCS results for the Area 1 verification formulations were 57.1, 84.7 and 77.2 psiwhich were all greater than the original performance criteria of 50 psi, and far greater than the 25
psi goal established by USEPA following the Tier 1 testing. The variability between the triplicatesample results could be from the high amount of organic materials, including animal hair-like
materials, within the sample matrix.
The permeability results for the Area 1 verification formulations were 2.1 x 10⁻⁶, 1.1 x 10⁻⁶, and
2.3 x 10⁻⁶ cm/sec, respectively which are all slightly higher than the performance goal of1.0 x 10-6 cm/sec.
Analysis of the SPLP leachability test for metals indicated that leachable barium remainedrelatively unchanged from the untreated Area 1 material to that of the treated Formulation 30.The untreated material had a SPLP leachable barium concentration of 0.871 while the leachable
barium concentration in the treated material was 1.04, 1.02 and 1.00 which are all within thevariability of the analysis method. SPLP leachable Cr was reduced from that of the untreated
Area 1 material. The untreated SPLP Cr concentration was 0.108 mg/L while the SPLP leachatesfor Formulation 30 had SPLP Cr concentrations of 0.038, <0.026 and <0.026 mg/L. Leachablenickel increased slightly from <0.011 mg/L to 0.023, 0.024 and 0.022 mg/L. Leachable zinc was
reduced from 0.069 to < 0.022 mg/L in each of the triplicate analyses.
Two organic constituents were found in the SPLP leachate of the treated Area 1 verification
Formulation 30 (i.e., phenol and 4-methylphenol). Phenol was not detected above 0.01 mg/L inthe SPLP leachate for the untreated sample, but was found in the extraction for the Formulation30 triplicate formulations at 0.028, 0.026 and 0.026 mg/L, respectively. The SPLP leachates of
the untreated sample contained 0.059 mg/L 4-methylphenol while the SPLP of the treatedtriplicates contained 1.22, 1.13 and 1.16 mg/L.
Area 2PP results for the Area 2 Formulation 15 were all greater than 3.0 tsf after 3 days. After 7 dayseach of the triplicate analyses had PP values greater than 4.5 tsf. The rapid development of PP
strength should allow the heavy equipment operator to move out onto the treated material after 3-days of curing.
UCS results for the Area 2 verification formulation were 177, 179 and 179 psi. These valueswere all greater than either of the site performance criteria of 25 or 50 psi.
The permeability results for the Area 2 verification formulation were 4.5 x 10 -8, 1.6 x 10⁻⁷, and
T/PROJECTS/Project Files/Mohawk/Final Mohawk Tannery SS Report.doc 19
1.2 x 10⁻⁶ cm/sec, respectively. Two of the triplicate formulations exceeded the performancegoal of 1.0 x 10⁻⁶ cm/sec while the third sample was slightly higher than the performance goal.
Analysis of the SPLP leachability test results for metals indicated that leachable bariumdecreased from the untreated Area 2 material to that of the treated Formulation 15. The untreated
material had a SPLP leachable barium concentration of 0.786 while the leachable bariumconcentrations in the SPLP samples for the triplicate treated formulations were 0.441, 0.423 and0.410 mg/L. SPLP leachable Cr and nickel were each unchanged from that of the untreated Area
2 material. The untreated SPLP Cr concentration was 0.272 mg/L while the SPLP leachateconcentrations for the verification formulations were 0.217, 0.227 and 0.234 mg/L. Nickel wasnot detected in levels above 0.011 mg/L in the untreated material, but leached slightly in the
treated material at 0.013 mg/L for each of the triplicate analyses. This value was considered thesame as the untreated analysis since the analyses were within the analytical error of the testingmethod. Leachable zinc was reduced from 0.041 mg/L to <0.022 mg/L in all three of the
verification triplicate SPLP leachates.
Analysis of the SPLP leachability testing for PAH compounds from the treated verificationformulation for Area 2 indicated that phenol, which was not detected at concentrations above0.01 mg/L in the untreated Area 2 material, was found at 0.17 mg/L in each of the SPLP
leachates for the triplicate analyses. The concentration for 1, 4-dichlorobenzene remainedrelatively unchanged from the SPLP analysis of the untreated material to the treated materialswhile the leachability of 1, 2-dichlorobenzene was reduced in the treated material. The SPLP 1,
4-dichlorobenzene concentrations for the untreated material and the triplicate Formulation 15samples were <0.01, <0.01, 0.011 and 0.012 mg/L, respectively. The initial untreated SPLPconcentration of 1, 2-dichlorobenzene was 0.22 mg/L. The treated formulations had SPLP
concentrations of 0.13 mg/L for each of the triplicate samples. The SPLP leachable of 4-methylphenol, 2, 4, 6-trichlorophenol, and pentachlorophenol all increased from the untreated to thetreated Area 2 materials. None of these constituents were found in the SPLP leachate of the
untreated sample above <0.01, 0.01 and 0.05 mg/L, respectively. The Area 2 verificationFormulation 15 SPLP leachates contained 0.041, 0.037 and 0.04 mg/L of 4-methylphenol, 0.32,
0.33, and 0.35 mg/L of 2, 4, 6-trichlorophenol, and 0.42, 0.37 and 0.41 mg/L ofpentachlorophenol. Leachable naphthalene was reduced from 0.19 mg/L in the SPLP leachate inthe untreated Area 2 material to 0.098, 0.10 and 0.096 mg/L in the SPLP of final Area 2
Formulation 15.
T/PROJECTS/Project Files/Mohawk/Final Mohawk Tannery SS Report.doc 20
4.0 Conclusions and Recommendations
4.1 ConclusionsThe initial characterization data for the Mohawk Tannery sample materials are summarized in
Tables 3-1 and 3-2. Based on these results composite samples were prepared that were expectedto be representative of Areas 1 and 2 at the site. SPLP leaching results indicated that the Area 1
material contains leachable barium (0.871 mg/L), Cr (0.108 mg/L), zinc (0.069 mg/L), and 4-methylphenol (0.059 mg/L). The Area 2 material primarily leaches barium (0.786 mg/L), Cr(0.272 mg/L), zinc (0.041 mg/L), 1, 2 dichlorobenzene (0.22 mg/L) and naphthalene (0.19 mg/L).
Thirty-four (34) Area 1 and 18 Area 2 formulation screening mixes were prepared in five andthree tiers of formulation screening tests, respectively. Screening results are reported in Tables
3-3 through 3-14. Various reagents and combination of reagents including PC, Lafarge BFS, HL,FAC, FAF, ferrous sulfate heptahydrate, Spill King™ organic absorbent and Nochar’s PetroBond N910 organic absorbent polymer were tested. The original performance criteria for the S/S
materials were to meet a 50 psi UCS, 1 x 10⁻⁶ cm/sec permeability and not to increase constituentleachability in the treated material. S/S reagents were slurried with water prior to their addition
to the sludges. Area 5 sand was also added to Area 1 sludge. The Area 5 sand was added dry,not as a slurry. Additional performance goals for the treated material were:
Percent volume increase less than 75 percent (preferable 50 percent) PP values of 2.5 tsf at 7 days minimum (preferably 3.0 tsf by 3 days).
The UCS performance goal was modified from 50 psi to greater than 25 psi after the initial
screening tests were completed. EPA provided a general guideline of 50 psi UCS for treatment ofliquids using S/S. (U.S. EPA/53O/SW86/016, 1986, Prohibition on the Placement of BulkLiquid Hazardous Waste in Landfills, Statutory Interpretative Guidance and other EPA
documents.) This EPA guideline was partly based on assuming that significant bearing masswould be applied over the S/S treated materials. Based on the future use plans for the MohawkTannery site, the load applied to the treated materials will be less than 50 psi, i.e., less than 25
psi. The UCS performance goal was decreased from 50 to 25 psi for three reasons, to moreaccurately reflect the conditions at the site, to decrease the volume increase of the treated sludge,
and to decrease the reagent and overall treatment costs.
Additional formulations were prepared to determine the amount of reagent needed to treat the
Area 1 material when there was standing water in the impoundment. It was determined that
T/PROJECTS/Project Files/Mohawk/Final Mohawk Tannery SS Report.doc 21
removal of the water cap will significantly decrease the amount of reagent needed to S/S the Area1 sludge.
A formulation containing a mixture of Area 1 and Area 2 materials was also tested since someArea 2 material was placed on top of the Area 1 sludge. The addition of Area 2 sludge does not
significantly affect the effectiveness of the selected Area 1 formulation. However, the additionof Area 2 sludge does increase the total mass of sludge to be treated; thus, the total mass ofreagent and Area 5 sand needed to meet the performance specifications will be increased
accordingly. The impact on reagent usage and associated costs from the addition to Area 1 ofArea 2 sludge is expected to be small compared to the impact of having a 1.5 foot deep water capon top of Area 1.
Based on formulation screening results, one formulation from Area 1 and one formulation fromArea 2 were prepared in triplicate. The verification formulations were:
Area 1 (Formulation 30)- 0.30 mix ratio PC + 0.10 mix ratio BFS + 0.06 mix ratio HL + 0.23 mix ratio water +
50 percent (v/v) Area 5 sand
Area 2 (Formulation 15)- 0.12 mix ratio PC + 0.04 mix ratio BFS + 0.08 mix ratio of water,
The testing results (Tables 3-17 and 3-18) indicated that the selected Area 1 formulation wassuccessful in meeting the 50 psi UCS criterion. The final permeabilities for these samples rangedfrom 1.1 x 10⁻⁶ to 2.3 x 10⁻⁶ cm/sec which was slightly higher than the performance goal. TheSPLP leachabilities of phenol and 4-methyl phenol were slightly increased in the treatedmaterials and ranged from 0.026 to 0.028 mg/L and 0.037 to 0.041 mg/L, respectively. Thepercent volume increase was 57 percent, which is less than the 75 percent criterion. Lower doserates of Area 5 sand usage should decrease the percent volume increase accordingly. The PPresults were slightly less than the 2.5 tsf goal after 7 days of curing.
The selected formulation for Area 2 well exceeded the UCS criterion (Tables 3-17 and 3-18).The average permeability also met the performance goal; however, the values were highlyvariable ranging from 1.2 x 10⁻⁶ which was slightly higher than the performance goal to 4.5 x 10⁻⁸
cm/sec. The SPLP leachabilities for the treated materials was slightly increased for phenol at0.17 mg/L; 2, 4, 6-trichlorophenol ranging from 0.32 to 0.35 mg/L; and pentachlorophenolranging from 0.37 to 0.41 mg/L. The selected formulation met the PP goal at 3 days and thepercent volume increase.
T/PROJECTS/Project Files/Mohawk/Final Mohawk Tannery SS Report.doc 22
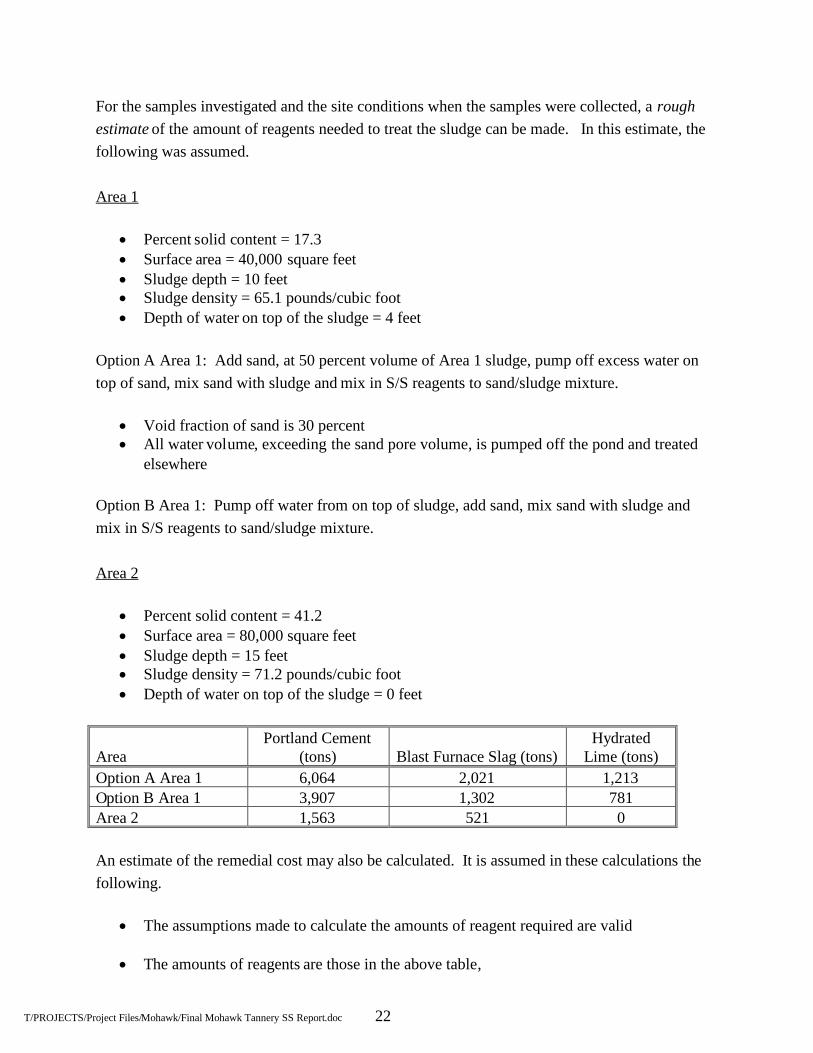
For the samples investigated and the site conditions when the samples were collected, a roughestimate of the amount of reagents needed to treat the sludge can be made. In this estimate, thefollowing was assumed.
Area 1
Percent solid content = 17.3 Surface area = 40,000 square feet Sludge depth = 10 feet Sludge density = 65.1 pounds/cubic foot Depth of water on top of the sludge = 4 feet
Option A Area 1: Add sand, at 50 percent volume of Area 1 sludge, pump off excess water ontop of sand, mix sand with sludge and mix in S/S reagents to sand/sludge mixture.
Void fraction of sand is 30 percent All water volume, exceeding the sand pore volume, is pumped off the pond and treated
elsewhere
Option B Area 1: Pump off water from on top of sludge, add sand, mix sand with sludge andmix in S/S reagents to sand/sludge mixture.
Area 2
Percent solid content = 41.2 Surface area = 80,000 square feet Sludge depth = 15 feet Sludge density = 71.2 pounds/cubic foot Depth of water on top of the sludge = 0 feet
AreaPortland Cement
(tons) Blast Furnace Slag (tons)Hydrated
Lime (tons)Option A Area 1 6,064 2,021 1,213Option B Area 1 3,907 1,302 781Area 2 1,563 521 0
An estimate of the remedial cost may also be calculated. It is assumed in these calculations thefollowing.
The assumptions made to calculate the amounts of reagent required are valid
The amounts of reagents are those in the above table,
T/PROJECTS/Project Files/Mohawk/Final Mohawk Tannery SS Report.doc 23
Davis Bacon labor rates are used,
All excess water will be treated using a sand/carbon filters and either discharged to thecity sewage line and/or used in Area 2 treatment,
There will not be a problem with water flowing into the pits during treatment and curing,and
The sludge will be treated using normal remedial equipment such as Lang Tool rotarymixers, Allu rotary mixers, augers, and excavators.
Based on these assumptions a remediation cost range for the full-scale treatment is between 2.5to 4.5 million dollars.
4.2 RecommendationsThe verification formulations met the physical requirements for the project (UCS, PP, percentvolume increase). Permeability results were close to or better than the performancespecifications. The Area 1 permeabilities were about a factor or two greater than the
performance specification.
Analysis of the SPLP organic compound leachability showed that a few compounds leachedslightly more in both treated products than in the untreated sludges. If these SPLP andpermeability results are acceptable than the verification formulations are candidates for field
operations. In order to decrease the Area 1 percent volume increase, a reduction in Area 5 sandusage should be considered. In order to decrease the SPLP organic compounds leachability,Shaw recommends considering treating Area 1 using the following formulation:
- 0.30 mix ratio PC + 0.10 mix ratio BFS + 0.06 mix ratio HL + 0.01 mix ratioactivated powdered carbon + 0.23 mix ratio water + 50 percent (v/v) Area 5 sand
This is the same formulation selected and confirmed in this bench-scale treatability study withthe addition of 0.01 mix ratio of activated powdered carbon. Based on results from treating otherorganic contaminated materials at other sites, it is expected that the addition of powdered carbon
will decrease the leachability of both phenol and 4-methylphenol and may decrease thepermeability.
Similarly, to decrease the Area 2 SPLP organic compound leachability, Shaw recommendsconsidering the addition of 0.01 mix ratio powdered carbon to the Formulation 15 mixture for thetreatment of the Area 2 material, as follows:
T/PROJECTS/Project Files/Mohawk/Final Mohawk Tannery SS Report.doc 24
0.12 mix ratio PC + 0.04 mix ratio BFS + 0.01 mix ratio activated powdered carbon + 0.08 mixratio of water.

T/PROJECTS/Project Files/Mohawk/Final Mohawk Tannery SS Report.doc
Tables
T/PROJECTS/Project Files/Mohawk/Final Mohawk Tannery SS Report.doc
Table 2-1. Parameters for Characterization ofThe Mohawk Treatability Samples
Parameter Methodology
pH SW-846 Method 9045
Bulk Density ASTM Method D2937
Solids and Water Content ASTM Method D2216
Total SVOCs SW-846 Method 8270Total Metals including hexavalentchromium SW-846 Method 3050/6010
Table 2-2. Parameters for Characterization ofThe Treatability Composite Samples
Parameter MethodologypH SW-846 Method 9045
Bulk Density ASTM Method D2937Solids and Water Content ASTM Method D2216SPLP SVOCs and UTS Metals SW-846 Method 1312/8270/6010
T/PROJECTS/Project Files/Mohawk/Final Mohawk Tannery SS Report.doc
Table 3-1. Characterization Results for the Mohawk Tannery Treatability Samples
DescriptionSEK2580A SEK2580B SEK2580C SEK2582A SEK2582BArea 1 (A) Area 1 (B) Area 1 (C) P2 Sludge (A) P2 Sludge (B)
pH (s.u.) 7.1 7.0 7.2 9.4 9.8Density (g/cm3) 1.07 1.04 1.02 1.20 1.18Solids Content (%) 15.18 18.40 18.35 40.84 41.48Silver (mg/kg) <13.11 <10.90 <10.90 <4.82 <4.80Aluminum (mg/kg) 9420 8208 8554 4922 4315Arsenic (mg/kg) 17.5 17.1 14.4 17.5 9.91Barium (mg/kg) 39.0 34.2 35.4 78.1 44.6Beryllium (mg/kg) <1.97 <1.63 <1.63 <0.725 <0.718Calcium (mg/kg) 111,000 113,000 124,000 179,000 204,000Cadmium (mg/kg) 3.06 2.55 2.36 0.85 0.82Cobalt (mg/kg) 15.1 12.5 12.5 5.56 5.50Chromium (mg/kg) 26,349 25,221 24,081 24,047 12,560Hexavalent Chromium (mg/kg) 117 257 959 313 656Copper (mg/kg) 34.8 29.2 32.0 28.2 22.0Iron (mg/kg) 17,300 14,200 13,500 3,400 3,740Potassium (mg/kg) 339 290 297 245 280Magnesium (mg/kg) 1,252 1,147 1,188 4,212 6,364Manganese (mg/kg) 18,708 14,785 13,348 468 516Molybdenum (mg/kg) <15.1 <12.5 <12.5 <5.56 <5.50Sodium (mg/kg) 4,670 4,984 4,048 2,412 2,628Nickel (mg/kg) 15.2 11.6 13.2 4.7 4.5Phosphorus (mg/kg) 5,843 5,109 5,067 3,575 3,785Lead (mg/kg) 49.7 41.3 41.7 21.7 57.1Sulfur (mg/kg) 24,241 21,579 20,049 8,448 7,883Antimony (mg/kg) 413 402 386 370 191Selenium (mg/kg) <8.56 <7.07 <7.08 <3.13 <3.11Tin (mg/kg) <15.1 <12.5 <12.5 <5.56 <5.50Strontium (mg/kg) 177 164 173 192 251Thallium (mg/kg) 15.0 13.6 11.9 8.33 3.76Vanadium (mg/kg) <6.56 <5.42 <5.44 <2.42 <2.39Zinc (mg/kg) 246 207 207 125 101Phenol (mg/kg) 0.73 1.07 1.09 <0.33 0.351,4-Dichlorobenzene (mg/kg) <0.33 <0.33 <0.33 <0.33 <0.331,2-Dichlorobenzene (mg/kg) <0.33 <0.33 <0.33 0.80 1.454-Methylphenol (mg/kg) 2.3 13.6 11.6 0.61 0.48Naphthalene (mg/kg) <0.33 <0.33 <0.33 1.13 2.112,4,6-Trichlorophenol (mg/kg) <0.33 <0.33 <0.33 <0.33 <0.332,4,5-Trichlorophenol (mg/kg) <0.33 <0.33 <0.33 0.66 1.86Pentachlorophenol (mg/kg) <1.66 <1.66 <1.66 1.03 1.60
Other PAH/SVOCs less than detection limits of 0.33 or 1.66 mg/kg
T/PROJECTS/Project Files/Mohawk/Final Mohawk Tannery SS Report.doc
Table 3-1. Characterization Results for the Mohawk Tannery Treatability Samples(continued)
DescriptionSEK2583 SEK2585 SEK2586 SEK2587 SEK2581 SEK2584
P2 Fillsurface
P2 Lowerblack sand
Upper P2black sand P2 Cr sand Area 5 Gravel Pit
FillpH (s.u.) 7.6 9.2 8.4 10.2 6.1 7.7Density (g/cm3) 1.82 1.97 1.91 1.94 1.43 1.62Solids Content (%) 86.30 85.94 82.74 88.51 95.61 96.34Silver (mg/kg) <2.32 2.94 4.28 4.51 <2.09 <2.07Aluminum (mg/kg) 5,272 6,598 10,719 12,541 4,717 5,989Arsenic (mg/kg) 4.82 4.89 4.56 7.14 5.45 4.89Barium (mg/kg) 17.5 18.0 29.7 31.6 11.0 8.32Beryllium (mg/kg) <0.348 <0.347 <0.474 <0.336 <0.313 <0.310Calcium (mg/kg) 2,130 6,350 9,970 10,300 487 927Cadmium (mg/kg) 0.93 1.20 1.86 2.11 0.698 1.74Cobalt (mg/kg) 2.67 3.62 4.96 6.04 2.41 2.81Chromium (mg/kg) 584 301 1,892 282 10.8 15Hexavalent Chromium (mg/kg) 5.8 1.4 3.7 8.6 0.91 0.8Copper (mg/kg) 5.4 4.72 8.95 9.11 3.01 3.32Iron (mg/kg) 6,550 9,300 12,800 15,800 5,300 1,380Potassium (mg/kg) 599 862 1,046 1,830 598 452Magnesium (mg/kg) 1,657 2,548 3,451 5,932 1,318 2,709Manganese (mg/kg) 117 107 183 235 102 119Molybdenum (mg/kg) <2.67 <2.65 <3.63 <2.58 <2.41 <2.38Sodium (mg/kg) 40 460 380 594 21 15Nickel (mg/kg) 7.5 10.6 14.4 22.6 4.9 8.97Lead (mg/kg) 7.89 3.37 13.1 5.01 2.0 3.45Antimony (mg/kg) 8.53 <4.43 27.4 3.75 <1.04 1.03Selenium (mg/kg) <1.51 <1.50 <2.05 <1.46 <1.36 <1.34Tin (mg/kg) <2.67 <2.65 <3.63 <2.58 <2.41 <2.38Thallium (mg/kg) <1.51 <1.50 <2.05 <1.46 <1.36 <1.34Vanadium (mg/kg) 10.4 10.5 15.1 22.3 8.39 17.9Zinc (mg/kg) 23.5 22.6 42.0 34.6 11.4 19.8Phenol (mg/kg) <0.33 0.76 <0.33 <0.33 <0.33 <0.331,4-Dichlorobenzene (mg/kg) <0.33 <0.33 <0.33 <0.33 <0.33 <0.331,2-Dichlorobenzene (mg/kg) <0.33 <0.33 <0.33 <0.33 <0.33 <0.334-Methylphenol (mg/kg) <0.33 <0.33 <0.33 <0.33 <0.33 <0.33Naphthalene (mg/kg) <0.33 <0.33 <0.33 <0.33 <0.33 <0.332,4,6-Trichlorophenol (mg/kg) <0.33 <0.33 <0.33 <0.33 <0.33 <0.332,4,5-Trichlorophenol (mg/kg) <0.33 <0.33 <0.33 <0.33 <0.33 <0.33Pentachlorophenol (mg/kg) <1.66 <1.66 <1.66 <0.33 <1.66 <1.66
Other PAH/SVOCs less than detection limits of 0.33 or 1.66 mg/kg
T/PROJECTS/Project Files/Mohawk/Final Mohawk Tannery SS Report.doc
Table 3-2. Initial Baseline SPLP Leachability Results forThe Mohawk Tannery Treatability Composite Samples
Sample ID SEK 2580Comp
SEK 2582Comp SEK 2585
Description Area 1Composite
P2 SludgeComposite
P2 Lowerblack sludge
SPLP Equilibrium pH (s.u.) 7.9 9.2 9.1Silver (mg/L) <0.021 <0.021 <0.021Aluminum (mg/L) <0.054 <0.054 2.02Arsenic (mg/L) <0.011 <0.011 <0.011Barium (mg/L) 0.871 0.786 0.043Beryllium (mg/L) <0.003 <0.003 <0.003Calcium (mg/L) 22.6 23.8 23.1Cadmium (mg/L) <0.003 <0.003 <0.003Cobalt (mg/L) <0.025 <0.025 <0.025Chromium (mg/L) 0.108 0.272 <0.026Hexavalent Chromium (mg/L) <0.025 <0.025 <0.025Copper (mg/L) <0.025 <0.025 <0.025Iron (mg/L) <0.048 <0.048 <0.048Potassium (mg/L) 2.26 2.08 0.988Magnesium (mg/L) 1.15 3.18 <0.750Manganese (mg/L) 0.533 <0.015 <0.016Molybdenum (mg/L) <0.025 <0.025 <0.026Sodium (mg/L) 39.5 36.9 14.3Nickel (mg/L) <0.011 <0.011 <0.011Lead (mg/L) <0.011 <0.011 <0.011Antimony (mg/L) <0.011 <0.011 <0.011Selenium (mg/L) <0.014 <0.014 <0.014Tin (mg/L) <0.025 <0.025 <0.026Thallium (mg/L) <0.014 <0.014 <0.014Vanadium (mg/L) <0.011 <0.011 <0.011Zinc (mg/L) 0.069 0.041 0.019Phenol (mg/L) <0.01 <0.01 0.0851, 4- Dichlorobenzene (mg/L) <0.01 <0.01 <0.011,2-Dichlorobenzene (mg/L) <0.01 0.22 <0.014-Methylphenol (mg/L) 0.059 <0.01 0.047Naphthalene (mg/L) <0.01 0.19 <0.012,4,6-Trichlorophenol (mg/L) <0.01 <0.01 <0.012,4,5-Trichlorophenol (mg/L) <0.01 <0.01 <0.01Pentachlorophenol (mg/L) <0.05 <0.05 <0.05
T/PROJECTS/Project Files/Mohawk/Final Mohawk Tannery SS Report.doc
Table 3-3. Results for the Mohawk Tannery Area 1 Tier 1 Formulations
Formulation
PortlandC
ement
Blast
FurnaceSlag
HydratedL
ime
ClassF
FlyA
sh
ClassC
FlyA
sh
FerrousSulfate
Area
5Sand
(v/v) 2
Water
Waterto
Binder
Ratio Pocket Penetrometer (tsf)3 SampleBleed4
UCS(psi)5
Mix Ratio1 Day1
Day3
Day5
Day7
Day3
Day7
Day7
Day14
1 0.1 - - - - 0.03 - 0.13 1:1 <0.25 <0.25 <0.25 <0.25 - S - -2 0.15 - - - - 0.03 - 0.18 1:1 <0.25 <0.25 <0.25 <0.25 - S - -3 0.2 - - - - 0.03 - 0.23 1:1 <0.25 <0.25 <0.25 <0.25 - S 1.94 -4 - - 0.1 - - 0.03 - 0.23 2:3:1 <0.25 <0.25 <0.25 <0.25 - S - -5 - - 0.2 - - 0.03 - 0.43 2:2:1 <0.25 <0.25 <0.25 <0.25 - S - -6 0.1 - - - - 0.03 - 0.23 2:3:1 <0.25 <0.25 <0.25 <0.25 - F - -7 0.2 - - - - 0.03 - 0.43 2:2:1 <0.25 <0.25 <0.25 <0.25 - S 1.62 -8 0.1 - - - 0.1 0.03 - 0.23 1:1 <0.25 <0.25 <0.25 <0.25 - S 0.64 -9 0.2 - - - 0.2 0.03 - 0.40 1:1 <0.25 <0.25 <0.25 <0.25 - D 3.23 -
10 0.1 - - - - 0.03 0.102 0.13 1:1 <0.25 <0.25 <0.25 <0.25 - S - -11 0.15 - - - - 0.03 0.152 0.18 1:1 <0.25 <0.25 <0.25 <0.25 - S - -
1Mix Ratio = [(weight reagent) / (weight waste)]2Mix Ratio (defined above) instead of percent (v/v)3Highlighted pocket penetrometer results greater than operations desired resistance goal of >2.5 tsf.4Sample Bleed: D= dry, F= film, S= significant, E=extrudes with pressure5Highlighted UCS values greater than 25 psi.

T/PROJECTS/Project Files/Mohawk/Final Mohawk Tannery SS Report.doc
Table 3-4. Results for the Mohawk Tannery Area 1 Tier 2 Formulations
Formulation
PortlandC
ement
Blast
FurnaceS
lag
Hydrated
Lim
e
Class
FF
lyA
sh
Class
CFly
Ash
FerrousS
ulfate
Area
5S
and(v/v) 2
Water
Water
toB
inderRatio
Pocket Penetrometer (tsf)3 Sample Bleed4 UCS(psi)5
Mix Ratio1 Day 1 Day 3 Day 5 Day 7 Day 62 Day 3 Day 7 Day 62
11 0.15 - - - - 0.03 - 0.18 <0.25 <0.25 <0.25 <0.25 - - S -
13 0.15 0.05 - - - - 50 0.20 1:1 <0.25 0.25 0.35 0.50 1.75 S E 15.1
14 0.05 0.15 - - - - 50 0.20 1:1 <0.25 <0.25 <0.25 <0.25 <0.25 S F -
15 0.20 - - - - - 50 0.20 1:1 <0.25 <0.25 0.25 0.25 1.15 S E 11.7
16 0.15 0.05 - - - - 50 0.50 2:5:1 <0.25 <0.25 <0.25 <0.25 0.50 S F -
17 0.20 - - - - - 50 0.50 2:5:1 <0.25 <0.25 <0.25 <0.25 0.50 S F -
18 0.15 0.05 - - 0.30 - 50 0.50 1:1 <0.25 <0.25 <0.25 <0.25 3.50 S E 36.2
19 0.20 - - - 0.30 - 50 0.50 1:1 <0.25 <0.25 <0.25 <0.25 3.00 S F 24.6
20 - - 0.40 - - - 40 0.80 2:1 <0.25 <0.25 <0.25 <0.25 <0.25 S S -
1Mix Ratio= [(weight reagent) / (weight waste)]2Mix Ratio (defined above) instead of percent (v/v)3Highlighted pocket penetrometer results greater than operations desired resistance goal of >2.5 tsf.4Sample Bleed: D= dry, F= film, S= significant, E=extrudes with pressure5Highlighted UCS values greater than 25 psi.
T/PROJECTS/Project Files/Mohawk/Final Mohawk Tannery SS Report.doc
Table 3-5. Area 1 Percent Volume Increase
FormulationPortlandCement
BlastFurnace
SlagHydrated
Lime
Class FFlyAsh Water
Area 5Sand
TotalBinderAdded
(%)
TotalBinder,Area 5Sandand
WaterAdded
(%)
PercentVolumeIncrease
Mix Ratio (w/w)18 0.15 0.05 - 0.3 0.5 0.69 50 169 86.5119 0.2 - - 0.3 0.5 0.69 50 169 86.5127 0.2 0.07 0.05 - 0.16 0.69 32 117 47.5028 0.25 0.08 0.05 - 0.19 0.69 38 126 52.6230 0.3 0.096 0.06 - 0.23 0.69 45.6 137.6 57.3931 0.25 0.08 0.05 - 0.21 1.04 38 163 75.3332 0.2 0.1 0.05 - 0.2 0.69 35 124 53.2633 0.2 0.07 0.05 - 0.2 1.04 32 156 67.4534 0.25 0.1 0.06 - 0.25 0.69 41 135 59.74
T/PROJECTS/Project Files/Mohawk/Final Mohawk Tannery SS Report.doc
Table 3-6. Results for the Mohawk Tannery Area 1 Tier 3 Formulations
Form
ulation
PortlandC
ement
BlastFurnace
Slag
Hydrated
Lim
e
Class
FFly
Ash
Class
CF
lyA
sh
Ferrous
Sulfate
Area
5S
and(v/v)
2
Water
Water
ToB
inderR
atio
Pocket Penetrometer (tsf)3 Sample Bleed4
Mix Ratio1 Day1
Day3
Day7
Day14
Day21
Day28
Day35
Day42
Day49
Day56
Day3
Day7
21 0.15 0.05 - - - - 50 0.20 1:1 <0.25 0.25 0.50 0.75 1.25 1.40 1.15 1.75 1.75 1.25 F F
22 0.15 0.05 - - - - 50 0.20 1:1 <0.25 <0.25 0.25 0.50 0.50 1.00 1.00 1.50 1.50 1.25 F F
23 0.15 0.05 - - - - 50 0.20 1:1 <0.25 0.25 0.30 0.70 0.75 1.30 1.50 2.00 2.00 1.70 F F
1Mix Ratio= [(weight reagent) / (weight waste)]2Mix Ratio (defined above) instead of percent (v/v)3Highlighted pocket penetrometer results greater than operations desired resistance goal of >2.5 tsf.4Sample Bleed: D= dry, F= film, S= significant, E=extrudes with pressure
T/PROJECTS/Project Files/Mohawk/Final Mohawk Tannery SS Report.doc
Table 3-7. Results for the Mohawk Tannery Area 1 Tier 4 and 5 Formulations
Form
ulation
Portland
Cem
ent
BlastF
urnaceSlag
Hydrated
Lim
e
Class
FFly
Ash
Class
CF
lyA
sh
FerrousSulfate
Area
5Sand
(v/v)2
Water
Waterto
Binder
Ratio
Pocket Penetrometer (tsf)3 SampleBleed4
UCS(psi)5
Mix Ratio1 Day1
Day3
Day7
Day14
Day21
Day28
Day35
Day3
Day7
Day7
Day28
Day36
24 0.15 0.05 0.05 - - - 50 0.25 1.1 <0.25 0.25 0.25 0.50 0.90 0.90 1.10 F E - - -
25 0.21 0.07 0.05 - - - 50 0.33 1.1 <0.25 <0.25 0.50 1.50 2.20 2.40 3.20 F E - - -
26 0.21 0.07 0.05 - - - 50 0.33 1.1 <0.25 <0.25 0.25 1.50 1.90 1.90 2.50 S E - - -
27 0.20 0.07 0.05 - - - 50 0.16 0.5.1 <0.25 0.25 0.70 1.50 2.00 3.20 3.60 F E - - 27.4
28 0.25 0.08 0.05 - - - 50 0.19 0.5.1 <0.25 <0.25 1.20 3.50 >4.50 >4.50 >4.50 F E - 44.6 46.7
29 0.10 0.00 0.00 - - - 50 0.00 1.1 <0.25 0.25 0.55 0.75 1.00 1.00 1.00 F E - - -
30 0.30 0.10 0.06 - - - 50 0.23 0.5.1 0.25 0.75 3.00 >4.50 >4.50 - - E E 22.2 38.3 -
31 0.25 0.08 0.05 - - - 75 0.21 0.55.1 0.25 0.30 1.40 >4.50 >4.50 - - E E - 22.6 -
32 0.20 0.10 0.05 - - - 50 0.20 0.57.1 <0.25 0.30 0.65 2.00 2.80 - - E E - - -
33 0.20 0.07 0.05 - - - 75 0.20 0.63.1 <0.25 0.35 0.75 1.35 2.25 - - E E - - -
34 0.25 0.10 0.06 - - - 50 0.25 061.1 <0.25 0.25 1.15 3.40 >4.50 - - E E - - -
1Mix Ratio= [(weight reagent) / (weight waste)]2Mix Ratio (defined above) instead of percent (v/v)3Highlighted pocket penetrometer results greater than operations desired resistance goal of >2.5 tsf.4Sample Bleed: D= dry, F= film, S= significant, E=extrudes with pressure5Highlighted UCS values greater than 25 psi.
T/PROJECTS/Project Files/Mohawk/Final Mohawk Tannery SS Report.doc
Table 3-8. SPLP Leaching Results for the Mohawk TanneryArea 1 Tiers 4 and 5 Formulations
Parameter UnitsUntreated
Area 1Composite
Formulation28
Formulation30
Formulation31
Portland Cement m.r.1 - 0.25 0.30 0.25Blast Furnace Slag m.r. - 0.08 0.10 0.08Hydrated Lime m.r. - 0.05 0.06 0.05Water m.r. - 0.19 0.23 0.21Area 5 Sand % (v/v) - 50 50 75Permeability (Day 14) cm/sec - 1.2 x 10- 6 1.8 x 10⁻⁶ 1.3 x 10⁻⁶
Permeability (Day 28) cm/sec - 8.2 x 10- 7 9.7 x 10⁻⁷ 9.1 x 10⁻⁷
SPLP Equilibrium pH s.u. 7.9 11.7 11.7 11.5SPLP Silver mg/L <0.021 <0.022 <0.022 0.037SPLP Arsenic mg/L <0.011 <0.011 <0.011 <0.011SPLP Barium mg/L 0.871 0.550 0.728 0.458SPLP Beryllium mg/L <0.003 <0.003 <0.003 <0.003SPLP Cadmium mg/L <0.003 <0.003 <0.003 <0.003SPLP Chromium mg/L 0.108 0.186 0.139 0.171SPLP Nickel mg/L <0.011 0.021 0.022 0.028SPLP Lead mg/L <0.011 <0.011 <0.011 <0.011SPLP Antimony mg/L <0.011 <0.011 <0.011 <0.011SPLP Selenium mg/L <0.014 <0.014 <0.014 <0.014SPLP Thallium mg/L <0.014 <0.014 <0.014 <0.014SPLP Vanadium mg/L <0.011 <0.011 <0.011 <0.011SPLP Zinc mg/L 0.069 <0.011 0.013 0.021SPLP Phenol mg/L <0.01 <0.01 <0.01 <0.01SPLP 1,4-Dichlorobenzene mg/L <0.01 <0.01 <0.01 <0.01SPLP 1,2-Dichlorobenzene mg/L <0.01 <0.01 <0.01 <0.01SPLP 4-Methylphenol mg/L 0.059 0.017 0.014 0.017SPLP Naphthalene mg/L <0.01 <0.01 <0.01 <0.01SPLP 2,4,6-Trichlorophenol mg/L <0.01 <0.01 <0.01 <0.01SPLP 2,4,5-Trichlorophenol mg/L <0.01 <0.01 <0.01 <0.01SPLP Pentachlorophenol mg/L <0.05 <0.05 <0.05 <0.05
1m.r.= Mix Ratio=[(weight reagent)/(weight waste)]
T/PROJECTS/Project Files/Mohawk/Final Mohawk Tannery SS Report.doc
Table 3-9. Results for the Mohawk Tannery Area 2 Tier 1 Formulations
Formulation
PortlandC
ement
Blast
FurnaceSlag
HydratedL
ime
ClassF
FlyA
sh
ClassC
FlyA
sh
FerrousSulfate
Area
5Sand
(v/v) 2
Water
Waterto
Binder
Ratio Pocket Penetrometer (tsf)3 Sample Bleed4 UCS (psi)5
Mix Ratio1 Day 1 Day 3 Day 5 Day 7 Day 3 Day 7 Day 7 Day14
Day55
1 0.05 - - - - 0.03 - 0.08 1:1 <0.25 0.25 0.25 0.25 - S - - -
2 0.1 - - - - 0.03 - 0.13 1:1 <0.25 0.25 0.25 1.25 - D 6.5 - -
3 0.15 - - - - 0.03 - 0.18 1:1 0.5 2.5 3.25 4.0 - D 31.3 33.2 41.8
4 - - 0.1 0.1 - 0.03 - 0.23 1:1 <0.25 <0.25 <0.25 <0.25 - S - - -
5 - - 0.15 0.15 - 0.03 - 0.33 1:1 <0.25 <0.25 <0.25 <0.25 - S - - -
6 0.05 - - 0.1 - 0.03 - 0.18 1:1 <0.25 <0.25 <0.25 <0.25 - S - - -
7 0.1 - - 0.1 - 0.03 - 0.23 1:1 <0.25 0.25 0.75 0.75 - D 8.4 - 21.7
8 0.05 - - - 0.1 0.03 - 0.18 1:1 <0.25 0.25 0.5 0.5 - D 9.3 - 28.9
9 0.1 - - - 0.1 0.03 - 0.23 1:1 <0.25 0.75 1.25 1.75 - D 15.6 27.1 38.51Mix Ratio= [(weight reagent) / (weight waste)]2Mix Ratio (defined above) instead of percent (v/v)3Highlighted pocket penetrometer results greater than operations desired resistance goal of >2.5 tsf.4Sample Bleed: D= dry, F= film, S= significant, E=extrudes with pressure5Highlighted UCS values greater than 25 psi.
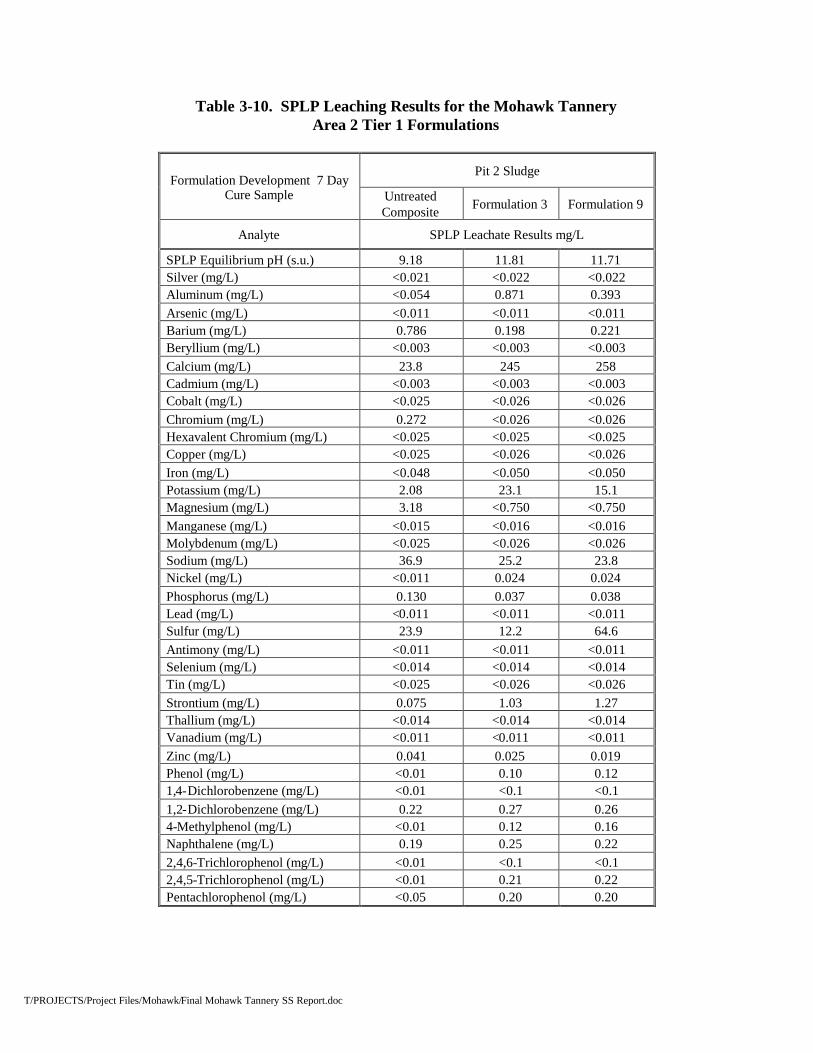
T/PROJECTS/Project Files/Mohawk/Final Mohawk Tannery SS Report.doc
Table 3-10. SPLP Leaching Results for the Mohawk TanneryArea 2 Tier 1 Formulations
Formulation Development 7 DayCure Sample
Pit 2 Sludge
UntreatedComposite Formulation 3 Formulation 9
Analyte SPLP Leachate Results mg/L
SPLP Equilibrium pH (s.u.) 9.18 11.81 11.71Silver (mg/L) <0.021 <0.022 <0.022Aluminum (mg/L) <0.054 0.871 0.393Arsenic (mg/L) <0.011 <0.011 <0.011Barium (mg/L) 0.786 0.198 0.221Beryllium (mg/L) <0.003 <0.003 <0.003Calcium (mg/L) 23.8 245 258Cadmium (mg/L) <0.003 <0.003 <0.003Cobalt (mg/L) <0.025 <0.026 <0.026Chromium (mg/L) 0.272 <0.026 <0.026Hexavalent Chromium (mg/L) <0.025 <0.025 <0.025Copper (mg/L) <0.025 <0.026 <0.026Iron (mg/L) <0.048 <0.050 <0.050Potassium (mg/L) 2.08 23.1 15.1Magnesium (mg/L) 3.18 <0.750 <0.750Manganese (mg/L) <0.015 <0.016 <0.016Molybdenum (mg/L) <0.025 <0.026 <0.026Sodium (mg/L) 36.9 25.2 23.8Nickel (mg/L) <0.011 0.024 0.024Phosphorus (mg/L) 0.130 0.037 0.038Lead (mg/L) <0.011 <0.011 <0.011Sulfur (mg/L) 23.9 12.2 64.6Antimony (mg/L) <0.011 <0.011 <0.011Selenium (mg/L) <0.014 <0.014 <0.014Tin (mg/L) <0.025 <0.026 <0.026Strontium (mg/L) 0.075 1.03 1.27Thallium (mg/L) <0.014 <0.014 <0.014Vanadium (mg/L) <0.011 <0.011 <0.011Zinc (mg/L) 0.041 0.025 0.019Phenol (mg/L) <0.01 0.10 0.121,4-Dichlorobenzene (mg/L) <0.01 <0.1 <0.11,2-Dichlorobenzene (mg/L) 0.22 0.27 0.264-Methylphenol (mg/L) <0.01 0.12 0.16Naphthalene (mg/L) 0.19 0.25 0.222,4,6-Trichlorophenol (mg/L) <0.01 <0.1 <0.12,4,5-Trichlorophenol (mg/L) <0.01 0.21 0.22Pentachlorophenol (mg/L) <0.05 0.20 0.20
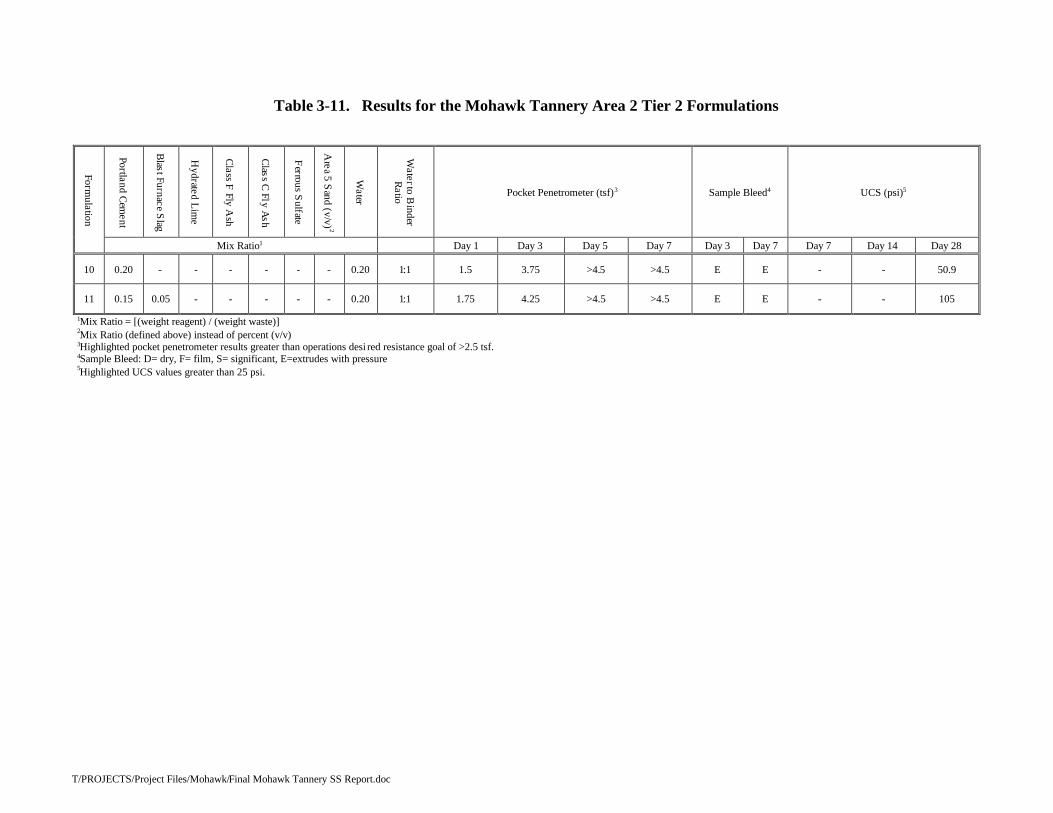
T/PROJECTS/Project Files/Mohawk/Final Mohawk Tannery SS Report.doc
Table 3-11. Results for the Mohawk Tannery Area 2 Tier 2 Formulations
Formulation
PortlandC
ement
BlastFurnace
Slag
Hydrated
Lim
e
Class
FFly
Ash
Class
CFly
Ash
Ferrous
Sulfate
Area
5S
and(v/v)
2
Water
Waterto
Binder
Ratio Pocket Penetrometer (tsf)3 Sample Bleed4 UCS (psi)5
Mix Ratio1 Day 1 Day 3 Day 5 Day 7 Day 3 Day 7 Day 7 Day 14 Day 28
10 0.20 - - - - - - 0.20 1:1 1.5 3.75 >4.5 >4.5 E E - - 50.9
11 0.15 0.05 - - - - - 0.20 1:1 1.75 4.25 >4.5 >4.5 E E - - 105
1Mix Ratio = [(weight reagent) / (weight waste)]2Mix Ratio (defined above) instead of percent (v/v)3Highlighted pocket penetrometer results greater than operations desi red resistance goal of >2.5 tsf.4Sample Bleed: D= dry, F= film, S= significant, E=extrudes with pressure5Highlighted UCS values greater than 25 psi.
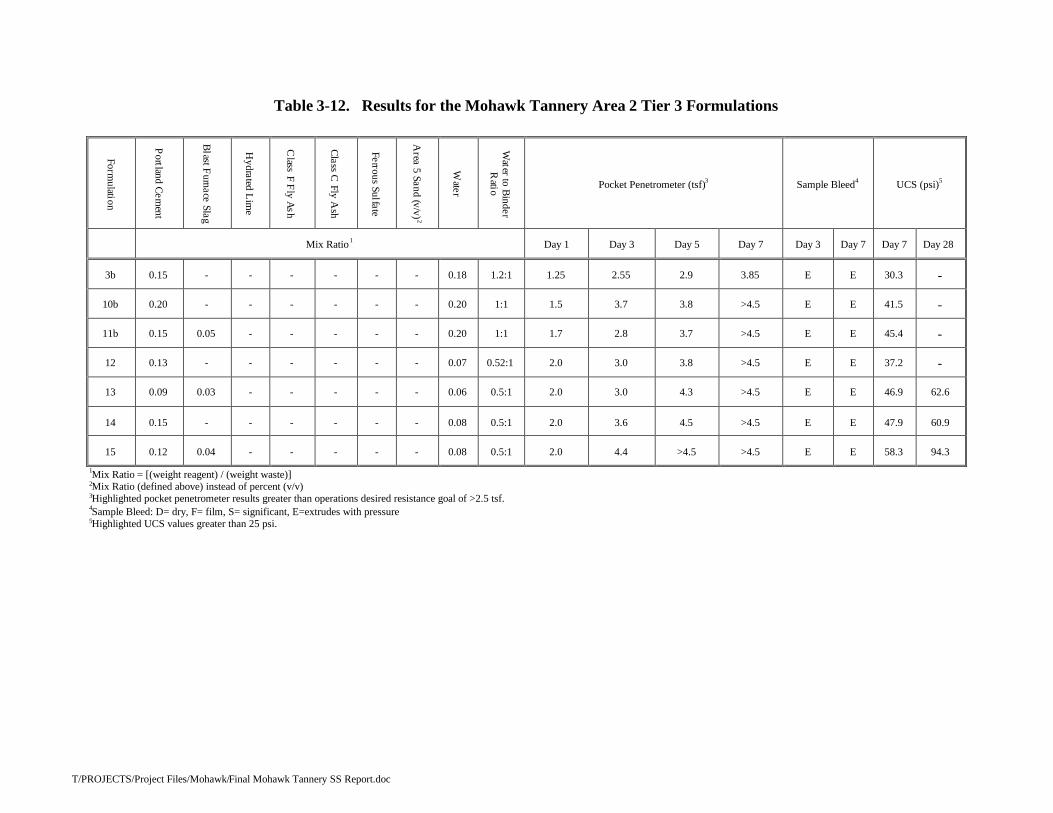
T/PROJECTS/Project Files/Mohawk/Final Mohawk Tannery SS Report.doc
Table 3-12. Results for the Mohawk Tannery Area 2 Tier 3 Formulations
Formulation
Portland
Cem
ent
BlastF
urnaceSlag
Hydrated
Lim
e
Class
FF
lyA
sh
Class
CFly
Ash
FerrousSulfate
Area
5Sand
(v/v)2
Water
Water
toB
inderR
atio Pocket Penetrometer (tsf)3 Sample Bleed4 UCS (psi)5
Mix Ratio1 Day 1 Day 3 Day 5 Day 7 Day 3 Day 7 Day 7 Day 28
3b 0.15 - - - - - - 0.18 1.2:1 1.25 2.55 2.9 3.85 E E 30.3 -
10b 0.20 - - - - - - 0.20 1:1 1.5 3.7 3.8 >4.5 E E 41.5 -
11b 0.15 0.05 - - - - - 0.20 1:1 1.7 2.8 3.7 >4.5 E E 45.4 -
12 0.13 - - - - - - 0.07 0.52:1 2.0 3.0 3.8 >4.5 E E 37.2 -
13 0.09 0.03 - - - - - 0.06 0.5:1 2.0 3.0 4.3 >4.5 E E 46.9 62.6
14 0.15 - - - - - - 0.08 0.5:1 2.0 3.6 4.5 >4.5 E E 47.9 60.9
15 0.12 0.04 - - - - - 0.08 0.5:1 2.0 4.4 >4.5 >4.5 E E 58.3 94.3
1Mix Ratio = [(weight reagent) / (weight waste)]2Mix Ratio (defined above) instead of percent (v/v)3Highlighted pocket penetrometer results greater than operations desired resistance goal of >2.5 tsf.4Sample Bleed: D= dry, F= film, S= significant, E=extrudes with pressure5Highlighted UCS values greater than 25 psi.
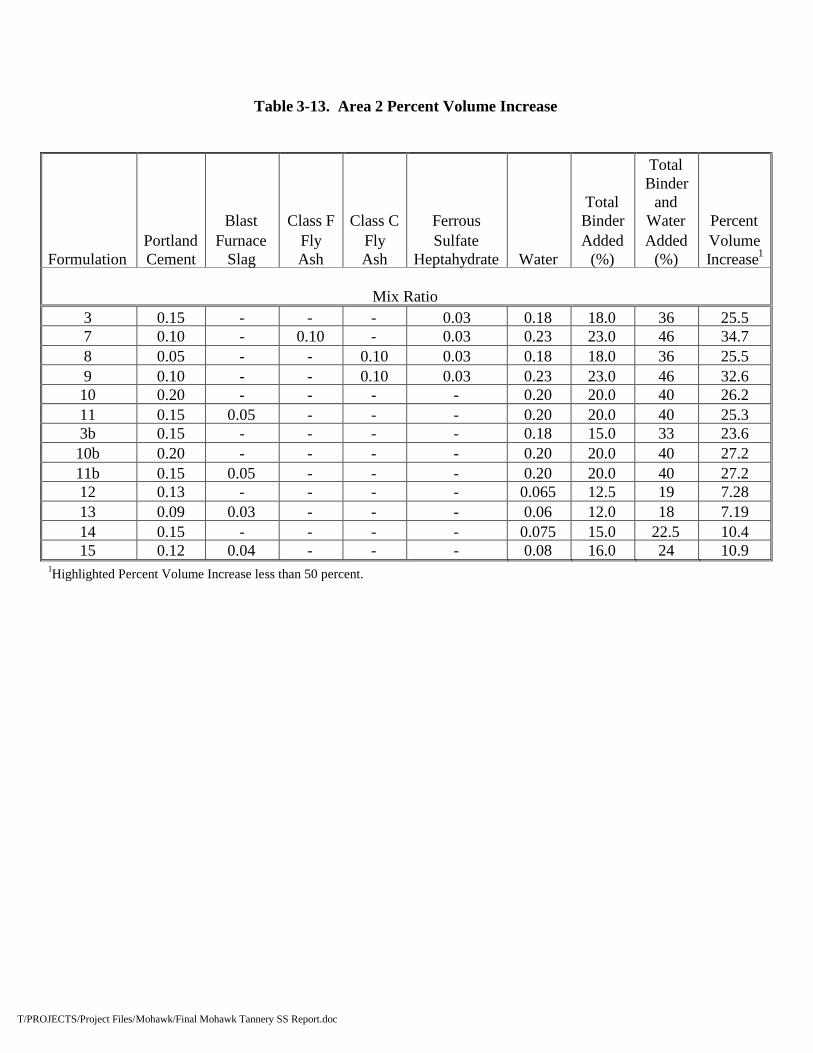
T/PROJECTS/Project Files/Mohawk/Final Mohawk Tannery SS Report.doc
Table 3-13. Area 2 Percent Volume Increase
FormulationPortlandCement
BlastFurnace
Slag
Class FFlyAsh
Class CFlyAsh
FerrousSulfate
Heptahydrate Water
TotalBinderAdded
(%)
TotalBinder
andWaterAdded
(%)
PercentVolumeIncrease1
Mix Ratio3 0.15 - - - 0.03 0.18 18.0 36 25.57 0.10 - 0.10 - 0.03 0.23 23.0 46 34.78 0.05 - - 0.10 0.03 0.18 18.0 36 25.59 0.10 - - 0.10 0.03 0.23 23.0 46 32.610 0.20 - - - - 0.20 20.0 40 26.211 0.15 0.05 - - - 0.20 20.0 40 25.33b 0.15 - - - - 0.18 15.0 33 23.610b 0.20 - - - - 0.20 20.0 40 27.211b 0.15 0.05 - - - 0.20 20.0 40 27.212 0.13 - - - - 0.065 12.5 19 7.2813 0.09 0.03 - - - 0.06 12.0 18 7.1914 0.15 - - - - 0.075 15.0 22.5 10.415 0.12 0.04 - - - 0.08 16.0 24 10.9
1Highlighted Percent Volume Increase less than 50 percent.
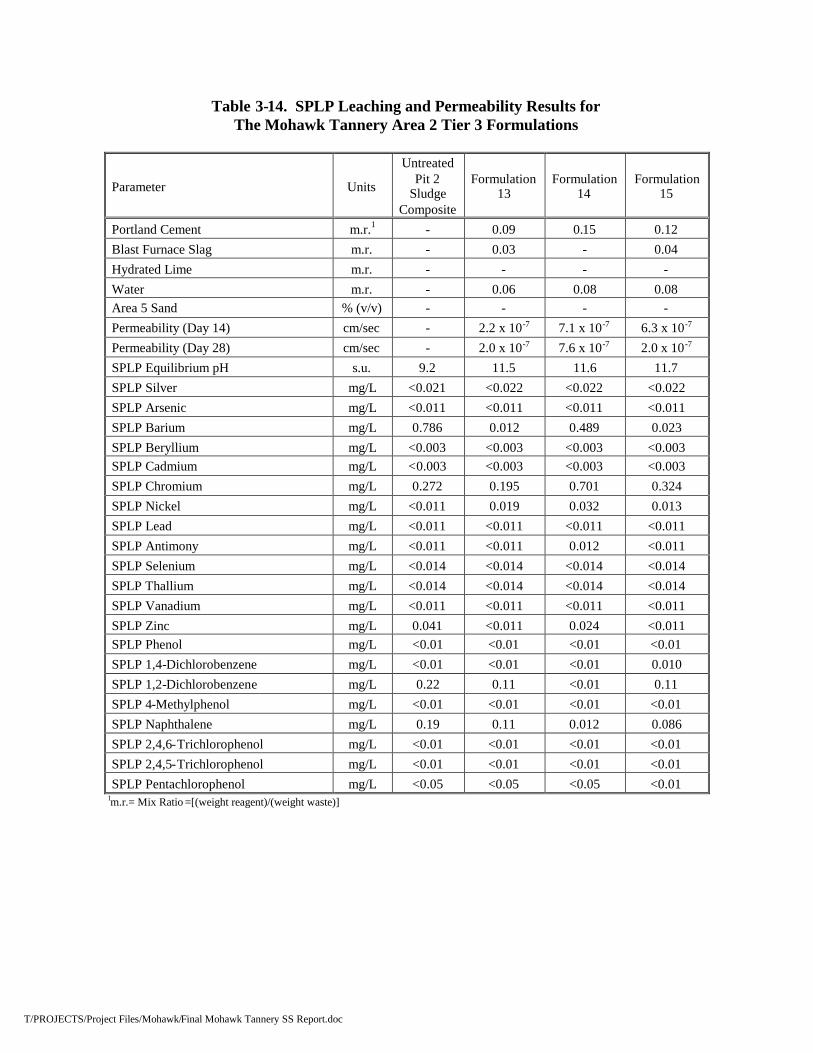
T/PROJECTS/Project Files/Mohawk/Final Mohawk Tannery SS Report.doc
Table 3-14. SPLP Leaching and Permeability Results forThe Mohawk Tannery Area 2 Tier 3 Formulations
Parameter Units
UntreatedPit 2
SludgeComposite
Formulation13
Formulation14
Formulation15
Portland Cement m.r.1 - 0.09 0.15 0.12Blast Furnace Slag m.r. - 0.03 - 0.04Hydrated Lime m.r. - - - -Water m.r. - 0.06 0.08 0.08Area 5 Sand % (v/v) - - - -Permeability (Day 14) cm/sec - 2.2 x 10⁻⁷ 7.1 x 10⁻⁷ 6.3 x 10⁻⁷
Permeability (Day 28) cm/sec - 2.0 x 10⁻⁷ 7.6 x 10⁻⁷ 2.0 x 10⁻⁷
SPLP Equilibrium pH s.u. 9.2 11.5 11.6 11.7SPLP Silver mg/L <0.021 <0.022 <0.022 <0.022SPLP Arsenic mg/L <0.011 <0.011 <0.011 <0.011SPLP Barium mg/L 0.786 0.012 0.489 0.023SPLP Beryllium mg/L <0.003 <0.003 <0.003 <0.003SPLP Cadmium mg/L <0.003 <0.003 <0.003 <0.003SPLP Chromium mg/L 0.272 0.195 0.701 0.324SPLP Nickel mg/L <0.011 0.019 0.032 0.013SPLP Lead mg/L <0.011 <0.011 <0.011 <0.011SPLP Antimony mg/L <0.011 <0.011 0.012 <0.011SPLP Selenium mg/L <0.014 <0.014 <0.014 <0.014SPLP Thallium mg/L <0.014 <0.014 <0.014 <0.014SPLP Vanadium mg/L <0.011 <0.011 <0.011 <0.011SPLP Zinc mg/L 0.041 <0.011 0.024 <0.011SPLP Phenol mg/L <0.01 <0.01 <0.01 <0.01SPLP 1,4-Dichlorobenzene mg/L <0.01 <0.01 <0.01 0.010SPLP 1,2-Dichlorobenzene mg/L 0.22 0.11 <0.01 0.11SPLP 4-Methylphenol mg/L <0.01 <0.01 <0.01 <0.01SPLP Naphthalene mg/L 0.19 0.11 0.012 0.086SPLP 2,4,6-Trichlorophenol mg/L <0.01 <0.01 <0.01 <0.01SPLP 2,4,5-Trichlorophenol mg/L <0.01 <0.01 <0.01 <0.01SPLP Pentachlorophenol mg/L <0.05 <0.05 <0.05 <0.01
1m.r.= Mix Ratio =[(weight reagent)/(weight waste)]
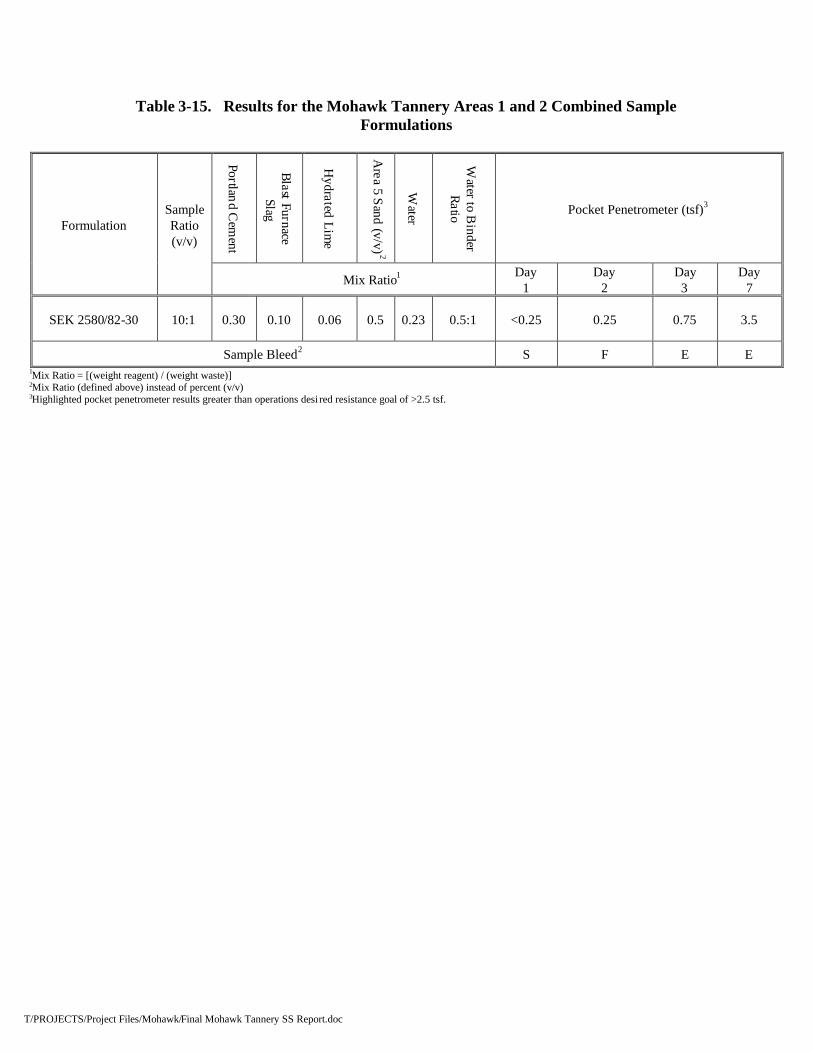
T/PROJECTS/Project Files/Mohawk/Final Mohawk Tannery SS Report.doc
Table 3-15. Results for the Mohawk Tannery Areas 1 and 2 Combined SampleFormulations
FormulationSampleRatio(v/v)
PortlandC
ement
BlastFurnace
Slag
Hydrated
Lime
Area
5Sand
(v/v)2
Water
Waterto
Binder
Ratio Pocket Penetrometer (tsf)3
Mix Ratio1 Day1
Day2
Day3
Day7
SEK 2580/82-30 10:1 0.30 0.10 0.06 0.5 0.23 0.5:1 <0.25 0.25 0.75 3.5
Sample Bleed2 S F E E1Mix Ratio = [(weight reagent) / (weight waste)]2Mix Ratio (defined above) instead of percent (v/v)3Highlighted pocket penetrometer results greater than operations desi red resistance goal of >2.5 tsf.
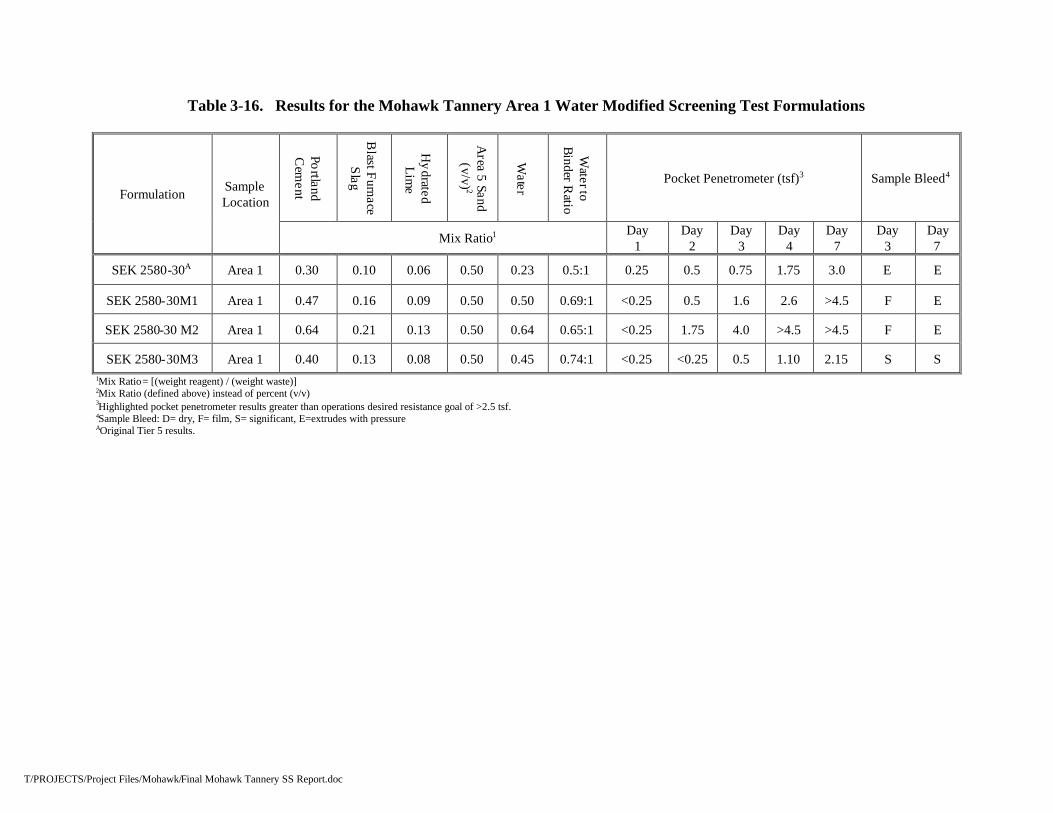
T/PROJECTS/Project Files/Mohawk/Final Mohawk Tannery SS Report.doc
Table 3-16. Results for the Mohawk Tannery Area 1 Water Modified Screening Test Formulations
Formulation SampleLocation
PortlandC
ement
BlastFurnace
Slag
HydratedL
ime
Area
5Sand
(v/v) 2
Water
Waterto
BinderRatio
Pocket Penetrometer (tsf)3 Sample Bleed4
Mix Ratio1 Day1
Day2
Day3
Day4
Day7
Day3
Day7
SEK 2580-30A Area 1 0.30 0.10 0.06 0.50 0.23 0.5:1 0.25 0.5 0.75 1.75 3.0 E E
SEK 2580-30M1 Area 1 0.47 0.16 0.09 0.50 0.50 0.69:1 <0.25 0.5 1.6 2.6 >4.5 F E
SEK 2580-30 M2 Area 1 0.64 0.21 0.13 0.50 0.64 0.65:1 <0.25 1.75 4.0 >4.5 >4.5 F E
SEK 2580-30M3 Area 1 0.40 0.13 0.08 0.50 0.45 0.74:1 <0.25 <0.25 0.5 1.10 2.15 S S1Mix Ratio= [(weight reagent) / (weight waste)]2Mix Ratio (defined above) instead of percent (v/v)3Highlighted pocket penetrometer results greater than operations desired resistance goal of >2.5 tsf.4Sample Bleed: D= dry, F= film, S= significant, E=extrudes with pressureAOriginal Tier 5 results.
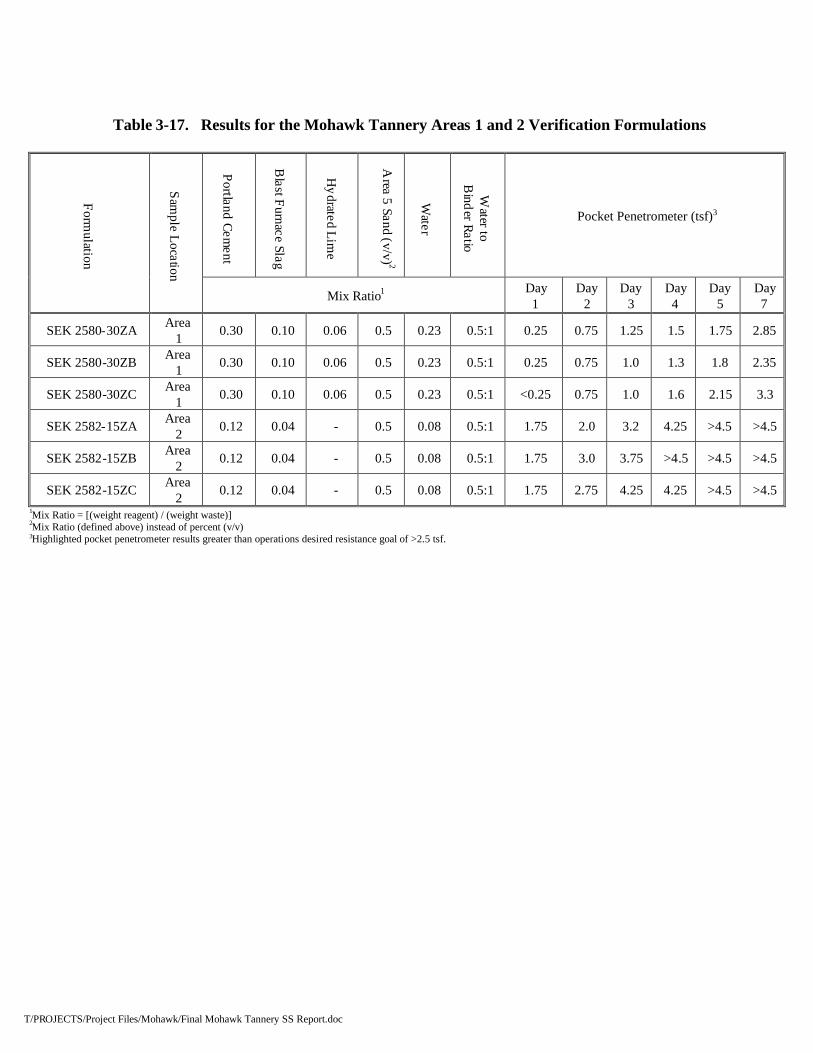
T/PROJECTS/Project Files/Mohawk/Final Mohawk Tannery SS Report.doc
Table 3-17. Results for the Mohawk Tannery Areas 1 and 2 Verification Formulations
Formulation
Sample
Location
PortlandCem
ent
BlastFurnace
Slag
Hydrated
Lime
Area
5Sand
(v/v) 2
Water
Waterto
BinderRatio
Pocket Penetrometer (tsf)3
Mix Ratio1 Day1
Day2
Day3
Day4
Day5
Day7
SEK 2580-30ZA Area1 0.30 0.10 0.06 0.5 0.23 0.5:1 0.25 0.75 1.25 1.5 1.75 2.85
SEK 2580-30ZB Area1 0.30 0.10 0.06 0.5 0.23 0.5:1 0.25 0.75 1.0 1.3 1.8 2.35
SEK 2580-30ZC Area1 0.30 0.10 0.06 0.5 0.23 0.5:1 <0.25 0.75 1.0 1.6 2.15 3.3
SEK 2582-15ZA Area2 0.12 0.04 - 0.5 0.08 0.5:1 1.75 2.0 3.2 4.25 >4.5 >4.5
SEK 2582-15ZB Area2 0.12 0.04 - 0.5 0.08 0.5:1 1.75 3.0 3.75 >4.5 >4.5 >4.5
SEK 2582-15ZC Area2 0.12 0.04 - 0.5 0.08 0.5:1 1.75 2.75 4.25 4.25 >4.5 >4.5
1Mix Ratio = [(weight reagent) / (weight waste)]2Mix Ratio (defined above) instead of percent (v/v)3Highlighted pocket penetrometer results greater than operations desired resistance goal of >2.5 tsf.
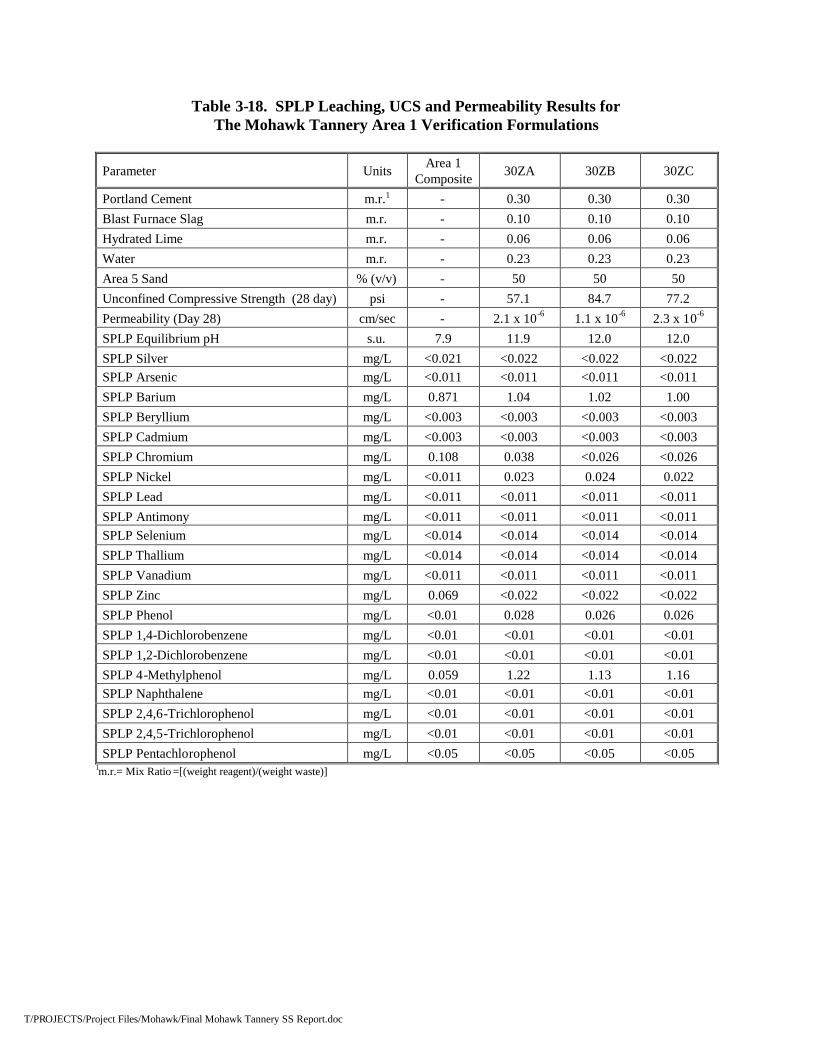
T/PROJECTS/Project Files/Mohawk/Final Mohawk Tannery SS Report.doc
Table 3-18. SPLP Leaching, UCS and Permeability Results forThe Mohawk Tannery Area 1 Verification Formulations
Parameter Units Area 1Composite 30ZA 30ZB 30ZC
Portland Cement m.r.1 - 0.30 0.30 0.30Blast Furnace Slag m.r. - 0.10 0.10 0.10Hydrated Lime m.r. - 0.06 0.06 0.06Water m.r. - 0.23 0.23 0.23Area 5 Sand % (v/v) - 50 50 50Unconfined Compressive Strength (28 day) psi - 57.1 84.7 77.2Permeability (Day 28) cm/sec - 2.1 x 10⁻⁶ 1.1 x 10⁻⁶ 2.3 x 10⁻⁶
SPLP Equilibrium pH s.u. 7.9 11.9 12.0 12.0SPLP Silver mg/L <0.021 <0.022 <0.022 <0.022SPLP Arsenic mg/L <0.011 <0.011 <0.011 <0.011SPLP Barium mg/L 0.871 1.04 1.02 1.00SPLP Beryllium mg/L <0.003 <0.003 <0.003 <0.003SPLP Cadmium mg/L <0.003 <0.003 <0.003 <0.003SPLP Chromium mg/L 0.108 0.038 <0.026 <0.026SPLP Nickel mg/L <0.011 0.023 0.024 0.022SPLP Lead mg/L <0.011 <0.011 <0.011 <0.011SPLP Antimony mg/L <0.011 <0.011 <0.011 <0.011SPLP Selenium mg/L <0.014 <0.014 <0.014 <0.014SPLP Thallium mg/L <0.014 <0.014 <0.014 <0.014SPLP Vanadium mg/L <0.011 <0.011 <0.011 <0.011SPLP Zinc mg/L 0.069 <0.022 <0.022 <0.022SPLP Phenol mg/L <0.01 0.028 0.026 0.026SPLP 1,4-Dichlorobenzene mg/L <0.01 <0.01 <0.01 <0.01SPLP 1,2-Dichlorobenzene mg/L <0.01 <0.01 <0.01 <0.01SPLP 4-Methylphenol mg/L 0.059 1.22 1.13 1.16SPLP Naphthalene mg/L <0.01 <0.01 <0.01 <0.01SPLP 2,4,6-Trichlorophenol mg/L <0.01 <0.01 <0.01 <0.01SPLP 2,4,5-Trichlorophenol mg/L <0.01 <0.01 <0.01 <0.01SPLP Pentachlorophenol mg/L <0.05 <0.05 <0.05 <0.05
1m.r.= Mix Ratio =[(weight reagent)/(weight waste)]
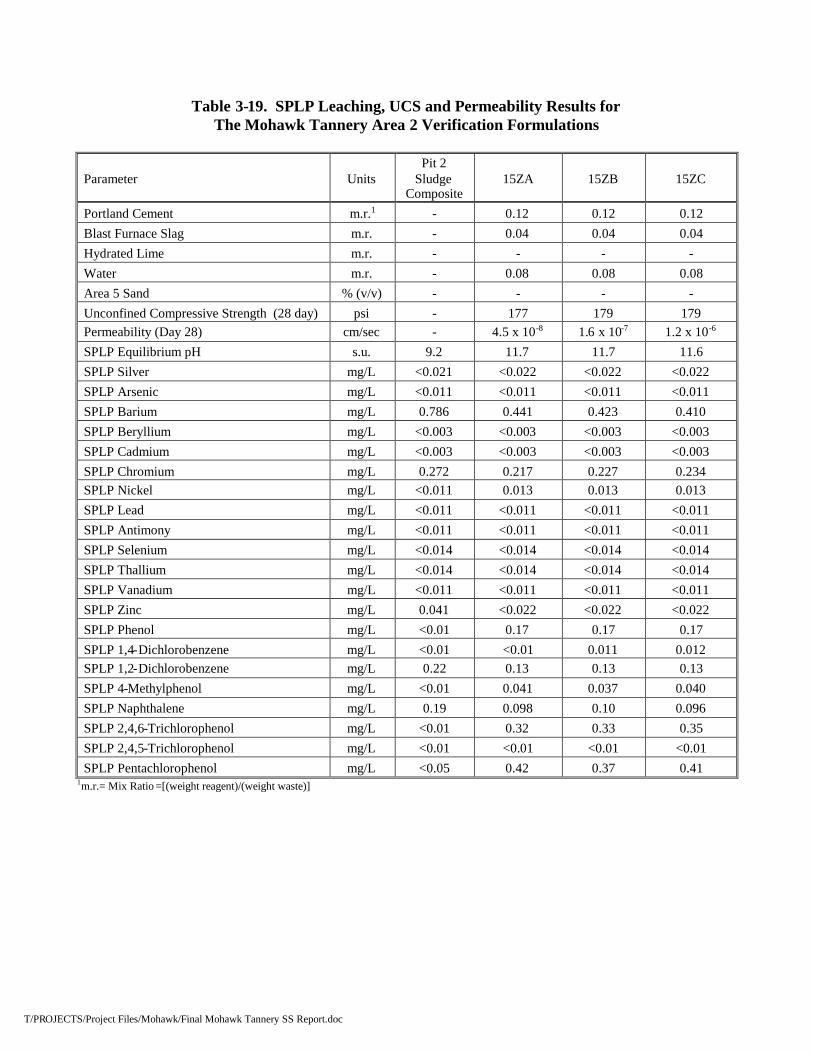
T/PROJECTS/Project Files/Mohawk/Final Mohawk Tannery SS Report.doc
Table 3-19. SPLP Leaching, UCS and Permeability Results forThe Mohawk Tannery Area 2 Verification Formulations
Parameter UnitsPit 2
SludgeComposite
15ZA 15ZB 15ZC
Portland Cement m.r.1 - 0.12 0.12 0.12Blast Furnace Slag m.r. - 0.04 0.04 0.04Hydrated Lime m.r. - - - -Water m.r. - 0.08 0.08 0.08Area 5 Sand % (v/v) - - - -Unconfined Compressive Strength (28 day) psi - 177 179 179Permeability (Day 28) cm/sec - 4.5 x 10⁻⁸ 1.6 x 10⁻⁷ 1.2 x 10⁻⁶
SPLP Equilibrium pH s.u. 9.2 11.7 11.7 11.6SPLP Silver mg/L <0.021 <0.022 <0.022 <0.022SPLP Arsenic mg/L <0.011 <0.011 <0.011 <0.011SPLP Barium mg/L 0.786 0.441 0.423 0.410SPLP Beryllium mg/L <0.003 <0.003 <0.003 <0.003SPLP Cadmium mg/L <0.003 <0.003 <0.003 <0.003SPLP Chromium mg/L 0.272 0.217 0.227 0.234SPLP Nickel mg/L <0.011 0.013 0.013 0.013SPLP Lead mg/L <0.011 <0.011 <0.011 <0.011SPLP Antimony mg/L <0.011 <0.011 <0.011 <0.011SPLP Selenium mg/L <0.014 <0.014 <0.014 <0.014SPLP Thallium mg/L <0.014 <0.014 <0.014 <0.014SPLP Vanadium mg/L <0.011 <0.011 <0.011 <0.011SPLP Zinc mg/L 0.041 <0.022 <0.022 <0.022SPLP Phenol mg/L <0.01 0.17 0.17 0.17SPLP 1,4-Dichlorobenzene mg/L <0.01 <0.01 0.011 0.012SPLP 1,2-Dichlorobenzene mg/L 0.22 0.13 0.13 0.13SPLP 4-Methylphenol mg/L <0.01 0.041 0.037 0.040SPLP Naphthalene mg/L 0.19 0.098 0.10 0.096SPLP 2,4,6-Trichlorophenol mg/L <0.01 0.32 0.33 0.35SPLP 2,4,5-Trichlorophenol mg/L <0.01 <0.01 <0.01 <0.01SPLP Pentachlorophenol mg/L <0.05 0.42 0.37 0.41
1m.r.= Mix Ratio =[(weight reagent)/(weight waste)]

T/PROJECTS/Project Files/Mohawk/Final Mohawk Tannery SS Report.doc
Figures
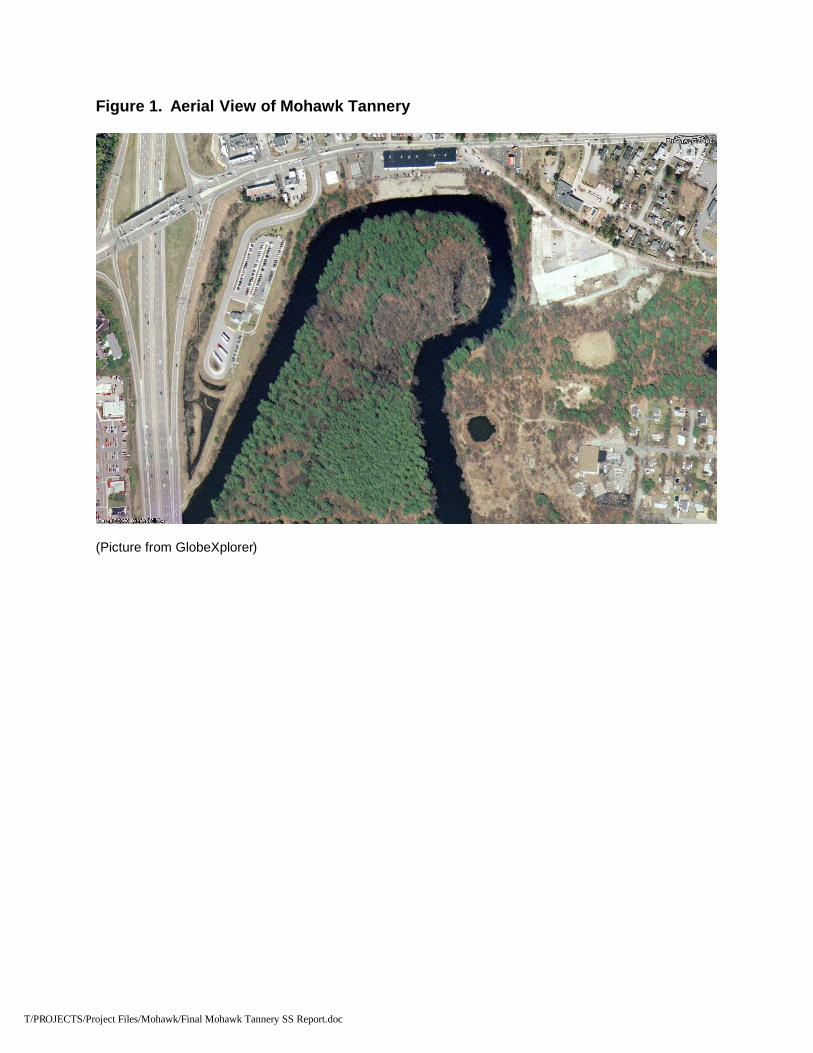
T/PROJECTS/Project Files/Mohawk/Final Mohawk Tannery SS Report.doc
Figure 1. Aerial View of Mohawk Tannery
(Picture from GlobeXplorer)
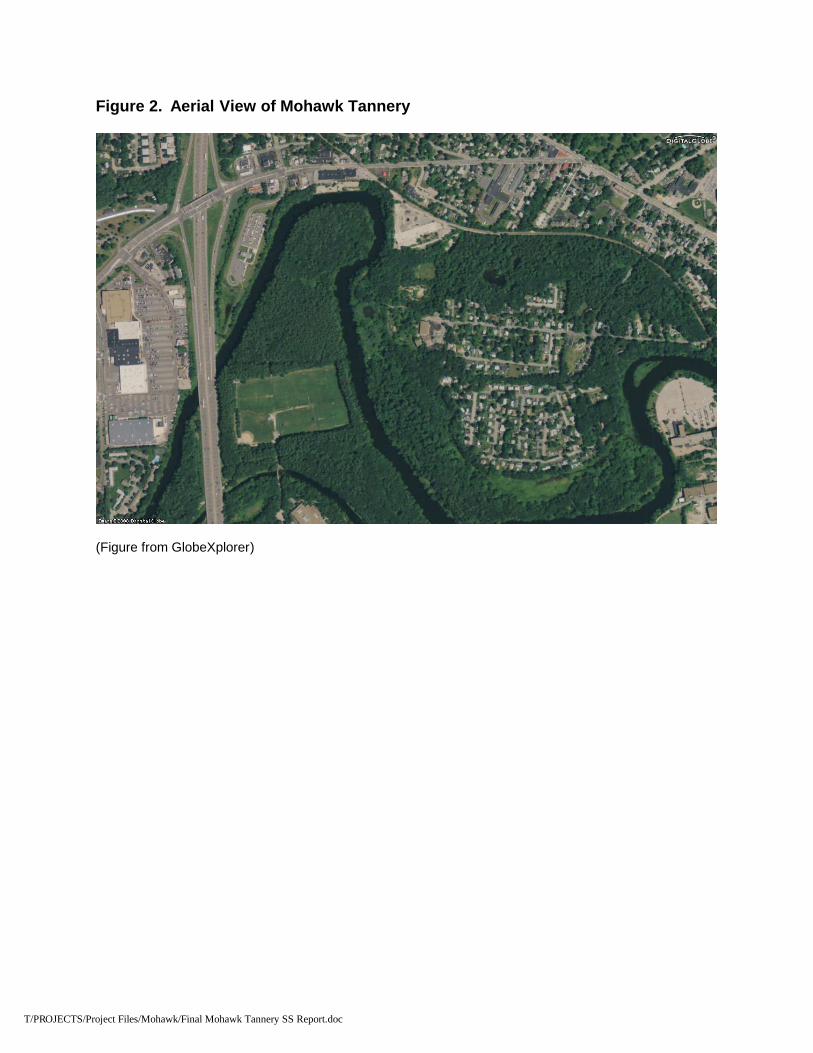
T/PROJECTS/Project Files/Mohawk/Final Mohawk Tannery SS Report.doc
Figure 2. Aerial View of Mohawk Tannery
(Figure from GlobeXplorer)
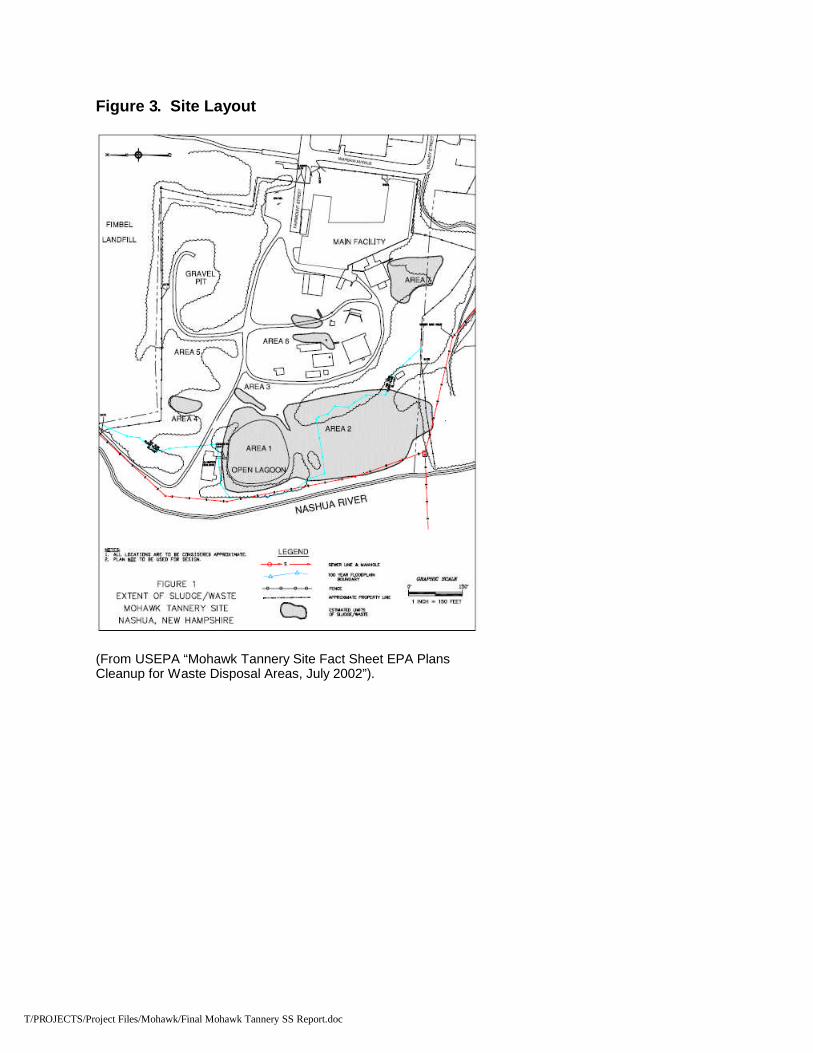
T/PROJECTS/Project Files/Mohawk/Final Mohawk Tannery SS Report.doc
Figure 3. Site Layout
(From USEPA “Mohawk Tannery Site Fact Sheet EPA PlansCleanup for Waste Disposal Areas, July 2002”).
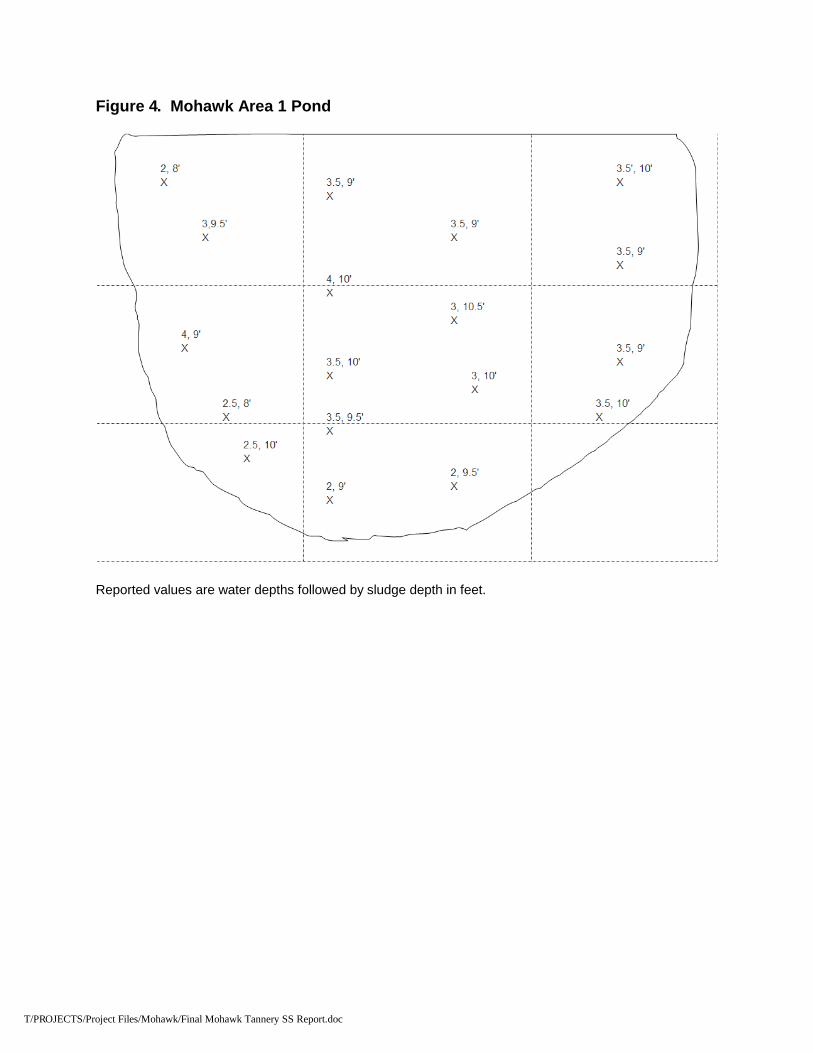
T/PROJECTS/Project Files/Mohawk/Final Mohawk Tannery SS Report.doc
Figure 4. Mohawk Area 1 Pond
Reported values are water depths followed by sludge depth in feet.
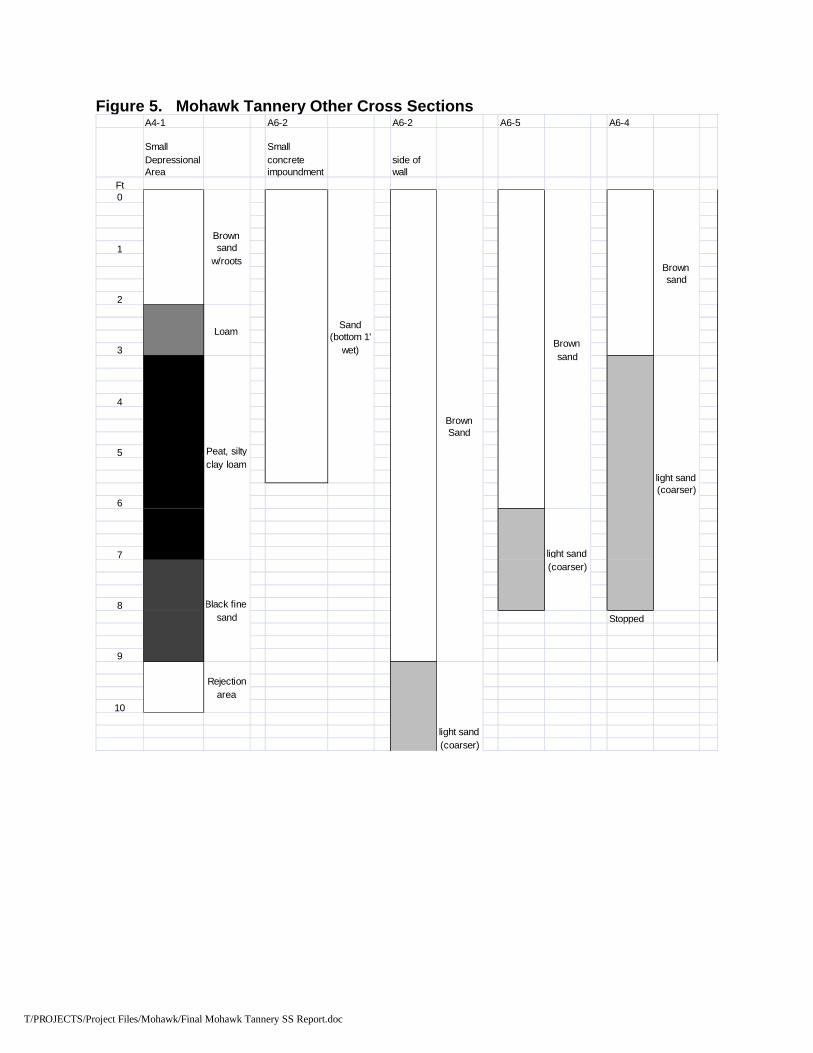
T/PROJECTS/Project Files/Mohawk/Final Mohawk Tannery SS Report.doc
Figure 5. Mohawk Tannery Other Cross SectionsA4-1 A6-2 A6-2 A6-5 A6-4
SmallDepressionalArea
Smallconcreteimpoundment
side ofwall
Ft0
1
2
3
4
5
6
7
8Stopped
9
10
Sand(bottom 1'
wet)
Brownsand
w/roots
Loam
Peat, siltyclay loam
Black finesand
Rejectionarea
Brownsand
light sand(coarser)
BrownSand
light sand(coarser)
Brownsand
light sand(coarser)
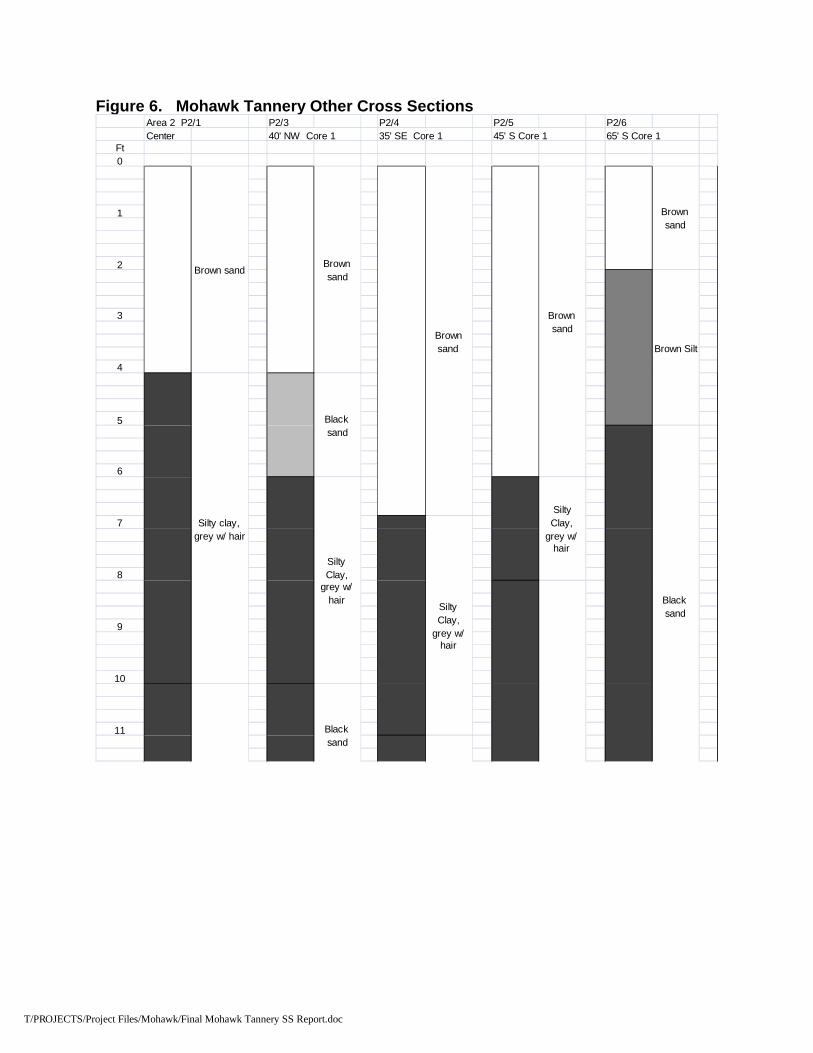
T/PROJECTS/Project Files/Mohawk/Final Mohawk Tannery SS Report.doc
Figure 6. Mohawk Tannery Other Cross SectionsArea 2 P2/1 P2/3 P2/4 P2/5 P2/6Center 40' NW Core 1 35' SE Core 1 45' S Core 1 65' S Core 1
Ft0
1
2
3
4
5
6
7
8
9
10
11
Brown sand
Silty clay,grey w/ hair
Brownsand
SiltyClay,
grey w/hair
Blacksand
Blacksand
SiltyClay,
grey w/hair
Brownsand
SiltyClay,
grey w/hair
Brownsand
Brownsand
Brown Silt
Blacksand
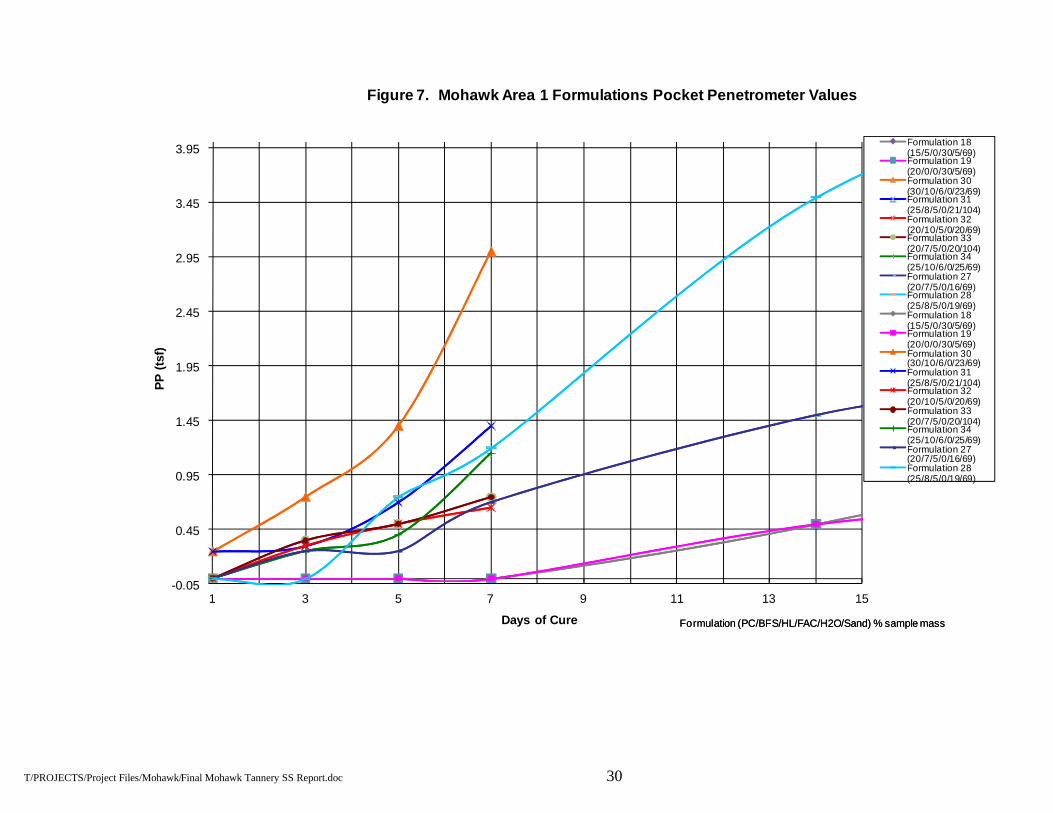
T/PROJECTS/Project Files/Mohawk/Final Mohawk Tannery SS Report.doc 30
-0.05
0.45
0.95
1.45
1.95
2.45
2.95
3.45
3.95
1 3 5 7 9 11 13 15
PP
(tsf
)
Days of Cure
Figure 7. Mohawk Area 1 Formulations Pocket Penetrometer Values
Formulation 18(15/5/0/30/5/69)Formulation 19(20/0/0/30/5/69)Formulation 30(30/10/6/0/23/69)Formulation 31(25/8/5/0/21/104)Formulation 32(20/10/5/0/20/69)Formulation 33(20/7/5/0/20/104)Formulation 34(25/10/6/0/25/69)Formulation 27(20/7/5/0/16/69)Formulation 28(25/8/5/0/19/69)Formulation 18(15/5/0/30/5/69)Formulation 19(20/0/0/30/5/69)Formulation 30(30/10/6/0/23/69)Formulation 31(25/8/5/0/21/104)Formulation 32(20/10/5/0/20/69)Formulation 33(20/7/5/0/20/104)Formulation 34(25/10/6/0/25/69)Formulation 27(20/7/5/0/16/69)Formulation 28(25/8/5/0/19/69)
Formulation (PC/BFS/HL/FAC/H2O/Sand) % sample massFormulation (PC/BFS/HL/FAC/H2O/Sand) % sample mass