
Final Report Selenium (Final)
51
Thesis Final Report Selenium: Plant uptake influenced by changing the pH WAGENINGEN UR November 20, 2014 Authored by: Arguello Jacome, David
-
Upload
arguello2009 -
Category
Documents
-
view
176 -
download
2
Transcript of Final Report Selenium (Final)

Thesis Final Report
Selenium: Plant uptake influenced by changing the pH
WAGENINGEN UR
November 20, 2014 Authored by: Arguello Jacome, David

Table of Contents
Abstract .................................................................................................................................. iii 1. INTRODUCTION ...................................................................................................................... 1 1.1. Problem description ......................................................................................................... 1 1.2. Background information ................................................................................................... 1 1.2.1. Selenium in Plants ....................................................................................................... 2 1.2.2. Fractions of Selenium in Soil and Their Relevance to Se Availability ..................................... 3 1.2.3. pH Effect on Selenium Bioavailability .............................................................................. 4 1.3. Objectives ...................................................................................................................... 4 1.3.1. Main Objective: ........................................................................................................... 4 1.3.2. Specific objectives: ...................................................................................................... 4 1.4. Aims, research questions, hypothesis ................................................................................. 4 2. MATERIALS AND METHODS ...................................................................................................... 5 2.1. First experiment: Nutrient solution culture .......................................................................... 5 2.2. Second experiment: Greenhouse pot experiment ................................................................. 7 2.3. Third experiment: Adsorption Experiment ......................................................................... 12 2.3.1. pH-Edge adsorption Experiment ................................................................................... 13 2.4. Data Analysis ................................................................................................................ 14 3. RESULTS ............................................................................................................................. 14 3.1. Result from Nutrient Solution Experiment.......................................................................... 14 3.1.1. pH adjustment .......................................................................................................... 14 3.1.2. Biomass ................................................................................................................... 16 3.1.3. Change of nutrient concentration in the hydroponic solution ............................................. 17 3.1.4. Se content in plants ................................................................................................... 18 3.1.5. Summary of the hydroponic experimental results ........................................................... 23 3.2. Results from Pot Experiment ........................................................................................... 24 3.2.1. Elements extracted in single step extractions of the original soil samples ........................... 24 3.2.2. 0.01M CaCl2 extraction in soils after the pot experiment .................................................. 24 3.2.3. Biomass ................................................................................................................... 26 3.2.4. Plant uptake .............................................................................................................. 27 3.2.5. Summary of the pot experiment results ........................................................................ 29 3.3. Results from adsorption batch experiment......................................................................... 30 3.3.1. Adsorption isotherm experiment................................................................................... 30 3.3.2. Soil factors related to Se adsorption ............................................................................. 33 3.3.3. pH adsorption edge experiment ................................................................................... 34 3.3.4. Summary of the Se adsorption experimental results ........................................................ 35 4. DISCUSSION ........................................................................................................................ 36 4.1. For the hydroponic experiment ........................................................................................ 36 4.2. For the pot experiment: ................................................................................................. 38 4.3. For Adsorption batch experiment ..................................................................................... 40
i

4.4. Comparing pH effect in the hydroponic, pot and adsorption experiment ................................. 41 5. CONCLUSIONS ..................................................................................................................... 41 REFERENCES ........................................................................................................................... 43 ANNEXES ................................................................................................................................ 46
ii

Abstract
Selenium is an essential element for the nutrition of humans and animals. Lack of this element could lead to several health problems. Its inclusion in human’s diet is mostly through the consumption of meat and vegetables. Biofortification of crops with inorganic forms of selenium has been applied as a standard management technique. Selenite and selenate are the main inorganic forms of selenium present in agricultural soil. Selenate has been widely studied but little is known about selenite. In this research three experiments were carried out to understand how pH affects selenium uptake. The first experiment was a hydroponic experiment with three levels of pH, two form of selenium and two levels of phosphate. The second experiment was a pot experiment with three types of soil, two levels of pH, two levels of phosphate and two levels of boron. The last experiment was an adsorption isotherm and envelope experiment. The results showed that selenite is taken up more easily rather than selenate without the presence of soil factor. At low pH selenium content in shoots were higher when selenite was added rather than when selenate was applied. When soil is included, selenite tends to be adsorbed to the soil particles at low pH levels. Selenate was almost no adsorbed to soil particles. Phosphate levels did not show a clear effect on the hydroponic experiment but it affected to some extent in the pot experiment. In conclusion, selenate is the most available form of selenate in soils, however due to its low adsorption to soil particles it could be easily washed form soils. Selenite is present in soils but due to its strong adsorption to soil particles it is not easily available for plants.
Key words: Selenium, selenite, selenate, pH, biofortification.
iii

1. INTRODUCTION 1.1. Problem description Selenium (Se) is an important micronutrient in the diet of animals and humans. The deficiency of this element can cause the development of several diseases related to muscle disorders, heart disorder, and bone and joint problems. A lack of selenium may also be related to malfunction of immune system, cancer and low reproduction rate. Selenium deficiency has been normally found in locations where Se levels in soils are low. In Western Europe, the soil selenium content is usually low and the selenium intake for cattle and human can be less than optimal. Some countries in Europe are facing this issue by supplying Se to their cattle as feed additive and crops via fertilization (bio-fortification).
In the context of selenium fertilization, it is known that selenium uptake and accumulation in plants are related not only to the total amount of Se, but also to the chemical form of Se fertilizer. In addition, soil factors like pH, redox potential, clay content, soil organic matter content, and salinity, among others, can also influence Se uptake. pH is a key soil chemical parameter. It has been shown that the bioavailability of Se is strongly influenced by soil pH (Selinus, 2013). However, most of these studies looked into the net effect of pH on plant uptake from soil only, without investigating the mechanisms in details.
In this thesis, the pH effect on plant uptake from nutrient solution, from soil, and on Se solubility in soil solution and adsorption will be investigated respectively. In addition, the interactions between pH and different chemical forms of Se (selenate and selenite) and soil textures (sandy, loamy and clay) will also be studied. Grass will be used as the testing plants. The results can improve our understanding regarding pH effect on Se phyto-bioavailability in general. Selenium can enter human’s diet by the consumption of meat. Therefore, understanding the effect of pH on the uptake of Se by grass can help scientists and farmers to increase the amount of Se supplied to humans’ diet through meat consumption.
1.2. Background information Selenium (Se) is a metalloid of the same family as oxygen (O) and sulphur (S). It was discovered in 1817 by Jacob Berzelius Jöns and since then Se has been known mainly for its toxicity to animals. Only until the 1950’s the importance of Se as a nutrient for animals and humans was discovered. After that, investigations have been developed in order to understand the role and behaviour of this element in animals and humans, and in soils and other environment. Selenium is widespread in the Earth’s crust where its average concentration is around 0.05-0.09 mg·kg−1 (Martens, 2003). The world average Se content in soil is 0.4 mg kg-1(Selinus, 2013). Selenium in soils can be in both organic and inorganic form. The inorganic forms of Selenium at different oxidation states are selenite (SeO3
−2), selenide (Se2−), selenate (SeO4
−2) and elemental selenium (Se0)(Lauchli, 1993). Selenium is an essential element for nutrition of animals and human beings (Schwarz & Foltz, 1957). Selenium is present in the structure of antioxidant enzymes like glutathione peroxidase which helps to prevent oxidative damage in body tissues (Rotruck et al., 1973). Therefore, Se deficiency can lead to health problems in animals and human beings. Several studies have reported that Se deficiency could cause different disorders in young animals, being the most important the white muscle disease (Mehdi, Hornick, Istasse, & Dufrasne, 2013). In humans similar symptoms have been reported, as well as other symptoms related to Se deficiency like thyroid injuries and decrease in the production of thyroid hormone. Selenium deficiency could also cause Keshan decease, which is an endemic cardiomyopathy mainly affecting children and women of childbearing age (Bhan, Sommerfelt, & Strand, 2001). In order to reduce the problems related to Se deficiency, its inclusion in animal diet has been taken as a standard management practice in different countries. For instance, in France the daily consumption of Se has been set up to 100 µg/kg of dry matter for ruminants (Mehdi et al., 2013). For human intake, the Dietary Reference Intake for Selenium in the USA in 2000 was 75 and 55 µg/day for adult men and women respectively (EFSA, 2006). It has been suggested that somewhat higher daily Se intake can reduce the risk of cancer (Clark et al., 1996), heart disease etc., and can improve immune system but there is a lot of controversy about these alleged benefits (Algotar et al., 2013; Duffield-Lillico et al., 2003; Reid et al., 2008). High concentrations of Se in both animals and humans can lead to toxicity problems. Selenium has similar chemical characteristics to sulphur (S) and can replace it in other enzymes with the risk of inactivating them (Aitken, 2001). The upper tolerable limit for Se daily intake by adults was defined in the US and UK at 200 µg/day (Selinus, 2013).
1

1.2.1. Selenium in Plants There is a controversial debate about the role of Se in plant physiology. Many scientific papers claim that Se has no effect on plant physiology. However, Se has been classified as a beneficial element, because some scientists have found that its presence might help plants in their reduction-oxidation processes, and therefore increases plant production, but it is not essential for plant growth. Hartikainen, Xue, and Piironen (2000) found that Se has a dual effect: at low concentrations it acts as an antioxidant, whereas at higher concentrations, it is a pro-oxidant. Therefore the toxicity of Se in plants could be attributed to its pro-oxidant behaviour. Even though it is still unclear to what extend Se is essential for plants, it has been proved that there are differences between accumulations of Se among plants. Brown and Shrift (1982) found that some plants can accumulate high amount of Se without showing any toxic effect. They proposed a classification of the North America flora based on the Se accumulation properties. The classification contains three categories: selenium accumulators (more than 1000 µg Se/g DM), selenium absorbers (up to 1000 µg Se/g DM) and selenium non-accumulators (no more than 25 µg Se/g DM) (DM: dry matter). Plants can take up and accumulate Se. These two processes are determined by different factors such as: the chemical form and concentration of Se (Hawrylak-Nowak, 2013), soil pH, salinity and CaCO3 content, type and concentration of competing ions, and finally if the plant is capable of absorb and metabolize Se (Wu, 2004). Vegetables rich in S have a higher capacity to accumulate Selenium because Se can replace S in the protein. Examples of these vegetables are some Brassica and Allium species (De Temmerman et al., 2014). Selenite and selenate are the most abundant forms of selenium in soil that plants can take up. It has been proved that selenate can compete with sulphate for the same transporters during the plant uptake due to the fact that selenate is an analogue to sulphate (Mikkelsen & Wan, 1990; Zayed & Terry, 1992). This means that selenate uptake is an active process (Terry, Zayed, de Souza, & Tarun, 2000). Additionally, Mikkelsen, Haghnia, Page, and Bingham (1988) found that the presence of SO4
2-
reduced the accumulation of Se by alfalfa due to an apparent Se-S antagonism. However, the process of selenite uptake is poorly understood. It has been suggested in early studies, that diffusion may be the main process for selenite to go into the roots, but other studies have shown that the presence of phosphate can inhibit selenite uptake but Se uptake is enhanced by phosphate deficiency in the plants suggesting an active process as well (J. L. Hopper & D. R. Parker, 1999; Li, McGrath, & Zhao, 2008). Although it is proven that both selenate and selenite can be directly taken up by plants, differences in their uptake and translocation in the plants have been found. Hawrylak-Nowak (2013) found that plants of lettuce accumulate more Se in the above ground biomass in the presence of selenate over selenite. Additionally, it was found that translocation of Se from roots to shoots is more efficient when Se was supplied as selenate. Finally, they conclude that a concentration below 15 µM in nutrient solution of both forms of selenium can significantly increase the Se concentration in the edible parts without showing any symptoms of toxicity. On the other hand, J. L. Hopper and D. R. Parker (1999) found that ryegrass (Lolium perenne L.) and clover (Trifolium fragiferrum) have preference to accumulate Se from selenite in roots. They also found that even though Se from Selenite is poorly translocated, that which reaches the shoot is more active than the more abundant Se supplied as Selenate. Selenate is taken up via sulphate-proton co-transporters (Smith, Ealing, Hawkesford, & Clarkson, 1995), and is reduced to selenite, and assimilated into organic Se using S assimilation enzymes. Selenate assimilation takes place mainly in the leaf chloroplast (Pilon-Smits et al., 1999), whereas selenite is transformed into organic Se in the root already and is transported from the root to the shoot in the organic form (Figure 1).
Figure 1: Transport after uptake of three Se-forms (selenate, selenite and selenomethionine) in plants.
2
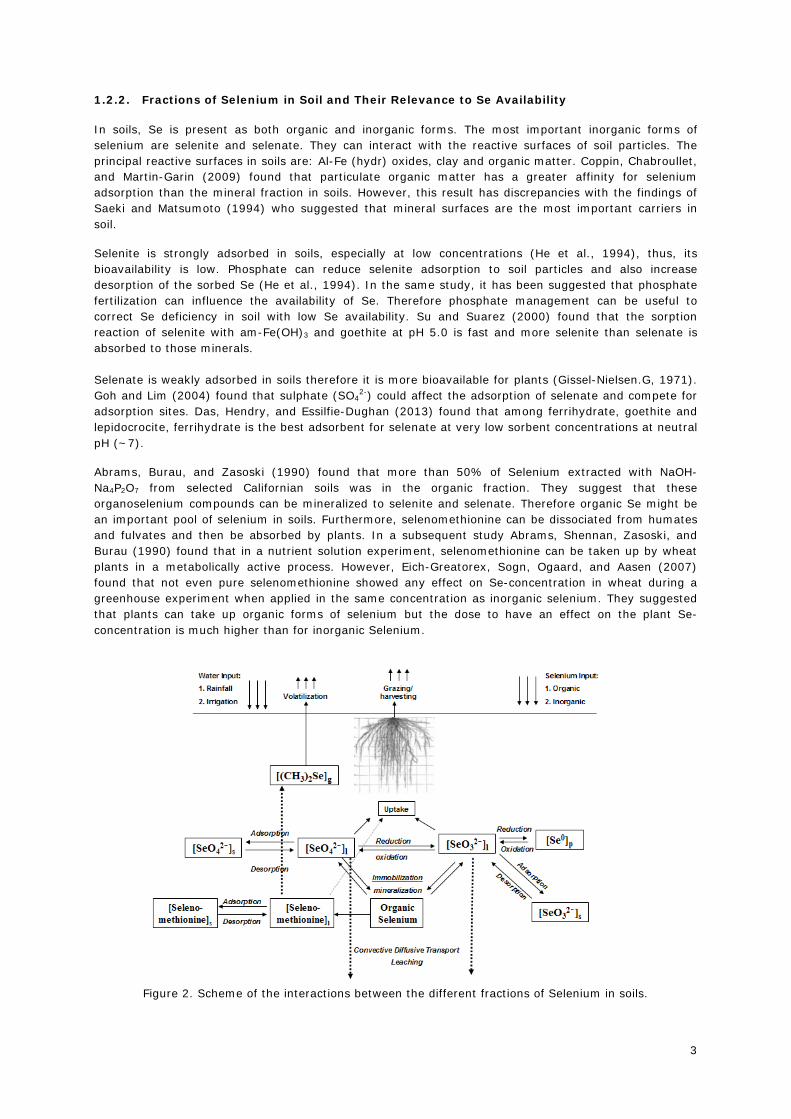
1.2.2. Fractions of Selenium in Soil and Their Relevance to Se Availability In soils, Se is present as both organic and inorganic forms. The most important inorganic forms of selenium are selenite and selenate. They can interact with the reactive surfaces of soil particles. The principal reactive surfaces in soils are: Al-Fe (hydr) oxides, clay and organic matter. Coppin, Chabroullet, and Martin-Garin (2009) found that particulate organic matter has a greater affinity for selenium adsorption than the mineral fraction in soils. However, this result has discrepancies with the findings of Saeki and Matsumoto (1994) who suggested that mineral surfaces are the most important carriers in soil.
Selenite is strongly adsorbed in soils, especially at low concentrations (He et al., 1994), thus, its bioavailability is low. Phosphate can reduce selenite adsorption to soil particles and also increase desorption of the sorbed Se (He et al., 1994). In the same study, it has been suggested that phosphate fertilization can influence the availability of Se. Therefore phosphate management can be useful to correct Se deficiency in soil with low Se availability. Su and Suarez (2000) found that the sorption reaction of selenite with am-Fe(OH)3 and goethite at pH 5.0 is fast and more selenite than selenate is absorbed to those minerals. Selenate is weakly adsorbed in soils therefore it is more bioavailable for plants (Gissel-Nielsen.G, 1971). Goh and Lim (2004) found that sulphate (SO4
2-) could affect the adsorption of selenate and compete for adsorption sites. Das, Hendry, and Essilfie-Dughan (2013) found that among ferrihydrate, goethite and lepidocrocite, ferrihydrate is the best adsorbent for selenate at very low sorbent concentrations at neutral pH (~7).
Abrams, Burau, and Zasoski (1990) found that more than 50% of Selenium extracted with NaOH-Na4P2O7 from selected Californian soils was in the organic fraction. They suggest that these organoselenium compounds can be mineralized to selenite and selenate. Therefore organic Se might be an important pool of selenium in soils. Furthermore, selenomethionine can be dissociated from humates and fulvates and then be absorbed by plants. In a subsequent study Abrams, Shennan, Zasoski, and Burau (1990) found that in a nutrient solution experiment, selenomethionine can be taken up by wheat plants in a metabolically active process. However, Eich-Greatorex, Sogn, Ogaard, and Aasen (2007) found that not even pure selenomethionine showed any effect on Se-concentration in wheat during a greenhouse experiment when applied in the same concentration as inorganic selenium. They suggested that plants can take up organic forms of selenium but the dose to have an effect on the plant Se-concentration is much higher than for inorganic Selenium.
Figure 2. Scheme of the interactions between the different fractions of Selenium in soils.
3

1.2.3. pH Effect on Selenium Bioavailability The pH can influence the plant nutrients uptake by two paths: affecting the behaviour of elements in soil or affecting the plant uptake itself. In the case of selenium, pH changes affect its chemical speciation in soil and the adsorption to soil particles. It is possible that the root uptake process and translocation of Se in plants are also pH dependent. At high pH levels, the binding capacity of soils decreases, for both inorganic selenium and organic selenium. Therefore the bioavailability of Se is higher at high pH. It has been found that selenate is the dominant form in alkaline soils and selenite in acid and humic soils. Besides, Se sorption is the highest at lower pH values, with Se(IV) sorption decreasing at pH values above 6, whereas Se(VI) sorption decreased over the entire pH range (2.5- 10)(Hyun, Burns, Murarka, & Lee, 2006). An experiment with goethite, hematite and selenium showed that the sorption of selenium decreases at alkaline pH, which was related to the change in surface charge and the predominant selenium species in solution (Rovira et al., 2008). On clay minerals, selenite adsorption increased at low solution pH, with a maximum near pH 5 and pH 4 for kaolinite and illite respectively (Goldberg, 2013). Similar behaviour has been found for clay minerals kaolinite and montmorillonite in previous studies (Goldberg & Glaubig, 1988). However, several investigators have found that the effect of pH on Se uptake decreases as clay and organic matter content of the soils increases (Gissel-Nielsen.G, 1971; Johnsson, 1991). Even though pH and redox potential are the dominant factors that determine the form of selenium in soils, Eich-Greatorex et al. (2007) found that the pH effect is dependent on the soil content of organic matter. In peat soil (37% of organic matter) Se uptake was smaller at high pH than low pH environments (Johnsson, 1991). 1.3. Objectives 1.3.1. Main Objective: To investigate the effect and extend of pH on Selenium uptake by plants and to better understand the mechanisms of these pH effects.
1.3.2. Specific objectives: • To study the effect of pH on selenate and selenite adsorption to soils of different texture, to
obtain pH dependent adsorption models. • To examine the effect of pH on Se uptake by rye grass in solution culture, when Se is supplied in
the form of selenate or selenite, and under different phosphate levels. • To study the effect of pH on Se uptake by rye grass in soil culture with soils of different textures
and different phosphorus levels, when Se is fertilized in the form of selenite. • To analyse the effect of pH and the form of Se on the uptake of S and P by rye grass in solution
and soil culture experiments. • To test if the effect of pH on Se uptake in the soil culture experiment can be explained from the
results of the solution culture experiment and the adsorption experiment. 1.4. Aims, research questions, hypothesis The aim of this research was to understand how the pH affects the plant uptake of selenium. To achieve this goal, three experiments were carried out. The experiments were: nutrient solution culture, pot experiment in the greenhouse, and batch adsorption experiment (isotherm and pH edge) in the laboratory.
The reason to divide this research into three experiments was to facilitate the understanding of the processes underlying the uptake of selenium. The nutrient solution culture experiment focused on the relation between nutrients and plant. The batch adsorption experiment gave an insight of the relation between nutrients and soil and finally the pot experiment helped to understand how these three factors (plants, soil and nutrients) are interrelated. The following research questions were raised:
• Which form of selenium (Selenite or selenate) is most absorbed by Italian rye grass at different pH’s?
4

• How does phosphate level in soils interact with selenium in the plant uptake at different pH’s? • To what extent are pH changes responsible for the increment or reduction in plant uptake of
Selenium? • What relations does the Selenium have with other elements like B, P and S at different pH’s?
The following hypotheses have been formulated in order to answer these research questions:
• A pH increment will increase the uptake of selenium in rye grass plants in soil culture experiment.
• A pH increment will decrease the availability of selenite and selenate to rye grass plants in the nutrient solution experiment.
• A high concentration of phosphate will reduce the available adsorption sites in soil and therefore the amount of selenite and selenate available in soil solution will be higher.
• In soil, selenite will be adsorbed the most at acid pH for all soils, but selenate will be more soluble at high pH levels.
2. MATERIALS AND METHODS Due to the magnitude of this research, the part of hydroponic and pot experiment was realized in collaboration with Emilio Lopez Porrero, a master student from the Plant Science Master program. His research was about the effect of pH on the uptake of Boron, therefore the hydroponic and pot experiments were carried out together but Se adsorption experiment was carried out by me and the analysis of data was performed separately. In this way, the combined cost of the investigation was reduced and the goals were reached for both more efficiently. In the following sections the materials and methods are explained in a chronological way.
2.1. First experiment: Nutrient solution culture Plants
The seeds of the test plants, Italian rye grass (Lolium multiflorum L.) were submerged in H2O2 (30%) during 15 minutes in order to sterilize them externally. The sterilized seeds were sown in quartz sand and moistened with demineralized water (180ml/kg sand). The germination took place in a germination box located at the greenhouse of Unifarm (Photos Annex 1). Six kilograms of quartz sand were used as germination bed. After 14 days the seedlings were taken out of the sand and washed with demineralized water to eliminate any rest of sand on their roots and transferred into the nutrient solution.
Nutrient Solutions
One PVC container of 20 liters was used for each treatment. The dimensions of each container were 40 cm x 20 cm x 25 cm (depth). Each container had a PVC cover with 20 holes. The plants were placed in the holes as clapped in polyethylene sponges which had a function of support (Photos Annex 1). Twelve containers were prepared with three levels of pH (4.0, 5.5 & 7.0), two levels of phosphate (low and high) and two types of selenium (selenite and selenate). Each container had 19 plants because one of the holes in the cover was used to keep the air flowing into the nutrient solution.
The nutrient solution for this experiment was prepared using one quarter strength of the concentrations used by Hoagland and Arnon (1950) (Table 1). Two levels of phosphate (high and low) and two forms of Selenium [Selenite (SeO3
2-) and Selenate (SeO42-)] were added. The nutrient solution was continuously
aerated through air pumps. The V-Tech air pump model AP-10 was used. These air pumps provided an air flow of 1.3 liters per minute. The solution was refreshed completely every three days in order to keep the levels of nutrients in the solution. Before refreshment, the containers were cleaned with 0.1 M HCl and demineralized water.
It is important to highlight that the solutions were prepared without the use of glassware in the lab. This procedure was implemented in order to avoid the contamination of external boron.
5

Table 1. Components of Nutrient in Stock Solution and Final Concentration in the Nutrient Solution
Nutrients
Concentration in Stock solution
ml of Stock
solution in 20 L
Final concentration
in 20 L mol/L gr/L
Potassium nitrate (KNO3) 1 101.11 25 1.25 mmol/L
Calcium Nitrate tetrahydrate [Ca(NO3)2.4H2O] 2 472.32 12.5 1.25 mmol/L
Magnesium Sulphate Heptahydrate (MgSO4.7H2O) 1 246.48 10 0.5 mmol/L
Potassium phosphate monobasic (KH2PO4) 1 136.09 5 0.25 mmol/L
Boric acid (H3BO3) * 0.05 2.86 5 12.5 µmol/L
Manganese Sulphate (MnSO4.H2O) * 9.2E-03 1.558 5 2.3 µmol/L
Copper Sulphate Pentahydrate (CuSO4.5H2O ) * 3.2E-04 0.08 5 0.08 µmol/L
Zinc Sulphate Heptahydrate (ZnSO4.7H2O ) * 7.7E-04 0.22 5 0.1925 µmol/L Ammonium Heptamolybdate Tetrahydrated [(NH4)6Mo7O24.4H2O] * 1.59E-05 0.0196 5 0.004 µmol/L
Iron (Fe3+ EDTA) ** 0.1 35 5 25 µmol/L * All these micronutrients were prepared in one common stock solution labelled trace elements ** Iron had its own stock solution due to its tendency to oxidize in the presence of light.
Treatment A full factorial design (Table 2) was implemented with the following factors: 3 levels of pH, 2 levels of phosphate and 2 types of selenium. The experiment had a total of twelve treatments. Two additional containers (control) were added to the experiment in which no pH adjustment was done, whereas the phosphate concentration was the same as “low” and no selenium was added to these two extra containers.
Table 2. Treatments of the hydroponic culture experiment
Treatment pH Phosphate Selenium A 4 High Selenite B 4 High Selenate C 4 Low Selenite D 4 Low Selenate E 5.5 High Selenite F 5.5 High Selenate G 5.5 Low Selenite H 5.5 Low Selenate I 7 High Selenite J 7 High Selenate K 7 Low Selenite L 7 Low Selenate
M not adjusted Low No
Selenium
N not adjusted Low No
Selenium
The levels of pH (4.0, 5.5 and 7.0) were set up by adding HCl or KOH in order to decrease or increase the pH respectively. Measurements using a portable pH-meter were done in order to guarantee a constant pH level for each treatment. The pH of the nutrient solution was adjusted to the desired values before the plants were transferred to the containers and the pH was re-adjusted to the nominal values every day during the growth of plants.
There were two levels of phosphate: low and high. These concentrations were reached by adding the normal amount (0.25 mmol/L, Table 1) or twice the amount of phosphate concentration (0.50 mmol/L) of the ¼ Hoagland’s solution. In order to avoid the addition of more potassium when doubling phosphate concentration, the high concentration of phosphate was obtained by adding monosodium phosphate (NaH2PO4).
6

Finally the forms of selenium in the system were selenate (SeO42-) and selenite (SeO3
2-). Both forms were added as the respective salt of sodium. The concentration of selenium in the nutrient solution was 0.09 ppm (1.14 µmol/L).
The hydroponic culture experiment was conducted in the greenhouse of Unifarm of Wageningen University, at a 20 ⁰C (± 3 ⁰C), and with additional light supplied for 16 hours per day with 400 Watt HPI lamps. The total duration of the hydroponic culture is 23 days (June 27th to July 20th 2014).
Measurements
• Nutrient Concentration in the Hydroponic Culture Solution Two samples of the nutrient solution (50 ml) were collected from each treatment. These samples were taken before and after the last refreshment of the nutrient solution in order to evaluate the effect of uptake of a developed plant on the nutrient concentration in solution.
The samples were collected using a plastic syringe and filtered using a filter membrane (0.45 micro meters) in order to eliminate rest of organic material (especially roots) and any precipitates that may have formed. After filtering, 9 ml of the filtered solution were collected into test tubes. One milliliter of concentrated HNO3 (1.4M) was added to avoid the formation of precipitates. The samples were analyzed on the ICP-AES (Thermo Scientific, Iris Advantage) for Fe, P and Mn or on ICP-MS (Thermo Scientific, Element2) for Se, B, Cu and Zn.
• Biomass All the plants of each treatment were harvested at 23 days after transplant. As mentioned before, each container had 19 plants. Two samples each containing 9 plants were collected from one container (one treatment) for further analysis as duplicates. The length of shoots and roots was measured. Also, the number of tillers was counted. Fresh weight of roots and shoots was measured. The plants were washed with demineralized water to reduce the amount of nutrients attached to the surface of the plants. The root and shoot were then separated. Afterwards the plant material was dried at 70oC during 24 hours. The dry weight of shoots and roots was measured and recorded.
• Element Concentration Analysis After drying and grinding the plant samples, shoots and roots were sent to the laboratory to be
digested by microwave and analyzed for the total content of macro and micronutrients in the plant.
The samples were destructed according to the protocol E1014 from CBLB. Some adjustments were made based on a previous test. About 0.4 g of the dried and milled plant sample was put into a Teflon destruction vessel. 5 mL of concentrated HNO3 was added to the sample and mixed. Afterwards, the destruction vessel was closed and allowed to stand overnight at room temperature (20 ± 1oC). After that, the vessel was put into a microwave to allow the first digestion step to take place. After the digestion program was completed, the sample was taken out, cooled down and 1 mL of H2O2 was added, and the second digestion step in the microwave took place. At the end, the sample was transferred into a 50 mL grainer tube, and the vessel was washed twice with ultrapure water, and finally the volume of the sample was made up to 50 mL by adding ultrapure water. Se and B concentration in the sample were measured using High Resolution ICP-MS (Thermo Scientific, Element2). For the rest of elements (P, S, Fe, Ca, Mn, Cu and Zn) ICP-AES (Thermo Scientific, Iris Advantage) equipment was used. As quality control, a standard reference sample 1573a (tomato leaves) was also analysed using the same method as the plant samples.
2.2. Second experiment: Greenhouse pot experiment Soils Three soils were used: one sandy, one clay and one loamy soil. These soils were collected from the Netherlands by Unifarm of WUR. These soils have been dried and sieved over 2 mm mesh. The soil properties (texture, clay content, Organic matter content, macronutrients, etc.) were measured by NMI-BLGG using Near Infrared Spectroscopy (Table 3). NMI-BLGG suggested the fertilization requirements for each soil based on a potato field production (Table 4). Using NMI suggestion, the
7

amount of fertilizers to be added was calculated with a production goal of 6 grams of dry matter per pot. According to the course of Research Methods in crop Sciences, the DM has a content of 0.3% phosphorus (P) and 3.33% potassium (K). This values were used to calculate the amount of nutrients to apply in the pot experiment.
Table 3. Basic Soil Properties
Soil Clay (%) Soil Organic Matter (%)
CEC mmol+/kg
Water holding capacity (%)
Sandy 2 3.8 59 20.0
Loamy 17 2.7 125 31.4
Clay 21 3.5 184 24.0
Table 4. Fertilization recommendation from BLGG based on potato production
kg/ha/yr.
Clay Loamy Sandy
Nitrogen Correction 0 10 20
Sulphate (SO4) 0 0 10
Phosphate (P2O5) 95 45 340
Potassium (K2O) 255 0 525
Calcium (CaO) 50 60 55
Magnesium (MgO) 0 0 74
Lime (based on an optimal pH of 6.6) 0 675 1280
The elemental concentrations in three extractions were measured in the original soil samples of the sandy, loamy and clay soil used, to determine the content of micronutrients in different fractions and amounts of amorphous Fe and Al oxides and total amount of adsorbed phosphor. Three extractions were performed: calcium chloride extraction, nitric acid extraction and ammonium oxalate extraction. Each of these extractions gave the content of the different fractions in the soil. The ammonium oxalate extraction was used as well to estimate the amount of amorphous iron and aluminum (hydr)oxide in these soils.
• Calcium chloride extraction: to determine the bioavailable amount of elements (extraction with 0.01 M CaCl2, soil : solution ratio 1:10, 2 h shaking). For Se, this method determines the soluble Se concentration.
• Nitric acid extraction: To determine the reactive amount of elements (extraction with 0.43 M HNO3, solution ratio 1:10, 2 h shaking). For Se this method determines total inorganic Se plus some acid soluble organic Se.
• Ammonium oxalate extraction: This method is applicable to the determination of amorphous inorganic Fe and Al oxides and organic complexed Fe and Al from soils. It attacks mostly silicate minerals and goethite and hematite only slightly, but it dissolves magnetite and finely divided, easily-weathered silicates such as olivine to a considerable extent. For Se, this method determines total inorganic Se plus organic Se that is initially adsorbed to oxides. The ammonium oxalate solution contains 16.2 g L-1 ammonium oxalate monohydrate and 10.9 g L-1 oxalic acid dehydrate, pH=3. In the extraction, soil: solution ratio=1:20 and the suspensions were shaken for 2h in the dark.
Acid-base titration curves. It was our initial intention to adjust the pH of the soils to the same pH’s as in the nutrient culture experiment (i.e. 4.0, 5.5 and 7.0). To achieve this goal, the first step was to determine the initial pH of each soil. The pH electrode with a Radiometer (PHM 92 Lab pH Meter with Probe Stand) was used to measure the pH in the 0.01M CaCl2 soil suspension (soil solution ratio 1:10). The initial soil pH is respectively 5.47, 7.34 and 7.47 (Table 5).
The next step was to obtain an acid-base titration curve for each soil in order to estimate the amount of acid and base needed to adjust the pH of each soil to the desired ones. This titration curve was made by taking 10 subsamples of each soil. Each subsample contained 4 grams of soil and was placed into a 50
8

ml polyethylene test tube. The Mettler balance (type PM480, Delta Range) was used to weight the soil samples. Different amounts of sulphuric acid (0.05 M H2SO4) or sodium hydroxide (0.1 M NaOH) were added into the test tubes, then the tubes were filled to 40 ml with calcium chloride (0.01M CaCl2). Afterwards, each sample was mechanically shaken for 96 hours at 20⁰C. Finally, the pH was measured in the suspension and recorded. With the data obtained, three curves were plotted. These curves helped to determine the amount of acid and base needed to adjust the soil pH’s.
Figure 3. Titration curves developed for the pH adjustment (for 4 gram soil in 40 ml 0.01M CaCl2).
pH adjustment of soil. The titration curves obtained above in Figure 3, provided the information about how much acid or base each soil required to change the pH. These curves revealed that in order to reduce the pH of the sandy and loamy soil with one pH unit 0.9 and 1.4 ml of 0.05 M H2SO4 were needed for 4 grams of soil respectively. The application of acid would add an extra amount of sulphate. Therefore, it was not possible to reduce the pH of loamy soil to the desired one because to reach a pH of 4 a huge amount of acid would be needed and toxicity problems of sulphate might appear. The final amount of acid used to reduce the pH for both soils was 0.7ml of acid. Moreover, 0.7 ml and 1.3 ml of 0.1M NaOH were needed to increase the pH with one pH unit of the sandy and loamy soil respectively. The clay soil showed a high pH buffer capacity and it will consume a lot of acid or base to change the soil pH. Due to the large buffer capacity of the clay soil, the experimental setup had to be modified. The final experimental setup had 3 soils with 2 pH’s for sandy and loamy soil and one pH for the clay soil.
To adjust the pH’s of the soils used for the pot experiment, H2SO4, HNO3 and Ca(OH) were used instead of H2SO4 and NaOH. This change was made in order to avoid an excessive use of sulphur and a possible toxic effect of sodium. The amount of acid and base applied are shown in Table 5. Calcium nitrate [Ca(NO3)2] and magnesium sulphate (MgSO4) were added simultaneously to the soils of different treatments in order to compensate the amount of SO4
2- and NO3- added (Table 6) as acids to the
treatments with lowered pH. Finally, the corresponding amounts of acid and base were added to the amount of soils needed for each treatment (each pot contains 1.8 kg dry soil) and the soils were wetted with demineralized water until 60% of its water holding capacity. The soils were put into plastic bags and placed in the shade of the greenhouse during 4 weeks.
During the calculations an error was made and 10 times more Ca(OH)2 was added to the soils, however the mistake was identified and corrected soon enough therefore none of the results were compromised. To correct our mistake one kilogram of soil with 10 times more Ca(OH)2 was mixed with 9 kg of original soil.
Soil water holding capacity. In order to implement the soil incubation, the water holding capacity of each soil was determined. To do this, 100 grams of each soil were placed into a plastic cup. The weight of the cup and the soil was recorded. Using a dispenser bottle, water was added to the soils and the mixture was mixed manually using a spoon until it was homogenized. This process was repeated until water
3
3.5
4
4.5
5
5.5
6
6.5
7
7.5
8
-4 -2 0 2 4 6 8 10 12
pH
acid (ml)
Sandy
Loamy
Clay
9

started to drain out of the soil. Then the weight of the sample was measured and recorded. The difference in weight between the first and last measurement is the water holding capacity for the 100 grams of soil. The results can be found in Table 3.
Table 5. Amount of acid and base added to adjust the soil pH.
Soil Original pH Acid and Base Amount added per kg Total Added/30kg Final
pH Desired
pH
Sandy 5.47 H2SO4 + HNO3 * 70 ml + 107.15 ml 1050 ml + 1607.5 ml 4.82 4.6
Loamy 7.34 H2SO4 + HNO3 * 70 ml + 107.15 ml 1051 ml + 1607.5 ml 7.34 6.5
Sandy 5.47 Ca(OH)2 1.9g 55.56 g 7.65 7
Loamy 7.34 Ca(OH)2 1.2g 36.30 g 7.8 8
Clay 7.47 None None None 7.47 7.47 * Concentration of Acids: H2SO4 (0.1M); HNO3 (0.2M). Final pH: after incubation time 4 weeks
After 4 weeks incubation, the soil pH was measured (in 0.01M CaCl2 suspension) and recorded. It was found that the pH of the loamy soil was not changed as much as expected, therefore the final pH was not the desired one and the interval between the two pH levels achieved is too small. Because it is not desirable to add even more acid to the loamy soil otherwise the amount of SO4 or NO3 added would be too large, we decided to increase the pH of the base-treated loamy soil further to create a larger pH interval between the two pH levels of the loamy soil. To increase the pH of the loamy soil further, 3 kilograms of loamy soil (with 10 times more Ca(OH)2 added and incubated for 4 weeks) were mixed with 27 kg of the incubated loamy soil with Ca(OH)2 already added. Then, the final pHs of all the soils were within 10% error from those desired, except that of acid-treated loamy soil (Table 5).
Potting and Soil fertilization. Afterwards, polyethylene pots of 2 kg of capacity were filled up with 1.8 kg (dry weight equivalent) of each soil. In the middle of each pot, one PVC pipe was inserted to until one third of the height of the pot of the soil (Photos Annex 2). Fertilizer solutions were added through the pipe to guarantee a normal supply of nutrients. The amount of fertilizers added was calculated with an objective of production of 6 grams of dry matter (Table 6). The recommendations of BLGG for conventional farming management (Table 4) were taken into account for the calculations. A solution of selenite (as sodium selenite) was added to the soils to simulate a bio-fortification with a dose of 2 grams of Selenium per hectare (using 1300 kg/m3 as soil density, which leads to 2.6x10⁶ kg of soil per hectare in the top 20 cm layer). Finally, a germination layer made with quartz sand was set on the top of soils in each pot.
Table 6. List of Fertilizers added to the pots.
Soil Nutrient Treatment mg/kg
soil Amount/ha Chemical
Form Soils with no acid added
N * All
150 390 kg N Ca(NO3)2
S * 110 286 kg S MgSO4
Clay
P
Low P 9.3 24.18 kg P
KH2PO4
High P 18.6 48.36 kg P
Sandy Low P 10 26 Kg P High P 20 52 Kg P
Loamy Low P 7.6 19.76 Kg P High P 15.2 39.52 Kg P
Clay
K
Low P 32 83.2 Kg K
KCl High P 21 54.6 Kg K
Sandy Low P 97 252.2 Kg K High P 85 221 Kg K
Loamy All 0 0
All Soils
Selenium All 7.66E-04 2 g Se Na2SeO3 Boron ** High B 0.75 1.95 kg B H3BO3 Manganese All 0.7 1.83 kg MnSO4.H2O Zinc All 2.80E-05 73.4 g ZnSO4.7H2O Copper All 7.00E-05 182 g CuSO4.5H2O Iron All 7.75 20.16 kg Fe-EDTA
10

* Applied for correction of extra N and S added during pH adjustment. ** Low Boron treatments only contained the original boron content of each soil without B fertilization
Plants Plants of Italian Rye Grass variety were grown directly in the pots. The pots were kept in the greenhouse. One gram of seeds per pot were spread over a germination layer and then covered with plastic sheets until germination occurred. After germination, the pots were placed inside a greenhouse with controlled environmental conditions at a 20 ⁰C (± 3 ⁰C), and with additional light supplied for 16 hours per day with 400 Watt HPI lamps. Additionally the pots were weighted with the purpose of determine the amount of water that was needed to maintain 60% of the water holding capacity. The pots were watered every day with demineralized water. The location of the pots on the table in greenhouse was changed during each watering step to better homogenize their environmental conditions.
Treatment An incomplete multifactorial experiment was performed with 4 factors. The factors were: three types of soil, two levels of pH, two levels of Boron and two levels of phosphate (Table 7). Each treatment contained three replicates (pots). In all treatments, a solution of sodium selenite (Na2SeO3) was applied to the soil before sowing the seeds. The concentration of selenium was 2 grams Se per hectare (Bitterli, Banuelos, & Schulin, 2010; Wang, Wang, Mao, Zhao, & Huang, 2013), which is equivalent to 1.38 µg Se/pot (Table 6).
Table 7. Treatments of the pot experiment
Treatment soil pH B (mg/pot) P (mg/pot) 1 sandy 4.5 0* 18 2 sandy 4.5 0* 36 3 sandy 4.5 1.35 18 4 sandy 4.5 1.35 36 5 sandy 7.5 0* 18 6 sandy 7.5 0* 36 7 sandy 7.5 1.35 18 8 sandy 7.5 1.35 36 9 loamy 7.0 0* 13.6 10 loamy 7.0 0* 27.2 11 loamy 7.0 1.35 13.6 12 loamy 7.0 1.35 27.2 13 loamy 8.0 0* 13.6 14 loamy 8.0 0* 27.2 15 loamy 8.0 1.35 13.6 16 loamy 8.0 1.35 27.2 17 clay 7.5 0* 16.7 18 clay 7.5 0* 33.4 19 clay 7.5 1.35 16.7 20 clay 7.5 1.35 33.4
* Boron content for this treatment was the original content of boron in the soil Measurements • Element Concentration in 0.01M CaCl2 Soil extracts Soil samples were taken from the pots after harvesting. Roots were removed by hand, and the samples were dried during 24 hours at 40OC. After drying, samples were sieved up to 2mm. Then four grams of sample were put into 50 ml test tubs. Later, 40 ml of 0.01M CaCl2 were added and the suspensions were shaken during two hours at 20OC. The pH of the suspension was measured and recorded. Afterwards, samples were centrifuged at 3000 rpm during 10 minutes. Using a 0.45 µm filter and a syringe the supernatant was filtered. The first 10 ml of the supernatant were used for ICP-AES (Thermo Scientific, Iris Advantage) measurements of P and Mn. The following 10 ml were used for dissolved organic carbon analyses using a segmented flow analyzer (SFA; 3039 Skalar, The Netherlands). The rest of the supernatant was distributed for analyses of Se, B, Cu, Zn with ICP-MS (Thermo Scientific, Element2).
11

Except for DOC samples, all samples were acidified with nitric acid to prevent adhesion of the elements to the test tube. The final concentration of the samples was 0.14 M HNO3. Finally these extracts were delivered to CBLB laboratory for further analysis. • Biomass and Element Concentration Analysis After 4 weeks of growing, the grass was cut above the soil surface and fresh weight of shoots was measured. After washing them with demi water, the plants were dried at 75oC during 24 hours, and the dry weight of shoots was measured. After grinding, the material was delivered to the CBLB laboratory for the microwave digestion and analysis of the macronutrient P, and micronutrient Se, B, Cu, Fe, Mn, Ca, S and Zn, as explained in the hydroponic experiment. 2.3. Third experiment: Adsorption Experiment Adsorption isotherm experiment Soils The same soils as used in the greenhouse pot experiment were used in the adsorption isotherm experiment (sandy, clay and loamy). Soils were collected after the incubation period before the pot experiment.
Treatment The adsorption solutions were prepared by diluting the sodium salts of selenite and selenate with a solution of 0.01M CaCl2. An incomplete factorial experiment was performed. The factors for this experiment were three types of soil, different levels of pH (two levels of pH for the sandy soil, one pH level for loamy and clay soil), and two forms of Selenium (selenite and selenate) for all the soils and pH’s. Two replicates were included for each treatment. A range of Se concentration was added to obtain the adsorption isotherms. The experiment had a total of 56 treatments. The treatments are showed in Table 8.
Three grams of each soil were weighted and put into 50 ml centrifuge tube and 30 ml of the adsorption solution corresponding to the treatment were added. The suspensions were shaken during 96 hours at 20oC.
Table 8. Treatments of Adsorption Isotherm Experiment
Soil Type pH Form
Se Concentration
(mg Se/L) Treatment Soil Type pH Form
Se Concentration
(mg Se/L) Treatment
Sandy 4.8 SeO3 0.1 A1 Loamy 7.5 SeO3 0.1 A29 Sandy 4.8 SeO3 0.2 A2 Loamy 7.5 SeO3 0.2 A30 Sandy 4.8 SeO3 0.5 A3 Loamy 7.5 SeO3 0.5 A31 Sandy 4.8 SeO3 2.3 A4 Loamy 7.5 SeO3 2.3 A32 Sandy 4.8 SeO3 4.6 A5 Loamy 7.5 SeO3 4.6 A33 Sandy 4.8 SeO3 11.4 A6 Loamy 7.5 SeO3 11.4 A34 Sandy 4.8 SeO3 22.8 A7 Loamy 7.5 SeO3 22.8 A35 Sandy 4.8 None 0 A8 Loamy 7.5 None 0 A36 Sandy 4.8 SeO4 0.1 A9 Loamy 7.5 SeO4 0.1 A37 Sandy 4.8 SeO4 0.2 A10 Loamy 7.5 SeO4 0.2 A38 Sandy 4.8 SeO4 0.4 A11 Loamy 7.5 SeO4 0.4 A39 Sandy 4.8 SeO4 2.1 A12 Loamy 7.5 SeO4 2.1 A40 Sandy 4.8 SeO4 4.2 A13 Loamy 7.5 SeO4 4.2 A41 Sandy 4.8 SeO4 10.4 A14 Loamy 7.5 SeO4 10.4 A42 Sandy 7.5 SeO3 0.1 A15 Clay 7.6 SeO3 0.1 A43 Sandy 7.5 SeO3 0.2 A16 Clay 7.6 SeO3 0.2 A44 Sandy 7.5 SeO3 0.5 A17 Clay 7.6 SeO3 0.5 A45 Sandy 7.5 SeO3 2.3 A18 Clay 7.6 SeO3 2.3 A46 Sandy 7.5 SeO3 4.6 A19 Clay 7.6 SeO3 4.6 A47 Sandy 7.5 SeO3 11.4 A20 Clay 7.6 SeO3 11.4 A48 Sandy 7.5 SeO3 22.8 A21 Clay 7.6 SeO3 22.8 A49 Sandy 7.5 None 0 A22 Clay 7.6 None 0 A50 Sandy 7.5 SeO4 0.1 A23 Clay 7.6 SeO4 0.1 A51 Sandy 7.5 SeO4 0.2 A24 Clay 7.6 SeO4 0.2 A52 Sandy 7.5 SeO4 0.4 A25 Clay 7.6 SeO4 0.4 A53 Sandy 7.5 SeO4 2.1 A26 Clay 7.6 SeO4 2.1 A54 Sandy 7.5 SeO4 4.2 A27 Clay 7.6 SeO4 4.2 A55 Sandy 7.5 SeO4 10.4 A28 Clay 7.6 SeO4 10.4 A56
12

Measurement
After 96 hours shaking, pH was measured in the suspension. Then the samples were centrifuged at 3000 rpm during 10 minutes to obtain a supernatant. Using a 0.45 µm filter and a syringe the supernatant was filtered. The first 10 ml of the supernatant were used for inorganic phosphate measured in a segmented flow analyzer-SFA-CaCl2 (3039 Skalar, The Netherlands). The following 10 ml were used for dissolved organic carbon analyses with a TOC analyzer (Shimadzu). The rest of the supernatant was distributed for analyses of Se and Ca with ICP-MS (Thermo Scientific, Element2) and ICP-AES (Thermo Scientific, Iris Advantage) respectively. The samples for selenium were diluted 50 times for the low concentrations and 1000 times for the high concentrations with a solution of HNO3 0.14M. The samples for Ca analyses were diluted 10 times using a solution of HNO3 (0.14M) because the background extraction was a 0.01 M CaCl2.
The measurement of Se concentrations in solution was performed by CBLB laboratory. Even though the content of Selenium in solution was high, the Se concentrations were measured on ICP-MS after diluting the samples because there is no protocol for the analysis of selenium with IPC-AES in the lab. The samples were analyzed using the ICP-MS equipment (Thermo Scientific, Element2). 2.3.1. pH-Edge adsorption Experiment Soils The (original: no pH adjustment, no fertilization) same sandy soil as used in the pot experiment was used for this experiment. The soil was proportioned by Unifarm greenhouses. The soil was dried at 40oC before sieving through a 2mm screen to remove gravel and roots.
Solutions Initially in the experimental design selenite and selenate would be used but, due to the almost non existing adsorption of selenate to the available soils, as discovered from the previous experiment, selenate was discarded.
The solution was prepared by diluting salts of selenite with 0.01M CaCl2. The concentration of the stock solution used for this experiment was 1000 mg Se/l. No replicates were used due to the trend over the series of Se concentration will be more or less continuous. The treatments are showed in Table 9.
Treatment Three grams of the sandy soil were weighted and put into 50 ml centrifuge tube. 15 ml of a 0.02M calcium chloride (CaCl2) were added. Afterwards acid (HCl) or base (KOH) was added in order to change the pH of the suspension to the desired ones. The samples were shaken during 72 hours at 20oC. After the 72 hours, pH of each sample was measured and corrected if necessary. Then 0.66 ml of selenite solution (1000mg Na2SeO3/l) was added and each tube was filled up with UPW to 30 ml. The final soil: solution ratio is 1:10. The final CaCl2 concentration is 0.01M, and the final Se concentration is 10 mg/l. Later, the samples were shaken during 96 hours at 20oC.
After the 96 hours, pH of the suspension was measured again. Each sample was centrifuged. The supernatant was filtered over 0.45 μm filter.
Measurement Calcium concentration was measured with ICP-AES (Thermo Scientific, Iris Advantage). Se concentration in solution was measured with ICP-MS (Thermo Scientific, Element2). The extracts were diluted with HNO3 (0.14M) due to the concentration of selenium was too high for the measurements with ICP-MS. Inorganic and Total carbon were measured using a TOC analyzer (Shitmadzu). Phosphate concentration was measured with SFA-CaCl2 (3039 Skalar, The Netherlands). The measurement was performed by CBLB laboratory.
13

Table 9. Treatments for the selenium pH-edge adsorption experiment
Soil Type pH Form
Se
Concentration added (mg
Se/l) Treatment
Sandy 4.0 SeO3 10 E1 Sandy 4.5 SeO3 10 E2 Sandy 5.0 SeO3 10 E3 Sandy 5.5 SeO3 10 E4 Sandy 6.0 SeO3 10 E5 Sandy 6.5 SeO3 10 E6 Sandy 7.0 SeO3 10 E7 Sandy 7.5 SeO3 10 E8 Sandy 8.0 SeO3 10 E9 Sandy 8.5 SeO3 10 E10 Sandy 9.0 SeO3 10 E11 Sandy 4.0 None 0 E12 Sandy 4.5 None 0 E13 Sandy 5.0 None 0 E14 Sandy 5.5 None 0 E15 Sandy 6.0 None 0 E16 Sandy 6.5 None 0 E17 Sandy 7.0 None 0 E18 Sandy 7.5 None 0 E19 Sandy 8.0 None 0 E20 Sandy 8.5 None 0 E21 Sandy 9.0 None 0 E22
2.4. Data Analysis All the data analysis was performed using the GenStat Statistics 17th Edition software. The Shapiro-Wilk test of normality and the Barlett’s test of homogeneity were performed in order to determine that our data fulfil the assumptions needed for the parametric tests like ANOVA and regression.
Analysis of variance (ANOVA) was performed to compare different groups of data if possible. Several regression analyses were performed to determine which variable could best explain the data obtained from the experiments.
3. RESULTS 3.1. Result from Nutrient Solution Experiment 3.1.1. pH adjustment In the hydroponic experiment, the targeted pH of the three levels is 4.0, 5.5 and 7.0 (Table 2). Every day during the growth of the plant, the pH was re-adjusted to the target value using HCl and KOH. In Figure 4, the amount of acid and base consumed each day can be found. The periodical patterns shown in the figures are related to the refreshment of the nutrient solution every 4 days. The acid/based used at the beginning of each cycle were those used to adjust the pH of the fresh nutrient solution to the targeted values, for which acid was needed for pH 4.0 and base was needed for pH 5.5 and pH 7.0.
For pH 4.0 and pH 5.5 treatments, acid was needed between the soluble refreshment to maintain the pH, which can be a result of nitrate plant uptake. It shows that at the end of the experiment more acid (Figure 4a and 4b) was needed to reach the targeted pH’s of 4.0 and 5.5. This is related to the increment in consumption of nitrate. At the last stage of the experiments plants were bigger and they needed more nitrogen to grow. It is known that plants tend to excrete OH- during the absorption of nitrate. In all treatments the nutrient solution tends to have an increase in pH. Compared to the pH 4.0 treatments, a
14

bit less acid was consumed to re-adjust the pH in the pH 5.5 treatments due to the higher targeted pH. There is no obvious difference between the two P levels and the two Se forms in the acid consumption.
Figure 4. Amount of Acid and Base added per day in the hydroponic experiment to reach pH 4.0 (a), 5.5 (b) and 7.0 (c).
For the pH 7.0 treatments, base instead of acid was needed to maintain the pH, which can be attributed to the pH drop caused by CO2 dissolution. However, the same behavior of pH increase due to nitrate uptake as in the pH 4.0 and 5.5 treatments was observed in treatments of pH 7.0 (Figure 4c). pH tended to increase therefore less base was needed to reach the targeted pH. Between day 16 to 24 the pH tended to pass the limit of 7.0, and consequently acid was applied (negative values in the graph) to lower the pH. Something to highlight is that more base was needed to increase the pH in the treatments with high level of phosphate due to probably the buffer from phosphate.
(a)
0
1
2
3
4
5
6
0
5
10
15
20
25
30
0 4 8 12 16 20
pH
O.1
M H
Cl (m
l)
AcidpH 4.0
(b)
01234567
-5
0
5
10
15
0 4 8 12 16 20 24
pH
0.1
M H
Cl (m
l)
AcidpH 5.5
(c)
012345678
-100
10203040506070
0 4 8 12 16 20 24
pH
0.1
M K
OH
(ml)
Time (days)
Base High PO4 Base Low PO4 pH 7.0
15

Figure 5. Variation of pH from the extra “control” treatments.
Figure 5 shows the pH variation of the extra “control” treatments. The initial pH of the nutrient solution without pH adjustment was around 5.4. It is visible that pH tended to increase between refreshments of the nutrient solution. Between day 0 and 4, pH from control 2 seems to be relatively stable, this difference was because that this treatment received air bubbling only after the first refreshment. It might be that lack of aeration of control 2 in the first 4 days limited plant root growth and nutrient uptake. Additionally, from day 16 to 24 the increase in pH was higher due to the bigger size of plants which required more nutrients to grow specially nitrogen. This phenomenon was similar to that observed in other treatments.
3.1.2. Biomass After the hydroponic experiment, the length, fresh weight and dry weight of shoot and root were measured. These plants were 5 weeks (35 days) old starting from germination and have been grown in the nutrient solution with treatments for 3 weeks (23 days).
The Shapiro-Wilk’s test (Shapiro & Wilk, 1965) and visual inspection of their histograms, normal Q-Q plots and box plots showed that the residues [g/pot] from the Shoot Dry weight (p=0.478) and roots dry weight (p=0.437), were approximately normally distributed. In the same way, a Bartlett’s test showed that variances from the residues [g/pot] of Shoot Dry weight (p=0.951) and Root Dry Weight (p=0.831) were homogeneous.
The Analysis of variance showed that there is no significant differences (p>0.05) among means of the different treatments made by interaction between factors of this experiment (pH, Form of Se and PO4 levels) on the biomass of grass plant (Dry matter of shoots and dry matter of roots. Figure 6 shows the comparison between biomass for the different treatments from shoots (6a) and roots (6b).
Figure 6a and 6b. Biomass of Shoot (left) and Roots (right) from the different treatments of the hydroponic experiment. The shoot and root biomass for the control treatment is respectively 1.91±0.21 and 0.60±0.06 grams of DM per replicate.
5.0
5.5
6.0
6.5
7.0
0 4 8 12 16 20 24
pH
Time (days)
pH Control 1pH Control 2
0.0
0.5
1.0
1.5
2.0
2.5
High-P Low-P High-P Low-P High-P Low-P
4 5.5 7
DM (g
per
repl
icat
e)
Selenite Selenate
0.0
0.2
0.4
0.6
0.8
High-P Low-P High-P Low-P High-P Low-P
4 5.5 7
DM (
g pe
r rep
licat
e)
Selenite Selenate
16

An analysis of variance was performed using the variable shoot-root ratio. There was a highly significant interaction effect between the level of pH (4.0, 5.5 and 7.0) and the form of selenium applied (selenite or selenate), on the shoot root ratio. F (2, 12) =23.32, p<0.001,whereas there was no significant effect of P level; Figure 7 shows the shoot-root ratio of the different treatments in the hydroponic experiment. The S/R ratio of the control treatments (no pH adjustment, no Se added) was S/R=3.14. S/R ratios were lower when selenium was applied as selenite than when it was applied as selenate at pH 4.0 and 5.5. At pH 7.0 the opposite occurred and S/R ratios were higher when selenite was applied compared to when selenate was applied. In the treatments with selenate, the S/R ratios were higher than in the control for all treatments except for treatment with pH 5.5 and high P. Phosphate did not show an effect or interaction with other factor over the shoot root ratio. Results show that at the concentration used, selenite has reduced the root growth at relatively low pH (4.0, 5.5). The reason of this effect is unclear.
Figure 7. S/R ratios of the hydroponic experiment compared against pH levels and form of Selenium
applied.
3.1.3. Change of nutrient concentration in the hydroponic solution Two samples of the nutrient solution (50 ml) were collected from each treatment. These samples were taken before and after the last refreshment of the nutrient solution in order to evaluate the effect of uptake of a developed plant on the nutrient concentration in solution. The results of this analysis can be found in Table 10.
Table 10. Change in nutrient concentration in the hydroponic solution.
Data from Table 10 are represented in Figure 8 for better interpretation. The results show that concentrations of almost all elements in nutrient solution decreased after 3 days of refreshment and the decrease becomes larger when pH increases. Manganese showed the most radical behavior at pH 7.0 when almost no Mn was found in solution. Zn showed a higher concentration in solution at pH 7.0.
a c bc
d d
ab
0
1
2
3
4
4 5.5 7
S/R
ratio
pH
Selenate Selenite
Treatment pH Phosphate Selenium Fe Mn P B Cu Se ZnLevel Level Form [mg/l] [mg/l] [mg/l] [µg/l] [µg/l] [µg/l] [µg/l]
A original High-P Selenite 1.13 0.12 15.21 133.20 4.70 85.47 13.21
AH 4 High-P Selenite 0.94 0.11 13.80 124.00 2.32 75.40 9.70
EH 5.5 High-P Selenite 0.84 0.09 13.60 137.00 2.87 81.50 8.10
IH 7 High-P Selenite 0.74 0.02 13.30 121.00 2.44 82.40 9.40
C original Low-P Selenite 1.10 0.12 7.33 129.87 4.62 83.47 12.88
CH 4 Low-P Selenite 0.96 0.11 6.28 120.00 3.21 76.10 9.90
GH 6 Low-P Selenite 0.83 0.06 6.09 132.00 1.96 78.10 4.50
KH 7 Low-P Selenite 0.78 0.00 6.29 128.00 2.25 79.90 9.20
B original High-P Selenate 1.13 0.12 15.10 134.31 4.76 80.81 14.21
BH 4 High-P Selenate 0.90 0.11 13.70 128.00 3.22 75.40 8.40
FH 6 High-P Selenate 0.78 0.08 13.40 135.00 2.65 79.40 3.70
JH 7 High-P Selenate 0.80 0.00 13.60 132.00 2.87 76.10 15.70
D original Low Selenate 1.15 0.12 7.70 139.86 5.16 85.69 15.21
DH 4 Low-P Selenate 0.98 0.11 6.39 124.00 3.12 79.10 9.00
HH 6 Low-P Selenate 0.84 0.07 5.96 129.00 2.36 75.00 5.30
LH 7 Low-P Selenate 0.83 0.01 6.29 128.00 2.64 78.10 9.70
Control Before Harvest Low-P No Selenium 1.13 0.12 7.45 134.87 5.14 0.02 13.82
Control After Harvest Low-P No Selenium 0.87 0.01 6.27 127.00 2.67 0.03 6.95
17

Regarding Se, the concentration change is small in all treatments compared to the original concentration. The change of the concentration can be caused by plant uptake and/or possible precipitation. And measurement error can also contribute to a few percent of changes. In conclusion, Se concentration in the nutrient solution remained to a large extent stable during the experiment.
Figure 8. Change in nutrient concentration for the different treatments: High P and Selenite (a), Low P and Selenite (b), High P and Selenate (c) and Low P and Selenate (d).
3.1.4. Se content in plants Plant samples from the hydroponic experiment were analyzed for their elemental content. The results for Se content in the shoot and root can be found in Table 11. For comparison, the plant S and P content are also shown in Table 11.
Table 11. Content of Se, P and S in shoots and roots of plant samples from the hydroponic experiment
(a)
1
10
100
1000
10000
100000
Initial 4 5.5 7
Conc
entr
atio
n of
Ele
men
ts [u
g/L]
pH
(b)
1
10
100
1000
10000
100000
Initial 4 6 7
Conc
entr
atio
n of
Ele
men
ts [u
g/L]
pH
(c)
1
10
100
1000
10000
100000
Initial 4 6 7
Conc
entr
atio
n of
Ele
men
ts [u
g/L]
pH
(d)
1
10
100
1000
10000
100000
Initial 4 6 7
Conc
entr
atio
n of
Ele
men
ts [u
g/L]
pH
18

Shoots Roots pH Level Form Se P S Se P S P Se µg/kg g/kg g/kg µg/kg g/kg g/kg 4 High Selenite 34731.4 6.94 2.7 79101.7 6.6 2
5.5 High Selenite 8274.2 7.32 2.7 32123.3 7 1.9 7 High Selenite 7765.3 7.19 2.8 36245.8 6.4 2.4 4 Low Selenite 31093.6 6.85 2.7 70968.7 6 1.9
5.5 Low Selenite 7691.2 7.69 2.8 31361.2 7.4 2.1 7 Low Selenite 7676.7 7.01 2.8 50092.7 6.6 2.4 4 High Selenate 12994 6.56 2.9 7192.3 6.3 2.1
5.5 High Selenate 11484.5 6.7 2.8 6402.2 6.2 2 7 High Selenate 12421.5 7 3 7595.9 6.2 2.7 4 Low Selenate 13978.2 7.34 3 7334 5.9 2
5.5 Low Selenate 11358 7.12 2.8 6682.3 6.2 2 7 Low Selenate 13254.1 7.77 3.1 7240 6.7 2.3
Control Control None 82.9 7.21 2.7 507.1 6.1 2 Control Control None 143.7 7.56 2.9 451.9 6.4 2.1
Uptake efficiency
In the “control” treatment, in which pH was not controlled and no Se was added (Table 2), the Se content in the shoots and roots was respectively 82.9-143.7 and 507.1-451.9 µg/kg (Table 11). In these treatments, no Se was added to the nutrient solution. These amounts of Se found in the plants can come from impurities of other chemicals, from air deposition, or from the seeds.
In the treatments with Selenite added, the Se content in the shoot ranges from 7.6 to 34.7 mg/kg and in the roots from 31.4 to 79.1 mg/kg, which correspond to a ratio between Se-plant/Se-solution of 84.4-385.5 for the shoot, and 348.8-878.8 for the root. In the treatment with selenate added, the Se content in the shoot ranges from 11.3 to 13.9 mg/kg, and in the root from 6.4 to 7.6 mg/kg, which correspond to a ratio between Se-plant/Se-solution of 125.56-154.44 for the shoot, and 71.1-84.4 for the root. The concentration of Se added to the nutrient solution was 0.09 ppm (1.15µmol/L).
The Se uptake efficiency can be compared to that of S. The S content in the plant ranges from 2.7 to 3.0 g/kg in the shoot, and 1.9 to 2.7 g/kg in the root. 0.50 mmol/L S (0.016 g S/L) has been added to the nutrient solution (Table 1). The S-plant/S-solution ratio is 168.75-187.5 for the shoot and 118.75-168.75 for the root. Compared to S, the Se uptake efficiency ranges from 50% to 228% in shoots and from 294% to 522% in roots of the S uptake efficiency in the same treatment when selenium is applied as selenite. In the treatment with selenate, Se uptake efficiency ranges from 74.4 to 82.4% in shoots and 50 to 60% in roots of the S uptake efficiency in the same treatment. It shows that Se can be effectively taken up when present in the soluble inorganic form. The uptake efficiency of selenite can be even higher than S, although S is a plant nutrient whereas Se is not considered as a plant nutrient element. The uptake efficiency of Se when applied as selenate is much lower than that when applied as selenite, and the uptake efficiency of selenate is also lower than that of S.
Effects of treatments: pH, Se form, P level
The Shapiro-Wilk’s test (Shapiro & Wilk, 1965) and visual inspection of their histograms, normal Q-Q plots and box plots showed that the residues from the logarithm in base 10 of the selenium content in shoots (µg/kg; p=0.51) and the logarithm in base 10 of the content of selenium in roots (µg/kg; p=0.704) were approximately normally distributed. In the same way, a Bartlett’s test showed that variances from the residues of the logarithm in base 10 of the content of selenium in shoots (µg/kg; p=0.457) and the logarithm in base 10 of the content of selenium in roots (µg/kg; p=0.096) were homogeneous.
There was a highly significant interaction effect between the level of pH (4.0, 5.5 and 7.0) and the form of selenium applied (selenite or selenate), on the logarithm of the content of selenium in shoots [µg/kg]. F (2, 12) =358.76, p<0.001; an interaction effect between Level of phosphate (high and low) and form
19

of selenium also showed significance [F (1, 12) =5.26, p=0.041]. In Figure 9a, the content of selenium in the shoot as a function of pH can be observed for the two types Se treatments and two levels of P treatments. The content of selenium in shoots is more than 2 times higher when Se is provided as selenite than when Se was supplied as selenate at low pH (4.0). At pH 5.5 a change of this order is observed and the content of selenium in shoots is higher when supplied as selenate than when supplied as selenite. pH has shown a strong effect on Se uptake when Se was supplied as Selenite in the pH range of 4.0-5.5. Se content in the shoot at pH 4.0 was more than 4 times higher than at pH 5.5 and 7.0 in the selenite treatment. Between pH 5.5 and pH 7.0, the pH effect is very small. For the selenate treatment, the pH effect over the whole pH range is small, with the highest Se-shoot observed at pH 4.0 and lowest at pH 5.5 and the difference is less than 20%. Even though the analysis of variance showed an interaction between level of P and form of selenium, the two times change in phosphate concentration in the nutrient solution did not have a clear effect on selenium in shoot. This was confirmed when the Fisher protected LSD analysis couldn’t found a categorization for the treatments. There was a highly significant interaction effect between pH (4.0, 5.5 and 7.0) and the form of selenium applied (selenite or selenate), on the logarithm of the content of selenium in roots [µg/kg]. F (2, 12) =30.95, p<0.001; In Figure 9b, the content of selenium in roots is presented as a function of pH for the different treatments. In this case the content of selenium is 4-10 times higher when selenite was provided than when selenite was provided. It shows that selenite was much more easily taken up by the roots than selenate. The pH effect on Se in root is similar to that on Se in shoot, but a minimum of Se-root was seen at pH 5.5 for both the selenite and selenate treatment. Again, the biggest change with pH was observed for the selenite treatment between pH 4.0 and 5.5. Phosphate levels did not show a significant effect on Se uptake in all treatments. Nevertheless, in treatment with selenite and pH 7.0, an increase of P level in the nutrient solution has led to about 30% decrease of Se in the root.
Figure 9a and 9b. Variation in Selenium content in shoots (left) and roots (right) along the pH gradient. Translocation from root to shoot
The ratio of Se content in the shoot to that in the root can be found in Table 12. It can be seen that this ratio is higher when selenium was applied as Selenate rather than when Selenium was applied as selenite. This shows that selenate was more efficiently translocated from roots to shoots. On the other hand, in treatments where selenium was applied as selenite, it tends to accumulate in the roots therefore these ratios are smaller. Two times changes in the amount of phosphate did not show any effect on the efficiency of Se translocation. pH variation did not affect the translocation of Se from root to shoots in the treatments with selenate. Meanwhile, ratios in the treatments with selenite did show a tendency to decrease when pH increases (Figure 10), i.e. when selenite was supplied, less Se was transported from roots to shoots at higher pH than at low pH. Overall, for selenate, pH has shown a relatively small effect on both the amounts of uptake in shoot and root and the ratio of Se-shoot to Se-root. For selenite, the increase of pH from 4.0 to 5.5 has not only reduced the absolute amount of Se taken up to shoot and root, but also has reduced the Se transport from root to shoot. As a result of the reduced transport from root to shoot at high pH, although Se-root in the selenite treatment is much higher than in the selenate treatment (Figure 9), the Se-shoot is higher in the selenate treatment than in the selenite treatment. Selenate is less easily taken up by the root compared to selenite, but more mobile in the plant.
0.0
0.5
1.0
1.5
2.0
2.5
3.0
3.5
4.0
3.5 4.5 5.5 6.5 7.5
ug S
e/ k
g DM
x
1000
0
pH
SeO3 High PSeO3 Low PSeO4 High PSeO4 Low P
0.0
1.0
2.0
3.0
4.0
5.0
6.0
7.0
8.0
9.0
3.5 4.5 5.5 6.5 7.5
ug S
e/ k
g DM
x
1000
0
pH
SeO3 High PSeO3 Low PSeO4 High PSeO4 Low P
20

Table 12. Shoot Root ratio of the content of Se, P and S.
pH P level Se shoot/root Se P S
4 High Selenite 0,44 1,05 1,35 4 Low Selenite 0,44 1,14 1,42
5,5 High Selenite 0,26 1,05 1,42 5,5 Low Selenite 0,25 1,04 1,33 7 High Selenite 0,21 1,12 1,17 7 Low Selenite 0,15 1,06 1,17
4 High Selenate 1,81 1,04 1,38 4 Low Selenate 1,91 1,24 1,50
5,5 High Selenate 1,79 1,08 1,40 5,5 Low Selenate 1,70 1,15 1,40 7 High Selenate 1,64 1,13 1,11 7 Low Selenate 1,83 1,16 1,35
Control Control None 0,16 1,18 1,35 Control Control None 0,32 1,18 1,38
Figure 10. Variation in Ratio of Selenium content for the different treatments
Comparison with S uptake
Se is chemically similar to S in many ways, therefore the results of S uptake are plotted in Figure 11a and 11b for comparison with Figure 9a and 9b. Figure 11a shows the content of sulphur in the shoot as a function of pH for the two types of Se treatments and two levels of P treatments.
The content of sulphur in shoots is approximately 10 - 12% higher when Se was provided as selenate than when Se was supplied as selenite at low and high pH (4.0 and 7.0). At pH 5.5 no change is observed and the content of sulphur in shoots is equal when selenium is added as selenite or selenate. pH has shown a strong effect on S uptake when Se was supplied as Selenate between pH 4.0 and 5.5. Sulphur content in the shoot at pH 4.0 was 10 to 12% higher than at pH 5.5 in the selenate treatment. Between pH 5.5 and pH 7.0, the pH effect is also strong, but now pH 5.5 has 10-12% less S in shoots than pH 7.0. For the selenite treatment, the pH effect over the whole pH range is small, with the highest S-shoot observed at pH 7.0 and lowest at pH 4.0 and the difference is less than 4%. Phosphate levels did not affect S uptake in all treatments except in the selenate treatment at pH 4.0. In this treatment an increase of P level in the nutrient solution has led to about 4% decrease of S in the shoots.
In Figure 11b, the content of sulphur in roots is presented as a function of pH for the different treatments. In this case the content of sulphur shows no clear difference between treatments. The increment in phosphate did not show any effect either. A general trend of increase of S-root is seen for all the treatments, especially between pH 5.5 and 7.0. Sulfur was supplied to the nutrient solution as sulfate, SO4
2-. From the perspective of competition with OH-, a negative instead of a positive pH effect can be expected on S uptake to the roots. It is not clear yet which reason has caused the effect observed.
0.0
0.5
1.0
1.5
2.0
2.5
High P Low P High P Low P High P Low P
4.0 5.5 7.0
Ratio
of S
elen
io C
onte
nt
SeleniteSelenate
21

Comparing Figure 11 a and b, we can see that the form of Se supplied has a more clear effect on S transport from root to shoot than on S uptake to the root. Compared to the control treatment, the presence of Se did not obviously influence S content in shoot and root (Table 11). The S-shoot/S-root ratio is in the range of 1.2-1.5 (Table 12). When supplied as selenate, Se is more mobile in the plants than S, whereas when supplied as selenite, Se is less mobile than S.
Figure 11a and 11b: Variation in Sulphur content in shoots (left) and roots (right) along the pH gradient. Treatment effects on P uptake
Several studies showed an interaction between Se and P uptake, so the results of phosphorus uptake are plotted in Figure 12a and 12b for comparison with Figure 9a and 9b.
Figure 12a shows the content of phosphorus in the shoot as a function of pH for the two types of Se treatments and two levels of P treatments. Different forms of Selenium did not show a marked relation with the content of P in shoots at pH 4.0 and 7.0. The content of P in shoots is approximately 3-10% higher when Se is provided as selenite than when Se was supplied as selenate at pH 5.5.
Phosphate levels did affect P uptake in treatments with selenate at pH 4.0. An increase of P level in the nutrient solution has led to about 15% decrease of P in the shoots. At pH 5.5 an increase in P level generates a decrease in P content of about 7%. At pH 7.0 an increase in P level showed a decrease in P content of about 11%. Phosphate levels did not affect P uptake in treatments with selenite except at pH 5.5 where an increase in Phosphate showed a decrease in P content of about 3%.
Figure 12a and 12b. Variation in phosphate content in shoots (left) and roots (right) along the pH gradient.
2.6
2.7
2.8
2.9
3.0
3.1
3.2
3.5 4.5 5.5 6.5 7.5
S-Sh
oots
(mg
S/kg
D.M
.)
pH
SeO3 High PSeO3 Low PSeO4 High PSeO4 Low P
1.5
1.7
1.9
2.1
2.3
2.5
2.7
2.9
3.1
3.5 4.5 5.5 6.5 7.5S-
Roo
ts (m
g S/
kg
D.M
.)
pH
SeO3 High PSeO3 Low PSeO4 High PSeO4 Low P
6.0
6.2
6.4
6.6
6.8
7.0
7.2
7.4
7.6
7.8
8.0
3.5 4.5 5.5 6.5 7.5
P-Sh
oots
(mg
P/ k
g D.
M.)
pH
SeO3 High PSeO3 Low PSeO4 High PSeO4 Low P
5.0
5.5
6.0
6.5
7.0
7.5
8.0
8.5
3.5 4.5 5.5 6.5 7.5
P-ro
ots (
mg
p/ k
g D.
M)
pH
SeO3 High PSeO3 Low PSeO4 High PSeO4 Low P
22
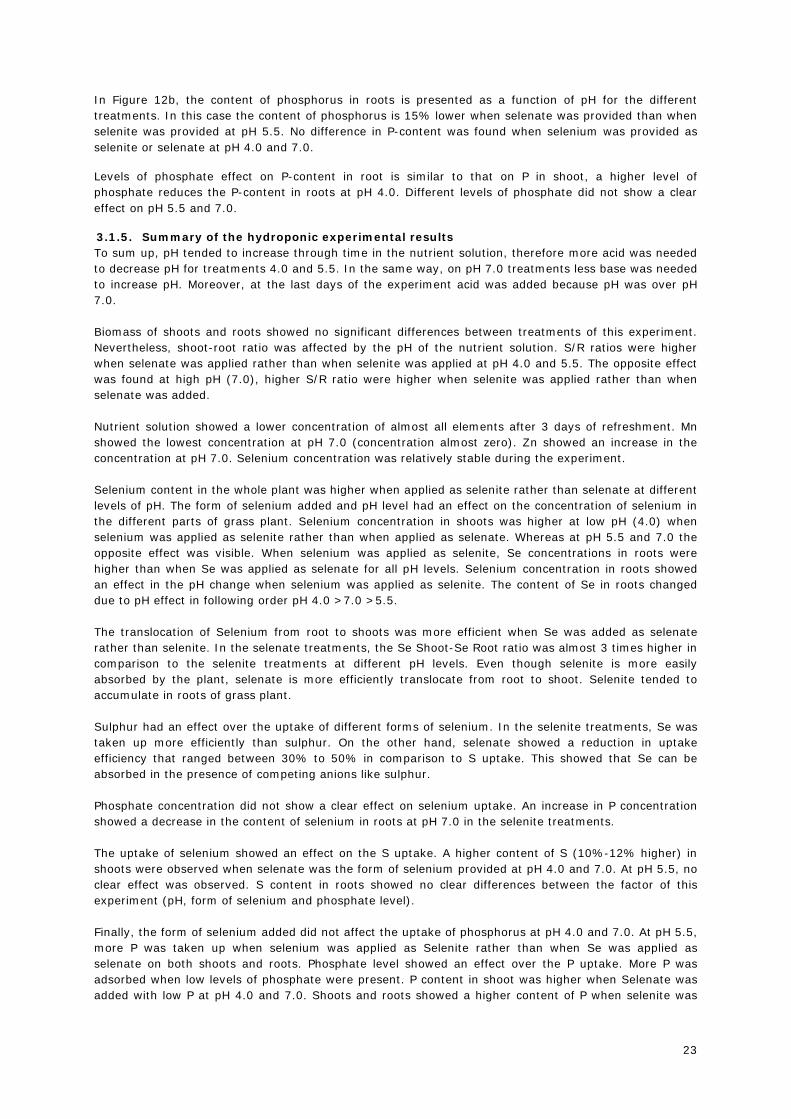
In Figure 12b, the content of phosphorus in roots is presented as a function of pH for the different treatments. In this case the content of phosphorus is 15% lower when selenate was provided than when selenite was provided at pH 5.5. No difference in P-content was found when selenium was provided as selenite or selenate at pH 4.0 and 7.0.
Levels of phosphate effect on P-content in root is similar to that on P in shoot, a higher level of phosphate reduces the P-content in roots at pH 4.0. Different levels of phosphate did not show a clear effect on pH 5.5 and 7.0.
3.1.5. Summary of the hydroponic experimental results To sum up, pH tended to increase through time in the nutrient solution, therefore more acid was needed to decrease pH for treatments 4.0 and 5.5. In the same way, on pH 7.0 treatments less base was needed to increase pH. Moreover, at the last days of the experiment acid was added because pH was over pH 7.0. Biomass of shoots and roots showed no significant differences between treatments of this experiment. Nevertheless, shoot-root ratio was affected by the pH of the nutrient solution. S/R ratios were higher when selenate was applied rather than when selenite was applied at pH 4.0 and 5.5. The opposite effect was found at high pH (7.0), higher S/R ratio were higher when selenite was applied rather than when selenate was added. Nutrient solution showed a lower concentration of almost all elements after 3 days of refreshment. Mn showed the lowest concentration at pH 7.0 (concentration almost zero). Zn showed an increase in the concentration at pH 7.0. Selenium concentration was relatively stable during the experiment. Selenium content in the whole plant was higher when applied as selenite rather than selenate at different levels of pH. The form of selenium added and pH level had an effect on the concentration of selenium in the different parts of grass plant. Selenium concentration in shoots was higher at low pH (4.0) when selenium was applied as selenite rather than when applied as selenate. Whereas at pH 5.5 and 7.0 the opposite effect was visible. When selenium was applied as selenite, Se concentrations in roots were higher than when Se was applied as selenate for all pH levels. Selenium concentration in roots showed an effect in the pH change when selenium was applied as selenite. The content of Se in roots changed due to pH effect in following order pH 4.0 >7.0 >5.5. The translocation of Selenium from root to shoots was more efficient when Se was added as selenate rather than selenite. In the selenate treatments, the Se Shoot-Se Root ratio was almost 3 times higher in comparison to the selenite treatments at different pH levels. Even though selenite is more easily absorbed by the plant, selenate is more efficiently translocate from root to shoot. Selenite tended to accumulate in roots of grass plant. Sulphur had an effect over the uptake of different forms of selenium. In the selenite treatments, Se was taken up more efficiently than sulphur. On the other hand, selenate showed a reduction in uptake efficiency that ranged between 30% to 50% in comparison to S uptake. This showed that Se can be absorbed in the presence of competing anions like sulphur. Phosphate concentration did not show a clear effect on selenium uptake. An increase in P concentration showed a decrease in the content of selenium in roots at pH 7.0 in the selenite treatments. The uptake of selenium showed an effect on the S uptake. A higher content of S (10%-12% higher) in shoots were observed when selenate was the form of selenium provided at pH 4.0 and 7.0. At pH 5.5, no clear effect was observed. S content in roots showed no clear differences between the factor of this experiment (pH, form of selenium and phosphate level). Finally, the form of selenium added did not affect the uptake of phosphorus at pH 4.0 and 7.0. At pH 5.5, more P was taken up when selenium was applied as Selenite rather than when Se was applied as selenate on both shoots and roots. Phosphate level showed an effect over the P uptake. More P was adsorbed when low levels of phosphate were present. P content in shoot was higher when Selenate was added with low P at pH 4.0 and 7.0. Shoots and roots showed a higher content of P when selenite was
23

added with low P level at pH 5.5. It is unclear why low levels of phosphate showed a higher P concentration in the plant.
3.2. Results from Pot Experiment 3.2.1. Elements extracted in single step extractions of the original soil samples The original soils were analyzed for elements extracted in 0.01M CaCl2, 0.43M HNO3 and ammonium oxalate extraction. The results can be found in Table 13.
The results show that a very low amount of Selenium is available to plants, as shown by Se extracted in CaCl2, which is 0.9, 3.4 and 4.4 µg/kg for the sandy, loamy and clay soil respectively. The amount of Se extracted in the Ammonium oxalate extraction is higher than that extracted in HNO3 and CaCl2. This reflects that AmOx extraction gives the total amount of inorganic selenium plus some organic selenium. The Se-CaCl2 follows the order of sandy<loamy<clay. The Se-HNO3 follows the order of clay<loamy<sandy. The Se-ammonium oxalate follows the order of sandy=clay<loamy.
For Al and Fe in the ammonium oxalate extraction, the sum of Al and Fe extracted is similar in the sandy and loamy soil, although the loamy soil contains a higher amount of clay (17%) than the sandy soil (2%) (Table 1). This can be caused partly by the larger amount of soil organic matter presented in the sandy (3.8%) than in the loamy (2.7%) soil, which can result in a larger amount of organic bound Al and Fe, especially when the pH is relatively low as in the case of the sandy soil. The organic-bound fraction contributes more to Al in the ammonium oxalate extraction than Fe in the extraction. When looking at Fe, its amount extracted in ammonium oxalate follows the order of sandy<loamy<clay, in line with the order of clay content.
The total amount of adsorbed P, as P measured in the ammonium oxalate, follows the order of sandy<loamy<clay, which follows the order of clay content and Fe extracted in ammonium oxalate.
Table 13. Results of the different extractions performed in the original soils.
Extraction Element Units Loamy Clay Sandy
Ammonium Oxalate Extraction
P [mg/kg] 465 553 269 S [mg/kg] 56 68 362 Al [mg/kg] 677 867 995 Fe [g/kg] 2.62 3.54 2.42 Cu [mg/kg] 9 15 7 Mn [mg/kg] 338.3 758.3 54.7 Zn [mg/kg] 10.49 12.07 8.13 B [µg/kg] 1984 1408 64 Se [µg/kg] 43.2 14.4 14.4
0.43 M HNO3 Extraction
Cu [mg/kg] 80.1 128.7 55.8 Mn [g/kg] 2.64 4.34 0.53 Zn [g/kg] 4.75 2.29 0.18 B [µg/kg] 2025 2755 1095 Se [µg/kg] 10.5 5.5 15.5
0.01 M CaCl2 Extraction
P [mg/kg] 2.8 1.5 0.55 Cu [µg/kg] 114 397.5 37.75 Mn [mg/kg] 0.135 0.065 5.59 Zn [mg/kg] 0.5 0.8 2.0 B [µg/kg] 696.5 354.5 510.5 Se [µg/kg] 3.4 4.4 0.9
3.2.2. 0.01M CaCl2 extraction in soils after the pot experiment The pH, DOC and Se concentration measured in the 0.01M CaCl2 extraction of the soil samples used for the pot experiment can be found in Table 14.
24

Table 14. Results from 0.01M CaCl2 extraction of the soils after the pot experiment
SOIL TYPE pH level BORON
level PO4 level Se-CaCl2 pH DOC [µg/kg] measured [mg/L]
Sandy LOW pH LOW B LOW P 0.83 5.06 14.60 Sandy LOW pH LOW B HIGH P 0.87 5.10 15.70 Sandy LOW pH HIGH B LOW P 0.87 5.06 14.37 Sandy LOW pH HIGH B HIGH P 0.83 5.08 13.57 Sandy HIGH pH LOW B LOW P 2.70 7.66 16.40 Sandy HIGH pH LOW B HIGH P 2.63 7.59 16.13 Sandy HIGH pH HIGH B LOW P 2.60 7.64 17.83 Sandy HIGH pH HIGH B HIGH P 2.63 7.55 14.70 Loamy LOW pH LOW B LOW P 3.37 7.69 11.70 Loamy LOW pH LOW B HIGH P 3.47 7.71 11.90 Loamy LOW pH HIGH B LOW P 3.30 7.68 13.93 Loamy LOW pH HIGH B HIGH P 3.43 7.65 11.73 Loamy HIGH pH LOW B LOW P 4.03 8.03 12.27 Loamy HIGH pH LOW B HIGH P 4.50 8.07 13.73 Loamy HIGH pH HIGH B LOW P 4.83 8.09 14.13 Loamy HIGH pH HIGH B HIGH P 4.53 8.12 14.93 Clay HIGH pH LOW B LOW P 4.90 7.78 15.00 Clay HIGH pH LOW B HIGH P 4.87 7.73 11.33 Clay HIGH pH HIGH B LOW P 5.80 7.72 15.17 Clay HIGH pH HIGH B HIGH P 5.80 7.70 14.30
The Shapiro-Wilk’s test (Shapiro & Wilk, 1965) and visual inspections of their histograms, normal Q-Q plots and box plots showed that the residues from the selenium in solution (µg/l) were approximately normally distributed for the sandy (p=0.77), loamy (p=0.76) and clay (p=0.87) soil. In the same way, Bartlett’s test showed that variances from the residues of selenium in solution (µg/l) were homogeneous for the sandy (p=0.577), loamy (p=0.376) and clay (p=0.282) soil.
pH level showed a highly significant effect on the content of selenium in the soil solution [µg/l] for sandy soil F(1,16)=1712.04, p<0.001 and Loamy soil F(1,16)=88.02, p<0.001soil; Figures 13a and 13b show that in both soils the concentration of Selenium in soil solution was high at high pH (7.61 and 8.08 for sandy and loamy soil respectively) than at lower pH in the same soil (5.08 and 7.68 for sandy and loamy soil respectively). Additionally, the loamy soil shows a higher concentration of selenium in soil solution than the sandy soil at both pH’s. In the clay soil, Se concentration in soil solution was on average 0.52±0.06 µg/L which is higher than that found in sandy and loamy soils. The DOC concentration in CaCl2 extraction is similar for all three soils. Increase of pH has shown a small positive effect on the DOC concentration in the sandy and loamy soil.
Figure 13a and 13b: Comparison of the average concentration of selenium in the soil solution for sandy
(a) and loamy (b) soils. An analysis of variance using the three soils with similar pH levels (high pH sandy, low pH loamy and clay soil) was performed to evaluate the effect of different phosphate and boron levels. A Shapiro-Wilk’s test (p=0.529) (Shapiro & Wilk, 1965) and a visual inspection of their histograms, normal Q-Q plots and box plots showed that the residues from the logarithm in base 10 of the selenium in solution (µg/l) were approximately normally distributed. In the same way, a Bartlett’s test (p=0.283) showed that variances from the residues of the logarithm in base 10 of the selenium in solution (µg/l) were homogeneous.
(a)
0
0.1
0.2
0.3
HIGH pH LOW pH
Se-S
oil [
ug/L
]
(b)
0
0.1
0.2
0.3
0.4
0.5
HIGH Ph LOW Ph
Se-S
olut
ion
[ug/
L]
25

The results showed a significant interaction effect between soil type and boron level on the logarithm of the content of selenium in soil solution. F (2, 24) =7.43, p<0.003; No significant effect of P level on Se-CaCl2 was found. Figure 14 shows the results of the interaction between soil type and level of boron using the logarithm of Se-CaCl2 [µg/l]. The highest Se concentration in soil solution (CaCl2 extraction) was measured in clay soil, followed by loamy soil then for sandy soil for both levels of boron. Different level of boron showed a significant effect over the Selenium concentration in soil solution for clay soil. No significant differences were found in Se-CaCl2 for loamy and sandy soil with different levels of boron.
Figure 14: Comparison of the average content of Selenium [log Se (µg/l)] in the soil solution for the
significant interaction between soil type and level of boron.
3.2.3. Biomass All pots contained the same concentration and form of selenium. Analysis of biomass (dry weight from shoots) of the pot experiment did not contribute to explain the effect of selenium on the plant growth. However, when biomass in sandy soil was analyzed, an effect of soil pH was found. Therefore a possible dilution of the content of Selenium in shoots was suspected.
Due to the pH levels were not the same for all the soils, one Analysis of Variance was performed for each soil. The Shapiro-Wilk’s test (Shapiro & Wilk, 1965) and visual inspections of their histograms, normal Q-Q plots and box plots showed that the residues from dry weight of biomass (g per replicate) were approximately normally distributed for the sandy (p=0.46), loamy (p=0.84) and clay (p=0.971) soil. In the same way, Bartlett’s test showed that variances from the residues of dry weight (g per replicate) were homogeneous for the sandy (p=0.381), loamy (p=0.198) and clay (p=0.375) soil.
There was a significant effect of pH on the dry weight of biomass [g per replicate] for sandy soil [F (1, 16) =7.18, p=0.016]. Higher shoot biomass was present at high pH (Figure 15a). However, no differences were found in the net content of Se per replicate (Figure 15b). Higher biomass with the same level of Se concentration in shoots, may lead to a dilution effect of biomass over the high pH (7.34) treatments. No differences in shoot biomass were found for loamy and clay soil (p>0.05), therefore no dilution effects are expected.
Figure 15a and b. Average biomass [g DM/replicate] (left) and average content of Se [µg Se per replicate] (right) for the different pH levels in sandy soil in the pot experiment.
a
b
c c
d d
0
0.1
0.2
0.3
0.4
0.5
0.6
0.7
HIGH B LOW B
Log
Se-S
oil [
ug S
e/l]
Clay
Loamy
Sandy
(a)
0
1
2
3
4
5
HIGH Ph LOW Ph
Shoo
t Bio
mas
s [g
DM/
repl
icat
e] (b)
0.08
0.084
0.088
0.092
0.096
0.1
HIGH Ph LOW Ph
Se-S
hoot
[ug
Se/
repl
icat
e]
26

An analysis of variance using the three soils with similar pH levels was performed to evaluate if biomass was affected for soil type. A Shapiro-Wilk’s test (p=0.521) (Shapiro & Wilk, 1965) and a visual inspection of their histograms, normal Q-Q plots and box plots showed that the residues from dry weight of shoots (g per replicate) were approximately normally distributed. In the same way, a Bartlett’s test (p=0.316) showed that variances from the residues of the dry weight of shoots (g per replicate) were homogeneous.
The results showed a significant effect of soil type on dry weight of shoots. [F (2, 24) =8.88, p=0.001]; Loamy soil presents the highest biomass, followed by clay and sandy soil with no differences between them (Figure 16a). Additionally, remarkable differences were found in the net content of selenium in shoots (Figure 16b). No dilution effects are expected due to the net content of Selenium in shoots differs for each soil.
Figure 16a and b. Average of biomass [g DM/replicate] (left) and average content of Se [µg Se per replicate] (right) for the different soils in the pot experiment.
3.2.4. Plant uptake The results of Se, S and P content in the plants can be found in Table 15. The Se content in the shoot is in the range of 21.5 to 90.8 µg/kg. This value is much lower than that in the hydroponic experiment (Table 11), even when compared to the control treatment in the hydroponic experiment without Se addition. Although Se was fertilized as selenite, the Se content in the plant is still lower than required for fodders for animals (150 µg/kg).
Table 15. Selenium, phosphorus and sulphur content in plants from the pot experiment
Soil Type pH PO4
Level
High B Low B Se P S Se P S
[µg/kg] [g/kg] [g/kg] [µg/kg] [g/kg] [g/kg] Sandy High pH
High PO4
26.35 3.45 3.30 22.47 3.26 3.14 Low pH 24.28 3.36 4.05 23.40 2.99 3.85 Loamy High pH 58.20 3.82 3.25 54.53 3.85 3.32 Low pH 31.40 4.67 3.24 23.18 4.60 3.28 Clay High pH 81.87 3.81 3.88 69.90 3.88 3.35 Sandy High pH
Low PO4
22.24 2.98 3.09 24.12 3.37 3.23 Low pH 30.32 2.58 3.88 30.49 2.51 3.65 Loamy High pH 51.82 3.96 3.30 58.70 3.82 3.44 Low pH 31.96 4.42 3.19 21.53 4.66 3.37 Clay High pH 90.82 3.42 3.74 69.06 3.33 3.41
The Shapiro-Wilk’s test (Shapiro & Wilk, 1965) and visual inspections of their histograms, normal Q-Q plots and box plots showed that the residues from the content of selenium in plant (µg/kg DM) were approximately normally distributed for the sandy (p=0.73), loamy (p=0.79) and clay (p=0.19) soil. In the same way, Bartlett’s test showed that variances from the residues of selenium in solution (µg/l) were homogeneous for the sandy (p=0.832), loamy (p=0.675) and clay (p=0.261) soil.
b
a
b
0
1
2
3
4
5
6
Clay Loamy Sandy
Shoo
t Bio
mas
s [g
DM p
er re
plic
ate]
(a) (b)
0
0.05
0.1
0.15
0.2
0.25
0.3
0.35
0.4
Clay Loamy Sandy
Se-s
hoot
s [ug
Se/
repl
icat
e]
27
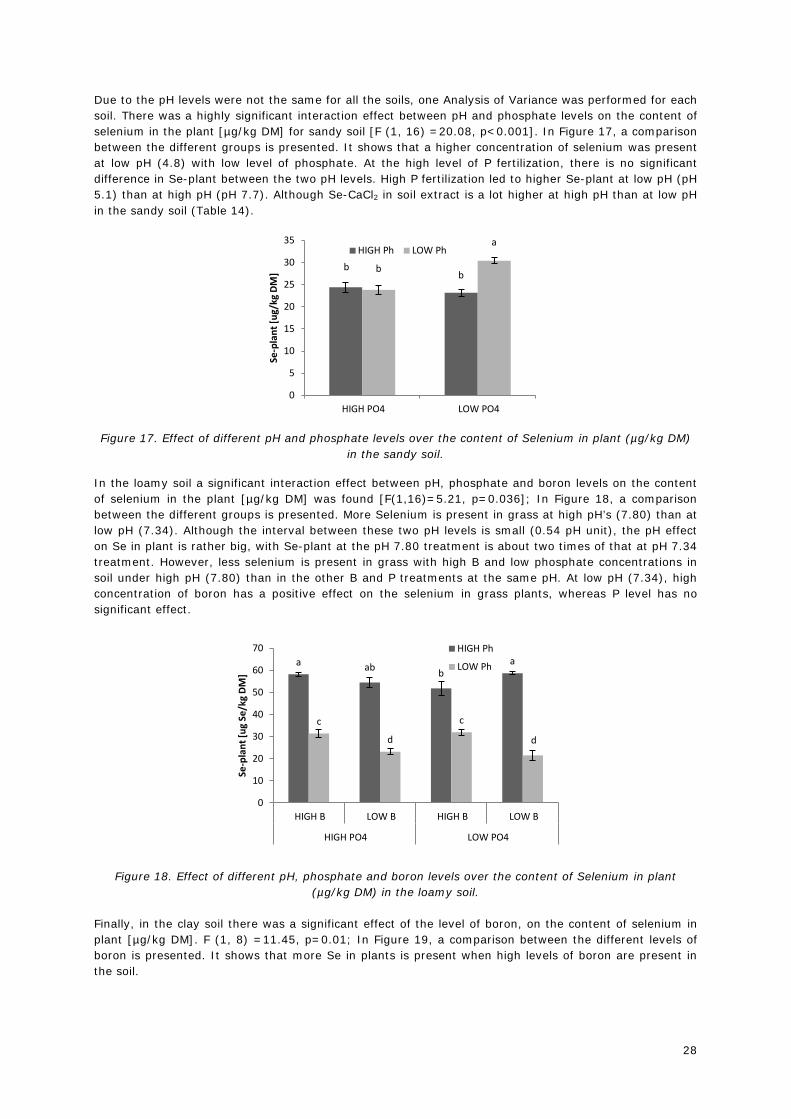
Due to the pH levels were not the same for all the soils, one Analysis of Variance was performed for each soil. There was a highly significant interaction effect between pH and phosphate levels on the content of selenium in the plant [µg/kg DM] for sandy soil [F (1, 16) =20.08, p<0.001]. In Figure 17, a comparison between the different groups is presented. It shows that a higher concentration of selenium was present at low pH (4.8) with low level of phosphate. At the high level of P fertilization, there is no significant difference in Se-plant between the two pH levels. High P fertilization led to higher Se-plant at low pH (pH 5.1) than at high pH (pH 7.7). Although Se-CaCl2 in soil extract is a lot higher at high pH than at low pH in the sandy soil (Table 14).
Figure 17. Effect of different pH and phosphate levels over the content of Selenium in plant (µg/kg DM)
in the sandy soil.
In the loamy soil a significant interaction effect between pH, phosphate and boron levels on the content of selenium in the plant [µg/kg DM] was found [F(1,16)=5.21, p=0.036]; In Figure 18, a comparison between the different groups is presented. More Selenium is present in grass at high pH’s (7.80) than at low pH (7.34). Although the interval between these two pH levels is small (0.54 pH unit), the pH effect on Se in plant is rather big, with Se-plant at the pH 7.80 treatment is about two times of that at pH 7.34 treatment. However, less selenium is present in grass with high B and low phosphate concentrations in soil under high pH (7.80) than in the other B and P treatments at the same pH. At low pH (7.34), high concentration of boron has a positive effect on the selenium in grass plants, whereas P level has no significant effect.
Figure 18. Effect of different pH, phosphate and boron levels over the content of Selenium in plant (µg/kg DM) in the loamy soil.
Finally, in the clay soil there was a significant effect of the level of boron, on the content of selenium in plant [µg/kg DM]. F (1, 8) =11.45, p=0.01; In Figure 19, a comparison between the different levels of boron is presented. It shows that more Se in plants is present when high levels of boron are present in the soil.
b b b
a
0
5
10
15
20
25
30
35
HIGH PO4 LOW PO4
Se-p
lant
[ug/
kg D
M]
HIGH Ph LOW Ph
a ab b a
c
d
c
d
0
10
20
30
40
50
60
70
HIGH B LOW B HIGH B LOW B
HIGH PO4 LOW PO4
Se-p
lant
[ug
Se/k
g DM
]
HIGH Ph
LOW Ph
28
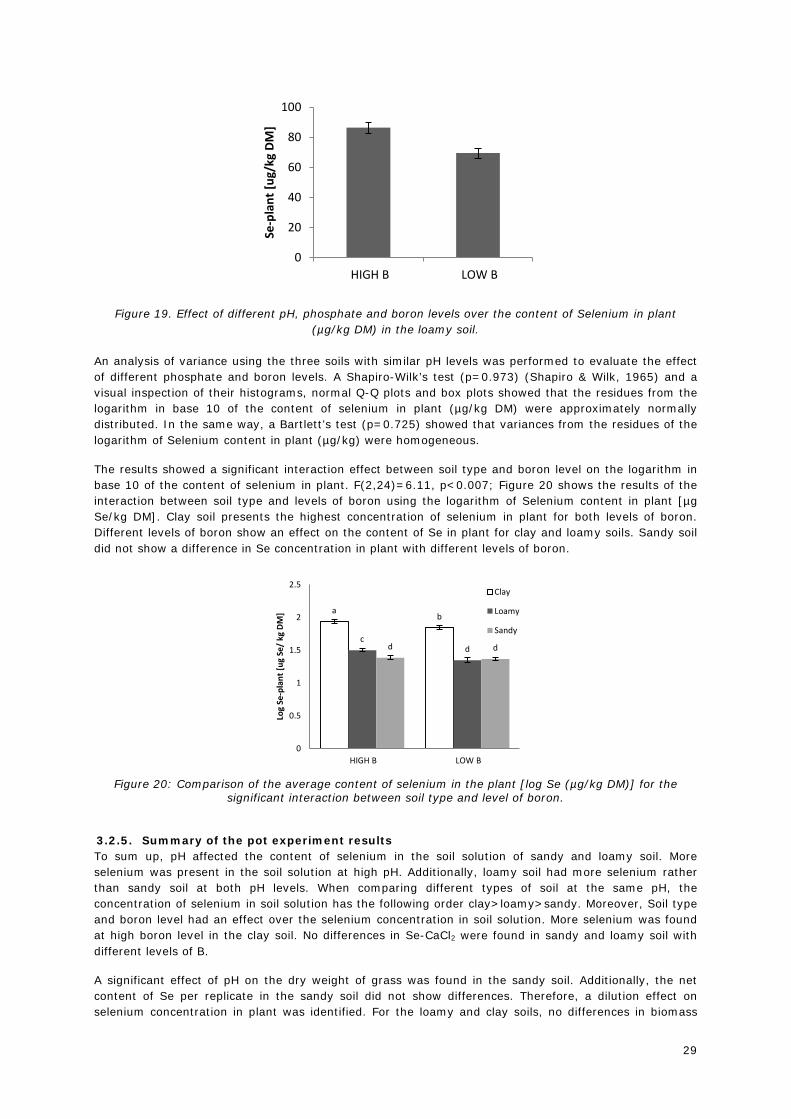
Figure 19. Effect of different pH, phosphate and boron levels over the content of Selenium in plant (µg/kg DM) in the loamy soil.
An analysis of variance using the three soils with similar pH levels was performed to evaluate the effect of different phosphate and boron levels. A Shapiro-Wilk’s test (p=0.973) (Shapiro & Wilk, 1965) and a visual inspection of their histograms, normal Q-Q plots and box plots showed that the residues from the logarithm in base 10 of the content of selenium in plant (µg/kg DM) were approximately normally distributed. In the same way, a Bartlett’s test (p=0.725) showed that variances from the residues of the logarithm of Selenium content in plant (µg/kg) were homogeneous.
The results showed a significant interaction effect between soil type and boron level on the logarithm in base 10 of the content of selenium in plant. F(2,24)=6.11, p<0.007; Figure 20 shows the results of the interaction between soil type and levels of boron using the logarithm of Selenium content in plant [µg Se/kg DM]. Clay soil presents the highest concentration of selenium in plant for both levels of boron. Different levels of boron show an effect on the content of Se in plant for clay and loamy soils. Sandy soil did not show a difference in Se concentration in plant with different levels of boron.
Figure 20: Comparison of the average content of selenium in the plant [log Se (µg/kg DM)] for the
significant interaction between soil type and level of boron.
3.2.5. Summary of the pot experiment results To sum up, pH affected the content of selenium in the soil solution of sandy and loamy soil. More selenium was present in the soil solution at high pH. Additionally, loamy soil had more selenium rather than sandy soil at both pH levels. When comparing different types of soil at the same pH, the concentration of selenium in soil solution has the following order clay>loamy>sandy. Moreover, Soil type and boron level had an effect over the selenium concentration in soil solution. More selenium was found at high boron level in the clay soil. No differences in Se-CaCl2 were found in sandy and loamy soil with different levels of B.
A significant effect of pH on the dry weight of grass was found in the sandy soil. Additionally, the net content of Se per replicate in the sandy soil did not show differences. Therefore, a dilution effect on selenium concentration in plant was identified. For the loamy and clay soils, no differences in biomass
0
20
40
60
80
100
HIGH B LOW BSe
-pla
nt [u
g/kg
DM
]
a b
c d d d
0
0.5
1
1.5
2
2.5
HIGH B LOW B
Log
Se-p
lant
[ug
Se/
kg D
M]
Clay
Loamy
Sandy
29

were found when their data was analyzed individually. When comparing soils with the same pH, loamy soil showed a higher biomass in comparison to clay and sandy soil which had similar biomass. Comparing the net content of Se in plant (g per replicate) showed differences between soils. Therefore, soil type did not have a dilution effect on the concentration of selenium in plants.
Se uptake of grass plants grown on sandy soil was affected by the interaction of pH and phosphate level. More Selenium was taken up when phosphate level was low in the treatments with low pH (4.8). Even though this result was unexpected the dilution effect of biomass described previously may had a relation with this result. In the case of loamy soil, the three factors of this experiment affected Se uptake. More selenium was taken up at high pH (7.80) than at low pH (7.34). Additionally, a low level of phosphate showed less selenium uptake in the high pH treatments. At low pH, high boron level increased the uptake of selenium, but different phosphate levels showed no clear effect. In the case of clay soil, boron showed an effect over selenium uptake. More selenium was present in grass plant when boron was added at a higher concentration.
Finally, when comparing different soils with similar pH level of boron and soil type showed an effect over selenium uptake. In general, more selenium was taken up when grass grew on clay soil. More selenium was taken up when grass grown on clay soil with high B level. Loamy soil showed differences on selenium uptake when different levels of B were added. Sandy soil showed no differences on selenium uptake at different boron levels.
3.3. Results from adsorption batch experiment 3.3.1. Adsorption isotherm experiment The results of the adsorption isotherm experiment using selenite are given in Table 16. Hardly measureable adsorption of selenate was observed, therefore the results for selenate were not shown.
Table 16. Results of the selenium adsorption isotherm experiment.
Form of selenium
Se solution
Se-adsorbed [mg/kg] Sandy Sandy Loamy Clay
[mg/L] pH 4.8 pH 7.5 pH 7.5 pH 7.6
SeO3
0.13 1.27 0.99 1.12 1.22 0.26 2.55 1.94 2.24 2.41 0.51 4.95 3.67 4.62 5.01 2.57 24.71 17.31 21.00 23.30 5.15 47.93 31.93 40.23 45.82 12.86 115.62 68.62 89.81 106.86 25.73 204.36 128.31 155.20 195.30
SeO4
0.11 0.14 0.13 0.17 0.14 0.22 0.19 0.14 0.26 0.24 0.39 0.87 0.67 0.51 0.56 1.99 3.87 2.07 2.27 2.11 4.30 4.47 2.02 5.06 5.91 11.25 12.51 9.01 10.00 14.50
The adsorption isotherms of selenite are given in Figures 21a and 21b. Adsorption of selenite to sandy soil showed a decrease with an increase of pH. The type of soils had an effect over the adsorption of selenite. Clay soil has the highest adsorption followed by loamy and sandy soils respectively under similar pH. Selenate showed almost no adsorption to the different soils of the experiment (data not shown).
30

Figure 21a (left) and 20b (right): Selenite adsorption isotherms in sandy soil with different pH levels
(left) adsorption isotherms for the different soil (right).
Figure 22. Adsorption isotherms for the different soils expressed in logarithmic scale.
No obvious adsorption plateau was observed under the experimental conditions (Figure 21a). The Freundlich model was applied to the experimental data in order to obtain equations that represent the adsorption to each soil. The equations for each soil are presented in Table 17. The logarithmic form of the Freundlich model applied is the following:
Log ([Se]-adsorbed) (mg/kg) = log K + n log ([Se]-solution) (mg/L)
Table 17. Logarithmic form of the Freundlich adsorption model for the different soils.
Soil Type pH Equation Adj. R2
Sandy 4.8 Log ([Se]-adsorbed)= 1.91+0.70 log([Se]-solution) 0.9267 Sandy 7.5 Log ([Se]-adsorbed)= 1.24 +0.80 log([Se]-solution) 0.9964 Loamy 7.5 Log ([Se]-adsorbed)= 1.51 +0.76 log([Se]-solution) 0.9830 Clay 7.6 Log ([Se]-adsorbed)= 1.78 +0.71 log([Se]-solution) 0.9633
[Se]-adsorbed: added Se minus Se in solution phase in mg Se/kg soil [Se]-solution: detected Se concentration in 0.01 CaCl2 with soil: solution ratio of 1:10 in mg Se/L The model fit was analyzed by comparing the amount of Selenium absorbed measured with predicted. The results are shown in the Figures 23 (a to h). These figures and the corresponding correlation coefficient prove that the models fit quite well.
0
50
100
150
200
250
0.0 5.0 10.0 15.0
Se-a
dsor
bed
[mg/
kg so
il]
Se-solution [mg/L]
Sandy; pH 4.8
Sandy; pH 7.5
0
50
100
150
200
250
0.0 5.0 10.0 15.0
Se-a
dsor
bed
[mg/
kg so
il]
Se-solution [mg/L]
Sandy; pH 7.5
Loamy; pH 7.5
Clay; pH 7.6
-0.5
0.0
0.5
1.0
1.5
2.0
2.5
-3.0 -2.0 -1.0 0.0 1.0 2.0
Log
(Se)
-ads
orbe
d [m
g/kg
soil]
Log (Se)-solution [mg/L]
Sandy pH 4.8Sandy pH 7.5Loamy pH 7.5Clay pH 7.6
31

Figure 23. Freundlich model fitting to the different adsorptions (right) and predicted vs measured values from the different models (left) for sandy low pH (a, b), sandy high pH (c, d), loamy (e, f) and clay (g, h) soils.
(a)
0
50
100
150
200
250
300
0.0 2.0 4.0 6.0
Se [m
g/kg
soil]
Se [mg/L]
Sandy; pH 4.8
Line Model
(b)
0
50
100
150
200
250
300
0 100 200 300
Q-S
e c
alcu
late
d m
g/kg
Q-Se measured mg/kg
(c)
0
20
40
60
80
100
120
140
160
0.0 5.0 10.0 15.0
Se [m
g/kg
soil]
Se [mg/L]
Sandy; pH 7.5
Line Model
(d)
0
20
40
60
80
100
120
140
0 50 100 150
Q-S
e c
alcu
late
d m
g/kg
Q-Se measured mg/kg
(e)
0
50
100
150
200
250
0.0 5.0 10.0 15.0
Se [m
g/kg
soil]
Se [mg/L]
Loamy; pH 7.5
Line Model
(f)
0
50
100
150
200
0 50 100 150 200
Q-S
e c
alcu
late
d m
g/kg
Q-Se measured mg/kg
(g)
0
50
100
150
200
250
300
0.0 2.0 4.0 6.0 8.0
Se [m
g/kg
soil]
Se [mg/L]
Clay; pH 7.6
Line Model
(h)
0
50
100
150
200
250
0 50 100 150 200 250
Q-S
e c
alcu
late
d m
g/kg
Q-Se measured mg/kg
32

3.3.2. Soil factors related to Se adsorption In order to understand the adsorption of selenite, a comparison between the amount of selenium adsorbed versus the amount of iron-(hydr) oxides (as measured in ammonium oxalate extraction), amount of total phosphate (as measured in ammonium oxalate extraction), amount of organic matter and clay in each soil was performed. In Figures 24a and 24b, it is shown that per unit of Fe(OH)3 and per unit of organic matter, clay soil adsorbs the most selenium. On the other hand in Figure 23c the sandy soil showed the highest adsorption of selenium per unit of clay. Finally, in Figure 23d it is shown the amount of selenium adsorbed per unit of total phosphate.
Figure 24. Selenium adsorbed expressed as per unit of iron (hydr) oxides (a), organic matter (b), clay (c) and phosphate (d). It is clear that selenite mostly binds to iron (and aluminum) (hydr)oxides, as shown by the small difference between the isotherms when Se-adsorbed was expressed as per unit of P adsorbed. It is known that P is soil is mainly adsorbed to metal oxides and to a less extent to clay. However, clay particles have positive charge on the edges of its structure, so they are able to bind anions like selenite. In Figure 23a and 23c the selenium adsorbed is expressed in terms of Fe(OH)3 and clay. An equation was developed to explain the adsorption to the different adsorption particles for each soil. It was found that clay content of each soil participates in the adsorption of selenite. Clay soil benefits from the highest content of clay. A factor of contribution (X) was found for the clay content to selenite adsorption. Therefore we can estimate the amount of selenite that is bound to Fe(OH)3 and clay per kg of soil if we use the following equation:
Log([Se]-adsorbed = logK + nlog([Se]-solution) + mlog [Fe(OH)3+X clay]
(a)
0
5
10
15
20
25
30
35
0.0 5.0 10.0 15.0
Se-a
dsor
bed
[mg/
mg
Fe(O
H)3
]
Se-solution [mg/L]
Sandy; pH 7.5Loamy; pH 7.5Clay; pH 7.6
(b)
0
1
2
3
4
5
6
7
0.0 5.0 10.0 15.0
Se-a
dsor
bed
[mg/
mg
O.M
.]
Se-solution [mg/L]
Sandy; pH 7.5Loamy; pH 7.5Clay; pH 7.6
(c)
-1
0
1
2
3
4
5
6
7
0.0 5.0 10.0 15.0
Se-a
dsor
bed
[mg/
mg
Clay
]
Se-solution [mg/L]
Sandy; pH 7.5
Loamy; pH 7.5
Clay; pH 7.6
(d)
0
20
40
60
80
100
120
140
160
180
0.0 5.0 10.0 15.0
Se-a
dsor
bed
[mg/
mg
PO4]
Se-solution [mg/L]
Sandy; pH 7.5Loamy; pH 7.5Clay; pH 7.6
33

Figure 25a shows that the previous equation fits quite well to the data, because the three lines tend to merge into one. If we include the organic matter as another factor, the equation in its logarithmic form would be as following:
Log([Se]-adsorbed = logK + nlog([Se]-solution) + mlog [Fe(OH)3+X clay] - zlog [O.M.]
Figure 25a (left) and 25b(right): Adsorption isotherms of selenium expressed as a function of
Fe(OH)3+Xclay (left), as a function of Fe(OH)3+XClay and OM. (right). X=0.000033 Figure 25b shows the inclusion of OM as a factor in the previous equation. This final equation fits better to the data because now the three lines are closer and they resemble more to one unique line. The value of X, which is a transforming factor for the adsorption capacity of clay to that of Fe (hydr)oxide, was fitted as 0.000033. These results show approximately that one mg of clay has the binding capacity for Se of 0.000033 mg de FeOH3. It means that on a mass basis, iron (hydr)oxides bind more than 30000 times more Se than clay at the same mass amount. Although the binding capacity of clay for Se is much lower than iron (hydr)oxides, its contribution can be significant since clay content in soil is much larger than the iron (hydr)oxide content. Using this factor (X), and the content of clay and iron (hydr)oxides in these soils, it can be estimated that clay contributed 13%, 53% and 50% to Se adsorption in the sandy, loamy and clay soil respectively. 3.3.3. pH adsorption edge experiment The envelope (edge) experiment shows that DOC has a positive relation with pH. An increase in pH causes an increase in DOC. Se content in soil solution also has a relation with pH which is directly related to the increment in DOC. Figure 26 shows the comparison between the content of Se in soil solution and the content of DOC.
(a)
0
5
10
15
20
25
30
0 5 10 15
Se-a
dsor
bed
[mg
Se/
(mg
Fe(O
H)3
+ 0
.000
033
mg
clay
)]
Se solution [mg/l]
Sandy SoilLoamy SoilClay Soil
(b)
0
1
2
3
4
5
6
7
0 5 10 15
Se-a
dsor
bed
[(m
g Se
/(m
g Fe
(OH
)3+
0.00
0033
mg
clay
))/ m
g O
M]
Se solution [mg/l]
Sandy SoilLoamy SoilClay Soil
34

Figure 26. Comparison between the amount of DOC and Selenium concentration at different pH for the treatments with and without added selenium.
When calculating Se in solution and Se adsorbed, the Se in solution measured in the no-Se treatment at similar pH was subtracted from the Se in solution in the Se treatment, to correct for the contribution of organic Se in the solution to the total Se concentration measured. The content of selenium related to DOC is approximately 0.036 µg Se/mg DOC. Finally, Figure 27b shows that the adsorption of selenium changes with pH. The adsorption is close to 100% and remained relatively constant within pH 4 to 6.5 at the amount of Se added in the experiment, but when pH increases further than 6.5 the adsorption of selenium decreases. Correspondingly, the Se in solution increases (Figure 27a) and the increases is relatively small between pH 4 and pH 6, whereas at pH>6, the increase is much stronger.
Figure 27a (left) and 27b (right). Soluble selenium (a) and Adsorbed selenium (b) in function of pH 3.3.4. Summary of the Se adsorption experimental results
To sum up, selenite showed a higher absorption to soils rather than selenate. Selenate adsorption was almost null, therefore this experiment was based on the behaviour of selenite. The effect of pH over the adsorption of selenite was clear. At low pH more selenite is adsorbed rather than a high pH. Soil type also showed a clear effect over the adsorption of selenite. The order of adsorption in the different soils was clay>loamy>sandy at similar pH level (~7.5).
0.0
0.0
0.1
1.0
10.0
0
10
20
30
40
50
3.0 4.0 5.0 6.0 7.0 8.0 9.0 10.0
Solu
ble
Se [m
g/L]
DOC
[mg/
l]
pH
DOC [-Se] DOC [+Se] Se [-Se] Se [+Se]
(a)
0.0
1.0
2.0
3.0
4.0
5.0
3.0 5.0 7.0 9.0 11.0
Solu
ble
Se [m
g/L]
pH
(b)
0
20
40
60
80
100
120
3.0 5.0 7.0 9.0 11.0
Q-S
e [m
g/kg
]
pH
35

The Freundlich model explained the adsorption of selenite quite well. The adjusted R2 ranged from 0.92 to 0.99 for the different soils, showing a high fitting of the Freundlich model.
Iron (hydr)oxides showed an important role in the adsorption of Se. Clay soil showed the higher adsorption of Se per unit of Fe(OH)3 followed by the loamy soil and in last the sandy soil. The same results were observed per unit of organic matter. On the other hand, sandy soils showed the higher adsorption per unit of clay in comparison to loamy and clay soil which had almost the same behaviour.
Clay content had a big role in the adsorption of selenite. A factor of contribution was estimated. One milligram of clay adsorbed the same amount of 0.000033 milligrams of Fe(OH)3. This represents a contribution of 13%, 53% and 50% to Se-adsorption in the sandy, loamy and clay soil respectively.
In the envelope (edge) experiment, Soluble-Se and DOC showed a positive relation with pH. At higher pH, more soluble Se and DOC were found. Additionally, at higher pH less selenite was adsorbed to the soil particles.
4. DISCUSSION 4.1. For the hydroponic experiment Biomass of shoot and root (dry weight) did not show any significant differences between treatments. But there is a tendency that at high P treatment in solution, the dry weight of both shoots and root decreases with increasing pH. On the other hand, at acidic pH’s (4.0 and 5.5) selenite treatment had a lower S/R dry matter ratio than the selenate treatment. At pH 7.0 no significant differences were found in the S/R dry weight ratio between the selenite and selenate treatment. This suggests that selenite stimulated root growth or suppressed shoot growth to some extent at acidic pH’s. In fact, in the experiment selenite has stimulated root growth at high P level at pH 4.0 and at low P level at pH 5.5, and selenate has reduced root growth at high P level at pH 4.0 and low P level at pH 5.5. These results are in agreement with the results found byHartikainen (2005), where Se doses of 0.1 mg/kg of soil clearly stimulated root growth of ryegrass (Lolium perenne L.). However, the same dose of Se affected negatively the root biomass on lettuce. This means that selenium toxicity depends not only on the dose of selenium but also on the type of plants. Additionally, J. Hopper and D. Parker (1999) found that at basal levels of sulphate and phosphate, selenite and selenate did not show toxic effect to the plants of strawberry (Trifolium fragiferrum L.) and ryegrass. In the same experiment of J. Hopper and D. Parker (1999), at higher levels of PO4 and SO4, selenite was more toxic than selenate decreasing the biomass of shoot and roots. Toxicity symptoms of Se include an negative impact on the growth (dry weight, root length, shoot height), and yellowing, black spots, chlorosis of plant leaves and pink root tissue (Jacobs, American Society of Agronomy. Division A-5., & Soil Science Society of America., 1989; Wu, 1994). No such symptoms were observed in this experiment, except a small reduction of shoot dry weight in some of the treatments. Selenium concentration in the shoot is between 7.68-13.9 mg/kg, and in the root between 6.40-79.1 mg/kg. Grasses are non-accumulator plants for Se, which contains normally <50 mg/kg Se (Rosenfeld & Beath, 1964). Yang, Wang, Zhou, and Sun (1983) have found that a concentration of >2 mg/kg and 1.25 mg/kg Se is harmful for wheat and pea crops respectively. Therefore the Se concentration found in the plants in our hydroponic experiment can be high enough to disturb some metabolic processes such as uptake of other elements, though no obvious toxic symptoms were observed. Selenium concentrations in the whole plant were higher for the selenite treatments than selenate treatments. Selenium concentration in the different plant parts strongly depended on Se-form supplied and pH. More selenium was taken up by shoots when applied as selenite rather than selenate at pH 4.0. However, at pH 5.5 and 7.0, more selenate was taken up by the shoots of grass. In the case of roots, more selenium was taken up when applied as selenite rather than selenate at different pH levels. These results are in accordance with the results found by Kikkert and Berkelaar (2013) andLongchamp, Angeli, and Castrec-Rouelle (2013). Kikkert et al. found that at pH 6.0, shoot tissue of wheat (Triticum turgidum L.) and canola (Brassica napus L) had more selenium when exposed to selenomethionine, followed by selenate, selenocysteine and in last selenite. On the other hand, Longchamp et al. found that root tissues of maize (Zea mays) had more selenium when selenite was added rather than selenate at the same pH level (6.0).
36

In principle, the pH effect on Se uptake observed in the hydroponic experiment can be attributed to (1) change of Se speciation in solution with pH; (2) competition of OH- for selenium uptake. Using the ECOSAT software, speciation calculations were performed for protonation of selenite and selenate over a wide pH range. The log K values used are as the follows:
SeO32-+H+=HSeO3
- log K=7.94 SeO3
2-+2H+=H2SeO30 log K=10.29
SeO42-+H+=HSeO4
- log K=1.906
In Figure 25a it is shown that >98% of Selenite is present as HSeO3- at pH 4.0 and pH 5.5, and at pH 7.0
84% is in the HSeO3- form and 16% in the SeO3
2- form. Moreover, SeO42- tends to be the dominant
specie (>99%) along the pH as seen in figure 25b. The results show that the change of Se speciation in solution is relatively small and may not be the explanation of the pH effect observed on Se uptake. The strong decrease of Se uptake in the selenite treatment between pH 4.0 to 5.5 may be due to competition with OH-, or other factors.
Figure 28. Speciation of Selenite (a) and Selenate (b) in solution for a total Se concentration of 1x10⁻⁵ mol/L.
It is believed that both selenate and selenite are actively taken up by plants, using respectively the sulphate and phosphate transporter (Li et al., 2008). Presence of sulphate in the nutrient solution may be one of the factors that affected Se uptake. Se uptake efficiency was higher than S uptake efficiency when Se was added as selenite. In contrast, Se uptake efficiency was lower than the S uptake efficiency when Se was applied as selenate. Similarly, presence of phosphate may be another factor that affected the uptake of selenium. The uptake efficiency of P is about 3 to 5 times higher than that of S. The Se uptake efficiency is lower than the uptake efficiency of P when applied in both Se forms. The much larger amount of selenite taken up to the roots compared to selenate can probably be attributed to the higher efficiency of P transporter than the S transporter. As mentioned above, it has been suggested that selenite uses P transporter of plants root and selenate uses S transporter. But for both selenite and selenate, their uptake efficiency is a lot lower than that of P and S respectively, with which they compete for the transporter. In treatments with Se added as selenate, Se uptake showed no change when the phosphate concentration was doubled in solution. When selenium was added as selenite, a small reduction in Se uptake was observed at high pH (7.0) when phosphate concentration was doubled (Figure 9a). This put forward that selenite is affected by the presence of phosphate more than selenate. These results are in harmony with the findings of J. Hopper and D. Parker (1999). They tested the uptake of selenium in Strawberry (Trifolium fragiferrum L.) and ryegrass (Lolium perenne L.) with different levels of sulphate and phosphate in a nutrient solution experiment at pH 6.0. They concluded that sulphate-selenate antagonism is stronger than phosphate selenite antagonism. However, in our experiment, we did not see a clear effect of the form of Se on S or P plant uptake, probably due to the much lower concentration of Se applied compared to S and P. Selenate was translocated from root to shoot more efficiently than selenite. Selenite tends to accumulate in plant roots. These results are in the same line as the results found by Li et al. (2008) and Chen, Jiang,
(a)
0.E+00
2.E-06
4.E-06
6.E-06
8.E-06
1.E-05
1.E-05
2 4 6 8 10
Conc
entr
atio
n in
sol
utio
n [m
ol/l
]
pH
SeO3HSeO3-1H2SeO3
(b)
0.E+00
2.E-06
4.E-06
6.E-06
8.E-06
1.E-05
1.E-05
2 4 6 8 10
Conc
entr
atio
n in
sol
utio
n [m
ol/l
]
pH
SeO4
HSeO4-1
37

and Li (2011). They found that the form of selenium added had a marked effect on the distribution of Se between roots and shoots. Selenate tends to be better distributed from roots to shoots. In the case of selenite, it tended to accumulate in roots of wheat (Triticum aestivum) at pH 6.0. They also found that selenate tends to be the most dominant species in most plant tissues when selenate was supplied to the nutrient solution. On the other hand, when selenite is added it tends to be converted into organic selenium forms in the root like selenomethionine. 4.2. For the pot experiment: Soil type and pH were important factors for the bioavailability of selenium in soil. Even though it has been suggested that sandy soils may have more bioavailable selenium due to fewer adsorption sites and the lower content of clay (Carlson, Adriano, & Dixon, 1991), this experiment showed opposite results. The sandy soil used tends to have less selenium in soil solution than the loamy soil. This could be related to the fact that selenium added to the pot experiment was relatively low in comparison to the natural content of selenium in the different soils. Se in the soil solution is probably mainly determined by the original soluble concentration. Comparing the amount of soluble selenium in the sandy soil with the amount in the loamy soil, the latter has approximately 3.5 times higher than the sandy soil. For both soils, less selenium was soluble in soil solution at the low pH treatment (4.82 and 7.34 for sandy and loamy respectively) than at the high pH treatment (7.65 and 7.8 for sandy and loamy respectively). It has been found that Se in CaCl2 soil extraction of Dutch agricultural soils is mainly organic Se (Weng, Vega, Supriatin, Bussink, & Van Riemsdijk, 2011). However, in current experiment, the increase of pH in the sandy and loamy soil has led to only limited increase of DOC, and the increase of soluble Se concentration with pH is much stronger than the DOC increase. Therefore we can deduce that a higher pH favours the dissolution of Se-rich organic matter. In the case of clay soil, selenium content in soil solution showed an interaction effect with boron levels. More selenium in soil solution was present at high boron levels. The mechanism of this effect is unclear. This could be related to a competition of boron with Se for adsorption sites in soils. Normally boric acid receives an OH- and forms borate anion which has an affinity for positive charges on iron and aluminium (hydr)oxides and clay edges (Goldberg, 1997). Boron can also be bound to soil organic matter. Other anions such as silicate, sulphate, phosphate can also be bound to oxides and can decrease B adsorption to Fe and Al (hydr)oxides (Bloesch, Bell, & Hughes, 1987; Choi & Chen, 1979; Goldberg, Forster, & Heick, 1993). In the case of adsorption to clay edges, Goldberg, Forster, Lesch, and Heick (1996) found that there is little competitive effect on B adsorption even by phosphate anion. They concluded that B adsorbing sites are essentially specific to B and act independently of competing anion. Therefore an addition of boron may increase the replacement of selenium bounded to the specific adsorption sites of boron and thus released to the soil solution. However, this explanation remains speculative especially due to the reason that soluble Se in the clay soil is likely to be mainly organic Se. More research is needed to understand it better. Selenium uptake in sandy soil was a bit higher at low pH and low phosphate concentration that at high pH and low phosphate concentration, which is not following the pH effect on soluble Se concentration. This unexpected result could be related to the increase in biomass found in the sandy soil with high pH. A higher biomass might result in a dilution of Se concentration in the plant. Therefore, when comparing the amount of Se in sandy soil, the sandy treatment with low pH will show a higher content of selenium which in reality is the same as the high pH treatments. Rodriguez-Barrueco, Chien, and Menon (1996) found similar dilution effects of biomass when working with cadmium and phosphate fertilization. They found that the concentration of Cd in the plant of Maize (Zea mays L.) was reduced when a higher concentration was added to the experimental crops. Phosphate induced a higher production of biomass because maize was able to uptake more nitrogen. Therefore the concentration of Cd was lower due to the dilution effect of biomass. Lee, Woodard, and Doolittle (2011a) found that, even at high selenium availability in soils, phosphate fertilization can decrease selenium concentration in grains of wheat (Triticum aestivum) due to the dilution effect of biomass.
38

Figure 29. Conceptual model of pH effect on Se distribution in soil, uptake and translocation in plants. In the loamy soil, selenium uptake by grass plant was higher at high pH. This result is in accordance with the results of Gissel-Nielsen.G (1971) and Eich-Greatorex et al. (2007) where with increasing pH, the adsorption of selenium in soil generally decreases. Thus higher bioavailability of selenium is normally found in mineral soils with high pH. Different phosphate levels did not present a strong effect on the selenium uptake. This result can be related to the relative small difference between pH levels in loamy soil (7.34 to 7.80). On the other hand, boron level did show an effect on selenium uptake at low pH. High levels of boron treatments presented higher content of Se in plants in comparison with low levels of boron treatments. These results are in contradiction with the findings of Mikkeisen, Haghnia, and Page (1987). They found that selenium concentration in alfalfa (Medicago sativa L.) was negatively correlated with B. A higher concentration of boron resulted in a lower concentration of Se in plant tissue. A main difference between the experiment of Mikkeisen et al. and this experiment is the addition of selenium in the form of selenate. Nevertheless, it is still unclear how an increase in boron concentration may influence positively the uptake of selenium. Se uptake results from the sandy soil are contradictory in comparison to the loamy soil. Loamy soil showed a higher uptake at high pH levels which is in agreement with results of previous studies related to selenium (Eich-Greatorex et al., 2007; Gissel-Nielsen.G, 1971; Selinus, 2013). Sandy soil showed an opposite result. Less Se was taken up by grass plants at high pH. This difference could be related in first instance to the small difference between pH levels. As seen in the hydroponic experiment, a large change in pH from 4.0 to 5.5 showed a dramatic decrease in the content of Se in shoots when applied as selenite. On the other hand, when the pH changed from 5.5 to 7.0, the content of Se in shoots was relatively stable. Sandy soil had bigger variation on the pH levels in the pot experiment. The selenium added was in the form of selenite which, as seen in the hydroponic experiment, is easily taken up by the plant at low pH. However, at low pH selenite tends to be adsorbed to the soil particles. Additionally, in the pot experiment selenium content in soil is mostly organic. The difference on the pH effect may be related to the content of organic matter of each soil. The sandy soil had 3.8% of organic matter which is higher compared to the 2.7% in the loamy soil. At high pH, organic matter is less stable therefore more selenium would be soluble in soil solution. The most logical explanation to the higher content of Se in the sandy soil with low pH is that sandy soil with high pH had a greater biomass production rather than low pH treatments in the same soil. A possible dilution effect of the biomass may affect the results in the sandy soil.
39

Se content in soil solution and pH were not good predictors for the content of Selenium in plant as none significant regressions were found. These results are in agreement with the results found by Weng et al. (2011). They found Se in soil solution was not a good predictor of the content of selenium in grass plant (Lolium perenne L.). As well, they also found that the most relevant factor that controls the Se availability in soils is mineralization of organic Selenium. Finally, they suggested that concentration of small DOC, soluble sulphur and/or phosphorus can explain the most variability of Se content in grass.
4.3. For Adsorption batch experiment Both, the adsorption isotherm experiment and the adsorption envelope experiment showed that selenite is more adsorbed at low pH than at high pH in sandy soil because with decreasing pH more positive charges are available on sesquioxides and clay minerals. This is related to the increase in the amount of pH-dependant binding sites at low pH (Eich-Greatorex et al., 2007; Lee, Woodard, & Doolittle, 2011b) thus more selenite is adsorbed to soil particles. This result is in agreement with the results found by several investigators who also found that less selenite is adsorbed to soils at high pH (Balistrieri & Chao, 1990; Hamdy & Gissel-Nielsen, 1977; Lee, Doolittle, & Woodard, 2011; Nakamaru, Tagami, & Uchida, 2005; Su & Suarez, 2000). In acid and neutral soils, selenite forms very insoluble iron oxide and oxyhydroxide complexes such as ferric selenite [Fe2(OH)4 SeO3] which is a precipitate (Frankenberger, 1994; Rosenfeld & Beath, 1964; Selinus, 2013). Selenate showed almost no adsorption to all soils in this experiment. Different types of soil also affected the adsorption of selenite. Clay soil showed the highest adsorption followed by loamy soil while sandy soil showed the lowest adsorption at the same pH (~7.5). Even though selenite is mostly adsorbed by iron hydroxides (Balistrieri & Chao, 1987, 1990), edges of clay particles are charged positively and they can also adsorb selenite (Rajan & Watkinson, 1976). In this experiment it was estimated that one mg of clay has the same binding capacity as 33 ng of FeOH3. This explains why clay soil adsorbed more selenite. The adsorption of selenite was positively related to sum of the amount of oxide and clay and negatively related to the amount of organic matter in each soil. These results are in agreement with the findings of Dhillon and Dhillon (1999). They found that adsorption of selenite to different soils of India was directly related to the amount of iron (hydr)oxides. They suggest that a higher amount of ammonium oxalate extractable iron in those soils should be the reason for greater retention of selenite. Moreover, they also suggest that the type of clay and its content in those soils also play a role in the adsorption of selenite. They suggest that possibly, anions of selenite are retained by clay minerals through replacement of OH-
and kaolinite contains 4 OH- groups more per unit crystal than montmorillonite. The Freundlich model fitted quite well to the data of the adsorbed isotherm as reported by several studies (de Abreu, Carvaho, Curi, Guilherme, & Marques, 2011; Dhillon & Dhillon, 1999; Mouta, de Melo, Soares, Alleoni, & Casagrande, 2008; Pezzarossa, Piccotino, & Petruzzelli, 1999). Sposito (1980) mathematically proved that the N-parameter in the Freundlich model measures the heterogeneity of adsorption sites. As the N-parameter approaches to zero, heterogeneity of adsorption sites increases and vice versa. The N parameter in Freundlich equation is also an indicator of the adsorption intensity. Results from this experiment suggest that the heterogeneity of adsorption sites differs between soils. Clay soil showed the lowest N-parameter followed by loamy and finally sandy soil, indicating a higher heterogeneity in the binding site and a lower binding affinity of the clay soil than the loamy and sandy soil. The higher heterogeneity and lower affinity of the binding sites in the clay soil can be attributed to the larger role that clay plays for selenite adsorption in this soil compared to the other soils. On the other hand, the K parameter in the Freundlich equation is related to the binding capacity. The K value derived is in the order of clay soil>loamy soil>sandy soil, in line with the observation that clay soil adsorbed more Se than the other soils at similar pH’s. The adsorption envelope experiment showed that an increase in pH produced an increment of DOC and Se in solution, in the absence and presence of selenite added. This suggests that Se and DOC are somewhat related. The relationship between DOC and Se may be due to Se has great affinity with organic matter (OM) especially humic (HA) and fulvic (FA) acids (Qin, Zhu, & Su, 2012). DOC increases with increasing pH because the organic matter that is adsorbed to the soil particles is released at high pH (Chirenje & Ma, 1999; Karavanova, 2013; Oste, Temminghoff, & Van Riemsdijk, 2002). This experiment also showed us that selenite was mainly adsorbed by amorphous Fe and Al (hydr)oxides. Goldberg
40

(2013) found a similar behaviour in the selenite adsorption to oxides. Among his findings he described that on oxide minerals, selenite adsorption exhibited a broad maximum up to pH 8 and then decreased rapidly with increasing solution pH as seen in Figure 27b.
4.4. Comparing pH effect in the hydroponic, pot and adsorption experiment To synthesize the results of these three experiments, a comparison using the conceptual model (Figure 29) will be explained as following.
In the hydroponic experiment, the pH effect on the plant is mostly detected in the uptake of different forms of selenium. At low pH, grass plant tended to take up more selenite than selenate. This selenite was accumulated in the roots of grass as showed by the lower shoot-root ratio found in the low pH treatments from the hydroponic experiment. The pH effect had a turnover at pH 5.5 and 7.0 where selenate was more taken up by plants rather than selenite.
At the moment that soil factor is included in the overall picture, pH affects selenium in a different way. First of all, selenite is strongly adsorbed to soil particles at different pH in comparison to selenate. As reported by Balistrieri and Chao (1987) selenite tends to form complexes with iron oxides as an inner sphere while selenate does it as an outer sphere. This is one of the reasons why selenate is weakly adsorbed in soils. Therefore, selenate will be the most available species in soils but it could also be washed out of the soils becoming a threat to the environment. On the other hand, selenite tends to be unavailable at low pH because, as shown in the adsorption experiment, its adsorption increases at low pH levels. At high pH, selenite increases in soil solution because less selenite is adsorbed to the soils particles. The adsorption envelope experiment revealed that selenium and DOC are related to some extent, at high pH more selenium (probably organic) and DOC were present in the CaCl2 solution. Nevertheless, this relation was not observed in the pot experiment. DOC measurements revealed quite stable levels of DOC for all soil types in the latter experiment.
Additionally in the pot experiment, it is not possible to relate the effect of pH to the adsorption of selenite to soil particles. This is because the amount of inorganic selenium applied in the experiment was veritable low in comparison to the existing amount of selenium in the different soils. Therefore the selenium available in solution during the experiment was mostly organic Se. We suspect that pH had an effect on the stability of organic matter. At high pH, organic matter is less stable and organic selenium could be released. Abrams, Shennan, et al. (1990) reported that organic forms of selenium were easily absorbed by roots of wheat in a hydroponic experiment with pH 6.0. However Eich-Greatorex et al. (2007) reported that not even pure selenomethionine was able to increase the Se content in wheat plants when applied into the soil as an organic source of selenium. Therefore some kind of mineralization might affect the organic Se released by organic matter in order to be easily absorbed by plants in the form of selenite.
5. CONCLUSIONS The conclusions of this research are linked to the research questions proposed before.
• Which form of selenium (Selenite or selenate) is most absorbed by Italian rye grass at different pH’s? The form of selenium applied had a strong effect on the bioavailability of selenium. When soil factor is not present, selenite tends to be more taken up by the roots of grass, especially at a lower pH. But, when the soil factor is included, selenate, if present, will become the dominant soluble specie because selenite tends to be strongly bound by the soil particles and thus it becomes unavailable for plants especially at low pH. But because of the large solubility of selenate and weak adsorption, selenate can be soon leached out from soil, and selenite and soluble organic Se may be the dominant forms that plants take up from soils. Selenium form also has an effect on the mobility of selenium in the plant. Selenite tends to be accumulated in roots and is inefficiently translocated to shoots. Selenate tends to be easily translocated from roots to shoots.
• How does phosphate level in soils interact with selenite in the plant uptake at different pH’s?
41

In the hydroponic experiment, phosphate did not show a clear effect over the uptake of selenium when applied as selenate, and phosphate has shown a small reduction effect on selenium uptake when supplied as selenite. In the pot experiment an effect of level of phosphate fertilization was observed at low pH not at high pH. At low pH Se uptake is higher at a low P level than at a high P level. This proves that phosphate competes with selenium for transporter sites on plant roots. This competition occurs especially when Se is in the form of selenite, in line with the idea that selenite uses phosphate transporter, whereas selenate uses sulphate transporter.
• To what extent are pH changes responsible for the increment or reduction in plant uptake of Selenium?
pH effect on Se uptake and translocation in the hydroponic experiment depends on the chemical form of Se. When applied as selenate, pH did not show a big effect on both root uptake and translocation from root to shoot. When applied as selenite, a low pH favours not only root uptake but also root to shoot transport. In the soil-plant system, the pH effect on Se plant uptake is more complicated. On the soil side, pH tends to affect factors like number of available binding sites in soil, amount of dissolved organic matter in soil solution, bioavailability of phosphate, chemical species of selenium among others. On the plant side, pH affects Se uptake by roots and transport from root to shoot. These factors affected the bioavailability of selenium and consequently its uptake. The net pH effect depends on the combination of all these processes. In the pot experiment, a small decrease of Se uptake was seen in the sandy soil when pH increased from 4.82 to 7.65. In the loamy soil, a significant Se uptake increase was observed when pH increased from 7.34 to 7.65. An increase of pH has led in general to an increase of soluble Se, but apparently the concentration of soluble Se is not the only factor determining Se uptake. The adsorption experiment showed that selenate binding to soils is rather weak. And adsorption of selenite to soil decreases with increasing pH, and is positively related to soil iron oxides and clay content and negatively related to soil organic matter content. However, one has to be careful when comparing the pH effect on selenite adsorption to soil and on Se speciation and bioavailability in soils, because without Se fertilization or with low amount fertilization, soluble Se is mainly organic Se.
• What relations does the Selenium have with other elements like B, P and S at different pH’s?
Selenium has different types of interactions with boron, phosphor and sulphur, depending on the form of selenium that is compared. Normally, selenate competes with sulphur to enter to plants because of its chemical similarity and they are taken up by plants with the same transporters. On the other hand, selenite competes with phosphate for adsorption sites in soil particles and for transporters on plants. Boron showed an effect on the selenium uptake which might be also related to the competition with adsorption sites specifically for B and Se, like on soil organic matter.
42

REFERENCES Abrams, M. M., Burau, R. G., & Zasoski, R. J. (1990). Organic Selenium Distribution in Selected California Soils.
Soil Science Society of America Journal, 54(4), 979-982. Abrams, M. M., Shennan, C., Zasoski, R. J., & Burau, R. G. (1990). Selenomethionine Uptake by Wheat
Seedlings. Agronomy Journal, 82(6), 1127-1130. Aitken, P. (2001). Selenium toxicity. In Practice, 23(5), 286-289. Algotar, A. M., Stratton, M. S., Ahmann, F. R., Ranger-Moore, J., Nagle, R. B., Thompson, P. A., . . . Stratton,
S. P. (2013). Phase 3 clinical trial investigating the effect of selenium supplementation in men at high-risk for prostate cancer. Prostate, 73(3), 328-335. doi: Doi 10.1002/Pros.22573
Balistrieri, L. S., & Chao, T. T. (1987). Selenium Adsorption by Goethite. Soil Science Society of America Journal, 51(5), 1145-1151.
Balistrieri, L. S., & Chao, T. T. (1990). Adsorption of Selenium by Amorphous Iron Oxyhydroxide and Manganese-Dioxide. Geochimica Et Cosmochimica Acta, 54(3), 739-751. doi: Doi 10.1016/0016-7037(90)90369-V
Bhan, M. K., Sommerfelt, H., & Strand, T. (2001). Micronutrient deficiency in children. British Journal of Nutrition, 85, S199-S203.
Bitterli, C., Banuelos, G. S., & Schulin, R. (2010). Use of transfer factors to characterize uptake of selenium by plants. Journal of Geochemical Exploration, 107(2), 206-216. doi: DOI 10.1016/j.gexplo.2010.09.009
Bloesch, P. M., Bell, L. C., & Hughes, J. D. (1987). Adsorption and Desorption of Boron by Goethite. Australian Journal of Soil Research, 25(4), 377-390. doi: Doi 10.1071/Sr9870377
Brown, T. A., & Shrift, A. (1982). Selenium - Toxicity and Tolerance in Higher-Plants. Biological Reviews of the Cambridge Philosophical Society, 57(Feb), 59-84. doi: DOI 10.1111/j.1469-185X.1982.tb00364.x
Carlson, C. L., Adriano, D. C., & Dixon, P. M. (1991). Effects of Soil-Applied Selenium on the Growth and Selenium Content of a Forage Species. Journal of Environmental Quality, 20(2), 363-368.
Chen, S. Y., Jiang, R. F., & Li, H. F. (2011). Uptake and translocation of selenate or selenite by wheat and rice seedlings. Huan Jing Ke Xue, 32(1), 284-289.
Chirenje, T., & Ma, L. Q. (1999). Effects of acidification on metal mobility in a papermill-ash amended soil. Journal of Environmental Quality, 28(3), 760-766.
Choi, W. W., & Chen, K. Y. (1979). Evaluation of Boron Removal by Adsorption on Solids. Environmental Science & Technology, 13(2), 189-196. doi: Doi 10.1021/Es60150a012
Clark, L. C., Combs, G. F., Turnbull, B. W., Slate, E. H., Chalker, D. K., Chow, J., . . . Taylor, J. R. (1996). Effects of selenium supplementation for cancer prevention in patients with carcinoma of the skin a randomized controlled trial - A randomized controlled trial. Jama-Journal of the American Medical Association, 276(24), 1957-1963. doi: DOI 10.1001/jama.276.24.1957
Coppin, F., Chabroullet, C., & Martin-Garin, A. (2009). Selenite interactions with some particulate organic and mineral fractions isolated from a natural grassland soil. European Journal of Soil Science, 60(3), 369-376. doi: DOI 10.1111/j.1365-2389.2009.01127.x
Das, S., Hendry, M. J., & Essilfie-Dughan, J. (2013). Adsorption of selenate onto ferrihydrite, goethite, and lepidocrocite under neutral pH conditions. Applied Geochemistry, 28, 185-193. doi: DOI 10.1016/j.apgeochem.2012.10.026
de Abreu, L. B., Carvaho, G. S., Curi, N., Guilherme, L. R. G., & Marques, J. J. G. D. E. M. (2011). Selenium Sorption in Soils of the Cerrado Biome. Revista Brasileira De Ciencia Do Solo, 35(6), 1995-2003.
De Temmerman, L., Waegeneers, N., Thiry, C., Du Laing, G., Tack, F., & Ruttens, A. (2014). Selenium content of Belgian cultivated soils and its uptake by field crops and vegetables. Science of the Total Environment, 468, 77-82. doi: DOI 10.1016/j.scitotenv.2013.08.016
Dhillon, K. S., & Dhillon, S. K. (1999). Adsorption-desorption reactions of selenium in some soils of India. Geoderma, 93(1-2), 19-31. doi: Doi 10.1016/S0016-7061(99)00040-3
Duffield-Lillico, A. J., Slate, E. H., Reid, M. E., Turnbull, B. W., Wilkins, P. A., Combs, G. F., . . . Grp, N. P. o. C. S. (2003). Selenium supplementation and secondary prevention of nonmelanoma skin cancer in a randomized trial. Journal of the National Cancer Institute, 95(19), 1477-1481. doi: Doi 10.1093/Jnci/Djg061
EFSA. (2006). Tolerable Upper Intake levels for Vitamins and Minerals. from http://www.efsa.europa.eu/en/ndatopics/docs/ndatolerableuil.pdf
Eich-Greatorex, S., Sogn, T. A., Ogaard, A. F., & Aasen, I. (2007). Plant availability of inorganic and organic selenium fertiliser as influenced by soil organic matter content and pH. Nutrient Cycling in Agroecosystems, 79(3), 221-231. doi: DOI 10.1007/s10705-007-9109-3
Frankenberger, W. T. (1994). Selenium in the Environment: Taylor & Francis. Gissel-Nielsen.G. (1971). Influence of Ph and Texture of Soil on Plant Uptake of Added Selenium. Journal of
Agricultural and Food Chemistry, 19(6), 1165-&. doi: Doi 10.1021/Jf60178a030 Goh, K. H., & Lim, T. T. (2004). Geochemistry of inorganic arsenic and selenium in a tropical soil: effect of
reaction time, pH, and competitive anions on arsenic and selenium adsorption. Chemosphere, 55(6), 849-859. doi: DOI 10.1016/j.chemosphere.2003.11.041
Goldberg, S. (1997). Reactions of boron with soils. Plant and Soil, 193(1-2), 35-48. doi: Doi 10.1023/A:1004203723343
Goldberg, S. (2013). Modeling Selenite Adsorption Envelopes on Oxides, Clay Minerals, and Soils using the Triple Layer Model. Soil Science Society of America Journal, 77(1), 64-71. doi: DOI 10.2136/sssaj2012.0205
Goldberg, S., Forster, H. S., & Heick, E. L. (1993). Boron Adsorption Mechanisms on Oxides, Clay-Minerals, and Soils Inferred from Ionic-Strength Effects. Soil Science Society of America Journal, 57(3), 704-708.
43

Goldberg, S., Forster, H. S., Lesch, S. M., & Heick, E. L. (1996). Influence of anion competition on boron adsorption by clays and soils. Soil Science, 161(2), 99-103. doi: Doi 10.1097/00010694-199602000-00003
Goldberg, S., & Glaubig, R. A. (1988). Anion Sorption on a Calcareous, Montmorillonitic Soil Selenium. Soil Science Society of America Journal, 52(4), 954-958.
Hamdy, A. A., & Gissel-Nielsen, G. (1977). Fixation of selenium by clay minerals and iron oxides. Zeitschrift Fur Pflanzenernahrung Und Bodenkunde, 140(1), 63-70. doi: 10.1002/jpln.19771400108
Hartikainen, H. (2005). Biogeochemistry of selenium and its impact on food chain quality and human health. Journal of Trace Elements in Medicine and Biology, 18(4), 309-318. doi: DOI 10.1016/j.jtemb.2005.02.009
Hartikainen, H., Xue, T. L., & Piironen, V. (2000). Selenium as an anti-oxidant and pro-oxidant in ryegrass. Plant and Soil, 225(1-2), 193-200. doi: Doi 10.1023/A:1026512921026
Hawrylak-Nowak, B. (2013). Comparative effects of selenite and selenate on growth and selenium accumulation in lettuce plants under hydroponic conditions. Plant Growth Regulation, 70(2), 149-157. doi: DOI 10.1007/s10725-013-9788-5
He, Z. L., Yang, X. A., Zhu, Z. X., Zhang, Q. Z., Xia, W. P., & Tan, J. N. (1994). Effect of Phosphate on the Sorption, Desorption and Plant-Availability of Selenium in Soil. Fertilizer Research, 39(3), 189-197. doi: Doi 10.1007/Bf00750246
Hoagland, D. R., & Arnon, D. I. (1950). The water-culture method for growing plants without soil. Berkely,: The College of Agriculture.
Hopper, J., & Parker, D. (1999). Plant availability of selenite and selenate as influenced by the competing ions phosphate and sulfate. [Plant and Soil]. 210(2), 199-207. doi: 10.1023/a:1004639906245
Hopper, J. L., & Parker, D. R. (1999). Plant availability of selenite and selenate as influenced by the competing ions phosphate and sulfate. Plant and Soil, 210(2), 199-207. doi: Doi 10.1023/A:1004639906245
Hyun, S., Burns, P. E., Murarka, I., & Lee, L. S. (2006). Selenium(IV) and (VI) sorption by soils surrounding fly ash management facilities. Vadose Zone Journal, 5(4), 1110-1118. doi: Doi 10.2136/Vzj2005.0140
Jacobs, L. W., American Society of Agronomy. Division A-5., & Soil Science Society of America. (1989). Selenium in agriculture and the environment : proceedings of a symposium. Madison, Wis., USA: American Society of Agronomy : Soil Science Society of America.
Johnsson, L. (1991). Selenium Uptake by Plants as a Function of Soil Type, Organic-Matter Content and Ph. Plant and Soil, 133(1), 57-64. doi: Doi 10.1007/Bf00011899
Karavanova, E. I. (2013). Dissolved organic matter: Fractional composition and sorbability by the soil solid phase (Review of literature). Eurasian Soil Science, 46(8), 833-844. doi: Doi 10.1134/S1064229313080048
Kikkert, J., & Berkelaar, E. (2013). Plant uptake and translocation of inorganic and organic forms of selenium. Arch Environ Contam Toxicol, 65(3), 458-465. doi: 10.1007/s00244-013-9926-0
Lauchli, A. (1993). Selenium in Plants - Uptake, Functions, and Environmental Toxicity. Botanica Acta, 106(6), 455-468.
Lee, S., Doolittle, J. J., & Woodard, H. J. (2011). Selenite Adsorption and Desorption in Selected South Dakota Soils as a Function of pH and Other Oxyanions. Soil Science, 176(2), 73-79. doi: Doi 10.1097/Ss.0b013e31820a0ff6
Lee, S., Woodard, H. J., & Doolittle, J. J. (2011a). Effect of phosphate and sulfate fertilizers on selenium uptake by wheat (Triticum aestivum). Soil Science and Plant Nutrition, 57(5), 696-704. doi: Doi 10.1080/00380768.2011.623282
Lee, S., Woodard, H. J., & Doolittle, J. J. (2011b). Selenium uptake response among selected wheat (Triticum aestivum) varieties and relationship with soil selenium fractions. Soil Science and Plant Nutrition, 57(6), 823-832. doi: Doi 10.1080/00380768.2011.641909
Li, H.-F., McGrath, S. P., & Zhao, F.-J. (2008). Selenium uptake, translocation and speciation in wheat supplied with selenate or selenite. New Phytologist, 178(1), 92-102. doi: 10.1111/j.1469-8137.2007.02343.x
Longchamp, M., Angeli, N., & Castrec-Rouelle, M. (2013). Selenium uptake in Zea mays supplied with selenate or selenite under hydroponic conditions. Plant and Soil, 362(1-2), 107-117. doi: DOI 10.1007/s11104-012-1259-7
Martens, D. A. (2003). Selenium. In B. A. Stewart & T. Howell (Eds.), Encyclopedia of water Science (pp. 840-842). New York: Marcel Dekker.
Mehdi, Y., Hornick, J. L., Istasse, L., & Dufrasne, I. (2013). Selenium in the Environment, Metabolism and Involvement in Body Functions. Molecules, 18(3), 3292-3311. doi: DOI 10.3390/molecules18033292
Mikkeisen, R. L., Haghnia, G. H., & Page, A. L. (1987). Effects of pH and selenium oxidation state on the selenium accumulation and yield of alfalfa. [Journal of Plant Nutrition]. Journal of Plant Nutrition, 10(8), 937-950. doi: 10.1080/01904168709363621
Mikkelsen, R. L., Haghnia, G. H., Page, A. L., & Bingham, F. T. (1988). The Influence of Selenium, Salinity, and Boron on Alfalfa Tissue Composition and Yield. Journal of Environmental Quality, 17(1), 85-88.
Mikkelsen, R. L., & Wan, H. F. (1990). The effect of selenium on sulfur uptake by barley and rice. [Plant and Soil]. 121(1), 151-153. doi: 10.1007/bf00013109
Mouta, E. R., de Melo, W. J., Soares, M. R., Alleoni, L. R. F., & Casagrande, J. C. (2008). Selenium adsorption in Oxisols. Revista Brasileira De Ciencia Do Solo, 32(3), 1033-1041. doi: Doi 10.1590/S0100-06832008000300012
Nakamaru, Y., Tagami, K., & Uchida, S. (2005). Depletion of selenium in soil solution due to its enhanced sorption in the rhizosphere of soybean. Plant and Soil, 278(1-2), 293-301. doi: DOI 10.1007/s11104-005-8769-5
Oste, L. A., Temminghoff, E. J. M., & Van Riemsdijk, W. H. (2002). Solid-solution partitioning of organic matter in soils as influenced by an increase in pH or Ca concentration. Environmental Science & Technology, 36(2), 208-214. doi: Doi 10.1021/Es0100571
44

Pezzarossa, B., Piccotino, D., & Petruzzelli, G. (1999). Sorption and desorption of selenium in different soils of the Mediterranean area. Communications in Soil Science and Plant Analysis, 30(19-20), 2669-2679. doi: Doi 10.1080/00103629909370404
Pilon-Smits, E. A., Hwang, S., Mel Lytle, C., Zhu, Y., Tai, J. C., Bravo, R. C., . . . Terry, N. (1999). Overexpression of ATP sulfurylase in indian mustard leads to increased selenate uptake, reduction, and tolerance. Plant Physiology, 119(1), 123-132.
Qin, H. B., Zhu, J. M., & Su, H. (2012). Selenium fractions in organic matter from Se-rich soils and weathered stone coal in selenosis areas of China. Chemosphere, 86(6), 626-633. doi: DOI 10.1016/j.chemosphere.2011.10.055
Rajan, S. S. S., & Watkinson, J. H. (1976). Adsorption of Selenite and Phosphate on an Allophane Clay. Soil Science Society of America Journal, 40(1), 51-54.
Reid, M. E., Duffield-Lillico, A. J., Slate, E., Natarajan, N., Turnbull, B., Jacobs, E., . . . Marshall, J. R. (2008). The nutritional prevention of cancer: 400 mcg per day selenium treatment. Nutrition and Cancer-an International Journal, 60(2), 155-163. doi: Doi 10.1080/01635580701684856
Rodriguez-Barrueco, C., Chien, S. H., & Menon, R. G. (1996). Dilution effect of plant biomass on plant cadmium concentration as induced by application of phosphate fertilizers Fertilizers and Environment (Vol. 66, pp. 437-442): Springer Netherlands.
Rosenfeld, I., & Beath, O. A. (1964). Selenium: geobotany, biochemistry, toxicity, and nutrition. New York,: Academic Press.
Rotruck, J. T., Pope, A. L., Ganther, H. E., Swanson, A. B., Hafeman, D. G., & Hoekstra, W. G. (1973). Selenium - Biochemical Role as a Component of Glutathione Peroxidase. Science, 179(4073), 588-590. doi: DOI 10.1126/science.179.4073.588
Rovira, M., Gimenez, J., Martinez, M., Martinez-Llado, X., de Pablo, J., Marti, V., & Duro, L. (2008). Sorption of selenium(IV) and selenium(VI) onto natural iron oxides: Goethite and hematite. Journal of Hazardous Materials, 150(2), 279-284. doi: DOI 10.1016/j.jhazmat.2007.04.098
Saeki, K., & Matsumoto, S. (1994). Selenite Adsorption by a Variety of Oxides. Communications in Soil Science and Plant Analysis, 25(11-12), 2147-2158. doi: Doi 10.1080/00103629409369178
Schwarz, K., & Foltz, C. M. (1957). Selenium as an Integral Part of Factor-3 against Dietary Necrotic Liver Degeneration. Journal of the American Chemical Society, 79(12), 3292-3293. doi: Doi 10.1021/Ja01569a087
Selinus, O. (2013). Essentials of medical geology : revised edition. New York: Springer. Shapiro, S. S., & Wilk, M. B. (1965). An Analysis of Variance Test for Normality (Complete Samples).
Biometrika, 52, 591-&. doi: Doi 10.2307/2333709 Smith, F. W., Ealing, P. M., Hawkesford, M. J., & Clarkson, D. T. (1995). Plant Members of a Family of Sulfate
Transporters Reveal Functional Subtypes. Proceedings of the National Academy of Sciences of the United States of America, 92(20), 9373-9377. doi: DOI 10.1073/pnas.92.20.9373
Sposito, G. (1980). Derivation of the Freundlich Equation for Ion-Exchange Reactions in Soils. Soil Science Society of America Journal, 44(3), 652-654.
Su, C. M., & Suarez, D. L. (2000). Selenate and selenite sorption on iron oxides: An infrared and electrophoretic study. Soil Science Society of America Journal, 64(1), 101-111.
Terry, N., Zayed, A. M., de Souza, M. P., & Tarun, A. S. (2000). Selenium in higher plants. Annual Review of Plant Physiology and Plant Molecular Biology, 51, 401-432. doi: DOI 10.1146/annurev.arplant.51.1.401
Wang, J. W., Wang, Z. H., Mao, H., Zhao, H. B., & Huang, D. L. (2013). Increasing Se concentration in maize grain with soil- or foliar-applied selenite on the Loess Plateau in China. Field Crops Research, 150, 83-90. doi: DOI 10.1016/j.fcr.2013.06.010
Weng, L., Vega, F. A., Supriatin, S., Bussink, W., & Van Riemsdijk, W. H. (2011). Speciation of Se and DOC in soil solution and their relation to Se bioavailability. Environmental Science & Technology, 45(1), 262-267. doi: 10.1021/es1016119
Wu, L. (1994). Selenium Accumulation and Colonization of Plants in Soils with Elevated Selenium and Salinity. In W. T. Frankenberg & S. Benson (Eds.), Selenium in the Environment (pp. 279-327). New York: Marcel-Dekker.
Wu, L. (2004). Review of 15 years of research on ecotoxicology and remediation of land contaminated by agricultural drainage sediment rich in selenium. Ecotoxicology and Environmental Safety, 57(3), 257-269. doi: Doi 10.1016/S0147-6513(03)00064-2
Yang, G. Q., Wang, S. Z., Zhou, R. H., & Sun, S. Z. (1983). Endemic Selenium Intoxication of Humans in China. American Journal of Clinical Nutrition, 37(5), 872-881.
Zayed, A. M., & Terry, N. (1992). Selenium Volatilization in Broccoli as Influenced by Sulfate Supply. Journal of Plant Physiology, 140(6), 646-652. doi: http://dx.doi.org/10.1016/S0176-1617(11)81018-7
45

ANNEXES
Annex 1. Photos from the hydroponic experiment.
Pictures 1 & 2. Germination of seedlings (left). Preparation of nutrient solution (right)
Pictures 3 & 4. Measuring pH of nutrient solution (left) and setup of the hydroponic experiment (right).
Pictures 5 & 6. Final days of hydroponic experiment (left) and harvesting (right).
46

Annex 2. Photos from the pot experiment.
Pictures 7 & 8. Pot filling with the incubated soils (left). Germination layer and watering pipe (right)
Pictures 9 & 10. Sowing of grass seeds (left) pots before germination (right).
Pictures 11 & 12. Germination under plastic cover (left) final days of the pot experiment (right).
47


![[320] Web 3: Selenium · for Selenium Java module for Selenium Ruby module for Selenium JavaScript mod for Selenium Chrome Driver Firefox Driver Edge Driver. Examples. Starter Code](https://static.fdocuments.net/doc/165x107/5eadce82cc4f0d7405687f01/320-web-3-selenium-for-selenium-java-module-for-selenium-ruby-module-for-selenium.jpg)