Final Report Rainfall Runoff Prediction Written by George ...
72
Final Report Rainfall Runoff Prediction Written by George Limpert In association with CARES and Chris Barnett With the mentoring of Dr. Neil Fox For CS 4970, Senior Capstone Design I
Transcript of Final Report Rainfall Runoff Prediction Written by George ...

Final ReportRainfall Runoff PredictionWritten by George Limpert
In association with CARES and Chris BarnettWith the mentoring of Dr. Neil Fox
For CS 4970, Senior Capstone Design I

Table of Contents
0. Introduction Page 31. Problem Definition Page 61.1.Problems & Needs Page 61.2.Background Information Page 81.2.1.WSR-88D Page 81.2.2.GIS Page 121.3.Literature Survey Page 131.3.1.The WSR-88D Rainfall Algorithm Page 131.3.2.Automated Bright Band Detection Page 161.3.3.Calibrating Radar Precipitation Estimates Page 181.3.4.Comparison of Radar Precipitation Estimates Page 201.3.5.Effect of Storm Type on Radar Precipitation Estimates Page 221.4.Goals & Prototypes Page 241.5.Cost & Feasibility Page 262. Requirements Analysis Page 272.1.Introduction Page 272.2.Overall Description Page 282.3.System Requirements and Constraints Page 292.3.1.Operating Environment Page 292.3.2.Market Users and Characteristics Page 312.3.3.Environmental Constraints Page 332.3.4.System Components Page 342.3.5.Software Interfaces and Libraries Page 362.3.6.Communication Interfaces Page 372.3.7.Hardware Interfaces Page 382.3.8.Software Maintenance, Life Cycle and Support Page 392.4.Performance Requirements Page 402.5.Resource Requirements Page 412.6.Evaluation Metrics Page 422.7.Alternative Solutions Page 433. Design Specifications Page 453.1.Introduction Page 453.2.Basic System Design Page 463.3.Data Requirements Page 473.4.Software Design Page 483.5.Testing Methods Page 523.6.Scheduling Page 533.7.System Implementation Page 543.8.System Testing Page 554. Technical Report Page 564.1.Introduction Page 564.2.Execution Page 574.3.Prototypes Page 594.4.Conclusion and Discussion Page 615. Future Work Page 636. Licensing Page 667. References Page 72

0. Introduction
In this report, I will describe the process by which I attempted to develop a
system for decoding radar data for the purpose of predicting the runoff of rainfall.
The reader will be presented with a background on the technologies in use and
some related work. Following this, the problem will be clearly defined and the
requirements for the project will be outlined. The design of the proposed finished
product will then be described. This describes the process in which the system was
developed.
The second half of the report focuses on the current status of the product. It is
not completed, but a working prototype has been created. The report describes the
prototype, its functionality, and describes the future work on the project. An
evaluation of the project is included at this point.
It is my belief that while the project did not meet its initial goals by the end of
the semester, it is not a failure. Unintended uses of the product and the software
within have been found. For example, a completely unrelated forecasting system
uses some source code from the software in this project. Also, the radar data format,
which is somewhat obscure, has been partially documented. This is beneficial for
someone else wishing to decode level III radar data, even if their product serves a
completely different purpose.
I hope after reading this report that the reader will gain a better understanding
and appreciation for the doppler radar technology that the National Weather Service
has developed. Furthermore, I hope the reader will gain a better appreciation for the
hard work that is involved in forecasting weather. As a meteorologist, it is frustrating
to be at the receiving end of jokes about how the forecasting of weather is extremely
inaccurate. While there are still many busted forecasts, our understanding of the
atmosphere and the processes within is constantly improving. Furthermore, the

technology used to detect and predict the weather is constantly being developed and
improved. At the time of writing this report, there is work underway to replace the
WSR-88D systems with newer radar technology. Despite the great benefits realized
by the implementation of these radar systems, there is much better technology that
is being developed. Weather forecasting is far more accurate than, for example,
flipping a coin, despite the comments of some comedians. It is a hard science which
benefits greatly from chemistry, computer science, mathematics, physics, and many
other branches of science. Even if you don't find the product useful, hopefully the
reader will have a better appreciation for meteorology after reading this report.
Special thanks is owed to three people who greatly assisted in the
development of this system.
First, I want to thank Steve Lack for his efforts in contributing to and improving
this project. Without his help in understanding the operation of radar, I would have
struggled much more with decoding the level III data.
Second, I want to thank Chris Barnett for his help in providing me with
information about GIS file formats and for his guidance in developing this project.
Without him, I would have developed this project with little sense of direction and
without a clear goal in mind. Furthermore, I would have been ignorant to the
requirements that a system such as the one I am developing has.
Finally, I want to thank Dr. Neil Fox for mentoring me and assisting me in the
development of this project. He is as close to an expert on radar as we have at the
University of Missouri. His knowledge of the subject was very helpful in decoding this
data. Furthermore, he helped me with finding answers to meteorological questions
which I did not have an answer to such as the resolution of the digital precipitation
array. Also, he helped me in verifying the data I converted. Finally, he guided my
project away from my initial plans and directed me towards creating a system which

would have practical uses at the university. Without his mentoring, I would not have
even started this project.
With that being said, I hope the reader finds my project report very useful and
informative. I also hope the reader comes away with a better appreciation for the
science of meteorology.

1. Problem Definition
1.1. Problem & Needs
One of the many important aspects of meteorology is hydrology. While it is
extremely important to understand what is occurring within the atmosphere and
about precipitation falling, it is also important to understand and forecast what
happens once the precipitation reaches the ground. Floods kill more people each
year than any other meteorological phenomena. Even in areas that don't usually
receive severe weather, flooding is often a threat. Hydrology is the branch of
meteorology that deals with what happens to precipitation after it reaches the
surface.
Hydrology also has important uses to agriculture. For example, soil has a limit
on how much water it can absorb. Different types of soils can absorb different
amounts of water before becoming saturated. Once the soil is saturated, additional
rainfall will run off. This can lead to flooding, but can also lead to erosion of topsoil.
Chemicals and fertilizers that have been applied may be washed away with the
water when run-off occurs. While these chemicals are useful to farmland, they may
be harmful in other places, particularly in streams and rivers. Some of these
chemicals include pesticides and herbicides which may be harmful to wildlife. It is
important to ensure that these chemicals, when applied, to not run-off into areas
where they would be harmful.
Because of these needs in agriculture and to predict flooding, it is very useful
to develop a product which can be used to forecast when run-off will occur. While
this depends somewhat on the amount of rainfall received over a certain time, it also
depends on the land. Topography and soil type are major factors in determining
when run-off will occur. Topographical data is widely available in formats that can be
manipulated and displayed by GIS systems. While many methods exist for

estimating precipitation, one of the best available is radar estimates of precipitation.
Radar data, however, is distributed in a very different format. To create a useful
product, it is necessary to merge geographic and precipitation data into a common
format so they can be displayed together.
The purpose of this project, given these needs, is to create a system for
collecting radar estimates of precipitation and converting this data into a format
which can be manipulated by GIS software. This data will then be delivered to a GIS
system which is capable of merging the radar data with existing geographic data to
create useful products. The data will likely be distributed through an existing website
to make it available to the agricultural community.

1.2. Background Information
1.2.1. Background Information: WSR-88D
An understanding of Doppler radar and the WSR-88D systems implemented
by the National Weather Service is essential for understanding this project. Data
from these radars are the basis for the rest of this project.
Ordinary radars operate by sending out pulses of energy. A portion of this
energy may be reflected back to the radar by objects in the path of the energy pulse.
The time it takes for a pulse to return to the radar site can be used to estimate the
distance of the object. The amount of energy reflected can also be useful in
determining some characteristics of the object which reflected the energy.
Doppler radar adds another useful parameter that can be detected. Radial
velocity is a measure of an object's motion towards or away from the radar site. This
can be determined because of the Doppler Effect. An approaching object, when
reflecting the energy, will also cause the waves to be compressed, resulting in a blue
shifting. An object moving away, when it reflects the energy, will cause the waves to
be stretched, which results in red shifting. By detecting these variations in frequency
of the reflected energy pulse, an object's radial velocity can be determined.
In meteorology, all of these parameters are extremely useful. Areas in the
atmosphere with greater concentrations of particles will reflect more energy than
areas of lesser particle concentration. Areas with more particles, if the particles are
water droplets, are likely receiving heavier precipitation. Reflectivity is somewhat
proportional to the amount of precipitation. Velocity is also important, particularly in
the context of severe weather. While velocity information may be used to detect
atmospheric boundaries and some other features of the atmosphere, it is very
important in circulations. A localized strong circulation in a thunderstorm may
suggest a possible tornado. A wider and weaker circulation may indicate the

presence a storm structure called a mesocyclone.
When combined together in a Doppler radar system, velocity and reflectivity
data are very useful in detecting areas where rain, snow, and severe weather are
occurring.
The WSR-88D system performs an entire scan every five, six, or ten minutes
depending on the mode of operation the radar is in. This scan consists of several
sweeps and can be pieced together to create an approximate three-dimensional
image of the volume of the atmosphere. Within each volume, there are several
sweeps, and the exact number varies depending on the mode of operation of the
radar. The sweeps within a volume are conducted at different elevations ranging
from 0.5 to 19.5 degrees. Within each sweep, a number of pulses or rays are sent.
Usually there are 367 rays within a sweep. And within each ray, there are a number
of range gates, corresponding to a distance from the radar. In the WSR-88D system,
there are usually 460 reflectivity range gates and 920 velocity range gates. Each
reflectivity range gate accounts for a 1 km distance from the radar and each velocity
range gate accounts for a ¼ km distance from the radar.
The hardware collects the data in an analog form. This data is be referred to
as level I data. The data is then converted to a digital form, which is referred to as
level II data. The level II data is equivalent to level I data but is in a digital form.
Often, level II data is referred to as raw data. Level II data can then be analyzed by
computer algorithms to produce other data that may be also useful to
meteorologists. This analyzed data along with a subset of the level II data is referred
to as level III data.
While many features of storm structure can be identified by a human
forecaster, algorithms can be designed to deliver similar results and with an
impartiality that a human is usually incapable of possessing. Furthermore, examining

data through computer algorithms is much quicker than relying on a human
observer. A human is certainly capable of detecting some circulations, identifying
storm cells, and estimating the motion of individual storms. Computer algorithms,
however, are also used to determine the height of cloud tops, indicate areas where
hail may be occurring, and estimate precipitation amounts. None of these can easily
be done by most people but can easily be done by using computers to analyze level
II data.
Despite the usefulness of the WSR-88D Doppler radar system, there are
significant limitations. For example, there are over 100 WSR-88D radars deployed
across the United States. Despite this, there are many areas, particularly in the
western United States, that are not covered well if at all by radar. Furthermore, there
are many limitations in the actual radar systems that do not relate to the
implementation of the radars.
It must be understood that radar does not indicate what weather is occurring
at the surface. Radar indicates what is occurring in the atmosphere above the
surface. While it can provide a strong indication of what may be occurring at the
surface, there is never a guarantee. It is still necessary for the National Weather
Service to rely on spotters to provide ground truth observations. The lowest beam
elevation used is 0.5 degrees, which also means that the beam will be farther above
ground at distances farther from the radar site. The curvature of the Earth also
causes the beam to be higher above the surface of the Earth at distances farther
from the radar site. Because of this, at far distances from radar sites, the radar beam
may actually be above the clouds. It is possible for no energy to be reflected back to
the radar from a given location while precipitation is actually occurring there. This
puts a strong limitation on the usefulness of radar to detect what is occurring at
distances far from the radar site.

There are also many other factors which may reduce the accuracy of radar
data. While radar beams can penetrate clouds, terrain around the radar site can
absorb the beam. There are also many sources of false echoes. The most common
of these occurs near the radar site and is referred to as ground clutter. There are
even algorithms for removing ground clutter from radar images; however these may
also remove legitimate echoes in the process.
Keeping these limitations in mind, radar is still a very useful tool in observing
the weather. Weather radar is best viewed as a system with two major parts. One
part is the radar dish, which collects the data. The other part is a computer and
some algorithms to analyze the data that is collected. The radar system as a whole
produces data that is very useful for the observation and forecasting of weather,
particularly in the area of severe weather.

1.2.2. Background Information: GIS
GIS is an acronym for geographic information system. A GIS is a computer
system which stores, manipulates, displays, and analyzes data that has a
geographical context. Many types of data such as boundaries, geographic features
such as rivers and mountains, man-made structures, and aerial photographs are
also suitable for analysis and display by GIS systems. Because meteorological data
is referenced in the context of an area at a location on or above the surface of the
Earth, it can also be manipulated by a GIS system.

1.3. Background Literature
1.3.1. Background Literature
Title: The WSR-88D Rainfall Algorithm
One of the algorithms the National Weather Service uses to interpret radar
data is used for estimating precipitation amounts. This algorithm has been revised
many times and does not rely only on radar data. This article describes the algorithm
that is used by the radar system in estimating precipitation.
There are several steps involved in estimating precipitation. The first step
involved is to detect whether precipitation is occurring within the coverage area
around the radar. This step takes radar data which is edited to remove ground clutter
as input. The data is examined to determine if certain thresholds are exceeded for
the purpose of detecting if significant precipitation is occurring.
The next step involved is to collect rain gage data. This only occurs after
significant precipitation has been detected. Rain gage data is collected in real time.
The following step involves processing actual radar data and converting it into
a polar grid in which each box is one degree wide and one kilometer long. The
algorithm only processes data for the first 230 kilometers around the radar. It
attempts to select data at various elevation angles which is approximately one
kilometer above the surface. This is done by taking into account the terrain and the
various elevation angles. It also takes into account beam blockage due to terrain.
Several elevation angles used to create the entire polar grid. At ranges far from the
radar, the higher value from two elevation angles is chosen. Some other adjustment
of radar data may also be performed during this step. After these adjustments, the
reflectivities are increased at times to account for partial beam blockages. Also,
areas of particularly high reflectivity gradients are edited for the purpose of removing
ground clutter. Some false echoes are then removed from the data, if they can be
detected. One step of this is to check the next elevation angle for a significant
decrease in reflectivity. If this is observed, the echo is determined to be false.
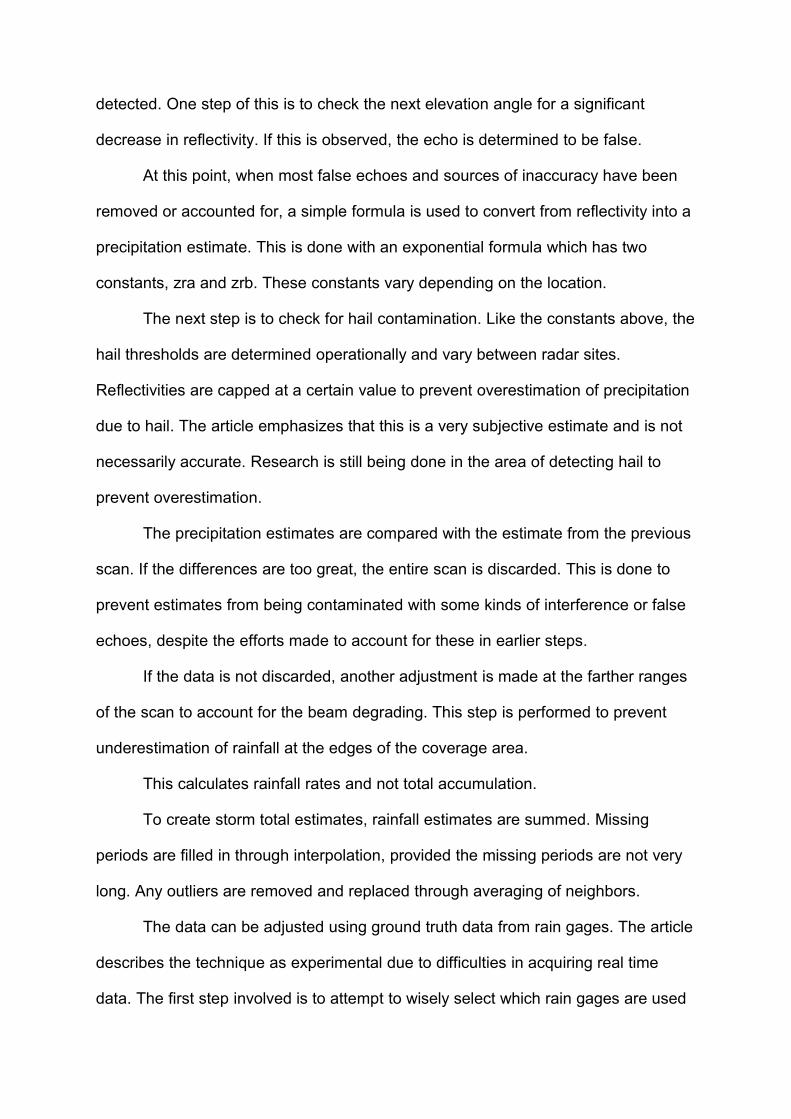
At this point, when most false echoes and sources of inaccuracy have been
removed or accounted for, a simple formula is used to convert from reflectivity into a
precipitation estimate. This is done with an exponential formula which has two
constants, zra and zrb. These constants vary depending on the location.
The next step is to check for hail contamination. Like the constants above, the
hail thresholds are determined operationally and vary between radar sites.
Reflectivities are capped at a certain value to prevent overestimation of precipitation
due to hail. The article emphasizes that this is a very subjective estimate and is not
necessarily accurate. Research is still being done in the area of detecting hail to
prevent overestimation.
The precipitation estimates are compared with the estimate from the previous
scan. If the differences are too great, the entire scan is discarded. This is done to
prevent estimates from being contaminated with some kinds of interference or false
echoes, despite the efforts made to account for these in earlier steps.
If the data is not discarded, another adjustment is made at the farther ranges
of the scan to account for the beam degrading. This step is performed to prevent
underestimation of rainfall at the edges of the coverage area.
This calculates rainfall rates and not total accumulation.
To create storm total estimates, rainfall estimates are summed. Missing
periods are filled in through interpolation, provided the missing periods are not very
long. Any outliers are removed and replaced through averaging of neighbors.
The data can be adjusted using ground truth data from rain gages. The article
describes the technique as experimental due to difficulties in acquiring real time
data. The first step involved is to attempt to wisely select which rain gages are used

to adjust the radar estimates. Data from rain gages is paired with data from radar,
through selecting the closest value from nearby radar estimates to what the gage
indicates. A variety of methods are then used to only choose good pairs of data.
Some statistical methods are also used for quality control purposes.
Once these steps are completed, graphical and digital products can then be
created from the rainfall estimates. These products can then be used for forecasting
or disseminated as level III data.
The article then describes rain gage networks and also some of the other
experimental work to overcome limitations of the rainfall estimation algorithm. Some
of these include finding better values for some tunable parameters of the algorithm,
solving problems involved with overestimates due to melting precipitation,
underestimates at far ranges of the scan, better handling of false echoes, and other
areas of research. The algorithm is still being improved and the final third of the
article is used entirely to discuss future improvements to better estimate rainfall.

1.3.2. Background Literature
Title: Automated Detection of the Bright Band Using WSR-88D Data
One source of overestimation of precipitation is referred to as a bright band.
In addition to cumulonimbus clouds, nimbostratus clouds can also produce
precipitation. If the precipitation melts on the way to the surface from nimbostratus
clouds, there will be a layer of melting precipitation which produces high reflectivities.
Because the radar beam is tilted, this layer of high reflectivity is observed as a bright
band. This band can stay over the same area for several hours, under some
conditions, and can result in significant overestimates of precipitation. This article
describes a technique for detecting and automatically accounting for the bright band
in precipitation estimates.
The first step of this algorithm is to acquire a good sample of data. In areas of
significant beam blockage, the data may be discarded completely. Data from all
elevations is considered in detecting the bright band.
A minimum reflectivity is defined for what constitutes a bright band. The
algorithm then checks higher and lower elevations for significant changes in
reflectivity. If this is observed, and is in within a defined distance from the radar, it is
considered by the rest of the algorithm as a possible bright band. In the case of the
bright band being particularly close to the ground, only the top of the bright band
may actually be observed. To account for this, the radar also considers data from
the RUC-2 model to identify at what height melting would occur.
Once a possible bright band is identified, the data is then examined to check
if the band extends around the radar site and if the height of the possible bright band
is consistent. If these tests are satisfied, then the algorithm identifies the area as a
bright band.
The article then discusses the accuracy of the estimates. Results from the

algorithm were verified through vertical pointed radars, weather balloon
observations, and RUC-2 model output. The article seems to suggest that the
algorithm performed well, but that some parameters may need to be tuned. Some
opportunities to further improve the algorithm are discussed in the article.
Unfortunately the article does not seem to mention how the data can be adjusted to
achieve more accurate precipitation estimates when a bright band is identified.

1.3.3. Background Literature
Title: Real-Time Calibration of Radar Precipitation Estimates
This article discusses methods of calibrating radar estimates of precipitation
using data from rain gages. The article starts by discussing some weaknesses of
rain gages. These include mechanical issues leading to underestimation of rainfall
and the distances between rain gages. Radar estimates of precipitation are
discussed as a means of overcoming these problems. Unfortunately, as the article
states, these estimates are not necessarily accurate.
Combining data from radar estimates and rain gages is suggested as a
means to overcome the limitations of both approaches. Data from radar estimates is
used to pinpoint trends in rainfall while data from rain gages is used to provide actual
measurements of rainfall. The article also suggests that the method of combining
data from the two sources needs to be done automatically and not require a human
operator.
This study uses level III data because of the difficulty in acquiring level II data
in real time. The digital precipitation array product is used because it is the only
digital representation of rainfall amounts. All of the other level III products provide
only a range of possible precipitation amounts and do not provide actual estimated
values. The digital precipitation array is a product with approximately four kilometer
square boxes in a grid to represent the data. This study also discusses possibly
merging estimates from multiple radars by selecting the highest value over a
particular point. The basis for this decision was that most of the overlapping areas
will be at the edge of radar coverage areas where precipitation tends to be
underestimated.
Several techniques are discussed to improve the accuracy of calibrating radar
estimates with rain gage data. These include adjusting the calibration to account for

distance from the radar site, using logarithms to remove exponential terms, and
adjusting for mechanical problems with rain gages. There still is the concern,
however, that an area of high reflectivity may not match up with an area of high
precipitation at the surface. A situation such as this could occur with strong winds in
the atmosphere causing precipitation to not fall directly downwards. This would be a
factor in situations where the horizontal reflectivity gradient is very high. If this
occurs, it is possible for a rain gage to receive high amounts of rainfall when an area
of low reflectivity is observed on radar, or a small amount of rain at the surface being
paired with a radar estimate of high rainfall. This can be prevented by setting a
maximum on how much radar estimates can be changed due to calibration. The
article states, however, that rarely is this situation actually a problem.
In this study, each radar was calibrated separately and the calibrations were
based on rainfall estimates from prior storms over a period of months. In some
cases, the calibration process significantly and unreasonably inflated radar
estimates. By changing a multiplier, these issues were accounted for to produce a
more reasonable estimate.
The results of this study show that some localized areas had their
precipitation estimates increased significantly due to calibration while areas that
received lesser amounts of precipitation had their estimates decreased. The article
states that the calibrated estimates agreed closely with observed amounts of
precipitation for the storm. Satellite data may also be incorporated, according to the
article, to further increase the accuracy of calibrated estimates.
1.3.4. Background Literature
Title: A Comparison of Radar Reflectivity Estimates of Rainfall from Collocated
Radars
This article describes attempts to improve radar estimates of precipitation and
testing of a new radar technology by NCAR. The article starts by discussing potential
problems with precipitation estimates. It discusses issues with bright bands along
with several other possible sources of inaccuracy. One potential source of error
highlighted is the limited resolution of radar at distant ranges. Also, at farther ranges
where the beam passes through higher altitudes, if water droplets are frozen,
reflectivities will be decreased resulting in underestimated precipitation. Another
source of potential error is due to differences in raindrop size.
The new radar system, referred to as S-Pol was compared against the
existing WSR-88D system. The WSR-88D radars are equipped to deal with issues
such as beam blocking and ground clutter, which the S-Pol radars were not. Several
techniques were incorporated to reduce the effects of these problems that the S-Pol
radars would encounter.
The article states that calibration of rain gages with radar estimates of
precipitation improves estimates. Also, tipping bucket rain gages may significantly
underestimate precipitation if strong winds are present. The article states, therefore,
that in these scenarios, the calibrated estimates should be the same or greater than
the values produced from rain gages.
The radars were evaluated around Denver and Wichita. The radars
performed better in Kansas than in Colorado and the article offers several
explanations for this. These possible explanations include smaller storm size in
Colorado, higher cloud bases, more hail in Colorado storms, and the subcloud layer
being drier. The article states that the radar estimates of precipitation were in good

agreement, usually, even when the estimates varied greatly from what was observed
by rain gages. The conclusion drawn from the data is that the main factor in
inaccuracies was because of differing raindrop sizes in storms. Well maintained
radars should not have significant variations in precipitation estimates and
differences in radars are unimportant compared to differences between storms,
according to the article.

1.3.5. Background Literature
Title: A Comparison of NEXRAD WSR-88D Radar Estimates of Rain
Accumulation with Gauge Measurements for High- and Low-Reflectivity
Horizontal Gradient Precipitation Events
This article reports on a study which attempts to evaluate the effectiveness of
the WSR-88D algorithm for estimating rainfall. The study attempts to measure the
performance of the algorithm over many cases instead of highlighting a single case.
The storms studied are divided into two major cases. One case is those with
high horizontal reflectivity gradients and the other is with low horizontal reflectivity
gradients. Data from several radar sites throughout the United States were used in
the study. Cases with high reflectivity gradient tended to involve storms with cores
that had high reflectivity values. The cases with low gradients tended to also have
lower reflectivity values.
One conclusion of this study is that variations between storms have a greater
impact on differences in precipitation estimates than differences between radars.
This study notes that the distance from the radar also affects the accuracy of
the radar estimates of precipitation. Four regions are defined when analyzing these
results, those being areas near to the radar, two mid-ranges, and the farthest
distances from the radar.
In cases of high reflectivity gradients, precipitation was underestimated close
to the radar. In mid-ranges, precipitation was overestimated. At the farthest ranges,
the estimates were similar to the totals actually observed. With low reflectivity
gradients, radar underestimated the precipitation totals in all cases but to the
greatest extent in the areas nearest to and farthest from the radar site.
The article suggests that close to the radar, some legitimate echoes may be
mistaken for ground clutter and incorrectly filtered by the algorithm. When the lowest

elevation detects ground clutter, the precipitation estimation algorithm chooses a
higher angle of elevation. This can lead to underestimation.
Underestimation of rainfall in cases of low reflectivity gradient is attributed
somewhat to the likelihood that the precipitation was mostly of a stratiform nature. In
this situation, if the radar beam is below or above the clouds, it may lead to poor
estimates. The article also suggests that the zra and zrb values used to convert
reflectivity values to precipitation estimates are optimized for cases of high
reflectivity gradients and will not perform well in situations of low reflectivity
gradients. Also cited as possible causes of inaccurate precipitation estimates are
bright bands, different raindrop sizes, and radars that were poorly calibrated.

1.4. Goals & Prototypes
The eventual goal of this project is to create an online product which can be
viewed by members of the agricultural community to aid them in deciding whether to
apply chemicals and fertilizer. As much of this product as possible should be
generated automatically. This should product should integrate easily with existing
GIS systems already present at the university.
The first prototype, which has already been completed, converts radar
estimates of precipitation into raw data which is stored in a text file and into a PNG
file for easy viewing. Later prototypes will be used to experiment with different types
of radar data which is available and different formats for which to convert data into
for integration with GIS systems.
Two radar products are being considered for use in this product. One product
is referred to as the digital precipitation array. It has 256 levels of precipitation and is
in a 131x131 grid. This product estimates the amount of precipitation that has fallen
to the ground in the past hour. A second product is a one hour precipitation estimate

in a radial format. This product has 16 levels, instead of 256, but has a higher
resolution. Each point along the grid is two kilometers long and one degree wide.
While this provides much greater resolution than the digital precipitation array, it
does not have nearly as good of precision. These products will be evaluated during
the prototyping to determine which is more suitable for the end product.

1.5. Cost & Feasibility
While the main coding project involved in this is to convert radar data, this
project actually involves creating an entire system. The level III data used in this
product is freely available from National Weather Service servers and can be
downloaded in nearly real time. One component of this system is to create a way of
automatically retrieving this data. This data must then be converted to a format
which can be read by GIS software. The converted data must be then sent to
another computer which has the GIS software. This other computer system will then
integrate this data with other geographical data to create an end product which is
available over the web.
There are many servers already at the university and any one of them could
be used to convert the level III radar data. It is not a particularly resource intensive
task and could probably work alongside other processes. The data used is available
at no cost and is small in size so bandwidth should not be a major issue. The GIS
systems are already in use at the university, so little if any additional cost will be
realized from this product. Overall, there are few costs from adding this product to
the products already made available from the university.
Because of the easy availability of this data, the low amount of computation
required in processing this data, and the systems already in place to display this
data after it is processed, this solution is very cost-effective while also providing a
good product.

2. Requirements Analysis
2.1. Introduction
The purpose of this project is to develop a system for decoding and
converting precipitation estimates into a format that can be analyzed and displayed
by GIS software. The goal of this, upon completion, is to generate a product which
may be viewed online and is useful for predicting runoff and flooding. Precipitation
estimates will be combined with terrain data such as elevation models and soil types
to generate a composite product. This is the requirements analysis for this project
and will define the environment for this product to operate in, explicitly what this
product is, and how it will be evaluated in the future. During the planning of this
project, several alternative possibilities were considered, and those will be presented
as well, both for the purpose of explaining the decision process and for suggesting
future work.

2.2. Overall Description
As described previously, this project is to develop a system for the purpose of
converting precipitation estimates to a format which is supported by GIS software.
The precipitation estimates are provided by National Weather Service (NWS) radars
in the form of level III data.
When downloaded from NWS servers, the level III data is in a complex format
which is partially run-length coded. One component of this system will be a program
to automatically download level III data files for the radars which cover the state of
Missouri. A major component of this system will be the software which decodes the
data files and converts them to a format which GIS software supports.
The conversion of level III data to another format will likely be done on a
machine which does not have GIS software. Therefore this data will need to be
automatically sent to another machine which does have the appropriate software.
After this data is sent, the machine with the GIS software will need to incorporate the
data to be displayed online. The website in which this data will be displayed already
exists. If the site cannot currently be updated automatically to incorporate new data,
this capability may need to be added.
This is a simple description of the system as a whole and the major
components within and how the components relate to each other within the system.
The process is linear, will likely be done without any human intervention, and will
need to be done quickly enough to provide reasonably current data on a website.

2.3. System Requirements and Constraints
2.3.1. Operating environment
The software produced will likely run on a UNIX machine. One goal of this
product is to have minimal human involvement necessary to produce the product.
Keeping this in mind, Windows does not have a reputation for being as reliable as
UNIX. Keeping these in mind, it is reasonable to expect the software will be run on
UNIX. It is, however, a goal of the project to attempt to maintain as much portability
as possible. It is feasible in the future that changes will occur which will result in the
product running on a different operating system such as Windows. It should be
possible to run the product on a new operating system with little difficulty. It is
expected that software will need to be recompiled to run in a new environment. This
is acceptable and is a result of not writing the software in an interpreted language
such as Java. The source code, however, should not require significant
modifications to operate in a new environment, provided the environment meets
some reasonable requirements. For example, appropriate compilers and
environments exist on Windows to run a large portion of UNIX software. An
environment with these tools should be able to run the software with little difficulty.
The software needed to display the end results of this product in a web
interface already exist. The product is to be displayed in a web page which already
exists. Therefore, the web server is of little concern to this project. Once this product
is delivered to the computers with GIS software, there should be little need for
modifications. If the web server were to change, it should not affect the operation of
the system. While the data generated may need to be stored within a database, it is
not a concern of this project. Much of the GIS data is apparently already stored in a
database and it is a concern of the GIS software.
While development tools such as source control and integrated development

environments could be used in creating this software, it is not particularly useful. The
software is not particularly complex and the use of these tools may introduce
possibly undesirable complexity. Instead of maintaining a large and complex
software package to interpret data, the goal is to develop a large number of modules
for import and export of data with a simple core. Each module should be
independent of other modules. By keeping the individual modules independent and
simple, it should minimize or eliminate the need for complex development tools.

2.3.2. Market Users and Characteristics
The product which is being provided will be publicly available without charge.
Since it will be produced and provided by the University, there is little need to be
concerned with competition in an open market. The product need not be profitable
and should not be since it is funded by tax dollars through a University with a
mission to serve the state of Missouri and specifically in the area of agriculture.
Regulatory constraints should not be an issue in the development of this product.
Since relatively little processing power is required to decode and convert level III
data, it should already run on hardware owned by the University. The level III data
files are relatively small files, particularly when compared to level II data, and should
not require significant bandwidth to download. The GIS software which will decode
this data and the webpage in which it is to be displayed already exist. Therefore,
little additional expense will be realized by incorporating this data. Keeping this in
mind, there is little economic expense in producing this product. Therefore, it is very
feasible to produce this product using resources which are already available.
There are two customers for this product that have different requirements.
One customer is the Center for Agricultural, Resource and Environment Systems
(CARES) which is an active participant in developing this product. They will,
however, directly receive the decoded data files and have specified some
requirements. The data must be provided on a timely basis and should be provided
in a format which can be interpreted by GIS software. While several formats have
been suggested, one that seems likely to be used is the shapefile format. These
requirements are simple and will be met during the development of the software.
The second customer in this is members of the agricultural community who will visit
the website for the end product. One would expect that the requirements of this
customer have already been met in the design of the website, which already exists.

Therefore, these requirements are not of concern to this project.

2.3.3. Environmental Constraints
While it might seem likely that any system will require some human
involvement, that is not a major concern in this project. The system is designed to
operate with minimal human interaction. The system operates in a linear fashion with
no major decision making. Both ends of the line are other systems, instead of being
humans. One end is the NWS servers, from which data is automatically retrieved.
The other end is the GIS software, which is also automated. Keeping this in mind,
human involvement is not a major concern in this project.
One obvious goal of this project is to produce quality data. The major factor in
determining the quality of the data is the quality of the data actually collected by the
radar. If the radar malfunctions and subsequently collects poor data, then there is no
way this product will produce good data. If the radar is producing good data, which
hopefully it is, then the quality of the data produced by the software will also be
good. One would hope the NWS maintains their radars well, and that it is reasonable
to expect quality data as output from this product.
Reliability is a major goal of this product. It is important that data be
processed in a timely fashion. Furthermore, it is important that this system require
little if any maintenance and human involvement. A major threat to reliability is
potential changes to the format in which level III data is disseminated. If this is
changed, and the NWS does make periodic modifications to the format, it may also
break the software which interprets and converts the data. This will adversely affect
reliability and cannot be easily accounted for when planning this project except to
make the source well commented so it can be modified as necessary with as little
difficulty as possible.
There are few if any safety issues involved in operating this system.
Therefore, it is not a major concern when developing this product.
2.3.4. System Components
As described previously, there are a few major components to this system
which operate in a linear fashion. This means that when one portion of the system
completes its task, the data is merely passed along to the next component. There
are no major decisions to be made in the operation of the system.
The first component of the system will retrieve data from NWS servers as
necessary and as is available. This component must retrieve the correct data files
from the servers, as many are available at a time. In excess of 200 files are usually
available of a level III product for a given radar. That means that many thousands of
data files are available from NWS servers at any given time. The correct one must
be selected. Also, the downloading of data must not place unnecessary load on the
University network connection or on NWS servers. NWS servers are not particularly
fast and the component must consume as few resources as possible so the access
of others to the data is not negatively impacted. Furthermore, if this component
malfunctions, it could lead to the NWS banning the computer's IP from accessing
the server. Also, it is entirely possible that radar data may not be available for
significant lengths of time due to outages or other reasons. This component must
detect this and behave in a sane way which enables the rest of the system to
correctly function.
Once this step is complete, the data is passed to a decoder. This component
must decode the level III data and convert it to a format which can be understood by
GIS software. The major requirement for this component is that it must correctly
decode the data according to the standard for storing level III data. Unfortunately,
the standard for level III data is vague and not particularly well documented.
Therefore, some care must be taken and there must be rigorous testing to ensure
that data is decoded correctly.

The third component of this data is responsible for the transmission of this
data to the computer with GIS software. This component must transmit the
converted data when it is available and must deliver the data in a timely fashion.
This must deliver the correct data and ensure that the computer with GIS software
correctly receives the data. Should either computer fail, this component should
behave in a reasonable way and not cause harm.
The fourth component of this data is the GIS system which takes the data and
displays it within a website upon request. This component is already developed and
is not within the scope of this project. While there are some obvious requirements of
this component, both in the resources required and in the website produced, it is not
within the scope of this project to modify this component or specify requirements.

2.3.5. Software Interfaces and Libraries
There are two major interfaces in this software. One is the interface with the
NWS servers and the requirements for this interface have already been specified.
The other interface is responsible for delivering the converted data to the GIS
system. The requirements for this interface have already been specified.
The main requirements for these components is that when one fails, the rest
of the system behaves in a reasonable way and does not cause damage. If possible,
the rest of the system must continue to function. If it is not possible, the rest of the
system must be ready to function as soon as the failing component becomes
available once again.
It is likely that only one external software library will be used in this system.
That library is for creating a shapefile, or possibly a file of another GIS format. These
libraries should be free and open source. If a shapefile is the format chosen for the
output of data, there is already an existing library called shapefile. This library has an
interface from C and is free and open source. This makes it a good choice for this
project.

2.3.6. Communication Interfaces
The likely communication interfaces in this project are the various network
links. One interface is an external network interface for downloading level III data
from NWS servers. This network link is already available from the University. The
other interface will be across the University network for the purpose of sending data
from the server responsible for converting the data to the server responsible for
displaying the data. Once again, this network link is already available and need not
be a concern of this project.

2.3.7. Hardware Interfaces
The scope of this project does not involve hardware. Therefore, it is not a
concern of this project and requirements will not be specified.

2.3.8. Software Maintenance, Life Cycle and Support
Clearly, this project will need to be maintained as the NWS makes changes to
the format in which they distribute radar data. Unfortunately, the NWS does not
make these updates on a regular basis and may not make the specifications on the
changes easily available. Furthermore, as bugs are found, these will need to be
fixed if they are critical. A major part of this maintenance is to make the code easily
understandable by programmers in the future who may be responsible for the
software. This may be accomplished by properly commenting the code and by
organizing the code in a way so that functions and functionality can be easily found
by someone examining the source.
Also, a goal of this project is to make the code reasonably portable so that it
can run on newer hardware when it is time for an upgrade. This will extend the
lifecycle of the software beyond current hardware and allow it to be implemented on
other machines if necessary.
While it is likely that this software will eventually need to be replaced or
rewritten, it will be designed with an architecture that will extend its life as long as
possible. By using modules to load and export the data, there may be new
applications to this software that have not been envisioned at the time of this writing.

2.4. Performance Requirements
The performance requirements for this system are not particularly strict. Since
the precipitation estimates are hourly and new data will only be input every hour, it
isn't a major problem if the efficiency isn't particularly great. On the other hand, the
software should still run reasonably well because other software may be running on
the same machine along with it. Considering that level III data is not particularly
large, because of the lack of many elevation angles, the memory requirements of
the program should be relatively low. For example, it is acceptable to use a few
megabytes, but not more than that.

2.5. Resource Requirements
Due to work on various prototypes, the format for level III data has been
deciphered well enough. This will greatly reduce the time required to develop this
product. A significant amount of time may be needed to test out data and verify it
against images produced by the NWS. It is impossible to know how long this will
take because of the inability to accurately forecast the weather far in advance. A few
weeks of verification may be enough to be reasonably certain that the system
functions correctly.
The system should process data within a few minutes of becoming available
and should run on rather modest hardware. That is to say that any computer made
within the last several years should be able to run the decoding software with little
difficulty.

2.6. Evaluation Metrics
A number of evaluation metrics are possible to determine the level of success
of this project and the quality of the system. One obvious metric is the accuracy of
the data produced. Perhaps a mean squared error of rainfall totals compared
against actual rain gauges would be a good measure of this. It is also worth
measuring the efficiency of the software by measuring both the time required to
decode a radar data file and the amount of memory required. Execution time is
dependent on hardware, however, and therefore may not be a good metric. Another
evaluation criteria is how well bandwidth and storage are utilized. Perhaps
measuring how efficiently data is stored, such as a measure of the amount of bytes
required to store data for a square kilometer, would be a reasonable evaluation
metric.

2.7. Alternative Solutions
There are many possible alternative solutions to produce similar data that
were considered during the design of this project. Some of these will be described
here along with the reasons the were not chosen.
One potential solution suggested was to decode level II radar data instead of
using level III data. This would allow for greater resolution and precision than is
possible with the level III data. Unfortunately, processing this data to produce a
useful product is a complex and difficult task that would take much more time to
develop than is desired. Furthermore, such an algorithm already is in use to produce
level III data. And the processing requirements to produce a precipitation estimate
from level II data are much greater than the requirements to decode level III data.
Therefore, while this is an attractive solution, it is not the best solution given the time
constraints under which this system is being developed.
There are methods available for using rain gauge data, instead of radar data,
to construct a precipitation estimate. The methods involved, however, are based on
purely mathematical ideas and the interpolation of data does not take into account
the behavior of the atmosphere. While this method uses actual ground truth data in
addition to radar data, it is not a good solution for producing accurate data.
Therefore this method is unsuitable.
There are two types of level III data that were considered for providing this
precipitation estimate. One is the hourly digital precipitation array which is in a
gridded format and has greater precision but lesser resolution than the other
product. The second product is a one hour precipitation estimate that is provided as
radial data. The precision on this product is much lower but the resolution is better.
There is a tradeoff between the resolution and precision when choosing between the
two data formats.

Another option which is very attractive but was not chosen was actually
described in the background literature for this project. Rain gauge data can be used
to calibrate the radar estimates. Incorporating ground truth data with radar data is
probably the best way to achieve accurate results while also maintaining the
resolution that radar provides. This requires, however, a significant effort and
amount of time to accurately calibrate the radar estimate of rainfall. Also, it would
require significantly more resources than just using level III data alone. While this
solution is very attractive and was considered, it could not be done within the
constraints of this project. It is a possible opportunity, however, for future
improvement of this system.

3. Design Specifications
3.1. Introduction
In this section of the report, you will be presented with a basic description of
the design for the project. Some factors outside this project strongly influenced the
design of the prototypes, and those factors will also be discussed.

3.2. Basic System Design
The goal of this project is to develop a system to automatically retrieve level
III radar data from National Weather Service (NWS) servers, decode and convert the
data to a format usable by GIS software, and upload the data to a computer which
has GIS software installed on it. Based on this description, the system can be
broken down into three obvious modules. The first module is responsible for
downloading the correct files from NWS servers. The second module does the
decoding and converting of data to an appropriate format. The third module is
responsible for uploading the data to a computer with GIS software.
While the first and third modules can be written as simple scripts, the second
module is significantly more complicated. Considering this, it is reasonable to break
the module down into smaller modules. The first of these smaller modules is a
decoder of the level III data formats. The second module is responsible for
converting radial data into gridded data, if necessary, and then choosing an output
format. The third module converts the gridded data into another format, such as a
shapefile or a graphical representation of the data.
3.3. Data Requirements
Data is supplied to the system from NWS servers. When downloaded, the
data is in a rather obscure format and is referred to as level III data. Internally, the
system converts the data into a raw gridded format. For output, the data can be
represented in a raw format, in a shapefile, or in a graphical format such as PNG.
There are no major requirements for I/O. As long as a network connection is
present to transfer the data from NWS servers and then to servers with GIS software
installed, the requirements for I/O have been met. The network infrastructure
required for this project is already in place.
No storage or archiving of data is performed by this system. Once data has
been decoded and converted, it is no longer needed by the system.
The most important requirement in terms of data is an accurate description of
the file format used to store level III data. There are several headers included before
the data, and the data is run length coded.
It is also worth noting that there are several types of level III data. These vary
depending on whether the data is in a gridded or radial organization and on the
number of levels in the data. For example, products with 256 levels of precision are
stored differently than products with 16 levels of precision. Depending on the type of
level III data, the same location in the header often has a different meaning. This
further complicates the decoding of level III data. The major difficulty in this project is
in decoding the input, and not in producing the output.

3.4. Software Design
In this section, a couple of diagrams showing the basic structure of the
system will be presented. An outline of the algorithms used to actually decode the
radar data are also included.
The first image presented describes the organization of the system as a
whole. It is a data flow diagram.
This diagram shows that data is downloaded from an NWS ftp server from
which the data is freely available. After this, the data is passed to the decoder
module. This module is responsible for decoding the level III data and producing one
or more representations of the data in a more useful format. The third module is
responsible for uploading the converted data to a computer which has GIS software.
The first and third modules can be developed using simple scripts or even
existing software. Keeping this in mind, they are not described in detail. The second
module, however, merits greater detail. This is due to its greater complexity and that
the task is more obscure than the tasks which the first and third modules are
expected to perform. Like the first diagram showing the entire system, the second

module, which is responsible for the decoding and conversion of data, is presented
as a data flow diagram.
This module shows the interaction with the first and the third module. Most
importantly, however, it shows the internals of the first module in a very simplified
form. Despite the simplified format in which this is represented, it does a good job of
showing the organization of the second module as a whole. Like the system itself,
the module executes in a linear fashion. That is to say that one part of the module
relies on data from the previous part of the module and one part of the module
cannot execute unless all the previous parts have completed.
The module begins its operation by reading in the header and determining
whether or not the data file is in the correct format. Many data values, including
thresholds, can be extracted from the header. This is the first step and isn't complex
at all. Also, the number of radials and the number of range gates in each radial
should be extracted from the header at this point.
After this, the data can now be extracted from the file. The data is organized

into radials. Each radial is run length coded, but different radials are not run length
coded together. Therefore, a loop can be created to iterate through the radials and
then decode each radial into an array. Reasonable pseudocode for this is presented
to show better the algorithm.
for current_radial = 0 to number_of_radials
current_location_in_radial = 0
for current_run = 0 to number_of_runs / 2
for current_run_location = 0 to current_run_length
decoded_data[current_radial][current_location_in_radial] =
current_value
current_location_in_radial = current_location_in_radial + 1;
next
next
next
At this point, we have an array of decoded data. It is a two dimensional array,
but is in a radial format. The best format for which to display the data is in a gridded
format. Therefore, a conversion must be performed. A grid is allocated and the
center is determined. From there, each point on the grid is matched up with a point
in a radial. The distance from the center is determined using the distance formula.
The angle can be determined using simple inverse trigonometric functions. At this
point, the distance and angle can be rounded to pick out a point within the radial
data. Any points which cannot be matched up with a nearby radial are set to a
sentinel value to indicate they are outside the range of the radar and do not have
any meaningful value.
It is worth noting that some points in the radial data may never be matched up
with points on the grid. Also, the points in the radial data may be matched up with

several points on the grid. This cannot be avoided. No averaging is performed
because it would greatly increase the complexity of the algorithm while providing
little if any benefit to the quality of data that has been collected. It is very
questionable if not unlikely that averaging of the data would provide any greater
precision than already exists in the data set.
This algorithm to convert radial data onto a cartesian grid necessarily uses
nested loops. Furthermore, it can be rather resource intensive, particularly in terms
of the computation required. While there are many possible optimizations which
could greatly increase the speed at which this operates, they are unnecessary for
this project.
Finally, this gridded data can be exported. This is simply done with a series of
nested loops. Two loops are required, each iterating along one of the axes.
Pseudocode is not shown because this step largely depends on the output format
which has been chosen.
Whether the format is a PNG or a shapefile, an external library is required at
this point. If the data is simply being exported to a text file, however, there is no need
for any external library. Again, this depends on the format of output which has been
chosen.
Lastly, it is worth mentioning that the decoding of the data may be different if
there is a different input format. Also, in some cases the step of converting radial
data to fit on a cartesian grid may be omitted. This would occur if the data is
provided in a gridded format instead of a radial format. This is true for the digital
precipitation array, which received strong consideration for use in this system. Had
this format been chosen, the system would be greatly simplified and at least one of
the steps mentioned above would have been unnecessary.

3.5. Testing Methods
The first part of testing is to verify that the decoded data is reasonable. If data
is decoded incorrectly, it is easy to generate results that make no sense. For
example, it is not reasonable to obtain results indicating that 30 inches of rain fell in
an hour. The most obvious test is just a sanity check to verify that the data is
reasonable.
Following the sanity check, the second stage of testing is to check the
decoded data against other decoded data that is known to be correct. The NWS
generates images depicting precipitation estimates. The system is also capable of
producing PNG images of the decoded data. Comparing images produced by the
system against images produced by the NWS is the best way of verifying that the
data is decoded correctly.
To verify that data has been correctly stored in a shapefile, the same process
can be used. GIS software is capable of visualizing data formats such as shapefiles.
These images should be compared against images produced by the NWS.
Once these checks are performed, it is reasonably safe to assume that the
data is being decoded and converted correctly.
It is not sufficient to test this with a single case or even just a few cases.
Instead, data from multiple radars and obtained at different times should be tested.
Only after many cases have been tested is it safe to assume that the system works
as it should.
Actual decoded data in a numeric format is not readily available from the
NWS. As a result, it is necessary to visually verify that the level III data has been
correctly decoded. While this is less accurate than other methods, it is much easier
and much more feasible.

3.6. Scheduling
Many projects are completed by groups, instead of by individuals, and
therefore they rely on protocols for communication and a scheduling of what all
members of the group are expected to be working on. Due to this project being
completed individually, much less planning in these areas was necessary. Instead,
the main goal of this project was to demonstrate continuous project towards the end
goal of a finished product. It is not easy to estimate how long tasks such as reverse
engineering a poorly documented file format will require. Instead, the goal of this
project was to demonstrate significant progress each week in the form of a new
prototype.

3.7. System Implementation
The system was developed using C and compiled in a cygwin environment
using gcc. Due to the nature of the cygwin environment, it is reasonable to expect
that the system can easily be ported to run in similar environments such as on Linux
or FreeBSD. While there is a significant amount of text which is dumped to stdout,
other methods of output were used. The most important other means of outputting
data was to create a PNG file using libpng.
Plans were made to use shapelib to create a shapefile from the radar data.
Unfortunately, this functionality was not completed. Instead, however, using a more
manual process, the raw data may be converted to a shapefile. While it is certainly
not difficult, the current process of creating a shapefile does not meet the initial
criteria of developing a system which fully automates the conversion of radar data.
The system currently operates by decoding level III radar data, although it
could be modified to accept other forms of radar data. Many types of radar data
were evaluated and a one hour precipitation estimate, in the form of radial data, was
chosen for the product.
The decoder operates by preparing a large array for radial data and
populating the array with precipitation estimates. After this, a cartesian grid is
prepared and for each point along the grid, the closest actual data point is selected.
No averaging is performed.
As a result, we obtain a reasonable approximation of the original data, but
plotted on a cartesian grid. The original data only provides a range of possible
values and is not particularly accurate. Keeping this in mind, any additional loss of
accuracy is minor, considering the limitations of the existing data set.

3.8. System Testing
To test the output of the system, two methods were used. The first method
was to output the raw data to a text file and examine the file to check that the values
were reasonable. Many cases of this were tried and in all cases, the values
produced were reasonable values.
The second method was a comparison against precipitation estimate images
prepared by the NWS. When compared, the precipitation estimates appeared
reasonable and very similar to the NWS images. Several cases spanning several
hours and generated by several radar sites were used in the testing of this system.
Sites included in the verification process include Pleasant Hill, Saint Louis,
Montgomery (AL), Melbourne (FL), Topeka, and Wichita. Several events were used
on multiple days. Rainfall estimates from events producing both light and heavy
precipitation were used in the testing process.
At this point, it is reasonably certain that the decoder functions properly and
produces correct output. Furthermore, this testing also verifies the algorithms used
to convert from polar to cartesian coordinates and to produce graphical
representations of the data.

4. Technical Report
4.1. Introduction
While the project did not meet the initial goals, a lot of goals were
accomplished. Also, some surprising benefits from this project were realized. These
will be discussed in these concluding remarks, in addition to a description of the
goals that were met and some potential future work to improve the software which
was developed.

4.2. Execution
The programs are designed to be executed within the cygwin environment
and from the command line. No graphical user interface is supplied since is it
unnecessary and does not contribute to the usability of the software. Furthermore,
providing a GUI is contrary to the goal of automating the system.
The program, since it is a prototype for the final project, has the name
test.exe in a cygwin environment. Obviously, this may be renamed to a more
descriptive name if necessary. The final prototype accepts one hour precipitation
radial data and produces two forms of output. One is a textual representation of the
decoded data. The second form of output is a PNG file which visually shows the
data which has been decoded. The file, test.exe, may be executed in a cygwin
environment using the following syntax:
./test.exe inputfile outputfile pngfile
Furthermore, some help is provided and this same information is displayed
when test.exe is run without any arguments.
This program, while it can be run easily from the command line, is designed
for integration with other software which runs automatically. It is best suited for batch
processing where little or no interaction with operators is required. This is the
intended environment in which this software will be deployed.
The input file is a level III data file. The output file is the name of the file in
which the textual output will be written to. The PNG file is the name of the file to
which the image representation of the data will be written to. Executing the program
is reasonably obvious and requires no further user interaction. There are no prompts
for data and no choices for the user to make.
Once complete, the text file may be viewed in any text editor. This includes
common editors such as vi or notepad. The PNG file may be viewed from any image

viewer or browser which supports the PNG format. Given the wide support for the
format, it is of little or no concern that some people might not be able to view the
image files.
Screenshots are not included because the software executes from the
command line. Examples of output are not included here because many samples
are provided in the files included with the project. There is no graphical interface
from which to operate this product, and therefore there is no need to attempt to
show these as part of the report.

4.3. Prototypes
In this discussion, the prototyping process used in developing this project will
be discussed. Hopefully it will provide a better insight into the development process
used during this project.
The early prototypes were only concerned with decoding the digital
precipitation array. The earliest prototype did not produce any kind of graphical
representation of the data but merely dumped the data to a text file. This was used
to verify that the data being output was reasonable. The prototype was coded
quickly and everything was dumped into the main function because the goal was to
reverse engineer the level III file format. This influenced later prototypes which were
based around the same code. The plan was to rewrite the code to incorporate better
software engineering techniques. Unfortunately the new codebase never reached a
reasonable quality. Therefore, all prototypes that were developed are based on this
older codebase.
Following this, an effort was made to modify the codebase to decode radial
data instead of the digital precipitation array. The initial incarnation of this prototype
merely decoded radial data and outputted every radial. Shortly after, a method for
converting the radial data to an approximation which fits on a cartesian grid was
added. This defines the second major prototype.
The next major prototype involved adding a graphical representation of the
data to the codebase. The images were output in the PNG format because libpng
was available and some documentation for the library was easily found by using
Google. This prototype merely had some extra code stuck onto the end of the
previous prototype.
The fourth major prototype fixed some major bugs with earlier prototypes.
While the earlier prototypes correctly decoded precipitation estimates, they only
worked with a special case of level III data. Since the precipitation estimates were
processed and generated by NWS computers, they could be expected to meet
certain standards. Other forms of radial data such as base reflectivity retained many
of the characteristics of raw data. A quick test of a base reflectivity image revealed
that data was not being decoded correctly because of varying widths and starting
points of radials. This was corrected in the fourth prototype so all radial data is
correctly decoded.
Output from later prototypes, in a graphical format, was compared against
data generated by the NWS to verify its accuracy and correctness.
The sum of this development is that the first prototype is useful in decoding
the digital precipitation array data. This is the only prototype which deals with the
digital precipitation array and works reasonably well. The fourth prototype is used for
correctly decoding all radial data. These two prototypes form the second module at
this time.
Multiple iterations of the development cycle were used in this process. This
involved consulting with Dr. Fox and Chris Barnett to verify that the data was being
decoded correctly. At times, changes in the requirements by Chris Barnett affected
the direction of the project and the prototypes. For example, his desire to use radial
data instead of the digital precipitation array led to the development of the second,
third, and fourth prototypes. This briefly explains the design process and the various
iterations that were performed in the development of this module.

4.4. Conclusions and Discussion
At first glance, it might seem like this project is a failure. Keeping in mind that
the system is hardly automated and far from being complete, it's hard to see the
project as being a success. This couldn't be farther from the truth.
As I've stated many times, the format used to distribute level III data is
sparsely documented. A file is available from the National Climatic Data Center
(NCDC) describing the format of level III data files. After reading this file, however, I
was left with as many questions as answers. In some areas, it is vague. In others, it
seems to completely omit information. While it is a good starting point, it does not, in
my opinion, provide the necessary information to create a complete decoder for level
III data.
Few software products are available for decoding level III data. While level III
data is used to generate images for many websites, the decoders are proprietary.
The free products I found for decoding the data were very limited and were
unsuitable for the project.
Keeping this in mind, partially documenting the format in which level III data is
distributed is a major success of this project. Furthermore, source code is included
for decoding the data, and the source is reasonably simple. It should be possible to
create derivative works based on this data to decode other level III data files and
produce other outputs.
I had the pleasure of working with a graduate student, Steve Lack, in the
atmospheric science department. His goal was to develop a nowcasting scheme.
One of my projects while working for him was to use the Radar Software Library
(RSL) software to decode level II data and output it in a form which is useful to him.
This data is in a radial form, which was not useful to any of his software. Source
code was copied directly from my project and inserted into his project for converting

data from a radial form to a gridded form. Furthermore, to assist him in visualizing
the data, I provided my source code for generating PNG images. While the data
source is different, parts of my project have already been useful in unexpected
places.
Because of the unexpected usefulness of my project and the goals which
have been accomplished, I see my project as being very successful already. I will
continue to develop the system and I plan to meet the stated goals of my project. I
hope that these goals are realized, in addition to the unexpected applications of my
work.

5. Future Work
While this project, once complete, will produce a working system that
hopefully performs its intended function well, there is much room for further
improvement. Some of these possible improvements will be discussed here.
One of the most obvious issues with producing a precipitation estimate for the
entire state of Missouri is the poor radar coverage in some parts of the state. Most
notably, north central Missouri receives poor coverage from multiple radars. North of
Columbia, the area is covered by the extreme ranges of the radars in Pleasant Hill,
Saint Louis, and Des Moines. There are multiple ways in which this could be
improved, although some of these are beyond the control of this project.
An obvious way of obtaining better radar data is if the NWS places a radar in
north central Missouri. While this is not expected to happen anytime soon, there has
been talk of a radar being placed in the Macon area. Should such a radar be added,
it could greatly improve the coverage in north central Missouri. It is important, when
estimating precipitation, to use data from as close to the ground as possible. Even at
the lowest elevation angle, the radar is scanning over 10,000 feet above the ground
in some areas of north central Missouri. This improvement is beyond the scope of
this project.
One more feasible way of obtaining better data in northern Missouri is to use
data from some of the less powerful radars in the area. For example, many
television stations operate their own radars. Data from these radars could be
processed to create precipitation estimates for the region. It is possible that this data
could be better than the data provided by the distant WSR-88D radars.
Unfortunately, such an improvement would also pose quite a challenge. It may be a
challenge to gain access to the radar data obtained by television stations. Also, an
algorithm will need to be designed for interpreting the data from the radar. This will

take significant time to develop and test. Similar algorithms are implemented by the
NWS, however many of these steps will need to be repeated when dealing with a
new radar. Furthermore, there may be issues in the quality of data obtained from the
radar.
While the product chosen for precipitation estimates may provide good
enough data for many or most cases, the one hour precipitation estimate is not the
best estimate available. Instead, a product called the digital precipitation array is
available and provides significantly better precision at the slight expense of
resolution. The digital precipitation array is one of the most feasible and beneficial
improvements that could be made to this system.
Also, while radar data may provide a good estimate of precipitation in many
cases, it is not a perfect estimate. Better data is available, particularly from rain
gauges. Unfortunately, rain gauges are not distributed well and do not provide good
resolution. It is possible, however, to use rain gauge data to calibrate the rainfall
estimates made by radar. This is a possible enhancement to the product, and was
actually designed for use within the WSR-88D algorithm for estimating precipitation.
Papers have already been written on this subject and one was described in the
literature survey earlier in this report.
Certainly there are other possible enhancements to this product. The use of
other radars, including those in Topeka, Evansville, Lincoln (IL), and Fort Smith were
discussed. Once the system is implemented to download and convert data from one
radar site, it is easy to add other radar sites. It would be very feasible, if enough
bandwidth is available, to obtain data for the entire United States. While this is
beyond the scope of this project, it is certainly a possible enhancement.
Another enhancement discussed was the possibility of obtaining the raw level
II data and designing an algorithm for estimating precipitation. While this is certainly

possible, it many not be worth the effort. This is particularly true because the NWS
has developed a reasonably good algorithm for estimating precipitation and provides
the output to the public free of charge. This enhancement may, however, provide
more room for tweaking the algorithm to provide better estimates of precipitation.
These are just a few of the possible improvements and extensions that could
be added to this project. As described earlier in this report, there are many possible
uses and improvements of this project which have not yet been envisioned. It is
impossible to list all the possible future work which could be done on this project.

6. Licensing
During the development of my project, I caused a bit of controversy by my
decision to not release my software under an open source license. I suppose that
my decision could be seen as arrogant and in opposition to my previously stated
views supporting the free and open exchange of ideas. While I can see how my
decision might be viewed in this light, I feel that my decision is the most ethical
choice and is the only one consistent with my beliefs supporting the free and open
exchange of ideas when possible.
To understand my opinions, a bit of background knowledge is required. Since
the early 1990s, the National Weather Service (NWS) was restricted in what
services it could provide. This policy recently expired, and in compliance with an
Office of Management and Budget (OMB) regulation the NWS decided to
discontinue its adherence to the terms of the expired policy and freely distribute its
products whenever possible. This has led to much weather data being made freely
available on the internet in easily accessible formats such as XML.
The NWS has been very successful in following its core mission of protecting
life and property. In my opinion, NOAA, under which the NWS operates, is an
example of a well-run and successful government agency. Furthermore, the NWS is
constantly in the process of researching meteorology and new technologies to better
predict the weather for the purpose of better serving the public. While many
government agencies seem to provide little benefit to the public, the influence of
NOAA and the NWS are apparent to me constantly. Releasing more data in a free
and open format is just another step to better serving the public.
While one would expect the public to be supportive of the decision to release
data in a free and open format, there is a very vocal group opposing this. The private
weather industry has spoken out against this new NWS policy. While they claim the

NWS has more important tasks than disseminating data to the public, it becomes
apparent that their real motives are to protect their profits and take over part of the
role the government has assumed in the meteorological community. I will present a
few of their arguments and explain why they are fallacious and untruthful.
The private weather industry claims that much of the efforts of the NWS is
spent producing forecasts of warm and sunny weather and neglects the tasks of
warning the public of emergencies. Private industry claims that the NWS would
better serve the public by delegating the tasks to companies of distributing data and
preparing most forecasts. They argue that the NWS could then concentrate on
warning the public of dangerous weather phenomena. It has gone far enough that
Rick Santorum, a Republican senator from Pennsylvania, has introduced a bill to the
Senate to force the NWS to cease many of their tasks and delegate them to private
industry. One of the decisions was to greatly restrict what data the NWS is allowed
to disseminate. Senator Santorum claims his bill will modernize the NWS.
While it might sound like a reasonable goal, it is based around lies. The NWS
delegates sections of the nation to various weather forecast offices (WFOs) which
are tasked with small areas of the United States. Each WFO generally prepares
forecasts twice daily. Both short range and medium range forecasts are prepared at
these times. Forecasts are issued at other times when significant weather is
expected such as thunderstorms. This is referred to as nowcasting. While I cannot
be certain of this, I expect that in most areas, a large majority of the time spent
forecasting is spent on nowcasting. Furthermore, to identify possible hazards in the
future, the NWS forecast offices should prepare short and medium range forecasts
at all times, anyway. It is in the best interests of the public if, for example, a severe
weather outbreak can be predicted several days before the outbreak actually occurs.
This can only be done by preparing short and medium range forecasts even when

significant weather is not imminent. Therefore to properly serve the public, it will be
necessary to spend the time to prepare the forecasts of warm and sunny weather
anyways.
The NWS does not just rely on individual WFOs to forecast significant
weather. Instead, there are offices tasked specifically with the purposes of
forecasting phenomena such as severe weather or hurricanes. The Storm Prediction
Center (SPC) cooperates with individual WFOs to forecast severe weather. The
National Hurricane Center (NHC) monitors the tropics for potential threats. While
these offices to distribute small amounts of meteorological data to the public, they
concentrate mostly on forecasting and warning the public of potential threats.
In the event of severe weather, the SPC issues watches and attempts to
inform the public when a significant severe weather threat is present. Individual
WFOs monitor their designated areas and issue warnings as necessary. When
severe weather threatens, the SPC and the appropriate WFOs concentrate on
nowcasting and alerting the public of imminent threats.
Keeping these ideas in mind, it is very clear to me that the NWS is not
distracted from their primary mission of protecting the public. Disseminating data and
producing the forecasts of warm and sunny weather is a necessary part of their
mission. Furthermore, distributing meteorological data to the public freely is very
beneficial to the mission of the NWS to protect life and property.
At this point, it is worth mentioning that I am a storm spotter. This means I
have been trained to recognize severe weather and report certain phenomena to the
NWS to assist them in issuing warnings. Furthermore, I am associated with Mizzou's
storm chase team. The primary mission of the storm chase team is to spot severe
weather and notify the appropriate authorities so that the public can be protected. I
rely on freely available weather data to help me identify when severe weather is in

the area. Furthermore, I am able to use this data to ensure that I can stay safe while
performing my tasks as a spotter and as a member of Mizzou's storm chase team.
Without the freely available weather data from the NWS, I would be far more
reluctant to engage in these activities out of concern for my safety.
There is no technology available to allow the NWS to remotely identify
hazards such as hail, high winds, or tornadoes. While they have a plethora of tools
that can be used to suggest to a forecaster where severe weather is occurring, the
NWS still relies greatly on spotters to provide ground truth data. I guarantee that I
am not the only spotter who would cease many of these activities out of concern for
personal safety if NWS data was not freely available. I certainly wouldn't pay
someone to get data so I can help serve the public. Without good radar data, such
as what is available from the NWS, I would not put my safety at risk to do something
such as attempting to spot a tornado. I use the available data to assist me in
identifying possible weather threats and in staying safe. Furthermore, I've already
paid for this data through my tax dollars. I shouldn't have to pay twice for the
necessary data to assist in performing a public service.
If enough spotters cease their spotting activities, the NWS will experience a
drop in reports of severe weather. Their ability to warn the public of actual severe
weather will be diminished.
Private industry does not have the same mission of protecting the public that
the government has. One of the more recognizable weather companies is the
Weather Channel. Their greatest concerns are ratings and revenue. This became
apparent when many of their actual meteorologists lost their jobs. It's nice to have
good on-air personalities, but meteorologists are more important to actually
forecasting the weather. Furthermore, their forecasts are questionable. The Weather
Channel operates their own model. I've heard from other meteorologists that this

model provides poor solutions and is unreliable. The NWS has expended much
effort to create quality models. I don't trust the products provided by industry when
they are compared with the products provided by the NWS.
Considering these arguments, I am staunchly opposed to the efforts of the
private weather industry to restrict the NWS. While I am in favor of free and open
source software, I cannot accept that a product I create could be used by the same
private industry that seeks to unnecessarily restrict the activities of the NWS.
I have not found an abundance of precipitation estimates available online. It
would seem to me that there would be a market for a website providing customized
or local hydrologic forecasts above and beyond what is done by the NWS. Given the
potential market, a tool such as what I have produced could be very useful to
someone wishing to create a commercial website for this purpose. While it is not fair
to judge the entire private weather industry based on these concerns, I would prefer
that my product not be usable for these purposes.
Open source, by definition, requires that I place no restrictions on who may
use my software and for what purposes they may use it. On the other hand, I would
greatly prefer that my software not be available to distribute products commercially. I
am not totally opposed to commercial use of my product, however. I recognize that
many users of my product from the agricultural community will have commercial
interests. I do not wish to prevent them from using my product. They will likely use
the results of my product to protect their agricultural interests. This is consistent with
the goal of protecting life and property and is something I strongly support. I only
wish to prevent the use of my product by those who wish to restrict the operations of
the NWS. Keeping this in mind, however, I cannot release my software under an
open source license.
Hopefully this explains my reasons for not releasing my software freely. I

believe that the private weather industry will endanger the public in their attempts to
maximize profits. As a result, I do not want to release a product which could be used
by the private weather industry. While I do support the free and open exchange of
ideas, I feel that private industry threats exactly this in the meteorological
community. Furthermore, I feel the threat posed by the private weather industry is far
greater than any threat posed by software released under restrictive licenses.
7. References
Background Literature:
[1] Fulton, Richard A. et al, “The WSR-88D Rainfall Algorithm,” Weather &
Forecasting; Jun98, Vol. 13 Issue 2, p377, 19p
[2] Gourley, Jonathan J. and Calvert, Chris M., “Automated Detection of the Bright
Band Using WSR-88D Data,” Weather & Forecasting; Aug2003, Vol. 18 Issue 4,
p585, 15p
[3] Legates, David R., “Real-Time Calibration of Radar Precipitation Estimates,”
Professional Geographer; May2000, Vol. 52 Issue 2, p235, 12p, 2 graphs, 4c
[4] Brandes, Edward A., Vivekanandan, J., and Wilson, James W., “A Comparison of
Radar Reflectivity Estimates of Rainfall from Collocated Radars,” Journal of
Atmospheric & Oceanic Technology; Sep99, Vol. 16 Issue 9, p1264, 9p
[5] Klazura, Gerard E. et al, “A Comparison of NEXRAD WSR-88D Radar Estimates
of Rain Accumulation with Gauge Measurements for High- and Low-Reflectivity
Horizontal Gradient Precipitation Events,” Journal of Atmospheric & Oceanic
Technology; Nov99, Vol. 16 Issue 11, p1, 9p