FINAL REPORT – PLEC-TANZANIA
90
FINAL REPORT – PLEC-TANZANIA SECTION I: HISTORY OF PLEC WORK IN TANZANIA Summary Tanzania was first associated with PLEC project in July, 1993. The first meeting for establishment of East African PLEC (EAPLEC) was from 19-22 December 1993, under facilitation of Professor M.A. Stocking, Associate Scientific Coordinator for PLEC. Dr. Romano Kiome of Kenya Agricultural Research Institute (KARI) was appointed Cluster Leader assisted by sub-cluster leaders in Uganda and Tanzania, namely Joyce Tumuhairwe and Fidelis B.S. Kaihura respectively. The pilot work started in 1994 in the three countries, with fundig from United Nations University. The objective of the first phase was to characterize selected project sites in each country and develop and test methodologies in preparation for the main project phase. Research methodologies mainly involved Participatory Rural Appraisal (PRA) and assessment of resources within the context of agrodiversity. Fieldwork was first carried out in two transects mainly the Leeward and Windward sides of Mount Meru that were running from sub-humid to semi-arid ecozones. From second year onwards, work concentrated in two sites of Olgilai/Ngiresi and Kiserian both on the windward side in sub-humid and semi-arid ecozones respectively. A total of 8 institutions and 2 universities were involved in PLEC work from which 39 PLEC collaborators were based. PLEC collaborators were either permanent, temporary or contracted staff. About 3000 farmers nationwide were involved in PLEC work in some way. The majority of farmers participated in farmer to farmer training programmes, small scale projects by farmer associations, farmer training programmes and on meetings and workshops. On average 4 meetings, 1 workshop and 6 farmer to farmer training sessions successful farmer resource management models were conducted in Arumeru. Project implementation was mainly constrained by lack of expectise in analysis of agrobiodiversity data, lack of proper data to conduct time series studies, drought in semi-arid Kiserian affecting most experimental results, market problems for selling farmers raised products like tree seedlings, and delays in opening farmer 1
-
Upload
truongmien -
Category
Documents
-
view
225 -
download
0
Transcript of FINAL REPORT – PLEC-TANZANIA
FINAL REPORT – PLEC-TANZANIA
SECTION I: HISTORY OF PLEC WORK IN TANZANIA
Summary
Tanzania was first associated with PLEC project in July, 1993. The first meeting for establishment of East African PLEC (EAPLEC) was from 19-22 December 1993, under facilitation of Professor M.A. Stocking, Associate Scientific Coordinator for PLEC. Dr. Romano Kiome of Kenya Agricultural Research Institute (KARI) was appointed Cluster Leader assisted by sub-cluster leaders in Uganda and Tanzania, namely Joyce Tumuhairwe and Fidelis B.S. Kaihura respectively.
The pilot work started in 1994 in the three countries, with fundig from United Nations University. The objective of the first phase was to characterize selected project sites in each country and develop and test methodologies in preparation for the main project phase.
Research methodologies mainly involved Participatory Rural Appraisal (PRA) and assessment of resources within the context of agrodiversity. Fieldwork was first carried out in two transects mainly the Leeward and Windward sides of Mount Meru that were running from sub-humid to semi-arid ecozones. From second year onwards, work concentrated in two sites of Olgilai/Ngiresi and Kiserian both on the windward side in sub-humid and semi-arid ecozones respectively.
A total of 8 institutions and 2 universities were involved in PLEC work from which 39 PLEC collaborators were based. PLEC collaborators were either permanent, temporary or contracted staff. About 3000 farmers nationwide were involved in PLEC work in some way. The majority of farmers participated in farmer to farmer training programmes, small scale projects by farmer associations, farmer training programmes and on meetings and workshops. On average 4 meetings, 1 workshop and 6 farmer to farmer training sessions successful farmer resource management models were conducted in Arumeru.
Project implementation was mainly constrained by lack of expectise in analysis of agrobiodiversity data, lack of proper data to conduct time series studies, drought in semi-arid Kiserian affecting most experimental results, market problems for selling farmers raised products like tree seedlings, and delays in opening farmer associations accounts. Most problems were however dealt with but without perfection. Overal, farmer– extension-researcher interactions were initiated and strengthened during the entire project period
1

Tanzania was first associated with PLEC through correspondence with Dr. Harold Brookfield via his letter of 14 July 1993. He had earlier communicated with Dr. Kiome of Kenya Agricultural Research Institute (KARI) on establishing the East African PLEC Cluster (EAPLEC). Together with Kenya and later Uganda initiatives for forming the East African PLEC Cluster were made. East Africa was intended to cover land degradation as a major component but also covering aspects of agricultural systems analysis, biological changes and socio-economic analysis, involving scientists from research institutions and universities in the three countries.
The first meeting was held from 19th – 22nd December, 1993 under the facilitation of Prof. M. A. Stocking as Scientific Advisor at Silver Spring Hotel Nairobi. At this meeting Prof. M. A. Stocking introduced PLEC. Dr. Romano Kiome, then Assistant Director, Soil and Water Management Research at KARI was then appointed Cluster Leader. Two scientists from KARI and two from university of Nairobi participated in the first meeting Mr. Kaihura of Agricultural Research Institute Mlingano, Tanga (now at Ukiriguru) visited the Kenya team from 30/January to 3rd February 1994 to familiarize with PLEC Kenya team and introduce the ideas for the work in Tanzania.
The preperatory phase started by convening the members from the three countries again under facilitation of Prof. Stocking to draft pilot phase proposals and tour the pre-identified project study areas for Kenya, meet local extension staff and research officials, talk to farmers in order to identify key research issues in relation to human ecology, land management and environmental change. The study sites in Kenya included Kiambu, Embu and Laikipia.
Finally EAST AFRICA PLEC CLUSTER was established and set for the pilot phase. The main objectives of the pilot phase was to develop and test research methodologies in preparation for the main phase of the project. Each sub-cluster had a specific theme but all themes were related. The theme for PLEC Tanzania was “Farming Systems Response, Biodiversity and adaptation to Conservation.
Funding: The pilot phase in East Africa was funded by the United Nations University (UNU). Only this source of funding supported work in Tanzania.
Site selection
Since PLEC was introduced as addressing interrelationships between population and sustainable land use with an assumption of existence of massive differential impacts on land use and management; two district districts i.e. Lushoto in Tanga region and Arumeru in Arusha region selected. Selection criteria included high population density, diverse land use systems, different processes and stages of land degradation, in and out migrations, diversity of farming practices and existence of other projects in the districts working on natural resources management. Due to logistical problems, Lushoto was dropped and continued with Arumeru district.
2

Arumeru district:
Arumeru District is one of the 9 districts which form Arusha Region in northern Tanzania. The district lies between longitudes 36.5o to 37.5o east and latitudes 3.5o to 3.7o
south of the Equator. Mount Meru which is the second highest mountain in the country with the height of 45931.8 metres above the sea level, is situated in the northern part of the District. Arumeru District has an area of 2966 square Kilometres which is about 3.6 of the area of Arusha region of which total area is 82424 square kilometres. Administratively, the district is divided into 6 divisions, 37 Wards and 133 villages. It is composed of three major ethinic groups which are the more sedentary Wameru and Waarusha and the pastoralis Maasai.
Initially two sites one on the windward side and another on the leeward side were selected. Each site running from lower slopes of mount Meru to the lowlands. The windward site included Olgilai/Ng’iresi (upper slope position and sub-humid), Moshono (midslope and intermediate) and Kiserian (lower slope and semi-arid) villages.The leeward site included Engorika (upper slope position) and Olkokola/Lengijave (lower slope). The windward side normally receives more rains than the leeward.
Sites characteriation
Characterization of the sites was done for both windward and leeward sites. The selected sites were areas running from sub-humid to semi-arid ecozones covering most of land use systems, soils, climate and with different impacts of population and degradation. The windward site initially covered 4 kilometer width and 17 kilometer length (appendix 1). The site was later extended in the south (lowlands) to cover more aspects like irrigation under semi-arid conditions. The leeward transect covered about 5 km x 10 km square area.
Methodology
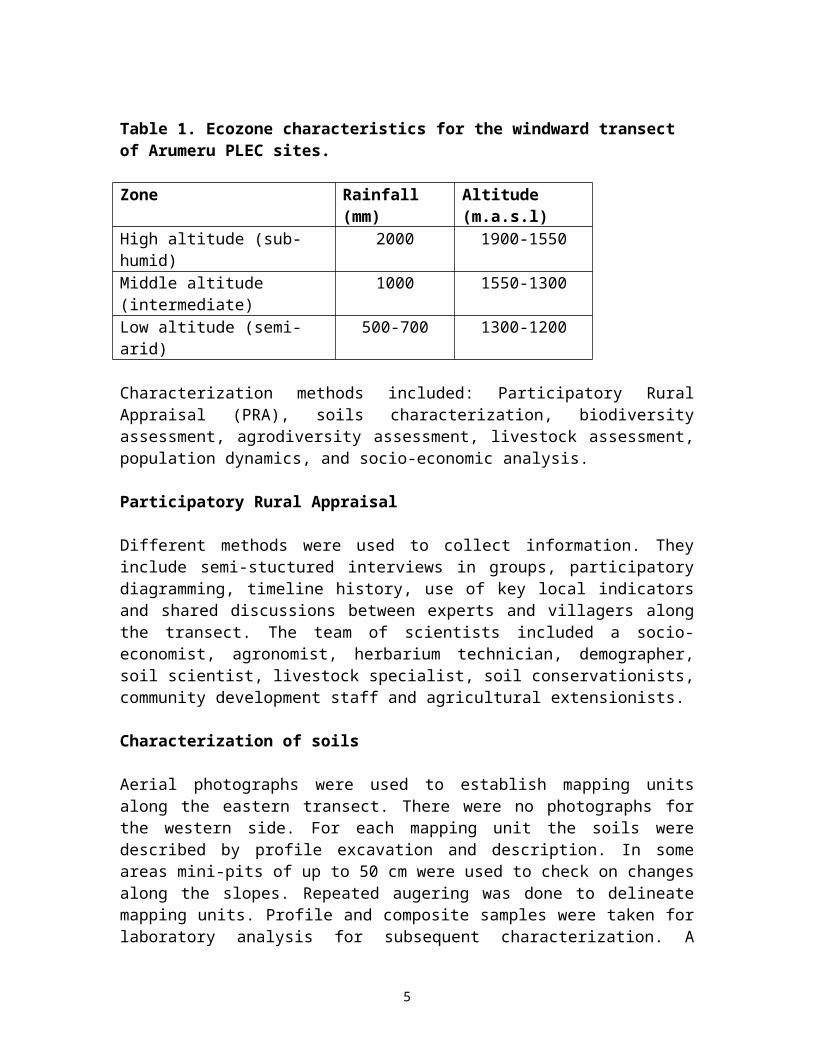
A transect approach was initially used to delineate the sites into ecozones based mainly on altitude and rainfall and hence associated differences in soils, cropping systems and management practices. Table 1 indicates the preliminary differentiating criteria of the windward transect.
Table 1. Ecozone characteristics for the windward transect of Arumeru PLEC sites.
Zone Rainfall (mm) Altitude (m.a.s.l)High altitude (sub-humid) 2000 1900-1550Middle altitude (intermediate) 1000 1550-1300Low altitude (semi-arid) 500-700 1300-1200
3

Characterization methods included: Participatory Rural Appraisal (PRA), soils characterization, biodiversity assessment, agrodiversity assessment, livestock assessment, population dynamics, and socio-economic analysis.
Participatory Rural Appraisal
Different methods were used to collect information. They include semi-stuctured interviews in groups, participatory diagramming, timeline history, use of key local indicators and shared discussions between experts and villagers along the transect. The team of scientists included a socio-economist, agronomist, herbarium technician, demographer, soil scientist, livestock specialist, soil conservationists, community development staff and agricultural extensionists. Characterization of soils
Aerial photographs were used to establish mapping units along the eastern transect. There were no photographs for the western side. For each mapping unit the soils were described by profile excavation and description. In some areas mini-pits of up to 50 cm were used to check on changes along the slopes. Repeated augering was done to delineate mapping units. Profile and composite samples were taken for laboratory analysis for subsequent characterization. A typical catena was described to represent soil characteristics for the western transect. Finally two maps on soils, physiography and vegetation cover were produced. Attached as appendices are the follow up maps on …………..
Agrobiodiversity assessment
This component of agrodiversity was assessed following PLEC-BAG guidelines.Selection of sample plots: Biased sample plots were used except in native forests. The aim was to collect the data representative of the most species diverse in a field type.Number of sample plots: The minimum number of sample plots depended on the type of the land use stage;- 5 plots were selected in native forests- 10 plots selected in house gardens and in edges- 3 plots were selected in annual cropping farms, planted forests, woodlots, micro-
catchment and in agroforestry systems.Plot size: Plot sizes were measured according to PLEC-BAG standards.- 1 x 1 m plots were used in edges and house gardens and as nested plots for sampling
herbaceous layer in field types within fallow, agroforestry, annual cropping, planted forests, woodlots, micro-catchment and in native forest.
- 20 x 20 m plots for sampling trees in native forests with nested subplots 5 x 5 m for sampling shrubs and 1 x 1m for sampling herbs, grasses and sedges,
- 5 x 5 m plots with nested 1 x 1 m plots were used for the rest of the field types.Data recording: Presence of species; Abundance of species; Ethno-botanical value of individual plant species, these were assigned to general categories such as food, medicinal, construction, fuel wood, fodder etc. and whether a plant species is an indicator of anything e.g. indicator of water, drought or salinity of the soil was recorded.
4
Sampling frequency: Sampling was does once, that was between May and June 1999 which was just after rainy season.
Agro-biodiversity data analysis:
Species richness and utility: Species richness within each plot, and within each field type was calculated and also species uses were recorded and tabulated in a special sheet.Similarity analysis: Sorenson’s formula, (Ss = Tci & j/(Ti + Tj) was used, Where: Ss = Sorenson’s similarity index; Ti & Tj = number of species in sample units i and j respectively; Tci & j = number of species in common to sample units i and j.Multiplied by 100 and reported as percent similarity value. The aim was to compare species composition among common field types within the sites and between the sites using individual farmers of the same status and different status e.g. between poor farmers within the sites, between poor and average farmers within the sites and between rich or poor, between the two demonstration sites.Species – area curves: Species-area curves were plotted using calculated cimulative number of species against cumulative area (Ha). The aim was to compare species-area relationships of different field types. Differences in the slope and inflection point of species-area curves, reflect differences in both total species richness between field types and distribution of species richness within them.Abundance – diversity curves: The curves were constructed by plotting species relative abundance against species rank. The aim was to show the relationship between species evenness and species richness in field types within sites and between the sites. Differences in the slope and shape of curves reflect differences in species richness and species evenness and their relationship to one another.
A qualitative method was also used to classify vegetation types based on physiognomic characteristics e.g. grassland, woodland, bushland or forest. Plant identification was done in the field using field guide identification books i.e. Flora of East Africa (Published families), A field guide to the wild flowers of East Africa (Blundell, 1987), and checklist of Kilimanjaro Flora (Bigger, 1968). Unknown or unfamiliar species were sampled and processed for identification in the herbarium.
Agrodiversity assessment
Assessment of agrodiversity was conducted in two PLEC sites of Arumeru, covering in detail most aspects of biophysical diversity, crop, land and livestock management diversity. To start with, farmers were grouped into three resource categories of poor, average and rich based on criteria set by themselves. Land Use Stages (LUS) and Field Types (FT) in each LUS as defined in PLEC News and Views (PNV) 13, April 1999 were then established in both PLEC sites. Pre-identified LUS and farmers fields were visited. For each LUS, reconnaissance traversing was done crosscutting the entire area whereby different existing field types were delineated. In farmers’ fields, existing field types were identified and named. Identification and assessment was done in collaboration with key informants in case of public lands and farm owners and key informants in the
5

case of farms. A checklist outlined in PNV 13 (1999) was the main guideline to most of the data collected. General surface conditions of each field type were described in terms of farm ownership, farmer category, farm location, land form, vegetation, drainage and % slope of the field, fertility rating, and evidence of NP&K deficiency symptoms on plants. To describe subsurface properties 10x50 cm2 mini-pits were excavated. Soils were described in terms of mini-pit characteristics and named in local and scientific names. Other descriptive parameters included: topsoil depth, surface (0-20 cm) and subsurface (30-50 cm) soil properties of color, texture, structure, consistence, pore size and distribution, and root size and abundance. For each minipit soil samples were taken from surface and subsurface horizons for laboratory analysis. In cases where field types did not show clear soil differences one minipit was described to represent similar field types in terms of soils.
Management systems were assessed in terms of crops and cropping systems, planting, tillage, livestock management, soil management of household farms and soil management of rented and/or hired farms. Crops and cropping systems were assessed in terms of types of crops/trees found in the field type, scientific, Kiswahili and local nomenclature, total number of varieties per field type, economic uses, characteristics of each variety, cropping systems and cropping systems strategies. Planting was characterized in terms of planting season and time, planting materials and methods, source of planting materials and existence or non existence of volunteer crops in each field type. Tillage was assessed in terms of types of tillage and tillage tools. Livestock where available were described in terms of type of breed and nomenclature, source of the breed, purpose of the breed, feeding and housing systems. Crop and soil management were characterized in terms of types of weeds and weed control, pests and their control, crop storage. Soil management was addressed in terms of fertility management types and strategies, soil erosion, drainage and moisture conservation systems.
Population dynamics
Whole group discussions were held between farmers, extension staff and the scientists. Visual assessment during site traversing was also made and compared to discussions held with farmers and extensionists. Indirect interrogation was also used to obtain major indicators of population dynamics such as household size, fertility, mortality and morbidity, and provision of major social services like water, hospitals, schools and family planning which have an effect on population dynamics or wellbeing.
Socio-economic analysis
Establishment of farmer categories
The initial step was to identify volunteer farmers to work with PLEC. These farmers were grouped into three resource endowment categories based on criteria set by farmers themselves. The criteria included: number of wives, type of houses (brick walls and roofed with iron sheets versus mud and roofed with grass), number and type of livestock, size of the farm and types of farm implements used (ox or tractor drawn or by hand).
6
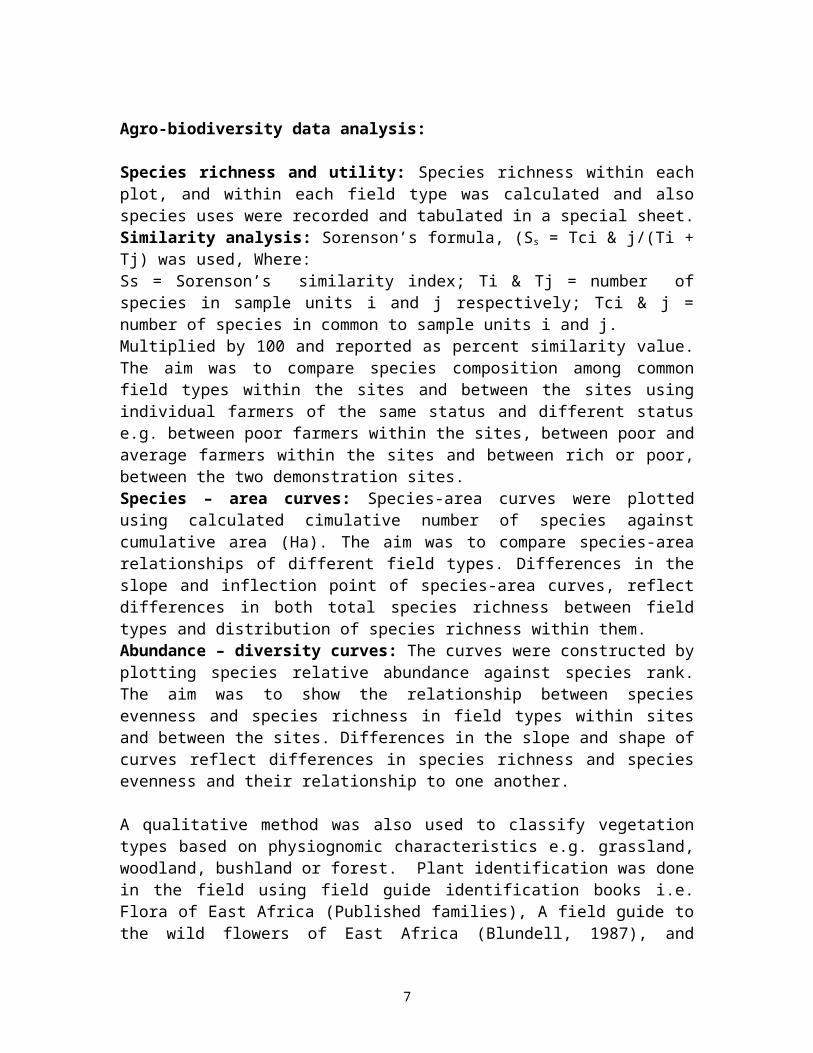
Figure 1 indicates the distribution of PLEC farmers by resource endowment in both sites. The majority of farmers in Olgilai/Ng’iresi were rich (63%) while the majority in Kiserian were average (54%). In both sites poor farmers based on set criteria were the minority.
Socio-economic aspects were covered along the same transects as population dynamics study. Choosing the two transects was based on changes in altitude and rainfall on both the windward and leeward sides of amount Meru. The eastern transect covered highland villages such as Sambasha and Ngiresi; Baraa village in the medium altitude while Kiserian village was representative of the lowlands. The Western transect was represented by Engorika village downward through Olkokola to Lengijave.Several approaches were used to obtain information including; semi-structured interviews with farmers and discussions with various leaders. Also participatory approach was applied where it was more appropriate. In these interviews gender balance was also sough when information was needed from both sexes.
Land degradation assessment
Land degradation assessment was conducted along with agrodiversity assessment for each field type. It was described in terms of erosion types, presence or absence of micro-pedestals, exposed tree trunks or mounds with corresponding estimates of the erosion rate in each case, contrast in colour of bare and covered surface patches, surface conditions with or without signs of crusting, sealing or stone remnants, evidence of deposition and its deposition rate, evidence of soil accumulation against trees or other obstructions, evidence of land slides etc. For areas with evidence of erosion, performance of the current crop was also rated. For each type evidence of sodicity or salinity was checked by presence or absence of indicator plants and later to be confirmed by laboratory estimates for ESP and tests for Ec respectively. For each field type, major degradation agents were also described and biological activity where evident also described.
The pilot phase report 86 pp was a product of the field activities for the period 1994/96. A table of contents for the report is appended. A soils, physiography and land cover map of the transect was also produced as part of the report. Field work continued for both sites for the year one activities. In the second year it was recommended by PLEC management to concentrate on one side. Full time work was then implemented on the windward side with Olgilai/Ng’iresi and Kiserian as sub-humid and semi-arid PLEC demonstration sites respectively. The intermediate site was also dropped. The objective was to concentrate efforts in a smaller area and become effective.
Progress of work within the four GEF-PLEC years
PLEC activities since 1998 were grouped into eight main activities mainly (1) working with farmers in established demonstration sites, (2) biodiversity and agrodiversity assessment, (3) participatory rural appraisal especially on organizational aspects, (4) outreach and experimental work, (5) conducting meetings and workshops on models, (6) capacity strengthening, (7) networking and (8) coordination. Field work was always
7

guided by annual terms of reference for each sub-cluster as outlined by the Principal Scientific Coordinator, follow scientific visits by respective associate scientific coordinators and where necessary technical visits by some of the PLEC staff members with more experience and exposure in certain components of PLEC work particularly biodiversity assessment and analysis. The main outputs for each year included: (a) feedback meetings to PLEC farmers on the outcomes of work for the respective years, (b) Annual workshops for Farmers and other stakeholders in the district, inviting key people from outside to open these workshops and others to make presentations on identified topics addressing focus PLEC topics, (c) Annual and semi annual progress reports to the Managing Coordinator, the scientific coordinators and cluster leaders, (d) training programmes particularly to farmers for capacity building especially in areas of biodiversity management and conservation, (e) participating and contributing to workshops and conferences organized by other relevant institutions, (f) preparing papers for journal publication and making contributions to the PLEC News and Views periodical.
Number of persons involved in PLEC work since 1998.
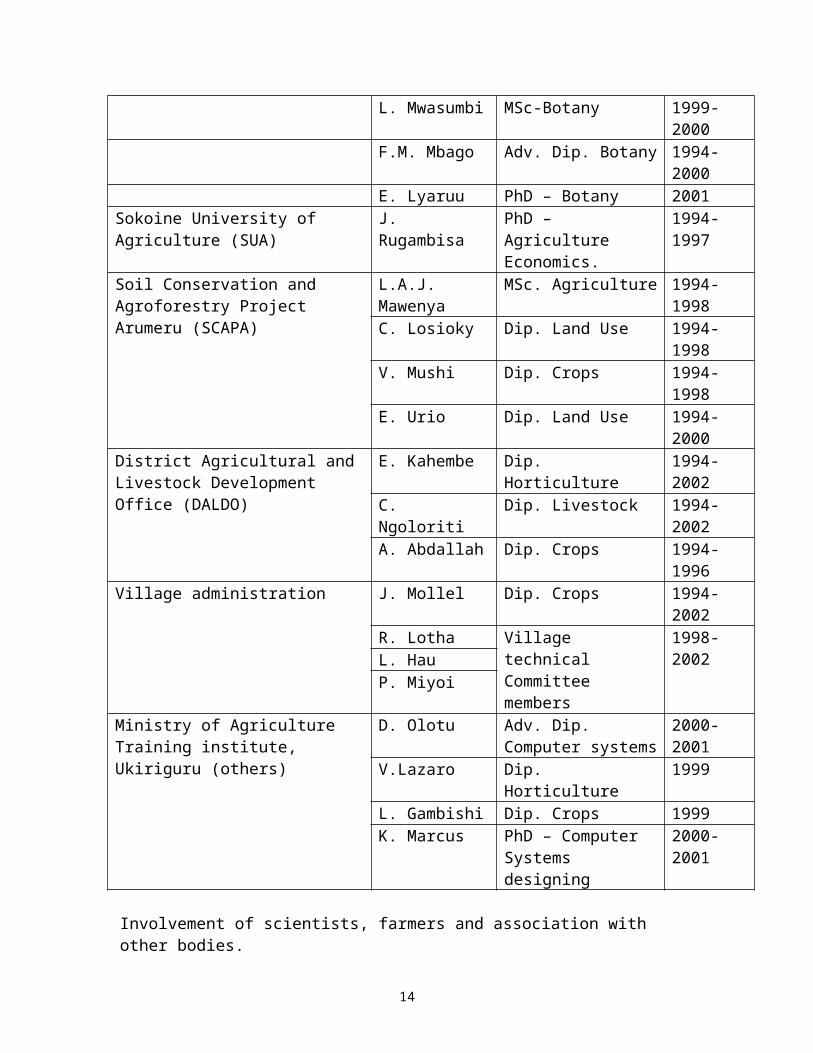
The entry point in Arumeru was through an existing Soil Conservation and Agroforestry Project (SCAPA) which also gave support staff for reconnaissance of the area and selection of representative transects. The others were the office of the Zonal Director, Research and Development, Agricultural Research Institute Selian and the office of the District Agricultural and Livestock Development Officer (DALDO) all of which provided staff to work with PLEC. Gradually more collaborators from different institutions and Universities were approached to work with PLEC. Table 2 summarizes a list of researchers, consultants and ministry of agriculture training officers who worked with PLEc for the period 1994 to 2001.
Table 2. Scientists, training and extension officers with PLEC 1994 to 2001.
Institution Collaborators Category PeriodAgric. Res. Institute Mlingano, Tanga F.B.S. Kaihura MSc – Soils 1994-2002
E.G. Kaitaba MSc. Soils 1994-2000B.S. Kiwambo PhD – Soils 1994-2001K. Masuki MSc. Agroforestry 1998-1999J.G. Mowo PhD – Soils 1994-1998J. Ngailo MSc. Soils 2000-2002
Agric. Res. Institute Selian, Arusha N.T. Massawe PhD – Livestock 1994-1998P.A. Ndakidemi MSc. Soils 1998-2002P. Msengi Dip. Crops 1998-2000A. Kingamkono MSc. Agromet 2000+
Agricultural Res. Institute, Ukiriguru, Mwanza
J. Maphuru MSc. Socio-econ. 1998-2000E. Mwalukasa MSc. Socio econ. 2000-2002E. Kemikimba Post Dip. Lab. sources 1998-2001F.P. Baijukya MSc. Soils 2001-2002C.J. Maganga Dip. Crops 2000-2002
8

Min. of Agric. & Food Security, DSM P.M. Ndondi Adv. Dip. Land Use 2000-2002Tropical Pesticide Research Institute, Arusha
J. Elia MSc – Botany 2000-2002N. Mollel BSc. Botany 2000-2002E. Mboya Post Dip. Botany 2000-2002
University of Dar-es-Salaam M.J. Mbonile PhD – Demography 1994-2000L. Mwasumbi MSc-Botany 1999-2000F.M. Mbago Adv. Dip. Botany 1994-2000E. Lyaruu PhD – Botany 2001
Sokoine University of Agriculture (SUA)
J. Rugambisa PhD – Agriculture Economics.
1994-1997
Soil Conservation and Agroforestry Project Arumeru (SCAPA)
L.A.J. Mawenya MSc. Agriculture 1994-1998C. Losioky Dip. Land Use 1994-1998V. Mushi Dip. Crops 1994-1998E. Urio Dip. Land Use 1994-2000
District Agricultural and Livestock Development Office (DALDO)
E. Kahembe Dip. Horticulture 1994-2002C. Ngoloriti Dip. Livestock 1994-2002A. Abdallah Dip. Crops 1994-1996
Village administration J. Mollel Dip. Crops 1994-2002R. Lotha Village technical
Committee members 1998-2002
L. HauP. Miyoi
Ministry of Agriculture Training institute, Ukiriguru (others)
D. Olotu Adv. Dip. Computer systems
2000-2001
V.Lazaro Dip. Horticulture 1999L. Gambishi Dip. Crops 1999K. Marcus PhD – Computer
Systems designing2000-2001
Involvement of scientists, farmers and association with other bodies.
The previous table indicated institutions and scientists from respective institutions. Some scientists worked on permanent basis. Others worked on short term or contracts. Some died and were replaced by others from same or other institutions.
Farmers involvement was first through Participatory Rural Appraisal (PRA) on constraints and control methods in natural resources management. Also in establishment of criteria for farmer categorization, identification of different land use stages and field types. In addition they were involved in establishment and implementation of the farmer to farmer exchange of knowledge and practices, conducting experiments and taking part in outreach programmes within and outside PLEC sites. Most projects working on natural resources management and community development were also worked together with PLEC. In many cases PLEC farmers were also farmers of other organisations in the village. The activities of each project continued to be complementary in addressing rural livelihoods. None of them however addressed biodiversity. Some projects found and working in collaboration with Arumeru included Heifer Project International (HPI), Traditional Irrigation Project (TIP) and the Community Development Unit, Arumeru
9

district. After compilation of reports on activities conducted during half/full year feedback meetings or workshops were organised for stakeholders in Arumeru and elsewhere to deliberate on the findings, develop recommendations and plan for future work. Participants from relevant institutions including the office of the Vice President, Department of Environment, the National Environmental Management Council and the Land use Planning Commission were among those that participated in PLEC organized gatherings. Table 2 summarizes the involvement of scientists, farmer, extension staff and other stakeholders in PLEC meetings, workshops and conferences.
10

Table 2. PLEC–Tanzania meetings, workshops, conferences and field visits for the period 1998 – 2002
Year Activity Activity Details F S E O Total1998 Meetings PLEC Project awareness awareness creation 150 3 5 2 160
Workshops PLEC Project awareness creation; Project implementation planning for collaborators
2 8 2 10 22
Farmer visits Farmer exchange visits from one site to another (Olkokola to Kiserian due to poor performer in Olkokola)
24 1 2 - 27
Field days Evaluation of farmer conducted experiments on soil fertility improvement and water harvesting in semi-arid Kiserian
18 4 5 10 35
Farmer to farmer visits organized between farmers and sometimes with facilitation of extension and/or scientists in Olgiali/Ngiresi
30 2 2 11 35
1999 Meetings Research Prog. Resource Fertility and drainage improvement of vertisols Erosion control using traditional sometimes.
18 - 2 - 20
Farmer visits Exchange visits between sites for farmer training other farmers sessions
48 2 2 2 54
Production of local and improved pastures 19 - 2 2 23Orientation of farmers to farmer association activities
18 - 2 4 14
Conferences International soil conservation organisation conference, Purdue University, Indiana, USA
- 1 - - 1
Agrobiodiversity initiatives for the Lake zone - 1 - - 12000 Meeting Zonal Annual Internal Programme Reviews - 3 - - 3
Workshops Global Biodiversity Forum by CBD Nairobi - 1 - - 1Soil Fertility recapitalization by WB in DSM - 1 - - 1
11

Progress of PLEC-Tanzania activities in Management meeting, Belem, Brazil.
- 1 - - 1
Farmers visits Inter-farmers self organized visits 40 - - - 40Feedback on Technical & Policy recommendation in respective villages
45 3 3 5 56
Technical and Policy recommendations 1 36 5 5 6 52PLEC future planning and continuation of current work
30 3 3 5 41
Technical and Policy recommendation 1 2 ? ? ? ?2001 Meetings Research and monitoring finds feedback 35 2 4 6 47
Annual Lake Zone Internal Programme reviewUNU/PLEC Management meeting - 19 - - 19
Workshops Incentive, measures to Enhance Sustainable use and conservation of Agrobiodiveristy – Zambia
- 1 - - 1
Farmer visits National agricultural shows 5 2 - - 7Familiarization of PLEC activities by farmers from neighboring Kilimanjaro region.
27 1 3 - 31
Familiarization to women from neighboring village to PLEC villages on small scale poultry production
24 - 2 2 28
Biotechnology of bananas production and dairy goats production
As above
Technical and policy recommendations 2 40 5 2 3 50Technical and policy recommendation feedback and PLEC future planning.
30 3 3 5 41
Symposium International Symposium on managing biodiversity in Agricultural Systems, Montreal
- 1 - - 1
12

Major problems in implementing PLEC work
Delays in establishing guidelines for biodiversity and agrodiversity assessment that initially we had to work using common procedures as outlined in literature and adopted with modifications nationally. After receiving guidelines most work followed PLEC procedures.
Lack of a full time conversant candidate to work on database development. All those who worked on it were there for short time. Efforts were made by PLEC management for the database person to one member of the BAG in Ghana and discuss on organization and analysis of data using both excel and access. This candidate was also assigned other duties by his employer after coming from Ghana. Efforts to get assistance from Dr Anna Tengberg of UNEP Nairobi did not also succeed. As a result most of the analysis is still pending.
The scattered nature of collaborating scientists in different institutions sometimes made it difficult to get everybody in the field at the time required and to submit reports well in time. Occasionally report writing had to be organised as an activity and bring all individuals to one place to accomplish the work.
Drought problems in semi-arid Kiserian site such that experiments on fertility improvement were not successful for most farmers due to mid season drought. Treatment effects on crop performance were assessed at silking stage for maize, and yield could be assessed for farmers combining water harvesting and fertility improvement.
Lack of time series remote sensing data to assist in analysis of multi-temporal changes work. Temporal and spatial changes in land use and others was done mainly using historical information from the elderly.
Water shortage due to drought in semi-arid Kiserian that retarded progress in raising tree nurseries particularly for farmer associations activities. Where possible containers and watering buckets were bought for farmers to effect irrigation.
Failure to get a market for selling tree seedlings raised by farmer associations for raising income. Instead of selling farmers have been advised to plant all the seedlings in degraded parts of their villages while potential markets are being explored by both PLEC staff and district extension office.
Delays for farmer associations to open accounts based on savings obtained from some of the association income generating and biodiversity enhancing projects. The process of formal registration of these associations is on-going before they can be allowed to open bank accounts.
13
SECTION II: DESCRIPTION OF PLEC-TANZANIA PROJECT AREA
Summary:
PLEC sites in Tanzania are located on the footslopes of the windward side of mount Meru. The project sites are located in the area between 36 42' 50'' E; 3 19' 36'' and 36 45' 00 E; 3,19' 36'' S. Pumice is the main parent material from which soils are developed. Major soils include Eutric Nitisols, Calcic Vertisols and Haplic Cambisols in semi-arid Kiserian and Eutric, Andosols, Mollic Flurisols and Alic Andosols in sub-humid Olgilai/Ng’iresi. The main farming systems are agropastoralism and agroforestry in Kiserian and Olgilai/Ng’iresi respectively. The population is about 3330 in Kiserian and 2158 in Olgilai/Ng’iresi based on 1999 village level census by PLEC. The 1988 census puts Arumeru one of the districts with highest population density in the country.
About 60% of the district is under cultivation, 30% under grassland and 10% under forest. Coffee/banana/trees agroforestry is dominant is sub-humid Olgilai/Ng’iresi. Other sub-humid crops include: maize, beans, Irish potatoes and vegetables. The lowland practice both crop production and livestock keeping. Major crops of the lowlands include maize, beans, millet and pigeon peas, cassava, sweet potatoes and sunflower have also been reinproduced by PLEC as they were also cultivated in the past.
Farmers are categorized into three classes. In Olgilai/Ng’iresi the rich category has more three acres of land, 3-8 heads of cattle and obtain more income from crop production. The average class owns 1-3 acres of land and 2-3 heads of cattle. Crops are the major source of income but at a lower rate than the rich.
The poor have less than 1 acre and between 1-2 cows or none at all. Overall, off-farm income contributes about 60% of the household income in Olgilai/Ng’iresi.
January to June are the most difficult months for cash income as no crops are sol during this period. One average 73% of total household income is spent on family requirements that include food, clothing, school fees, tax/levies and to some extent medication.
Climate, soil type, topography and management practices influence land degradation in both sites. Low fertility, soil erosion, poor vegetation cover and over grazing are among the major factors influencing degradation. Erosion control and use of organic inputs are among the practices addressing degradation control.
The sites in Tanzania are all found in one district. For purposes of description the climate, soils and land use systems do not differ as they are all situated on the footslopes of mount Meru. The description is therefore valid for both sites. Geology and land forms
The volcanic eruptions of mount Meru resulted in the formation of many volcanic cones around the project area. These cones have been formed by lateral dykes from the main
14

pipe conduit. Very few of the cones have craters indicating that the dykes had limited forces. There were indications of abundant gas in the erupting magma as evidenced by numerous gas filled vesicles or cavities with a sponge like form known as scoria forming the pumice. The parent material of which the soils around mount Meru have been formed.
A large part of the area around mount Meru is dominated by volcanic cones hills, dissected foot slopes and undulating plains. In general the volcanic cones are characterized by steep and long slopes which become gentle to almost flat at the lower part of the foot slopes. The foot slopes of the volcanic cones merge to form wide and sometimes extensive U shaped valleys. The physiography of this area characterized by steep and long slopes presents a big threat of erosion. Land use has to go hand in hand with a number of diverse soil and water conservation measures.
The sub-humid site of Olgilai/Ng’iresi is located along the foot-slopes of Kivesi hill -one of the volcanic cones of Mt Meru. Kivesi hill is characterised by steep slopes and broad valleys. The semi-arid site of Kiserian is located in the lowlands as extended plain of mount Meru. The lithology of the area is late cretaceous to recent volcanic materials composed of basalts, trachytes and pyroclastics (Sir M. MacDonald & Partners Ltd, 1990).
Some characteristics of Arumeru PLEC sites northern Tanzania
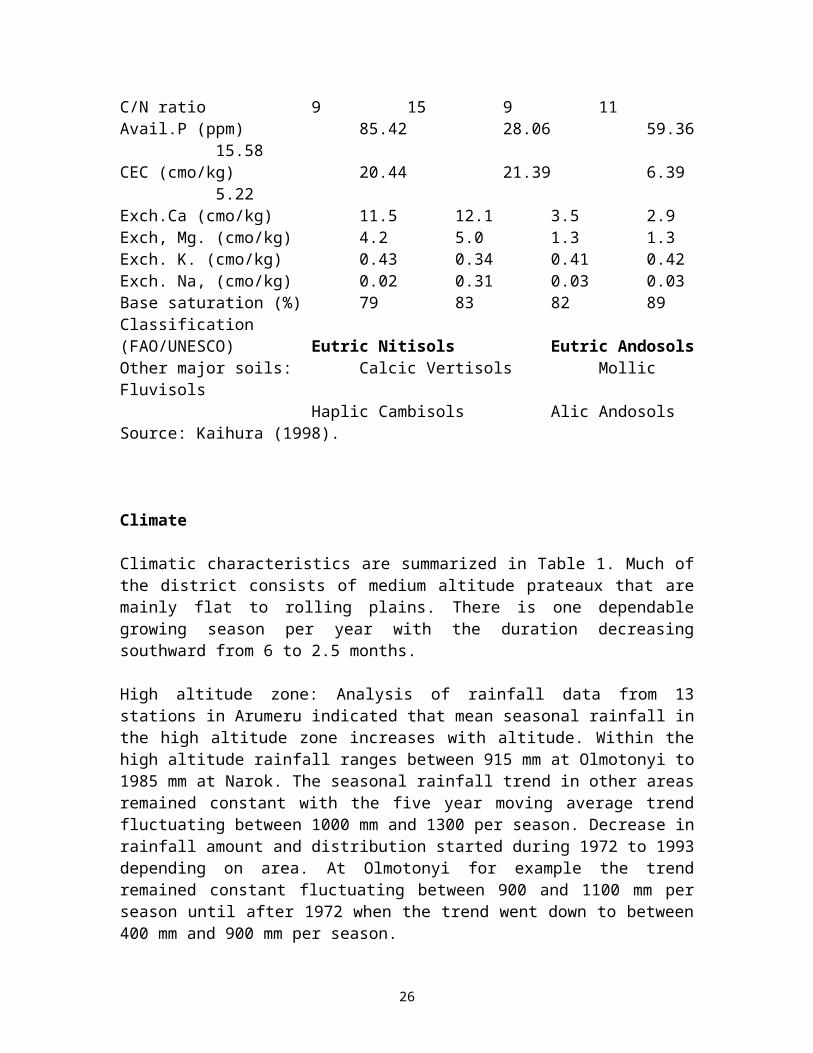
Olgilai and Ng’iresi villages constitute the high altitude, high rainfall subhumid site, while Kiserian village constitutes the low altitude, low rainfall semi-arid site in Arumeru district. The study sites are located in the area between 36 42’50”E; 3 19’36” and 36 45’00”E; 3 19’36”S. Agroforestry is the major land use system of the sub-humid site while agro-pastoralism is the dominant land use in the semi-arid site. Rainfall pattern is bimodal with long rains from March to May and short rains from November to December. The rainfall pattern and amount is determined by the dual movement of the Intertropical convergence zone (Fernandes et al. 1984). Table 1 summarizes some major characteristics of the study area.
Table 1. Salient features of PLEC study sites in Arumeru district
Characteristic Kiserian (Lowlands) Olgilai/Ngiresi (Uplands)Elevetion (m.a.s.l) 1,200 1,900Annual rainfall (mm) 500 2,000Temperature range 12-30 C 12-30CDominant farming system Agropastoral AgroforestryVillage population (1988) 3,330 2,158Major soil characteristics 0-20 cm 40-50 cm 0-20 cm 40-50 cmClay (%) 75 81 15 12Silt (%) 15 11 47 46Sand (%) 10 8 38 40PH H2O 1:2.5 6.3 6.4 6.4 6.6Org.C.(%) 0.8 0.3 3.7 4.5
15

Tot. N (%) 0.09 0.02 0.39 0.42C/N ratio 9 15 9 11Avail.P (ppm) 85.42 28.06 59.36 15.58CEC (cmo/kg) 20.44 21.39 6.39 5.22Exch.Ca (cmo/kg) 11.5 12.1 3.5 2.9Exch, Mg. (cmo/kg) 4.2 5.0 1.3 1.3Exch. K. (cmo/kg) 0.43 0.34 0.41 0.42Exch. Na, (cmo/kg) 0.02 0.31 0.03 0.03Base saturation (%) 79 83 82 89Classification (FAO/UNESCO) Eutric Nitisols Eutric AndosolsOther major soils: Calcic Vertisols Mollic Fluvisols
Haplic Cambisols Alic AndosolsSource: Kaihura (1998).
Climate
Climatic characteristics are summarized in Table 1. Much of the district consists of medium altitude prateaux that are mainly flat to rolling plains. There is one dependable growing season per year with the duration decreasing southward from 6 to 2.5 months.
High altitude zone: Analysis of rainfall data from 13 stations in Arumeru indicated that mean seasonal rainfall in the high altitude zone increases with altitude. Within the high altitude rainfall ranges between 915 mm at Olmotonyi to 1985 mm at Narok. The seasonal rainfall trend in other areas remained constant with the five year moving average trend fluctuating between 1000 mm and 1300 per season. Decrease in rainfall amount and distribution started during 1972 to 1993 depending on area. At Olmotonyi for example the trend remained constant fluctuating between 900 and 1100 mm per season until after 1972 when the trend went down to between 400 mm and 900 mm per season.
Middle altitude zone: The altitude in these stations ranges between 1219 m.a.s.l. at Tengeru to 1432 m.a.s.l. at TPRI. The mean seasonal rainfall varies from 805 mm at TPRI to 1183 mm at Tengeru. The trend in the mean seasonal rainfall indicates an increase in rainfall as one move from west to east. A five-year moving average in the stations does not show any evidence of cyclic trends. The trend at Tengeru show that the seasonal rainfall has been decreasing from between 1500 mm to above 2000 mm in the early 1960’s to values below 1000 mm after 1972.
Low altitude zone: The mean seasonal rainfall varies from 426 mm at Lucy Sisal Estate to 745 mm at Dolly Estate and it increases with altitude. A five-year moving average does not show an evidence of cyclic trends in any of the stations. The trend of seasonal rainfall is constant for several parts fluctuating between 500 and 1000 mm per season.. The trend at Lucy Sisal Estate showed a decreasing trend, decreasing from above 500 mm in the late 1970’s to about 400 mm in the 1980’s and to below 400 mm after 1990.
16

Population distribution
According to population census of 1988, Arumeru District has total population of 350827 people. The annual growth rate is estimated to be 3.8% slightly higher than the average regional annual growth rate of 3.5%. Based on projections therefore the district is now estimated to have a total population of 421488 people and the population density of 137 per square kilometre (one of the highest population density in the country). The average population density however, varies from the highly populated to the lower plains which have scattered population. Population growth rates and density in Arumeru increased slightly in 1960s compared to the 70s to the 90s. During the 70s and 90s the population probably due to increase in rate of out migration to other areas of Tanzania due to land scarcity. Out migration goes both within and outside the region. Based on Arumeru district Area profile 1998, the district’s current Crude Birth Rate (CBR) is estimated to be 53 people per 100, while the Crude Death Rate (CDR) is estimated to be 15 people per 100. Life expectancy is estimated to be 60-65 years. The situation might have changed now following the HIV aids problem.
Immigrant population: Arusha municipality is one of the hubs of tourist attractions. It has become an attractive settlement not only to people from neighbouring districts but also to foreigners. Immigrations from poorer regions are not easily controlled or restricted. Any excess population probably settles in Arumeru district. A possibility of out migration especially for the new generation seeking better and less populated areas in other parts of the country is foreseen. In the lowlands livestock exceed the estimated carrying capacity of 15 livestock units per km2 and is one of the major causes of degradation.
Soils: Soils are well drained dark sandy loams and loams developed on volcanic ash and pumice. They are of moderate to high natural fertility and favourable moisture holding properties. The soils are, however, highly susceptible to both water and wind erosion even on gentle slopes and require careful management. Low production and declining productivity is seen as a major problem.
Crops: About 60% of the land is under cultivation, 30% under grassland, and 10% under forest. In the sub-humid altitude, the coffee/banana/trees agroforestry system is dominant. Other crops include beans, maize, Irish potatoes, and vegetables. The lowlands practice both agricultural crop production and livestock keeping. Major crops include maize, beans, millet and pigeon peas. Through PLEC cassava, sweet potatoes, and sunflower, crops that were previously grown but disappeared were reintroduced. In some parts irrigation is practiced using water from the slopes of mount Meru. Livestock in Kiserian include cows, goats, sheep, pigs and donkeys.
Household characteristics
(i) The rich (upper) class
Rich farmers in Olgilai/Ng’iresi own more than 3 acres of land, between 3-8 heads of cattle and obtain a lot of income from crops (maize, coffee, bananas, beans and round
17

potato. In Kiserian rich farmers own more than 10 acres of land, keep more than 30 heads of cattle, 60 or more goats and about 10 sheep. They get a lot of income from maize and beans. They constitute about 5% of the village population in each site.
(ii) The average (middle) class
Average farmers in Olgilai/Ngiresi own between 1 and 3 acres of land, 2-3 heads of cattle, few sheep and chicken. Income is obtained from crops but less than what rich farmers get. They also earn income from sales of crops i.e. maize, coffee, bananas, beans and round potatoes at a lower magnitude than the rich. This category is about 15% of the village population. In Kiserian average farmers own between 5 and 10 acres of land, keep between 10-25 heads of cattle, 10-15 goats and about 2-5 sheep. They get income from crops. Average farmers constitute 15 and 60 percent respectively of the village population.
(iii) The poor (lower) class
Poor farmers in Olgilai/Ng’iresi have on average less than 1 acre of land, between 1-2 heads of cattle or no cattle at all and sell very small quantities of maize, coffee and round potato. Bananas are not enough even for home consumption. This category is about 80% of the village population. In Kiserian, poor farmers own less than 5 acres of land, keep less than 8 heads of cattle and do not own small animals. Income obtained is very low mostly from maize. Poor farmers constitute 80% and 35% of the village population for Olgilai/Ng’iresi respectively.
In both sites mean adult male and female is about the same. The average number of children per household is higher than adults in both zones.
Semi-arid households generally have large family sizes than sub-humid households. This is because males in Kiserian have many wives (two or more) than Olgilai/Ng’iresi. Education of heads of household ranges between standard 1-4 in Olgilai/Ng’iresi and 5-8 Kiserian. However, male members of the families are relatively more educated than the female members. Heads of households in rich categories have more education than their counterparts in other categories (they have above primary school education).
Across the different households, heads of households in rich category are older than the average and poor categories. All households in the rich categories have large families than other categories, followed by average category. The poor categories have the smallest family size. In Olgilai/Ng’iresi, the number of adult males in rich households differed significantly from poor households. While the number of youth females differed significantly from average and poor households significantly. In the low lands, heads of households in rich households have more education than in poor households, while the number of adult female is also greater than in poor households. The number of youth female is significantly different from average and poor households.
Household income and expenditure
18

Farmers in Arumeru District obtain income from three main sources, crops, livestock and off farm activities. Unlike other rural areas, off farm income contributes about 60 % of total household income for most farmers in Olgilai/Ng’iresi and Kiserian. Income from sales of crops and livestock and their products is second.
In both sites rich farmers get more income from crops than livestock. Crops sold include coffee, round potato, maize and beans. Cowpeas and pigeon peas are also sold in the semi-arid site. According to farmers, crops were the major source of income for majority of the households, however, changes of weather, declining soil fertility and farm sizes, have affected crop production. Most farmers sell their crops at home, while some sell in town. Prices for food crops are highly variable which cause considerable risks on household income. In zones where coffee is not grown farmers rely on very few crops for their income.
Although livestock is second important, animals are not sold regularly because they have both social and economic value. Livestock are sold only as last option (when farmers do not get income from the other sources). Many farmers responded that they sold their animals because of agent cash requirements for school fees, critical food shortage etc. In terms of numbers, the sales of livestock referred mainly to sheep, goat and chicken but in value terms the sales of cattle are more important. Cattle are farmers savings account and some used as source of draft power. Cattle are increasingly traded and their sales have a strong impact on the household budget. However, the prices for live cattle are very low during food shortage periods and increases when there is enough food.
January to June are the most difficult months for cash income, while a few indicated July to September to be difficult months. The major reason given is because no crops are sold during these months (January to June). Farmers indicated July-December to be good period for income generation because most of the crops are harvested and sold during this period. Farmers solve their financial problems through selling of livestock and off farm activities. Few farmers mainly in category three mentioned borrowing from friends and relatives as a solution. The off-farm income was mainly obtained from wage labour and petty trade (small-scale trading and running a shop). A few have part time job in town. Most of category one farmers fall under this group. Although, off-farm activities are limited, most farmers particularly in average and poor households consider it as important for their livelihood. In some households the youths are staying away looking for off farm activities and send some money back home.
Family expenditures account for between 60% and 85% of total annual household income. This was observed across all categories in the study area. The major components of family expenditures are food, cloths, school fees, tax/levies and to a limited extent medication. Livestock purchases are among the major expenditures of the households. This indicates that cattle are still considered a good investment in the rural areas. Other major expenditures relate to house construction. Expenditures on agro-inputs to improve the returns from agriculture is minimum.
Land degradation its causes and effects in Arumeru
19

The common factors of land degradation were evaluated for both PLEC sites. The factors included climate, soil types, topography, management practices and their effects on biological activity. Others were sodicity and salinity.
Olgilai/Ngiresi:
Annual rainfall is high but intensity is much reduced by the canopy developed under the forest and agroforestry systems that are dominant land use types in the area. The soils are either clay over silt clay or silt clay loam over silt clay. The structure is either very weak, fine and medium subangular blocky or moderate, fine and medium subangular blocky. Where high levels of organic matter have been applied a granular structure is common. Organic matter content ranges from low to high based on manure and crop stover management. The area is hilly with farms situated either on mountain ridges or hill crests, upper slopes or lower slopes and valleys. For most field types the slopes are straight, ranging from 4 to 120 meters. Field types are smaller in area compared to those in Kiserian. The slope gradient also ranges from 0o – 3 0o.
Surface cover ranges from 70% - 100%. The majority of field types being 95-100% covered by a combination of trees/canopy, crop and weeds cover plus or minus liter cover. For perennials, surfaces are dominantly covered. For annuals like round potatoes the seedbed is cultivated to smoothness and left bare to be covered by the growing crop cover. Due to high rainfall, and steep slopes, areas poorly conserved experience severe runoff. Well conserved fields do not experience erosion. Wrong timing for weeding and poor construction and strengthening of conservation structures sometimes create more erosion than it could actually be.
In general, high rainfall on very steep slopes and poor management of conservation structures cause land degradation in the area. However the soils have developed a good structure through continued mulching, in-situ liter decomposition and manure application, all of which encourage more infiltration than runoff.
There was evidence of termites and worms found in almost every pit dug. Flora and fauna were observed especially in soils with moderate to high organic matter content. Nodules in beans were in many cases observed to be pink when cut into half, as an indicator of efficient N2 fixation by nitrogen fixing bacteria. Improved microbial soil life and a complex network of the root systems of the complex cropping systems enhance more protective than degradation processes of the soils in Olgilai/Ngiresi. There were no indicator plants in the area for either sodicity or salinity.Erosion types, surface conditions and crop performance
Splash, sheet and rill erosion were all evident in most field types. There were neither micro or macro pedestals nor exposed stems or roots. In areas where bare patches existed there were observed contrasting colours on covered parts. In several fields, the bare surface was dark brown versus very dark grayish brown of the covered surface. In other fields eg. In the forest, bare soil was very dark brown, compared to the neighbouring black covered surface. The contrasting colours with darker ones for covered surfaces
20

suggest that bare surfaces have lost the topsoil with higher amount of organic matter and turned to relatively lighter colours. Due to sharp variations in short distances, there were cases of soil deposits estimated at 1cm/year deposition rate. There was more of liter and straw transported by surface runoff but obstructed at different places along the waterways. In some fields trash lines on line hedges or various forms of biophysical structures greatly checked the speed and transported materials with runoff.
Most of the crops in Olgilai/Ngiresi fall under average performance and indicate nutrient deficiency symptoms particularly nitrogen and phosphorus.
Kiserian:
Rainfall in Kiserian is highly intensive. Surface soils are dominantly clays with a weak and moderate, fine and medium subangular blocky structure and with low organic matter content. Agricultural farms and other field types are on variable slope gradients ranging from 0.5o to 8 o. Most slopes are straight with few that are convex. They are also long ranging from 10-30 meters.
The woodlots and natural conserved pastures have 100% canopy cover and are least disturbed by any kinds of soil manipulation. Surface cover on annual crop lands ranges between 40-60%. Some fields have retained natural trees which also improve crop cover. Most farms are ox-ploughed in most cases along the slopes and planting also done in furrows made along the slope. Secondary tillage makes the ploughed layer smooth except in a few cases where clods from primary tillage are left intact. Such rough surfaces help increase water infiltration and reduce runoff. Due to long slopes and poor vegetation cover on the surface both topography and management appear to have an impact on land degradation. Erratic rains on the other hand, adversely affect clayey surface soils whose detachment is easier due to low organic matter content while its transport is rapid due to clay particle size. Indeed both rainfall and soil type also influence land degradation in Kiserian. In almost all field types, biological activity was evident. There were tunnels of variable sizes in the soil, ant hills and termite mounts in different field types. In some soils particularly clays, white mycellia were observed. All microbial process have a positive effect of improving soil structure, aeration etc which greatly reduce the rate of land degradation. Mbuga was typical of thorny trees that are indicators of sodic soils. Sodicity indicator plants observed include: Olikiloriti, Elwai-narok and Mgunga.
Erosion types, surface conditions and crop performance
Sheet erosion was dominant for most field types. In contoured croplands, erosion appears to continue mainly due to too long contour intervals. In mbuga, both sheet and gully erosion were observed. The rate of soil loss was estimated to range from 0.1 cm/year in mbuga to 0.9 cm/year in annual cropping systems. Due to soil surface removal, there were soil colour contrasts in several but same field types between bare and covered surfaces. In mbuga for example, bare surface was found to be very dark brown while the covered surface soil was black. In some woodlots bare surface was reddish brown, whole the covered patches were dark brown. In a maize monocrop, bare surface was reddish
21

brown but dark reddish brown on covered surface. Crusting was also a dominant feature in most field types. There were very few incidences of depositional phases probably due to the fact that most slopes are straight. Visual assessment of crop performance indicated that in general crops were poor with NP and/or K nutritional deficiencies and in a few cases due to weed infestation.
SECTION III: PLEC ACTIVITIES IN TANZANIA AND EVALUATION OF THEIR OUTCOMES
Summary:
A total of 80 farmers, 20 from each of the first five villages started working with PLEC in 1998. The number decreased to about 40 in 1999 after other sites were abandoned. The number gradually increased with intensification of demonstration site activities to reach 3000 by 2001.
Expert farmers were selected from each village. Selection was gradual, through close and intimate interactions in the field. Looking into knowledge of the environment and what farmers are practicing, , the experts also willing to share knowledge with others were selected. Each expert farmer with a specific model to demonstrate its management to others. A total of 10 expert farmers were involved in training others in PLEC Tanzania up to 2001.
After a demonstration by one farmer, friendly interaction and contributions from scientists, extensionists and other farmers are discussed. Based on observed practices through farmer training, farmers pick the technology whole sale and adopt it on their own farms. Others pick it and modify it to meet their own farm conditions while others pick nothing. Evaluation of the impact of demonstration site farmer to farmer exchange of knowledge is then assessed by visiting individuals.
Through farmer to farmer training, soil fertility especially through the use of manure has increased for some farmers in Ng’iresi bunches of bananas have increased from an average of 30 kg per bunch to 50 kg. as a result of soil conservation in Kiserian, maize has increased from 100 kg /acre to 600 kg for some farmers.
Agricultural intensification, especially through planting of more than two crops at the same time and throughout the year has increased. About 20% of the farmers in Olgilai/Ng’iresi ar optimizing yield through application of proper crop spacing in addition to year round production.
Environmental conservation is another area where PLEC impact was greatest. Through farmer associations, individuals and school children, tree nurseries were established and raised. At the moment about 50% of PLEC farmers have more than 50 planted trees
22

around their homestead and another 30% with more than 2000 seedlings for sale. At the moment, the market for selling seedlings is a problem.
Farmers have also improved their skills in optimizing farm production through integration of benefits from crops and livestock. Maize and bean stover is first fed to animal and resultant farmyard manure applied on farm with improved nutritional quality. Urine from the pens is also mixed with other botanicals and used to kill pests in vegetables and teaks in cows.
Training visits and on-site exchange of knowledge has increased interaction amongst farmers. They know each others skills and where to go when they want knowledge or material.
Household nutrition has increased through a better understanding not only of different crops or vegetables but also their nutritional values and its impact on their health. Amaranthus was known to bean easy vegetable to grow but its use and value to farmers has improved after knowing that it improves on the iron content of the body etc. Other areas of impact include increased household income and gender sensitivity in community development.
Besides, establishment of farmer associations has resulted in fast spreading of PLEC technologies and practices.
Growth of population of collaborating farmers
Few farmers that were introduced to PLEC and involved in preliminary PRAs and group discussions were the very first ones to join PLEC in 1998. About 80 farmers (20 in each of the four experimenting villages in both transects were selected during and after the PRA to be involved in on-farm experimentation. Experimental packages to test were established by both farmers, extensionists and researchers after (a) establishment of farmer categories, (b) recording farmers’ own methods of addressing the two production constraints, (c) assessment of availability of resources or inputs per category and (d) evaluation of recommended management practices relevant to the environment and within farmers abilities to test. Of the 20 in each site some were involved in biodiversity assessment and socio-economic base line survey as key informers. The number of experimenting farmers dropped to about 40 in 1999 after sites of the leeward side were dropped. The number of farmer collaborators continuously increased as activities gained grounds and popularity. Main activities attracting and involving farmers more than foreseen were on-site farmer to farmer training programmes, outreach programmes, workshops and meetings and farmer training. From 2000 till now farmers from outside Arumeru and Arusha region started to visit PLEC sites with and without invitation to either participate in PLEC work or vist to see what is on the ground. During 2001 farmer associations had been established in villages neighboring PLEC sites and toured PLEC Olgilai/Ng’iresi farmers. In this PLEC farmers increased from 80 in 1998 to over 3000 in 2001.
23

Selection of expert farmers and the development of farmer to farmer training
Expert farmer selection is a continuous process of close and intimate interactions between farmers, researchers, extension staff and sometimes village administration while in the villages. In this process researchers (a) learn from farmers of the local problems facing farmers (b) understand the accumulated knowledge of farmers on the existing problems and their copying strategies and (c) identify farmers with successful models in controlling the problem. Researchers and extension staff also learn from farmers on the reasons for their successes and failures of certain management practices. They also seek to understand the value of such management models within the cultural and social framework of the area. An evaluation of successful farmers communication skills and willingness to share knowledge with other farmers and the extent of respect they commands amongst fellow villagers is also made. At this point researchers and extensionists also try to identify areas and types of intervention to improve on existing farmers own techniques. Based on the above criteria successful farmers in resources management are selected each for a specific model to train other farmers. Expert farmers are asked to prepare teaching aids and demonstration sites and teaching aids before the training.
However the selection process is a continuous as village visits and close interractions continue. More experts are identified and negatiations for their involvement in training others finalized.
Expert farmers teaching other farmers at demonstration sites.
Expert farmers successful models are used as demonstration sites to teach other farmers. Village members are informed of the day, time and venue for training. The training is organized, carried out by the expert farmer at his/her farm. He demonstrates the management practices to other farmers and explains why the practice works. Sometimes conditions for the same practice being a failure are also given. In some cases expert male farmers who work together with their wives and children on farm, also share the training to make it a wife and husband trainers session. Interactions by observing farmers are also attended by both the expert farmer, the extensionist, researcher or any other participating farmer. Where appropriate, researchers or extension staff contribute to the discussions particularly with scientific facts that support the practice and seek possibilities for its improvement. Occasionally participating farmers may come up with even better examples of the one demonstrated by the expert farmer. In that way, the demonstration site becomes a class, the farm becomes a chalkboard, the expert farmer a teacher, the experts become facilitators and participating farmers become modifiers or improvers of the technology. At the same time, since the demonstration site field type is common in the village and different participating farmers manage it differently, some individual pick part or the whole of the demonstrated practices for implementation on their own farms. Others pick some information that helps them modify their own practices in their own way, while others pick nothing. Where the training is recorded, the video is used to train other farmers elsewhere or borrowed by some of the participating farmers to follow the training on video more closely. The process continues whereby farmers convene at
24

another expert farmer’s demonstration site for training on a different management model on another planned date.
Main fields and methods in which farmer to farmer training has been effective
Fertility improvement
Integrated soil fertility management methods were used to address the problem of soil fertility. Different farmers variously use available inputs (mostly organic inputs) to solve the problem. Manure and crop residues utilization was improved through discussions on farmers fields. Experts in compost making trained others on the techniques involved while experts facilitated the process by additional training on the types, quality and amounts of organic materials to use, amounts inorganic fertilizer and ashes to apply, how often to water and how frequent to load or unload the pile before it is mature for application. Through training by expert farmers in conservation farming on steep slopes, production on steep slopes has improved in terms of vegetation cover, crop and fodder yield per ha. The use of well ripened and nutrient conserved manure instead of fresh manure has improved the size of bunches of bananas from an average of 30 kg to above 50. In the past application of fresh manure and sometimes slurry on farm resulted in capping of the surface and reduced crop yields. Effective utilization of manure has also improved vegetable production in terms of size, quality and tolerance to diseases resulting to better market price than before especially in the sub-humid site. The number of farmers throwing away manure to the road sides and dumping it in gullies or burning it as a waste has decreased by over 50%. Maize yield for example has also increased in semi-arid Kiserian through fertility build up as a result of soil conservation (using stone lines) from 100 kg per acre to above 600 kg depending on weather conditions in semi-arid Kiserian. After repeated farmer to farmer exchange of knowledge sessions, purposive selection of fodder to plant on contours to address diverse uses e.g. fertility improvement, livestock feeding and erosion control is now being practiced. In the past farmers were only using what was brought to them by various projects. Demonstration by experimenting farmers on Irish potatoes production to other farmers on the use of fertilizers especially nitrogen and associated increase in yield of potatoes has made even poor farmers to use fertilizer and optimize yield. Although not followed up closely some farmers have claimed to have increased milk production as a result of the improved mix of fodder. Others have improved on their annual household food requirements and need less supplements from the market. A few farmers indicated to have increased income from potatoes production (potatoes are mainly a cash crop) as a result of using fertilizer.
Agricultural intensification
Intensification of farming is common in sub-humid Olgilai/Ng’iresi where land is a scarce resource to many. Different farmers have different objectives and methods of agricultural intensification. Through on-farm training by expert farmers effective space utilization particularly by using proper crop spacing is now used by 20% more farmers than before. The selection of the types of crops to grow and proper management of each crop in the crop mix for yield optimization is now a concern of 20 to 30 percent more
25
farmers than before. Because of land scarcity and repeated training the diversity of crops in farm boundaries has increased to include trees for timber, fodder for livestock and crops for humans. Before PLEC the diversification of crops in boundaries was much less. Farmers have learned from expert farmers on how to optimize production by making their own soils and planting crops that can feed a family of 5 for a month from a 2 x 3 square meter area, making sure also that the crops planted can be harvested from both roots and shoots. Best and most effective use of the rains is another approach gaining grounds among farmers in land scarce areas. The “matatu” meaning maintaining three crops on the same piece of land throughout the year is now a strategy adopted by several farmers. In this technique two crops are perennials and one is an annual. The common annuals that rotate include maize, Irish potatoes and cauliflowers, depending on the length of the growing period versus the rainy period, ease of mixing and market demand and price of different crops at a given time. This training has also made farmers to produce with an anticipation of the price the crop will have at harvest. More farmers have also learned from others of the economics for example of harvesting and selling green maize and buying dry maize from the market at a later stage, and plant something else after uprooting maize stover. Other experts have the strategy to optimize production by including crops that meet the requirements of the family in terms of food and vegetable for meals and that nothing is required from the market as they have no cash. Others intensify to meet the requirements of certain cultural foods like is the Loshoro with Waarusha in Arumeru. Loshoro combines maize, beans, milk and other appetizers, all of which must be in abundant supply at any time of the year to meet household food requirements. In this way the intensification objectives and strategies learned from expert farmers has improved agricultural intensification diversity for at least 30% more farmers than before PLEC. Environmental conservation
Land scarcity has led some farmers to optimize production of crops/trees that have greater returns per unit area than others. After farmers including expert farmers from one village visited other expert farmers in other villages for training on various ways of increasing production and income, one practice that was adopted by many was raising trees in nurseries. Farmers either individually or in groups established tree nurseries with PLEC support and started selling or planting around their own homestead. They agreed as PLEC farmers especially in semi-arid Kiserian to conserve the environment around their homesteads first before thinking of conserving open or public lands and selling to others. School children were also trained by both scientific and farmer experts in raising tree nurseries and planting in selected parts of the school compound. They were also given two seedlings each to plant at home and manage to maturity. In some cases where indigenous endangered trees are the principle focus, these PLEC farmers have been used to train farmers and experts of other organizations on where to get seeds in the forests, how to grow the seeds successfully and appropriate environments to grow them. Some of these farmers have even been invited to demonstrate at national agricultural shows and farmers days on techniques for raising endangered indigenous trees. Crop livestock interaction
26

Small holder farmers livelihood in Arumeru depends on both livestock keeping and crop production. While several farmers were not much aware of the methods to optimize benefits from keeping both crops and animals other farmers knew. Transfer of knowledge was purely through farmer to farmer training sessions. Instead of taking maize and beans stover to the field for mulching in the coffee-banana farms for example, the stover has first to be fed to animals where the remains this time as farmyard manure richer in nutrients and quality are piled for complete decomposition and applied on the farm. Bean stover for example improves the nutritional quality of animal feed and increases milk yield. The urine from stalls is collected and fermented in combination with exudates from other botanicals, mixed in established urine:water ratios and used to control pests in vegetables e.g. aphids and teaks in livestock. Exploitation of complementary effects in crop and livestock has increased for most farmers who participated full time in PLEC sessions of exchange of knowledge and practices. The diversity of livestock on farm is also gradually increasing as different varieties for different crops are also increasing on farm. In this way manure quality from different livestock will variously and positively improve crop yield while additional benefits are realized. Keeping of guinea pigs for example which in turn eat rats in the house and around the homestead helps reduce loss of stored maize in the house. Guinea pigs also scare snakes and alarm people if they are around. They are also eaten by man. This is one major impact of PLEC gained though farmer exposure and training by other farmers. Increased farmer interactions and visits
Farmers have come to know each other more and better through exchange and or training visits. They know where to go for a specific problem even in the absence of extensionists. PLEC experience has shown that many farmers had production constraints for which they were finding solutions for a long time without success. But through farmer to farmer training visits solutions to some of these problems came from farmers within the same villages. PLEC has therefore helped to unfold knowledge from one farmer to the neighbor farmer that needs it and can get it at no cost. In this way individual farmer visits from one farm to another and from village to another in search of knowledge and materials or more training is now common. The demand for estensionists to work with farmers has now declined. The methodology when further developed will solve the technology development and dissemination problem fced by Tanzania as a result of a non functional extension service.
Household nutritional improvement
During characterization of field types on farmers fields it was learned that house gardens play an important role in supporting family livelihood. It is a field type mothers have to visit almost everyday to collect some vegetables for the next meal. From discussions farmers were highlighted on the importance of vegetables in nutrition. That amaranthus for example improves iron content. And that some vegetables contribute to vitamins in addition to use as a vegetable. Understanding of additional values of house gardens contributed to their improved management and diversity. In addition increased chicken
27

rearing amongst farmers and subsequent feeding on both chicken meat and eggs was a way through to the problem of Waarusha keeping livestock but not slaughtering until on special occasions. Household income improvement
As discussed earlier increased production per unit area as a result of soil fertility improvement and effective use of space through raising of tree nurseries are factors contributing to increased income. As will be seen in he next item, activities by different farmer associations contributed to increase in household income. Indicators of income improvement were reduced frequency of local levy collectors chasing people to pay levy in time. After introduction of small scale production of local chicken was introduced and benefits realized, the village administration passed a by-law for every household to rear chicken and sell to get timely money to pay levy. Other indicators are improved ability of farmers to pay school fees, buy uniform for their school children and pay for medicine for common problems like malaria, coughing, wounds etc. Some farmers appreciate that those basic requirements that they were missing before PLEC like salt, sugar, matchboxes and paraffin in the house are currently rarely missing.
Gender sensitivity in community development
One marked impact was the change in customary habits that women cannot interact with the public or attend and actively participate in public gatherings and or rural community development development. At the start in 1994 it was very difficult to get access to female members of the family. Hardly any one could talk if they attended group discussions during PRA. After four years of PLEC work and particularly through meeting and interacting with farmers of all categories (rich and poor), use of women experts to talk to village females, inviting all categories of women into workshops and asking them to talk about their problems, management practices, etc in front of men and educating husbands of PLEC male farmers and asking them to involve their wives actively, contributed to the observed change that women are now active participants in rural development activities particularly with PLEC. Making women farmer associations and training them to become independent of their husbands in small household requirements like buying washing soap or body lotion for themselves, made even those that were reluctant to cooperate to come forward. The currently established PLEC committees for each village that will manage PLEC in the absence of the project include women for almost every village. A good indicator for the change was women coming up to cheer the PLEC Management Group members at night in Arusha town together with their men. Usually women do not go out at night in Waarusha customs, neither do they accompany their husbands while going out even if they were going to the same place. This was clearly different at Maasai camp dinner and entertainment for PLEC management. Success and failures in developing farmer associations
Farmer associations were gradually and successfully established and developed in Tanzania. Two associations were first established in 1999 both women groups addressing
28

small scale production tree nurseries and poultry keeping. Later other groups were established some through PLEC scientists initiatives initiatives but also through farmers own initiatives. At the moment there are eight groups broadly addressing livestock production, poultry production, beehives production, etc. To be able to implement some of the resolutions passed during annual meetings farmers of the sub-humid site split themselves to become two villages each with small number of farmer associations. Kiserian farmers also split themselves into upper and lower Kiserian. Lower Kiserian fall in the belt of much lower rainfall in the south of the site and upper Kiserian fall in the northern part of the site with relatively more rain than the south. Each big group appointed the chair, secretary and cashier and few committee members to run the village.Through associations formation very active and influencial farmers became leaders of the groups and hence a very reliable support to PLEC scientific staff. The main objectives of smaller associations is to improve livelihood through increased income, while the objective of the villages is to enhance and conserve biodiversity in agricultural systems. Since leaders of associations are all esteemed PLEC farmers and since they plan their own activities and their programme of work, they become the steering wheel of the process while PLEC scientists facilitate and monitor progress. Extended showing of on-farm demonstration sessions by expert farmers are broadly coordinated by groups or leaders of different associations in collaboration with the extensionists.
Nature of interventions introduced by PLEC
a) Interventions on farmers experimental fields.
Interventions were different from site to site depending on identified constraints, existing farmers ways of control and the diversity of farmers access to resources. In Kiserian for example water harvesting techniques were desired to improve water availability during the growing season. The resource available to farmers was basically manure. In addition PLEC assessment of subsurface soil characteristics indicated the existence of a plough pan restricting downward movement and encouraging runoff. The type of manure previous used by farmers was poorly managed and PLEC improved on manure quality through introduction of proper management of manure. The problem of plough pan was not known to farmers. It was addressed by breaking it by adjusting the plough for ploughing deeper than 30 cm compared to the ordinary plough depth of 20 cm. The problem is also caused by blunt and old ploughs commonly possessed by farmers and the inability of indigenous oxen to pull the plough at deep depth during primary and/or secondary tillage. Deep tillage in combination with application of 10 tons farmyard manure was accepted and adopted by farmers interested in harvesting water for increased crop yield. Other treatments that included tie ridging and use of farmyard manure combined with fertilizer were rejected during farmer field days and abandoned. So this was basically a modification of the existing technology to make it more appropriate for the area. Tie ridges were an imported and effective technology in water harvesting but rejected due to much labour requirement to make them and the common practice of using ploughs in primary and secondary tillage.
29

Most conserved areas for erosion control using biophysical structures were ineffective. PLEC through collaboration with the village soil conservation team trained farmers on how to use the “A” frame to make contours and how to establish contour intervals. The knowledge was picked but practice is still slow. Farmers want somebody else to make contours for them. This is again an external method as farmers establish contour distance by estimation but they also have labour constraint for such work.
In the sub-humid site introduction of urea or NPK in Irish potatoes production was an external intervention. Farmers know that in order to obtain desired cash income potatoe production has to be high. Many did not know fertilizer benefits and seeing the results most farmers do not accept growing potatoes without fertilizer.
b) Interventions developed through improvement of successful farmers management models.
These methods include fertility improvement, improved agricultural intensification, raising of tree and vegetable nurseries, composting techniques, improved in-situ pasture management, conservation tillage techniques on very steep slopes, management and effective use of organic inputs etc. The process of evaluation, interaction, adoption, rejection or modification of a given technology is described above under “Farmers teaching other farmers.
The value of PLEC activity to the farmers and their families
Farmers of all ages and gender consider PLEC a small scale farmer’s spokesman and savior. As reported earlier several farmers consider PLEC as a project that touches the real day to day problems of the farmers in daily life and facilitates them to manage successfully. It has made some of the improve production, others have become powerful heads of their own families by meeting the real basic daily needs of the family and some have been exposed to knowledge they did not have before as a tool to struggle with nature. They want to continue working with PLEC so that its benefits spread to reach many particularly those who had no chance to be associated with it for the past four years.
SECTION IV: DATA ANALYSIS
Summary:
Data analysis was carried out mostly after characterization of the land, land use types and field types and socio-economic assessments. Overall, 5 land use stages and 42 field types were found in Olgilai/Ng’iresi while 7 land use types and 29 field types were found in Kiserian. Boundary and house-gardens had the greatest frequency in Olgilai/Ng’iresi while maize/beans and natural pastures were more frequent in Kiserian.
30

Agricultural intensification was also observed to be associated with greater diversity of crops and cropping systems especially in the sub-humid zone. The agroforestry system management systems resulted in good quality soils with deep surface depth with high organic matter content.
Biodiversity assessement indicated greatest biological diversity was found in natural forest while utility indices were highest in agricultural farms. Soil management practices like soil and water conservation using biophysical and biological methods and use of organic inputs for soil fertility management increased on-farm biodiversity. The exercise on data analysis needs to be completed before main conclusion can be made.
Biodiversity and agrodiversity analysis was conducted after characterization of existing land use stages and field types. In each land use stage different field types were identified and characterized in terms biodiversity and agrodiversity characteristics.
Agrodiversity
Land Use Stages and Field Types
Five dominant Land Use Stages (LUS) mainly natural forest, planted forest (taungya system), agroforestry, water source micro-catchments and pasture fallows were identified in Olgilai/Ngiresi sub-humid site. Agroforestry was the dominant land use stage covering 80% of the sub-humid site. In the semi-arid site of Kiserian seven LUS namely mbuga, mixed cropping, neglected fallows, woodlots, agroforestry, stone dominated hilltops and quarries were identified. Mbuga was dominant and covered 68% of the area. Different field types in identified L.U.S. were also identified. Most field types were identified on farmers fields while others were in the forest (gazetted forest) and others in open grazing lands. A total of 42 different field types were found in Olgilai/Ng’iresi site and 29 in semi-arid Kiserian. A greater number of field types on farmers fields indicates farmers endeavors in managing biodiversity in agricultural systems for their own survival.
The boundary and house gardens had the greatest frequency in Olgilai/Ng’iresi denoting the importance of demarcations of land under conditions of land scarcity and house gardens as household immediate vegetables bank in the absence of cash. Maize/Beans intercrops and natural pasture were most frequent in Kiserian. The field types in Kiserian support the fact that the site is an agro-pastoral area. Figure 1 indicates the types and frequency of field types in both sites.
Overall there were a greater diversity of crops and cropping systems in the sub-humid densely populated area than in semi-arid Kiserian site. Individual field types were however bigger in Kiserian than Olgilai/Ng’iresi site. The greater diversity of crops and cropping systems in Olgilai/Ng’iresi was a result of agricultural intensification under conditions of land scarcity. It was also due to the fact that farmers try to optimize production throughout the year on the same small pieces of land. An in depth analysis of the crops in individual fields also indicates a greater diversity of crop varieties. While we talk of bananas in the coffee/banana/maize/beans field type, a single field type may have
31

more than 6 varieties of bananas or beans or maize depending on production objectives of the individual farmer, economic uses of each variety, plant characteristics and farmers tastes and preferences that may be influenced by socio-cultural factors for a given tribe. Table 1 illustrates main crops in both sites and corresponding varieties that may be found on a single farm.
Table 1: Maize, Bean and Banana Varieties Grown in Arumeru
Crop varieties Economic uses Plant characteristics
Zea mays (Maize)Kienyeji Food, income, crop residues fed to
animalsNot very sweet, tolerant to storage pests, good milling quality, low yielding, drought susceptible.
Katumani Food, income, crop residues fed to animals
Drought tolerant, early maturing, low yielding, good milling quality, tolerant to storage pests.
CG4141 (Lowlands) Food, income, crop residues fed to animals
Good milling quality, drought tolerant.
UCA (Highlands) Food, income, crop residues fed to animals
Good milling quality, drought tolerant.
Kilima Food, income, crop residues fed to animals
High yielding, susceptible to storage pests, good milling quality, high water demand, high quality flour.
Phaseolus spp (Beans):Soya kijivu Food, income, crop residues fed to
animals."No gases after eating", early maturing, good taste, climbing type, sweet, high price, grey.
Kachina Food, income, crop residues fed to animals.
High market price, early maturing, spoils quickly after cooking.
Lovirondo Food and crop residues fed to animals Climbing type, "causes bloating and gases after eating", laborious to harvest, low market price.
Bwanashamba Food and crop residues fed to animals Most popular in Kiserian, high yielding, good taste, susceptible to diseases and aphids.
Masai red ndogo (namira)
Food and crop residues fed to animals.
High yielding, good tasting, "no gases after eating", needs wide spacing for high production.
Karanga Food and crop residues fed to animals.
High yielding, good tasting when cooked (flavours food).
Masai-red kubwa (namriri)
Food and crop residues fed to animals.
High market price, bush type, early maturing, good tasting and flavours food, susceptible to diseases.
Lyamungu 90 Food and income Good tasting and flavours food, early maturing, drought tolerant, high yielding, high market price.
Kiburu Food and crop residues fed to animals.
Drought tolerant, grows well on soils with poor fertility.
Engichumba Food and income Very high yielding, violet beanEngichumba-ng'iro Loshoro (traditional food) High yielding, sweet, grey beanEngichumba-narok Food and income Similar to Engichumba-ng'iro, black beanMoshi Food and income Very high yielding, sweetest, yellow beanKibumulu Food and income Fast cooking, high price, dark red beanMusa spp (Bananas)Kisimiti Income, brewing, animal feed (stem) Early maturing, drought tolerant, good milling
qualityNg'ombe Loshoro, brewing, income, roofing,
fodder to animals.Hard when cooked.
Mshale Matendela (traditional food), income Good for roasting, long and thick banana fingers.Uganda fupi Banana soup (mtori), fruit, income, Early maturing, small with mainly fingers,
32

peels fed to animals susceptible to pests and diseases.Uganda ndefu Banana soup, fruit, peels fed to
animalsLarge with few fingers, susceptible to pests and diseases.
Kisukari Fruit, income, animal feed (stems) Very sweet, drought and disease tolerant, low nutrient demand
Mzuzu Roasting for tea Tolerant to drought and diseaseMalindi Food (matendela), animal feed Drought tolerantMnanambu Soup, roasting ShadeMkonosi Roasting Disease tolerantMkono wa tembo Roasting Disease tolerantNdishi Loshoro, income Susceptible to diseasesOlmuririko Loshoro, brewing Modest tolerance to diseases
As a general case, field types in individual farmer fields change with seasons. Greatest changes are in the sub-humid site. In this site there are three seasons a year and many diverse crops and cropping systems.
In a different exercise soils in each field type were characterized. In the Coffee/Banana/Maize/Beans field type, soils were found black (moist) on the top, silty clay loam with moderate, fine, granular and angular blocky structure, friable when moist, sticky and plastic when wet; with many very fine and fine pores and many fine and medium with few coarse roots. The subsurface 30cm and below were very dark brown (moist) clays, with weak fine and medium subangular blocky structure. Very friable (moist), sticky and plastic (wet); Common very fine and fine pores with common fine and few medium roots. The topsoil depth of such soils exceeds 50cm depth by colour designation. The soils appered to be well developed and with good quality indicating the impact of the land use system in being able to support overpopulated populations as is the case of Arumeru.
Biodiversity
Analysis conducted on biodiversity addressed species richness and utility assessment and similarity analysis. The results were used to compare species diversity, utility and similarity among common field types within and across sites and between farmer categories and land tenure systems within and across sites.
The most dominant field types were assessed. They included natural and planted forests with different degrees of disturbance, coffee/banana/maize/beans system; maize/beans; water source micro-catchment and grass fallows in sub-humid Olgilai/Ng’iresi. Analysed field types in Kiserian included maize/beans, woodlots, mbuga, agroforestry and chickpea monocropping.
Greatest biological diversity was found in natural forest systems while utility indices were greatest in agricultural farms. Poor farmers were also richer in biodiversity per unit area compared with rich and average farmers. Overall, human influence on environment was associated with loss in biodiversity especially under natural systems. Soil management practices like soil and water conservation using biophysical and biological structures and fertility improvement using organic inputs both increased on-farm biodiversity (Table 2).
33

Table 2. Species richness, utility and similarity for coffee/banana/maize/beans field type across farmer categories
Field type Farmer ParametersS.R. (%) U.I. S.I.
Co/Ba/Mz/Bn. Yangan (rich) 15 60 53Gidiel (rich) 9 78 75Alfayo (Average) 12 67 35Nassoro (poor) 20 55 25Melami (poor) 17 59 49
NB: S.R. (Species Richness); U.I (Utility Index); S.I. (Similarity Index)
Poor farmers had higher species diversity than rich and average farmers. In order to spread risk, poor farmers plant as many crops on a small piece of land and take advantage of whatever grows on the plot including volunteer crops. Poor farmers also have less choice on what to remove and what to maintain on their farms. For the two rich farmers Yangan is located at the depositional phase of the along the slope and accumulating alluvium soil from upper slope that is more fertile and favoring diverse plant species growth compared with Gidiel field type locating on gently sloping and less fertile land. Alfayo, though average farmer, had greater diversity also than Gidiel. Alfayo’s field type contains contour bands with different types of shrubs and grasses for erosion control.
Through sensitization and increase in farmer to farmer project organized and individual visits, and exposure on markets and market demand, farmers diversified what they planted on contours to include species whose use values meet family demands like fruits for children, fodder for livestock, shrubs and trees for livestock and human diseases control etc, instead of planting a single plant specie on one contour as earlier indicated by previous projects. Application of manure or crop residues increased soil moisture content, flora and fauna counts per unit volume of soil plus fungal growth evidenced by white growth of mycelia within profiles excavated in well managed potatoe plots along the footslopes of Kivesi hill in Ng’iresi.
Land tenure was also observed to positively and negatively affect species richness, utility and similarity. Similar field types one on a private plot and another on a communal plot were significantly different in species richness. A private woodlot had diverse species (Table 3)
Table 3. Plant species diversity under private and clan owned woodlotsWoodlot Farmer
categoryOwnership Parameters
S.R. (%) U.I. S.I.Konyokyo Rich Private 51 55 17Loisurie Rich Clan 44 50 16
Evaluation of cropping systems indicated that monocropping was inferior to mixed cropping and agroforestry in enhancing and conserving biodiversity. Species richness was highest for maize/beans compared with maize monocrop.
34

SECTION V: DATA ANALYSIS 2
Summary:
Other components of analysis included socio-economic characteristics of households (J.Mafuru, 1999), cash flow analysis (only beans presented here) in both sites; rainfall analysis and an indication of climatic change by R. Kingamkono and population pressure studies by A. Munagham. Some of the work reported refers to the five original sites but most of the extracts are from the two main sites of Olgilai/ng’iresi and Kiserian.
Assessment of socio-economic characteristics indicated that households in all sites had average number of children per household higher than adults. Semi-arid household families had larger family sizes than middle and higher altitudes mostly due to polygamy in the lowlands. Heads of households in the rich category were also older than the average and poor categories in all sites. Rich farmers ranged between 50 and 62 years of age. Rich farmer households had larger families and poor households had the smallest family size.
Cashflow analysis indicated that cash income sources were highest in July and October when crops are sold while income from livestock sales was highest in February and November. Sales from crops and livestock and their by products were important sources of income for the rich while off farm labour was important for the poor in Kiserian. In Olgilai/Ng’iresi main income sources were sales from crops and wage labour in Arusha town.
Household expenditure was mainly on family food, clothing, school fees etc. for all farmer categories but also on investment in crop production for rich farmers in Ng’iresi in the months of March and October. Chekereni market was major and common to both sites. Irish potatoes and bananas had less risks and relatively stable in price. Beans were the most important crop but very fluctuating in price. On the other hand tomatoes, amaranthus and onions had lower risks compared to cabbages.
Climatic change was assessed through rainfall data analysis from 13 stations in all ecozones in Arusha from the period ranging from 15-66 years depending on the station. There were two district rainy seasons, short rains (vuli) and long rains (masika). Short rains were mostly unpredictable 1st of October was taken as start date of short rains and 1st of November as end of short rains. Start of longrains was January 15 th, ending on 1st
April. The median length of the growing season was longest (40 days) in high altitude and shortest in semi-arid lowlands (range 0-5 days).
For masika, the median start date was taken as 23 February and 9 July as median end date in the high altitude. The median start of long rains in lowlands falls within the second decade of March, ending early in May on the western part and later (early June) on the eastern side.
35

The length of the masika season was longest in the high altitude and shortest in the lowlands. The median length ranged between 106 to 133 days in high altitude and in the lowland median length of masika season varied from 48 days to 96 days. Over all the trend in start and end of long rains indicated shifting trend starting later and ending earlier at present compared to the 1960s.
Population pressure for Ng’iresi village was also studied more closely by conducting a village census in 1999. Population growth and limited available land were the main factors. Comparison of data from the official 1988 census and the 1999 village level census, indicated a shift in sex ratio from 97.8 in 1988 to 98.5 in 1999, and the reasons for the shift were not very clear.
The dependency ratio had also fallen from 110 in 1998 to 99 in 1999. The results suggested a decline in fertility levels (more women in child bearing groups), reversed adult out-migration or having a high proportion of children living outside the village. Average family size was 5 people in 1999 compared to 7.1 in 1988. The reasons for difference could be the difference in definition of household in the two censa or due to disproportionate increase in number of households relative to the population increased. Further investigations were proposed.
Data analysis from other components included rainfall analysis, demography and socio-economics, nutrient dynamics and multi-temporal changes analysis. Some of these have not been well analyzed and are not included. The figures reffered to in the rainfall analysis section are found in the main report and not presented here. The report from the second student from UEA Norwich, UK who worked with PLEC-Tanzania in 2001 has also not been completed.
5.1 Socio-economics
Table 1. Household Characteristics
Characteristics Olgilai/Ng’iresi
Moshono Kiserian Engorika Olkokola/Lengijave P-value
Age of HH head (years) 44.5 44.7 48.9 50.6 50.7 0.397No. of male adults 1.0 1.2 1.4 2.4 2.2 0.114No. of female adults 1.3 1.4 1.6 2.3 2.3 0.039No. of youth male 1.3 1.4 1.6 1.7 2.9 0.089No. of youth female 1.0 1.3 1.7 2.3 2.6 0.009No of children
2.7 3.6 3.6 3.3 5.1 0.091Family size 7.0 8.5 9.0 9.2 15.1 0.000
36
Source: Baseline survey 1998
The characteristics of the households in Arumeru district are shown in Table 1. Most farmers interviewed on the leeward side of mount Meru and the lowlands east of mount Meru were older than in Olgilai/Ng’iresi and Moshono. In all sites the mean adult male and female was more or less the same, except that the leeward side households were slightly higher than the windward sites. The average number of children per household was higher in all sites than adults but not significantly different across sites.
Households in semi-arid sites had larger family sizes than middle and high altitude sites. This is because males in semi-arid sites have more than one wife. Education of heads of household ranged between standard 1-4 in Olgilai/Ng’iresi and 5-8 in both Moshono, Kiserian and Olkokokla/Lengijave. In Engorika, most heads of households had above seven years of schooling. However, male members of the families are relatively more educated than the female members. Heads of households in rich farmer categories had more education than their counterpart categories.
Heads of households in rich category were also older than the average and poor categories in all sites. Ages of the rich farmers ranged between 50 years in Lengijave to 62 years in Engorika. For the average category, the age ranges between 43 years to 48. The poor class had age between 40 to 51 years. It was noted that, the poor people were older than people in the average category except for Ngiresi.
Rich farmer households had larger families than other categories and poor households had the smallest family size.
5.2 Average Household Cash Flow analysis from 1999/2000 / 2000/2001 beans.
The analysis shows that on average cash inflows were higher from off farm activities for medium class in Kiserian being peak in January whereby other sources apart from livestock and crops were also important. Cash income sources were highest in July and October whereby income from livestock sales was highest in February and November. However in Olgilai/Ng’iresi for the same social class both off farm and cash income from crops were important while other cash sources apart from crops and livestock were almost not important as opposed to Kiserian due to a high level of diversification in Kiserian.
Cash income (inflow) from crops and livestock was an important sources for rich farmers in Kiserian. In Olgilai/Ng’iresi off farm cash income sources were mainly from wage labour in Arusha town. Crop sources were important and on peak in November and December. Off farm and other sources were the main cash income for poor farmers in Kiserian particularly during September to January.
With regards to cash outflow (expenditure) cash expenditure was dominantly on family needs for all farmer categories. Investment in crop and livestock production was also important for Olgilai/Ng’irsesi rich farmers and at peak in March and October
37

respectively. The rich in Kiserian investment in crop production rose from February to April while other expenditures were high in September to December. Average farmers in Kiserian did not show investment in crop production. Generally the cash expenditure pattern on investment in livestock and crop production for poor farmers was lowest and comparable to average farmers with a characteristic of low level of investment.
Crop market opportunity and risks:
Crop market prices for various crops were monitored on monthly basis at various local markets. Chekereni was a common local market for most crops grown in the two sites. Irish potato and banana (ng’ombe) had less market risks due to relatively less variability in price compared to other field crops. Beans were the most important crop but with relatively higher market risk. Maize and banana had lower market risks. For horticultural crops cabbage had high market risks while tomato, amaranthus and onions had lowest market risk.
5.3 Rainfall data analysis
Daily rainfall data from 13 stations were collected from the Department of Meteorology in Dar es Salaam. These were entered into INSTAT - a statistical package for analysis of agroclimatological data. The stations, their location and altitude are shown in Table 2. The table also gives the mean annual rainfall and the duration of rainfall record used in the analysis. The shortest rainfall record is for Tengeru Coffee Estate with 15 years (1961/62 to 1975/76) and the longest is for Olmotonyi with 66 years (1927/28 to 1992/93). Most stations have a lot of missing data, and when this extended over many months, the years under which they belong were coded as missing
The altitudes of stations under the study range from below 900 m.a.s.l. at KIA and Lucy Sisal Estate to above 1800 m.a.s.l. at Narok Forest Station. Mean annual rainfall is lowest at Lucy Sisal Estate (426 mm) and highest at Narok Forest Station (1985 mm). Generally the mean annual rainfall increases as one moves towards the peak of Mount Meru. Also there is more rainfall on the eastern slopes of the mountain than on the western slopes.
Two rainy seasons are distinct in the district: the short rains (vuli) and the long rains (masika). The vuli rains are unpredictable and in some stations (especially those on the lower altitudes) they do not occur at all in some seasons.
Table 2: Details of stations used in the study
STATION Location Altitude (m.a.s.l.)
Mean seasonal rainfall (mm)
Duration of rainfall record analyzed
NGURDOTO CRATER 3o18'S 36o55'E 1676 1185 1962/63-1993/94NAROK FOREST STATION 3o20'S 36o40'E 1829 1985 1961/62-1991/92OLMOTONYI 3o18'S 36o39'E 1609 915 1927/28-1992/93TPRI 3o20'S 36o37'E 1432 805 1954/55-1996/97SELIAN COFFEE ESTATE 3o21'S 36o36'E 1402 921 1933/34-1996/97
38
ARUSHA AIRPORT 3o22'S 36o38'E 1387 862 1959/60-1997/98ARUSHA MAJI 3o23'S 36o41'E 1402 1005 1965/66-1996/97THEMI 3o24'S 36o42'E 1372 1097 1935/36-1989/90TENGERU COFFEE ESTATE 3o22'S 36o48'E 1219 1183 1961/62-1975/76USA LTD 3o23'S 36o52'E 826 1973/74-1996/97DOLLY ESTATE 3o25'S 36o52'E 1067 745 1934/35-1987/88KIA 3o25'S 37o04'E 891 525 1971/72-1997/98LUCY SISAL ESTATE 3o33'S 36o49'E 426 1976/77-1995/96
The start, end and length of RAINY seasons
DEFINITIONS
The start date of the rains was taken as the first occasion after an earliest possible date on which a running total of at least 10 mm of rain was reached in 7-consecutive days with at least 3 days being wet. The end of rains was taken as the first occasion after an earliest possible ending date on which fifteen consecutive dry days occurred. The earliest possible start date of vuli rains in Arumeru district was taken as 1st October while the earliest possible ending date was taken as 1st November. The earliest possible start date of masika rains was taken as 15th January while the earliest possible ending date was taken as 1st April. These were determined after a careful study of the rainfall records. A day was considered dry if it had less than 1.0 mm of recorded rainfall. Such an amount is often insignificant in terms of its contribution to crops as it is usually lost through evaporation in a matter of few hours. A day was considered wet if it had 1.0 mm or more of recorded rainfall. The length of a season was taken as the duration between the start and end dates of the rains.
Start and end of vuli rains
The start and end dates of the vuli rains for each station were determined for each year. Frequency distributions of these dates were determined and percentage points at 20, 50 and 80% derived. The results are summarised in Table 3. From the table, the start of the vuli rains at Ngurdoto crater occurs on or after 16 October in 4 out of 5 years while it occurs on or after 22 November in 1 out of 5 years. The median date is 5 November. The end of the vuli rains occurs on or after 30 November in 4 out of 5 years, on or after 31 December in 1 out of 5 years, and the median date is 15 December.
Table 3: Probable dates for which the vuli season can be expected to start and end at given percentage point
STATION START DATES - VULI END DATES – VULI20% 50% 80% C.V(%) 20% 50% 80% C.V(%)
NGURDOTO CRATER 16-Oct 5-Nov 22-Nov 37.3 30-Nov 15-Dec 31-Dec 17.7NAROK FOREST STATION 18-Oct 10-Nov 19-Nov 28 11-Dec 07-Jan 25-Jan 19.5OLMOTONYI 30-Oct 13-Nov 28-Nov 30.4 8-Dec 23-Dec 22-Jan 31.6TPRI 5-Nov 19-Nov 5-Dec 25.6 4-Dec 15-Dec 4-Jan 21.9SELIAN COFFEE ESTATE 4-Nov 20-Nov 14-Dec 39.1 21-Nov 7-Dec 29-Dec 20.1ARUSHA AIRPORT 31-Oct 17-Nov 27-Nov 34.5 27-Nov 15-Dec 13-Nov 21.3
39

ARUSHA MAJI 25-Oct 12-Nov 25-Nov 32.3 28-Nov 09-Dec 20-Dec 17.2THEMI 22-Oct 10-Nov 7-Dec 29.7 23-Nov 14-Dec 3-Jan 21.3TENGERU COFFEE ESTATE 22-Oct 11-Nov 6-Dec 56.3 21-Nov 01-Dec 17-Dec 21.6USA LTD 3-Nov 20-Nov 15-Dec 55.8 24-Nov 01-Dec 12-Dec 19.2DOLLY ESTATE 1-Nov N/A N/A 52.8 21-Nov 27-Nov 11-Dec 11.5KIA 8-Nov 25-Nov N/A 52.2 21-Nov 30-Nov 8-Dec 15.8LUCY 12-Nov N/A N/A 49.4 21-Nov 23-Nov 5-Dec 15.2
In the high altitude zone, the median start dates of vuli rains are within the first half of November ranging from the 5th at Ngurdoto Crater to the 13th at Olmotonyi. Within this zone, the vuli rains starts first on the eastern side of the district progressing towards the western side. The median end dates of the vuli rains in the zone is within the last half of December and the first week of January. The rain ends earlier on the eastern side than on the western side. The variability in start dates is medium with coefficient of variability ranging between 28% and 37.3%. The coefficient of variability of end dates ranges from 17.7% to 31.6%.
In the middle altitude zone, the median start dates indicate that the vuli rains starts within the second decade of November. The trend again here is from east to west. The median end dates of vuli rains in this zone lies within the first half of December, starting from 1 December at Tengeru and Usa to 15 December at TPRI and Arusha Airport. The trend of cessation dates is again from east to west. The coefficient of variability for both start and end dates is also medium as shown in Table 3.
The median start dates of vuli rains in the low altitude zone lies between late November and early December. In 1 out of 5 years the vuli rains are non existent. The median end dates are within the last decade of November. The start dates in this zone are highly variable with coefficient of variations between 49.4% and 52.8%. The end dates are not very variable, with coefficient of variability ranging between 11.5% and 15.8%.
THE LENGTH OF THE VULI SEASON
The length of the vuli season was taken as the duration between the start and end dates of rains. This was calculated for each year on every station. Frequency distributions of these lengths were determined and percentage points at 20, 50 and 80% derived. Table 4 shows the length of the vuli season for each station at the three percentage points. From the table, the length of the vuli season at Ngurdoto crater is 30 days in 4 out 5 years, 53 days in 1 out of 5 years and the median length is 42 days.
The median length of the vuli season is longest in the high altitude zone, ranging from 40 days at Olmotonyi to 55 days at Narok Forest Station. In the medium altitude zone, the median length ranges from 17 days at Usa to to 40 days at Themi. In the low altitude zone the median length ranges from 0 days at Dolly and Lucy Estates to 5 days at KIA. In this zone in 1 out 5 years there are no vuli rains. Similarly, at Lucy and Dolly Estates there are no vuli rains in 50% of the years.
40

The year to year variation in lengths was evident at each station. In the high altitude zone the variations are medium, increasing as you go down the low altitude zone. The coefficient of variation in lengths in the high altitude zone is range from 54.8% at Ngurdoto crater to 84% at Olmotonyi. In the medium altitude zone, the coefficient of variation ranges from 76.6% at Arusha Airport to 113.2% at Usa. The coefficient of variation in the low altitude zone is the highest, ranging from 122% at KIA to 154.7% at Lucy Sisal Estate.
Table 4: The length of vuli and masika seasons (days) for various stations in Arumeru District at three levels of probability
STATION LENGTH-VULI LENGTH-MASIKA80% 50% 20% C.V(%) 80% 50% 20% C.V(%)
NGURDOTO CRATER 30 42 53 54.8 99 133 178 33.0NAROK FOREST STATION 35 55 90 55.4 115 127 166 28.4OLMOTONYI 22 40 73 84.0 85 106 125 24.9TPRI 12 27 57 84.2 95 115 127 20.0SELIAN COFFEE ESTATE 0 21 49 91.3 86 105 124 22.5ARUSHA AIRPORT 9 33 66 76.6 92 113 128 21.8ARUSHA MAJI 7 32 53 80.6 87 117 129 28.2THEMI 8 40 61 73.8 88 117 137 26.8TENGERU COFFEE ESTATE 8 23 55 85.0 71 93 116 43.1USA LTD 0 17 43 113.2 68 91 105 28.4DOLLY ESTATE 0 0 24 150.5 37 71 105 54.0KIA 0 5 37 122.0 56 96 109 32.7LUCY 0 0 19 154.7 25 48 65 57.0
The start, end and length of MASIKA season
Start and end of masika rains
The start and end of rains for the masika season was determined in a similar manner as described for the vuli season. The results are summarised in Table 5. From the table, the median start date of masika rains at Ngurdoto crater is 23 February. The rains starts on or after 9 February in 4 out of 5 years and on or after 9 March in 1 out of 5 years at this station. Similarly, the masika rains ends on or after 5 June in 4 out of 5 years and on or after 16 August in 1 out of five years at this station. The median date is 9 July.
In the high altitude zone, the rain starts early on the higher altitudes and ends early on the lower altitudes. In the medium altitude zone, the masika rains starts earlier on the western stations than on the eastern stations. For example, the median start date at TPRI is 4 February, while that at Tengeru is 1 March. The end of rains in this zone is almost the same, with all stations having their median end date within the last week of May and first week of June. The median start of masika rains in the low altitude zone falls within the second decade of March for all stations. The rains in this zone ends earlier on the western stations than on the eastern ones. For example, the median end date of masika rains is 3 May at Lucy Estate while that of KIA is 2 June.
41

The variations in both start and end dates for masika rains is not very high compared to those of vuli rains. In all stations, the coefficient of variation for start dates range from 10.5% at TPRI to 15.8% at Dolly Estate. The coefficient of variation for end dates varies from 5.2% at Selian Coffee Estate to 12.2% at Ngurdoto Crater.
Table 5: Probable dates for which the masika season can be expected to start and end at given percentage point
STATION START DATES - MASIKA END DATES –MASIKA20% 50% 80% C.V(%) 20% 50% 80% C.V(%)
NGURDOTO CRATER 9-Feb 23-Feb 9-Mar 11.7 5-Jun 9-Jul 16-Aug 12.2NAROK FOREST STATION 25-Jan 03-Feb 19-Feb 13.4 28-May 14-Jun 03-Aug 11OLMOTONYI 26-Jan 11-Feb 29-Feb 11.5 18-May 29-May 7-Jun 6.4TPRI 26-Jan 4-Feb 16-Feb 10.5 19-May 25-May 6-Jul 5.7SELIAN COFFEE ESTATE 28-Jan 16-Feb 4-Mar 11.4 21-May 31-May 8-Jun 5.2ARUSHA AIRPORT 26-Jan 9-Feb 23-Feb 11.6 21-May 29-May 9-Jun 6.6ARUSHA MAJI 30-Jan 14-Feb 18-Mar 13.1 25-May 6-Jun 10-Jul 8.5THEMI 26-Jan 12-Feb 8-Mar 12.9 22-May 5-Jun 24-Jun 8TENGERU COFFEE ESTATE 11-Feb 1-Mar 22-Mar 12.8 15-May 23-May 24-Jun 10.5USA LTD 10-Feb 25-Feb 28-Mar 14 18-May 28-May 5-Jun 7DOLLY ESTATE 7-Feb 11-Mar 10-Apr 15.8 6-May 20-May 5-Jun 7KIA 5-Feb 19-Mar 4-Apr 15.7 25-May 2-Jun 17-Jun 5.7LUCY 17-Feb 19-Mar 5-Mar 11.6 17-Apr 3-May 21-May 8
THE LENGTH OF THE MASIKA SEASON
The length of the masika season was taken as the duration between the start and end dates of masika rains. This was calculated for each year on every station. Frequency distributions of these lengths were determined and percentage points at 20, 50 and 80% derived. Table 4 shows the length of the masika season for each station at the three percentage points. From the table, the length of the masika season at Ngurdoto crater is 99 days in 4 out 5 years, 178 days in 1 out of 5 years and the median length is 133 days.
The length of the masika season is longest in the high altitude zone and shortest in the low altitude zone. The median length in the high altitude zone ranges from 106 days at Olmotonyi to 133 days at Ngurdoto Crater. The Eastern stations are having longer lengths than the one in the eastern side. In the medium altitude zone, the median length varies from 91 days at Usa to 117 days at Arusha Maji and Themi Estate. In this zone, stations in the west have longer lengths than the ones in the east. In the low altitude zone, the median length of the masika season varies from 48 days at Lucy Sisal Estate to 96 days at KIA. The trend here is that the length is increasing as one moves from the west to the east. The variability in lengths in this season is not as higher as for the vuli season. The coefficient of variation in lengths for the masika season varies from 20% at TPRI to 57% at Lucy Sisal Estate.
TEMPORAL TRENDS IN START AND END DATES OF MASIKA SEASON
42
The variations in start and end dates for the masika season was studied to see if there are long term changes in these events. One station with long term records of rainfall data was selected from each zone for this study. These are Olmotonyi, Selian Coffee Estate and Dolly Estate, representing respectively the high altitude zone, the medium altitude zone and the low altitude zone. The trend of start and end of rains in these stations are shown in figures B1 to B6.
From Figure B1, the trend of dates for onset of rains for Olmotonyi is shown by the dotted line. The slope of this trend line is positive indicating that rains are starting late nowadays. The polynomial trend (bold curve) is showing some cyclic trends but which are progressively uprising, indicating a shift in onset of rains. Where as before 1960 rains had never started later than day 185 (3 March), Figure B1 (not in this text) indicates numerous events where rains have started after this date in the period 1960 to date. Figure B2 (not in this text) shows the trend of dates for cessation of rains for this station. The slope of the linear trend is slightly negative, indicating that rains are nowadays ending earlier than in the past. The polynomial trend is also showing some cyclic trends, which are progressively lowering, indicating a shift in cessation of rainfall. These trends, that the rains are starting late and ending earlier than it used to be, are resulting into a shorter growing season. The other two stations, i.e. Selian and Dolly Estate, show the same trend, the later with increasing alarming magnitudes.
5.4 Population pressure
Assessment was made of the population pressure effects on agrodiversity in Ng’iresi village.
Population pressure in Ng’iresi is due to a combination of two factors i.e population growth and limited available land. The population trends over the last two decades were discussed. Limitation on available land for conversion to Agriculture and the population density in Ng’iresi were considered. Finally the effects of population pressure and the future population trajectory were considered. The extract from the theses (N. Murnaghan, 1999) into this report covers the population growth factor only.
POPULATION GROWTH
In the years between 1978 and 1988 official censuses, the population of Ng’iresi village rose from 1,676 to 2,158 (cited in Mbonile, 1998). This represents an annualized population growth rate of 2.56 per cent. This rate is below the national population growth rate of 3.2 percent per annum for the period from 1970 to 1995 (UNDP, 1998, p.177). No official census was carried out in 1998. After exploring possible sources of information that might be indicative of population change, the village leadership proposed that the best way of obtaining reliable data was through a village level census. Consequently village representatives conducted a census for the residents in Ng’iresi specifically for use in the research. According to this census, the population of Ng’iresi in June 1999 was 2,859. This represents an annualised growth rate of 2.59 percent since 1988, which although marginally above the rate that prevailed for the previous decade, is in line with
43
projections made by the United Nations. The projected annual population growth rate for Tanzania for the period 1995-2015 is 2.6 percent (UNDP, 1998, p117).
Comparison of the data from the official census of 1988 (cited in Mbonile, 1998) with that obtained from the village level census carried out in 1999 shows that there has been a shift in the sex ratio.
Table 6 Sex ratios
1998 1999Sex ratio 97.8 98.5Sex Number Percentage Number PercentageMale 1067 49.4 1419 49.6Female 1091 50.6 1440 50.4Total 2158 100 2859 100
In 1988 the sex ratio was 97.8 (i.e. 978 men to every 1,000 women). By 1999 this ratio was 98.5. Without further investigation it is not possible to state with certainty weather this change is explained entirely by births and deaths or a fall in the frequency of polygamy, or weather there was greater out-migration of men in the past.
In June 1999, 46.1 percent of Ng’iresi population was under 15 years old (Table 111.2 pg 83). The dependency ratio has fallen from 110 to 99 since 1998, despite an increase of 283 in the 0-14 years age group.
Table 7 Age analysis
1998 1999Dependency ratio
110 99
Age Number Percentage Number Percentage0-14 1035 48.0 1318 46.115-64 1026 47.5 1434 50.265+ 97 4.5 107 3.7Total 2158 100 2859 100
The decrease in the dependency ratio suggests that fertility levels are falling (since there are now more women in the child bearing age group), or that adult out-migration has been reversed. (A third possible explanation is that a high proportion of children are living with relatives outside the village). Further investigation is necessary to correctly identify the reason for the change in the dependency ratio.
The average family size in 1999 was 5 people. This average disguises some quite large families – over 30 percent of the families in Ng’iresi have seven or more family members. In most of these larger families there are two (and occasionally) three wives. The average household size in 1998 was 7.1 (Mbonile,1998). It is not clear from the data
44

why there is such a big difference in the space of a decade. It is likely that it is a combination of two factors:
i) Different definitions of household were employed by the official census and the village level census. The division into households in the village level census was based on the definition used by Mbonile i.e. a household is a group of persons who share food, dwellings and other essential provisions (1998, p.36). Therefore in 1999, families that lived in separate accommodation and farmed their own land were treted as separate households, even though several houses may be physically situated in the same boma or compound. The 1998 data suggests that the total number of households was about 305. (In 1999 there were 350 households.) It seems likely that all people living in the boma were included as a single household, regardless of whether they actually lived and farmed separately.
ii) There has been a disproportionate increase in the number of households, relative to the population increase. There is a gap of 11 years between the last census and the fieldwork. It is reasonable to assume that any new households since the census will not have children of more than ten years of age. An examination of the data of 1999 shows that a large number of households do not have any children aged 11 years or upwards (173 households out of a total of 530 households). These may well equate to new subdivision of farmland and the establishment of new households in the village.
In conclusion it was clear that there can be no doubt that over the last two decades Ng’iresi has experienced population growth. With such a high proportion of the population under 15 years, there is , inherent in the existing population structure , a momentum of population growth in the future. The potential fertility of these 15 year olds as adults will affect population growth rates for the next generation.
ANALYSIS TO BE CARRIED OUT LATER
There are three areas that need to be addressed In terms of statistical analysis. They include agrodiversity database, time line series analysis and nutrient dynamics. The biodiversity analysis needs external support. Other components of agrodiversity can be analyzed locally provided there is time and money for consultancy for some aspects.
Time line series analysis was inconvenienced by lack of appropriate series of remote sensing data. Even the existing ones need developing in appropriate laboratories before one can buy them. Not sure if they can be obtained from outside the country.
Nutrient dynamics study is still being worked on. It is limited by time constraint but the draft report is at hand.
45

SECTION VI: THE SUSTAINABILITY OF PLEC WORK
Summary:
Different actions were taken to ensure sustainability of PLEC work in Arumeru without a project. In order to be effective in implementation and monitoring of activities, each site was split in to two i.e. Olgilai and Ng’iresi in sub-humid site and upper and lower Kiserian in semi-arid site. Each smaller village appointed a PLEC committee composing mostly leaders of existing farmer associations and expert farmers. The expert farmers & association leaders are considered powerful engines to carry on PLEC work without a project.
The established strong interactions between farmers and extension staff and reduced dependency of farmers on extension staff in technology dissemination, expert farmers are expected to continue their role as experts but now with more developed models and confidence as a result of their empowerment through PLEC.
Arumeru district administration has also shown interest to fund some of the activities of PLEC without a project. However, continued pushing for actual funding is still desirable. Besides, extensionists working with PLEC during the entire period have now changed in attitude towards farmers and are prepared to continue the established relations through PLEC if modest support is obtained.
Many farmers who joined PLEC in the middle of the project indicate their worries if PLEC funding terminates. The government although not able to fund is still interested in replication of the project in other parts of the country. Developed technical and policy recommendations also need to be pushed for their implementation at both community and national levels. The situation at the moment indicates the need for PLEC continued support of its esteemed small holder farmers.
PLEC initiatives since 1998
Involvement of farmers in the planning and implementation of PLEC work since the beginning was an important factor to make them know what PLEC is to them and what they are expected to do. Some farmers say the project is in deed touching our daily life needs and are inclined to work along the objectives of the project (developing sustainable resources management in agricultural systems which in turn improve their livelihoods and ensure food security at least at household level.) Some of the outputs of PLEC like small scale production of local chicken whose sales of eggs and chicken and nutritional improvement through eating eggs etc, has made village leaders to follow up PLEC activities and assist in ensuring implementation of some of them. Although not directly considered PLEC impact, these leaders will continue to follow the foot steps of PLEC in executing some of its programmes for the development of their rural people. Some councilors in the project villages use the existence of PLEC in their area to promote their popularity saying that PLEC activities are based on ideas conceived by both PLEC staff and councilors and would like to see PLEC work continue. Discontinuity of PLEC work
46

will otherwise be associated with councilors failure to improve farmers’ livelihood. There is a possibility that farmers themselves, village leaders and councilors will continue the work of PLEC for some time after the project. Some activities normally carried out in March at this time of the year are still going on in both sites despite ending the pro/April every year are currently on-going even after February 28th.
Through PLEC the councilors were able to get hold of the otherwise inactive extension staff to work.. PLEC extensionists had a working programme also known to the farmers and village leaders. Using this experience, councilors asked all extensionists to work with them in developing a programme for their work villages and report progress to councilors monthly. This is also PLEC impact that indirectly will ensure continuation of PLEC work. Last but not least was the establishment of PLEC committees in each village within PLEC sites. A total of four committees each with a chair, secretary, treasurer and several committee members have been established to continue PLEC work with or without PLEC project. They have focus areas per village and have developed a work plan. For most villages one member is from the village leadership. This is partly to monitor activities so that PLEC does not become a political and probably more powerful organ but also to report to the leadership any kind of support or advise the committee might need from the village administration. Expert farmers also form part of the committee and farmer associations leaders also. These are the engines of PLEC work without a project.
Indications of financial support from Arummeru district council
In appreciating PLEC work, councilors in PLEC sites started from year 2000 to talk about the need for the Arumeru district council to contribute funds to continue some of the PLEC work within and outside PLEC villages. However not all councilors quickly understand reasons foe supporting PLEC. In addition several claim that the funds they have are not enough to finance activities outside the core programme of the councilors themselves. The District Executive Director who has been associated with PLEC work and sometimes participated in farmer associations environmental conservation activities is positive in funding some PLEC work but has not pushed hard to convince the council to do so. They probably need follow up and this is one area where PLEC continuation beyond 2002 would put more emphasis in order for them to finance the third phase. The district agricultural office has started working on a nation wide world bank funded project on soil fertility recapitalization and agricultural intensification programme (SOFRAIP), where Arumeru district is one of the pilot districts. They indicated to include some of the PLEC activities in SOFRAIP for funding. We have also agreed that PLEC collaborating scientists from Selian Agricultural Research Institute that is situated in the northern zone will continue with some of the PLEC work using government funds allocated to address research in their zone. Input from the extension staff
Extension staff that worked with PLEC since 1998 have a different attitude and understanding of the role of extension. They are not any more linkage tools of delivering messages from research to farmers if they exist. They have developed closer relationships
47

with farmers and understand what is expected from them. They had more extensionist-farmer contact time during PLEC project than ever before. They say they will work more productively as PLEC products even after the project. However they were only four that worked full time with PLEC. Others were on and off. It would be better to continue PLEC project another phase and aim at extensive involvement of extensionists in PLEC project work and training in order that they carry forward after PLEC 11. Need for extended support to farmers
The activities and benefits of PLEC work were not clearly understood by many farmers at the beginning. They saw PLEC as any other projects that had come and gone. They only started gaining interest through the spread of the farmer to farmer training programme that involved every interested person. They gained more interest when some of their colleagues were seen on television talking about their work. Many of them were impressed by the outputs of the initiated farmer associations. Of greatest importance was the concept of PLEC to share knowledge to all in need and that benefits are mainly to those who keep a keen interest and participate. It was only in 2000 when some obvious positive impacts started being seen and other farmers talking about the importance of PLEC to their own family wellbeing that many started to chase PLEC. They say it was late for them to be part of the project but then time was not enough for them to benefit from the project. They request that PLEC be extended to support them particularly the late comers and those outside PLEC sites who did not have chance to participate. In May 2001 they thought they conveyed their message that PLEC continues, but were disappointed to hear that PLEC was ending about a year from that time. PLEC extension is mostly required in the following areas: Support to established farmer associations:
Farmer associations are a driving force and a tool to bring people together and implement what they plan. Most activities by these associations are aimed at biodiversity enhancement, livelihood improvement and food security. They are mostly headed by expert farmers and well committed farmers. They work to bring together women who for quite a long time have been left behind so that they can become productive components in rural development and reduce their dependence on men among other things. They are still immature and need to develop. They need both technical and financial support at least for another four years. At that time they will have their own bank accounts and well established programmes of work to continue on their own.
Newly recruited farmers
As explained earlier several farmers recognised the importance of PLEC and joined rather late. This is not uncommon as adoption of practices is usually slow. Other farmers from outside PLEC sites started by establishing their own association and asked to join PLEC they were only visited for encouragement to continue based on experiences gained from their neighbors. They need also to be attended. Besides, the district and nation would like to see the participatory technology development and dissemination approach
48

tested widely and possibly adopted at a later stage. Extension staff need to be introduced to the skills of working with farmers. There is no way that they can get this through formal training but through continued practice. Since the government has limited funds to promote participatory technology development then possibilities should be looked into particularly by PLEC a project already promoting participatory development of sustainable resource management methods with farmers as trainers.
Follow up of the implementation of established policy and technical recommendations
Several of the recommendation made through PLEC annual workshops and later presented to decision maker for incorporation into rural development programmes need follow up. This is needed both at community and national level to ensure their implementation. It will be meaningless to just work for four years and come up with good recommendations for agrodiversity development and just leave them to others to ensure implementation. In fact the government after the 24th January technical and policy recommendations meeting, is looking for cooperation from PLEC to work towards implementation of the recommendations. The recommendations were a result of PLEC ground work in the sites. They were developed jointly with farmers and can be followed up by their architects who are the same farmers and PLEC scientists. The taste of the pudding is within the eating. PLEC must taste the impact of implementation of developed recommendations before letting others eat the pudding. This can be achieved by having PLEC 11.
APPENDICES (1)
PLEC-Tanzania substantive reports, publications and draft papers.
N.Murnaghan. 1999. The impacts of population pressure and resource availability on agrodiverity. A pilot study in Ng’iresi village, Tanzania. MSc theses, School of Development studies of the University of East Anglia. 134 pp.
F.Kaihura, R.Kiome, M.Stocking, A.Tengberg and J.Tumuhairwe. 1999. Agrodiversity highlights in East Africa. PLEC News and Views No 14. 25-32 pp.
Fidelis B.S.Kaihura, P.Ndondi and E.Kemikimba. 2000. Agrodiversity assessment in diverse and dynamic small scale farms in Arumeru, Arusha, Tanzania. PLEC News and Views No. 16. 14-27.
Kaihura, F.B.S, Kaitaba. E.G and Mbonile, M.J. 1999. Assessment of agrodiversity at lanedscape level under small scale farming systems in Arumeru district, Tanzania. 19th International Soil Conservation Organisation Conference, Purdue University, Indiana, USA.
49

Socio-economic characteristics of selected households in Arumeru district, Arusha region, Tanzania (report on baseline survey in Arumeru district)
Agrodiversity assessment in diverse and dynamic small scale farms in Arumeru, Arusha, Tanzania (Kaihura, F.B.S, P. Ndondi and E. Kemikimba)
Agrobiodiversity assessment in Olgilai/Ngiresi and Kiserian demonstration sites, arumeru district Tanzania (July 1999). (F.M. Mbago)
Assessment of the vascular plant species diversity in the Arumeru district – PLEC project April 1999. Report on the establishment of the permanent vegetation sample for the monitoring programme (Mwasumbi and Mbago).
Land degradation its causes and effects in Arumeru area of Arusha, Tanzania
Agrobiodiversity assessment in PLEC sites of Arumeru, Arusha, Tanzania. (J.Elia, Neduvoto and Mboya)
Appendix (i) Species Richness and Utility
Appendix (ii) Kiserian Tentative Plants Checklist for the year 1999
Similarity Analysis – Between Plots in a Field Type within a Farmer
Soil nutrient dynamics and agrodiversity in sub-humid and semi-arid Arumeru, Arusha, Tanzania (Baijukya & Kaihura 2002: draft)
Agrodiversityassessment in diverse and dynamic small scale farms in Arumeru, Arusha, Tanzania (J. Ngailo:draft)
Farmers livelihoods and crop market dynamics (Mwalukasa 2001)
Farmers adaptations to agrodiversity conservation in small scale farming systems in Arumeru, Arusha, Tanzania. (kaihura, Ndondi & Kahembe) (Draft prepared for Ghana Wshop but not presented)
Agrodiversity assessment in diverse and dynamic small scale farms in Arumeru, Arusha, Tanzania. (Kaihura, Ndondi, Kahembe – 1999)
Soil profile descriptions and analytical data. (Kaitaba, Kaihura & Kemikimba)
Experimental and monitoring work in PLEC demonstration sites of Olgilai/Ng’iresi and Kiserian villages, Arumeru district, Tanzania (Report 5)
50

Relation of community information to scientific information based on resources assessment and on how the system of resource access and distribution relates to the use of land. (report 6).
Evaluation of the fertility status of soils selected farms on both windward and leeward sides of Mount Meru. (Kaihura and Kaitaba, 1999)
Incentive measures to enhance sustainable use and conservation of agrobiodiversity: Experiences from Tanzania. (Kaihura and Lukonge – Lusaka workshop).
Potential tree species for sub-humid and semi-arid environments of Arumeru district Tanzania. (H.P. Msanga – National tree seed programme – Morogoro)
Soil management and agrodiversity: A case study from Arumeru, Arusha, Tanzania. (Kaihura, Stocking and Kahembe – Montreal)
Agrodiversity as a means of sustaining small scale dryland farming systems in Tanzania. (Kaihura, Stocking and Murnaghan – CBD – Nairobi).
Special and temporal characteristics of rainfall in Arumeru district, Arusha region, Tanzania. (R. Kingamkono)
Population pressure, agrodiversity and food security in Arumeru district (Mbonile, M.J. 2000)
The role of patent and other forms of protection in national bioprospecting efforts (L.Enu-Kwesi, 1999)
NB: Some of these publications were presented in during workshops and appear in respective proceedings except for the East Africa General meeting papers.
51

APPENDICES (2)
Figure 1: Longitudinal section of the windward transect.
NB: The Soils, Physiography and land cover map is part of the report also submitted to UNU.
Acacia bushland Lowland grassland
Z O N E 3
Z O N E 2
Settlements on cultivated farms
Montane forest
Z O N E 1
Settlements
Land under cultivationGrassland
Plantation/planted treesAcacia bushland
Natural forest/trees
NOTE: Drawing not to scale.
1970
1950
1860
ALTI
TUDE
(m.a
.s.l)
53

N
3 0 3 Kilometers
1:80000
#Y#Y
#Y
#Y
#Y#Y#Y
#Y
#Y
#Y
#Y #Y
#Y
#Y
%U
%U %U
%U
%U
%U
%U
%U
%U
%U
%U
%U
%U
%U
MAA
MPA
MPA
MAA
SCG
PFC
NNF
SCG
MBA
MBI MBI
CBM
CBMNFF
MPA
CBM
MPA
NFF
SCG
CBM
MBI
MPA
MBA
MBA
MBA
CBM
PFCNFF
PMB
PMB
NN
F
CBM
MBA
CBM
MPA
CBM
MAA
MBA
PMB
CBM
NNF
PMB
NFF
NNF
NFF
PMB
NFF
PMB
NNF
SCG
NFF
MBI
SCG
NFFSCG
MPA
CBM
PMB
SCG
MBA SCG
MBI
CBM
SCG
SCG
PMB
PMB
PMB
SCG
PMB
SCG
NNF
Njiro hill
Kivesi hill
Namasi hill
Laiboni hill
Lekimana hill
Tanzania packers
Olgilai dispensary
Baraa primary school
Ngiresi primary school
Ngiresi Village office
Olgilai primary school
Oldedai primary school
Kiserian primary school
Landuse Description
CBH Banana, coffee, maize, beans and agroforest treesCBMMAAMBAMBIMPANFFNNFPFCPMBSCG
Banana, coffee, maize, beans and agroforest treesScattered banana and coffee, maize, beans and agroforestry treesMaize, beans, few banana and agroforest trees
Maize, beans, pegion pea and agroforestNatural forest
Planted forest and scattered cultivation on young treesMaize beans and pegion peaScattered cultivation and grazing
Land usecodes
Scattered cultivation, trees and shrubs
Maize, beans, irish potato, onions, sweet potato and vegetables
Dominant land Utilization TypesCBMPMBMBAMBIMPANFFPFCMAANNFSCG
RiversMajor riverSeasonal stream
RoadsMajor RoadMinor roadRailway
#Y Centres%U Soil Profiles
Fieldwork GIS database LayoutingMap productionCopyright Date
: Kaihura F.B.S., Kaitaba E.G. and Kemikimba E.: Kaitaba E.G. and K.F.G. Masuki : Masuki K. F. G.: NSS-GIS Laboratory, ARI-Mlingano: Tanzania PLEC Subcluster : July 1999
Land Utilization TypesOlgilai/Ngiresi and Kiserian PLEC sites Arumeru, Arusha
Location of Arumeru Districtin the Northern Zone
Printed at ARI-Mlingano, NSS-GIS LAboratory, November 2001.
54
Location of Arumeru Districtin the Northern Zone
N
1 0 1 2 3 Kilometers1:80000
Soils and TerrainOlgilai/Ngiresi and Kiserian PLEC sites Arumeru, Arusha
Printed at ARI-Mlingano, NSS-GIS LAboratory, November 2001.
Fieldwork GIS database LayoutingMap productionCopyright Date
: Kaihura F.B.S., Kaitaba E.G. and Kemikimba E.: Kaitaba E.G. and K.F.G. Masuki : Masuki K. F. G.: NSS-GIS Laboratory, ARI-Mlingano: Tanzania PLEC Subcluster : July 1999
Soilcode Soil and Terrain Description
H1 Crest of large volcanic conesH2 Upper footslope of large volcanic conesH3 Middle footslope of large volcanic conesH4 Lower slope of large volcanic conesH5 Crest of small volcanic conesH6 Upper slope of small volcanic conesH7 Lower slope of small volcanic conesH8 Remnants of small volcanic conesL1 Plains dominated with black soilsL2 Plains dominated with red soilsL3 Plain dominated with Highly cracking black soilsM1 Flat part along the long slopesM2 Rolling to undulating footslopesM3 Dissected steep slopeM4 Gently undulating slopeP0 Flat plainP1 Rolling plain (1400-1600m)P2 Undulating plain (below 1400m)R1 Elongated ridgeR2 Small isolated ridgeV1 Broad elongated valleyV2 Narrow elongated valleyV3 Steeply incised valleyV4 Steeply dissected river banks"V5 Depression
Soils and TerrainH1H2H3H4H5H6H7H8L1L2L3M1M2M3M4P0P1P2R1R2V1V2V3V4V5
#Y Centres%U Soil Profiles
RiversMajor riverSeasonal stream
RoadsMajor RoadMinor roadRailway
#Y#Y
#Y
#Y
#Y#Y#Y
#Y
#Y
#Y
#Y #Y
#Y
#Y
%U
%U %U
%U
%U
%U
%U
%U
%U
%U
%U
%U
%U
%U
Njiro hill
Kivesi hill
Namasi hill
Laiboni hill
Lekimana hill
Tanzania packers
Olgilai dispensary
Baraa primary school
Ngiresi primary school
Ngiresi Village office
Olgilai primary school
Oldedai primary school
Kiserian primary school
M2
V3
M1
M2
V2
M3
R1
V5
V4
M4
V2
V1
M4
M4
M4
H4
H3
H2
V5
H1 R2
H7P1
H5
H4
P1
P1
P1H3
P1
H2
H1H4
V3 H5
V1
H3H7
H2
H5
H4
P2
H1
P2
P0
H4
V1
H6H3
P0
H4
V5 H3H7
H5
P0
H8H6
H7
H5H5
H7H4
L1
L1
V2
H3
H8
L1
H7
V2
L2
L2
L2
L2H8 H8
H3 V2H8H2
L2
H4
L2
L3
V2
V2
L2L2
H7V2
55
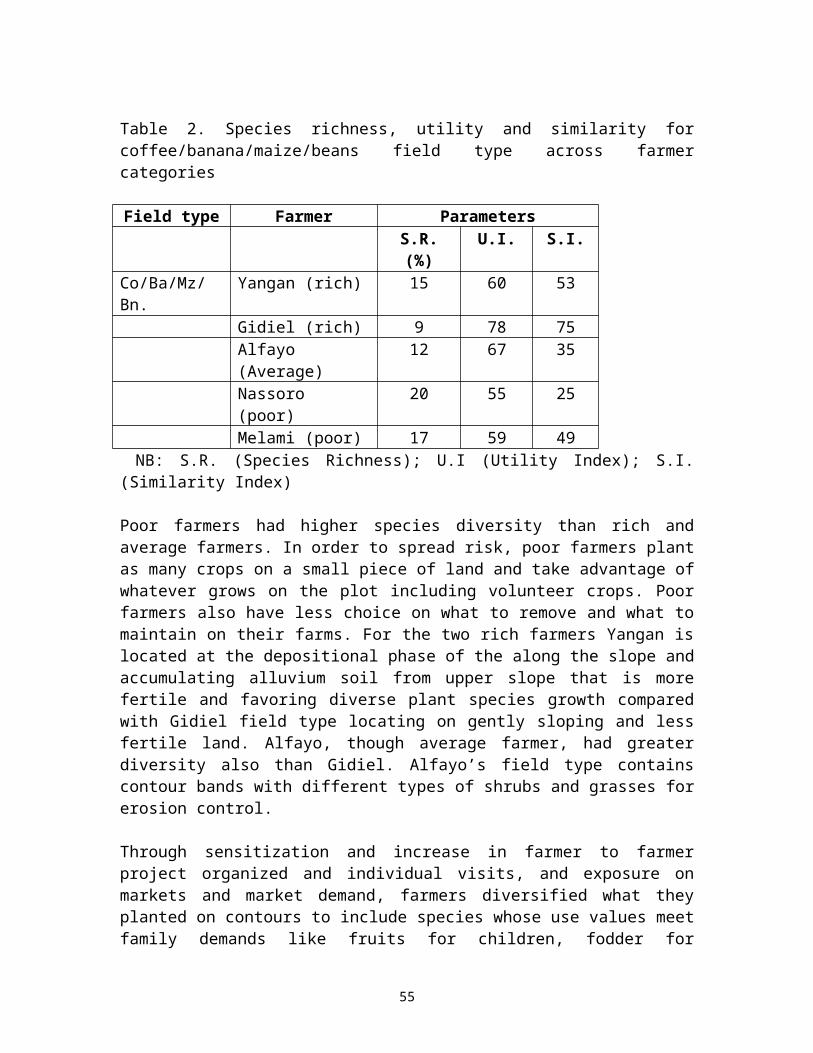
TANZANIA
Location of Arumeru District
Soils and Terrain CharacteristicsLengijave and Olkokola PLEC sites, Arumeru, Arusha
Fieldwork : Kaihura F.B.S., Kaitaba E.G. and Kemikimba E.GIS database: E.G. Kaitaba and K.F.G MasukiCopyright : Tanzania PLEC Subcluster.Date : July 1999.
0.5 0 0.5 1 1.5 2 Kilometers
1:60000
N
#Y
#Y
#Y
#Y
#Y
#Y
#Y
#Y
%U
%U
%U
%U
%U %U
%U
%U
%U
Oldonyo Lengijave
Lengijave Pr. Sch.
Kilimamoto
Mukulati Sec. Sch.
Lengijave village office
Olkokola Pr. Sch
Engorika hill
Nadunguro Forest office
M3
P2
P3
R1
P1
M4R1V1
M2
R1
V4
V1
M4
R1
M1
P2
M1
V1
A1
M1
R1
V1M1
R1
A1
H4
R1
P2
R2
V3
V1
M2
V3
H3
R1
M2
V1
R2
M3
R2
A2
R2
V1
M1
R2 M3
M4
R2
V3
R2
M5R2
R2
V1
V2
R2
M5
R1
V1
V3
V3
R1
R2
V3
V2
V2
V2
V2
A1
R3
M4
V2
H4
H2
H3
R3
H3
V1
H4 M4
R2
H2
R3
H2H3
R2
R3
R2
H5
H1
H2
Prof ile pits%U
Centres#Y
Contours
RoadsMajor roadRural road
RiversMajor riverSeasonal stream
KEYSoils and Terrain
A1A2H1H2H3H4H5M1M2M3M4M5P1P2P3R1R2R3V1V2V3V4
Soter Code Soils and Terrain DescriptionsA1 Smooth alluvial fanA2 Dissected alluvial fanH1 Crest of volcanic coneH2 Upper slope of volcanic coneH3 Middle slope of volcanic coneH4 Lower slope of Volcanic coneH5 CraterM1 Slightly dissected steep slopeM2 Crest of the hillM3 Highly dissected steep slopeM4 Moderately dissected steep slopeM5 FootslopeP1 Flat plainP2 Undulating peneplainP3 Undulating to Rolling peneplainR1 Wide elongated ridgeR2 Slopes of the ridgeR3 Isolated small ridgeV1 Wide U shaped valleyV2 Narrow U shaped valleyV3 Steeply dissected V shaped valleyV4 very wide (somehow filled) valley
56
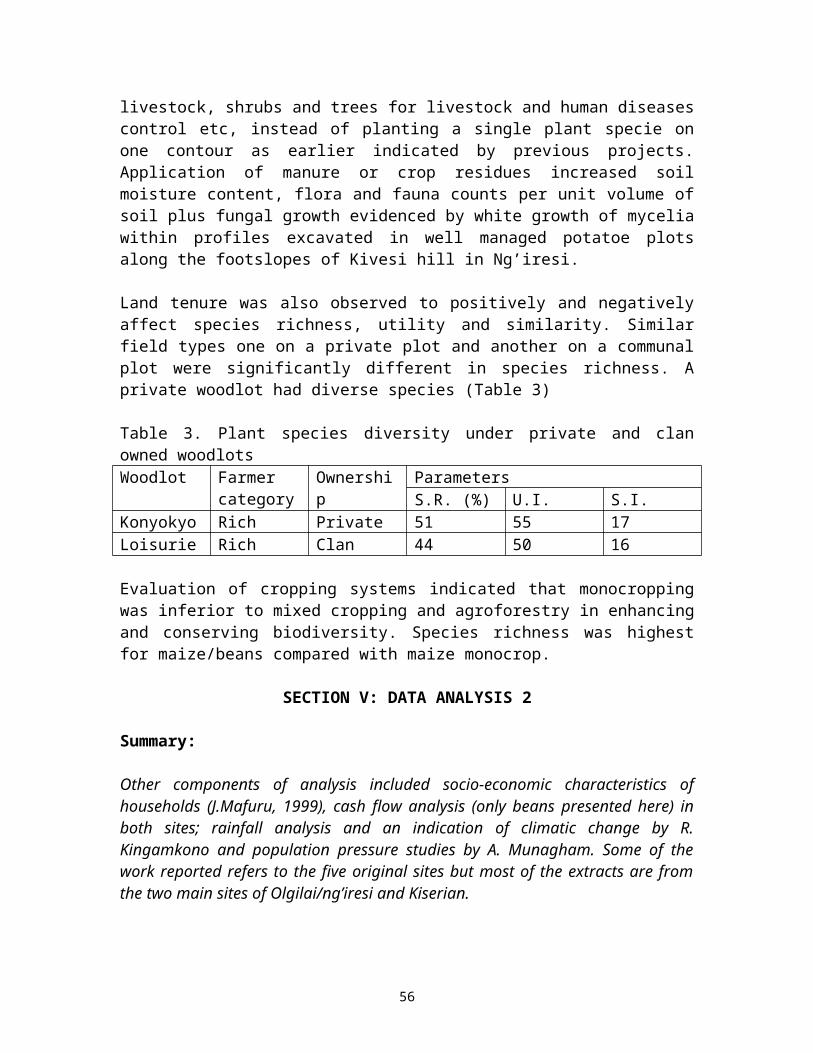
#Y
#Y
#Y
#Y
#Y
#Y
#Y
#Y
1800
2000
1900
1900
2200
2500
1800
2400
2200
2000
1900
1900
1800
2300
2100
2100
1800
1700
1800
1800
1800
2200
1900
2500
1700
2400
2000
2300
2100
MBD
MBS
GFS
DPNGFS
MBD
MBF
DBM
GFS
BPM
DBM
GFS
SCG
SCG
MBD
DBM
SCG
MBH
GFS
SCGDBM
GFS
GFS
MBK
MBH
MBE
TSD
MBF
MBD
TSD
DBM
MBF
GFS
DPN
MBE
ITG
DBM
MBE
SCG
DPN
DPN
MBE
MBE
DBM
TSD
MBE
MBE
MBBMBE
MBB
MBE
MBE
GFSDBM
DBM
TSD
GFS
TSD
DBM
MBE
TSD
DBM
DBM
DBM
DBM
MBH
SAG
MBK
DBM
DSG
SAG
DSG
DSG
DBM
MBK
MBE
SAG
DSG
MBE
SAG
MBE
SSG
DSG
DPN
Oldonyo Lengijave
Lengijave Pr. Sch.
Kilimamoto
Mukulati Sec. Sch.
Lengijave village office
Olkokola Pr. Sch
Engorika hill
Nadunguro Forest office
Lengijave and Olkokola PLEC sites, Arumeru, ArushaLand Utilization Types
Fieldwork : Kaihura F.B.S., Kaitaba E.G. and Kemikimba E.GIS database : Kaitaba E.G and K.F.G MasukiCopyright : Tanzania PLEC SubclusterDate : July 1999.
N
0.5 0 0.5 1 1.5 2 Kilometers
1:60000
TANZANIA
Location of Arumeru District
LU Code Land Use Description
BPM Maize, sweet potatoes and beansDBM Maize, beans, sorghum and dolicus lablabDPN Dominated by planted and natural forestDSG Dominated by short grass mainly for grazingGFS Mainly for grazing, few Settlements and scattered cultivationITG Indiginous trees, grass and shrubsMBB Maize, beans, banana and fruit treesMBD Maize, beans, dolicus lablab and settlementsMBE Maize, beans and settlementsMBF Maize, beans, fruit trees (pitches) and settlementsMBH Maize, beans and horticultural cropsMBK Maize, beans and settlementsMBS Maize, beans,grazing and settlementsSAG Settlements and grazingSCG Scatered cultivation, grazing and settlementsSSG Scattered short grassTSD Dominated by indiginous trees, shrubs and grasses
%U
Centres#Y
Contours
RoadsMajor roadRural road
RiversMajor riverSeasonal stream
KEYDominant Land Utilization Types
BPMDBMDPNDSGGFSITGMBBMBDMBEMBFMBHMBKMBSSAGSCGSSGTSD
LEGEND
57

58