
Final Report of SET-Plan workshop on Pulp and Paper Report of...GALEMBERT, Marc MARSIDI, Ernst...
33
EUROPEAN COMMISSION DIRECTORATE-GENERAL JOINT RESEARCH CENTRE SET-Plan Information System (SETIS) European Commission, DG JRC-IE, Postbus Nr. 2, 1755 ZG Petten (N.-H.) – The Netherlands. Office: RML 312 2/230. Telephone: direct line (31-224) 565245. Fax: (31-224) 565616. E-mail: [email protected] Petten, 27 January 2011 ESE/JM/ (2011) Subject: FINAL Report of the SET-Plan workshop on Technology Innovations for Energy Efficiency and Greenhouse Gas (GHG) emissions reduction in the Pulp and Paper Industries in the EU27 up to 2030 Participants: Stakeholders: Teresa PRESAS, Marco MENSINK, Jernej VERNIK, Michael HOVEN, Francisco SILVA GOMES, Tomas WYNS, Frédéric GUILLET, Bernard DE GALEMBERT, Marc MARSIDI, Ernst WORREL, Laurent LEVACHER European Commission: Philipp TROPPMANN, Benoit MERLAND, Joana NOGUEIRA, Christian THIEL, José MOYA, Stathis PETEVES (Chair) Venue: Square de Meeûs 8, (SDME 10/F) December 15, 2010 (9:40 – 12:30) 1. CONTEXT AND SCOPE OF THE WORKSHOP The EU is starting to implement its Europe 2020 Strategy, which is designed to turn Europe into a world leader in smart, sustainable and inclusive growth. Research and Innovation are key drivers to achieving this transition. In 2008, the European Union (EU) has launched an ambitious initiative on low carbon energy technologies through the European Strategic Energy Technology Plan (SET-Plan). The SET-Plan is the technology pillar of the EU Energy and Climate Change Policy. It is the EU's response to the challenge of accelerating the development and widespread market take-up of low carbon technologies as a key element for meeting the goals of the European energy policy together with a stable regulatory framework and for fostering conducive market conditions. Europe 2020 identifies also the need for boosting innovation in different sectors of the economy such as transport and industry aiming at modernising and decarbonising the transport sector, supporting the transition of manufacturing sectors to greater energy and resource efficiency and promoting technologies and production methods that reduce natural resource use. This innovation framework provides a timely opportunity to investigate the added value for a potential European Action Plan on the energy intensive industrial sector in the
Transcript of Final Report of SET-Plan workshop on Pulp and Paper Report of...GALEMBERT, Marc MARSIDI, Ernst...

EUROPEAN COMMISSION DIRECTORATE-GENERAL JOINT RESEARCH CENTRE SET-Plan Information System (SETIS)
European Commission, DG JRC-IE, Postbus Nr. 2, 1755 ZG Petten (N.-H.) – The Netherlands. Office: RML 312 2/230. Telephone: direct line (31-224) 565245. Fax: (31-224) 565616. E-mail: [email protected]
Petten, 27 January 2011 ESE/JM/ (2011)
Subject: FINAL Report of the SET-Plan workshop on Technology Innovations for Energy Efficiency and Greenhouse Gas (GHG) emissions reduction in the Pulp and Paper Industries in the EU27 up to 2030
Participants:
Stakeholders: Teresa PRESAS, Marco MENSINK, Jernej VERNIK, Michael HOVEN, Francisco SILVA GOMES, Tomas WYNS, Frédéric GUILLET, Bernard DE GALEMBERT, Marc MARSIDI, Ernst WORREL, Laurent LEVACHER
European Commission: Philipp TROPPMANN, Benoit MERLAND, Joana NOGUEIRA, Christian THIEL, José MOYA, Stathis PETEVES (Chair)
Venue: Square de Meeûs 8, (SDME 10/F) December 15, 2010 (9:40 – 12:30)
1. CONTEXT AND SCOPE OF THE WORKSHOP The EU is starting to implement its Europe 2020 Strategy, which is designed to turn Europe into a world leader in smart, sustainable and inclusive growth. Research and Innovation are key drivers to achieving this transition. In 2008, the European Union (EU) has launched an ambitious initiative on low carbon energy technologies through the European Strategic Energy Technology Plan (SET-Plan). The SET-Plan is the technology pillar of the EU Energy and Climate Change Policy. It is the EU's response to the challenge of accelerating the development and widespread market take-up of low carbon technologies as a key element for meeting the goals of the European energy policy together with a stable regulatory framework and for fostering conducive market conditions. Europe 2020 identifies also the need for boosting innovation in different sectors of the economy such as transport and industry aiming at modernising and decarbonising the transport sector, supporting the transition of manufacturing sectors to greater energy and resource efficiency and promoting technologies and production methods that reduce natural resource use.
This innovation framework provides a timely opportunity to investigate the added value for a potential European Action Plan on the energy intensive industrial sector in the
EUROPEAN COMMISSION DIRECTORATE-GENERAL JOINT RESEARCH CENTRE SET-Plan Information System (SETIS)
2
context of the SET-Plan. This responds also to the Council and Parliament recommendations expressed in the context of the adoption of the SET-Plan Communication in 2008 to investigate the possibilities to broaden the scope of technology priorities within the SET-Plan. “Further Industrial Initiatives may be necessary, and therefore Council encourages the Commission to continue to examine areas with great potential such as marine energy, energy storage and energy efficiency for this purpose.” European Council, April 2008 “Calls on the Commission to add energy efficiency technologies, including co- and polygeneration, to the areas covered by the EIIs…”. Parliament, June 2008 The SET-Plan is currently in its implementation phase, moving towards the establishment of large scale programs such as the European Industrial Initiatives (EIIs) that bring together industry, the research community, the Member States and the Commission in risk-sharing, public-private partnerships on the development of key energy technologies at the European level. So far, several EIIs have been launched focusing on the six priority technologies already identified: wind, solar, electricity grids, bioenergy, carbon capture and storage and sustainable nuclear fission. In parallel, the Commission brings forward the Sustainable Industry Low Carbon Scheme (SILC) to coordinate framework conditions, funding actions, data collection, and other activities by the EU and Member States to promote the development and uptake of low carbon technologies in the energy intensive industry in coordination with the SET-Plan. The SILC scheme is intended as a practical, industry-based initiative at EU level that aims to achieve significant improvements in both the competitiveness and the environmental performance of 'traditional' mainstream industries which have to comply with the stringent requirements of the European Emission Trading Scheme (ETS). Through a number of co-financed sectoral projects, SILC shall identify, develop and deploy technological and non-technological innovation measures that will increase the EU industries' competitiveness and, at the same time, achieve significant greenhouse gas reductions. This workshop, organised under the auspices of the Information System of the SET-Plan (SETIS) aimed at exchanging with the stakeholders on the current role of technology innovation in the improvement of energy efficiency and reduction of CO2 emissions in the Pulp and Paper Industry, the anticipated technological development and market potential as well as to explore potential actions in the context of the SET-Plan. This report summarises the discussions and exchange of information that occurred during the workshop. Additional information has been provided by the sector based on a questionnaire developed by SETIS. This response is annexed to this document.

EUROPEAN COMMISSION DIRECTORATE-GENERAL JOINT RESEARCH CENTRE SET-Plan Information System (SETIS)
3
2. CURRENT STATE OF PLAY OF THE PULP AND PAPER INDUSTRY IN EUROPE The pulp and paper industry produces different types of pulp, both from virgin (wood) and recycled material that are subsequently processed into a variety of paper products. For (virgin) pulp making (NACE 17.11) two main routes are used – chemical and mechanical pulp making.
Virgin pulp can be produced alongside paper, on the same site. In Europe, about 18% of all mills in the pulp and paper industry are integrated mills producing both virgin pulp and paper. Recycled fibres are the starting point for the recycling process. Europe has one of the highest recovery and utilisation rates of fibres in the world (72% in 2009). Except for small number of deinked market pulp mills, pulp production from recycled fibres is always integrated alongside paper production.
The pulp and paper industry is one of the energy intensive sectors of the EU and global industry. Pulp and paper production requires the use of power and steam/heat. There are large variations on the energy profiles for different technologies. However, in general terms, it can be said that mechanical pulp making is more electro-intensive and less heat intensive than chemical pulping. The electricity/steam consumption ratio at paper mills enables an efficient use of co-generation of heat and power (CHP). On the overall European balance, the industry in 2008 bought 72 TWh of electricity, sold 9 TWh of electricity, and produced 53 TWh of electricity.
Taking into account the different energy intensities of the various product types, the average specific heat consumption for the sector is between 4-7 GJ/t to create an end product. The lowest values being noted for recycled based newsprint and the highest for specialty papers and packaging. Specific primary energy consumption in 2008 was 13.41 GJ/t, based on the overall totals of energy and production data.
All in all, half of the energy used by the industry (53.9% in 2009) comes from biomass and circa 38% from natural gas. Therefore, although the industry is energy-intensive, its not carbon-intensity is not proportional when compared with other sectors.
From 1990 to 2006 the improvement in specific primary energy and electricity consumption has been 16.5% and 16.1%, respectively. The main drivers of this efficiency gains have been 1) the fuel prices, 2) the continuous renewal in the industry through replacing old machinery with new generations of larger, faster, and more efficient machines, 3) and the pressure of customer and regulatory demand for more environmentally friendly technologies. The increase over the years of the share of recycled paper has played against this trend as the processing of recycled paper usually leads to less bio-energy usage.

EUROPEAN COMMISSION DIRECTORATE-GENERAL JOINT RESEARCH CENTRE SET-Plan Information System (SETIS)
4
With respect to CO2 emissions, the emissions covered by the EU ETS system are circa 37 million tonnes in 2009. And from 1990 to 2008 the absolute emissions have decreased by 4.4%, with a reduction of specific CO2 emissions of 42 % on average for direct and indirect specific emissions (electricity) and 39% for direct specific emissions from fuels used on site. A key role for these reductions is played by the increased use of biomass, which is affected by the product and processing mix (e.g. chemical pulping).
It is also noted that although the CO2 emissions of the sector account for only 2% of the emissions under the EU ETS, it comprises 11 out of the 52 benchmarks which have been determined for a total of 20 sectors by the European Commission (the initial proposal of the pulp & paper sector was to use 64 different products). Furthermore, some of this benchmark values had to be determined using best reference values from the BREF1 instead of using the general approach of assigning the values using a benchmarking curve.
Action: Joint work between SETIS and sector representatives to detail and consolidate further the mapping of current sector energy consumption and CO2 emission levels in Europe.
3. L IKELY EVOLUTION OF THE PULP AND PAPER INDUSTRY IN EUROPE The European pulp and paper industry consists of some 800 companies which produce pulp, paper and board across Europe, ranging from small and medium sized companies to multi-nationals and comprising about 1100 mills. In 2006 the EU paper and board production (reported by the 18 CEPI-associated countries) was 26.8% (102Mt) of world production. (North America 26.8% and Asia 36.3%). Europe also represents about 23% (43.5 Mt) of the world’s total pulp production.
The European pulp and paper sector production has grown at an average rate of 1.6% per year between 2000 and 2007 while the turnover has remained relatively stable due the increasing competition from emerging countries. Between 2007 and 2009, due to the financial crisis, the production decreased by 14% and the turnover by 12%. The European pulp & paper industry has partially recovered with a production that has grown by 10% over the past 9 months. However, it has not reached pre-crisis levels yet. For certain grades (e.g. newsprint) production is not expected to come back to pre-crisis levels.
1 BREFs are the main reference documents on Best Available Techniques. They are prepared by the European Integrated Pollution Prevention and Control (IPPC) Bureau and are used by competent authorities in Member States when issuing operating permits for the installations that represent a significant pollution potential in Europe.
EUROPEAN COMMISSION DIRECTORATE-GENERAL JOINT RESEARCH CENTRE SET-Plan Information System (SETIS)
5
Overall, the sector keeps growing at a steady pace with a changing product mix and new grades developing as a consequence of long-term societal changes (tissue, because of ageing population and hygiene needs, packaging, etc.). The situation of the sector in 2020, 2030, and 2050 will also depend largely on the extent to which export markets can remain to be served, e.g. the competitiveness of the sector in a global perspective.
In a business as usual scenario there is still some room for improvement because benchmark levels have 50% lower specific CO2 emissions than the highest values, and the specific CO2 emissions of best performers are 30% lower than the average. However, tapping this potential improvement requires the replacement of today’s machines by new ones. As new machines cost hundreds of millions of Euros, this will take time and is dependent on machine age, investment cycles, sector developments and availability of capital. In the timeframe set, 2020 and 2030 are still within existing investment cycles, and 2050 is only “two paper machines away”. The prime candidates for improvements are the boilers followed by the most energy-intensive part of the paper production (the drying of the paper). In general terms, full deployment of BATs could lead to roughly 25% CO2 savings by 2050. These potential savings fall short of the demanding need of decarbonising the society, further decreases would require additionally the implementation of breakthrough technologies. There exist several potential breakthrough technologies that did not manage to demonstrate market viability yet. These technologies can be grouped in several families:
• The bio-route is the route towards integrated biorefinery complexes producing bio-pulp, bio-paper, bio-chemicals, bio-fuels, bio-energy and possibly bio-Carbon Capture and Storage (bio-CCS). Some of the bio-route concepts could be in scope for the 1st call for proposals under the Bioenergy EII. There is a first large scale demonstrators (a bio-DME plant in connection to a pulp mill) under construction in Sweden. Part of this route is also the further development of gasification of the black liquor, which aims at producing a combustible mixture of raw gases on the one hand and separating out the inorganic pulping chemicals on the other hand for their subsequent use in the pulping processes. Lignoboost, another bio-route concept, is a complete system that extracts lignin, a component of wood from kraft black liquor. This lignin can be used as a biofuel with relatively high heating value and could also be used as feedstock to produce innovative chemicals.
• Innovative drying technologies. Some drying technologies as “impulse drying”, the “Condebelt” process, or the “steam impingement drying” have only had a first case implementation, and have not been replicated. Research and demonstration regarding innovative drying technologies seems to be in standstill.

EUROPEAN COMMISSION DIRECTORATE-GENERAL JOINT RESEARCH CENTRE SET-Plan Information System (SETIS)
6
• Mechanical pulp. There is ongoing work, at studies level, to optimise the production of mechanical pulp focusing mainly on the wood yield preparation and more efficient refiner plates (less energy consumption at the same productivity levels).
On general terms, and similarly to other energy intensive industries, the Pulp and Paper industry devotes around 1 to 2% of its turnover to R&D. However, many companies focus their R&D investments mainly on new products, leaving most of the investment in R&D regarding technology and processes to a small number of specialised suppliers.
Despite the apparently high number of promising technologies their market uptake is not happening. Possible reasons will be discussed with more detail in the next point. The IEA technology perspectives and the Horizon 20502 study published by CAN Europe give first estimates of savings potentials that could be achieved through a larger scale deployment of the above listed breakthrough technologies.
Action: Joint work between SETIS and sector representatives to define and assess deployment pathways of the European Pulp and Paper Sector in Europe and the role of technology innovation for efficiency improvements and CO2 reduction.
4. BARRIERS AND NEEDS In the short and long term, perspectives on the issue of availability of raw materials (wood and recycled fibre) will be crucial for the Pulp and Paper industry. Currently, there is an increasing pressure on biomass availability. For their main virgin feedstock, wood, the Pulp and Paper industry is competing with other bio energy producers. At the same time, waste paper is exported at large scale as some new large paper mills in China run on imported waste paper; this leads to shortages in recycled fibres for some European paper producers.
As stated above, current research and demonstration in many innovative technologies is nearly stalled. This is related to the fact that many of the already available innovative technologies could not demonstrate market viability yet. Most of the potential breakthrough technologies are currently in a "valley of death ", unable to achieve market deployment. Large scale demonstration plants could help the breakthrough technologies to cross or leave this “valley of death” and demonstrate market viability. If the breakthrough technologies are not deployed, the expected improvement of the sector in
2 http://www.caneurope.org/component/docman/doc_download/1716-steel-paper-and-cement-identifying-breakthrough-technologies-oct2010
EUROPEAN COMMISSION DIRECTORATE-GENERAL JOINT RESEARCH CENTRE SET-Plan Information System (SETIS)
7
energy consumption and emissions is roughly estimated at about 25% by 2050, achievable through the deployment of BATs in two investment cycles from now to 2050.
The main barrier to further expand CHP in the sector may be the spread price, (difference between the price of the fuel used by the CHP and the price of the electricity generated). Also the trend by many municipalities to decrease the availability of waste to be recycled by the energy insensitive industries may further hamper reaching higher levels of efficiency.
The lack of detailed information about consumptions and emissions of most of the Pulp and Paper technologies is a barrier in itself. Potential policy measures need to be justified and prioritised on sound data and robust impact calculations. The aggregated nature of the information managed by CEPI makes it difficult to assess the impact that individual technologies in the Pulp and Paper industry could have on the energy system level.
5. ACHIEVING THE VISION – RECOMMENDED ACTIONS AT EU LEVEL It would be highly advisable for the pulp and paper industry to organize a project similar to the ULCOS project for the Iron and Steel Industry. The aim of such a project would be to screen the most promising technologies and to gather solid numbers on costs and benefits of the breakthrough technologies. This data could support the subsequent definition of larger scale demonstration activities needed in order to showcase market viability for certain technologies. It is reminded to the stakeholders the importance for public support to have a programmatic approach that encompasses in a comprehensive way short-term and long-term needs including up-stream research, supported by a long term vision and a detailed analysis of the impact of such R&D and D programme on the EU Policy Goals. The sector emphasized the importance of support for R&D, D at community level considering the high risk entailed in investing in the research and demonstration of the breakthrough technologies. Important initiatives at European level that are in scope to address partially the R&D, D needs of the sector are the Bioenergy EII and potentially the pending SILC initiative. Action: The sector agrees to define further the needs for research and demonstration that could eventually qualify for a SET-Plan action, that is based on a sector vision that goes beyond business as usual, clearly identifies (i) the benefits to the EU energy and climate policy goals, substantiated by adequate data, (ii) the added-value to work at European level and that contains a risk analysis that justifies the public intervention.

EUROPEAN COMMISSION DIRECTORATE-GENERAL JOINT RESEARCH CENTRE SET-Plan Information System (SETIS)
8
Brussels, 10th of December 2010
Annex: ANSWERS PREPARED BY CEPI TO THE QUESTIONNAIRE FOR ENERGY-INTENSIVE INDUSTRIES IN SUPPORT OF THE SET- PLAN –
A - INTRODUCTION TO THE PULP & PAPER INDUSTRY
General
The European pulp and paper industry consists of some 800 companies which produce pulp, paper and board across Europe, ranging from small and medium sized companies to multi-nationals and about 1100 mills. Together they represent almost 30% of the global production. The Confederation of European Pulp and Paper Industries (CEPI) represent the vast majority of these mills and companies, through its 19 national association members (including Norway and Switzerland). The largest pulp and paper producing countries are Germany, Sweden, Finland and Italy, with Spain and Portugal increasingly so. The sector generates a total turnover of 71 billion Euros, generating an added value of about 15 billion Euros. It employs some 230.00 people directly and a total of 1.8 million people in the related value chain. It is part of the Forest-based Industries, which has a turnover of 375 billion Euros, 6.5% of the European manufacturing industry’s turnover. 60% of employment in the European pulp & paper industry is located in rural areas
Organisation of the sector
CEPI is part of the International Council of Forest and Paper Associations (ICFPA), a global network of forest and paper associations, representing over 90% of the global forest-based industry capacities. Industrial sectors from large new economies like China, India and Brazil are also members of ICFPA, together with important pulp and paper producing countries: USA, Canada and Japan. Although active information is exchanged and regions work together, there is no global paper institute or technology programme.
Processes
The pulp and paper industry produces different types of pulp, both from virgin (wood) and recycled material that are subsequently processed into paper. For (virgin) pulp making (NACE 17.11) two main routes are used – chemical and mechanical pulpmaking. Both groups can be subdivided into subgroups. Chemical pulping comprises kraft, sulphite or soda processes. Mechanical pulping comprises pressure groundwood pulping (PGP), thermo mechanical pulping (TMP) and chemi-thermo mechanical pulping
EUROPEAN COMMISSION DIRECTORATE-GENERAL JOINT RESEARCH CENTRE SET-Plan Information System (SETIS)
9
(BCTMP). There is also a small production of speciality and non-wood pulps. Virgin pulp production can be made alongside paper production, on the same site, however standalone market virgin pulp mills also exist and standalone paper mills exist. The latter buy a mix of different market pulps to produce specific paper products. In Europe, about 18% of all mills in the pulp and paper industry are integrated mills producing both virgin pulp and paper.
Virgin pulp is also the starting point for the recycling process. The collection of recovered fibres in Europe is vastly developed, resulting in one of the highest recovery and utilisation rates in the world (72% in 2009). Except for small number of deinked market pulp mills, pulp production from recycled fibres is always integrated alongside paper production. Deinked recycled pulp is also sold to the market by a number of these mills. There are over 60 types of recovered fibre, standardised in a special EN 643 standard. The choice of which recovered paper to use depends on the quality demands for the paper grade produced.
Paper production (NACE 17.12) is generally grouped into main grades: newsprint, other printing and writing paper (fine paper, office paper), tissue, containerboard (kraftliner, testliner, fluting), and cartonboard. Paper grades can be coated and uncoated, making for different applications. A large group of paper production can be categorised as specialties (ranging from cigarette paper to bitumen paper, glazed paper or banknote paper).
Environmental framework
The European pulp and paper industry falls under the new Industrial Emission Directive (IED, former IPPC). There is a special pulp and paper industry ‘best available technologies’ reference document (BREF), which holds more detailed descriptions of the information provided above and can be used as data source. A new BREF is under construction and will be available by the end of 2011. Environmental emissions of a large number of mills can be found in the European PRTR system as well. CEPI publishes a GRI B+ Sustainability report that holds a number of environmental statistical data.
Energy introduction
The pulp and paper industry is one of the energy intensive sectors of EU and global industry. The production of pulp and paper requires the use of power and steam/heat. The energy profiles of different technologies have large variations. Mechanical pulpmaking is electro-intensive and less heat intensive. However the heat linked for paper making is mainly generated in CHP plant next to the pulping and paper making. Chemical pulping is also bio-energy producer. Recycled fibre-based papermaking is mostly based on natural gas, in combination with CHP. The electricity/steam consumption ratio at paper mills enables efficient use of co-generation of heat and power (CHP) and CHP is therefore

EUROPEAN COMMISSION DIRECTORATE-GENERAL JOINT RESEARCH CENTRE SET-Plan Information System (SETIS)
10
widely applied in the paper industry. There are also large variations in the feedstock and the products produced in the various member states. This affects the energy profile of the sector in each member state considerably (e.g. energy intensity, fuel types used, role of national gas based CHP, CO2 emission intensity) but also the markets within which the industry works and which technologies might be applicable.
The European pulp and paper buys electricity from the grid, sells electricity to the grid and uses its self-produced electricity. Heat is mostly made and used within mills, although heat is bought from outside in a number of cases, and also heat is supplied to third parties. 53,9% (in 2009) of the primary energy use is based on biomass, 38% on natural gas, the remainder on fuel oil, peat and coal. On the overall European balance, the industry in 2008 bought 72.000 GWh of electricity, sold 9.000 GWh of electricity, produced 53.000 GWh of electricity. The total primary energy input (fuels) was 1.267.000 TJ in 2008. Further information on the energy profile of the sector can be found in the IEA technology perspectives, which holds a special chapter on the sector as well.
CO2 Emission introduction
The European Pulp and paper mills are an appointed sector of the EU ETS, which means the CITL has data on 1007 pulp and paper permits (all paper mills that produce less than 20 tonnes a day excluded). The total emissions of the European pulp and paper mills were 37,3Mt in 2008. Half of the mills in CITL are a so-called ‘small emitter’, emitting less than 25ktonnes per year. The largest single emitting installation emitted around 500 ktonnes/annum, a high figure for the paper industry, but moderate compared to other sectors. For the post 2012 EU ETS a total of 11 benchmarks have been determined by the European Commission. These benchmarks reflect, however, only the heat related emissions per tonne of pulp and paper as there is no free allocation to any electricity production in the EU ETS directive. Significant part of the pulp and paper production (e.g. dissolving pulp, (C)TMP, other pulps, kraftliner, TAD, other paper) is not covered by the 11 benchmarks.
Data availability
Statistical data for the sector are being reported by national associations and collected by the CEPI office. For the specific issues CEPI issues monthly, quarterly and yearly reports on the parameters that are being reported on the (total) national levels. Partial data also exist on the global Pulp&Paper RISI database3. Partial data also exist on the global Pulp&Paper RISI database (http://www.risiinfo.com/). The key databases for the sector in
3 RISI – www.risiinfo.com

EUROPEAN COMMISSION DIRECTORATE-GENERAL JOINT RESEARCH CENTRE SET-Plan Information System (SETIS)
11
Eurostat are under the “Structural Business Statistics - Annual detailed enterprise statistics for industry”
(http://epp.eurostat.ec.europa.eu/portal/page/portal/statistics/search_database). When using data from Eurostat or other public sources one should be aware that data are grouped in many cases at NACE 2 level, including pulp and paper production, but also converting of paper into final products and even printing and publishing. This in many cases requires re-analysis of data before the link between e.g. turnover and energy use can be made. CEPI statistics by definition reflect data on national level, not at a product specific or mill specific level. To our knowledge no such databases currently exist. CEPI only has a general impression of costs, as no mill specific, process or product specific data are shared in the sector.
B – SECTORAL DEVELOPMENT
I. Current state of play of your sector in Europe4
1. What is currently the energy consumption of your sector by tone of output? (By type of fuel and energy carriers, e.g. electricity, heat, process steam etc.)
Introduction
In CEPI statistics, information is collected on the energy streams entering and leaving the mills e.g. the primary energy use (fuels), the fuel mix, electricity production, purchases and sales and heat consumption. The heat consumption data are data with the least quality as they are not uniformly measured across Europe and often encompass a multitude of heat flows in the mill. The high uptake of CHP is sometimes recorded in a black box inside the mills, where the energy flows entering and leaving the mills are clearly measured.
Fuel mix
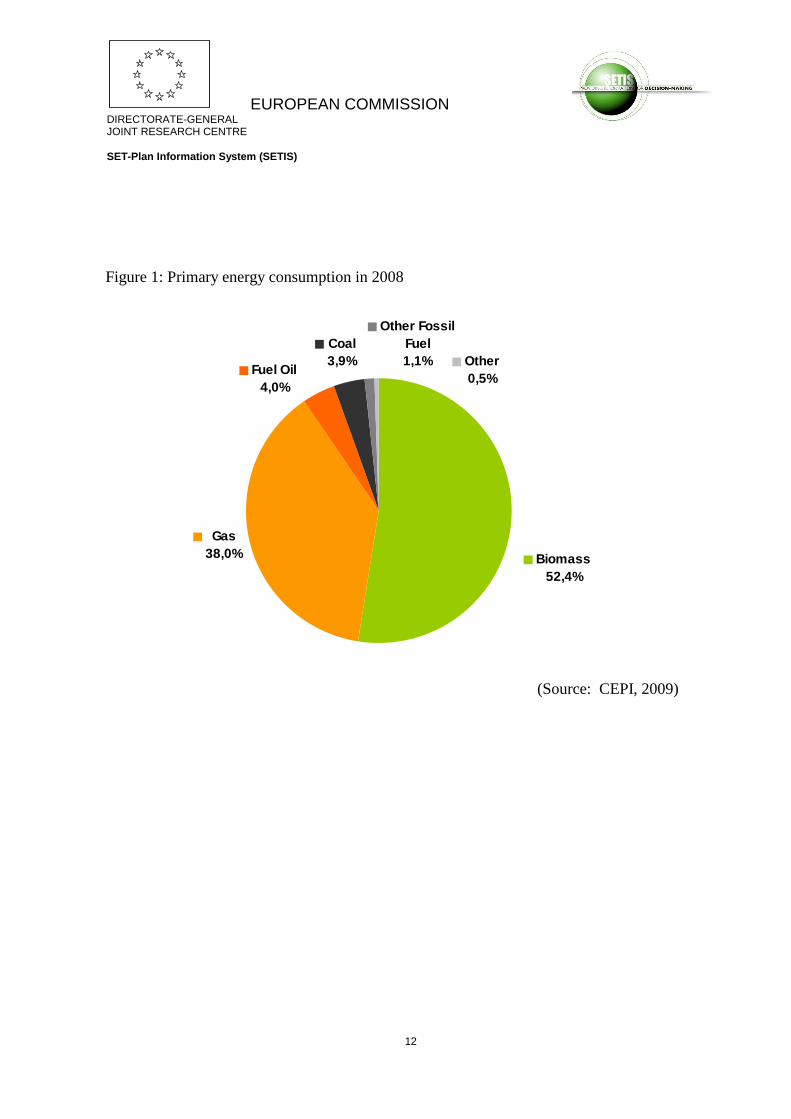
Half of the energy used by the industry (53,9% in 2009) comes from biomass and circa 38% (36.8% in 2007) from natural gas. So although the industry is energy-intensive, it is not carbon-intensive.
4 NB. These data are based on the CEPI statistics, covering the vast majority of countries, but however not all pulp and paper mills in Europe (e.g. in Greece).
EUROPEAN COMMISSION DIRECTORATE-GENERAL JOINT RESEARCH CENTRE SET-Plan Information System (SETIS)
12
Figure 1: Primary energy consumption in 2008
Gas38,0%
Coal3,9%
Other Fossil Fuel1,1% Other
0,5%Fuel Oil
4,0%
Biomass52,4%
(Source: CEPI, 2009)
EUROPEAN COMMISSION DIRECTORATE-GENERAL JOINT RESEARCH CENTRE SET-Plan Information System (SETIS)
13
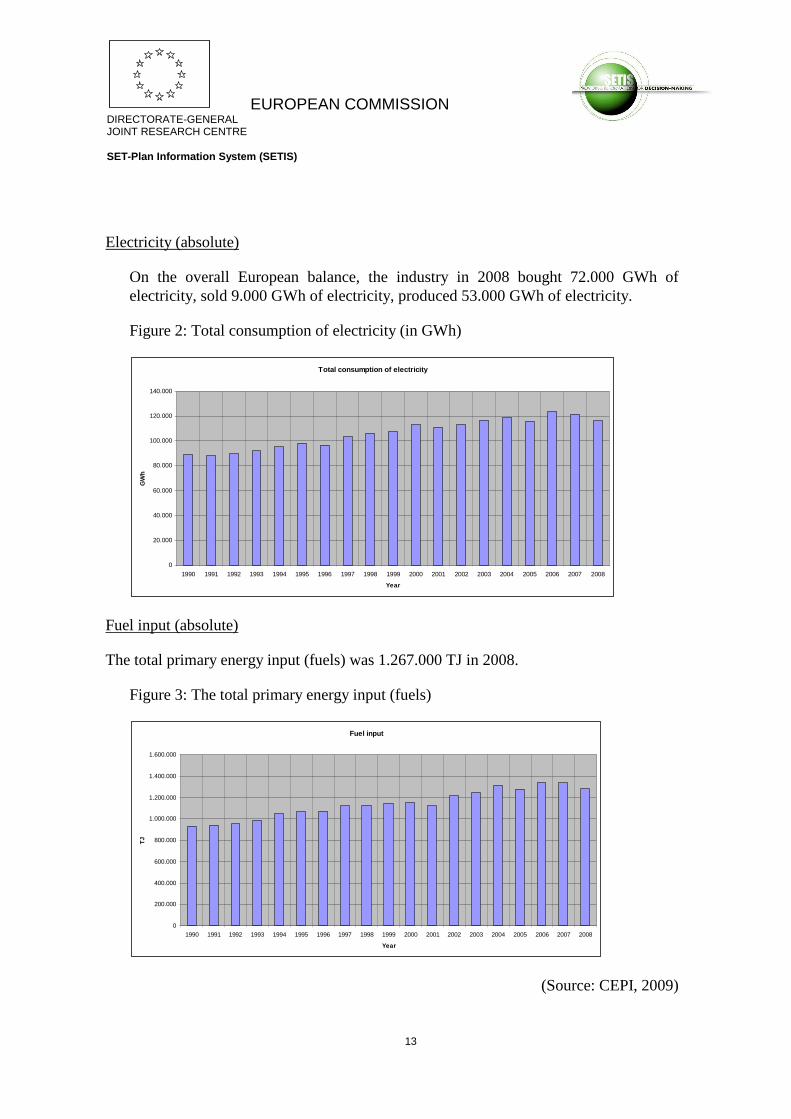
Electricity (absolute)
On the overall European balance, the industry in 2008 bought 72.000 GWh of electricity, sold 9.000 GWh of electricity, produced 53.000 GWh of electricity.
Figure 2: Total consumption of electricity (in GWh)
Total consumption of electricity
0
20.000
40.000
60.000
80.000
100.000
120.000
140.000
1990 1991 1992 1993 1994 1995 1996 1997 1998 1999 2000 2001 2002 2003 2004 2005 2006 2007 2008
Year
GW
h
Fuel input (absolute)
The total primary energy input (fuels) was 1.267.000 TJ in 2008.
Figure 3: The total primary energy input (fuels)
Fuel input
0
200.000
400.000
600.000
800.000
1.000.000
1.200.000
1.400.000
1.600.000
1990 1991 1992 1993 1994 1995 1996 1997 1998 1999 2000 2001 2002 2003 2004 2005 2006 2007 2008
Year
TJ
(Source: CEPI, 2009)

EUROPEAN COMMISSION DIRECTORATE-GENERAL JOINT RESEARCH CENTRE SET-Plan Information System (SETIS)
14
Heat (absolute)
The total consumption of heat in 2008 was 621.000 TJ.
Figure 4: Total consumption of heat
Total consumption of heat
0
100.000
200.000
300.000
400.000
500.000
600.000
700.000
2000 2001 2002 2003 2004 2005 2006 2007 2008
Year
TJ
(Source: CEPI, 2009)
CO2 (absolute)
Our total CO2 emissions covered by the EU ETS system are circa 37 million tones in 2008.
Figure 5: Direct CO2 emissions (absolute in Mega tones)
Direct (absolute) CO2 emissions
34,00
35,00
36,00
37,00
38,00
39,00
40,00
41,00
42,00
43,00
1990 2000 2005 2006 2007 2008
Year
Meg
a to
nnes
(Source: CEPI, 2009)
EUROPEAN COMMISSION DIRECTORATE-GENERAL JOINT RESEARCH CENTRE SET-Plan Information System (SETIS)
15
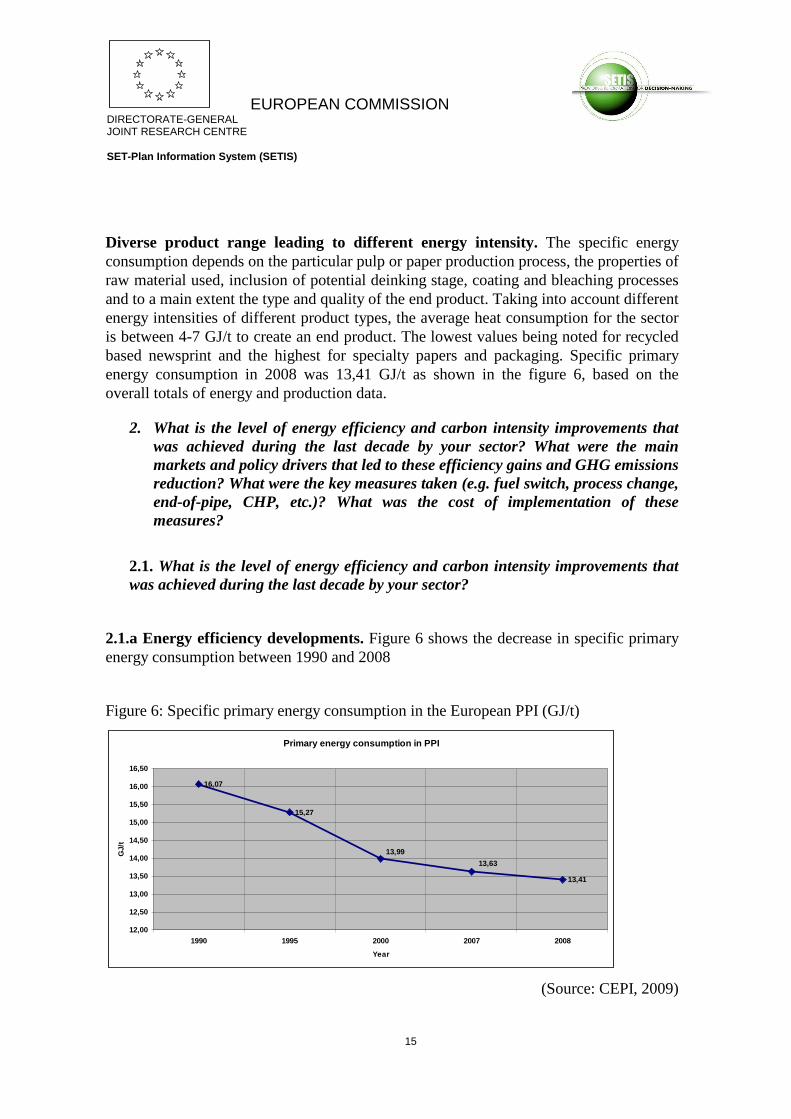
Diverse product range leading to different energy intensity. The specific energy consumption depends on the particular pulp or paper production process, the properties of raw material used, inclusion of potential deinking stage, coating and bleaching processes and to a main extent the type and quality of the end product. Taking into account different energy intensities of different product types, the average heat consumption for the sector is between 4-7 GJ/t to create an end product. The lowest values being noted for recycled based newsprint and the highest for specialty papers and packaging. Specific primary energy consumption in 2008 was 13,41 GJ/t as shown in the figure 6, based on the overall totals of energy and production data.
2. What is the level of energy efficiency and carbon intensity improvements that was achieved during the last decade by your sector? What were the main markets and policy drivers that led to these efficiency gains and GHG emissions reduction? What were the key measures taken (e.g. fuel switch, process change, end-of-pipe, CHP, etc.)? What was the cost of implementation of these measures?
2.1. What is the level of energy efficiency and carbon intensity improvements that was achieved during the last decade by your sector?
2.1.a Energy efficiency developments. Figure 6 shows the decrease in specific primary energy consumption between 1990 and 2008
Figure 6: Specific primary energy consumption in the European PPI (GJ/t)
Primary energy consumption in PPI
16,07
15,27
13,41
13,99
13,63
12,00
12,50
13,00
13,50
14,00
14,50
15,00
15,50
16,00
16,50
1990 1995 2000 2007 2008
Year
GJ/
t
(Source: CEPI, 2009)

EUROPEAN COMMISSION DIRECTORATE-GENERAL JOINT RESEARCH CENTRE SET-Plan Information System (SETIS)
16
The figure shows an overall improvement in primary energy consumption of 16,6% between 1990 and 2008. Energy intensity developments are partly influenced by structural factors and by efficiency improvements. For the time being there are no decomposition analysis done to break out the contribution of these factors. Growing utilisation rate of CHP installations in PPI played very important role in the reduction of the primary energy consumption.
2.1.b Electricity A similar trend is recorded in the specific electricity consumption as shown in the figure 7.
Figure 7: Specific Electricity consumption
Specific electricity consumption in PPI
1,041,05
1,12
1,16
1,24
0,90
0,95
1,00
1,05
1,10
1,15
1,20
1,25
1,30
1990 1995 2000 2007 2008
Year
MW
h/k
t
(Source: CEPI, 2009)
The figure shows an overall improvement specific electricity consumption of 16,1% between 1990 and 2008.
2.1.c GHG emissions
Fossil CO2 emissions are mainly the result of the production of heat and electricity, from fuel oil use in the lime kiln, direct heaters on natural gas in tissue Yankee cylinders and infrared dryers in paper machines and start-up fuels in biomass boilers. There are hardly any (other) fossil CO2 process emissions present. In the absolute terms PPI reduced the overall fossil CO2 emissions by 4,4% between 1990-2008, the specific CO2 emissions per ton of product were reduced by 42 % on average for direct and indirect emissions

EUROPEAN COMMISSION DIRECTORATE-GENERAL JOINT RESEARCH CENTRE SET-Plan Information System (SETIS)
17
(electricity) and 39% for direct emissions from fuels used on site. Key role in this process is the increased use of biomass, which is affected by the product mix (e.g. chemical pulping).
Figure 8: Specific CO2 emission – t/t of product between 1990 and 2008
Specific CO2 emissions / t of product
0,3480,349
0,425
0,5700,500
0
0
0
0
0
1
1
1990 1995 2000 2007 2008
Year
t/t
(Source: CEPI, 2009)
2.2 What were the main markets and policy drivers that led to these efficiency gains and GHG emissions reduction?
The main driver for these developments has been the cost of energy and the relative competition impact of energy costs. As in the cost structure of pulp and paper production the main elements of capital costs, raw material and labour costs are in many cases similar or stable for competing companies, energy costs are the one cost factor with the potential largest variation. Saving on energy can therefore directly improve the relative competitive position of the company. Increasing energy and raw material costs have been key forces in improvements.
A second driver of development lies in investments, innovation and restructuring. The sector has edged continuously towards larger and fasters machines, being more efficient per tonne of output. New machines have pushed smaller machines either off the market or to change towards specialty products and niches. Only the leanest and extremely well run older and mid-sized machines stand a chance to compete with new and large machines.
The third driver has been regulation and customer demand. Authorities, investors, customers, the general public, political groups, environmental pressure groups and media
EUROPEAN COMMISSION DIRECTORATE-GENERAL JOINT RESEARCH CENTRE SET-Plan Information System (SETIS)
18
are participating as stakeholders, demanding mills to improve their energy efficiency gains and environmental impact on the whole.
2.3 What were the key measures taken (e.g. fuel switch, process change, end-of-pipe, CHP, etc.)?
There are four key measures that can be identified contributing to these results:
a) New investments/new machines/upgraded technology.
b) New boilers and Fuel mix switch. In the last 2 decades many new investments were recorded and which changed the basic fuel mix in the PPI installations. In total the share of coal decreased by 48% and the share of fuel oil by 61%. Due to the fuel switch and increased production we see the increase in the use of natural gas by factor two and the increase in the use of biomass by the factor 1,7. (Source: CEPI, 2009)
c) CHP utilisation rate – Figure 3 shows the development in the share of electricity produced through CHP compared to total on-site electricity generation. The results show that the overall share in CEPI countries rose by 6, % between 1990 and 2008. If we exclude Norway (hydropower) the change is even higher (8,5%). In seven countries where 100% of the self-generated electricity is produced in CHP and in one specific country where the usage rose by 80% in the same timeframe. (Source: CEPI, 2009)

EUROPEAN COMMISSION DIRECTORATE-GENERAL JOINT RESEARCH CENTRE SET-Plan Information System (SETIS)
19
Figure 9: Share of electricity produced through CHP compared to total on-site electricity generation (on-site produced electricity excluding the electricity bought from the grid)
CHP self-generated electricity share
82,00%
84,00%
86,00%
88,00%
90,00%
92,00%
94,00%
96,00%
98,00%
1990 1991 1992 1993 1994 1995 1996 1997 1998 1999 2000 2001 2002 2003 2004 2005 2006 2007 2008
Year
%
(Source: CEPI, 2009)
d) Mill optimisation, product in efficiency and energy management systems. The best way to save energy is to produce efficiently, making production optimisation one of the key reasons for improvements, notably, preventing losses and broke. Adding a focus on energy efficiency, improving the mills operations, fine tuning, debottlenecking, etc. leads to well-run mills and these have been focus areas for improvement as well. We consider differences in strategies used, as well as control equipment, especially for smaller mills, compared to more modern mills.
2.4 What was the cost of implementation of these measures?
1. The sector has a total turnover of 71 billion Euros, generating an added value of about 15 billion Euros. It employs some 230.00 people directly and 1.8 million people in the total related value chain. It is part of the Forest-based Industries, which has a turnover of 375 billion Euros, i.e. 6.5% of the European manufacturing industry’s turnover. Many mills operate in rural areas, making them very important to regional employment – 60% of employment in the European pulp & paper industry is located in rural areas.

EUROPEAN COMMISSION DIRECTORATE-GENERAL JOINT RESEARCH CENTRE SET-Plan Information System (SETIS)
20
Table 1: Cash manufacturing costs for the European pulp & paper industry in Q2 2010 (capital costs not included) – source RISI
Europe Cash Manufacturing Cost* in 2Q10
Consumable €/Tn M€/Y % Maintenance 38 4.635 8,0% Labour 49 6.005 10,4% Electricity 32 3.982 6,9% Fuels 51 6.281 10,9% Chemicals 72 8.799 15,2% Market Pulp 110 13.485 23,4% Recovered Paper 45 5.474 9,5% Wood 73 9.038 15,7%
Sum 469 57.700 100%
Figure 10: Cash manufacturing costs for the European pulp & paper industry compared with other key competing countries in Q2 2010 (capital costs not included) – source RISI
0
100
200
300
400
500
600
EU RU CN JP ID BR US CA
EU
R /
To
nn
e
Maintenance
Labour
Electricity
Fuels
Chemicals
Market Pulp
RecoveredPaperWood
RU: Russia / CN: China / JP: Japan / ID: Indonesia / BR: Brazil / US: United States of America / CA: Canada
Overall investments in past years have been about 5 billion Euros per year, with about 500 million Euros specifically dedicated to environmental investments improvement of energy efficiency and carbon emission abatement technologies, according to consultants.

EUROPEAN COMMISSION DIRECTORATE-GENERAL JOINT RESEARCH CENTRE SET-Plan Information System (SETIS)
21
Productivity remains a crucial competitiveness factor for the European pulp & paper industry. Labour productivity has increased by more than 30% within the European pulp and paper industry. Thanks to this gain, the European industry has remained among the top leaders of the global pulp and paper sector.
Figure 11: Labour productivity comparison between Europe and competing countries
4. The European pulp and paper sector production has grown at an average rate of 1.6% per year between 2000 and 2007 while the turnover has remained relatively stable due the increasing competition from emerging countries. Between 2007 and 2009, due to the crisis, the production decreased by 14% and the turnover by 12%. The European pulp & paper industry has partially recovered with a production that has grown by 10% over the past 9 months. However, it is not back to the pre-crisis level yet.
EUROPEAN COMMISSION DIRECTORATE-GENERAL JOINT RESEARCH CENTRE SET-Plan Information System (SETIS)
22
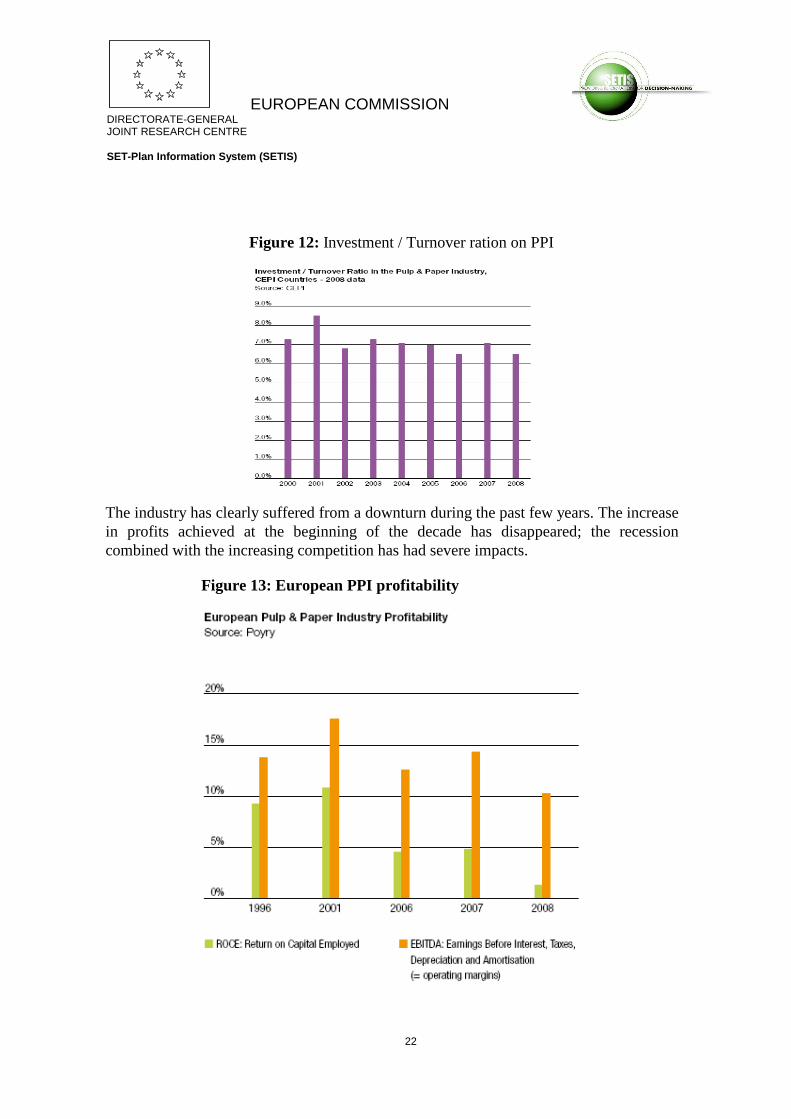
Figure 12: Investment / Turnover ration on PPI
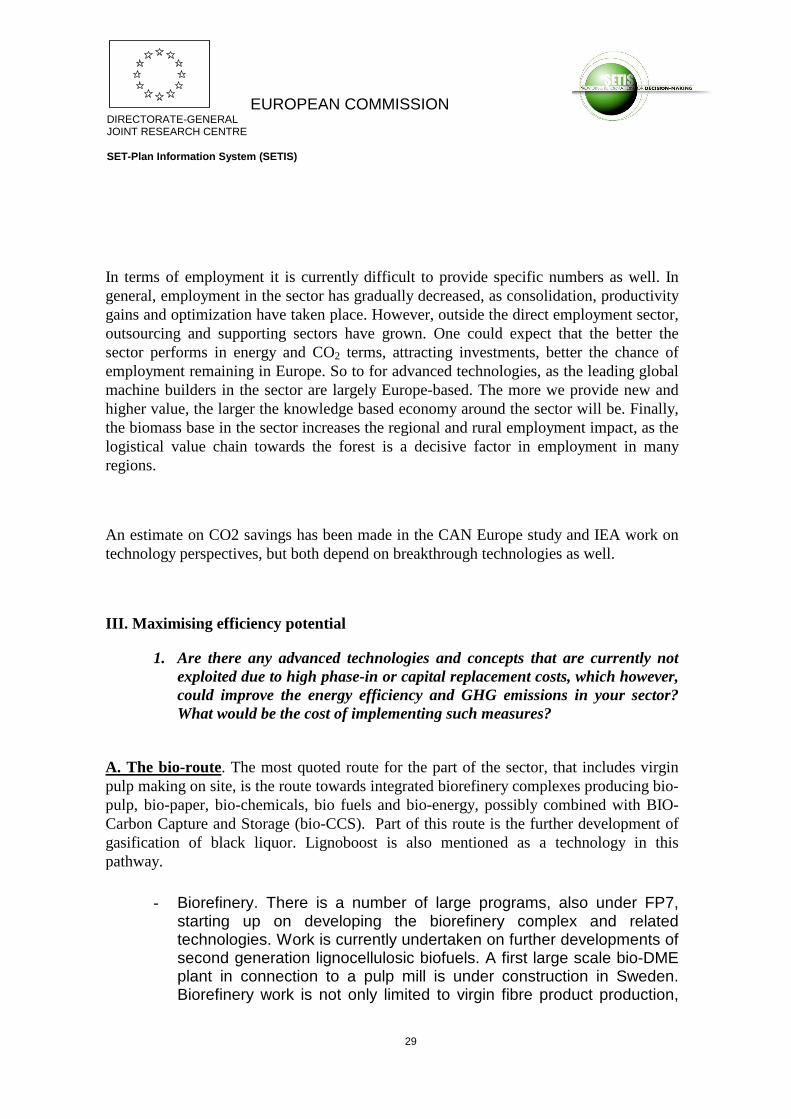
The industry has clearly suffered from a downturn during the past few years. The increase in profits achieved at the beginning of the decade has disappeared; the recession combined with the increasing competition has had severe impacts.
Figure 13: European PPI profitability

EUROPEAN COMMISSION DIRECTORATE-GENERAL JOINT RESEARCH CENTRE SET-Plan Information System (SETIS)
23
II. Likely evolution of the sector
1. What is the likely evolution of the sector in 2020, 2030, 2050 in terms of turn-over in Europe? Is your sector more likely to invest in plants outside the EU?
1.a. What is the likely evolution of the sector in 2020, 2030, 2050 in terms of turn-over in Europe?
The economic crisis in 2009 has hit the sector hard, although much of the pain of restructuring had also been felt before the crisis started. Most of the sector emerged from the crisis fairly fast and strong given that measures had already been put in place.
Paper production and consumption have in the past not only been known to be cyclical but also in line with the growth of GDP. Now, however, that link seems to be broken partially in the USA, and Europe partly seems to follow suit. In modelling used, the pulp and paper production in Europe continues to grow at a rate of about 1-1,5% per year, lower than in the past. A decline of production can be found in certain grades (e.g. newsprint), that are not expected to come back to pre-crisis levels. Overall however the sector keeps growing at a steady pace with new grades developing (tissue because of ageing population and hygiene needs, packaging, etc.) Where the sector will be in 2020, 2030 and 2050 largely also depends on the extent to which export markets can remain to be served, e.g. the competitiveness of the sector in a global perspective. The main global growth in the pulp and paper industry takes place in China, South America, India and Rest of Asia, serving growing markets there.

EUROPEAN COMMISSION DIRECTORATE-GENERAL JOINT RESEARCH CENTRE SET-Plan Information System (SETIS)
24
Figure 14: Paper and board consumption per capita – comparison with other world regions
In the short and long term, perspectives on the issue of availability of raw material (wood and recycled fibre) will be crucial for PPI in order to strive for the climate targets set by the EU. Clear example of the importance can be proven with the fact that the wood pellet fuel prices in Germany have not declined during the economic crisis, while natural gas and oil have. This shows the pressure on biomass supply, which is already high in the EU. Equal treatment is very important to ensure the availability of all raw materials should also be granted to wood and biomass and not be limited to metals and minerals only. Although the raw materials wood and recovered paper are renewable, they are not infinite and therefore need to be used efficiently. Measures must avoid unfair competition and promote equal and cost – efficient access to wood for both pulp and paper and bio-energy producers so that our industry can maintain its current high contribution to EU’s renewable energy targets, while the high levels of collected recovered paper in Europe are an indispensable contribution to the recycling society. At the same time waste paper

EUROPEAN COMMISSION DIRECTORATE-GENERAL JOINT RESEARCH CENTRE SET-Plan Information System (SETIS)
25
(trade) is becoming a global market as some large paper machines in China run on imported waste paper.
1.b Is your sector more likely to invest in plants outside the EU?
Economic studies have shown that globally the law of one price (LOP) applies to many major pulp papermaking grades, meaning that after correction of local factors, prices around the world are similar. The sector directly competes on global markets, not only or the export markets, but also with North, South- en Chinese production directly competing with European markets. The sector is recognized as a carbon leakage sector, both for trade and carbon intensity. What is important though is to see carbon leakage not only as a one dimensional factor. What really is at stake are future investment decisions between a low profit margin Europe and high profit margins outside the EU. Of further importance is the marginal impact of global competition – meaning imports increase when price and costs differ between EU and other regions increase e.g. there is an ongoing anti-dumping case against China.
Investments outside the EU have taken – meaning EU-based companies investing in the likes of Brazil or China. Large European companies now co-own pulp production facilities in South America and paper mills in Russia or China. The key question for the future will be how large a share of the investments it will be. The sector has a strong European base, but is losing competitive positioning. If effort are made the main share of the production could stay in Europe and the European manufacturing base could remain strong. In, for example, German papermaking, the links between the strong base of family owned companies and their local customers is a key asset. Global commodity products such as chemical pulp or copy paper will have a harder time to compete.
Investment decisions will depend on margins, market, regulatory framework, energy and raw material costs, etc. Europe’s waste and renewable energy policies will have a major impact. What is important to realize is that there are only a few producers of pulp and paper technology in the world, selling the same technology to customers around the world. There is no patent issue or technology transfer debate.
CEPI has in the context of ICFPA developed a study on global trends in the pulp and paper industry, which has been brought in as part of the material.

EUROPEAN COMMISSION DIRECTORATE-GENERAL JOINT RESEARCH CENTRE SET-Plan Information System (SETIS)
26
2. Will new types of products be introduced? If yes, what is the timeline of their introduction? What would be the likely impact on energy consumption and GHG emissions?
Paper products are continuously evolving. Where total production is steadily growing, paper grades and products are developing. Research and innovation in PPI focus on one hand to offer new products and solutions to the market and on the other to optimize the use of raw materials (wood and recycled fibre, water, fuels) and side products in the paper production processes.
New products and solutions are being developed in the field of intelligent paper and packaging, building materials (light weight construction materials), batteries, liquid barriers, new materials (biopolymers, nanocellulose, etc.) Timeframe of their introduction to the market is closely connected to the general economical recovery, the needs of the market and funding that will be available for further steps to full commercialization.
Energy improvements can be made in the reduction of steam and power consumption in the mill equipment. There is a lot of potential for improvement in older and smaller plants. This potential is much smaller in modern and large scale mills.
The main impact on the GHG emission would result in more optimized use of raw materials, reuse (recyclability) as well as indirect impacts for example in offering new building materials and isolation for housing and optimized energy production processes.
New products will on the one hand result in lower carbon products, especially when focusing on main commodity markets. More specialized, higher added value and niche products could however also be more energy or carbon intensive, as the complexity of the products increases.
In practice several applications of intelligent paper are being developed5:
- Hot / Cold sensitive paper - Fresh / Old sensitive paper - Intelligent paper memory cards (showing the close collaboration with the ICT
sector)
5 More information can be found in the PPI innovation trends report: http://www.cepi.org/docshare/docs/1/KLGHONDBKJKGIBGHCOLGMLBCQ7UH59V6474OYDUK6CM6/CEPI/docs/DLS/innovation_trends_final-20101116-00009-01-E.pdf

EUROPEAN COMMISSION DIRECTORATE-GENERAL JOINT RESEARCH CENTRE SET-Plan Information System (SETIS)
27
- Pharma DDSi – Intelligent packaging for pharmaceuticals reminding you to take you pills at the certain time
- Nano- and micro-cellulose – providing new solution for barriers in liquid packaging, etc.
- Improved pulp fibres being pressed in different forms for different use having comparable resistance as steel, wood or hard plastics
3. In a ‘business as usual scenario’ with regards to energy efficiency and GHG abatement measures, what are the likely improvements in energy efficiency and GHG emissions expected in 2020, 2030, 2050? Which stage of the manufacturing process and process utilities are prime candidates for improvements? What are the main components that would be improved? At what cost?
3.a In a ‘business as usual scenario’ with regards to energy efficiency and GHG abatement measures, what are the likely improvements in energy efficiency and GHG emissions expected in 2020, 2030, 2050?
When one would follow the data shown by the benchmarks for EU ETS, the IEA technology perspectives, and new BREF, one can see that with incremental improvements, further fuel mix change and current state of the art technology a further improvement could be made. This estimate is based on the difference between the benchmark levels and the shape of benchmark curves with the best performers being at 70% of average and half of the highest values. This, however, requires that all of today’s machines and mills would have to be replaced fully by new ones. As new machines cost hundreds of millions of Euros, this will take time and is dependent on machine age, investment cycles, sector developments and availability of capital. In the timeframe set, 2020 and 2030 are still within existing investment cycles, and 2050 is “only two paper machines away”.
Further fuel mix change not only depends on investments in new boilers, but also in availability and costs of biomass. The part of the sector based on virgin pulp making is reaching optimum biomass use levels, where further improvements will focus on gaining more energy from biomass, not so much replacing the biomass share in the fuel mix, maybe with the exception of lime kilns, where a trend to replace fuel oil with gas and/or biomass is ongoing. Most of the recycled paper based part of the sector is already operated on natural gas and CHP, which could also be called the optimum for this part of the sector, efforts are being made to look into combined operations with waste incineration activities, which can provide heat as well.

EUROPEAN COMMISSION DIRECTORATE-GENERAL JOINT RESEARCH CENTRE SET-Plan Information System (SETIS)
28
For further improvement in line with the 2050 EU target, breakthrough technologies will be needed, as shown In the IEA technology perspectives and a recent study by CE Delft on behalf of CAN Europe.
3.b Which stage of the manufacturing process and process utilities are prime candidates for improvements? What are the main components that would be improved? At what cost?
The first focus area for the sector open for improvements is the boilers (recovery boiler, fluidized bed boiler, bark boiler, etc, CHP). Optimizing the production and conversion of energy, increasing steam and electricity production, optimizing the recovery process, etc. can directly impact on the amount of primary energy needed to produce the heat and electricity needed. Optimizing the fuel mix used to make the energy is part of this discussion as well.
The second focus area lies in the heat consumption - the most energy-intensive part of the paper production process (machine) is the drying of the paper. New technologies are being exploited, some of which are already in test phase but will require further research and developments to reach a wider operational scale. Currently main possibility to reduce the drying energy is to increase the dryness after the press section. The investment cost is several million Euros to rebuild the press section with the shoe press.
Specifically-important for mechanical pulping are improvements which reduce the electricity consumption needed for pulp production, or increase electricity efficiency by recovering the heat from the pulp making for use in papermaking.
4. If this potential is achieved what would be the possible impact of each of the measures identified above on:
a. Fuel savings b. Employment c. CO2 savings
On fuel savings and CO2 savings, CEPI does not have information for specific measures, as the data is not available to us, other than the overall analysis given earlier and the estimate of the 25% improvement potential. We hope more information comes from this workshop as well.
EUROPEAN COMMISSION DIRECTORATE-GENERAL JOINT RESEARCH CENTRE SET-Plan Information System (SETIS)
29
In terms of employment it is currently difficult to provide specific numbers as well. In general, employment in the sector has gradually decreased, as consolidation, productivity gains and optimization have taken place. However, outside the direct employment sector, outsourcing and supporting sectors have grown. One could expect that the better the sector performs in energy and CO2 terms, attracting investments, better the chance of employment remaining in Europe. So to for advanced technologies, as the leading global machine builders in the sector are largely Europe-based. The more we provide new and higher value, the larger the knowledge based economy around the sector will be. Finally, the biomass base in the sector increases the regional and rural employment impact, as the logistical value chain towards the forest is a decisive factor in employment in many regions.
An estimate on CO2 savings has been made in the CAN Europe study and IEA work on technology perspectives, but both depend on breakthrough technologies as well.
III. Maximising efficiency potential
1. Are there any advanced technologies and concepts that are currently not exploited due to high phase-in or capital replacement costs, which however, could improve the energy efficiency and GHG emissions in your sector? What would be the cost of implementing such measures?
A. The bio-route. The most quoted route for the part of the sector, that includes virgin pulp making on site, is the route towards integrated biorefinery complexes producing bio-pulp, bio-paper, bio-chemicals, bio fuels and bio-energy, possibly combined with BIO-Carbon Capture and Storage (bio-CCS). Part of this route is the further development of gasification of black liquor. Lignoboost is also mentioned as a technology in this pathway.
- Biorefinery. There is a number of large programs, also under FP7, starting up on developing the biorefinery complex and related technologies. Work is currently undertaken on further developments of second generation lignocellulosic biofuels. A first large scale bio-DME plant in connection to a pulp mill is under construction in Sweden. Biorefinery work is not only limited to virgin fibre product production,
EUROPEAN COMMISSION DIRECTORATE-GENERAL JOINT RESEARCH CENTRE SET-Plan Information System (SETIS)
30
but also takes place in combination with recycled fibre based mills and agro and food industries.
Picture 1: Biorefinery concept in PPI
- Black liquor gasification. The main goal is to produce a combustible mixture of raw gases as well as separate out the inorganic pulping chemicals for recycling for the pulping process. Key advantages of the process can be translated in the efficient use of resources through the combination of the cycles (gas and steam turbine) up to 30% power efficiency in comparison to the conventional boilers reaching max of 12-13%. (BREF, 2001). At the same time the air emissions remain very low.
- Lignoboost. Lignoboost is a complete system that extracts lignin, a component of wood, form kraft black liquor. In the lignoboost process lignin appears as an outstanding biofuel with a high heat value.
- Extracted lignin can be used as biofuel, replacing coal and oil. It can be used also in the mill as fuel in a power boiler or to replace fossil fuels used in the lime kiln. Lignoboost process extracts lignin which is a renewable substance and an excellent example of efficient use of the resources, opening up many more option in further exploration in production of new innovative chemicals (biofuels), carbon fibers, etc.

EUROPEAN COMMISSION DIRECTORATE-GENERAL JOINT RESEARCH CENTRE SET-Plan Information System (SETIS)
31
B. New innovative drying technologies. These have been in study reports for a decade or more (see for example de Beer et al). They have, however, still not materialized in a large scale or even at laboratory stage. Research seems to be in standstill. A first installation for steam impingement drying now is in place in Portugal. Technologies which have not been further used so far are Impulse Drying and the so-called ‘Condebelt’ process. Impulse technology tries to combine pressing and drying into a single compact process. In the Condebelt drying process the paper web coming from the press section is dried between two steel belts instead of traditional steam cylinders.
• Impulse technology for dewatering of paper: Different concepts have been investigated and tried under various names such as hot pressing or pressure drying. The development work is still young. Many obstacles have been met in the development work and the technology has not yet resulted in full-scale implementation.
• Condebelt process: There seems to be one Condebelt drying process in commercial operation in the EU. It has been running since May 1996 at Stora Enso´s Pankakowski mill, Finland, producing core board, linerboard and special boards. The technology has however not been replicated since then.
C. Mechanical pulp. There is ongoing work into studies to optimise the production of mechanical pulp focusing mainly on the wood yield preparation and more efficient refiner plates (less energy consumption at the same productivity levels).
D. OTHERS TO BE ADDED IN THE WORKSHOP.
2. If these technologies are not yet commercialized, what is the scale of research, development and demonstration that is required to accelerate their development?
3. If already commercially available, what are the main barriers to their implementation? What incentives and efforts are needed to deploy them in your sector?
TO BE COMPLETED AT THE WORKSHOP

EUROPEAN COMMISSION DIRECTORATE-GENERAL JOINT RESEARCH CENTRE SET-Plan Information System (SETIS)
32
So far, this is unclear and needs to be investigated further. We expect most of the technologies related to biorefinery developments to be at or before the “valley of death” in terms of R&D, requiring large investments to jump from pilot plant to full scale application. A number of these investments bring financial risks that mills cannot take in the current economy and for which help is needed. Further, several large scale technologies are competing in the same field, where it is not yet clear which will be the winning technology. First movers have to be found.
For those commercially-available drying technologies the market seems to doubt their application so far, as so few new machines have been installed. Next to a cost factor, trust or reliability seems to be an issue.
Governments could conduct further research and dictate to what extent bio-refinery could be possible in the recycled paper sector and/or in combination with the RCF mills and other sectors such as food or agro.
4. If the maximum potential in energy efficiency improvement and GHG emissions reduction are realized, what would be the impact of each of the measures/incentives identified above on:
a. Fuel savings b. Employment c. CO2 savings
Estimates of savings potentials are not available at CEPI but have been made by IEA in the technology perspectives and the CAN Europe Study by CE. The most far reaching scenarios seem to indicate that there are in the long term larger potentials, which could result in the sector becoming a net carbon sink, with the bio-ccs side of the sector covering the remaining emissions in the rest of the sector. These estimates however seem to be very rudimentary and based on very basic models. For the more specific technologies such as the mentioned impulse drying or condebelt drying savings of 20-25% of heat consumption have been mentioned but not proven.

EUROPEAN COMMISSION DIRECTORATE-GENERAL JOINT RESEARCH CENTRE SET-Plan Information System (SETIS)
33
6.
7. IV. THE CONTRIBUTION OF THE SET-PLAN
(1) Which are the key measures and incentives that should be undertaken at the EU level in order to maximise the development and uptake of energy efficiency and GHG emissions abatement technologies by your sector?
To be discussed and identified in the workshop and added afterwards.
Main elements:
A. Favourable Investment frameworks B. Sector dedicated R&D Programmes. C. Large scale pilot projects/ up scaling projects. D. Technology scans/roadmaps? E. See for example the Canadian programme.

![TELEKOM MALAYSIA BERHAD · TELEKOM MALAYSIA BERHAD [128740-P] ... Dato’ Ir Abdul Rahim Abu Bakar 9. Dato’ Ibrahim Marsidi 10. Mr Davide Giacomo Federico Benello @ David Benello](https://static.fdocuments.net/doc/165x107/5ac62be47f8b9a12608e0315/telekom-malaysia-berhad-malaysia-berhad-128740-p-dato-ir-abdul-rahim-abu.jpg)


