Final Report for 'Rapid Arson Sample Analysis Using … DART Final Report.pdf · Rapid Arson Sample...
24
Rapid Arson Sample Analysis Using DART Mass Spectrometry Final Report January 26, 2012 John McClelland, Principal Investigator Project Personnel: Roger W. Jones and Tonu Reinot Ames Laboratory–USDOE Iowa State University
Transcript of Final Report for 'Rapid Arson Sample Analysis Using … DART Final Report.pdf · Rapid Arson Sample...
Rapid Arson Sample Analysis Using DART Mass Spectrometry
Final Report January 26, 2012
John McClelland, Principal Investigator Project Personnel: Roger W. Jones and Tonu Reinot
Ames Laboratory–USDOE
Iowa State University
Rapid Arson Sample Analysis using DART Mass Spectrometry MFRC Final Report
- 2 -
Table of Contents
Project Description..................................................................................................................... 3
Project Objectives ...................................................................................................................... 3
Current Status............................................................................................................................. 4
Procedures.................................................................................................................................. 5
Results........................................................................................................................................ 8
Future Work ............................................................................................................................... 22
Publications and Presentations................................................................................................... 22
References.................................................................................................................................. 22
Rapid Arson Sample Analysis using DART Mass Spectrometry MFRC Final Report
- 3 -
Project Description
Gas chromatography/mass spectrometry (GC/MS) is commonly used to identify
accelerants in fire debris,1-5 but it is not ideal, requiring substantial time for sample analysis and
data interpretation. GC/MS usually has sufficient sensitivity and specificity, but it can be time
consuming because gas chromatography (GC) is slow, and it generates a very large data set,
demanding substantial analyst time.3,6 Dropping the GC step while maintaining specificity and
sensitivity would greatly speed up the analysis and substantially reduce data-analysis complexity.
This project investigated applying a new, faster mass spectrometry (MS) method for
arson analysis called direct analysis in real time (DART),7,8 with the goal of developing DART-
MS as a faster, more efficient alternative to GC/MS. DART-MS has the speed of a screening
technique and the precision of GC/MS. The abilities of DART-MS to detect small amounts of
accelerants on common substrates9 and to detect accelerants after the substrate has been
burned10,11 have already been demonstrated by others prior to this project. This project
demonstrated that accelerants could still be identified when the GC step was eliminated.
Project Objectives
DART-MS has the necessary sensitivity, but its accuracy, reliability, and validity for a
wide range of accelerants and substrates had not yet been demonstrated prior to this project. The
objectives of the project were
1. collecting DART-MS spectra of vapors from the major classes of ignitable liquids,
2. collecting DART-MS spectra of vapors from a common fire-debris matrix after being
burned with and without accelerants, and
3. demonstrating the ability to identify the accelerant used in burning a sample.
Rapid Arson Sample Analysis using DART Mass Spectrometry MFRC Final Report
- 4 -
Current Status
The project ran from February through December 2011 and is now complete. During the
project, the following items were accomplished:
1. DART mass spectra of vapors from 11 different accelerants were collected and
assembled into a data library.
2. Carpet and padding samples treated with eight different accelerants as well as an
untreated (i.e., accelerant free) sample were burned in a reproducible manner, and
DART mass spectra of vapors from the unaged, burned material were acquired.
3. The burned-sample DART mass spectra of Item 2 above were searched against the
data library of pure-accelerant-vapor spectra, and all but one pair of accelerants
(mineral spirits and paint thinner) matched with the correct burned samples.
4. Samples of several accelerants were allowed to evaporate for extended periods to
produce aged samples. The mass spectra of their vapors were then recorded.
5. Several of the samples in Item 2 were re-examined after they had aged for about five
months in closed containers. It was found that the headspace vapors from the
samples showed aging in a similar manner to the partially evaporated accelerants
in Item 4, despite the samples being in sealed jars.
6. Carpet and padding samples burned with gasoline accelerant were left open to the air
and tested over a period of nine days to assess the effects of aging prior to a
sample being gathered at an arson site. The changes were much greater than
those observed for sealed samples, but they were comparable to those observed
when gasoline was allowed to evaporate at room temperature, as in Item 4.
Rapid Arson Sample Analysis using DART Mass Spectrometry MFRC Final Report
- 5 -
Procedures
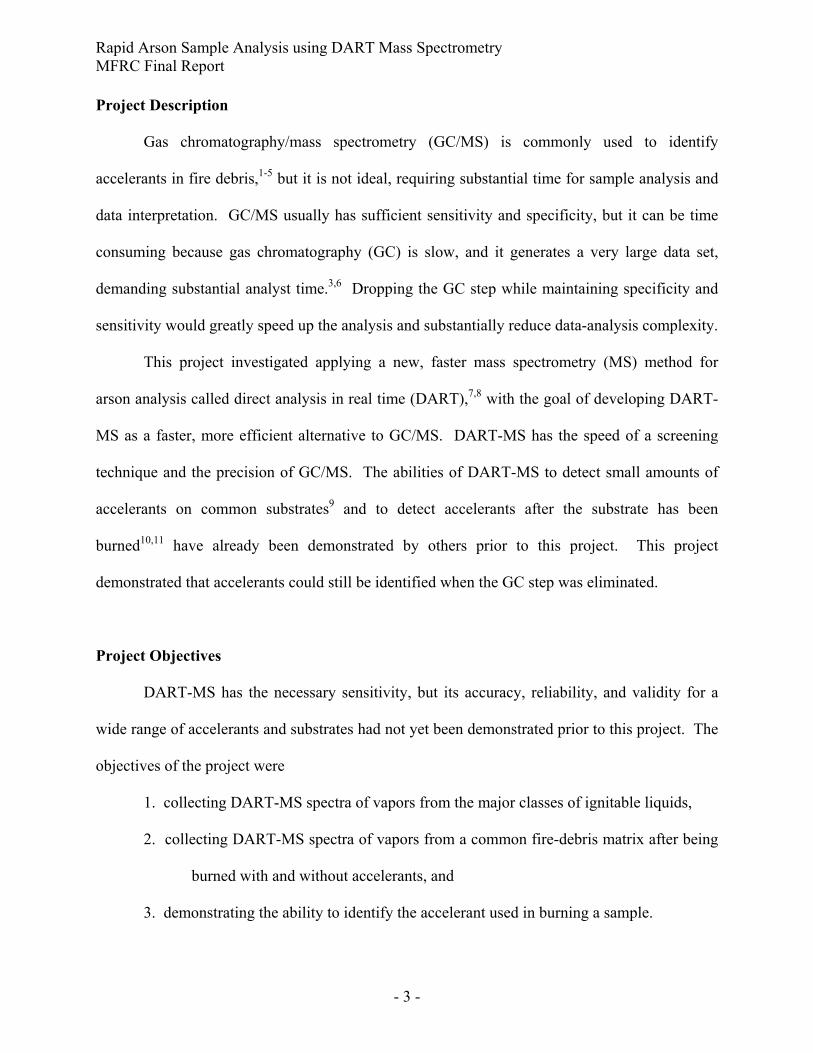
The DART source shown in Figure 1 ionizes the sample in the open air using a stream of
gas containing electronically excited atoms or molecules.7 Data acquisition usually takes less
than one minute. DART can yield unambiguous molecular formulas when paired with a high-
resolution mass spectrometer, as in our laboratory, because the DART ionization process is
gentle, often resulting in intact molecules instead of molecular fragments. Most commonly, a
sample molecule, M, becomes either the ion [M + H]+ by proton addition or the ion [M – H]+ by
hydride abstraction. This reduction in fragments simplifies the spectra of mixtures and thereby
simplifies their analysis.
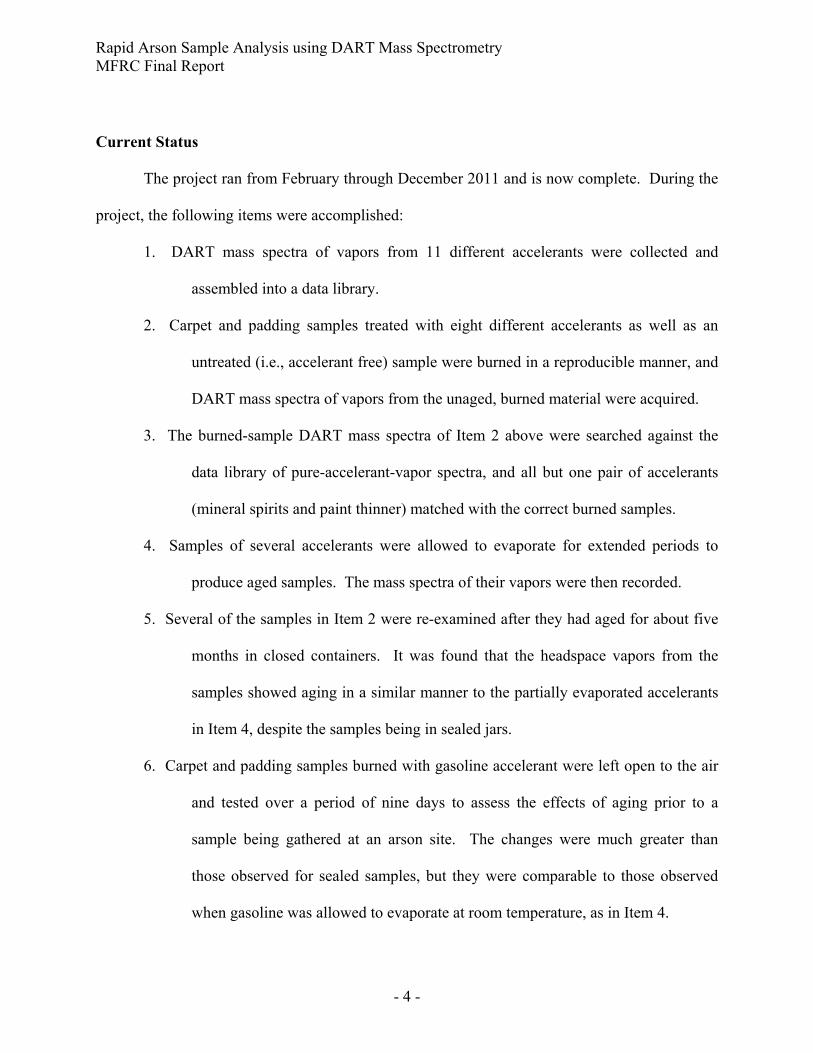
Headspace vapors from the accelerants and from burned samples were drawn into a
disposable syringe, and then the syringe was fitted with a 6-inch-long needle and placed in a
syringe pump to reproducibly inject the vapors into the DART-MS open-air sampling gap, as
shown in Figure 2. The pump injected vapor at 86 mL/hr (the maximum rate of the pump), and
data acquisition normally took less than one minute. The observed spectra are somewhat
dependent on the temperature of the helium gas coming from the ion source, so initially, data for
the unaged accelerants were recorded at nominal helium temperatures of both 200 and 400 °C. It
Figure 1. Schematic of the DART ion source. The discharge creates exicted helium atoms (metastables), which ionize the sample in the sample gap. Helium ions are blocked from there by electrodes 1 and 2. The ionized sample molecules are sucked into the spectrometer inlet for analysis. Image from Wikipedia, with acknowledgement to JEOL USA, Inc.
Rapid Arson Sample Analysis using DART Mass Spectrometry MFRC Final Report
- 6 -
was later found that the headspace vapors from the burned samples were well sampled at the
lower temperature, so the 400 °C sampling was discontinued.
Table 1: Accelerant Vapors Included in the Database
Charcoal starter Mineral spirits, odorless Coleman camp fuel Mineral spirits, low odor Diesel fuel Paint thinner Gasoline, regular Turpenoid Gasoline, 2-stroke-engine (with oil) Turpentine Kerosene WD 40
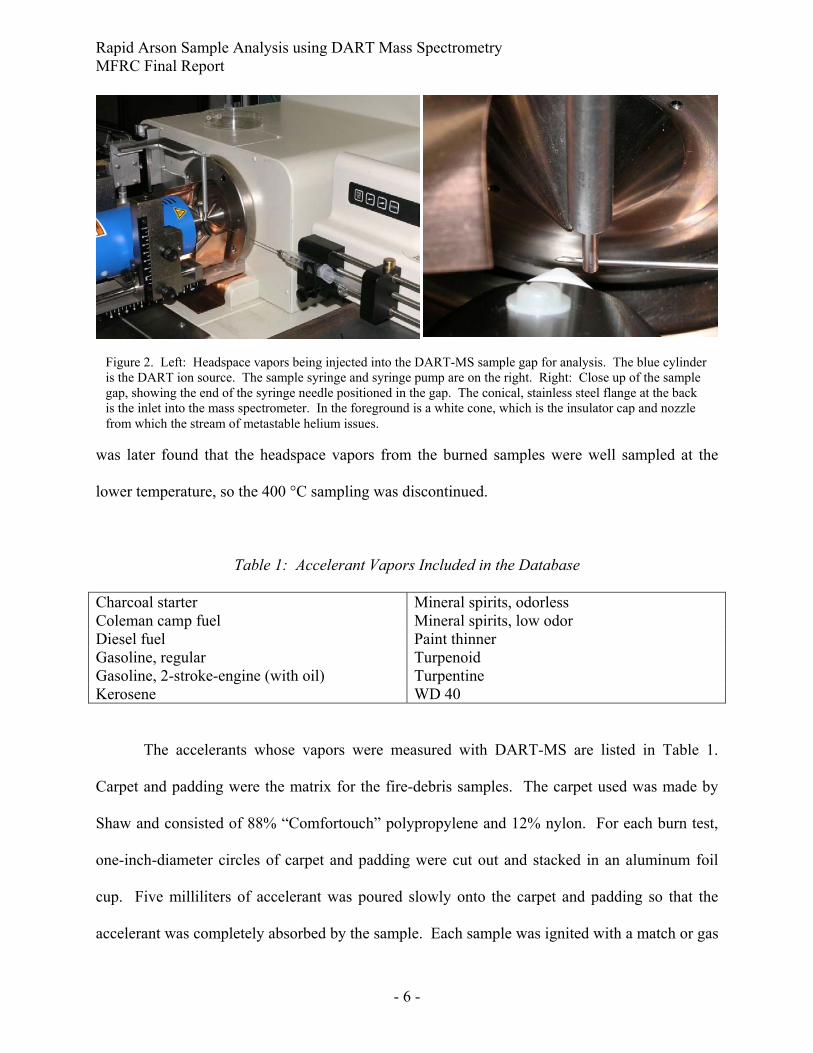
The accelerants whose vapors were measured with DART-MS are listed in Table 1.
Carpet and padding were the matrix for the fire-debris samples. The carpet used was made by
Shaw and consisted of 88% “Comfortouch” polypropylene and 12% nylon. For each burn test,
one-inch-diameter circles of carpet and padding were cut out and stacked in an aluminum foil
cup. Five milliliters of accelerant was poured slowly onto the carpet and padding so that the
accelerant was completely absorbed by the sample. Each sample was ignited with a match or gas
Figure 2. Left: Headspace vapors being injected into the DART-MS sample gap for analysis. The blue cylinder is the DART ion source. The sample syringe and syringe pump are on the right. Right: Close up of the sample gap, showing the end of the syringe needle positioned in the gap. The conical, stainless steel flange at the back is the inlet into the mass spectrometer. In the foreground is a white cone, which is the insulator cap and nozzle from which the stream of metastable helium issues.
Rapid Arson Sample Analysis using DART Mass Spectrometry MFRC Final Report
- 7 -
torch, and the burn time was recorded. At the end of the burn, the fire was smothered by placing
a glass vial upside down over the foil cup.
For each burn sample that was not to be left exposed to the air to age, the foil cup and its
contents were sealed in a 2 oz glass vial with a tetraflurorethylene/silicone septum in its lid. At
the time of analysis, vapors were withdrawn from the sealed vial through the septum with a
syringe, and the analysis was done as shown in Figure 2 and described above for the fresh-
accelerant vapors. The headspaces of samples burned with eight different accelerants were
analyzed fresh (i.e., within 24 hours of the burn). Samples from three-minute burns for four of
these accelerants (Coleman camp fuel, low-odor mineral spirits, turpentine, and charcoal starter)
were then kept in their sealed vials and re-analyzed after approximately five months of storage to
test for aging while sealed.
Samples burned with gasoline were aged by being left exposed to the air immediately
following the burn. They were put in open 2 oz glass vials in a laboratory hood. Their
headspace vapors were analyzed repeatedly over a period of nine days. One to four hours before
each analysis, the samples were sealed in their vials so that headspace vapors could build up.
After each analysis, the vials were re-opened and placed back in the hood to continue aging.
Samples of the five accelerants involved in the burned-sample-aging tests (i.e., regular
gasoline, Coleman camp fuel, low-odor mineral spirits, turpentine, and charcoal starter) were
aged for comparison with the burn-sample vapors. Samples of each of these accelerants were
placed in open bottles in a laboratory hood and allowed to evaporate until the liquid volume
reached 50% of its initial volume. Additional samples were left open for up to 60 days in an
attempt to also reach 25% and 10% of the initial volume, but only gasoline and camp fuel
reached both of these goals. Charcoal starter reached the 25% mark. The volumes of the other

Rapid Arson Sample Analysis using DART Mass Spectrometry MFRC Final Report
- 8 -
samples effectively stopped decreasing over time before they reached the 25% and/or 10% goals.
For comparison with the open-air-aged gasoline-burn samples, another gasoline sample was aged
until its volume stopped changing, at which point it had reached 6% of its initial volume.
Results
As described above, DART mass spectra generally consist of protonated molecular ions,
[M + H]+, or ions produced by hydride abstraction, [M – H]+, and little fragmentation occurs.
Alkanes have a low affinity for acquiring a proton, so they are observed principally by the
hydride-abstraction route.12 Figure 3, the mass spectrum of gasoline, illustrates this. Ions of the
form CnH2n+1+ come mostly from hydride abstraction from alkanes. Other formulas arise
principally from protonation of alkenes and cyclic species.
m/z40 60 80 100 120 140 160
Sign
al
0
50000
100000
150000
200000
C3H
7+
C4H
9+
C3H
9O+
C5H
11+
C6H
13+
C7H
11+C
5H10
+
C6H
11+ C
6H12
+C
6H9+
C7H
13+
C7H
15+
C8H
10+
C8H
15+
C9H
17+
C10
H19
+
C11
H21
+
Figure 3. DART mass spectrum of the headspace vapors from unaged regular gasoline. Most of the major peaks result from proton addition to or hydride abstraction from the neutral molecules in the sample.
Rapid Arson Sample Analysis using DART Mass Spectrometry MFRC Final Report
- 9 -
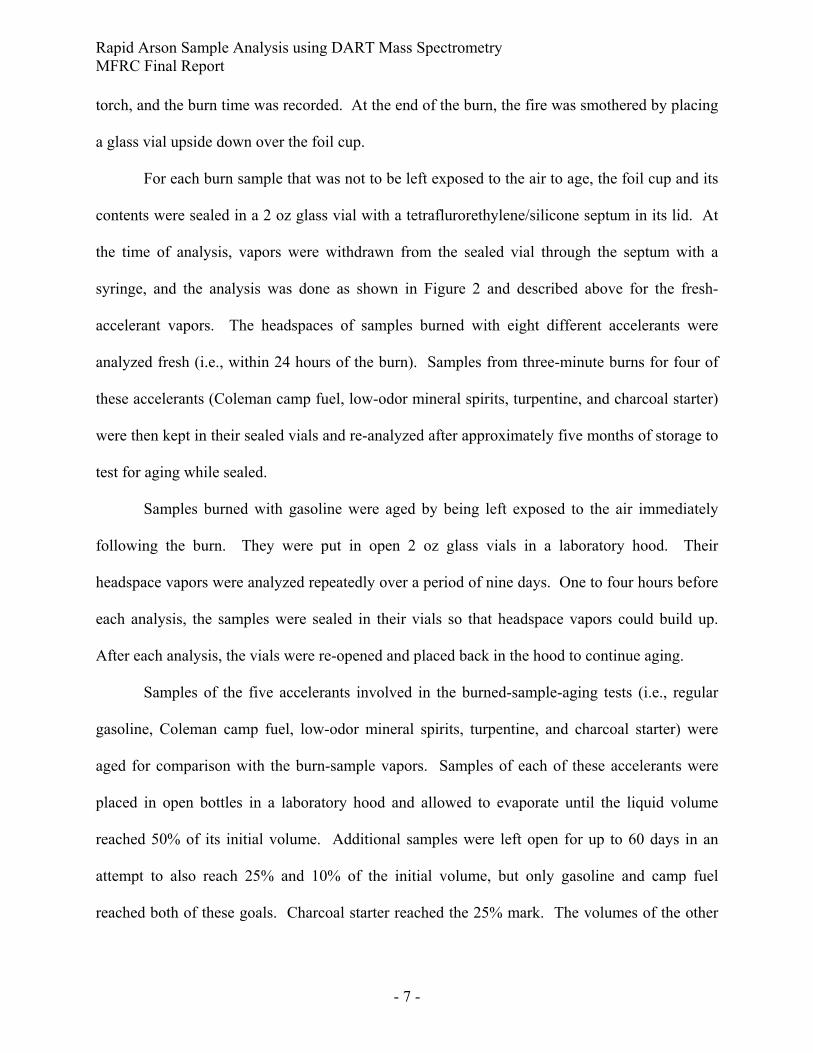
The mass spectra of accelerant vapors
generally differ substantially from one another, as
illustrated in Figure 4, so it is usually not difficult
to differentiate them. Materials sold under different
names may, however, have very similar or even
identical compositions and will therefore produce
very similar spectra. We found one such pair of
twins sold under different names. Figure 5 shows
the spectra for the odorless mineral spirits and the
paint thinner in our collection. These happen to
have the same brand name (Klean-Strip), and they
appear to be very similar in composition.
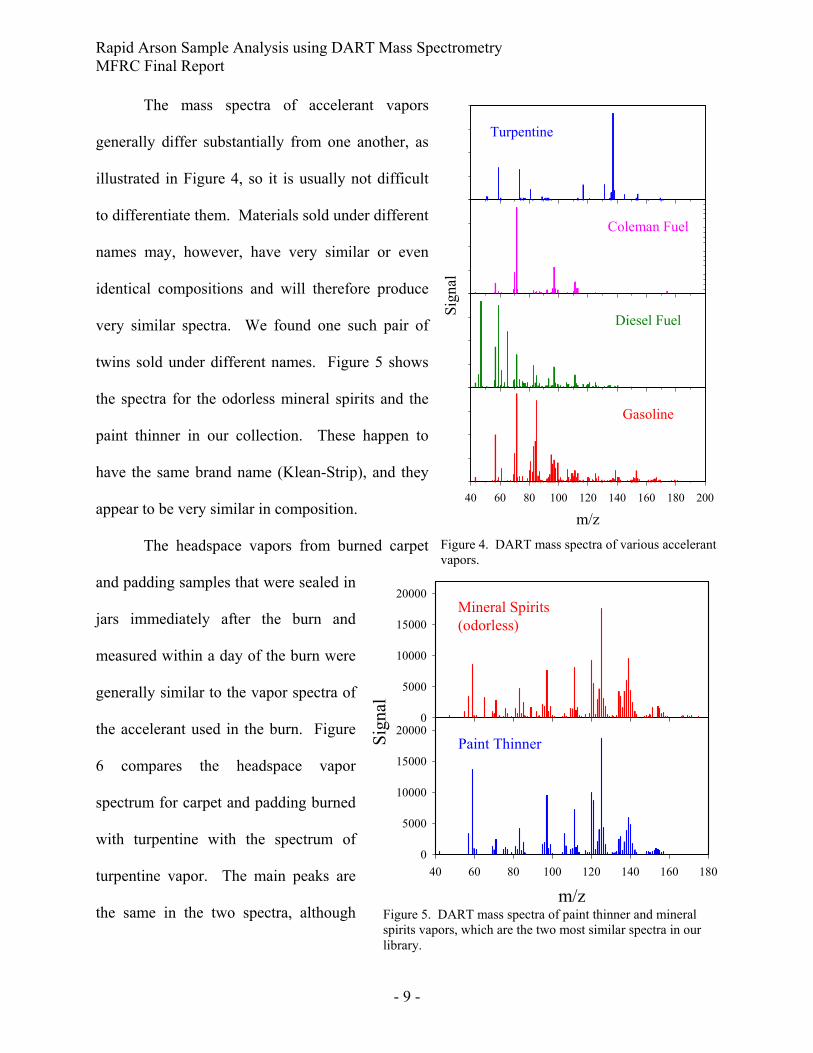
The headspace vapors from burned carpet
and padding samples that were sealed in
jars immediately after the burn and
measured within a day of the burn were
generally similar to the vapor spectra of
the accelerant used in the burn. Figure
6 compares the headspace vapor
spectrum for carpet and padding burned
with turpentine with the spectrum of
turpentine vapor. The main peaks are
the same in the two spectra, although
m/z40 60 80 100 120 140 160 180 200
Sign
al
Turpentine
Coleman Fuel
Diesel Fuel
Gasoline
Figure 4. DART mass spectra of various accelerant vapors.
m/z40 60 80 100 120 140 160 180
0
5000
10000
15000
20000Sign
al
0
5000
10000
15000
20000
Paint Thinner
Mineral Spirits(odorless)
Figure 5. DART mass spectra of paint thinner and mineral spirits vapors, which are the two most similar spectra in our library.
Rapid Arson Sample Analysis using DART Mass Spectrometry MFRC Final Report
- 10 -
their relative sizes differ
somewhat.
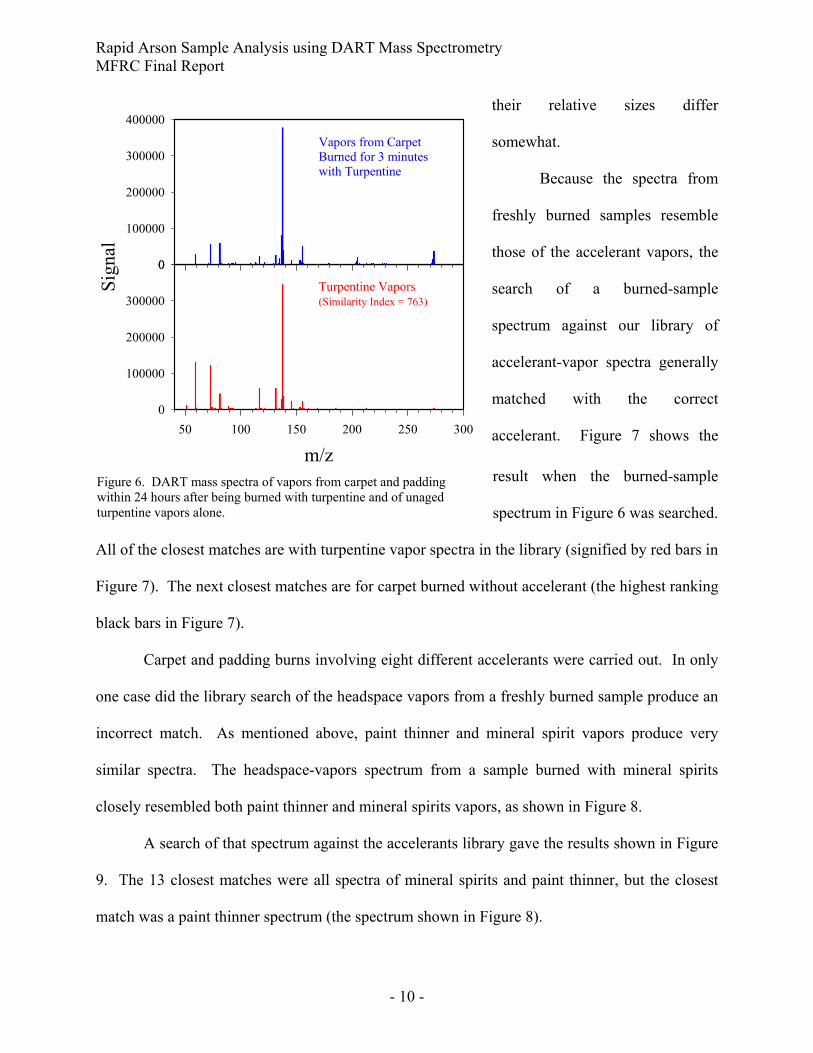
Because the spectra from
freshly burned samples resemble
those of the accelerant vapors, the
search of a burned-sample
spectrum against our library of
accelerant-vapor spectra generally
matched with the correct
accelerant. Figure 7 shows the
result when the burned-sample
spectrum in Figure 6 was searched.
All of the closest matches are with turpentine vapor spectra in the library (signified by red bars in
Figure 7). The next closest matches are for carpet burned without accelerant (the highest ranking
black bars in Figure 7).
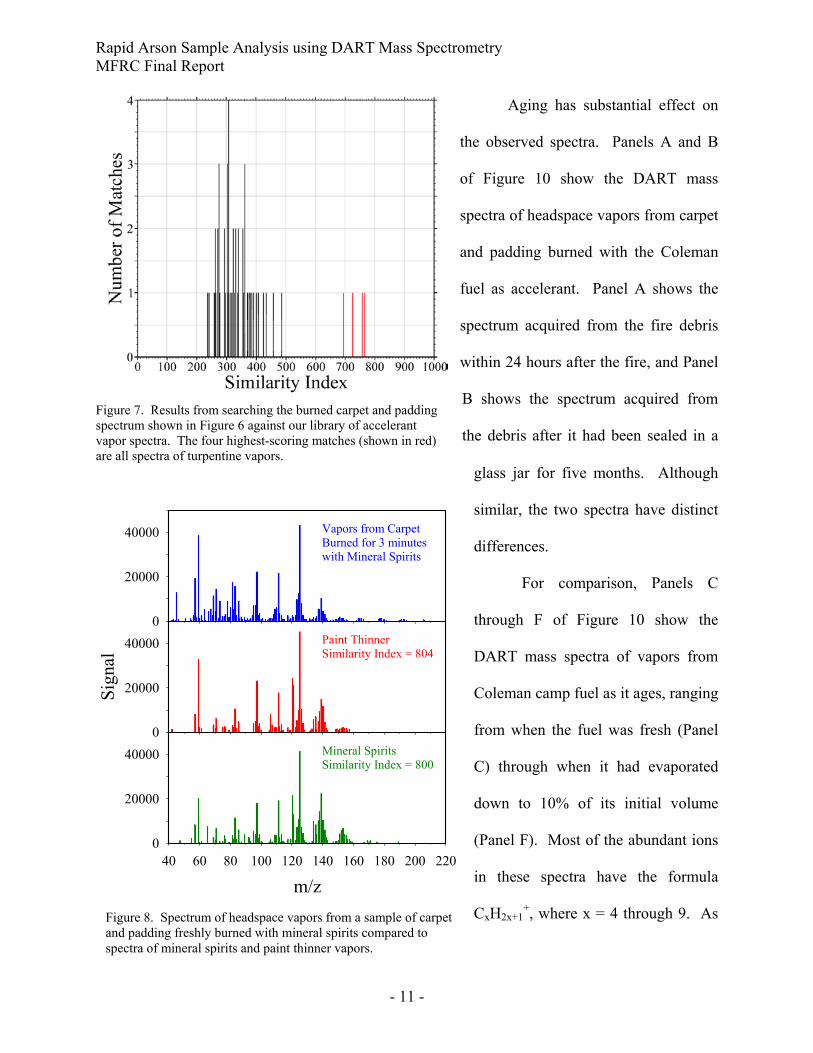
Carpet and padding burns involving eight different accelerants were carried out. In only
one case did the library search of the headspace vapors from a freshly burned sample produce an
incorrect match. As mentioned above, paint thinner and mineral spirit vapors produce very
similar spectra. The headspace-vapors spectrum from a sample burned with mineral spirits
closely resembled both paint thinner and mineral spirits vapors, as shown in Figure 8.
A search of that spectrum against the accelerants library gave the results shown in Figure
9. The 13 closest matches were all spectra of mineral spirits and paint thinner, but the closest
match was a paint thinner spectrum (the spectrum shown in Figure 8).
m/z50 100 150 200 250 300
0
100000
200000
300000
400000
Sign
al
0
100000
200000
300000
400000
Vapors from CarpetBurned for 3 minuteswith Turpentine
Turpentine Vapors(Similarity Index = 763)
Figure 6. DART mass spectra of vapors from carpet and padding within 24 hours after being burned with turpentine and of unaged turpentine vapors alone.
Rapid Arson Sample Analysis using DART Mass Spectrometry MFRC Final Report
- 11 -
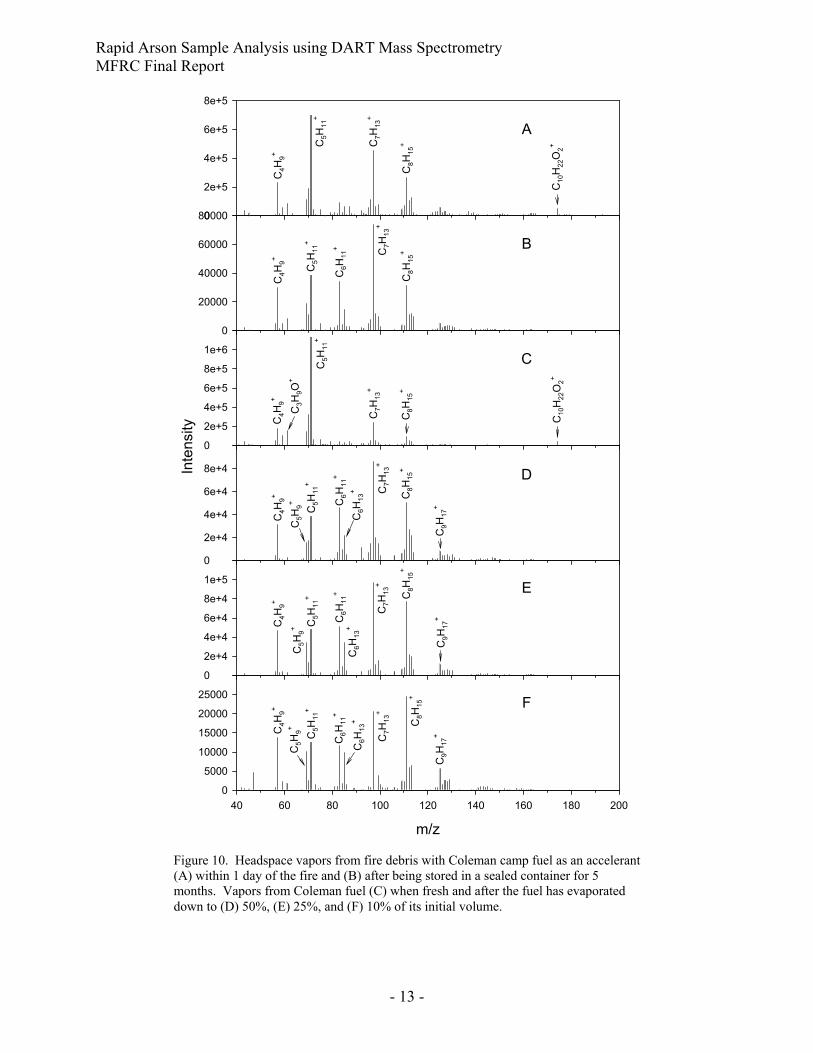
Aging has substantial effect on
the observed spectra. Panels A and B
of Figure 10 show the DART mass
spectra of headspace vapors from carpet
and padding burned with the Coleman
fuel as accelerant. Panel A shows the
spectrum acquired from the fire debris
within 24 hours after the fire, and Panel
B shows the spectrum acquired from
the debris after it had been sealed in a
glass jar for five months. Although
similar, the two spectra have distinct
differences.
For comparison, Panels C
through F of Figure 10 show the
DART mass spectra of vapors from
Coleman camp fuel as it ages, ranging
from when the fuel was fresh (Panel
C) through when it had evaporated
down to 10% of its initial volume
(Panel F). Most of the abundant ions
in these spectra have the formula
CxH2x+1+, where x = 4 through 9. As Figure 8. Spectrum of headspace vapors from a sample of carpet
and padding freshly burned with mineral spirits compared to spectra of mineral spirits and paint thinner vapors.
m/z40 60 80 100 120 140 160 180 200 220
0
20000
40000
Sign
al
0
20000
400000
20000
40000 Vapors from CarpetBurned for 3 minuteswith Mineral Spirits
Paint ThinnerSimilarity Index = 804
Mineral SpiritsSimilarity Index = 800
Figure 7. Results from searching the burned carpet and padding spectrum shown in Figure 6 against our library of accelerant vapor spectra. The four highest-scoring matches (shown in red) are all spectra of turpentine vapors.

Rapid Arson Sample Analysis using DART Mass Spectrometry MFRC Final Report
- 12 -
noted above, alkanes tend to ionize by removal of H-, so their ions have one less hydrogen atom
than the neutral molecules.12 The CxH2x-1+ ions can therefore arise from either hydrogen
abstraction from the alkane CxH2x+2 or protonation of the alkene CxH2x. Coleman camp fuel
consists principally of pentane, cyclohexane, heptane, octane, and nonane,13 so the CxH2x+1+ ions
must come from hydrogen abstraction from the alkanes. The spectrum from fresh Coleman fuel
(Panel C) is consistent with this composition. The base peak is C5H11+ from pentane (vapor
pressure = 451 torr), the most volatile of the five main fuel components, and the C6 species are
relatively weak, consistent with the lower volatility of cycloalkanes compared to n-alkanes. Of
course, the unknown relative abundances of the fuel components also affect their relative
strengths in the spectra, but volatility is the principal factor affecting how the spectrum changes
as the accelerant ages. As the fuel ages, the more volatile components are preferentially lost, so
the less volatile components
come to dominate the
spectrum. When 50% of the
liquid has evaporated (Panel
D), C7H13+ from heptane
(vapor pressure = 42 torr) is the
base peak, and the C6 species
are relatively stronger. When
only 10% of the liquid remains
(Panel F), C8H15+ from octane
(vapor pressure = 14 torr) is the
base peak. Figure 9. Search results for the spectrum in Figure 8 of a carpet and padding sample burned with mineral spirits. Red = mineral spirits matches, blue = paint thinner matches.
Rapid Arson Sample Analysis using DART Mass Spectrometry MFRC Final Report
- 13 -
m/z
40 60 80 100 120 140 160 180 2000
5000
10000
15000
20000
25000
30000
F
0
2e+4
4e+4
6e+4
8e+4
1e+5
1e+5
E
0
2e+4
4e+4
6e+4
8e+4
1e+5
D
0
2e+5
4e+5
6e+5
8e+5
1e+6
1e+6
CC7H
13+
C8H
15+
C6H
11+
C5H
11+
C4H
9+
C6H
13+
C5H
9+
C9H
17+
C7H
13+
C8H
15+
C6H
11+
C5H
11+
C4H
9+
C6H
13+
C5H
9+
C9H
17+
C7H
13+
C8H
15+
C6H
11+
C5H
11+
C4H
9+
C6H
13+
C5H
9+
C9H
17+
C7H
13+
C8H
15+
C5H
11+
C4H
9+
C3H
9O+
0
20000
40000
60000
80000
C4H
9+
C8H
15+C7H
13+
C6H
11+
C5H
11+ B
0
2e+5
4e+5
6e+5
8e+5
A
C4H
9+
C5H
11+
C7H
13+
C8H
15+
Intensity
C10H22O2+
C10H22O2+
Figure 10. Headspace vapors from fire debris with Coleman camp fuel as an accelerant (A) within 1 day of the fire and (B) after being stored in a sealed container for 5 months. Vapors from Coleman fuel (C) when fresh and after the fuel has evaporated down to (D) 50%, (E) 25%, and (F) 10% of its initial volume.

Rapid Arson Sample Analysis using DART Mass Spectrometry MFRC Final Report
- 14 -
The spectrum in Panel A of Figure 10 from the fresh debris is most similar to that of the
unaged-accelerant vapors in Panel C. C5H11+ dominates both spectra, and the C6 peaks are small.
The spectrum in Panel B from the five-month-old debris, on the other hand, most closely
m/z
40 60 80 100 120 140 160 180 2000
2000
4000
6000
80000
40000
80000
120000
0
10000
20000
30000
40000
50000
D
C
B
0
50000
100000
150000
200000
250000
A
C3H
7O+
C3H
8O2+
C6H
13O2+
C4H
9+
C3H
7O+ C5H
11+
C6H
13+
C7H
15+
C8H
17+
C8H
17O+ C8H
17O2+
C10H21+
C11H23O+
C4H
9+
C3H
7O+
C5H
11+
C6H
13+
C7H
15+
C8H
17+
C9H
19+
C8H
17O2+
C4H
9+
C3H
7O+
C5H
11+
C6H
13+
C6H
13O2+
Intensity
Figure 11. Headspace vapors from fire debris with charcoal starter used as an accelerant (A) within 1 day of the fire and (B) after sealed storage for 5 months after the fire. Vapors from the charcoal starter (C) when fresh and (D) after it has evaporated down to 50% of its initial volume.

Rapid Arson Sample Analysis using DART Mass Spectrometry MFRC Final Report
- 15 -
resembles that of the vapors from the accelerant aged to 50% of its initial volume. Clearly some
aging has occurred to the fire-debris sample even though it was stored in a sealed jar.
Figure 11 shows spectra from Wal Mart charcoal starter. Panels C and D are from vapors
of the starter when fresh and when evaporated to 50% of its initial volume. The differences
between the two are substantial. The three species that dominate the spectrum of the fresh starter
are all oxygenated species, and only one of those is above 80 m/z. At the 50%-volume point,
these species are greatly reduced and numerous hydrocarbons dominate the spectrum, with most
of the observed species above 80 m/z. The headspace spectra from the fire debris involving the
starter fluid in Panels A and B show similar, if less drastic, differences. The spectrum from the
five-month-old debris in Panel B is quite similar to that from the 50%-volume accelerant. The
spectrum of the fresh debris in Panel A is most similar to the spectrum of the fresh-accelerant
vapors in Panel C, but it contains additional species that are more prominent in the 50%-volume
spectrum, so it is intermediate between the two.
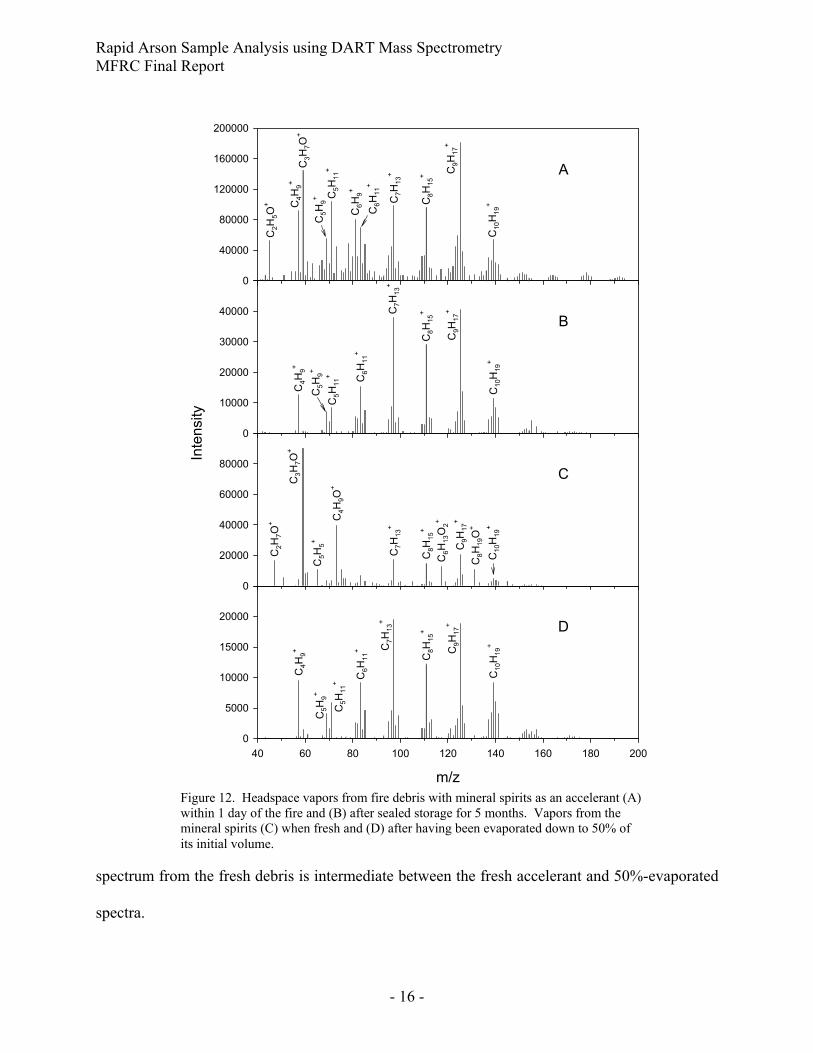
Figure 12 presents spectra from low-odor mineral spirits. Panels C and D are spectra of
the mineral spirits vapors when the spirits are fresh and after being aged to 50% of its initial
volume. Although the mineral spirits and charcoal starter spectra are quite different, the changes
from aging the accelerants are similar. The fresh-mineral-spirits spectrum is dominated by
oxygenated species and the largest peaks are below 80 m/z, but the aged-spirits spectrum is
dominated by hydrocarbons above 80 m/z. The fire-debris spectra involving mineral spirits as an
accelerant also show differences reminiscent of the charcoal starter spectra. The spectrum from
the five-month-old debris in Panel B resembles the 50%-evaporated spirits spectrum, and the
Rapid Arson Sample Analysis using DART Mass Spectrometry MFRC Final Report
- 16 -
spectrum from the fresh debris is intermediate between the fresh accelerant and 50%-evaporated
spectra.
m/z
40 60 80 100 120 140 160 180 2000
5000
10000
15000
20000
250000
20000
40000
60000
80000
1000000
10000
20000
30000
40000
500000
40000
80000
120000
160000
200000
D
C
A
B
C2H
5O+ C4H
9+
C3H
7O+
C5H
9+ C5H
11+
C6H
9+
C6H
11+
C7H
13+
C8H
15+ C
9H17+
C10H19+
C4H
9+
C5H
11+ C6H
11+
C7H
13+
C8H
15+
C9H
17+
C10H19+
C2H
7O+
C3H
7O+
C4H
9O+
C7H
13+
C8H
15+
C9H
17+
C10H19+
C5H
5+
C6H
13O2+
C8H
19O+
C4H
9+
C5H
11+
C7H
13+
C8H
15+
C9H
17+
C10H19+
C5H
9+
C6H
11+
C5H
9+
Intensity
Figure 12. Headspace vapors from fire debris with mineral spirits as an accelerant (A) within 1 day of the fire and (B) after sealed storage for 5 months. Vapors from the mineral spirits (C) when fresh and (D) after having been evaporated down to 50% of its initial volume.
Rapid Arson Sample Analysis using DART Mass Spectrometry MFRC Final Report
- 17 -
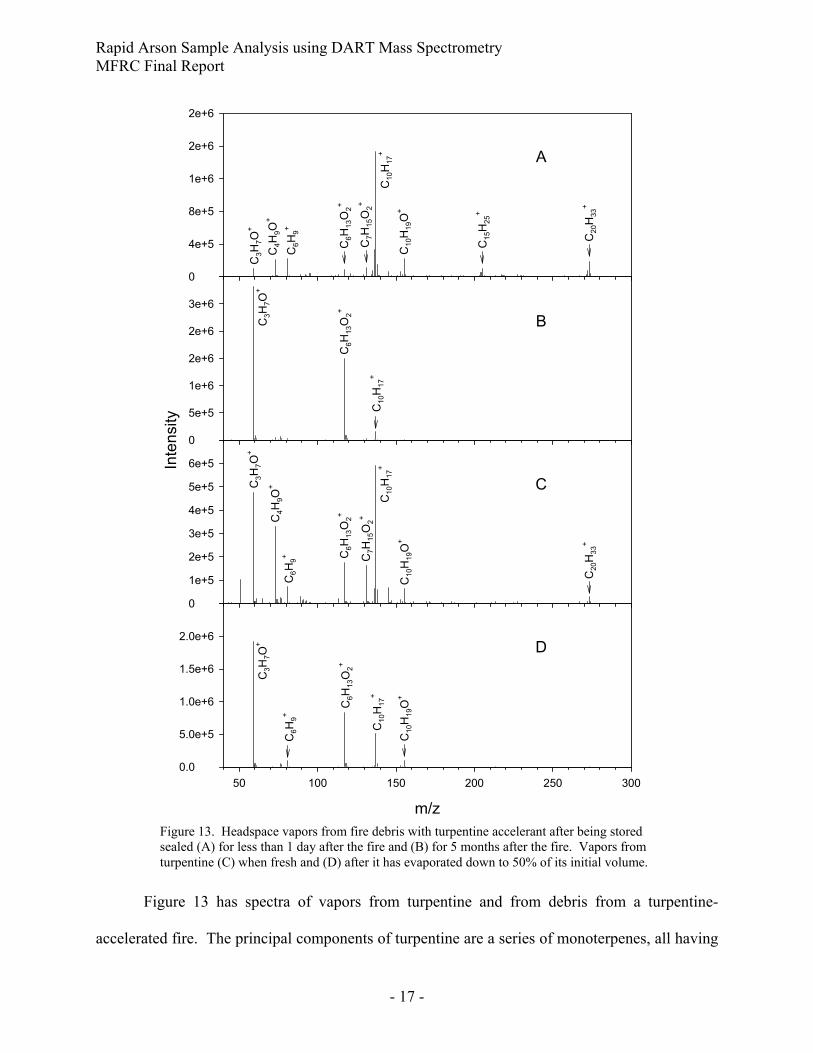
Figure 13 has spectra of vapors from turpentine and from debris from a turpentine-
accelerated fire. The principal components of turpentine are a series of monoterpenes, all having
m/z
50 100 150 200 250 3000.0
5.0e+5
1.0e+6
1.5e+6
2.0e+6
2.5e+60
1e+5
2e+5
3e+5
4e+5
5e+5
6e+5
7e+50
5e+5
1e+6
2e+6
2e+6
3e+6
3e+60
4e+5
8e+5
1e+6
2e+6
2e+6
D
C
A
B
C3H
7O+
C6H
13O2+
C10H17+
C3H
7O+
C6H
13O2+
C10H17+
C4H
9O+
C7H
15O2+
C20H33+
C3H
7O+
C6H
13O2+
C10H17+
C3H
7O+
C6H
13O2+
C10H17+
C4H
9O+
C7H
15O2+
C20H33+
C6H
9+
C10H19O+
C15H25+
C6H
9+
C10H19O+
C6H
9+
C10H19O+
Intensity
Figure 13. Headspace vapors from fire debris with turpentine accelerant after being stored sealed (A) for less than 1 day after the fire and (B) for 5 months after the fire. Vapors from turpentine (C) when fresh and (D) after it has evaporated down to 50% of its initial volume.
Rapid Arson Sample Analysis using DART Mass Spectrometry MFRC Final Report
- 18 -
the formula C10H16.14 A peak from the protonated monoterpenes, C10H17+, is present in all of the
Figure 13 spectra, and it is the base peak for both the fresh fire-debris headspace vapors in Panel
A and fresh turpentine vapors in Panel C. Turpentine also contains smaller amounts of
sesquiterpenes, C15H24, and diterpenes, C20H32. A peak from the protonated diterpenes is present
in both Panels A and C, and a protonated sesquiterpenes peak appears in Panel A. Unlike the
spectra from the accelerants in Figures 10 through 12, the spectra from turpentine and its fire
debris become sparser rather than denser with age, simplifying the spectra of the aged materials.
Still, like the previous accelerants, the headspace spectrum from the five-month-old fire debris
resembles the vapor spectrum from 50%-evaporated accelerant, while the spectrum from fresh
fire debris is most similar to that from fresh turpentine. The low-mass peaks in the fresh-fire-
debris spectrum, however, are weaker than in the fresh-turpentine spectrum. Most probably, the
high volatility of the low-mass species has resulted in their preferential loss during the fire.
Given that the headspace vapors of fire debris aged even when the samples were sealed in
an inert container, the aging was expected to be more substantial if the sample was left open to
the environment. As there may be some delay between the occurrence of a fire and the gathering
of forensic samples, we also examined aging of fire debris left open to the air after the fire was
extinguished. A sample of carpet and padding was ignited with regular gasoline as an accelerant
and then extinguished after three minutes. The debris was kept in a glass jar and tested daily.
The jar was kept open so that the sample was exposed to room air except for a two to seven hour
period prior to each analysis during which the jar was sealed so that headspace vapors could
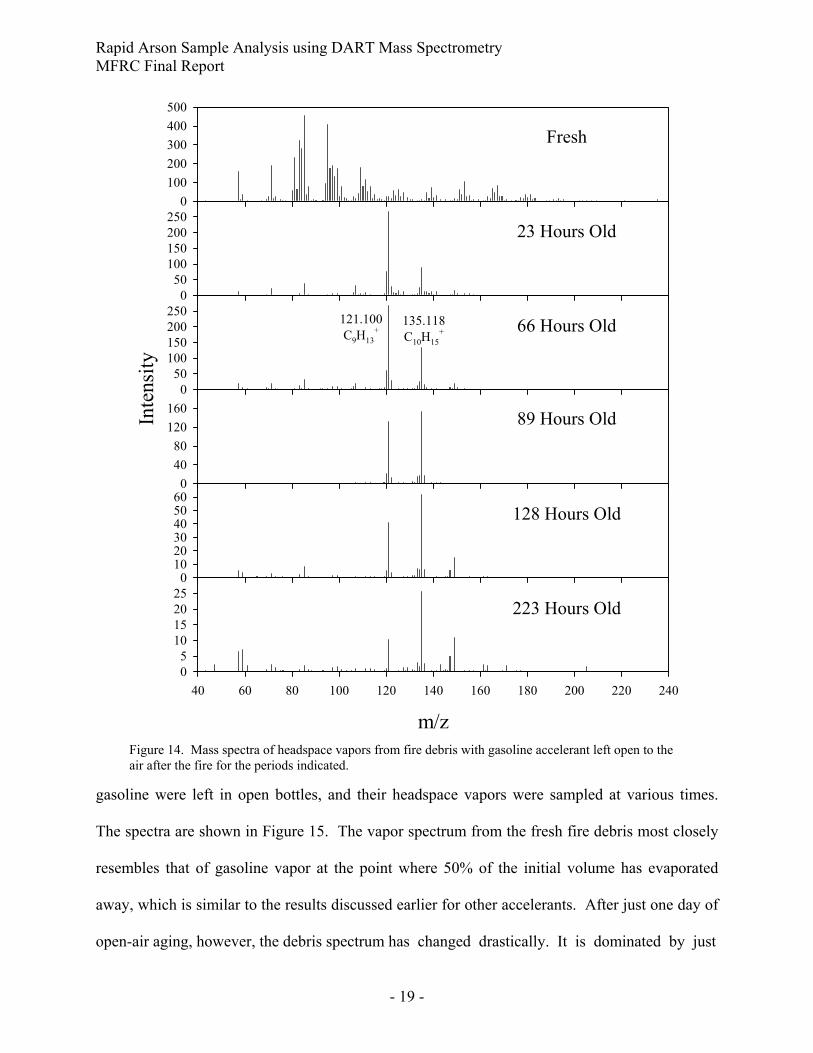
accumulate. Figure 14 shows the spectra of headspace vapors from very shortly after the fire to
223 hours (9¼ days) after the fire, excluding the periods when the jar was sealed. The spectrum
from the fresh debris differs markedly from all later spectra. For comparison, samples of
Rapid Arson Sample Analysis using DART Mass Spectrometry MFRC Final Report
- 19 -
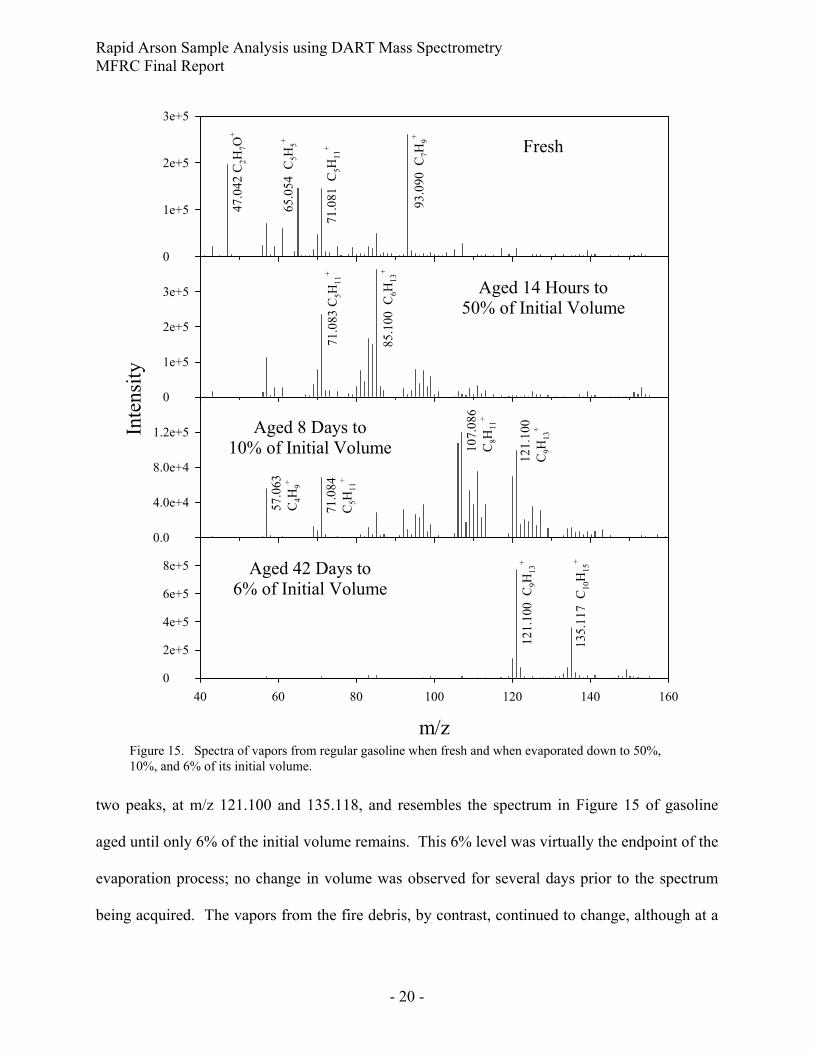
gasoline were left in open bottles, and their headspace vapors were sampled at various times.
The spectra are shown in Figure 15. The vapor spectrum from the fresh fire debris most closely
resembles that of gasoline vapor at the point where 50% of the initial volume has evaporated
away, which is similar to the results discussed earlier for other accelerants. After just one day of
open-air aging, however, the debris spectrum has changed drastically. It is dominated by just
m/z40 60 80 100 120 140 160 180 200 220 240
05
1015202530
223 Hours Old
010203040506070
128 Hours Old
04080
120160200
89 Hours Old
050
100150200250300
66 Hours Old
050
100150200250300
23 Hours Old
0100200300400500
FreshIn
tens
ity
121.100C9H13
+135.118C10H15
+
Figure 14. Mass spectra of headspace vapors from fire debris with gasoline accelerant left open to the air after the fire for the periods indicated.
Rapid Arson Sample Analysis using DART Mass Spectrometry MFRC Final Report
- 20 -
two peaks, at m/z 121.100 and 135.118, and resembles the spectrum in Figure 15 of gasoline
aged until only 6% of the initial volume remains. This 6% level was virtually the endpoint of the
evaporation process; no change in volume was observed for several days prior to the spectrum
being acquired. The vapors from the fire debris, by contrast, continued to change, although at a
m/z40 60 80 100 120 140 160
0
2e+5
4e+5
6e+5
8e+5
1e+6
Aged 42 Days to6% of Initial Volume
121.
100
C9H
13+
135.
117
C10
H15
+
0.0
4.0e+4
8.0e+4
1.2e+5
1.6e+5
Aged 8 Days to10% of Initial Volume 10
7.08
6C
8H11
+
121.
100
C9H
13+
57.0
63C
4H9+
71.0
84C
5H11
+
0
1e+5
2e+5
3e+5
4e+5
Aged 14 Hours to50% of Initial Volume
85.1
00 C
6H13
+
71.0
83 C
5H11
+
0
1e+5
2e+5
3e+5
Fresh
93.0
90 C
7H9+
47.0
42 C
2H7O
+
65.0
54 C
5H5+
71.0
81 C
5H11
+
Inte
nsity
Figure 15. Spectra of vapors from regular gasoline when fresh and when evaporated down to 50%, 10%, and 6% of its initial volume.
Rapid Arson Sample Analysis using DART Mass Spectrometry MFRC Final Report
- 21 -
much slower pace than during the first day. It is apparent that aging is much faster for accelerant
dispersed over the surface of fire debris than it is for liquid accelerant in an open container.
The two strongest peaks in the fresh-debris spectrum are at m/z 85.098 and 95.085.
These correspond to C6H13+ and C7H11
+. The m/z 85 peak most likely arises from one or more
hexanes, C6H14, through hydride abstraction, and the m/z 95 peak may come from a protonated
heptatriene (such as [CH2=CH-CH=CH-CH=CH-CH3]H+) or a fragment of a larger molecule.
The two strongest peaks in the spectra at later times are m/z 121.100 and 135.118, which
correspond to C9H13+ and C10H15
+, respectively. These most likely come from the benzene
derivatives C9H12 and C10H14. These are the formulas for benzene with three and four additional
CH2 groups, respectively. C9H12 could therefore be propyl benzene, ethyl toluene, or trimethyl
benzene, or their combination. Similarly, C10H14 could be butyl benzene, propyl toluene, and so
on. These observations are consistent with the volatilities of the species observed. C9H12
compounds have low vapor pressures at room temperature, ranging from 1.79 torr (1,2,3-
trimethylbenzene) to 4.54 torr (i-propylbenzene), and the vapor pressures of the C10H14
compounds vary from 0.36 torr (1,2,3,4-tetramethylbenzene) to 5.88 torr (i-butylbenzene).
These are all very much less volatile than the species that disappear quickly. The hexane
isomers, for example, have vapor pressures between 134 and 326 torr (n-hexane and 2,2-
dimethylbutane, respectively).
It is evident that DART-MS is capable of providing a rapid and detailed compositional
analysis of the headspace vapors from fire debris, without the benefit of chromatographic
separation. The DART-MS spectrum arises principally from the accelerant present in the fire
debris, so the accelerant can be identified or at least substantially narrowed down by searching
the sample mass spectrum against a library of accelerant spectra. The vapors from fire debris
Rapid Arson Sample Analysis using DART Mass Spectrometry MFRC Final Report
- 22 -
initially age rapidly, however, when left open to the air, so a library would have to contain
spectra from aged accelerants to be useful.
Future Work
The results of this project represent a good proof of principle that DART-MS can be used
to rapidly determine the presence and identity of accelerants in fire debris. This data will be used
in proposals seeking further funding so that DART-MS can be developed into a practical analysis
tool for arson investigation.
Publications and Presentations
Early progress in the project was presented in a talk at the MFRC Annual Meeting in St.
Louis, MO, on May 26. A more comprehensive paper on the results of the project was given at
the 40th Annual Meeting of the Midwestern Association of Forensic Scientists in Lombard, IL,
on September 22.
References
1. ASTM Method E 1618-06, “Standard Test Method for Ignitable Liquid Residues in Extracts
from Fire Debris Samples by Gas Chromatography-Mass Spectrometry.”
2. A. D. Pert, M. G. Baron, and J. W. Birkett, “Review of Analytical Techniques for Arson
Residues,” J. Forensic Sci. 51, 1033-1049 (2006). DOI: 10.1111/j.1556-4029.2006.00229.x
3. W. Bertsch and G. Holzer, “Analysis of Accelerants in Fire Debris by Gas
Chromatography/Mass Spectrometry,” in Forensic Applications of Mass Spectrometry, J.
Yinon, Ed.; CRC Press: Boca Raton, FL; 1995, 129-169.
Rapid Arson Sample Analysis using DART Mass Spectrometry MFRC Final Report
- 23 -
4. C. R. Midkiff, “Arson and Explosive Investigation,” in Forensic Science Handbook, Vol. 1,
2nd Edition, R. Saferstein, Ed.; Prentice Hall, 2002, 479-524.
5. C. R. Midkiff, Jr., “Laboratory Examination of Arson Evidence,” in More Chemistry and
Crime, S. M. Gerber and R. Saferstein, Eds.; American Chemical Society: Washington, DC:
1997, 85-106.
6. R. Newman, M. Gilbert, and K. Lothridge, GC-MS Guide to Ignitable Liquids, CRC Press:
New York; 1998.
7. R. B. Cody, J. A. Laramée, and H. D. Durst, “Versatile New Ion Source for the Analysis of
Materials in Open Air under Ambient Conditions,” Anal. Chem. 77, 2297-2302 (2005).
DOI: 10.1021/ac050152j
8. R. B. Cody and J. A. Laramée, US Patent No. 6949741; 2005.
9. C. M. Coates, S. Coticone, P. D. Barreto, A. E. Cobb, R. B. Cody, and J. C. Barreto,
“Flammable Solvent Detection Directly from Common Household Materials Yields
Differential Results: An Application of Direct Analysis in Real-Time Mass Spectrometry,”
J. Forensic Ident. 58, 624-631 (2008).
10. J. A. Laramée, R. B. Cody, J. M. Nilles, and H. D. Durst, “Forensic Application of DART™
(Direct Analysis in Real Time) Mass Spectrometry” in Forensic Analysis on the Cutting
Edge: New Methods for Trace Evidence Analysis, R. D. Blackledge, Ed.; Wiley-
Interscience: Hoboken, NJ; 2007, 175-195.
11. Supporting material for Reference 7, available at http://dx.doi.org/10.1021/ac050162j.
12. R. B. Cody, “Observation of Molecular Ions and Analysis of Nonpolar Compounds with the
Direct Analysis in Real Time Ion Source,” Anal. Chem., 81, 1101-1107 (2009). DOI:
10.1021/ac8022108
Rapid Arson Sample Analysis using DART Mass Spectrometry MFRC Final Report
- 24 -
13. MSDS for Coleman Camp Fuel; see http://www.coleman.com/coleman/msds/lantern.pdf.
14. C. L. Steele, S. Katoh, J. Bohlmann, and R. Croteau, “Regulation of Oleoresinosis in Grand
Fir (Abies grandis),” Plant Physiol., 116, 1497-1504 (1998). DOI: 10.1104/pp.116.4.1497