Chapter 4 Audio and video compression 4.1 Introduction 4.2 audio compression 4.3 Video compression.
FINAL REPORT, DECEMBER 2016 1
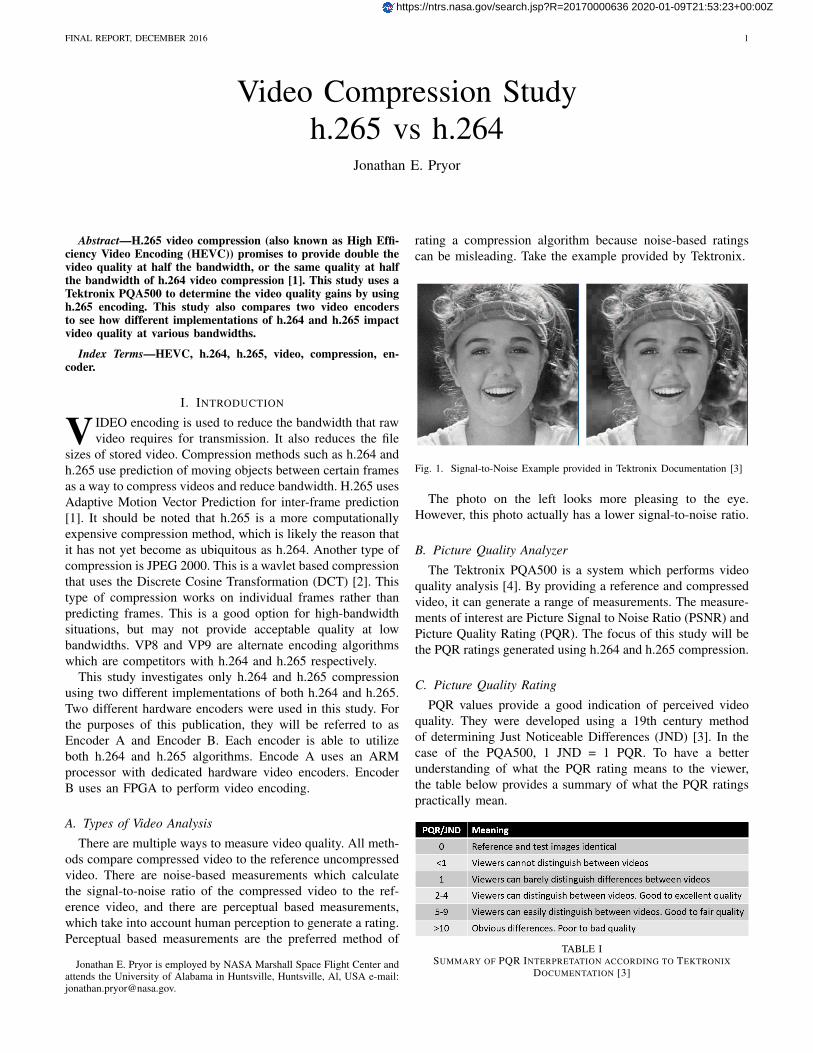
Video Compression Studyh.265 vs h.264
Jonathan E. Pryor
Abstract—H.265 video compression (also known as High Effi-ciency Video Encoding (HEVC)) promises to provide double thevideo quality at half the bandwidth, or the same quality at halfthe bandwidth of h.264 video compression [1]. This study uses aTektronix PQA500 to determine the video quality gains by usingh.265 encoding. This study also compares two video encodersto see how different implementations of h.264 and h.265 impactvideo quality at various bandwidths.
Index Terms—HEVC, h.264, h.265, video, compression, en-coder.
I. INTRODUCTION
V IDEO encoding is used to reduce the bandwidth that rawvideo requires for transmission. It also reduces the file
sizes of stored video. Compression methods such as h.264 andh.265 use prediction of moving objects between certain framesas a way to compress videos and reduce bandwidth. H.265 usesAdaptive Motion Vector Prediction for inter-frame prediction[1]. It should be noted that h.265 is a more computationallyexpensive compression method, which is likely the reason thatit has not yet become as ubiquitous as h.264. Another type ofcompression is JPEG 2000. This is a wavlet based compressionthat uses the Discrete Cosine Transformation (DCT) [2]. Thistype of compression works on individual frames rather thanpredicting frames. This is a good option for high-bandwidthsituations, but may not provide acceptable quality at lowbandwidths. VP8 and VP9 are alternate encoding algorithmswhich are competitors with h.264 and h.265 respectively.
This study investigates only h.264 and h.265 compressionusing two different implementations of both h.264 and h.265.Two different hardware encoders were used in this study. Forthe purposes of this publication, they will be referred to asEncoder A and Encoder B. Each encoder is able to utilizeboth h.264 and h.265 algorithms. Encode A uses an ARMprocessor with dedicated hardware video encoders. EncoderB uses an FPGA to perform video encoding.
A. Types of Video Analysis
There are multiple ways to measure video quality. All meth-ods compare compressed video to the reference uncompressedvideo. There are noise-based measurements which calculatethe signal-to-noise ratio of the compressed video to the ref-erence video, and there are perceptual based measurements,which take into account human perception to generate a rating.Perceptual based measurements are the preferred method of
Jonathan E. Pryor is employed by NASA Marshall Space Flight Center andattends the University of Alabama in Huntsville, Huntsville, Al, USA e-mail:[email protected].
rating a compression algorithm because noise-based ratingscan be misleading. Take the example provided by Tektronix.
Fig. 1. Signal-to-Noise Example provided in Tektronix Documentation [3]
The photo on the left looks more pleasing to the eye.However, this photo actually has a lower signal-to-noise ratio.
B. Picture Quality Analyzer
The Tektronix PQA500 is a system which performs videoquality analysis [4]. By providing a reference and compressedvideo, it can generate a range of measurements. The measure-ments of interest are Picture Signal to Noise Ratio (PSNR) andPicture Quality Rating (PQR). The focus of this study will bethe PQR ratings generated using h.264 and h.265 compression.
C. Picture Quality Rating
PQR values provide a good indication of perceived videoquality. They were developed using a 19th century methodof determining Just Noticeable Differences (JND) [3]. In thecase of the PQA500, 1 JND = 1 PQR. To have a betterunderstanding of what the PQR rating means to the viewer,the table below provides a summary of what the PQR ratingspractically mean.
TABLE ISUMMARY OF PQR INTERPRETATION ACCORDING TO TEKTRONIX
DOCUMENTATION [3]
https://ntrs.nasa.gov/search.jsp?R=20170000636 2020-01-09T21:53:23+00:00Z
FINAL REPORT, DECEMBER 2016 2
II. FACTORS
There are 4 factors involved in this study. Each possiblefactor is shown below. (table 2) There are two algorithmsbeing explored; h.264 and its successor, h.265. There are twoencodes, as mentioned in the Section 1. There are 5 band-widths being tested, and there are a total of 6 representativescenes that are of interest.
III. METHODS
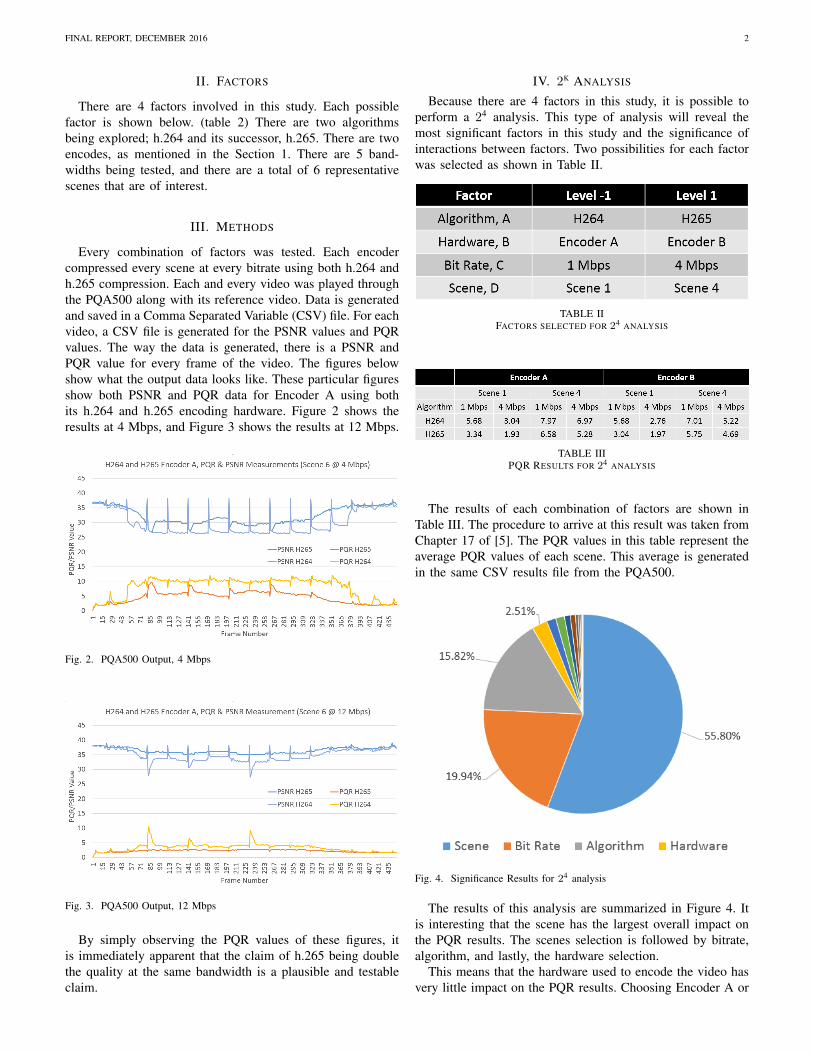
Every combination of factors was tested. Each encodercompressed every scene at every bitrate using both h.264 andh.265 compression. Each and every video was played throughthe PQA500 along with its reference video. Data is generatedand saved in a Comma Separated Variable (CSV) file. For eachvideo, a CSV file is generated for the PSNR values and PQRvalues. The way the data is generated, there is a PSNR andPQR value for every frame of the video. The figures belowshow what the output data looks like. These particular figuresshow both PSNR and PQR data for Encoder A using bothits h.264 and h.265 encoding hardware. Figure 2 shows theresults at 4 Mbps, and Figure 3 shows the results at 12 Mbps.
Fig. 2. PQA500 Output, 4 Mbps
Fig. 3. PQA500 Output, 12 Mbps
By simply observing the PQR values of these figures, itis immediately apparent that the claim of h.265 being doublethe quality at the same bandwidth is a plausible and testableclaim.
IV. 2K ANALYSIS
Because there are 4 factors in this study, it is possible toperform a 24 analysis. This type of analysis will reveal themost significant factors in this study and the significance ofinteractions between factors. Two possibilities for each factorwas selected as shown in Table II.
TABLE IIFACTORS SELECTED FOR 24 ANALYSIS
TABLE IIIPQR RESULTS FOR 24 ANALYSIS
The results of each combination of factors are shown inTable III. The procedure to arrive at this result was taken fromChapter 17 of [5]. The PQR values in this table represent theaverage PQR values of each scene. This average is generatedin the same CSV results file from the PQA500.
Fig. 4. Significance Results for 24 analysis
The results of this analysis are summarized in Figure 4. Itis interesting that the scene has the largest overall impact onthe PQR results. The scenes selection is followed by bitrate,algorithm, and lastly, the hardware selection.
This means that the hardware used to encode the video hasvery little impact on the PQR results. Choosing Encoder A or
FINAL REPORT, DECEMBER 2016 3
Encoder B is the least important selection. Choosing a higherbitrate and selecting an h.265 encoder has a much biggerimpact. It is likely that the scene may be pre-determined, butit is important to choose a representative scene when takingPQR measurements because it has such a profound impact onthe results.
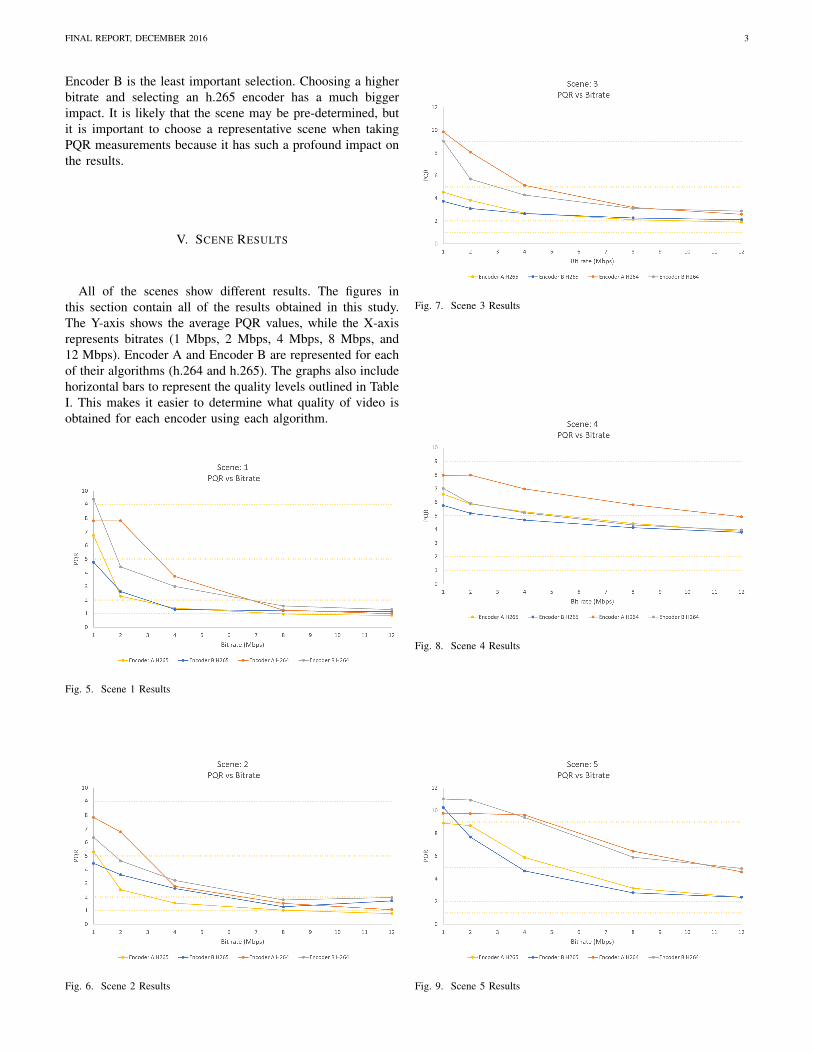
V. SCENE RESULTS
All of the scenes show different results. The figures inthis section contain all of the results obtained in this study.The Y-axis shows the average PQR values, while the X-axisrepresents bitrates (1 Mbps, 2 Mbps, 4 Mbps, 8 Mbps, and12 Mbps). Encoder A and Encoder B are represented for eachof their algorithms (h.264 and h.265). The graphs also includehorizontal bars to represent the quality levels outlined in TableI. This makes it easier to determine what quality of video isobtained for each encoder using each algorithm.
Fig. 5. Scene 1 Results
Fig. 6. Scene 2 Results
Fig. 7. Scene 3 Results
Fig. 8. Scene 4 Results
Fig. 9. Scene 5 Results
FINAL REPORT, DECEMBER 2016 4
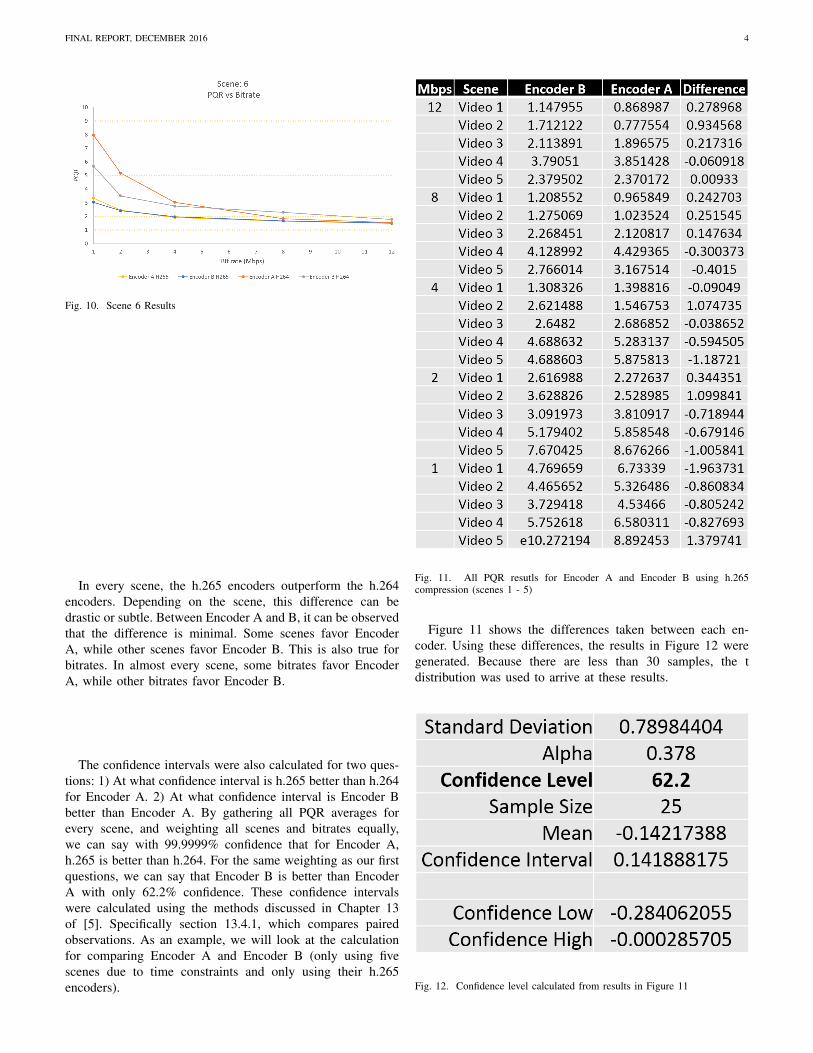
Fig. 10. Scene 6 Results
In every scene, the h.265 encoders outperform the h.264encoders. Depending on the scene, this difference can bedrastic or subtle. Between Encoder A and B, it can be observedthat the difference is minimal. Some scenes favor EncoderA, while other scenes favor Encoder B. This is also true forbitrates. In almost every scene, some bitrates favor EncoderA, while other bitrates favor Encoder B.
The confidence intervals were also calculated for two ques-tions: 1) At what confidence interval is h.265 better than h.264for Encoder A. 2) At what confidence interval is Encoder Bbetter than Encoder A. By gathering all PQR averages forevery scene, and weighting all scenes and bitrates equally,we can say with 99.9999% confidence that for Encoder A,h.265 is better than h.264. For the same weighting as our firstquestions, we can say that Encoder B is better than EncoderA with only 62.2% confidence. These confidence intervalswere calculated using the methods discussed in Chapter 13of [5]. Specifically section 13.4.1, which compares pairedobservations. As an example, we will look at the calculationfor comparing Encoder A and Encoder B (only using fivescenes due to time constraints and only using their h.265encoders).
Fig. 11. All PQR resutls for Encoder A and Encoder B using h.265compression (scenes 1 - 5)
Figure 11 shows the differences taken between each en-coder. Using these differences, the results in Figure 12 weregenerated. Because there are less than 30 samples, the tdistribution was used to arrive at these results.
Fig. 12. Confidence level calculated from results in Figure 11
FINAL REPORT, DECEMBER 2016 5
This would not be enough to make a decision betweenEncoder A and Encoder B without knowing how to properlyweight the scenes and bitrates. It would be too early in thisstudy to make a proper selection.
VI. CONCLUSION
It is conclusive that h.265 outperforms h.264 in all situa-tions. However, if a selection between Encoder A or EncoderB was necessary, factors other than video quality would needto be assessed. Other factors that would come into play arecost, weight, ruggedness, speed of encoding, ease of use, andother metrics.
ACKNOWLEDGMENT
The author would like to thank Dr. Aleksandar Milenkovicat the University of Alabama in Huntsville for his support anddirection.
REFERENCES
[1] “HEVC / H.265 Explained.”[2] “JPEG 2000: How does it work?.”[3] “Understanding PQR, DMOS, and PSNR Measurements,” tech. rep.[4] “Picture Quality Analysis System | Tektronix.”[5] R. Jain, The Art of Computer Systems Performance Analysis. John Wiley
& Sons, Inc., 1991.