Final Report Could there be basic differences between …varun_ag/readinggroup/images/1/...46...
150
Final Report
Transcript of Final Report Could there be basic differences between …varun_ag/readinggroup/images/1/...46...

Final Report
Lava
Note
Could there be basic differences between rural and urban areas? Could the disparities between Pratham data and other data be due to this reason? (since Pratham considers only rural areas and not places like urban slums)

Maps in this report may not be accurate or to-scale. These are mere representations.
ASER2005- Rural
Annual Status of Education Report (Rural)
Cover: Rahul De, member of the ASER team took this picture in Meghalaya.
Other photos: All photos taken by volunteers as they visited villages.
Also available on CD.
For more information: [email protected]
Price:
Students: Rs. 100
Other individuals: Rs. 200
Institutions: Rs. 500
Outside India: USD 50.00/ GBP 25.00
Layout by: Trimiti Services, Mumbai
Printed by: Jolly offset, Mumbai
Published by:
Pratham Resource Center
Mumbai office:
Ground Floor, YB Chavan Center,
Gen. J. Bhosale Marg, Nariman Point,
Mumbai, India, 400 021.
Phone: 91-22-22886975, 91-22-23851405
New Delhi office:
A1/7, Safdarjung Enclave,
New Delhi, 110 029.
Phone: 91-11-26716083/84

WePeople of India
From different states and regionsSpeaking different languages
Sat with our childrenAnd looked
WithinInside our homes
At our villagesInto our schools
And prepared this reportFor ourselves
To build a better India
Final report

Gilghit
Chilas
SRINAGAR
Kargil
Leh
Anantnag
KashmirNorth
Punch
Udhampur
Mirpur
Kathua
Gilgitwazara
Riasi
TribalTerritory
Muzzararbad
Ladakh
Jammu
JAMMU AND KASHMIR
Chamba
Dharamsala
Kullu
MandiKinnaur
Bilaspur
SHIMLA
HamirpurUna
Solan
Sirmaur
Kangra
Lahul a Spitind
HIMACHAL PRADESHGurdaspur
AmritsarHoshiarpur
Kapurthala
Jalandhar Nawanshahr
PUNJAB
Firozpur
Faridkot
Moga Ludhiana Rupnagar
FatehgarhSahib
Muktsar Sangrur
Bathinda
Mansa
Patiala
Kapurthala
DEHRADUN
Uttarkashi
Rudraprayag
Chamoli
Haridwar BageshwarPithoragarh
Almora
Nainital
Champawat
Tehri Garhwal
Pauri
Udham Singh Nagar
UTTARANCHAL
Sirsa Fatehabad
Hisar
Bhiwani
Kaithal
Karnal
JindPanipat
SonipatRohtak
Jhajjar
Mahendragarh GurgaonRewari
Faridabad
Kurukshetra
Ambala
Yamunanagar
Panchkula
HARYANA
LUCKNOW
Ghaziabad
Meerut
BijnorMuzaffarnagar
Saharanpur
Moradabad
RampurPilibhit
Bulandshahar Bareilly
BadaunAligarh
Hathras Etah
Shahjahanpur
Mathura
MainpuriAgraFirozabad
Etawah
Kannauj
Hardoi
Sitapur
Kheri
Bahraich
Balrampur
GondaBara-Banki
Jhansi
Lalitpur
Hamirpur
Auraiya
Mahoba
KanpurUnnao
Rae Bareli
Faizabad
Basti
Sultanpur
Azamgarh
Gorakhpur
Deoria
Mau
Maharajganj
BalliaGhazipur
Varanasi
JaunpurKaushambi
Mirzapur
SRNBanda
Fatehpur
Baghpat
JPN
GBN
Farukhabad Shrawasti
Jalaun
Siddhart Nagar
Pratapgarh
Chitrakoot
A. Nagar
SKN
Kushinagar
AllahabadChandauli
Sonbhadra
Fatehpur
RAJ ASTH AN
JAIPUR
Ganganagar
Hanumangarh
Bikaner
Jaisalmer
Barmer
Jalor
Sirohi
Udaipur
Rajasamand
Chittaurgarh
Bhilwara
Pali
Jodhpur
Nagaur
Ajmer
Dhaulpur
Alwar
Bharatpur
Karauli
Tonk SawaiMadhopur
Bundi
KotaBaran
Jhalawar
Dungarpur
Banswara
Churu
Jhunjhunun
Sikar
Dausa
Patan
Mehsana
Jamnagar
Rajkot
Porbander
JunagadhAmreli
Bhavnagar
Ahmedabad
Kheda
Anand
Vadodara
Bharuch
Surat
Navsari
Narmada
Panch Mahals
Sabar Kantha
Banas Kantha
Kachchh
Rann of Kachchh
Dahod
The Dangs
ValsadDAMAN AND DIU
Surendranagar
GUJARATGANDHINAGAR
MUMBAI
MA H AR AS HT RA
Nandurbar
Nashik
Thane
Raigad
Pune
Ahmednagar
AurangabadJalna
Dhule
Jalgaon
Buldhana
Akola
Amravati
Wardha
Yavatmal
Washim
Hingoli
Bid
ParbhaniNanded
Latur
Satara
RatnagiriSangli
Kolhapur
Solapur
Gondia
Bhandara
Nagpur
Gadchiroli
Chandrapur
Sindhudurg
Usmanabad
BHOPAL
BhindMorena
Gwalior
Sheopur
Shivpuri
Datia
Neemach
Barwani
Jhabua
DharIndore
Mandsaur
RatlamUjjain
Shajapur
Dewas
Rajgarh
Sehore
Vidisha
Raisen
Guna
Tikamgarh
Sagar DamohKatni
Jabalpur
Narsimhapur
Mandla
Hoshangabad
Harda
Betul
ChhindwaraSeoni
Balaghat
Panna
ChhatarpurSatna Rewa
Sidhi
East Nimar
Dindori
Umaria
Shahdol
West Nimar
MADHYA PRADESH
PATNA
Aurangabad
Bhabua
Rohtas
Gaya
Buxar
Jahanabad
Bhojpur
Nawada
Sheikhpura
Lukhisarai
JamuiBanka
Munger
Begusarai Khagaria
Samastipur
Saharsa
Muzaffarpur Madhepura
Darbhanga
Katihar
Purnia
SupaulAraria
Kishanganj
Siwan
Gopalganj SheoharMadhubani
Sitamarhi
Bhagalpur
VaishaliSaran
PaschimChamparan
Nalanda
PurbiChamparan
BIHAR
Khonsa
Changlang
Tawang
YingkiongAnini
Tezu
West Kameng
East Kameng
Papum Pare
Lower Subansiri
Upper Subansiri
East Siang
Upper Siang
West SiangA RU N AC H AL
P R AD ES H
DISPUR
Kokrajhar
Borpeta
Nalbari
GoalparaDhubri
Nagoan
Karimganj
Hailakandi
Karbi Anglang
Jorhat
Sibsagar
Dibrugarh
Dhemaji
Sonitpur
North Cachar Hills
Cachar
Kamrup
Bongaigaon
Darrang
Tinsukia
Golaghat
Lakhimpur
Morigaon
KarbiAnglang
ASSAM
IMPHAL East
ChurachandpurChandel
ThoubalBishnupur
Imphal West
Ukhrul
Senapati
Tamenglong
MANIPUR
NAGALAND
KOHIMA
Phek
Zunheboto
Wokha
Mokokchung
Tuensang
Mon
Dimapur
SHILLONGMEGHALAYAWest Garo Hills
South Garo Hills
East Garo Hills
West Khasi Hills
Ri Bhoi
Jaintia HillsEast Khasi Hills
AIZAWAL
MIZORAM
Lunglei
Serchhip
Saiha
Mamit
Kolasib
Champhai
Lawngtlai
Agartala
TRIPURA
North Tripura
Udaipur
South Tripura
Dhalai
Kailashahar
West Tripura
WEST BENGALKOLKATA
Medinipur
Haora
PuruliyaBankura
Barddhaman
Jalpaiguri
Darjiling
Koch Bihar
Uttar Dinajpur
Dakshin Dinajpur
Maldah
Birbhum
HugliNorth 24 Paraganaa
South 24 Paraganaa
Murshidabad
Nadia
GANGTOK
SIKKIM
Namchi
Mangan
Lachen
North
West
East
South
JHARKHAND
RANCHI
Jamshedpur
Gumla
Lohardaga
Garhwa
Latehar
Hazaribag
Chatra
Bokaro
Dhanbad
Giridih DumkaDeogarh
GoddaPakur
Sahibganj
Kodarma
Palamau
East Singhbhum
Sindega
West Singhbhum
Jamtara
BHUBANESWAR
Malkangiri
Koraput
NabarangpurRayagada
PuriKalahandi
NuaparhaBalangir
NayagarhPhulbani (Khandamal)
Sonapur
Bauda
Angul
Bargarh Sambalpur
Khorda
Cuttack
Jagatsinghpur
Kendrapara
Dhenkanal
Bhadrak
Baleshwar
Deogarh
KendujhargarhJharsuguda
Sundargarh
Mayurbhanj
Jajpur
Ganjam
Gajapati
ORISSA
RAIPUR
Dantewada
Kanker
Dhamtari
Raj Nandgaon
Durg
Mahasumund
Bilaspur
Janjgir
Raigarh
SurgujaKoriya
Jashpur
Korba
Kawardha
Bastar
CHHATTISGARH
HYDERABAD
Adilabad
NizamabadKarimnagar
Rangareddi
Mahbubnagar
Chittoor
Anantapur
Cuddapah Nellore
Guntur
Kurnool
Nalgonda
KhammamEast Godavari
Yaman (PONDICHERRY)
Warangal
Vishakhapatnam
Vizianagaram
Srikakulam
West Godavari
Krishna
Prakasam
Medak
ANDHRA PRADESH
North Goa
South Goa
GOA
KARNATAKA
BANGALORE
Bidar
Gulbarga
Raichur
Bijapur
Bagalkot
KoppalDharwadGadag
Belgaum
Haveri
ChitradurgaShimoga
Udipi
Chikmangalur
Hassan
Mandya
Mysore
Chamaranj nagar
Tumkur
Kolar
Bellary
Dakshin Kannad
Uttar Kannad
Devangere
Kodagu
Tumkur
KARNATAKA
TAMILNADU
PONDICHERRY
CHENNAI
Coimbatore
Tirunelveli
Thoothukkudi
RamanathapuramVirudunagar
Shivaganga
MaduraiTheni
Dindigul Pudukkottai
Thanjavur
KarurTiruchirappalli
Nagapattinam
Thiruvarur
Karaikal (PONDICHERRY)
ErodeNamakkal
Perambalur
AriyalurNagapattinam
Salem
Dharmapuri
Tiruvannamalai
Villupuram
Cuddalore
Vellore Kancheepuram
Thiruvallur
Kanyakumari
The Nilgiris
K
R
A
E
L
A
THIRUVANANTHAPURAM
Kasargod
Kannur
MAHE(PONDICHERRY)
Kozhikode(Calicut)
Malappuram
Palakkad
Thrissur
Ernakulam
Alappuzha Kottayam
Pathanamthitta
Kollam
Wayanad
IdukkiKochi
20+
15 - 20
10 -15
5 - 10
3 - 5
0 - 3
No data
Percentage of children
ASER 2005
Maps may not be accurate or to-scale. These are mere representations.
ii
Districtwise distribution of% out-of-school children
INDIA Rural
Lava
Highlight

An essay: “What would happen if there was no school?”- Ishu Singh, Std. V, Lucknow, Uttar Pradesh
iiiASER 2005
Andhra Pradesh 86 Foundation for Ecological Security 180 Jansahbhagi Kendra1 Lok Satta and hundreds of volunteers 87 Gharda Foundation 181 Jharkhand Gramin Vikas Trust
Arunachal Pradesh 88 Gram Sewa Trust 182 Krishi Gram Vikas Kendra2 Lobsang Genchen and local volunteers 89 Gram Swaraj Sangh 183 Lohardagga Gram Swaraya Sansthan3 SARRA 90 Gram Udyog Sewa Trust 184 Lohiya Viklang Seva Samiti4 Tobom Dai and college students 91 Gram Vikas Seva Sangh 185 Lok Chirag Seva Sansthan
Assam 92 Gram Vikas Trust 186 Lokprerna Kendra5 Dr. Sarbeshwar Chutiya & 93 Gujarat Adivasi Sabha 187 Nav Bharat Jagriti Kendra
Dept of Sociology students, 94 Gujarat Vidyapith 188 SAHYOGINI6 Dhemaji College 95 INFONIX Computers/ CMC 189 Samajik Parivartan Sansthan7 Tezpur Mahila Samiti,affiliates, volunteers 96 IRMA 190 Vikas Bharti Foundation8 Socio-Educational Welfare Association 97 Ishwar Khadi Gram Udyog Sangh 191 Vision Foundation9 Dhubri Science club 98 Jagrut Mahila Sangathan 192 Youth Unity for Voluntary Action
10 NGO Forum, Tinsukia 99 Jalaram Trust KarnatakaBihar 100 Jay Chamunda Trust 193 Akshara Foundation
11 Abhiyan 101 Junagadh Mahila Mandal 194 Azim Premji Foundation 12 Action for development of demos 102 Jyoti Trust 195 Belgaum Integrated Rural Development 13 Adarsh Mahila Kalyan Kendra 103 Kantha Vistar Satatyapurna vikas Samita 196 EMBARK YOUTH ORGANIZATION14 Baba Singheshar Mahila Vikas Sansthan 104 Kodinar Mahila Mandal 197 Geleyara Balaga15 Bal Mahila Kalyan 105 Kutch Mahila Vikas Sangathan 198 “HELP” organization16 Bihar Seva Samiti 106 Lok Bharati 199 Initiatives for Development Foundation 17 CORD 107 Lok Niketan Sanstha, MSW Dept 200 Mahatma Gandhi Rural Dev & Soc Change 18 Deepalaya Mansik Swasthya Evam 108 Lok Seva Yuva Trust 201 Malendu Edu & Rural Dev Society.
Viklang Parishad 109 M L Gandhi Higher Secondary Trust 202 POWER 19 Disha Vihar 110 M N College 203 Rural Literacy & Health Programme20 Globe Organisation 111 M S University 204 Rural Development Foundation 21 Gram Vikash Manch 112 Mahila Samakhya 205 Sadhana22 Gramin Bal Evam Manav Vikas Samiti 113 Mahila Sangh 206 Sarvodaya Integrated Rural Dev & Tech Ed 23 Gramin Manav Seva Mandir 114 Mangal Bharati 207 Shambulingeshwara Youth Group24 Gramin Sansadhan Vikas Parishad 115 Marag 208 Spoorthidhama, Kedur Post, 25 Gramysheel 116 Matru Krupa Khadi Gram Udyog Sangh 209 Sri. Kuvempu Yuva Vikasa Vedike26 HELPERS 117 Navsarjan LAHRC -Adivasi Sarvangi Vikas 210 VALORED27 Idea 118 Nehru Yuva Kendra Kerala28 Jan Kalyan Sangh Nimdih 119 Odakh 21129 Jan Shikshan Kendra 120 Panth Abhiyan/ Maitree Abhiyan30 Jawahar Zyoti Bal Vikas Kendra 121 Parishram Mahila Mandal Madhya Pradesh31 Jeewan Jyoti Kendra 122 Parivartan Trust 212 Abhinavgram Udhyan Samiti32 Koshi Anchal Samagra Evam 123 Pragati Education Trust 213 ABHIVYAKTI
Manav Kalyan Parishad 124 Prarambh Abhiyan/ Pehel Abhiyan 214 Asha Gramodhyan Shiksha Manav Kalyan 33 Mahila Chetna Vikas Mandal 125 Prerna Abhiyan 215 Bhagwanti Bai Shiksha Prashar Samiti34 Mahila Vikas Samiti Datapur 126 Rural Development Foundation 216 Bharti Kala Evam Vigyan Samiti35 Manav Sarvangin Vikash Sanstha 127 Rural Development Society 217 Bhartiya Swashakti Sangh36 Pragti Shilp Kala Kendra 128 Sakhi 218 Gopal Krishna Shiksha Avm Samajik Samiti37 Preeti Jagriti 129 Sarvangi Gram Vikas Sanstha 219 Green Valley Foundation38 Prerna Seva Sansthan 130 SEWA 220 Hastkshap39 Rashtriya Vikash & Samaj Kalyan Parishad 131 SETU 221 Indra Jain Balvikas Vidya Samiti40 Rights Collective 132 Sevabharti Vikas Sanstha 222 Jati Yuva Mandal41 SAARTHI 133 Shanti Gram Nirman Mandal 223 Jawahar Nehru Yuva Mandal42 Saran Zila Samagra Vikas Sansthan 134 Shramik Vikas Sanstha 224 Kalpatru Vikas Samiti43 Sardar Ballav Bhai Patel Seva Sansthan 135 Shree Sharda Sarvajanik Seva Mandal 225 Khajuraho Foundation44 Voluntary Forum for Education 136 Shri Ambedkar Education Trust 226 LRM Educational and Social Welfare Society
Chhattisgarh 137 Shri Jaya Ashapura Charitable Trust 227 Maharshi Vivekanand Shiksha Samiti45 Abhivyakti Jan Shiksha Evam Sanskriti Samiti 138 Shri Ravi Dayal Seva Turst 228 MP Jan Adhikar Manch46 Chinahari Jan Shiksha Evam Sanskriti Samiti 139 Siddhi Mahila Sangh Federation 229 Nav Adarsh Mahila Mandal47 Sankalp Sanskritik Samiti 140 Swami Sahajanand College of Comm & Mgt 230 Nav Chetna Vidya Mandir48 Balrang 141 Tasra Agro Consumer Sanstha 231 New Model High Sch & Consultant Rights 49 Nav Sankalp 142 Una Mahila Mandal 232 Parhit Samaj Sewi Sansthan50 Chhatisgarh Bharat Gyan Vigyan Samti 143 Unnati 233 Parivartan Kalyan Sangh, Indore51 Rupak Sanstha 144 Vikalp 234 Pichore Yuva Mandal52 Hathkargha Samiti 145 Vishudhanand Vidya Mandir 235 Prayas Samaj Sevi Sansthan53 Nav Ambika Shikshn Samiti 146 Vivekanand Research Training Institute 236 Prayas Samajik Samiti54 Zilla Shodh Sansthan, 147 VRT 237 Public Development Centre55 Samta Samiti 148 WASMO 238 Rakshtriya Ekta Natya Samiti56 Sangata Samiti 149 Yuva Chetna 239 Sadbhawna Samiti57 Koya Samiti Haryana 240 Sangwari, Society
Dadra & Nagar Haveli 150 Arya PG College 241 Sankalp Samajsevi Sansthan58 Deep Mahila Mandal 151 Chotu Ram Arya College 242 Shakuntla Parmar Samiti59 Rural Development Foundation 152 Gaur Brahmin College 243 Shivangi Education Society
Daman& Diu 153 ITI College, Narwana 244 Shram Bhakti Mahila Sangatan60 Youth Action Force 154 JNC Devi Lal College 245 Shreegurukrupa Shiksha Prasaran Manch61 Swami Vivekanand Yuva Mandal 155 Khalsa College 246 Soc of Action Alt Research & 62 Sahyog 156 Kurukshetra University 247 Sujagruti Samajsevi Sansthan63 Sargam 157 MM College 248 Support in Development64 Bhilwada Jilla Panchayat 158 Mukand Lal National College 249 Sushil Gyan Shiksha Prasar Samiti
Goa 159 Nehru College 250 U.S.Development Club65 DMC College 160 Nehru Yuvak Kendra 251 Uday the rising Society66 Jogalekar Maha Vidhalaya 161 Panjab University 252 Unnati Sansthan
Gujarat 162 RK SP College 253 Vimal Shiksha Samiti67 Aayush Foundation 163 SD College, Ambala Cantt 254 Yugbodh Shiksha Samiti68 Adag Shikshan Abhiyan Himachal Pradesh Maharashtra69 Adarsh Mahila Mandal 164 SARDHA 255 Adarsh Sevabhavi Mahila mandal70 Akhand Jyot Foundation 165 SRDA 256 Adarsh Vidyalaya 71 Anand Institute of Social Work 166 Ankur Welfare Association 257 Adasha Gramvikas Mandal72 ANANDI 167 SUTAR DHARA 258 Adiwasi Dyanpith, Navapur73 ANARDE 168 SEWA Himalyas 259 Adiwasi Satpuda Shikshan Prasarak Mandal 74 ANARDE/Navjyot Foundation 169 SUTRA 260 Anand Gramin Vikas Pratishthan.75 Anmol Rural Development Foundation Jammu & Kashmir 261 Anarya Swayamsevak Sangh76 Aroa Networking and Development Initiative 170 SECMOL 262 Ankur Adivasi Vikas Sanstha77 BAIF 171 Kargil Development Project 263 Ankur Yuva Mandal78 Bajrang Gram Vikas Trust 172 Jammu University, students & faculty 264 Anushree Shikshan Sanstha 79 BSC Jharkhand 265 Bhagyodya Pratishtan80 BSC / St Xaviers Non formal Education Society 173 Abhiyan 266 Bhakar Sansta81 BSC-AVSC 174 ASRA 267 Buddhishth Society82 CARITAS 175 Bihar Pradesh Yuva Parishad 268 Chaitanya Sanstha83 CHAITANYA Charitable Trust 176 Community Development Centre 269 Chintamani Trust84 Dangi Mazdoor Union 177 Gram Jyoti Kendra 270 Devidas Rathod
178 Gramin Navodaya Kendra85 Deep Jyot179 Gramin Samaj Vikas Manch
KUDUMBASHREE and affiliated 280
Community Development Societies
They reached the remotest villages of India
ASER 2005iv
No

ASER 2005 v
271 Dhartidhan Gram vikas sanstha 367 Swash 457 Peoples Watch272 Dhnyanajyoty Gram Vikas Mandal 368 Tarun Bharat news paper 458 Sense273 DILASA 369 Tarun Mandal 459 TamilNadu Science Forum274 Dilasa Mahila Mandal 370 Tarun Patrakar Sangh Dodamark 460 Thai Thamizh Palli275 Disha Samajik Sanstha 371 Tarun Patrakar Sangh Kudal 461 Vidyarambam276 Dnyandeep Trust 372 Tata Institute Of Social Science 462 VOCRDC277 Dnyanwarsha 373 Tejash Mahila Mandal Tripura278 Dr. Ambedkar sanskruti krida mandal 374 The Bridge Trust 463 Janasanskriti 279 Dr. Ambedkar Sansodhan Vikas Munch 375 Ujam Uttar Pradesh280 Dr. Arodkar Gramvikas Sanstha 376 Ujjawal 464 Action Aid and partners281 Dr.G.W. Karwar Bahudeshiya Trust, Beed 377 Vanchit Vikas Sanstha 465 Akhand Prabandh Avm Sodh Sansthan282 Dreamland 378 Vanketash Seva Samiti 466 Arunodaya Sansthan Mahoba283 Ekata Yuva mandal 379 Vengurla's Sarpanch 467 Asha Gramodhyan Sansthan, Jalone284 Ekta Tarun Mandal 380 Vidya Vikas Mahavidyalay, Samudrapur 468 Azad Sewa Ashram285 Gram Vikas Sansta 381 Vidya Vikas Shikshn Sanstha 469 Bhagwati Devi Inter College,286 Grami Adivashi Vikas Sanstha, Pali 382 Vikalp India Manpur.Tahsil-Khair287 Har Har Mahadev Bhaudeshiya Trust, Bhilali 383 VOICE, Satara 470 Bharatiya Jan Kalyan Sansthan288 Janhit Pratishtan 384 Vyankateshwar Shikshan Sansta, Ankisa 471 Bharatiya Manav Samaj 289 Janjagruti Trust 385 Women Tribal Development Kalyan Samiti (BMSKSS)290 Jankalyan Sevabhavi Sanstha 386 Youth Group 472 Bhawani NGO, Ghaziabad291 Janrtha Adiwasi Vikas Sanstha 387 Yusuf Meharali Centre, Tarapur Panvel 473 BK Lokvikas Sansthan292 Janseva Pratikshtan 388 YUVA Sushikshit Berojgar Sanstha 474 Bundelkhand Seva Sansthan293 Janwadi Prathisthan 389 Yuvak Mandal, Ambarnath 475 Bundelkhand Sevagram Sansthan294 K.G. N. Sewabhavi 390 Yuvak Mandal, Bhiwandi 476 Deonagri Intercollege, Meerut295 Kankavli's Sarpanch 391 Yuvak Mandal, Kalyan 477 Devlopment Initiatives by Social 296 Karmvir Mahavidyalay 392 Yuvak Mandal, Talasari Animation (D I S A)297 Kastraib Sanghatana 393 Yuvak Mandal, Vasai 478 Drumned Rajkiya Inter College, NSS298 Kelkar College, Mulund 394 Z.P Kanishta Mahavidyalay, Yetapalli 479 Gandhi Faiz-e-am Degree College, NSS299 Krantijyoti Mahila Mandal Manipur 480 Government Inter College, NSS300 Lokhitarthi 395 PRDA 481 Gram Unmesh Sansthan301 Lokhitwadi Bahuuddeshiy 396 NABARD with local volunteers 482 Gramin Punar Nirman Sansthan
Sevabhavi Sanstha (teachers, ngo, students) 483 Gramin Vikas Avm Punar Nirman302 Loksamanway Pratisthan Taloda Meghalaya 484 HINDUSTAN SCOUTS AND GUIDES303 Lokvikas Trust 397 NEHU Tura and volunteers 485 Jan Kalyan Avm Shiksha Sansthan304 M.N.Rai Institute, Karad 398 Ecotour and other local NGOs 486 Jan Shikshan Kendra305 M.S.W. College, Katol Nagaland 487 Janpad Vikas Awam Samaj Kalyan 306 M.T. Rural Deva Society, Amgaon 399 WALO & Konyak students committee Samiti +Sarvangid Gramid Vikas 307 Maharashtra Rajya Apang Karmachari 400 Ms. Amen la Jamir and Prashikchhan Samiti308 Mahila Adhyapak Vidyalay, Bhandara 401 Ms. Heckali 488 Janta Seva Samiti309 Manasi Mahila Mandal 402 Ms. Vinni 489 K.K. Degree College310 Maturchhaya Gramin Vikas 403 Ms. Sara 490 Kalpi Jalone Yuva Samiti
Sanshodhan Sanstha 404 Ms. Rosila 491 LMST311 Matrumandir Trust 405 Mr. Longsebemu 492 Lok Bandhu Seva Sansthan312 MAVIM 406 Mr. M. Kikon 493 Lokmitra313 May Mauli Orissa 494 Maharishi Dayanand Inter College,314 Nalanda Bal Vikas And Magasvargia Mahila Vikas 407 Gramvikas Brahmanpur.Tahsil- Atrauli315 Navanirmiti Samajik Sanstha 408 Ankur 495 Mahila Samakhya, Aurariya & Muzaffarnagar316 Navudhaya 409 Akssus, Ankuran 496 Manav Vikas Parishad317 Neharu yuva kendra 410 Anugul Govt. College 497 Margshree Charitable Trust318 Parulekar College, Talasari 411 Khaira College 498 Mobilization coordinator,Jalalabad319 Pen Kaps Vikas Sanstha 412 Bant College 499 PACE320 Pragati Shikshan Sanstha 413 Maharshi Dayananda College 500 Panna Lal Nagar Palika Inter College321 Prakash Prasaran Sanshta 414 Jiral College, Jiral 501 PGSS322 Prashant 415 N.C. College 502 G.B.Pant Institute of Social Sciences323 Pratham Shikshan Mandal 416 S.G. College, Kanikapada (Baulanga) 503 Manav Vikas Parishad324 Prerana Sanstha 417 Mahima College, Lakhanpur 504 Rural Youth & Cultural Development325 Prerna Sayamrojgar Udyog Kendra 418 Phulbani Govt. College 505 S.D. Inter College, Kantinagar326 Pride India, Mahad 419 Marsaghai College 506 Sahyog Samajik Sansthan327 R.R.T.K. Club Mohgaon 420 Prananath College 507 Samaj Kalyan Shiksha Sansthan328 Rajabhau Jadhav 421 Gangadharmeher College 508 Samrat Prithaviraj Chauhan 329 Rajaram bapu Dnyan Prabhodini 422 Malkanagiri College Degree College, Baghpat330 Raje Dharmrao Juniar College 423 Nabarangapur College 509 Sanchit Vikas Sansthan331 Rajrshi Shahu Gramin Vikas Prakalp 424 Bikrakmdev College 510 Santlal Arunodaya Sansthan332 Rajshatnan College Washim Punjab 511 Sarpanch,Powayan Tahsil333 Ramdev Patil College, Kuhi 425 Kheti Virasat Mission 512 SHAH Bal &Mahila Kalyan334 S. T. Karmachari Mahamandal Unit 426 Lok Bhalai Sanstha Regd 513 Sumigar Samajik Kalyan Samiti335 Saath 427 Panjab University, students and faculty 514 Sumitra Samaj Kalyan Sanstha336 SACRED Rajasthan 515 Supported by Pratham Rampur337 Sahara Yuva Sanskrutik Mandal 428 AASARO 516 Swabhiman Samiti338 Saibaba 429 ASSEFA 517 Tarun Chetna Sansthan339 Samarth shikshan & Sanskruti Sanstha 430 CECOEDECON Uttaranchal340 Samata Bahuddeshiy Shikshan Sanstha 431 CUTS 518 Action Aid341 Sane Guruji Sanstha 432 ECAT-Bodhgram 519 Bageshwar P.G. College
433 Educational & Rural 520 Daliyon Ka DagriyaDevelopment Society 521 Himalyan Jan Kalyan
434 GMVS,GESVS, VKESS Avam Bal Vikas Samiti435 GRAVIS 522 Jandesh436 Human Employment Ability Development 523 KAGAAS437 Institute of Rural Management, Jodhpur 524 Kumaon University438 JGVS 525 Mahila Kalyan Samiti439 Lok Kalyan Sansthan 526 Parvatiya Lok Shakshan 440 Lok Vikas Sansthan Samiti Amit Gram441 Modi College, NSS 527 Parvtiya Vikash Sanshthan,442 Moon Light Society 528 Sanyojak Van Gram Bhumi Adhi manch443 MVPSS, 529 Sudha444 Patel Sansthan 530 U.J.J.S.Khari445 PAVS West Bengal446 Prayas Seva Sansthan 531 Calcutta Foundation447 Sahayogi Sewa Sansthan 532 CSRA448 Saraswati Vidhalaya Shikshan Sansthan 533 Dinajpur Centre For Social Change449 SSD 534 IRSA
Tamil Nadu 535 Janasanskriti450 AID-Indida 536 Mandra Lion's Club451 Grassroots 537 Rotary Club 452 Rseeds (East Midnapur & West Midnapur)453 Aram 538 SAHAY454 AREDS 539 Sister Nivedita Kalyan Samiti455 GandhiGram University 540 Mr. Kishore Mansata,
342 Sangharsh Sevabhavi Sanstha343 Sankalp Bahuddeshiya Prakalp344 Sankalp Gram Vikas Prakalp345 Sarpanch, Dahanu346 Sarpanch, Jawahar347 Sarpanch, Mokhada348 Sarpanch, Vikramgad349 Sarpanch, Wada350 Savadha Trust351 Savitribai Phule Samajik Sanghatana352 Savli Prathithan, Killedharur353 Seva Maitriya354 Sham Shikshan Prasarak Mandal355 Shikshanagrahi356 Shiv Prakalp357 Shramik Sahayatta Mandal358 Shramik Sanghatana359 Shree. Sant Dhyaneshwar Mahila Sevabhavi 360 Shri Shani Mandir Trust, Shirpur361 Shyam Swayamsevi Sanstha362 SPPD363 Student Welfare Foundation364 Suprabhat Mahila Mandal365 Swami Vivekananad Vichar manch366 Swami Vivekanand Library
456 Manonmanian Sundaranar University Myriad Technology

ASER 2005vi
Acknowledgements
Helping the teams on the ground have been innumerable helpful and hospitable people: families of the volunteers, bus drivers, STD booth operators, college
principals, printers, neighbors and friends.
The entire ASER 2005 effort has taken less than 100 days. After village surveys and school visits were completed, the support team went to work. In particular, we
want to thank the data teams in each state for making data available almost as soon as it came in. The data analysis team in Delhi, the production and printing
teams in Mumbai, and AV team in Bangalore - all need a special thanks for endless hours, long nights of work to turn the effort of thousands into something that can
be shared quickly across the country.
We thank Dr. Montek Singh Ahluwalia, Dy. Chairman of Planning Commission, and members of the Planning Commission- Dr. Kirit Parikh and Prof. Abhijit Sen, and
several experts who helped in discussions on sampling.
We also thank Shri Amit Kaushik, Director, Elementary Education and Literacy, Ministry of Human Resource Development, for his inputs in analyzing the data.
Pratham gratefully acknowledges the support of the Commonwealth Education
Fund (CEF) for piloting tools and methodology.
Pratham gratefully acknowledges the on-going support of Oxfam Novib for the Pratham Resource Cente which led the design and preparatory work
for ASER 2005.
Also:Action Aid was the state partner for Uttaranchal. They organized surveys in 10 of 12 districts covered. Many Action Aid partners participated in Uttar Pradesh. Many
district partners in Bihar are also members of Voluntary Forum for Education. In Rajasthan, Institute of Rural Management - Jodhpur participated in the
ASER survey.

ASER 2005 vii
The appeal that went out in October, 2005
Appeal to participate, in order to IMPACT education in India
As citizens of India, each one of us has the right to monitor the work of the government and we also have the responsibility help to make our society equitable, efficient, and effective. Every Indian man, woman and child deserves a vibrant democratic society based on Izzat, Imandari, and Insaaf.
Every Indian wants India to be not only a literate but also an educated country. Every Indian child deserves an equal opportunity to build a good life. Every Indian pays regular taxes to provide elementary education to the children of India. Every Indian also pays 2% cess levied by the Government of India on all central taxes.
Pratham appeals to individuals, organizations, institutions, and businesses to join an effort to create a citizens' Annual Status of Education Report for India. In August 2004, with the help of citizens and NGOs, we led a survey of 19 districts in 17 states of India. We found that percentage of children enrolled in schools is very high (85-90%+) in most states especially in the 6-10 age group. But, in many states, 50% children in Std 2 and above, going to government schools, cannot read even simple sentences. 60% children cannot do simple subtraction, leave alone multiplication and division. For the first time, a number was put to status of basic learning in the country. Pratham did not stop at this analysis, but has been actively working with various state governments to change this reality. We are willing to do more.
ASER is not a negative idea, it is linked with a constructive satyagraha to insist on the right of the citizens to participate in the functioning of the government. We believe that good work done by governments, and there is a lot of it, deserves to be applauded. But governments must also take outcome oriented steps to improve performance of schools.
ASER is an annual effort. It will go on until December 2010 the deadline for achieving quality universal elementary education declared by Government of India.
ASER ❑ October, 2005
Pratham Resource Centre

A new girl in the class. Tamil Nadu Nov 2005
ASER 2005viii
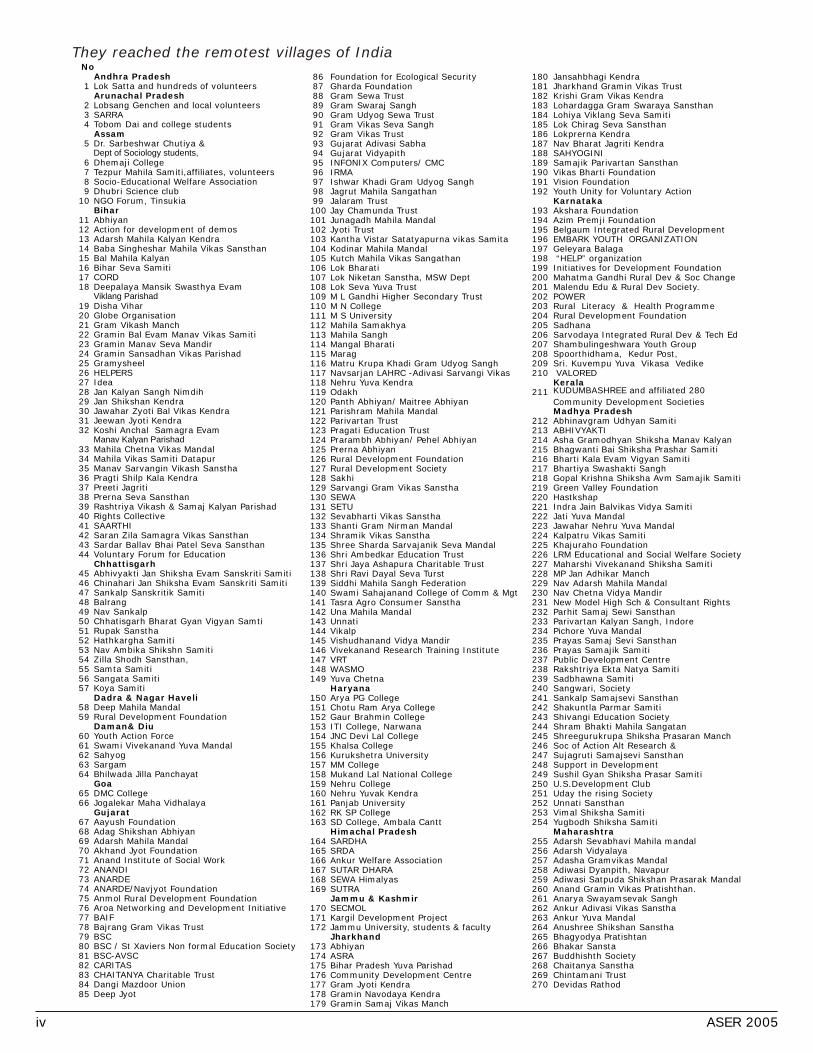
ASER 2005: CLARIFICATIONS
CLARIFICATIONS:
Only states where all districts were surveyed or almost all districts were surveyed have been ranked in the national pages (p.16). States that were not surveyed fully have not been ranked and are not included in this table.
All school observation information pertains to ONLY GOVERNMENT SCHOOLS in the surveyed villages. Private schools were not visited and therefore no observation data on private schools was collected.
Arunachal Pradesh, Assam, Jammu & Kashmir, Manipur, Meghalaya, Nagaland, and Tripura have been allocated two instead of four pages in the report due to partial coverage of districts. Dadra & Nagar Haveli, Daman & Diu and Goa too had few districts.
The following districts have very little data available on standard of the child. Therefore, results from these districts should be regarded as anomalous:
o Andhra Pradesh — Khammam;
o Assam — Sonitpur;
o Chhatisgarh — Durg;
o Madhya Pradesh — Ujjain, Indore, Shahdol and Barwani;
o Tamil Nadu — Erode.
Pupil-teacher ratio (PTR) based on enrollment is the ratio of enrolled children to appointed teachers. PTR based on attendance is the ratio of children to teachers attending on the day of the survey.

ASER 2005
Contents
❑ Map of India: district-wise, % out-of-school children ......................................................ii
❑ List of partners............................................................................................iv
❑ Acknowledgements .....................................................................................vi
❑ ASER appeal of Oct 2005 .................................................................................vii
1. ASER: The idea Madhav Chavan..............................................1
2. Set the ball rolling... Vimala Ramachandran ...................................2
3. Choosing villages ...........................................................................................5
5. What to do in a village .....................................................................................6
6. How to test reading .....................................................................................9
7. How to test arithmetic .................................................................................11
8. Map of India: district-wise % children who cannot read......................................12
9. How to read tables......................................................................................13
10. The National picture ...................................................................................15
11. Map of India: % children who cannot do arithmetic ..........................................24
12. Jammu and Kashmir, Himachal Pradesh, Uttaranchal, Punjab, Haryana ................26
13. Rajasthan, Uttar Pradesh, Bihar, West Bengal, Jharkhand ..................................44
14. Gujarat, Daman and Diu, Dadra Nagar Haveli, Madhya Pradesh,
Chhattisgarh, Orissa ...................................................................................66
15. Maharshtra, Andhra Pradesh, Goa, Karnataka, Kerala, Tamil Nadu.......................88
17. Tripura, Assam, Meghalay, Manipur, Nagaland, Arunachal Pradesh.....................112
❑ Support in cash and in kind .........................................................................124
Annexures
A. Sample ............................................................................................126
B. Sample design ...................................................................................127
C. Comparisons With Other Data ...............................................................129
D. Formats ...........................................................................................132
Index

ASER 2005

ASER: The idea
The picture on the opposite page is a snapshot of a scene on a particular day in November '05.
ASER2005 is a collective snapshot taken by about twenty thousand volunteers between November 14 and December 20, 2005. It represents reality at that point but we sense that the reality is changing. We intend to participate in that change, accelerate it, and shape it, because we believe that as citizens, it is our self-evident right and responsibility to do so. ASER is a declaration of this right and the responsibility that goes with it.
The picture on the facing page could raise many questions. Why is the boy carrying the burden? Why is the volunteer testing him with his burden on his head? Why on the road? What are the school-boy's thoughts? Why did the photographer take a picture of a boy?
ASER2005 looks at some simple basic indicators. Our report will lead to many questions too. But some facts will stand clear like the burden on the boy's head, and the schoolbag on the other boy's back. This Report consists mainly of tables, charts, and graphs in addition to a few notes on the methodology. There is very little textual analysis and commentary. This is because first of all, the facts speak for themselves. Secondly, we had set ourselves a deadline of publication before the Republic Day of 2006, which did not leave much time for detailed analysis. Following this Report, we intend to launch a periodical called “ASER Discussions” to further analyze the data and to improve the subsequent ASERs.
The young people of ASER experienced a oneness of India in its villages that we could not capture in this report. Young women from Delhi went to remote areas of the Hilly North and the Northeast, the plains of Haryana, Punjab, and UP. Everywhere they were greeted with great warmth in every home. Other men and women from the East, West and South ventured into 'dangerous' territories where there is no evidence of government. Social networks came alive in many places where neither NGOs nor college contacts were readily available. Volunteers were greeted in every village, every school, and every home warmly. The act of testing brought many people together. Children wanted to be tested. Mothers wanted children tested. “Can my child read?”
The idea behind ASER is not just to take a snapshot for display or to merely make a statement. It is more than that. This is our country, these are our children, and the snapshot is to inform ourselves, the people of India, so that we understand the situation first hand and act to change the picture. The ASER results will be taken back to the districts and villages so that people can think about what to do next. We will extend a helping hand to the various levels of government to change the situation.
The issues of development of a modern democracy are linked with every problem of India one can think of. Education is no exception. Evidence-based discussions should be an important component in the development of democracy. In the absence of clear, consistent, and credible data such discussions are impossible. Recently governments have started commissioning independent third party evaluations and assessments. In that case, is ASER needed? If ASER was a small research agency, it would be redundant. But as a movement that takes scientific methods of assessment and analysis to large numbers of ordinary people and demystifies them, ASER has its own place.
On October 2, 2005, when the first email about ASER went out to five people in Pratham, we sort of knew we could do it. But, having reached and touched 84% of rural India at a breakneck speed, I can say on behalf of every person who became a part of ASER that we are proud of the effort and the result.
Madhav Chavan
1ASER 2005
Lava
Highlight
Lava
Underline
Lava
Highlight
Lava
Highlight
Lava
Highlight
Lava
Highlight
Lava
Highlight
Lava
Highlight

1Vimala Ramchandran
Set the ball rolling…
2 ASER 2005
1 Educational Resource Unit, Delhi
2 (1) Pratichi (India) Trust: The Pratichi Education Report, New Delhi 2002 and PROBE Report. 1999. (2) Public Report on Basic Education in India. Delhi: Oxford University
Press. (3) Jha, Jyotsna and Dhir Jhingran, Elementary Education for the Poorest and other Deprived Groups, Centre for Policy Research, New Delhi 2002, (4) Vasavi, A. R. and K. Chamraj. 2000. Community-School Interlinks: Preliminary Report of a Socio-anthropological Study of Primary Education in Five Districts of Karnataka. Bangalore. National Institute of Advances Studies. (5) Ramachandran, Vimala (ed): Hierarchies of Access: Gender and Social Equity in Primary Education in India, Sage Publications, 2004.3 Apparently the report has just been submitted by IMRB.
Over the years people engaged with elementary education have been wrestling with tools to make a realistic assessment of both provisions (teachers, schools, facilities) and outcomes (learning). Given the size and enormous diversity of India, this has remained a huge challenge. At periodic intervals sample surveys like NSS and NFHS have generated information on children attending school and mean years of schooling, which have been used by different constituencies to illustrate the progress or lack of it in the education sector. Equally national research studies like PROBE (1999) or state specific studies like Pratichi Education report (2002) have drawn the attention of the government to school participation, teacher availability, attendance and learning1. Similarly donor sponsored studies – for example on teacher absence – have also turned the spotlight on some important issues. Commissioned studies done under the aegis of District Primary Education Programme (DPEP) and, now Sarva Shiksha Abhiyan (SSA) have also been valuable additions to our knowledge base.
While some of these studies have drawn flack from official quarters they have nevertheless forced attention on both the dismal situation in large parts of the country and the success stories notably the near universal school participation in Himachal Pradesh. The government has also made commendable efforts to fine-tune official DISE statistics and the ten-yearly educational survey (NCERT) to capture progress towards educational objectives. At the same time the government has also admitted the limitations of data generated by the system. Most recently Government of India commissioned a
2 sample survey to estimate the number of out-of-school children . This is indeed a welcome step
because comparing system generated statistics with information generated through sample survey would indeed give us valuable insights into the situation on the ground.
Notwithstanding the range and wealth of information generated on different aspects of elementary education, there has been a growing realisation that periodic independent assessment of where we are with respect to both provision as well as outcomes is necessary. It is in this context that ASER 2005 initiated by Pratham is valuable. The survey is commendable not only because it has been done in 485 districts across the country but because it involved a wide range of people – from local voluntary organisations to ordinary citizens who volunteered to participate in the survey. Among the little known facts of ASER is that 373 districts were paid for by individual donors or institutions who contributed Rs 500 to Rs 10,000 each to cover the cost of the survey. Voluntary and social action groups joined in as partners with close to 776 small and big groups joining the effort in different ways.
The survey consisted of three parts – household level interviews, testing of children (using tests to assess ability to read and to do simple arithmetic at the class 2 level) and status of government schools. This may seem very simplistic to many people in the academia. Equally educationists used to debating the fine points of learning and testing may express their outrage at such an endeavour. Yet discussions with people involved in the survey revealed that they felt that even such basic testing (of reading paragraph and story and subtraction and division in arithmetic) drew the attention of the parents and community leaders to whether children were learning.
The findings of ASER are quite interesting. While there have really not been any big surprises with respect to enrolment, the most disturbing finding is that close to 1.2 crore children are still out of school! The situation in Bihar (13.5%), Rajasthan (10.4%), Jharkhand (9.8%) and even Andhra Pradesh (7.4%) is quite worrisome. Almost 8 years of DPEP and 3 years of Sarva Shiksha Abhiyan –
Lava
Highlight
Lava
Highlight
Lava
Highlight
Lava
Highlight
Lava
Highlight
Lava
Highlight
Lava
Highlight
Lava
Underline
Lava
Underline

3ASER 2005
apart from state specific projects like Andhra Pradesh Primary Education Project (1987-1994), Bihar Education Project (1991 till it merged with DPEP in 1994), Rajasthan Shiksha Karmi Project (1987 to 2003) and Rajasthan Lok Jumbish (1992 to 2004) – seem to have had limited impact.
The good news is that the gender gap in the percentage of out of school children has come down. Till 2001 it was estimated that over 65% of out of school children were girls. Now it is 52% (6-10 age) and 55% (11-14 age). Another good news is that 77.2% teachers were found to be present in the school and that only 8.3% of primary schools and 7.5% of upper primary schools did not have teachers. In several states 100% of teachers appointed to the surveyed school were present on the day of visit. The flip side is also interesting – 37.2% of primary schools and 25% of upper primary schools (government schools) visited in Kerala did not have any teacher present on the day of visit!
ASER has confirmed that the percentage of boys to girls in private school is skewed in favour of the former. While the all-India proportion is 60:40, state-wise differences are significant. The ratio worsens as we move north of the Narmada towards Madhya Pradesh, Rajasthan, Uttar Pradesh, Bihar and so on. Some preference is demonstrated in more ways than sex-selective abortions.
The alarming findings relate to reading and arithmetic. ASER did not test children for age or grade specific competency. It tested the ability of children to read (a simple paragraph or story pitched at grade 2 level). Close to 35% of children in the 7-14 age group could not read a simple paragraph (grade 1 level difficulty) and almost 60% of children could not read a simple story (grade 2 level difficulty). The huge surprise is that the situation in Tamil Nadu, Karnataka and Gujarat (where the schools function and where all provision related indicators are good) are far worse than Bihar, and Chhattisgarh (where indicators like teacher-pupil ratio, drop out rates and schooling facilities are abysmal). The percentage point difference between government and private schools is approximately 10. Which means that almost 30% of children in private schools cannot read grade one level paragraphs.
The situation with respect to mathematics is also quite alarming. Our IT hubs like Karnataka and Tamil Nadu need to seriously think about the way mathematics is taught in schools – government as well as private. Similarly, despite so many years of back-to-school programmes and bridge courses in Andhra Pradesh, the percentage of out of school children is indeed worrying. This is particularly alarming in the light of girl child labour in cottonseed farms and in cotton plucking. Here is a state that traverses a pre-industrial agrarian situation with a highly modern information technology industry.
We need to interpret these findings with caution. It has to be noted that while a significant proportion children entering class 1 reach class 5 in Tamil Nadu and Karnataka, the drop out rate in Bihar is high. Furthermore only around 51.8% of enrolled children attend school regularly. Therefore (unlike TN and Karnataka) the ones who have reached class 5 are not only a self-selected group but they are the ones who are highly motivated. These findings may just be revealing a small tip of the iceberg. There is an urgent need to study when and how good provisions (classrooms, teachers, textbooks, mid day meal and so on) translate into outcomes in learning and in ability of children to complete schooling.
The data generated by ASER needs far more rigorous analysis and that would be done in the coming months. The single most important contribution of ASER is that an independent group got together an interesting range of individuals and organisations to find out what is really happening to our children. Creating a space for independent (neither government sponsored or donor driven) assessment of India’s progress towards universal elementary education is invaluable. This effort could perhaps encourage groups across the country to initiate similar audit of education, child development, health and indeed many other dimensions of development.
Lava
Highlight

From : MysoreDate: November 11, 2005
The local people surrounding the following 2 villages in Chikamagalur district of Karnataka
are of the opinion that it may be difficult for the volunteers to approach them for survey.
Recently a police van was blown up. The situation at present is a bit tensed. We hope
the situation will ease out in the next few days in which case the same villages will be
surveyed with police assistance. If the situation continues to be tense, we may
please be suggested alternative villages for replacement, which may be considered only
in case it is absolutely necessary.
From: Madhya PradeshConversations with team
Sometimes it is hard work to find the villages that have been selected for the survey. Frequently, the names of villages as they are known locally are different from the names given in the census. The village list from the census is in English but in Hindi the name sounds different. This makes many villages difficult to find. Volunteers ask directions from locals in nearby villages, from hospitals, police stations and government offices, from petrol bunks and even from passing truck drivers. In Bhopal district of Madhya Pradesh, one survey team spent an entire day looking for a village whose name was slightly misspelled in the census. After travelling 80 km in the wrong direction, a policeman from the police headquarters of a particular block who happened to come from that village finally escorted them there.
From: Tamil NaduDate: 3/12/2005 2:40 pm
We have problem in Cuddalore district. Survey for all 20 villages were completed on 20 and 21 of Nov. But because of heavy rains and floods, the houses of many of our volunteers (Tutors of Vidyarambam) have got heavily damaged and they all have shifted to relief camps. We could not establish contact with most of them and as such we are not sure of the fate of ASER survey report. Hopefully the papers are intact. Similarly there are damages in Thanjavur, Nagapattinam, Trichy andPerambalur districts. Today I am personally leading a team to Cuddalore to assess the damage.
From Uttar Pradesh:
One volunteer: “People say nobody can enter these villages. These are villages of dacoits. I am afraid… but I want to survey the villages… shall I go??… I want to go…” The village was
surveyed.
Another on mobile phone: “Please talk to this Inspector. We have been brought to the police
station and they won't let us go. It is getting late. We will not be able to survey if it gets
dark…. They think we boys and girls are up to no good. I have told them everything about
what we are doing..”. The Inspector promised to cooperate. But the volunteers could leave only by 3:30 pm. Survey went on well after
sunset… the villagers gave food.
4 ASER 2005

Rukmini Banerji
Sitting with a map of India, looking at the length and breadth of the country, mountains in
the north, forests and ravines in the centre, densely populated plains, arid and thinly
populated desert lands in the west, fertile belts in along the southern coasts …. ASER 2005
was to be a snapshot of the status of schooling and learning in the country; the effort
reliably capturing the rich diversity of rural India.
How many villages should we go to in each district? How should these villages be chosen? Should the
same strategy for choosing villages be used for remote sparsely peopled areas as they are for crowded
and accessible regions? To reach deep into each district and spread wide across rural India, a large
sample size was needed. If all districts in a state could not be done, would the districts that were done
still count for something? But how large did the sample size need to be to generate reliable district level
estimates so that the ASER report of each district level could represent the current schooling and
learning experiences of children.
The search and the research began. Consulting sampling experts, meeting professors in universities,
statisticians in research institutions, survey organizations, looking up Census of India, National Sample
Survey, absorbing technical reports, statistics textbooks, weighing options and alternatives… finally
decisions were taken.
Using villages lists from the 2001 census, villages were selected randomly within each district using 1probability proportional to size method of sampling (PPS) . Some villages were easily accessible by
public transport, in other cases teams had to walk long distances to remote villages. Volunteers
traveled for a day or more into the Thar desert in Rajasthan, in the mountains of Uttaranchal, and
across jungles near the Myanmar border to survey villages. In a few cases, ASER teams needed
security escort to venture into dangerous or disturbed areas. Only in rare or specific instances were
villages or districts omitted from the survey; this typically happened because of security concerns,
inaccessibility, or harsh weather.
The names on the map of India begin to assume great significance. These are places that we
have to go to. There are so many names that do not show up on the map but we know they
are there because they are on our village lists. Villages are being found. Small settlements
and big villages; villages with scattered hamlet…..from Thiruvananthapuram and
Kannyakumari in the southern tip of the country to Leh and Kargil in Ladakh, Rajouri and
Poonch in Jammu, to Tinsukia in Assam, East Siang in Arunachal and Kutch near the Arabian
Sea.
509 rural districts participated in ASER 2005; data from 485 districts has been used in this report. More
than 9521 villages across the country were visited.
1MODE provided technical advice on sampling for ASER 2005. See annexure for technical details of sampling design.
Choosing villages
5ASER 2005
Lava
Highlight
Lava
Highlight

What to do in the village
6 ASER 2005
These were the instructions given to all participants in ASER 2005. The instructions have been translated into over 15 languages and executed in 28 states and union territories
TASK 1: HOW TO MAKE A MAP
Contact Sarpanch: Introduce yourself to the Sarpanch or to other senior members of the panchayat. Tell them about ASER. Ask them for information about schools in the village and around the village. Get the approximate number of households in the village from the Sarpanch.
Start mapping: To get to know the village, walk around and start mapping.
o Talk to people: How many different hamlets/sections are there in the village? Where they are located? What is the estimate of households in each hamlet/section? Tell them about ASER.
o Map: On the map, show the main landmarks – temples, mosques, river, school, bus-stop, panchayat bhavan, shop etc. Mark the main roads/streets/paths through the village prominently on the map.
Marking and numbering sections: If the village has hamlets, then mark the hamlets on the map and number them. If the village is one continuous habitation then divide the entire village in 4 sections. For each hamlet/section, note the estimated number of households. Verify all the information on the map with people in the village as you walk around.
TASK 2: HOW TO SAMPLE HOUSEHOLDS AND CHILDREN TO BE SURVEYED
If the village consists of more than 4 different hamlets, then make chits with numbers for each hamlet. Randomly pick 4 chits. If there are 4 or less hamlets, then we will go to all hamlets. If the village is one continuous habitation, then divide the entire village into four quadrants/sections. We will visit each quadrant/section. Outline these sections on the village map.
In each hamlet/section of the village, we need to survey all children from 5 households. Thus for the entire village, there will be information for about 20 randomly selected households.
thIn each hamlet/section. Try to find the central point in that habitation. Visit every 5 dwelling in
st th ththe habitation (e.g. 1 house, 6 house, 11 house ..). Get information about the household. Survey & test every child between the ages of 6 and 14 in that household. Stop after you have completed 5 households in that section. If you have you have reached the end of the section, go
tharound again using the same every 5 household rule.
Now move to the next selected hamlet/quadrant. Follow the same process.
If the selected dwelling is closed or if there is no body at home, note that down on your survey sheet as “house closed” move to the next house. Continue until you have 5 households in which there were inhabitants, Note down information about the household. Test children from 6 up to the age of 14.
Make sure that you go to households on a Sunday or holiday when children are likely to be home.
Lava
Highlight
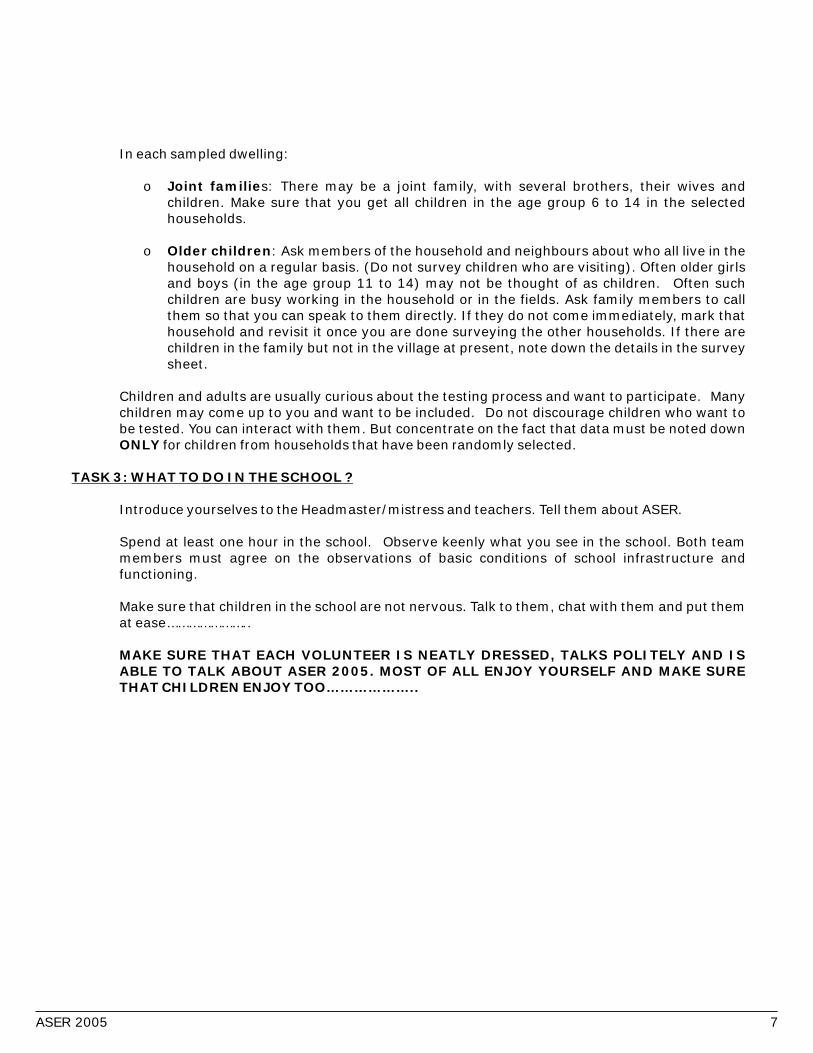
In each sampled dwelling:
o Joint families: There may be a joint family, with several brothers, their wives and children. Make sure that you get all children in the age group 6 to 14 in the selected households.
o Older children: Ask members of the household and neighbours about who all live in the household on a regular basis. (Do not survey children who are visiting). Often older girls and boys (in the age group 11 to 14) may not be thought of as children. Often such children are busy working in the household or in the fields. Ask family members to call them so that you can speak to them directly. If they do not come immediately, mark that household and revisit it once you are done surveying the other households. If there are children in the family but not in the village at present, note down the details in the survey sheet.
Children and adults are usually curious about the testing process and want to participate. Many children may come up to you and want to be included. Do not discourage children who want to be tested. You can interact with them. But concentrate on the fact that data must be noted down ONLY for children from households that have been randomly selected.
TASK 3: WHAT TO DO IN THE SCHOOL ?
Introduce yourselves to the Headmaster/mistress and teachers. Tell them about ASER.
Spend at least one hour in the school. Observe keenly what you see in the school. Both team members must agree on the observations of basic conditions of school infrastructure and functioning.
Make sure that children in the school are not nervous. Talk to them, chat with them and put them at ease…………………..
MAKE SURE THAT EACH VOLUNTEER IS NEATLY DRESSED, TALKS POLITELY AND IS ABLE TO TALK ABOUT ASER 2005. MOST OF ALL ENJOY YOURSELF AND MAKE SURE THAT CHILDREN ENJOY TOO………………..
7ASER 2005

Reading tasks for Rani
Children are assessed as being in one of the following five categories: Level 2 (story), Level 1 (easy paragraph), Word, Letter, Not able to recognize letters.
8 ASER 2005
Lava
Highlight
Lava
Highlight

9ASER 2005
How to test reading. Can Rani read?
Ask the child to read any 5 letters from the letters list. Let the child choose the letters herself. If she can correctly recognize at least 4 out of 5 letters with ease, then show her the list of words again.
She will be marked as a “letter” child if he can read 4 out of 5 letters but cannot read words.
If not, then mark her as a child who cannot even recognize letters.
EASY PARAGRAPH - LEVEL 1
Point to one of the easy paragraphs. Ask the child to read the easy paragraph. The child may read slowly. She may stop frequently; shemay make 3 or 4 mistakes in not reading words correctly. But as long as the child reads the text like she is reading a sentence, she should be categorized as a child who can read easy paragraphs. This level is also called LEVEL 1.
START HERE:
While reading the paragraph, if the child stops very often, has difficulty with more than 3 or 4 words and reads like she is reading a string of words not a sentence, then show her the list of words.
Ask the child to read any 5 words from the word list. Let the child choose the words herself.
If she can correctly read at least 4 out of the 5 words with ease, then ask her to try to read the easy para again.
Mark her as a “word” category child if she can correctly and comfortably read words but is still struggling with the easy para.
If she cannot correctly read at least 4 out of the 5 words she chooses, then show her the list of letters.
NEXT, DOWORDS
NEXT, DOLETTERS
If the child reads the paragraph fluently with ease, then ask herto read the story or LEVEL 2 text.
Show the child the story. If she can read fluently with ease and reads like she is reading a long text, then she is marked as a “story” child. This child can read LEVEL 2 text.
If she is unable to read the story fluently and stops a lot, mark her as a “paragraph child”. This child can read LEVEL 1 text.
NEXT, DOSTORYLEVEL 2
Lava
Highlight

Make sure children are relaxed. Chat with them : ask them ~ who is their best friend, what is their favourite game … Playing simple games may also help. When the child seems relaxed then you can introduce the testing tasks. Give children time to become familiar with the tool and the task. Each tester has several sample tests. Let the child practice for a few minutes with one sample paper. For actual testing use a different one. If the child makes a mistake, let her have another chance. Show her a different problem. If she is struggling with subtraction, take her to number recognition and then come back to subtraction. Work with the child, until you are sure of what the child is able to do comfortably and confidently.
ASER 200510
Number Subtraction Division
Ask any 5. Of 5, 4 must be correct Ask any 2. Both must be correct Ask any 1, it must be correct
Aser
Arithmetic tasks for Rani
Lava
Highlight

Show the child the division problems. She can choose one to try. Ask her to tell you what the problem is and what she has to do.
Ask her to write and solve the problem.
Observe what she does. if she is able to correctly solve the problem, then mark her as a “division child.”
If she is unable to do one problem, give her another problem from the sheet.
If she is unable to solve any division problem correctly, mark her as a child who can do “subtraction”.
How to test arithmetic. Can Rani do arithmetic?
START HERE WITH SUBTRACTION
Point one by one to at least 5 numbers.
Ask her to identify numbers.
If she can correctly identify at least 4 out of 5 numbers then mark her as a child who can “recognize numbers.”
If not, mark her as a child who “cannot even
56- 38
Point to any one of the subtraction sums. Ask the child what the numbers are. For example: 56. If the child says 5 and 6, ask her again to say what the number is when the numbers are together. Point to the minus sign and ask “what do you have to do?”
Once you have established that the child correctly recognizes the numbers you are showing her, ask her to write and solve the problem. Give her or let her choose another similar problem from the sums on the page. Observe the child as she solves the sum.
SUBTRACTION: 2 DIGIT WITH BORROWING
If she does both the subtraction problems correctly, give her a division problem.
If she cannot correctly do the subtraction problems, then give her the number recognition task.
NEXT, DO NUMBER RECOGNITION
NEXT, DO DIVISION
NumberRecognition (20-100)
48
36
Division 3 digit by 1 digit
11ASER 2005

Gilghit
Chilas
SRINAGAR
Kargil
Leh
Anantnag
KashmirNorth
Punch
Udhampur
Mirpur
Kathua
Gilgitwazara
Riasi
TribalTerritory
Muzzararbad
Ladakh
Jammu
JAMMU AND KASHMIR
Chamba
Dharamsala
Kullu
MandiKinnaur
Bilaspur
SHIMLA
HamirpurUna
Solan
Sirmaur
Kangra
La ul S tih and pi
HIMACHAL PRADESHGurdaspur
AmritsarHoshiarpur
Kapurthala
Jalandhar Nawanshahr
PUNJAB
Firozpur
Faridkot
Moga Ludhiana Rupnagar
FatehgarhSahib
Muktsar Sangrur
Bathinda
Mansa
Patiala
Kapurthala
DEHRADUN
Uttarkashi
Rudraprayag
Chamoli
Haridwar BageshwarPithoragarh
Almora
Nainital
Champawat
Tehri Garhwal
Pauri
Udham Singh Nagar
UTTARANCHAL
Sirsa Fatehabad
Hisar
Bhiwani
Kaithal
Karnal
JindPanipat
SonipatRohtak
Jhajjar
Mahendragarh GurgaonRewari
Faridabad
Kurukshetra
Ambala
Yamunanagar
Panchkula
HARYANA
LUCKNOW
Ghaziabad
Meerut
BijnorMuzaffarnagar
Saharanpur
Moradabad
RampurPilibhit
Bulandshahar Bareilly
BadaunAligarh
HathrasEtah
Shahjahanpur
Mathura
MainpuriAgra
Firozabad
Etawah
Kannauj
Hardoi
Sitapur
Kheri
BahraichBalrampur
GondaBara-Banki
Jhansi
Lalitpur
Hamirpur
Auraiya
Mahoba
Kanpur Rural
Unnao
Rae Bareli
FaizabadBasti
SultanpurAzamgarh
Gorakhpur
Deoria
Mau
Maharajganj
BalliaGhazipurJaunpur
Kaushambi
Banda
Fatehpur
Baghpat
JPN
Gautam Budda Nagar
Farukhabad
Shrawasti
Jalaun
Siddhart Nagar
Pratapgarh
Chitrakoot
AN
SKN
Kushinagar
Allahabad
Chandauli
Sonbhadra
UTTAR PRADESH
Varanasi
Mirzapur
SRN
Kanpur Urban
Fatehpur
RAJ ASTH AN
JAIPUR
Ganganagar
Hanumangarh
Bikaner
Jaisalmer
Barmer
Jalor
Sirohi
Udaipur
Rajasamand
Chittaurgarh
Bhilwara
Pali
Jodhpur
Nagaur
Ajmer
Dhaulpur
Alwar
Bharatpur
Karauli
Tonk SawaiMadhopur
Bundi
KotaBaran
Jhalawar
Dungarpur
Banswara
Churu
Jhunjhunun
Sikar
Dausa
Chittaurgarh
Patan
Mehsana
Jamnagar
Rajkot
Porbander
JunagadhAmreli
Bhavnagar
Ahmedabad
Kheda
Anand
Vadodara
Bharuch
Surat
Navsari
Narmada
Panch Mahals
Sabar Kantha
Banas Kantha
Kachchh
Rann of Kachchh
Dahod
The Dangs
ValsadDAMAN AND DIU
Surendranagar
GUJARATGANDHINAGAR
MUMBAI
MA H AR AS HT RA
Nandurbar
Nashik
Thane
Raigad
Pune
Ahmednagar
AurangabadJalna
Dhule
Jalgaon
Buldhana
Akola
Amravati
Wardha
Yavatmal
Washim
Hingoli
Bid
ParbhaniNanded
Latur
Satara
RatnagiriSangli
Kolhapur
Solapur
Gondia
Bhandara
Nagpur
Gadchiroli
Chandrapur
Sindhudurg
Usmanabad
BHOPAL
BhindMorena
Gwalior
Sheopur
Shivpuri
Datia
Neemach
Barwani
Jhabua
DharIndore
Mandsaur
RatlamUjjain
Shajapur
Dewas
Rajgarh
Sehore
Vidisha
Raisen
Guna
Tikamgarh
Sagar DamohKatni
Jabalpur
Narsimhapur
Mandla
Hoshangabad
Harda
Betul
ChhindwaraSeoni
Balaghat
Panna
ChhatarpurSatna Rewa
Sidhi
East Nimar
Dindori
Umaria
Shahdol
West Nimar
MADHYA PRADESH
PATNA
Aurangabad
Bhabua
Rohtas
Gaya
Buxar
Jahanabad
Bhojpur
Nawada
Sheikhpura
Lukhisarai
JamuiBanka
Munger
Begusarai Khagaria
Samastipur
Saharsa
Muzaffarpur Madhepura
Darbhanga
Katihar
Purnia
SupaulAraria
Kishanganj
Siwan
Gopalganj SheoharMadhubani
Sitamarhi
Bhagalpur
VaishaliSaran
PaschimChamparan
Nalanda
PurbiChamparan
BIHAR
Khonsa
Changlang
Tawang
YingkiongAnini
Tezu
West Kameng
East Kameng
Papum Pare
Lower Subansiri
Upper Subansiri
East Siang
Upper Siang
West SiangA RU N AC H AL
P R AD ES H
DISPUR
Kokrajhar
Borpeta
Nalbari
GoalparaDhubri
Nagoan
Karimganj
Hailakandi
Karbi Anglang
Jorhat
Sibsagar
Dibrugarh
Dhemaji
Sonitpur
North Cachar Hills
Cachar
Kamrup
Bongaigaon
Darrang
Tinsukia
Golaghat
Lakhimpur
Morigaon
KarbiAnglang
ASSAM
IMPHAL East
ChurachandpurChandel
ThoubalBishnupur
Imphal West
Ukhrul
Senapati
Tamenglong
MANIPUR
NAGALAND
KOHIMA
Phek
Zunheboto
Wokha
Mokokchung
Tuensang
Mon
Dimapur
SHILLONGMEGHALAYAWest Garo Hills
South Garo Hills
East Garo Hills
West Khasi Hills
Ri Bhoi
Jaintia HillsEast Khasi Hills
AIZAWAL
MIZORAM
Lunglei
Serchhip
Saiha
Mamit
Kolasib
Champhai
Lawngtlai
Agartala
TRIPURA
North Tripura
Udaipur
South Tripura
Dhalai
Kailashahar
West Tripura
WEST BENGALKOLKATA
Medinipur
Haora
PuruliyaBankura
Barddhaman
Jalpaiguri
Darjiling
Koch Bihar
Uttar Dinajpur
Dakshin Dinajpur
Maldah
Birbhum
HugliNorth 24 Paraganaa
South 24 Paraganaa
Murshidabad
Nadia
GANGTOK
SIKKIM
Namchi
Mangan
Lachen
North
West
East
South
JHARKHAND
RANCHI
Saraikela
Gumla
Lohardaga
Garhwa
Latehar
Hazaribag
Chatra
Bokaro
Dhanbad
Giridih DumkaDeogarh
GoddaPakur
Sahibganj
Kodarma
Palamau
East Singbhum
Sindega
West Singbhum
Jamatara
BHUBANESWAR
Malkangiri
Koraput
NabarangpurRayagada
PuriKalahandi
NuaparhaBalangir
NayagarhPhulbani
Sonapur
Bauda
Angul
Bargarh Sambalpur
Khorda
Cuttack
Jagatsinghpur
Kendrapara
Dhenkanal
Bhadrak
Baleshwar
Deogarh
KendujhargarhJharsuguda
Sundargarh
Mayurbhanj
Jajpur
Ganjam
Gajapati
ORISSA
(Khandamal)
RAIPUR
Dantewada
Kanker
Dhamtari
Raj Nandgaon
Durg
Mahasumund
Bilaspur
Janjgir
Raigarh
SurgujaKoriya
Jashpur
Korba
Kawardha
Bastar
CHHATTISGARH
HYDERABAD
Adilabad
NizamabadKarimnagar
Rangareddi
Mahbubnagar
Chittoor
Anantapur
Cuddapah Nellore
Guntur
Kurnool
Nalgonda
KhammamEast Godavari
Yaman (PONDICHERRY)
Warangal
Vishakhapatnam
Vizianagaram
Srikakulam
West Godavari
Krishna
Prakasam
Medak
ANDHRA PRADESH
North Goa
South Goa
GOA
KARNATAKA
BANGALORE
Bidar
Gulbarga
Raichur
Bijapur
Bagalkot
KoppalDharwadGadag
Belgaum
Haveri
ChitradurgaShimoga
Udipi
Chikmangalur
Hassan
Mandya
Mysore
Chamaranj nagar
Tumkur
Kolar
Bellary
Dakshin Kannad
Uttar Kannad
Devangere
Kodagu
Tumkur
KARNATAKA
TAMILNADU
PONDICHERRY
CHENNAI
Coimbatore
Tirunelveli
Thoothukkudi
RamanathapuramVirudunagar
Shivaganga
MaduraiTheni
Dindigul Pudukkottai
Thanjavur
KarurTiruchchirappalli
Nagapattinam
Thiruvarur
Karaikal (PONDICHERRY)
ErodeNamakkal
Perambalur
AriyalurNagapattinam
Salem
Dharmapuri
Tiruvannamalai
Villupuram
Cuddalore
Vellore Kancheepuram
Tiruvallur
Kanyakumari
The Nilgiris
K
R
A
E
L
A
THIRUVANANTHAPURAM
Kasargod
Kannur
MAHE(PONDICHERRY)
Kozhikode(Calicut)
Malappuram
Palakkad
Thrissur
Ernakulam
Alappuzha Kottayam
Pathanamthitta
Kollam
Wayanad
IdukkiKochi
0-15
15-30
30-45
45-60
60-75
75+
No Data
Percentage of children
N
Districtwise percentage of children in Std V who cannot read Std II level
simple text fluently
12 ASER 2005
Maps may not be accurate or to-scale. These are mere representations.
INDIA Rural
Lava
Highlight
Lava
Highlight

Percentage of children who can read….
Std NothingAlpha-bets
WordPara
LEVEL-1Story
LEVEL-2Total
These are children
who cannot read
EVEN level-1
In this table, of all children in standard VIII:
❑ 8.72% can read a level 1 paragraph, and
❑ 85.64% can read a level 2 story
Therefore, in standard VIII, the percentage of children who :
❑ cannot read a level 2 story is the sum of those who can read nothing, those who recognize alphabets, those who recognize words and finally those who can read a paragraph of level 1 difficulty (14.36% = 1.74 + 1.39 + 2.51 + 8.72).
❑ Similarly the percentage of children who cannot read a level 1 paragraph is the sum of those who can read nothing, those who recognize alphabets, and those who recognize words (5.64% = 1.74 + 1.39 + 2.51).
ASER 2005 13
HOW TO READ THE TABLES: READING
In the learning section of the report, some of the tables have been presented in terms of children who
can do certain reading tasks and some others in terms of children who cannot do these tasks. Since
the numbers may not be obvious to the reader an explanation of how to read them is given below.
Reading: Children were tested on 5 levels of reading:
❑ The highest level (referred to as Level-2 in the ASER report) was whether they could read a
simple “story” with long sentences of standard II difficulty.
❑ The next level (referred to as Level-1 in the ASER report) was a small “paragraph” with short
sentences of standard I difficulty.
❑ The subsequent level was word recognition.
❑ The most basic level of reading was letter recognition.
❑ Finally, if the child could not even recognize letters of the alphabet, he/she was designated as a
non-reader.
Note that children, who can read a simple story of standard II level may be capable of higher levels of
reading. Therefore, the estimates in the learning tables were presented in terms of children who
cannot do certain levels in reading.
EXAMPLE: Look at the table below that refers to reading levels of children in different standards. These
tables were used to generate the learning curve graphs.
II
IIII
IIIIII
IVIV
VV
VIVI
VIIVII
VIIIVIII
These are children who cannot read level-2
42.36 32.16
18.04 28.25
9.2 16.61
5.09 9.33
3.92 5.69
2.78 3.42
2.25 2.10
1.74 1.39
15.53 4.77 5.19 100
26.71 14.38 12.61 100
22.76 24.19 27.24 100
14.63 24.57 46.39 100
9.78 20.82 59.79 100
6.41 15.66 71.73 100
4.11 11.46 80.07 100
2.51 8.72 85.64 100
11.77 14.05 14.53 16.59 43.06 100

StdNothing Number-
recognitionSubtraction Division Total
Can do
division
AND
subtraction
Can do up
to
subtraction
but not
division
These children cannot do subtraction (n)or
division.
Children who can solve
Of all children in standard VIII:
❑ 17.78% can do subtraction, and ❑ 69.02% can divide.
Therefore, in class VIII, the percentage of children who cannot divide is the sum of those who cannot even recognize numbers, those who can recognize numbers, and those who can do subtraction (30.98% = 3.59 + 9.61 + 17.78).
Similarly the percentage of children who cannot subtract or divide is the sum of those who cannot even recognize numbers and those who can recognize numbers but cannot do subtraction (13.2% = 3.59 + 9.61).
14 ASER 2005
HOW TO READ THE TABLES: ARITHMETIC
In the learning section of the report, some of the tables have been presented in terms of children who
can do certain arithmetic tasks and some others in terms of children who cannot do these tasks. Since
the numbers may not be obvious to the reader an explanation of how to read them is given below.
Arithmetic: Children were tested on 4 levels of arithmetic:
❑ The highest level was whether they could divide a 3 digit number by a 1 single digit number.
❑ The next level was 2 digit subtraction with borrowing.
❑ The subsequent level was number recognition between 1 - 100.
❑ If the child could not even recognize numbers, he/she was classified as a child who could not
recognize numbers.
Note that children, who can divide a 3 digit number by a single digit number, might be capable of higher
levels of arithmetic.
EXAMPLE: Look at the table below that refers to arithmetic levels of children in different standards.
These tables were used to generate the learning curve graphs
These children cannot do division
100
100
100
100
100
100
100
100
100
I
II
III
IV
V
VI
VII
VIII
57.87 33.69 5.53 2.90
32.08 44.77 16.97 6.18
18.14 35.59 31.66 14.61
11.53 24.17 33.43 30.86
8.60 18.50 29.52 43.38
6.00 14.24 26.02 53.74
4.73 11.81 21.31 62.16
3.59
19.60
9.61
26.36
17.78
23.49
69.02
30.56
Lava
Highlight

The National picture
Lava
Highlight

45%
55%48%
52%
Out-of-school children: Proportion of girls and boys.Percentage of boys and girls in government and private schools
Age 11-14Age 6-10
All analyses based on data from 28 out of 35 states and union territories
INDIA RURAL
Other states were not surveyed fully and are therefore not included in this table.
Rank State
% Out-of-
school
children
Rank State
% Out-of-
school
children
1 Goa 0.3 10 West Bengal 4.4
2 Kerala 1.6 11 Chhattisgarh 4.7
3 Karnataka 1.9 12 Haryana 5.3
4 Uttaranchal 2.0 13 Uttar Pradesh 7.3
5 Tamil Nadu 2.7 14 Andhra Pradesh 7.4
6 Maharashtra 2.8 15 Orissa 8.9
7 Gujarat 3.6 16 Jharkhand 9.8
8 Madhya Pradesh 4.0 17 Rajasthan 10.4
9 Punjab 4.3 18 Bihar 13.5
All India 6.6
Gender differences
Out-of-school children
Enrollment
Government Private Madarsa EGSNever
EnrolledDrop Out
Age : 6-14 ALL 75.1 16.3 0.9 1.0 3.7 2.9 100
Age : 6-10 ALL 77.8 15.5 1.0 1.2 3.4 1.2 100
Age : 11-14 ALL 71.6 17.7 0.8 0.6 3.8 5.4 100
Age : 6-10 BOYS 76.9 17.0 1.0 1.1 2.9 1.1 100
Age : 6-10 GIRLS 78.8 13.7 1.1 1.2 3.9 1.3 100
Age : 11-14 BOYS 72.0 19.1 0.8 0.6 3.0 4.7 100
Age : 11-14 GIRLS 71.2 16.1 0.9 0.6 4.8 6.4 100
% Children in each age group in different
types of schools
% Children in each age
group not in schoolTotal
0
20
40
60
80
100
Boys Girls Boys Girls
Govt school Pvt school
Children 6-14
16 ASER 2005
Lava
Highlight
Lava
Note
Very very different from the 40% seen in earlier studies!
Lava
Highlight
Lava
Highlight
Lava
Highlight
Lava
Highlight

17ASER 2005
ASER 2005: ALL INDIA FINDINGS (rural)
To guarantee that all children (6 to 14) enroll in school, stay in school through the elementary stage and receive education of satisfactory quality, the Government of India has launched a massive nation-wide program of universalising elementary education. The objectives of Sarva Shiksha Abhiyan (SSA)
1 are :
All children in school, Education Guarantee Centre, Alternate School, ‘ Back-to-School’ camp by 2003; All children complete five years of primary schooling by 2007 All children complete eight years of elementary schooling by 2010 Focus on elementary education of satisfactory quality with emphasis on education for life Bridge all gender and social category gaps at primary stage by 2007 and at elementary education level by 2010 Universal retention by 2010
What does ASER 2005 say about India’s progress towards these goals?
ENROLLMENT:
93.4% children in 6 to 14 age group are enrolled in school.
75.1% of children in the 6-14 age group are enrolled in government schools and 16.3% in private schools (aided + unaided). A very small proportion (around 1% each) are enrolled in madarssa, EGS and alternate schools.
In some states, a substantial portion of children in this age group goes to private schools. In some states one third to one fifth of all children (6-14) go to private schools. For example: Haryana (34.5%), Uttar Pradesh (28%), Punjab (25.5%), Kerala (22.4%) and Rajasthan (21.9%).
OUT OF SCHOOL CHILDREN:
6.6% children in the 6-14 age group are not in school. This fact cannot be ignored. More than half of these out of school children were never enrolled in school.
ASER 2005 estimates of out of school children are based on population figures from the 2001 census.
These estimates indicate that about 12.5 million children are not in school based on latest population projection by the census. These include never-enrolled and dropped out children.
Bihar, Uttar Pradesh, Rajasthan, Andhra Pradesh and Orissa account for 71.2% of all out of school children.
There are considerable state wise variations in the proportion of children out of school: several states such as Kerala, Karnataka, Uttaranchal, Tamil Nadu, Maharashtra, Goa and Gujarat have less than 4% children in the 6 to 14 age group out of school. Only Rajasthan and Bihar have more than 10% children out of school.

Reading Arithmetic
Top - 5 Top - 5
Kerala 18.5 West Bengal 26.3
Uttaranchal 20.5 Haryana 35.8
Chhatisgarh 24.4 Bihar 36.8
WestBengal 24.5 Uttaranchal 39.8
Bihar 26.9 Chhatisgarh 41.3
Bottom - 5 Bottom - 5
Tamil Nadu 49.3 Karnataka 75.7
UP 48.7 Tamil Nadu 68.2
Karnataka 48.7 Orissa 68.1
Gujarat 48.3 UP 66.8
Madhya Pradesh 48.0 Madhya Pradesh 62.0
% std V
CANNOT
solve
division
% std V
CANNOT
read level-2
Reading Arithmetic
0
10
20
30
40
50
60
70
80
Govt Pvt Govt Pvt
Performance of top five and bottom five states in Indiabased on % all children Std V
Comparison of government and private schools
based on % Std. V children who CAN read level-2
and solve written numerical sums
INDIA RURAL
Std V level-2Reading
Std V can solveDivision
Children who CAN read and solve numerical written sums Learning curves
**Level - 2: Ability to read a 'story' text with some long sentences of std 2 level difficulty.
* Level - 1: Ability to read a small paragraph with short sentences of std 1 level difficulty.
Division: 3 digit divided by 1 digit.
Subtraction: 2 digit subtraction with borrowing.
Learning
% Children who CANNOT read ...% Children who CANNOT solve numerical
written sums of ...
Level 1* Level 2**Subtraction or
DivisionDivision
Age : 7-14 ALL 34.9 51.9 41.0 65.5
Age : 7-10 ALL 48.2 67.6 53.6 79.4
Age : 11-14 ALL 17.3 31.0 24.3 47.0
Govt : Std II-V 43.9 65.2 49.6 77.8
Pvt : Std II-V 31.9 52.2 37.9 66.7
Govt : Std VI-VIII 9.4 22.2 17.0 40.0
Pvt : Std VI-VIII 6.7 16.7 14.6 33.4
Std Nothing Letter Word Para-
Level I
Story-
Level IITotal
I 42.1 32.5 15.6 4.8 5.0 100
II 17.3 28.4 27.0 14.6 12.8 100
III 8.5 16.4 22.8 24.5 27.8 100
IV 4.6 9.2 14.6 24.7 47.0 100
V 3.1 5.3 9.5 20.7 61.3 100
VI 2.4 3.3 6.3 15.5 72.6 100
VII 1.8 2.0 3.9 11.3 81.0 100
VIII 1.5 1.3 2.4 8.4 86.4 100
Total 11.3 14.1 14.5 16.6 43.6 100
% All school children who can read-standardwise
Std NothingNumber
recogn
Subtracti
onDivision Total
I 57.6 34.0 5.6 2.8 100
II 31.3 45.2 17.2 6.3 100
III 17.4 35.6 32.1 15.0 100
IV 10.9 24.1 33.8 31.2 100
V 7.5 18.1 29.9 44.6 100
VI 5.5 14.1 26.0 54.5 100
VII 4.3 11.5 21.2 63.1 100
VIII 3.3 9.3 17.5 69.8 100
Total 19.0 26.4 23.7 30.9 100
% All school children who can solve written
numerical sums - standardwise
18 ASER 2005
Lava
Highlight
Lava
Highlight

19ASER 2005
GENDER DIFFERENCES:
60% of students in private schools are boys.
There are noteworthy state differences. At one end we have Rajasthan and Uttaranchal where the proportion of boys in private schools is over 65% and at the other end in Kerala where proportion of girls is 51%. Boys and girls are almost even in Tamil Nadu, Karnataka and Maharashtra.
Girls as a percentage of all out-of-school children 6-14 are 52.8% (52.3% 6-10 and 55% 11-14).
LEARNING: READING
ASER records basic reading levels as:
Level 1 is the ability to read a small paragraph with short sentences at standard I level of difficulty. Level 2 is the ability to read a ‘story’ text with some long sentences with standard II level of difficulty.
35% of all children in the age group 7-14 could not read simple paragraphs (Level 1 text) and close to 52% could not read a short story (Level 2 text).
In the 7-10 age group, this number is higher with 48.2% children unable to read Level 1 paragraphs and almost 68% unable to read Level 2 stories. For older children in the age group 11-14, 17.2% could not read easy paragraphs (Level 1) and 31% could not read stories (at Level 2).
44% children studying in standard II to V in government schools cannot read easy paragraphs (Level 1). In private schools in standard II to V, this number is somewhat lower at 32%. A much higher proportion in both types of schools (65.3 in government and 52.4 in private) cannot read Level 2 stories.
Although many more children in higher classes (standard 6 to 8) can read, there are still 22% children in government schools and 17% in private schools who cannot read standard II level text.
There are wide state-wise variations in reading ability. For example, among children currently studying in standard V, only 25% or fewer children are unable to read Level 2 text in Kerala, Uttaranchal, Chattisgarh and West Bengal. But the proportion of children unable to read (Level 2) is substantially higher: close to 50% children in Uttar Pradesh, Tamil Nadu, Gujarat, Karnataka and Madhya Pradesh cannot read simple ‘story’ text. Bihar features in the top five states when ranked by standard V children’s ability to read.
Note : Only states where all or almost all districts that have been surveyed are ranked here. States that were not fully surveyed are not ranked here.
LEARNING: ARITHMETIC
41% of children in the 7 to 14 age group are unable do either the two digit subtraction problem

Teachers, children, and classrooms
Provision and use
INDIA RURAL
Std.
I-IV/V
Std.
I - VIII
Total number of schools
visited 4935 3546
% enrolled children
attending (average) 70.8 72.5
Children's attendance
Schools with:
% of schools with less
than 50% of enrolled
children attending
15.8 14.0
Std.
I-IV/V
Std.
I - VIII
Total number of schools
visited 4895 3552
% teachers attending
(average) 74.9 74.6
% of schools with NO
teachers present9.5 8.4
% of schools with ALL
teachers present 50.9 36.5
Teachers' attendance
Schools with:
Type of
school by
enrollment
%
Schools
visited
Std
I-V
rooms
Type of
school by
enrollment
%
Schools
visited
Std
I-VIII
rooms
<=50 13.5 2.7 <=150 18.8 4.8
51-75 12.4 3.1 151-250 30.2 6.7
76-150 32.6 3.7 251-350 22.9 8.1
151-225 21.7 4.3 351-450 11.6 8.8
>225 19.9 5.1 >450 16.5 12.1
Average number of rooms available
Pupil-teacher ratio (PTR)
Media
n fig
ure
s
Schools Std. I-V Schools Std. I - VIII
38.3
33.836.7
33.8
0
10
20
30
40
50
PTR based onenrollment
PTR based onattendance on
day of visit
PTR based onenrollment
PTR based onattendance on
day of visit
% of schools with no water/toilet provision
% of schools with water/toilet provision but not useable
% of schools with water/toilet provision and useable
Water & toilet provision and use (%)
Schools Std. I-V Schools Std. I-VIII
Textbooks and midday meals (%)
Schools Std. I-V Schools Std. I-VIII
Pe
rce
nta
ge
of sc
ho
ols
0
20
40
60
80
100
Water facility
and use
Toilet provision
and use
Water facility
and use
Toilet provision
and use
Pe
rce
nta
ge
of sch
oo
ls
79.670.3
84.6
74.0
0
20
40
60
80
100
Schools
where most
(75%) of
children in Std
5 have
textbooks
Midday meal
available
Schools
where most
(75%) of
children in Std
5 have
textbooks
Midday meal
available
20 ASER 2005
Lava
Note
If one teacher teaches more than one grade/batch?
Lava
Note
Are text/ books provided by govt school
Lava
Highlight
Lava
Highlight
Lava
Highlight

21ASER 2005
24.4% of the same age group could do the subtraction problems (2 digit problem with borrowing) but could not correctly do the division problems that were given to them.
For the younger age group, the numbers are higher: close to 54% cannot do the two-digit subtraction problem. For the older age group (11 to 14), about a quarter of the children could not do either subtraction or division and about half of all children could not do the division problem.
The gap between government and private school is also interesting. Private schools lead by about 12% in the younger age group and by 2.4% in the older age group. Even in private schools in the higher classes (standards VI to VIII) 33.4% children could not do division problems that children are expected to do in primary grades. The picture in government schools is worse with 40% children in standards VI to VIII unable to handle the simple division problem.
The All-India findings indicate that across the board, whether we look at the situation by age or standard or type of school, the level of arithmetic is weak and needs serious improvement.
As with reading, there are significant state-wise variations in arithmetic. For example, the arithmetic ability of standard V children in states like West Bengal, Haryana, Bihar, Uttaranchal and Chhattisgarh have over 50% children who can do the simple division problems. Again, the big surprises are the southern states: Tamil Nadu and Karnataka recording high percentages of children who cannot do the division problem that was given to them.
3SCHOOL FUNCTIONING :
All school observation in formation pertains only to government schools in the surveyed villages.
Teachers and children:
On average, over 75% teachers were found to be attending on the day of the visit in sampled schools. Less than 10% schools had no teachers and 51 % schools at the primary level and 36% of schools at the upper primary level had all teachers present on the day of the visit.
Children’s attendance patterns indicate that approximately 71% of enrolled children in primary schools and close to 73% of children in schools up to standard VIII were in school on the day of the visit.
Bihar recorded the lowest attendance numbers with 51.8 % of enrolled children attending. In several states, the attendance level was between 60% to 70%. These are Rajasthan, Uttar Pradesh, West Bengal, Jharkhand, Orissa and Madhya Pradesh. Other states have higher levels. Similar patterns were observed in upper primary schools. Regular and sustained attendance of children in school is clearly an issue in many states.
3 ASER teams visited 9252 government schools. Along with the village visit, the team was asked to pay a visit to the local government primary school. During the school visit, the team got information on enrolled children as well as appointed teachers and para-teachers from the school records register. The team observed the number of children and teachers present. The team also recorded whether there was tap or hand pump in the school premises and whether it was functioning. Similar information about availability and use of toilets, rooms and textbooks was noted. Finally, whether the midday meal was being prepared and served on the day of the visit was also observed. In 460 villages, ASER teams did not find a school that was open on that day.

1.6
4.0
2.8
13.7
8.1
18.9
8.9
4.3
10.4
2.7
1.8
7.3
2.0
4.4
81.5
52.0
67.3
74.3
90.4
81.5
58.4
60.4
62.0
50.7
83.6
51.3
79.5
75.5
56.0
38.0
39.5
56.3
71.1
49.7
31.9
46.8
47.8
31.8
57.1
33.2
60.2
73.7
48.4
58.9
40.9
63.2
58.7
19.5
35.4
45.3
42.6
64.2
75.2
48.6
47.6
24.3
61.7
68.9
54.8
73.1
75.6
35.0
37.6
68.1
51.7
71.1
89.6
48.7
67.1
51.3
8.0
5.0
7.5
13.1
4.7
0.6
1.7
0.3
3.6
5.3
1.0
2.7
9.8
1.9
All
Children
All
Children
% Out-of-
school
% CAN
read
level - 2
% CAN solve
subtraction
Andhra Pradesh Kerala
Arunachal Pradesh* Madhya Pradesh
Assam* Maharashtra
Bihar Manipur*
Chhattisgarh Meghalaya*
Dadra & Nagar Haveli Nagaland*
Daman & Diu Orissa
Goa Punjab
Gujarat Rajasthan
Haryana Tamil Nadu
Himachal Pradesh* Tripura*
Jammu & Kashmir* Uttar Pradesh
Jharkhand Uttaranchal
Karnataka West Bengal
State State
*Partial coverage
India 6.6 61.3 44.6
% Out-of-
school
% CAN
read
level - 2
% CAN solve
subtraction
Performance of all states
INDIA RURAL
Std III to V childrenStd III to V children
22 ASER 2005

23ASER 2005
Pupil-teacher ratio based on attendance (i.e. number of children actually present and number of teachers attending on the day of the visit.) shows that the all India pupil-teacher ratio is well below 40 – with the exception of Uttar Pradesh (49). The picture in schools that are up to the upper primary level (standard I to VII/VIII) reveal a similar pattern – all India is 33.3. Most
4States have a PTR on the day of the visit of below 50.
At the national level, on average, there is one teacher in a school with enrollment of 50 or less and 2 teachers in schools of 51 to 75 children. However there are many states (like Bihar, Uttar Pradesh, Orissa, Jharkhand, Chattisgarh) which have median attendance of only 3 teachers or less in schools where children’s enrollment is between 150 and 225.
School facilities – provision and use:
78% of primary schools visited had either a hand pump or a tap. Of these schools 85% had water supply. 60% of schools visited had toilet facilities out of which 70% were usable. (4891 primary schools visited.)
83% of schools up to standard VIII had hand pump or a tap and 87% of those had water supply. 77% had toilets of which 72% were working. While upper primary school had better provisioning, there was not much difference in the proportion of those which are usable / functional. (3541 primary+upper primary schools visited.)
Out of the 8886 schools observed (primary schools and combined primary and upper primary) in more than 80% schools, children in standard V had textbooks.
The picture was very encouraging in several states where most children had textbooks in 90% of schools. This was the case in Rajasthan, W Bengal, Chhattisgarh, Madhya Pradesh, Gujarat, Maharashtra, Goa, Andhra Pradesh, Karnataka, Kerala and Tamil Nadu. Availability of textbooks was relatively low in primary schools of Bihar (52.4%), Jharkhand (35.1%) and Orissa (32.3%). The overall snapshot of textbook provision is a positive one suggesting that the supply and distribution of textbooks have improved greatly in large areas of the country.
70% of schools visited were preparing or serving mid day meal.
However there are some noteworthy state-wise variations – in Punjab 17.3% (where midday meal program is not yet being implemented on scale), Bihar 38.2%, Goa 46%, Uttar Pradesh 53.6%, Jharkhand 65.5% and Orissa 63.3%. The percentage was highest in Chhattisgarh (95.1%) and Kerala (94.9%).
ASER will be conducted on an annual basis until 2010. ASER 2005 shows that enrollment levels are very high in almost all states however the foundations of basic reading and arithmetic needs to be urgently strengthened in the early grades in school. A strong beginning is essential for building a solid foundation for elementary education.
Note : In some districts, very little data was available on “standard of child”. Results from these districts should be regarded as anomalous. These are : Khammam (AP), Sonitpur (Assam), Durg (Chhatisgarh), Ujjan, Indore, Shadol and Barwani (MP) and Erode (TN).
4 The information on number of teachers and para-teachers appointed to the school was given to the ASER team by the teachers. If this number is reported as lower than actual, it will influence the ratio of teachers attending to teachers appointed. PTR based on enrollment is the ratio of enrolled children to appointed teachers (teachers + para teachers). PTR based on attendance i.e. it is the ratio of children attending to teachers attending on the day of the visit.

Chamba
Dharamsala
Kullu
MandiKinnaur
Bilaspur
SHIMLA
HamirpurUna
Solan
Sirmaur
Kangra
a l S tiL hu and pi
HIMACHAL PRADESHGurdaspur
AmritsarHoshiarpur
Kapurthala
Jalandhar Nawanshahr
PUNJAB
Firozpur
Faridkot
Moga Ludhiana Rupnagar
FatehgarhSahib
Muktsar Sangrur
Bathinda
Mansa
Patiala
Kapurthala
DEHRADUN
Uttarkashi
Rudraprayag
Chamoli
Haridwar BageshwarPithoragarh
Almora
Nainital
Champawat
Tehri Garhwal
Pauri
Udham Singh Nagar
UTTARANCHAL
Sirsa Fatehabad
Hisar
Bhiwani
Kaithal
Karnal
JindPanipat
SonipatRohtak
Jhajjar
Mahendragarh GurgaonRewari
Faridabad
Kurukshetra
Ambala
Yamunanagar
Panchkula
HARYANA
LUCKNOW
Ghaziabad
Meerut
BijnorMuzaffarnagar
Saharanpur
Moradabad
RampurPilibhit
Bulandshahar Bareilly
BadaunAligarh
HathrasEtah
Shahjahanpur
Mathura
MainpuriAgra
Firozabad
Etawah
Kannauj
HardoiSitapur
Kheri
BahraichBalrampur
GondaBara-Banki
Jhansi
Lalitpur
Hamirpur
Auraiya
Mahoba
Kanpur Rural
Unnao
Rae Bareli
FaizabadBasti
SultanpurAzamgarh
Gorakhpur
Deoria
Mau
Maharajganj
BalliaGhazipur
Varanasi
JaunpurBela
Mirzapur
SRNBanda
Fatehpur
Baghpat
JPN
Gautam Budda Nagar
Shrawasti
Jalaun
Siddhart Nagar
Pratapgarh
Chitrakoot
AN
SKN
Kushinagar
AllahabadChandauli
Sonbhadra
UTTAR PRADESH
Kaushambi
Farukhabad
Fatehpur
Kanpur UrbanRAJ ASTH AN
JAIPUR
Ganganagar
Hanumangarh
Bikaner
Jaisalmer
Barmer
Jalor
Sirohi
Udaipur
Rajasamand
Chittaurgarh
Bhilwara
Pali
Jodhpur
Nagaur
Ajmer
Dhaulpur
Alwar
Bharatpur
Karauli
Tonk SawaiMadhopur
Bundi
KotaBaran
Jhalawar
Dungarpur
Banswara
Churu
Jhunjhunun
Sikar
Dausa
Chittaurgarh
Patan
Mehsana
Jamnagar
Rajkot
Porbander
JunagadhAmreli
Bhavnagar
Ahmedabad
Kheda
Anand
Vadodara
Bharuch
Surat
Navsari
Narmada
Panch Mahals
Sabar Kantha
Banas Kantha
Kachchh
Rann of Kachchh
Dahod
The Dangs
ValsadDAMAN AND DIU
Surendranagar
GUJARATGANDHINAGAR
MUMBAI
MA H AR AS HT RA
Nandurbar
Nashik
Thane
Raigad
Pune
Ahmednagar
AurangabadJalna
Dhule
Jalgaon
Buldhana
Akola
Amravati
Wardha
Yavatmal
Washim
Hingoli
Bid
ParbhaniNanded
Latur
Satara
RatnagiriSangli
Kolhapur
Solapur
Gondia
Bhandara
Nagpur
Gadchiroli
Chandrapur
Sindhudurg
Usmanabad
BHOPAL
BhindMorena
Gwalior
Sheopur
Shivpuri
Datia
Neemach
Barwani
Jhabua
DharIndore
Mandsaur
RatlamUjjain
Shajapur
Dewas
Rajgarh
Sehore
Vidisha
Raisen
Guna
Tikamgarh
Sagar DamohKatni
Jabalpur
Narsimhapur
Mandla
Hoshangabad
Harda
Betul
ChhindwaraSeoni
Balaghat
Panna
ChhatarpurSatna Rewa
Sidhi
East Nimar
Dindori
Umaria
Shahdol
West Nimar
MADHYA PRADESH
PATNA
Aurangabad
Bhabua
Rohtas
Gaya
Buxar
Jahanabad
Bhojpur
Nawada
Sheikhpura
Lukhisarai
JamuiBanka
Munger
Begusarai Khagaria
Samastipur
Saharsa
Muzaffarpur Madhepura
Darbhanga
Katihar
Purnia
SupaulAraria
Kishanganj
Siwan
Gopalganj SheoharMadhubani
Sitamarhi
Bhagalpur
VaishaliSaran
PaschimChamparan
Nalanda
PurbiChamparan
BIHAR
Khonsa
Changlang
Tawang
YingkiongAnini
Tezu
West Kameng
East Kameng
Papum Pare
Lower Subansiri
Upper Subansiri
East Siang
Upper Siang
West SiangA RU N AC H AL
P R AD ES H
DISPUR
Kokrajhar
Borpeta
Nalbari
GoalparaDhubri
Nagoan
Karimganj
Hailakandi
Karbi Anglang
Jorhat
Sibsagar
Dibrugarh
Dhemaji
Sonitpur
North Cachar Hills
Cachar
Kamrup
Bongaigaon
Darrang
Tinsukia
Golaghat
Lakhimpur
Morigaon
KarbiAnglang
ASSAM
IMPHAL East
ChurachandpurChandel
ThoubalBishnupur
Imphal West
Ukhrul
Senapati
Tamenglong
MANIPUR
NAGALAND
KOHIMA
Phek
Zunheboto
Wokha
Mokokchung
Tuensang
Mon
Dimapur
SHILLONGMEGHALAYAWest Garo Hills
South Garo Hills
East Garo Hills
West Khasi Hills
Ri Bhoi
Jaintia HillsEast Khasi Hills
AIZAWAL
MIZORAM
Lunglei
Serchhip
Saiha
Mamit
Kolasib
Champhai
Lawngtlai
Agartala
TRIPURA
North Tripura
Udaipur
South Tripura
Dhalai
Kailashahar
West Tripura
WEST BENGALKOLKATA
Medinipur
Haora
PuruliyaBankura
Barddhaman
Jalpaiguri
Darjiling
Koch Bihar
Uttar Dinajpur
Dakshin Dinajpur
Maldah
Birbhum
HugliNorth 24 Paraganaa
South 24 Paraganaa
Murshidabad
Nadia
GANGTOK
SIKKIM
Namchi
Mangan
Lachen
North
West
East
South
JHARKHAND
RANCHI
Saraikela
Gumla
Lohardaga
Garhwa
Latehar
Hazaribag
Chatra
Bokaro
Dhanbad
Giridih DumkaDeogarh
GoddaPakur
Sahibganj
Kodarma
Palamau
East Singbhum
Sindega
West Singbhum
Jamatara
BHUBANESWAR
Malkangiri
Koraput
NabarangpurRayagada
Puri
NuaparhaBalangir
Nayagarh
SonapurAngul
Bargarh Sambalpur
Khorda
Cuttack
Jagatsinghpur
Kendrapara
Dhenkanal
Bhadrak
Baleshwar
Deogarh
KendujhargarhJharsuguda
Sundargarh
Mayurbhanj
Jajpur
Ganjam
Gajapati
ORISSABauda
Phulbani(Khandamal)
Kalahandi
RAIPUR
Dantewada
Kanker
Dhamtari
Raj Nandgaon
Durg
Mahasumund
Bilaspur
Janjgir
Raigarh
SurgujaKoriya
Jashpur
Korba
Kawardha
Bastar
CHHATTISGARH
HYDERABAD
Adilabad
NizamabadKarimnagar
Rangareddi
Mahbubnagar
Chittoor
Anantapur
Cuddapah Nellore
Guntur
Kurnool
Nalgonda
KhammamEast Godavari
Yaman (PONDICHERRY)
Warangal
Vishakhapatnam
Vizianagaram
Srikakulam
West Godavari
Krishna
Prakasam
Medak
ANDHRA PRADESH
North Goa
South Goa
GOA
KARNATAKA
BANGALORE
Bidar
Gulbarga
Raichur
Bijapur
Bagalkot
KoppalDharwadGadag
Belgaum
Haveri
ChitradurgaShimoga
Udipi
Chikmangalur
Hassan
Mandya
Mysore
Chamaranj nagar
Tumkur
Kolar
Bellary
Dakshin Kannad
Uttar Kannad
Devangere
Kodagu
Tumkur
KARNATAKA
TAMILNADU
PONDICHERRY
CHENNAI
Coimbatore
Tirunelveli
Thoothukkudi
RamanathapuramVirudunagar
Shivaganga
MaduraiTheni
Dindigul Pudukkottai
Thanjavur
KarurTiruchirappalli
Nagapattinam
Thiruvarur
Karaikal (PONDICHERRY)
ErodeNamakkal
Perambalur
AriyalurNagapattinam
Salem
Dharmapuri
Tiruvannamalai
Villupuram
Cuddalore
Vellore Kancheepuram
Tiruvallur
Kanyakumari
The Nilgiris
K
R
A
E
L
A
THIRUVANANTHAPURAM
Kasargod
Kannur
MAHE(PONDICHERRY)
Kozhikode(Calicut)
Malappuram
Palakkad
Thrissur
Ernakulam
Alappuzha Kottayam
Pathanamthitta
Kollam
Wayanad
IdukkiKochi
Gilghit
Chilas
SRINAGAR
Kargil
Leh
Anantnag
KashmirNorth
Punch
Udhampur
Mirpur
Kathua
Gilgitwazara
Riasi
TribalTerritory
Muzzararbad
LadakhJAMMU AND KASHMIR
Jammu
N
Percentage of children in Std V who cannot solve a simple
written division problem 3 digit by 1 digit
INDIA Rural
0-15
15-30
30-45
45-60
60-75
75+
No Data
Percentage of children
24 ASER 2005
Maps may not be accurate or to-scale. These are mere representations.
DADAR AND NAGAR HAVELI
Lava
Highlight
Lava
Highlight

Jammu and Kashmir
Himachal Pradesh
Uttaranchal
Punjab
Haryana
Note : J & K has only two pages instead of four due to partial coverage of districts

Gilghit
Chilas
SRINAGAR
Kargil
Leh
Anantnag
KashmirNorth
Punch
Udhampur
Mirpur
Kathua
Gilgitwazara
Riasi
TribalTerritory
Muzzararbad
Ladakh
Jammu
42%
58%
43%
57%
All analyses based on data from 7 out of 14 districts
Age 11-14Age 6-10
JAMMU AND KASHMIRRURAL
Out-of-school children: Proportion of girls and boys.Percentage of boys and girls in government and private schools
Gender differences
Out-of-school children
Enrollment
26 ASER 2005
20+
15 - 20
10 - 15
5 - 10
3 - 5
0 - 3
No data
Percentage of children
Government Private Madarsa EGSNever
Drop Out
Age : 6-14 ALL 77.6 17.7 0.3 1.8 1.4 1.3 100
Age : 6-10 ALL 76.7 19.1 0.2 3.0 0.7 0.3 100
Age : 11-14 ALL 78.9 16.0 0.3 0.4 2.1 2.4 100
Age : 6-10 BOYS 76.3 20.7 0.3 1.9 0.5 0.3 100
Age : 6-10 GIRLS 77.3 16.9 0.1 4.4 1.0 0.4 100
Age : 11-14 BOYS 77.6 18.5 0.5 0.2 0.9 2.3 100
Age : 11-14 GIRLS 80.8 12.4 0.0 0.6 3.7 2.6 100
Total
% Children in each age group in different
types of schools
% Children in each age
group not in school
0
20
40
60
80
100
Boys Girls Boys Girls
Govt school Pvt school
Children 6-14

JAMMU AND KASHMIRRURAL
Comparison of government and private schools
based on % Std. V children who CAN read level-2
and solve written numerical sums
Reading Arithmetic
Children who CAN read and solve numerical written sums Learning curves
**Level - 2: Ability to read a 'story' text with some long sentences of std 2 level difficulty.
* Level - 1: Ability to read a small paragraph with short sentences of std 1 level difficulty.
Division: 3 digit divided by 1 digit.
Subtraction: 2 digit subtraction with borrowing.
Performance of surveyed districts
Learning
% Children who CANNOT read ...% Children who CANNOT solve numerical
written sums of ...
27
Level 1* Level 2** Division
Age : 7-14 ALL 36.6 59.0 32.6 59.2
Age : 7-10 ALL 52.8 77.3 46.4 76.5
Age : 11-14 ALL 20.7 41.1 19.4 42.6
Govt : Std II-V 49.8 72.4 43.4 71.0
Pvt : Std II-V 31.4 58.9 19.8 62.6
Govt : Std VI-VIII 10.4 30.2 10.5 31.3
Pvt : Std VI-VIII 10.5 34.9 1.7 19.9
Std Nothing Letter Word Para-
Level I
Story-
Level IITotal
I 13.9 33.0 37.5 8.8 6.8 100
II 7.6 19.5 46.1 17.8 9.0 100
III 1.8 10.1 38.5 28.1 21.5 100
IV 2.3 10.9 33.2 22.9 30.9 100
V 1.2 4.4 22.2 23.5 48.7 100
VI 0.8 1.5 14.5 22.7 60.5 100
VII 0.3 1.3 6.7 17.0 74.7 100
VIII 0.0 0.1 2.1 21.8 76.1 100
Total 3.4 10.2 26.5 20.8 39.1 100
Std NothingNumber
recogn
Subtracti
onDivision Total
I 21.3 59.9 12.3 6.6 100
II 10.0 53.8 26.7 9.7 100
III 2.8 40.3 37.7 19.2 100
IV 3.2 36.9 25.6 34.4 100
V 2.6 18.7 30.1 48.6 100
VI 0.8 10.0 27.5 61.8 100
VII 0.3 7.5 16.9 75.3 100
VIII 0.7 5.9 12.3 81.1 100
Total 5.0 29.6 25.1 40.3 100
% All school children who can solve written
numerical sums - standardwise
Riasi
All
Children
% Out-of-
school
% CANread
level - 2
% CAN solve
subtraction
Punch 6.2 23.3 50.0
Jammu 3.0 15.7 55.2
Udhampur 3.0 39.5 56.0
Leh(Ladakh) 2.4 30.9 52.7
1.9 62.2 80.8
Kargil 1.7 42.2 78.9
Kathua 1.4 34.7 73.8
Doda 0.9 37.3 87.2
Jammu & KashmirState
2.7 35.2 66.5
District
Std III to V children
46.6
61.5
45.9
64.4
0
10
20
30
40
50
60
70
Govt Pvt Govt Pvt
Std. V level-2 Reading Std. V can solve Division
ASER 2005
% All school children who can read-standardwise

50%50%
36%
64%
All analyses based on data from 5 out of 12 districts
Age 11-14Age 6-10
HIMACHAL PRADESH RURAL
Out-of-school children: Proportion of girls and boys.Percentage of boys and girls in government and private schools
Gender differences
Out-of-school children
Enrollment
28 ASER 2005
20+
15 - 20
10 - 15
5 - 10
3 - 5
0 - 3
No data
Percentage of children
Government Private Madarsa EGSNever
EnrolledDrop Out
Age : 6-14 ALL 91.2 7.1 0.0 0.7 0.7 0.4 100
Age : 6-10 ALL 89.1 9.3 0.0 1.1 0.5 0.1 100
Age : 11-14 ALL 94.7 3.5 0.0 0.0 0.9 0.9 100
Age : 6-10 BOYS 88.5 10.2 0.0 0.9 0.3 0.1 100
Age : 6-10 GIRLS 89.8 8.3 0.0 1.2 0.7 0.0 100
Age : 11-14 BOYS 94.0 4.2 0.0 0.0 0.8 1.1 100
Age : 11-14 GIRLS 95.4 2.8 0.0 0.0 1.1 0.7 100
% Children in each age group in different
types of schools
% Children in each age
group not in schoolTotal
0
20
40
60
80
100
Boys Girls Boys Girls
Govt school Pvt school
Children 6-14
Chamba
Dharamsala
Kullu
Mandi Kinnaur
Bilaspur
SHIMLA
HamirpurUna
Solan
Sirmaur
Kangra
a u n S tL h l a d pi i

HIMACHAL PRADESH RURAL
Comparison of government and private schools
based on % Std. V children who CAN read level-2
and solve written numerical sums
Reading Arithmetic
Children who CAN read and solve numerical written sums Learning curves
**Level - 2: Ability to read a 'story' text with some long sentences of std 2 level difficulty.
* Level - 1: Ability to read a small paragraph with short sentences of std 1 level difficulty.
Division: 3 digit divided by 1 digit.
Subtraction: 2 digit subtraction with borrowing.
Performance of surveyed districts
Learning
% Children who CANNOT read ...% Children who CANNOT solve numerical
written sums of ...
29
Level 1* Level 2**Subtraction or
DivisionDivision
Age : 7-14 ALL 19.8 35.6 22.0 44.9
Age : 7-10 ALL 33.8 58.7 36.8 70.0
Age : 11-14 ALL 1.4 5.4 2.6 12.1
Govt : Std II-V 28.4 52.4 30.4 63.2
Pvt : Std II-V 19.6 42.6 30.0 66.6
Govt : Std VI-VIII 0.0 1.4 1.3 7.0
Pvt : Std VI-VIII 0.0 0.0 0.0 5.7
Std Nothing Letter Word Para-
Level I
Story-
Level IITotal
I 20.8 57.7 17.1 2.7 1.6 100
II 1.4 36.5 36.1 17.0 8.9 100
III 1.5 8.4 23.6 39.4 27.2 100
IV 0.0 1.7 6.5 32.9 58.9 100
V 0.4 0.6 1.7 7.7 89.5 100
VI 0.0 0.0 0.0 1.5 98.5 100
VII 0.0 0.0 0.0 0.8 99.2 100
VIII 0.0 0.0 0.0 1.6 98.4 100
Total 3.5 14.9 11.8 14.5 55.3 100
% All school children who can read-standardwise
Std NothingNumber
recogn
Subtracti
onDivision Total
I 29.5 67.0 3.1 0.4 100
II 7.5 71.2 18.6 2.7 100
III 1.8 32.0 51.2 15.0 100
IV 0.6 12.1 41.4 46.0 100
V 1.3 2.1 21.4 75.2 100
VI 0.0 1.3 10.5 88.3 100
VII 0.0 2.0 4.3 93.7 100
VIII 0.0 0.4 1.2 98.4 100
Total 5.8 26.2 21.0 47.0 100
% All school children who can solve written
numerical sums - standardwise
All
Children
% Out-of-
school
% CAN
read
level - 2
% CAN solve
subtraction
Solan 2.0 65.3 68.7
Chamba 2.0 70.4 88.4
Sirmaur 1.4 50.7 91.8
Mandi 0.6 66.2 84.4
Una 0.0 43.0 86.3
Himachal Pradeshstate
1.0 60.1 84.3
District
Std III to V children
89.494.1
75.179.1
0
10
20
30
40
50
60
70
80
90
100
Govt Pvt Govt Pvt
Std. V level-2 Reading Std. V can solve Division
ASER 2005

43%
57%52%48%
All analyses based on data from 12 out of 13 districts
Age 11-14Age 6-10
UTTARANCHAL RURAL
Out-of-school children: Proportion of girls and boys.Percentage of boys and girls in government and private schools
Gender differences
Out-of-school children
Enrollment
30 ASER 2005
20+
15 - 20
10 - 15
5 - 10
3 - 5
0 - 3
No data
Percentage of children
% Children in each age group in different
types of schools
% Children in each age
group not in school
Government Private Madarsa EGSNever
EnrolledDrop Out
Age : 6-14 ALL 78.0 19.4 0.3 0.2 0.7 1.3 100
Age : 6-10 ALL 77.1 21.4 0.3 0.2 0.5 0.4 100
Age : 11-14 ALL 80.2 15.8 0.4 0.1 0.7 2.7 100
Age : 6-10 BOYS 73.6 24.9 0.4 0.3 0.5 0.4 100
Age : 6-10 GIRLS 81.6 16.9 0.2 0.2 0.6 0.5 100
Age : 11-14 BOYS 77.9 18.9 0.4 0.1 0.7 2.0 100
Age : 11-14 GIRLS 83.1 11.9 0.4 0.2 0.8 3.7 100
Total
0
20
40
60
80
100
Boys Girls Boys Girls
Govt school Pvt school
Children 6-14
DEHRADUN
Uttarkashi
Rudraprayag
Chamoli
Haridwar Bageshwar
Pithoragarh
Almora
NainitalChampawat
Tehri Garhwal
Pauri
Udham Singh Nagar

Udham Singh Nagar 46.2
Uttarkashi 31.8
Almora 28.0
Champawat 26.9
Bageshwar 26.0
Udham Singh Nagar 60.6
Champawat 55.0
Rudraprayag 53.7
Almora 51.4
Uttarkashi 51.0
Dehradun 2.1
Hardwar 20.8
Nainital 27.9
Chamoli 38.6
Tehri Garhwal 43.3
UTTARANCHAL RURAL
Performance of top five and bottom five districts in state based on % all children Std V
Comparison of government and private schools
based on % Std. V children who CAN read level-2
and solve written numerical sums
Reading Arithmetic
Children who CAN read and solve numerical written sums Learning curves
**Level - 2: Ability to read a 'story' text with some long sentences of std 2 level difficulty.
* Level - 1: Ability to read a small paragraph with short sentences of std 1 level difficulty.
Division: 3 digit divided by 1 digit.
Subtraction: 2 digit subtraction with borrowing.
Learning
% Children who CANNOT read ...% Children who CANNOT solve numerical
written sums of ...
31ASER 2005
Level 1* Level 2**Subtraction or
DivisionDivision
Age : 7-14 ALL 23.2 37.0 30.3 56.7
Age : 7-10 ALL 34.7 52.4 43.7 74.3
Age : 11-14 ALL 7.5 16.0 11.4 32.0
Govt : Std II-V 32.2 51.3 40.9 72.6
Pvt : Std II-V 19.2 32.2 31.1 65.0
Govt : Std VI-VIII 4.4 11.4 7.6 26.2
Pvt : Std VI-VIII 2.4 7.8 2.9 18.1
Std Nothing Letter Word Para-
Level I
Story-
Level IITotal
I 30.7 42.7 17.3 4.2 5.1 100
II 9.0 29.4 29.8 14.5 17.3 100
III 4.9 9.8 16.5 26.1 42.6 100
IV 2.3 5.6 6.7 20.9 64.5 100
V 2.3 2.6 4.4 11.3 79.5 100
VI 0.4 2.2 2.7 8.6 86.3 100
VII 0.7 1.8 1.0 6.1 90.5 100
VIII 0.3 1.7 1.1 4.5 92.5 100
Total 6.8 13.0 11.2 13.3 55.7 100
Std NothingNumber
recogn
Subtracti
onDivision Total
I 36.3 54.8 5.1 3.8 100
II 14.5 67.0 13.8 4.7 100
III 8.9 33.5 45.6 12.1 100
IV 5.2 17.1 43.8 33.8 100
V 3.8 9.1 26.9 60.2 100
VI 1.3 5.8 22.0 70.9 100
VII 1.8 4.9 14.3 79.1 100
VIII 1.1 5.5 16.3 77.2 100
Total 10.0 27.8 25.1 37.1 100
% All school children who can solve written
numerical sums - standardwise
Reading Arithmetic
Top - 5 Top - 5
Bottom - 5 Bottom - 5
% std III to
V CANNOT
read level-2
% std III to
V CANNOT
solve
subtraction77.4
93.4
57.7
76.0
0
10
20
30
40
50
60
70
80
90
100
Govt Pvt Govt Pvt
Std. V level-2 Reading Std. V can solve Division
Nainital 9.4
Dehradun 16.1
Hardwar 19.9
Rudraprayag 21.3
Chamoli 23.2
% All school children who can read-standardwise

Teachers, children, and classrooms
Provision and use
UTTARANCHAL RURAL
Average number of rooms available
32 ASER 2005
Type of
school by
enrollment
%
Schools
visited
Std
I-V
rooms
Type of
school by
enrollment
%
Schools
visited
Std
I-VIII
rooms
<=50 23 3.2 <=150 60 4.2
51-75 25 3.4 151-250 33 8.0
76-150 32 3.2 251-350 7 6.0
151-225 10 3.3 351-450 0 0.0
>225 10 5.4 >450 0 0.0
% of schools with no water/toilet provision
% of schools with water/toilet provision but not useable
% of schools with water/toilet provision and useable
Water & toilet provision and use (%)
Schools Std. I-V Schools Std. I-VIII
Textbooks and midday meals (%)
Schools Std. I-V Schools Std. I-VIII
Pe
rce
nta
ge
of sc
ho
ols
92.4 84.7
73.3 73.3
0
20
40
60
80
100
Schools
where most
(75%) of
children in Std
5 have
textbooks
Midday meal
available
Schools
where most
(75%) of
children in Std
5 have
textbooks
Midday meal
available
Pupil-teacher ratio (PTR)
Media
n fig
ure
s
Schools Std. I-V Schools Std. I - VIII
31.1
37.0
23.819.8
0
10
20
30
40
50
PTR based onenrollment
PTR based onattendance on
day of visit
PTR based onenrollment
PTR based onattendance on
day of visit
Std.
I-IV/V
Std.
I - VIII
Total number of schools
visited 186 15
% teachers attending
(average) 71.8 89.6
% of schools with NO
teachers present11.3 0.0
% of schools with ALL
teachers present 49.5 73.3
Teachers' attendance
Schools with:
Std.
I-IV/V
Std.
I - VIII
Total number of schools
visited 188 15
% enrolled children
attending (average) 82.9 80.5
Children's attendance
Schools with:
% of schools with less
than 50% of enrolled
children attending
5.9 6.7
0
20
40
60
80
100
Water facility
and use
Toilet provision
and use
Water facility
and use
Toilet provision
and use
Pe
rce
nta
ge
of sch
oo
ls

Performance of all districts
UTTARANCHAL RURAL
33ASER 2005
All
Children
% Out-of-
school
% CAN
read
level - 2
% CAN
solve
subtraction
Almora 2.2 48.6 72.0
Bageshwar 1.7 51.7 74.0
Chamoli 0.5 61.4 76.8
Champawat 2.8 45.0 73.1
Dehradun 0.3 97.9 83.9
Haridwar 0.6 79.2 80.1
District
Std III to V childrenAll
Children
% Out-of-school
% CAN read
level - 2
% CAN solve
subtraction
Nainital 4.6 72.1 90.6
Rudraprayag 0.6 46.3 78.7
Tehri Garhwal 0.0 56.7 74.4
Udham Singh Nagar 5.6 39.4 53.8
Uttarkashi 1.4 49.0 68.2
District
Std III to V children
Uttaranchal State 2.0 63.1 74.8

56%
44%
60%
40%
All analyses based on data from 17 out of 17 districts
Age 11-14Age 6-10
PUNJAB RURAL
Out-of-school children: Proportion of girls and boys.Percentage of boys and girls in government and private schools
Gender differences
Out-of-school children
Enrollment
34 ASER 2005
20+
15 - 20
10 - 15
5 - 10
3 - 5
0 - 3
No data
Percentage of children
70.0
68.9
73.4
67.5
70.6
71.8
75.4
25.5
28.8
20.7
30.0
27.3
22.1
19.1
0.0
0.0
0.0
0.0
0.0
0.0
0.0
0.2
0.2
0.1
0.3
0.2
0.1
0.0
2.0
1.3
1.7
1.4
1.1
1.7
1.7
2.4
0.8
4.0
0.8
0.8
4.2
3.8
Government Private Madarsa EGSNever
EnrolledDrop Out
Age : 6-14 ALL 100
Age : 6-10 ALL 100
Age : 11-14 ALL 100
Age : 6-10 BOYS 100
Age : 6-10 GIRLS 100
Age : 11-14 BOYS 100
Age : 11-14 GIRLS 100
Total
% Children in each age group in different
types of schools
% Children in each age
group not in school
0
20
40
60
80
100
Boys Girls Boys Girls
Govt school Pvt school
Children 6-14
Gurdaspur
Amritsar
Hoshiarpur
Kapurthala
Jalandhar Nawanshahr
Firozpur
Faridkot
Moga LudhianaRupnagar
Fatehgarh Sahib
Muktsar SangrurBathinda
Mansa
Patiala
Kapurthala

Std Nothing Letter Word Para-
Level I
Story-
Level IITotal
I 39.7 35.2 16.8 5.2 3.1 100
II 17.2 33.8 26.0 15.5 7.5 100
III 5.5 21.5 26.9 26.1 20.0 100
IV 4.1 11.9 16.1 28.5 39.4 100
V 2.3 5.4 10.6 21.3 60.4 100
VI 1.5 4.8 6.1 17.4 70.2 100
VII 1.4 2.0 5.9 8.7 82.0 100
VIII 0.5 1.5 3.5 8.5 86.0 100
Total 8.9 15.3 15.1 17.8 42.8 100
% All school children who can read-standardwise
Faridkot 49.0
Nawanshahr* 50.3
Firozpur 53.2
Hoshiarpur 54.7
Fatehgarh Sahib 55.1
Level 1* Level 2**Subtraction or
DivisionDivision
Age : 7-14 ALL
Age : 7-10 ALL
Age : 11-14 ALL
Govt : Std II-V
Pvt : Std II-V
Govt : Std VI-VIII
Pvt : Std VI-VIII
% Children who CANNOT read ...% Children who CANNOT solve numerical
written sums of ...
PUNJAB RURAL
Performance of top five and bottom five districts in state based on % all children Std V
Comparison of government and private schools
based on % Std. V children who CAN read level-2
and solve written numerical sums
Reading Arithmetic
Children who CAN read and solve numerical written sums Learning curves
**Level - 2: Ability to read a 'story' text with some long sentences of std 2 level difficulty.
* Level - 1: Ability to read a small paragraph with short sentences of std 1 level difficulty.
Division: 3 digit divided by 1 digit.
Subtraction: 2 digit subtraction with borrowing.
Learning
35ASER 2005
34.3
52.6
13.3
46.2
37.7
9.5
8.8
52.8
74.5
28.0
69.6
59.7
23.0
15.8
35.4
54.0
14.4
47.7
39.9
11.0
7.5
64.1
83.9
41.7
79.3
73.0
36.9
27.6
Reading Arithmetic
Top - 5 Top - 5
Bottom - 5 Bottom - 5
% std III to
V CANNOT
read level-2
% std III to
V CANNOT
solve
subtraction 58.8
66.3
45.950.3
0
10
20
30
40
50
60
70
Govt Pvt Govt Pvt
Std. V level-2 Reading Std. V can solve Division
Bathinda 80.8
Gurdaspur 64.6
Ludhiana 64.6
Moga* 63.5
Muktsar* 63.4
Mansa* 21.1
Kapurthala 22.0
Hoshiarpur 25.1
Nawanshahr* 29.1
Firozpur 30.6
Muktsar* 52.4
Bathinda 51.9
Jalandhar 45.4
Ludhiana 45.2
Amritsar 43.3
Std NothingNumber
recogn
Subtracti
onDivision Total
I 51.8 39.4 6.5 2.4 100
II 27.7 50.1 17.9 4.4 100
III 13.8 42.4 31.0 12.7 100
IV 9.3 25.4 43.5 21.8 100
V 5.5 13.9 33.8 46.8 100
VI 3.8 10.4 31.1 54.8 100
VII 2.5 6.0 22.4 69.1 100
VIII 1.6 5.3 18.8 74.3 100
Total 14.7 25.8 27.0 32.5 100
% All school children who can solve written
numerical sums - standardwise

Teachers, children, and classrooms
Provision and use
PUNJAB RURAL
Average number of rooms available
36 ASER 2005
Type of
school by
enrollment
%
Schools
visited
Std
I-V
rooms
Type of
school by
enrollment
%
Schools
visited
Std
I-VIII
rooms
<=50 16 3.1 <=150 13 5.9
51-75 13 3.7 151-250 31 9.9
76-150 37 4.7 251-350 30 11.1
151-225 24 5.7 351-450 14 10.8
>225 10 7.2 >450 12 16.9
% of schools with no water/toilet provision
% of schools with water/toilet provision but not useable
% of schools with water/toilet provision and useable
Water & toilet provision and use (%)
Schools Std. I-V Schools Std. I-VIII
Textbooks and midday meals (%)
Schools Std. I-V Schools Std. I-VIII
Pe
rce
nta
ge
of sc
ho
ols
80.8
20.5
89.3
9.8
0
20
40
60
80
100
Schools
where most
(75%) of
children in Std
5 have
textbooks
Midday meal
available
Schools
where most
(75%) of
children in Std
5 have
textbooks
Midday meal
available
Pupil-teacher ratio (PTR)
Media
n fig
ure
s
Schools Std. I-V Schools Std. I - VIII
29.8
34.2
25.827.5
0
10
20
30
40
50
PTR based onenrollment
PTR based onattendance on
day of visit
PTR based onenrollment
PTR based onattendance on
day of visit
Std.
I-IV/V
Std.
I - VIII
Total number of schools
visited 185 82
% teachers attending
(average) 66.4 71.1
% of schools with NO
teachers present13.0 13.4
% of schools with ALL
teachers present 36.2 23.2
Teachers' attendance
Schools with:
Std.
I-IV/V
Std.
I - VIII
Total number of schools
visited 186 84
% enrolled children
attending (average) 78.9 83.2
Children's attendance
Schools with:
% of schools with less
than 50% of enrolled
children attending
6.5 2.4
0
20
40
60
80
100
Water facility
and use
Toilet provision
and use
Water facility
and use
Toilet provision
and use
Pe
rce
nta
ge
of sch
oo
ls

Performance of all districts
PUNJAB RURAL
37ASER 2005
All Children
% Out-of-school
% CAN read
level - 2
% CAN solve
subtraction
Amritsar 3.0 37.8 56.7
Bathinda 9.0 19.2 48.1
Faridkot 6.2 51.0 64.2
Fatehgarh Sahib 0.8 44.9 65.4
Firozpur 9.1 46.8 69.4
Gurdaspur 2.7 35.4 58.5
Hoshiarpur 1.6 45.3 74.9
Jalandhar 2.7 39.5 54.6
Kapurthala 3.1 37.6 78.0
District
Std III to V childrenAll
Children
% Out-of-school
% CAN read
level - 2
% CAN solve
subtraction
Ludhiana 1.7 35.4 54.8
Mansa* 7.4 43.3 78.9
Moga* 9.7 36.5 61.4
Muktsar* 17.6 36.6 47.6
Nawanshahr* 3.3 49.7 70.9
Patiala 2.2 40.6 68.8
Rupnagar 0.9 39.2 64.6
Sangrur 2.2 44.1 66.5
District
Std III to V children
PANJAB STATE 4.3 40.1 63.4

44%
56%54%
46%
Gender differences
Out-of-school children
Enrollment
Age 11-14Age 6-10
All analyses based on data from 19 out of 20 districts
HARYANA RURAL
Out-of-school children: Proportion of girls and boys.Percentage of boys and girls in government and private schools
38 ASER 2005
20+
15 - 20
10 - 15
5 - 10
3 - 5
0 - 3
No data
Percentage of children
Government Private Madarsa EGSNever
EnrolledDrop Out
Age : 6-14 ALL 59.2 34.4 1.1 0.1 2.5 2.8 100
Age : 6-10 ALL 59.4 35.4 1.3 0.1 2.9 0.9 100
Age : 11-14 ALL 59.3 32.8 0.8 0.1 1.7 5.3 100
Age : 6-10 BOYS 56.8 38.7 0.8 0.1 2.6 1.0 100
Age : 6-10 GIRLS 62.7 31.2 2.0 0.1 3.2 0.9 100
Age : 11-14 BOYS 56.0 38.5 0.2 0.0 1.3 4.1 100
Age : 11-14 GIRLS 63.9 25.0 1.6 0.1 2.3 7.1 100
Total
% Children in each age group in different
types of schools
% Children in each age
group not in school
0
20
40
60
80
100
Boys Girls Boys Girls
Govt school Pvt school
Children 6-14
Sirsa Fatehabad
Hisar
Bhiwani
KaithalKarnal
JindPanipat
SonipatRohtak
Jhajjar
Mahendragarh GurgaonRewari
Faridabad
Kurukshetra
Ambala
Yamunanagar
Panchkula

HARYANA RURAL
Performance of top five and bottom five districts in state based on % all children Std V
Comparison of government and private schools
based on % Std. V children who CAN read level-2
and solve written numerical sums
Reading Arithmetic
Children who CAN read and solve numerical written sums Learning curves
**Level - 2: Ability to read a 'story' text with some long sentences of std 2 level difficulty.
* Level - 1: Ability to read a small paragraph with short sentences of std 1 level difficulty.
Division: 3 digit divided by 1 digit.
Subtraction: 2 digit subtraction with borrowing.
Learning
% Children who CANNOT read ...% Children who CANNOT solve numerical
written sums of ...
39ASER 2005
Level 1* Level 2**Subtraction or
DivisionDivision
Age : 7-14 ALL 27.1 43.4 27.4 48.5
Age : 7-10 ALL 42.3 62.3 40.7 66.4
Age : 11-14 ALL 9.6 21.7 12.0 27.8
Govt : Std II-V 42.4 64.9 42.8 70.1
Pvt : Std II-V 26.2 46.4 23.6 50.6
Govt : Std VI-VIII 5.9 17.0 8.5 23.6
Pvt : Std VI-VIII 2.3 8.3 3.3 13.0
Std Nothing Letter Word Para-
Level I
Story-
Level IITotal
I 37.6 36.9 12.9 5.7 7.0 100
II 15.2 27.1 27.3 16.8 13.7 100
III 7.2 13.5 22.6 27.4 29.3 100
IV 3.4 7.3 15.6 24.0 49.7 100
V 0.9 3.8 6.1 18.2 71.1 100
VI 1.1 1.8 4.4 12.6 80.1 100
VII 0.7 1.4 1.8 8.6 87.6 100
VIII 0.5 0.3 1.3 5.9 92.0 100
Total 8.5 12.1 12.7 16.1 50.7 100
Std NothingNumber
recogn
Subtracti
onDivision Total
I 51.8 35.1 7.4 5.7 100
II 26.4 41.2 21.5 11.0 100
III 13.9 27.0 34.4 24.7 100
IV 7.7 17.7 30.5 44.1 100
V 2.8 10.8 22.2 64.2 100
VI 2.1 6.6 17.4 73.9 100
VII 1.6 6.0 12.5 80.0 100
VIII 0.6 2.6 8.8 88.0 100
Total 13.8 19.6 20.7 45.9 100
Reading Arithmetic
Top - 5 Top - 5
Fatehabad* 26.0 Rewari 3.7
Rewari 31.6 Rohtak 15.4
Rohtak 35.8 Fatehabad* 15.6
Mahendragarh 37.8 Sirsa 18.8Jind 40.7 Hisar 19.3
Bottom - 5 Bottom - 5
Karnal 62.9 Karnal 43.1
Yamunanagar 62.7 Yamunanagar 40.9
Gurgaon 62.3 Gurgaon 38.1
Kaithal 58.9 Bhiwani 37.5
Panchkula* 57.7 Kurukshetra 36.8
% std III to
V CANNOT
read level-2
% std III to
V CANNOT
solve
subtraction
65.1
82.9
56.9
78.9
0
10
20
30
40
50
60
70
80
90
Govt Pvt Govt Pvt
Std. V level-2 Reading Std. V can solve Division
% All school children who can read-standardwise% All school children who can solve written
numerical sums - standardwise
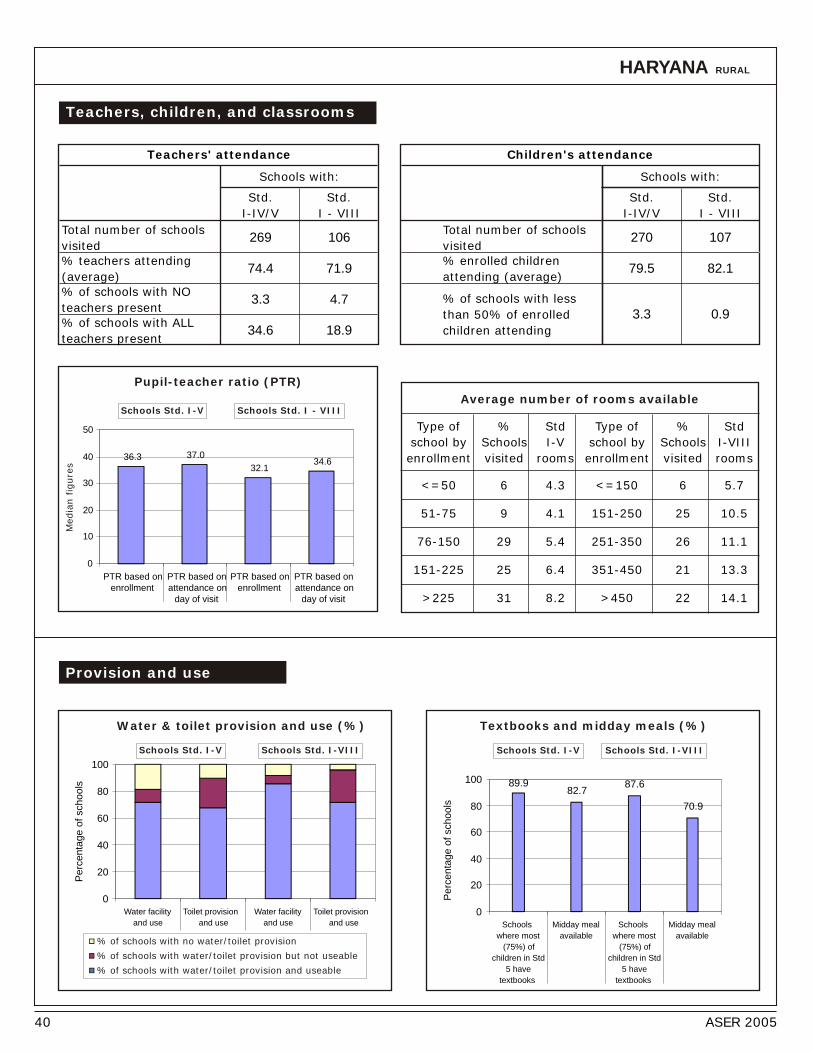
Std.
I-IV/V
Std.
I - VIII
Total number of schools
visited 269 106
% teachers attending
(average) 74.4 71.9
% of schools with NO
teachers present3.3 4.7
% of schools with ALL
teachers present 34.6 18.9
Teachers' attendance
Schools with:
Teachers, children, and classrooms
Provision and use
HARYANA RURAL
Average number of rooms available
40 ASER 2005
Type of
school by
enrollment
%
Schools
visited
Std
I-V
rooms
Type of
school by
enrollment
%
Schools
visited
Std
I-VIII
rooms
<=50 6 4.3 <=150 6 5.7
51-75 9 4.1 151-250 25 10.5
76-150 29 5.4 251-350 26 11.1
151-225 25 6.4 351-450 21 13.3
>225 31 8.2 >450 22 14.1
Pupil-teacher ratio (PTR)
Media
n fig
ure
s
Schools Std. I-V Schools Std. I - VIII
36.3 37.0
32.134.6
0
10
20
30
40
50
PTR based onenrollment
PTR based onattendance on
day of visit
PTR based onenrollment
PTR based onattendance on
day of visit
Std.
I-IV/V
Std.
I - VIII
Total number of schools
visited 270 107
% enrolled children
attending (average) 79.5 82.1
Children's attendance
Schools with:
% of schools with less
than 50% of enrolled
children attending
3.3 0.9
% of schools with no water/toilet provision
% of schools with water/toilet provision but not useable
% of schools with water/toilet provision and useable
Water & toilet provision and use (%)
Schools Std. I-V Schools Std. I-VIII
0
20
40
60
80
100
Water facility
and use
Toilet provision
and use
Water facility
and use
Toilet provision
and use
Pe
rce
nta
ge
of sch
oo
ls
Textbooks and midday meals (%)
Schools Std. I-V Schools Std. I-VIII
Pe
rce
nta
ge
of sc
ho
ols
89.982.7
87.6
70.9
0
20
40
60
80
100
Schools
where most
(75%) of
children in Std
5 have
textbooks
Midday meal
available
Schools
where most
(75%) of
children in Std
5 have
textbooks
Midday meal
available

Performance of all districts
HARYANA RURAL
41
All
Children
% Out-of-
school
% CAN
read
level - 2
% CAN
solve
subtraction
Ambala 1.9 43.0 63.3
Bhiwani 2.9 42.6 62.5
Faridabad 8.7 50.4 75.3
Fatehabad* 8.4 74.0 84.4
Gurgaon 9.5 37.7 61.9
Hisar 9.7 48.1 80.7
Jhajjar* 2.6 51.6 74.6
Jind 3.7 59.3 74.7
Kaithal 6.8 41.1 70.1
Karnal 5.5 37.1 56.9
District
Std III to V childrenAll
Children
% Out-of-school
% CAN read
level - 2
% CAN solve
subtraction
Kurukshetra 2.7 53.2 63.2
Mahendragarh 3.6 62.2 74.2
Panchkula* 2.7 42.3 63.4
Panipat 3.8 44.2 77.8
Rewari 0.8 68.4 96.3
Rohtak 3.5 64.2 84.6
Sirsa 6.8 47.8 81.2
Sonipat 5.0 49.3 80.7
Yamunanagar 2.1 37.3 59.1
Std III to V children
Haryana state 5.3 49.9 73.3
ASER 2005


Rajasthan
Uttar Pradesh
Bihar
West Bengal
Jharkhand

36%
64%
36%
64%
Out-of-school children
All analyses based on data from 32 out of 32 districts
Age 11-14Age 6-10
RAJASTHAN RURAL
Out-of-school children: Proportion of girls and boys.Percentage of boys and girls in government and private schools
Gender differences
Out-of-school children
Enrollment
44 ASER 2005
20+
15 - 20
10 - 15
5 - 10
3 - 5
0 - 3
No data
Percentage of children
% Children in each age group in different
types of schools
% Children in each age
group not in school
Government Private Madarsa EGSNever
EnrolledDrop Out
Age : 6-14 ALL 67.0 21.9 0.5 0.2 5.9 4.5 100
Age : 6-10 ALL 68.5 23.5 0.5 0.3 5.2 2.1 100
Age : 11-14 ALL 65.1 19.3 0.4 0.1 6.8 8.4 100
Age : 6-10 BOYS 67.6 27.1 0.3 0.2 3.5 1.2 100
Age : 6-10 GIRLS 69.7 18.7 0.6 0.3 7.4 3.2 100
Age : 11-14 BOYS 67.4 23.1 0.3 0.1 3.6 5.5 100
Age : 11-14 GIRLS 61.8 13.7 0.5 0.2 11.4 12.5 100
Total
0
20
40
60
80
100
Boys Girls Boys Girls
Govt school Pvt school
Children 6-14
JAIPUR
Ganganagar
Hanumangarh
Bikaner
Jaisalmer
Barmer
Jalor
Sirohi
Udaipur
RajasamandChittaurgarh
Bhilwara
Pali
Jodhpur
Nagaur
Ajmer
Dhaulpur
Alwar
Bharatpur
Karauli
Tonk
SawaiMadhopur
Bundi
Kota Baran
Jhalawar
Dungarpur
Banswara
Churu
Jhunjhunun
Sikar
Dausa

RAJASTHAN RURAL
Performance of top five and bottom five districts in state based on % all children Std V
Comparison of government and private schools
based on % Std. V children who CAN read level-2
and solve written numerical sums
Reading Arithmetic
Children who CAN read and solve numerical written sums Learning curves
**Level - 2: Ability to read a 'story' text with some long sentences of std 2 level difficulty.
* Level - 1: Ability to read a small paragraph with short sentences of std 1 level difficulty.
Division: 3 digit divided by 1 digit.
Subtraction: 2 digit subtraction with borrowing.
Learning
% Children who CANNOT read ...% Children who CANNOT solve numerical
written sums of ...
45ASER 2005
Level 1* Level 2**Subtraction or
DivisionDivision
Age : 7-14 ALL 36.5 51.4 42.2 61.1
Age : 7-10 ALL 49.9 66.9 55.6 75.7
Age : 11-14 ALL 19.3 31.5 25.1 42.3
Govt : Std II-V 49.5 68.3 55.3 78.4
Pvt : Std II-V 31.7 53.0 38.2 62.2
Govt : Std VI-VIII 7.0 19.5 14.0 33.5
Pvt : Std VI-VIII 4.2 13.0 8.4 20.4
Std Nothing Letter Word Para-
Level I
Story-
Level IITotal
I 58.3 26.8 9.7 2.7 2.6 100
II 25.6 30.5 25.7 10.7 7.6 100
III 10.9 17.1 25.3 21.9 24.8 100
IV 5.9 9.1 14.3 24.6 46.1 100
V 3.3 5.4 8.3 21.0 62.0 100
VI 3.1 2.1 4.1 16.5 74.4 100
VII 2.0 0.9 2.3 10.1 84.7 100
VIII 2.5 0.4 0.4 6.2 90.5 100
Total 15.8 13.2 12.7 14.9 43.6 100
Std NothingNumber
recogn
Subtracti
onDivision Total
I 71.4 24.9 2.4 1.3 100
II 39.6 44.3 10.7 5.3 100
III 22.3 36.7 25.5 15.5 100
IV 13.4 24.2 30.3 32.1 100
V 9.1 16.1 27.1 47.8 100
VI 6.4 10.5 23.3 59.8 100
VII 4.5 6.8 16.0 72.8 100
VIII 4.1 4.0 11.3 80.6 100
Total 23.9 23.2 18.7 34.2 100
% All school children who can solve written
numerical sums - standardwise
Reading Arithmetic
Top - 5 Top - 5
Sikar 33.3 Hanumangarh 17.1
Jalor 42.9 Jalor 18.8
Churu 43.1 Barmer 22.6
Barmer 43.4 Pali 27.4
Ganganagar 43.9 Sikar 29.3
Bottom - 5 Bottom - 5
Sirohi 88.1 Sirohi 53.6
Jhalawar 70.0 Dungarpur 55.1
Ajmer 69.8 Chittaurgar 51.9
Dungarpur 69.5 Banswara 71.8
Jaipur 67.7 Ajmer 61.2
% std III to
V CANNOT
read level-2
% std III to
V CANNOT
solve
subtraction
59.3
71.8
43.1
65.4
0
10
20
30
40
50
60
70
80
Govt Pvt Govt Pvt
Std. V level-2 Reading Std. V can solve Division
% All school children who can read-standardwise

Teachers, children, and classrooms
Provision and use
RAJASTHAN RURAL
46 ASER 2005
Average number of rooms available
Type of
school by
enrollment
%
Schools
visited
Std
I-V
rooms
Type of
school by
enrollment
%
Schools
visited
Std
I-VIII
rooms
<=50 12 3.9 <=150 16 6.1
51-75 16 4.1 151-250 42 8.2
76-150 36 4.9 251-350 29 9.2
151-225 22 6.0 351-450 8 10.5
>225 14 7.5 >450 5 9.8
% of schools with no water/toilet provision
% of schools with water/toilet provision but not useable
% of schools with water/toilet provision and useable
Water & toilet provision and use (%)
Schools Std. I-V Schools Std. I-VIII
Textbooks and midday meals (%)
Schools Std. I-V Schools Std. I-VIII
Pe
rce
nta
ge
of sc
ho
ols
95.3
81.8
96.8
83.9
0
20
40
60
80
100
Schools
where most
(75%) of
children in Std
5 have
textbooks
Midday meal
available
Schools
where most
(75%) of
children in Std
5 have
textbooks
Midday meal
available
Pupil-teacher ratio (PTR)
Media
n fig
ure
s
Schools Std. I-V Schools Std. I - VIII
38.5
33.3 34.5 33.0
0
10
20
30
40
50
PTR based onenrollment
PTR based onattendance on
day of visit
PTR based onenrollment
PTR based onattendance on
day of visit
Std.
I-IV/V
Std.
I - VIII
Total number of schools
visited 321 281
% teachers attending
(average) 76.2 76.2
% of schools with NO
teachers present6.5 4.3
% of schools with ALL
teachers present 48.3 33.1
Teachers' attendance
Schools with:
Std.
I-IV/V
Std.
I - VIII
Total number of schools
visited 320 280
% enrolled children
attending (average) 69.7 73.2
Children's attendance
Schools with:
% of schools with less
than 50% of enrolled
children attending
13.8 6.4
0
20
40
60
80
100
Water facility
and use
Toilet provision
and use
Water facility
and use
Toilet provision
and use
Pe
rce
nta
ge
of sch
oo
ls

Performance of all districts
RAJASTHAN RURAL
47ASER 2005
All Children
% Out-of-school
% CAN read
level - 2
% CAN solve
subtraction
Ajmer 14.7 30.2 38.8
Alwar 9.2 36.4 56.5
Banswara 18.0 32.6 28.2
Baran* 11.4 51.9 61.1
Barmer 13.6 56.6 77.4
Bharatpur 12.3 42.1 52.4
Bhilwara 15.3 42.6 63.4
Bikaner 18.9 47.8 68.0
Bundi 12.7 42.7 62.4
Chittaurgar 7.8 44.4 48.1
Churu 4.6 56.9 70.5
Dausa* 9.7 54.3 56.3
Dhaulpur 14.0 37.7 58.1
Dungarpur 8.2 30.5 44.9
Ganganagar 7.6 56.1 66.3
Hanumangarh 3.5 49.0 82.9
District
Std III to V childrenAll
Children
% Out-of-school
% CAN read
level - 2
% CAN solve
subtraction
Jaipur 6.6 32.3 48.6
Jaisalmer 15.5 36.3 61.2
Jalor 15.1 57.1 81.2
Jhalawar 18.6 30.0 56.2
Jhunjhunun 1.6 49.6 63.4
Jodhpur 10.8 40.8 53.7
Karauli* 6.4 42.5 67.9
Kota 6.9 46.1 50.0
Nagaur 8.5 38.0 53.8
Pali 4.5 41.4 72.6
Rajasamand* 7.4 42.6 56.1
Sawai Madhopur 15.2 47.3 51.6
Sikar 6.7 66.7 70.7
Sirohi 14.5 11.9 46.4
Tonk 9.6 50.0 60.5
Udaipur 13.6 52.6 49.8
District
Std III to V children
Rajasthan state 10.4 44.7 59.7

43%
57%50%50%
All analyses based on data from 69 out of 69 districts
Age 11-14Age 6-10
0
20
40
60
80
100
Boys Girls Boys Girls
Govt school Pvt school
UTTAR PRADESH RURAL
Out-of-school children: Proportion of girls and boys.Percentage of boys and girls in government and private schools
Gender differences
Out-of-school children
Enrollment
48 ASER 2005
20+
15 - 20
10 - 15
5 - 10
3 - 5
0 - 3
No data
Percentage of children
% Children in each age group in different
types of schools
% Children in each age
group not in school
Government Private Madarsa EGSNever
EnrolledDrop Out
Age : 6-14 ALL 63.1 27.9 1.6 0.2 4.4 2.9 100
Age : 6-10 ALL 67.2 25.7 1.7 0.1 4.1 1.3 100
Age : 11-14 ALL 56.0 31.9 1.3 0.2 4.9 5.8 100
Age : 6-10 BOYS 64.9 28.6 1.6 0.1 3.8 1.0 100
Age : 6-10 GIRLS 70.1 22.0 1.8 0.2 4.5 1.5 100
Age : 11-14 BOYS 55.8 34.6 1.3 0.2 3.7 4.5 100
Age : 11-14 GIRLS 56.2 28.5 1.3 0.2 6.5 7.4 100
Total
LUCKNOW
Ghaziabad
Meerut
BijnorMuzaffarnagar
Saharanpur
Moradabad
RampurPilibhit
Bulandshahar Bareilly
BadaunAligarh
Hathras Etah
Shahjahanpur
Mathura
MainpuriAgraFirozabad
Etawah
Kannauj
Hardoi
Sitapur
Kheri
Bahraich
Balrampur
GondaBara-Banki
Jhansi
Lalitpur
Hamirpur
Auraiya
Mahoba
KanpurUnnao
Rae Bareli
Faizabad
Basti
Sultanpur
Azamgarh
Gorakhpur
Deoria
Mau
Maharajganj
BalliaGhazipur
Varanasi
JaunpurKaushambi
Mirzapur
SRNBanda
Fatehpur
Baghpat
JPN
GBN
FarukhabadShrawasti
Jalaun
Siddharth Nagar
Pratapgarh
Chitrakoot
A. Nagar
SKN
Kushinagar
AllahabadChandauli
Sonbhadra
Fatehpur

UTTAR PRADESH RURAL
Performance of top five and bottom five districts in state based on % all children Std V
Comparison of government and private schools
based on % Std. V children who CAN read level-2
and solve written numerical sums
Reading Arithmetic
Children who CAN read and solve numerical written sums Learning curves
**Level - 2: Ability to read a 'story' text with some long sentences of std 2 level difficulty.
* Level - 1: Ability to read a small paragraph with short sentences of std 1 level difficulty.
Division: 3 digit divided by 1 digit.
Subtraction: 2 digit subtraction with borrowing.
Learning
% Children who CANNOT read ...% Children who CANNOT solve numerical
written sums of ...
49ASER 2005
Level 1* Level 2**Subtraction or
DivisionDivision
Age : 7-14 ALL 46.4 61.3 53.6 74.0
Age : 7-10 ALL 62.0 77.4 67.7 86.2
Age : 11-14 ALL 25.2 39.4 34.4 57.5
Govt : Std II-V 61.3 78.9 67.6 87.7
Pvt : Std II-V 35.7 56.2 43.4 71.8
Govt : Std VI-VIII 16.8 31.3 29.1 54.5
Pvt : Std VI-VIII 7.0 16.4 14.2 34.6
Std Nothing Letter Word Para-
Level I
Story-
Level IITotal
I 52.0 29.3 12.3 3.5 2.8 100
II 24.6 34.9 21.0 11.7 7.8 100
III 14.8 23.8 22.1 19.9 19.5 100
IV 7.9 16.8 18.1 21.7 35.6 100
V 5.0 10.8 12.0 20.9 51.3 100
VI 3.5 6.1 7.6 15.7 67.2 100
VII 2.8 4.3 5.2 11.4 76.4 100
VIII 1.9 2.7 2.8 9.0 83.7 100
Total 16.8 19.2 14.6 14.8 34.6 100
Std NothingNumber
recogn
Subtracti
onDivision Total
I 70.6 24.8 3.2 1.4 100
II 45.3 38.4 12.1 4.2 100
III 30.5 36.3 22.8 10.4 100
IV 21.6 29.2 27.3 21.9 100
V 14.4 23.2 29.2 33.2 100
VI 9.6 18.1 25.7 46.7 100
VII 8.4 13.2 23.0 55.4 100
VIII 5.9 12.5 20.7 60.9 100
Total 30.3 27.2 19.8 22.8 100
% All school children who can solve written
numerical sums - standardwise
Reading Arithmetic
Top - 5 Top - 5
Saharanpur 31.2 Chitrakoot* 6.5
Ghaziabad 38.1 Firozabad 12.2
Jhansi 42.3 Chandauli* 12.6
Baghpat* 45.4 Ghaziabad 13.9
Gautam Buddha Nagar* 48.2 Varanasi 16.0
Bottom - 5 Bottom - 5
Shrawasti* 86.7 Kheri 83.1
Mahoba* 87.3 Etah 79.2
Farrukhabad 87.4 Jaunpur 78.0
Etah 89.9 Jalaun 75.4
Jalaun 91.7 Shrawasti* 74.2
% std III to
V CANNOT
read level-2
% std III to
V CANNOT
solve
subtraction
45.2
69.3
27.8
49.3
0
10
20
30
40
50
60
70
80
Govt Pvt Govt Pvt
Std. V level-2 Reading Std. V can solve Division
% All school children who can read-standardwise

0
10
20
30
40
50
Pupil-teacher ratio (PTR)
PTR based on
enrollment
PTR based on attendance on day of visit
PTR based on
enrollment
PTR based onattendance on
day of visit
Media
n fig
ure
s
Schools Std. I-V Schools Std. I - VIII
Teachers, children, and classrooms
Provision and use
UTTAR PRADESH RURAL
50 ASER 2005
Type of
school by
enrollment
%
Schools
visited
Std
I-V
rooms
Type of
school by
enrollment
%
Schools
visited
Std
I-VIII
rooms
<=50 1 2.9 <=150 31 2.7
51-75 3 2.7 151-250 32 4.1
76-150 25 3.0 251-350 21 4.4
151-225 30 3.6 351-450 9 4.7
>225 41 3.8 >450 7 5.7
Average number of rooms available
Std.
I-IV/V
Std.
I - VIII
Total number of schools
visited 783 359
% teachers attending
(average) 76.0 66.6
% of schools with NO
teachers present7.8 24.8
% of schools with ALL
teachers present 52.0 51.5
Teachers' attendance
Schools with:
Std.
I-IV/V
Std.
I - VIII
Total number of schools
visited 791 337
% enrolled children
attending (average) 63.6 58.7
Children's attendance
Schools with:
% of schools with less
than 50% of enrolled
children attending
23.1 28.5
% of schools with no water/toilet provision
% of schools with water/toilet provision but not useable
% of schools with water/toilet provision and useable
Water & toilet provision and use (%)
Schools Std. I-V Schools Std. I-VIII
Textbooks and midday meals (%)
Schools Std. I-V Schools Std. I-VIII
Pe
rce
nta
ge
of sc
ho
ols
0
20
40
60
80
100
Water facility
and use
Toilet provision
and use
Water facility
and use
Toilet provision
and use
Pe
rce
nta
ge
of sch
oo
ls 84.6
56.7
86.4
52.5
0
20
40
60
80
100
Schools
where most
(75%) of
children in Std
5 have
textbooks
Midday meal
available
Schools
where most
(75%) of
children in Std
5 have
textbooks
Midday meal
available
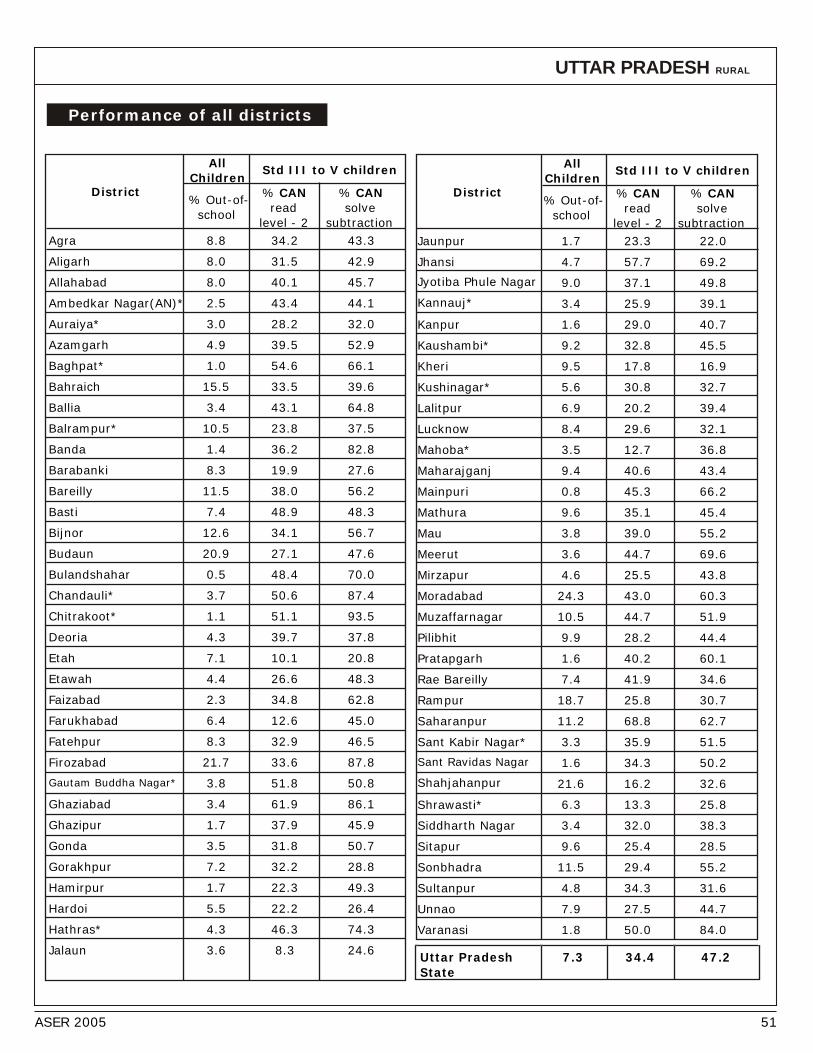
Performance of all districts
UTTAR PRADESH RURAL
Uttar Pradesh State
7.3 34.4 47.2
All
Children
% Out-of-school
% CAN read
level - 2
% CAN solve
subtraction
Jaunpur 1.7 23.3 22.0
Jhansi 4.7 57.7 69.2
Jyotiba Phule Nagar 9.0 37.1 49.8
Kannauj* 3.4 25.9 39.1
Kanpur 1.6 29.0 40.7
Kaushambi* 9.2 32.8 45.5
Kheri 9.5 17.8 16.9
Kushinagar* 5.6 30.8 32.7
Lalitpur 6.9 20.2 39.4
Lucknow 8.4 29.6 32.1
Mahoba* 3.5 12.7 36.8
Maharajganj 9.4 40.6 43.4
Mainpuri 0.8 45.3 66.2
Mathura 9.6 35.1 45.4
Mau 3.8 39.0 55.2
Meerut 3.6 44.7 69.6
Mirzapur 4.6 25.5 43.8
Moradabad 24.3 43.0 60.3
Muzaffarnagar 10.5 44.7 51.9
Pilibhit 9.9 28.2 44.4
Pratapgarh 1.6 40.2 60.1
Rae Bareilly 7.4 41.9 34.6
Rampur 18.7 25.8 30.7
Saharanpur 11.2 68.8 62.7
Sant Kabir Nagar* 3.3 35.9 51.5
Sant Ravidas Nagar 1.6 34.3 50.2
Shahjahanpur 21.6 16.2 32.6
Shrawasti* 6.3 13.3 25.8
Siddharth Nagar 3.4 32.0 38.3
Sitapur 9.6 25.4 28.5
Sonbhadra 11.5 29.4 55.2
Sultanpur 4.8 34.3 31.6
Unnao 7.9 27.5 44.7
Varanasi 1.8 50.0 84.0
District
Std III to V children
51ASER 2005
All
Children
% Out-of-
school
% CAN
read
level - 2
% CAN
solve
subtraction
Agra 8.8 34.2 43.3
Aligarh 8.0 31.5 42.9
Allahabad 8.0 40.1 45.7
Ambedkar Nagar(AN)* 2.5 43.4 44.1
Auraiya* 3.0 28.2 32.0
Azamgarh 4.9 39.5 52.9
Baghpat* 1.0 54.6 66.1
Bahraich 15.5 33.5 39.6
Ballia 3.4 43.1 64.8
Balrampur* 10.5 23.8 37.5
Banda 1.4 36.2 82.8
Barabanki 8.3 19.9 27.6
Bareilly 11.5 38.0 56.2
Basti 7.4 48.9 48.3
Bijnor 12.6 34.1 56.7
Budaun 20.9 27.1 47.6
Bulandshahar 0.5 48.4 70.0
Chandauli* 3.7 50.6 87.4
Chitrakoot* 1.1 51.1 93.5
Deoria 4.3 39.7 37.8
Etah 7.1 10.1 20.8
Etawah 4.4 26.6 48.3
Faizabad 2.3 34.8 62.8
Farukhabad 6.4 12.6 45.0
Fatehpur 8.3 32.9 46.5
Firozabad 21.7 33.6 87.8
Gautam Buddha Nagar* 3.8 51.8 50.8
Ghaziabad 3.4 61.9 86.1
Ghazipur 1.7 37.9 45.9
Gonda 3.5 31.8 50.7
Gorakhpur 7.2 32.2 28.8
Hamirpur 1.7 22.3 49.3
Hardoi 5.5 22.2 26.4
Hathras* 4.3 46.3 74.3
Jalaun 3.6 8.3 24.6
District
Std III to V children

48%52%48%
52%
Out-of-school children
BIHARAll analyses based on data from 34 out of 37 districts
Age 11-14Age 6-10
RURAL
Out-of-school children: Proportion of girls and boys.Percentage of boys and girls in government and private schools
Gender differences
Out-of-school children
Enrollment
52 ASER 2005
20+
15 - 20
10 - 15
5 - 10
3 - 5
0 - 3
No data
Percentage of children
Government Private Madarsa EGSNever
EnrolledDrop Out
Age : 6-14 ALL 72.1 9.6 3.5 1.6 10.0 3.1 100
Age : 6-10 ALL 72.2 10.5 3.7 2.0 10.2 1.5 100
Age : 11-14 ALL 72.1 7.8 3.3 0.7 9.6 6.6 100
Age : 6-10 BOYS 73.4 11.6 3.4 1.9 8.3 1.4 100
Age : 6-10 GIRLS 70.7 9.0 4.0 2.1 12.6 1.5 100
Age : 11-14 BOYS 74.4 8.7 2.9 0.7 7.1 6.2 100
Age : 11-14 GIRLS 68.9 6.5 3.8 0.8 13.0 7.1 100
Total
% Children in each age group in different
types of schools
% Children in each age
group not in school
0
20
40
60
80
100
Boys Girls Boys Girls
Govt school Pvt school
Children 6-14
PATNA
Aurangabad
BhabuaRohtas
Gaya
Buxar
Jahanabad
Bhojpur
Nawada
Sheikhpura
Lukhisarai
JamuiBanka
Munger
Begusarai Khagaria
Samastipur
Saharsa
Muzaffarpur
Madhepura
Darbhanga
Katihar
Purnia
SupaulAraria
Kishanganj
Siwan
Gopalganj
Sheohar MadhubaniSitamarhi
Bhagalpur
Vaishali
Saran
PaschimChamparan
Nalanda
PurbiChamparan

BIHAR RURAL
Performance of top five and bottom five districts in state based on % all children Std V
Comparison of government and private schools
based on % Std. V children who CAN read level-2
and solve written numerical sums
Reading Arithmetic
Children who CAN read and solve numerical written sums Learning curves
**Level - 2: Ability to read a 'story' text with some long sentences of std 2 level difficulty.
* Level - 1: Ability to read a small paragraph with short sentences of std 1 level difficulty.
Division: 3 digit divided by 1 digit.
Subtraction: 2 digit subtraction with borrowing.
Learning
53ASER 2005
Level 1* Level 2**Division
Division
Age : 7-14 ALL 40.9 55.4 42.0 63.2
Age : 7-10 ALL 52.7 68.9 53.3 76.4
Age : 11-14 ALL 22.0 33.7 23.9 42.2
Govt : Std II-V 39.9 60.3 40.8 69.4
Pvt : Std II-V 18.8 37.1 19.8 48.8
Govt : Std VI-VIII 4.1 13.1 5.6 20.7
Pvt : Std VI-VIII 1.1 8.4 2.3 12.0
% Children who CANNOT read ...% Children who CANNOT solve numerical
written sums of ...
Std Nothing Letter Word Para-
Level I
Story-
Level IITotal
I 47.7 31.5 12.2 4.3 4.4 100
II 16.2 27.4 26.9 14.6 15.0 100
III 6.2 12.8 17.8 27.2 35.9 100
IV 3.4 6.1 9.2 22.7 58.5 100
V 2.0 2.6 5.9 16.5 73.1 100
VI 1.3 1.8 2.9 11.6 82.5 100
VII 0.3 0.8 1.8 7.0 90.1 100
VIII 0.5 0.2 0.6 6.4 92.3 100
Total 14.9 15.2 12.8 14.8 42.3 100
Std NothingNumber
recogn
Subtracti
onDivision Total
I 63.4 28.4 5.9 2.4 100
II 29.3 40.3 20.7 9.7 100
III 13.0 24.8 37.8 24.5 100
IV 7.6 14.2 31.8 46.4 100
V 3.6 8.1 25.1 63.2 100
VI 2.8 4.6 19.5 73.1 100
VII 1.0 3.2 13.1 82.7 100
VIII 0.8 1.8 7.8 89.5 100
Total 22.6 21.1 21.4 35.0 100
% All school children who can solve written
numerical sums - standardwise
Reading Arithmetic
Top - 5 Top - 5
Madhepura 13.2 Madhepura 6.0
Patna 29.0 Sheikhpura* 12.5
Aurangabad 29.5 Jehanabad 14.1
Nawada 31.7 Khagaria 14.8
Supaul* 33.3 Aurangabad 15.2
Bottom - 5 Bottom - 5
Sheohar* 63.0 Sheohar* 40.0
Bhojpur 62.2 Kaimur(Bhabua)* 35.3
Rohtas 60.3 Darbhanga 35.0
Gopalganj 59.9 Sitamarhi 34.7
Vaishali 58.9 Nalanda 34.2
% std III to
V CANNOT
read level-2
% std III to
V CANNOT
solve
subtraction
71.7
90.2
61.6
81.3
0
10
20
30
40
50
60
70
80
90
100
Govt Pvt Govt Pvt
Std. V level-2 Reading Std. V can solve Division
% All school children who can read-standardwise

BIHAR RURAL
Teachers, children, and classrooms
Provision and use
54 ASER 2005
Type of
school by
enrollment
%
Schools
visited
Std
I-V
rooms
Type of
school by
enrollment
%
Schools
visited
Std
I-VIII
rooms
<=50 1 2.5 <=150 1 3.0
51-75 1 1.5 151-250 18 4.8
76-150 21 2.3 251-350 17 4.9
151-225 31 2.7 351-450 18 5.5
>225 46 3.2 >450 46 6.9
Average number of rooms available
% of schools with no water/toilet provision
% of schools with water/toilet provision but not useable
% of schools with water/toilet provision and useable
Water & toilet provision and use (%)
Schools Std. I-V Schools Std. I-VIII
Textbooks and midday meals (%)
Schools Std. I-V Schools Std. I-VIII
Pe
rce
nta
ge
of sc
ho
ols
52.2
38.4
62.4
39.0
0
20
40
60
80
100
Schools
where most
(75%) of
children in Std
5 have
textbooks
Midday meal
available
Schools
where most
(75%) of
children in Std
5 have
textbooks
Midday meal
available
Pupil-teacher ratio (PTR)
Media
n fig
ure
s
Schools Std. I-V Schools Std. I - VIII
52.0
34.8
44.368.2
0
10
20
30
40
50
PTR based onenrollment
PTR based onattendance on
day of visit
PTR based onenrollment
PTR based onattendance on
day of visit
Std.
I-IV/V
Std.
I - VIII
Total number of schools
visited 322 293
% teachers attending
(average) 74.0 69.8
% of schools with NO
teachers present8.1 6.1
% of schools with ALL
teachers present 42.9 28.0
Teachers' attendance
Schools with:
Std.
I-IV/V
Std.
I - VIII
Total number of schools
visited 321 293
% enrolled children
attending (average) 51.2 49.0
Children's attendance
Schools with:
% of schools with less
than 50% of enrolled
children attending
41.1 47.4
0
20
40
60
80
100
Water facility
and use
Toilet provision
and use
Water facility
and use
Toilet provision
and use
Pe
rce
nta
ge
of sch
oo
ls

BIHAR RURAL
Performance of all districts
55ASER 2005
All Children
% Out-of-school
% CAN read
% CAN solve
Araria 23.0 56.5 76.1
Aurangabad 9.3 70.5 84.8
Banka* 10.4 49.1 77.7
Begusarai 4.3 56.6 82.7
Bhagalpur 5.4 60.0 81.0
Bhojpur 3.3 37.8 78.4
Buxar* 5.1
22.8
45.8
49.8
76.5
65.0Darbhanga
Gaya 11.7 45.5 73.5
Gopalganj 4.5 40.1 65.9
Jamui* 22.4 63.9 77.9
Jahanabad 9.1 63.7 85.9
Kaimur(Bhabua)* 4.0 42.8 64.7
Katihar 18.9 60.8 74.4
Khagaria 12.0 57.4 85.2
Kishanganj 23.3 55.6 82.1
Lukhisarai* 16.7 58.1 82.3
Madhepura 11.5 86.8 94.0
District
Std III to V childrenAll
Children
% Out-of-
school
% CAN
read
% CAN
solve
Madhubani 12.8 41.9 67.1
Munger 18.6 59.2 78.9
Muzaffarpur 5.8 58.4 79.4
Nalanda 11.9 45.8 65.8
Nawada 18.5 68.3 83.6
Pashchim Champaran 17.3 54.4 66.8
Patna 6.4
12.3
71.0
71.0
71.6
71.6Purbi Champaran
Purnia 15.9 58.9 75.1
Rohtas 4.2 39.7 66.0
Saharsa 26.1 59.1 80.1
Samastipur 9.6 54.4 74.4
Saran 9.4 48.3 75.6
Sheikhpura* 12.0 52.6 87.5
Sheohar* 25.1 37.0 60.0
Sitamarhi 25.2 55.6 65.3
Supaul* 28.6 66.7 79.8
Vaishali 4.6 41.1 70.9
District
Std III to V children
Bihar state 13.1 53.6 74.7

52%48%
55%
45%
Gender differences
Out-of-school children
Enrollment
All analyses based on data from 14 out of 17 districts
Age 11-14Age 6-10
WEST BENGAL RURAL
Out-of-school children: Proportion of girls and boys.Percentage of boys and girls in government and private schools
56 ASER 2005
20+
15 - 20
10 - 15
5 - 10
3 - 5
0 - 3
No data
Percentage of children
% Children in each age group in different
types of schools
% Children in each age
group not in school
Government Private Madarsa EGSNever
EnrolledDrop Out
Age : 6-14 ALL 92.2 2.8 0.2 0.4 1.5 2.9 100
Age : 6-10 ALL 94.8 3.3 0.1 0.2 1.0 0.7 100
Age : 11-14 ALL 87.8 2.1 0.3 0.3 2.5 7.0 100
Age : 6-10 BOYS 94.4 3.5 0.1 0.3 1.0 0.7 100
Age : 6-10 GIRLS 95.2 2.9 0.1 0.1 0.9 0.7 100
Age : 11-14 BOYS 88.1 2.0 0.4 0.3 2.3 6.9 100
Age : 11-14 GIRLS 87.4 2.3 0.3 0.2 2.8 7.1 100
Total
0
20
40
60
80
100
Boys Girls Boys Girls
Govt school Pvt school
Children 6-14
KOLKATA
Medinipur
Haora
Puruliya
Bankura
Barddhaman
Jalpaiguri
Darjiling
Koch Bihar
Uttar Dinajpur
Dakshin Dinajpur
Maldah
Birbhum
HugliNorth 24 Paraganaa
South 24 Paraganaa
Murshidabad
Nadia

WEST BENGAL RURAL
Performance of top five and bottom five districts in state based on % all children Std V
Comparison of government and private schools
based on % Std. V children who CAN read level-2
and solve written numerical sums
Reading Arithmetic
Children who CAN read and solve numerical written sums Learning curves
**Level - 2: Ability to read a 'story' text with some long sentences of std 2 level difficulty.
* Level - 1: Ability to read a small paragraph with short sentences of std 1 level difficulty.
Division: 3 digit divided by 1 digit.
Subtraction: 2 digit subtraction with borrowing.
Learning
Subtraction or
% Children who CANNOT read ...% Children who CANNOT solve numerical
written sums of ...
57ASER 2005
Level 1* Level 2**Division
Division
Age : 7-14 ALL 22.1 48.5 21.8 51.3
Age : 7-10 ALL 29.5 62.9 29.0 67.5
Age : 11-14 ALL 8.7 22.4 9.0 22.1
Govt : Std II-V 24.8 57.3 24.4 61.6
Pvt : Std II-V 28.2 47.9 35.1 60.5
Govt : Std VI-VIII 1.9 12.8 2.9 12.2
Pvt : Std VI-VIII 2.4 27.6 8.0 41.7
Std Nothing Letter Word Para-
Level I
Story-
Level IITotal
I 17.2 40.8 24.9 10.3 6.8 100
II 4.5 18.9 28.4 34.5 13.7 100
III 1.6 8.1 16.5 38.8 35.0 100
IV 1.2 3.0 6.6 32.0 57.2 100
V 0.7 1.6 4.9 17.3 75.5 100
VI 0.3 0.7 1.8 14.1 83.1 100
VII 0.6 0.2 0.9 9.5 88.8 100
VIII 0.0 0.2 0.4 8.4 91.0 100
Total 4.3 12.3 13.8 24.6 44.9 100
Std NothingNumber
recogn
Subtracti
onDivision Total
I 27.2 53.3 12.7 6.9 100
II 11.1 38.4 39.9 10.6 100
III 4.8 21.8 45.9 27.6 100
IV 2.4 8.4 36.6 52.7 100
V 2.2 7.1 17.0 73.7 100
VI 0.6 4.1 13.2 82.2 100
VII 0.4 1.2 6.5 91.8 100
VIII 0.0 1.6 8.3 90.1 100
Total 7.8 21.7 28.0 42.5 100
% All school children who can solve written
numerical sums - standardwise
Reading Arithmetic
Top - 5 Top - 5
Medinipur 18.8 Murshidabad 1.2
Koch Bihar 25.4 Medinipur 8.6
Barddhaman 36.0 Barddhaman 10.7
Uttar Dinajpur 36.4 North 24 Paraganaa 11.3
Bankura 41.0 South 24 Paraganaa 11.9
Bottom - 5 Bottom - 5
Murshidabad 97.6 Dakshin Dinajpur* 44.6
Dakshin Dinajpur* 65.1 Bankura 32.4
Maldah 58.7 Uttar Dinajpur 31.4
Hugli 57.1 Hugli 30.4
South 24 Paraganaa 54.9 Maldah 26.1
% std III to
V CANNOT
read level-2
% std III to
V CANNOT
solve
Subtraction 76.5
49.4
75.0
39.9
0
10
20
30
40
50
60
70
80
90
Govt Pvt Govt Pvt
Std. V level-2 Reading Std. V can solve Division
% All school children who can read-standardwise

Teachers, children, and classrooms
Provision and use
WEST BENGAL RURAL
58 ASER 2005
Average number of rooms available
Type of
school by
enrollment
%
Schools
visited
Std
I-V
rooms
Type of
school by
enrollment
%
Schools
visited
Std
I-VIII
rooms
<=50 3 1.6 <=150 0.0 0.0
51-75 6 2.6 151-250 0.0 0.0
76-150 34 2.9 251-350 0.0 0.0
151-225 35 3.5 351-450 0.0 0.0
>225 22 4.0 >450 0.0 0.0
% of schools with no water/toilet provision
% of schools with water/toilet provision but not useable
% of schools with water/toilet provision and useable
Water & toilet provision and use (%)
Schools Std. I-V Schools Std. I-VIII
Textbooks and midday meals (%)
Schools Std. I-V Schools Std. I-VIII
Pe
rce
nta
ge
of sc
ho
ols
80.576.3
0.0 0.00
20
40
60
80
100
Schools
where most
(75%) of
children in Std
5 have
textbooks
Midday meal
available
Schools
where most
(75%) of
children in Std
5 have
textbooks
Midday meal
available
Pupil-teacher ratio (PTR)
Media
n fig
ure
s
Schools Std. I-V Schools Std. I - VIII
47.3
37.5
0.0 0.00
10
20
30
40
50
PTR based onenrollment
PTR based onattendance on
day of visit
PTR based onenrollment
PTR based onattendance on
day of visit
Std.
I-IV/V
Std.
I - VIII
Total number of schools
visited 229 0
% teachers attending
(average) 72.5 0.0
% of schools with NO
teachers present17.0
% of schools with ALL
teachers present 53.7
Teachers' attendance
Schools with:
Std.
I-IV/V
Std.
I - VIII
Total number of schools
visited 231 0
% enrolled children
attending (average) 69.2 0.0
% of schools with less
than 50% of enrolled
children attending
13.9
Children's attendance
Schools with:
0
20
40
60
80
100
Water facility
and use
Toilet provision
and use
Water facility
and use
Toilet provision
and use
Pe
rce
nta
ge
of sch
oo
ls

Performance of all districts
WEST BENGAL RURAL
59ASER 2005
All
Children
% Out-of-
school
% CAN
read
level - 2
% CAN
solve
subtraction
Puruliya 14.3 46.8 81.6
Koch Bihar 11.0 74.6 85.7
Uttar Dinajpur 9.5 63.6 68.6
Maldah 7.7 41.3 73.9
Haora 7.4 54.0 83.4
Dakshin Dinajpur* 5.0 34.9 55.4
Hugli 4.2 42.9 69.6
District
Std III to V childrenAll
Children
% Out-of-
school
% CAN
read
level - 2
% CAN
solve
subtraction
Bankura 3.8 59.0 67.6
North 24 Paraganaa 2.9 49.7 88.7
South 24 Paraganaa 2.7 45.1 88.1
Medinipur 2.6 81.2 91.4
Barddhaman 1.5 64.0 89.3
Murshidabad 0.8 2.4 98.8
Birbhum 0.0 47.6 80.6
District
Std III to V children
West Bengal State
4.4 74.6 85.7

48%52%48%52%
Gender differences
Out-of-school children
Enrollment
All analyses based on data from 20 out of 22 districts
Age 11-14Age 6-10
JHARKHAND RURAL
Out-of-school children: Proportion of girls and boys.Percentage of boys and girls in government and private schools
Out-of-school children
60 ASER 2005
20+
15 - 20
10 - 15
5 - 10
3 - 5
0 - 3
No data
Percentage of children
Government Private Madarsa EGSNever
EnrolledDrop Out
Age : 6-14 ALL 71.9 10.8 1.4 6.1 6.4 3.4 100
Age : 6-10 ALL 73.6 10.1 1.2 7.3 6.1 1.7 100
Age : 11-14 ALL 69.2 12.1 1.5 3.5 6.9 6.8 100
Age : 6-10 BOYS 74.1 11.1 1.0 7.0 5.2 1.6 100
Age : 6-10 GIRLS 73.0 8.8 1.6 7.8 7.1 1.7 100
Age : 11-14 BOYS 71.3 12.6 0.8 3.3 4.8 7.1 100
Age : 11-14 GIRLS 66.6 11.4 2.5 3.7 9.5 6.5 100
Total
% Children in each age group in different
types of schools
% Children in each age
group not in school
0
20
40
60
80
100
Boys Girls Boys Girls
Govt school Pvt school
Children 6-14
RANCHI
Saraikela
Gumla
Lohardaga
Garhwa
Latehar
Hazaribag
Chatra
Bokaro
Dhanbad
GiridihDumkaDeogarh
GoddaPakur
Sahibganj
Kodarma
Palamau
East SinghbhumSindega
West Singhbhum
Jamtara

JHARKHAND RURAL
Performance of top five and bottom five districts in state based on % all children Std V
Comparison of government and private schools
based on % Std. V children who CAN read level-2
and solve written numerical sums
Reading Arithmetic
Children who CAN read and solve numerical written sums Learning curves
**Level - 2: Ability to read a 'story' text with some long sentences of std 2 level difficulty.
* Level - 1: Ability to read a small paragraph with short sentences of std 1 level difficulty.
Division: 3 digit divided by 1 digit.
Subtraction: 2 digit subtraction with borrowing.
Learning
% Children who CANNOT read ...% Children who CANNOT solve numerical
written sums of ...
61ASER 2005
Level 1* Level 2**Subtraction or
DivisionDivision
Age : 7-14 ALL 42.5 57.9 45.6 70.7
Age : 7-10 ALL 54.1 71.8 57.5 83.8
Age : 11-14 ALL 24.7 36.9 27.6 50.8
Govt : Std II-V 45.4 66.0 49.3 79.3
Pvt : Std II-V 23.1 40.2 29.7 60.0
Govt : Std VI-VIII 8.0 19.0 10.5 34.2
Pvt : Std VI-VIII 2.9 6.1 8.0 21.6
Std Nothing Letter Word Para-
Level I
Story-
Level IITotal
I 42.8 33.3 15.9 3.6 4.4 100
II 17.1 28.6 27.9 14.6 11.8 100
III 7.4 15.8 21.8 27.0 28.0 100
IV 4.1 8.1 12.8 21.2 53.8 100
V 2.7 4.8 6.8 18.6 67.1 100
VI 1.6 4.0 4.6 12.9 76.8 100
VII 1.6 2.0 1.5 9.4 85.6 100
VIII 0.5 2.2 2.0 5.2 90.1 100
Total 13.8 16.9 15.5 15.4 38.5 100
Std NothingNumber
recogn
Subtracti
onDivision Total
I 60.7 30.7 6.6 2.0 100
II 32.9 44.4 17.2 5.5 100
III 17.3 32.0 36.4 14.4 100
IV 11.4 18.2 37.0 33.5 100
V 7.9 12.2 32.4 47.6 100
VI 5.0 8.6 26.3 60.1 100
VII 3.7 4.8 22.8 68.7 100
VIII 1.1 4.6 14.2 80.2 100
Total 24.0 25.3 24.2 26.5 100
% All school children who can solve written
numerical sums - standardwise
Reading Arithmetic
Top - 5 Top - 5
Garhwa 37.8 Ranchi 25.2
Bokaro* 38.4 Lohardaga 25.3
Ranchi 42.5 JAMTARA 25.5
Kodarma* 43.2 Sahibganj 27.0
Giridih 44.2 Garhwa 27.5
Bottom - 5 Bottom - 5
DUMKA 77.5 DUMKA 52.5
Pakaur* 71.0 SINDEGA 49.5
PALAMU 69.0 Deoghar 47.1
Godda 63.0 PALAMU 41.5
Deoghar 61.8 Purbi Singhb 40.7
% std III to
V CANNOT
read level-2
% std III to
V CANNOT
solve
subtraction
65.1
84.7
45.8
62.6
0
10
20
30
40
50
60
70
80
90
Govt Pvt Govt Pvt
Std. V level-2 Reading Std. V can solve Division
% All school children who can read-standardwise

Teachers, children, and classrooms
Provision and use
JHARKHAND RURAL
62 ASER 2005
Average number of rooms available
Type of
school by
enrollment
%
Schools
visited
Std
I-V
rooms
Type of
school by
enrollment
%
Schools
visited
Std
I-VIII
rooms
<=50 8 1.3 <=150 8 3.8
51-75 15 2.3 151-250 21 6.1
76-150 40 2.6 251-350 21 6.4
151-225 24 3.3 351-450 15 6.6
>225 13 3.6 >450 35 8.7
% of schools with no water/toilet provision
% of schools with water/toilet provision but not useable
% of schools with water/toilet provision and useable
Water & toilet provision and use (%)
Schools Std. I-V Schools Std. I-VIII
Textbooks and midday meals (%)
Schools Std. I-V Schools Std. I-VIII
Pe
rce
nta
ge
of sc
ho
ols
35.1
61.8
44.7
75.8
0
20
40
60
80
100
Schools
where most
(75%) of
children in Std
5 have
textbooks
Midday meal
available
Schools
where most
(75%) of
children in Std
5 have
textbooks
Midday meal
available
Pupil-teacher ratio (PTR)
Media
n fig
ure
s
Schools Std. I-V Schools Std. I - VIII
46.4
34.0
45.355.9
0
10
20
30
40
50
PTR based onenrollment
PTR based onattendance on
day of visit
PTR based onenrollment
PTR based onattendance on
day of visit
Std.
I-IV/V
Std.
I - VIII
Total number of schools
visited 196 151
% teachers attending
(average) 74.3 71.0
% of schools with NO
teachers present8.7 5.3
% of schools with ALL
teachers present 49.5 28.5
Teachers' attendance
Schools with:
Std.
I-IV/V
Std.
I - VIII
Total number of schools
visited 200 149
% enrolled children
attending (average) 58.4 58.5
Children's attendance
Schools with:
% of schools with less
than 50% of enrolled
children attending
29.5 31.5
0
20
40
60
80
100
Water facility
and use
Toilet provision
and use
Water facility
and use
Toilet provision
and use
Pe
rce
nta
ge
of sch
oo
ls
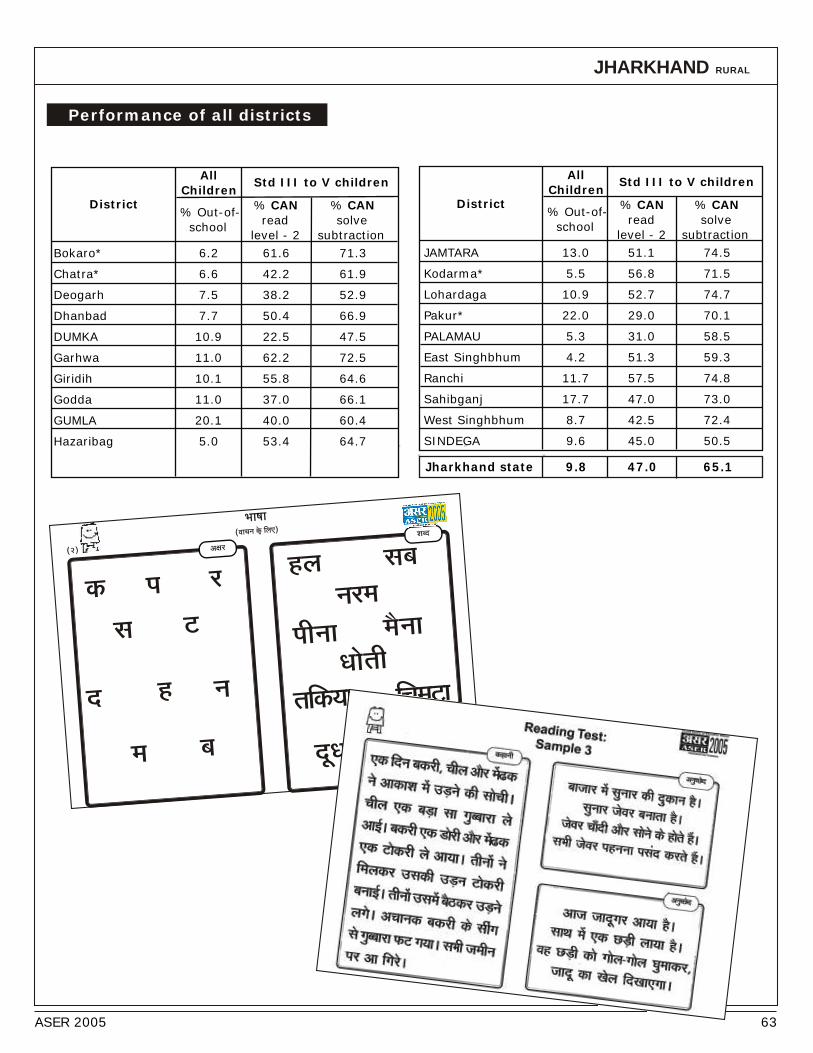
Performance of all districts
JHARKHAND RURAL
63ASER 2005
All
Children
% Out-of-
school
% CAN
read
level - 2
% CAN
solve
subtraction
Bokaro* 6.2 61.6 71.3
Chatra* 6.6 42.2 61.9
Deogarh 7.5 38.2 52.9
Dhanbad 7.7 50.4 66.9
DUMKA 10.9 22.5 47.5
Garhwa 11.0 62.2 72.5
Giridih 10.1 55.8 64.6
Godda 11.0 37.0 66.1
GUMLA 20.1 40.0 60.4
Hazaribag 5.0 53.4 64.7
District
Std III to V childrenAll
Children
% Out-of-
school
% CAN
read
level - 2
% CAN
solve
subtraction
JAMTARA 13.0 51.1 74.5
Kodarma* 5.5 56.8 71.5
Lohardaga 10.9 52.7 74.7
Pakur* 22.0 29.0 70.1
PALAMAU 5.3 31.0 58.5
East Singhbhum 4.2 51.3 59.3
Ranchi 11.7 57.5 74.8
Sahibganj 17.7 47.0 73.0
West Singhbhum 8.7 42.5 72.4
SINDEGA 9.6 45.0 50.5
District
Std III to V children
Jharkhand state 9.8 47.0 65.1


Gujarat
Daman and Diu
Dadra Nagar Haveli
Madhya Pradesh
Chhattisgarh
Orissa
Note : Daman and Diu, Dadra Nagar Haveli do not have school tables as the numbers of observations was too small.

41%
59%
42%
58%
Gender differences
Out-of-school children
Enrollment
All analyses based on data from 25 out of 26 districts
Age 11-14Age 6-10
GUJARAT RURAL
Out-of-school children: Proportion of girls and boys.Percentage of boys and girls in government and private schools
66 ASER 2005
20+
15 - 20
10 - 15
5 - 10
3 - 5
0 - 3
No data
Percentage of children
Government Private Madarsa EGSNever
EnrolledDrop Out
Age : 6-14 ALL 87.8 7.4 0.6 0.6 1.3 2.3 100
Age : 6-10 ALL 90.1 6.7 0.6 0.5 1.2 0.9 100
Age : 11-14 ALL 84.8 8.6 0.5 0.7 1.2 4.3 100
Age : 6-10 BOYS 89.6 7.6 0.6 0.5 0.9 0.8 100
Age : 6-10 GIRLS 90.6 5.7 0.6 0.4 1.6 1.2 100
Age : 11-14 BOYS 85.9 9.1 0.5 0.6 0.7 3.2 100
Age : 11-14 GIRLS 83.3 7.9 0.5 0.7 1.8 5.7 100
Total
% Children in each age group in different
types of schools
% Children in each age
group not in school
0
20
40
60
80
100
Boys Girls Boys Girls
Govt school Pvt school
Children 6-14
Patan
Mehsana
Jamnagar
Rajkot
Porbander
JunagadhAmreli
Bhavnagar
Ahmedabad
Kheda
Anand
Vadodara
Bharuch
Surat
Navsari
Narmada
Panch Mahals
Sabar Kantha
Banas Kantha
Kachchh
Rann of Kachchh
Dahod
The Dangs
Valsad
Surendranagar
GANDHINAGAR

GUJARAT RURAL
Performance of top five and bottom five districts in state based on % all children Std V
Comparison of government and private schools
based on % Std. V children who CAN read level-2
and solve written numerical sums
Reading Arithmetic
Children who CAN read and solve numerical written sums Learning curves
**Level - 2: Ability to read a 'story' text with some long sentences of std 2 level difficulty.
* Level - 1: Ability to read a small paragraph with short sentences of std 1 level difficulty.
Division: 3 digit divided by 1 digit.
Subtraction: 2 digit subtraction with borrowing.
Learning
% Children who CANNOT read ...% Children who CANNOT solve numerical
written sums of ...
67ASER 2005
Level 1* Level 2**Subtraction or
DivisionDivision
Age : 7-14 ALL 34.2 53.7 39.9 62.7
Age : 7-10 ALL 47.5 68.9 52.8 73.7
Age : 11-14 ALL 15.8 32.8 22.8 48.1
Govt : Std II-V 46.7 67.7 53.8 75.6
Pvt : Std II-V 32.8 60.1 21.2 47.9
Govt : Std VI-VIII 11.3 27.9 19.4 46.2
Pvt : Std VI-VIII 17.7 33.8 12.8 30.0
Std Nothing Letter Word Para-
Level I
Story-
Level IITotal
I 35.3 37.4 14.0 5.4 7.9 100
II 12.6 29.9 34.1 10.8 12.6 100
III 6.9 17.1 32.6 19.3 24.2 100
IV 4.3 8.1 22.3 26.5 38.8 100
V 2.8 4.0 14.8 26.8 51.7 100
VI 2.0 4.2 9.1 19.2 65.5 100
VII 1.1 1.6 6.2 15.0 76.2 100
VIII 1.0 1.7 4.6 10.3 82.4 100
Total 7.2 12.4 18.9 18.6 42.9 100
Std NothingNumber
recogn
Subtracti
onDivision Total
I 56.0 31.1 6.7 6.2 100
II 34.3 45.6 11.1 9.0 100
III 20.1 42.8 19.5 17.6 100
IV 12.5 28.4 26.5 32.6 100
V 6.5 21.9 29.0 42.6 100
VI 5.8 16.3 28.6 49.3 100
VII 4.1 11.6 24.9 59.5 100
VIII 2.7 12.1 17.0 68.2 100
Total 16.2 27.3 22.2 34.3 100
% All school children who can solve written
numerical sums - standardwise
Reading Arithmetic
Top - 5 Top - 5
Banas Kantha 37.9 Patan* 1.1
Bhavnagar 41.8 Surat 4.4
Valsad 42.1 The Dangs 13.4
Gandhinagar 44.9 Mahesana 20.7
Surendranagar 50.6 Valsad 24.8
Bottom - 5 Bottom - 5
Porbandar* 92.3 Ahmedabad 70.1
Patan* 78.5 Mahesana 64.5
Surat 77.7 Amreli 63.8
Junagadh 77.0 Porbandar* 61.5
Sabar Kantha 76.1 Sabar Kantha 57.4
% std III to
V CANNOT
read level-2
% std III to
V CANNOT
solve
subtraction
51.947.5
40.1
66.9
0
10
20
30
40
50
60
70
80
Govt Pvt Govt Pvt
Std. V level-2 Reading Std. V can solve Division
% All school children who can read-standardwise
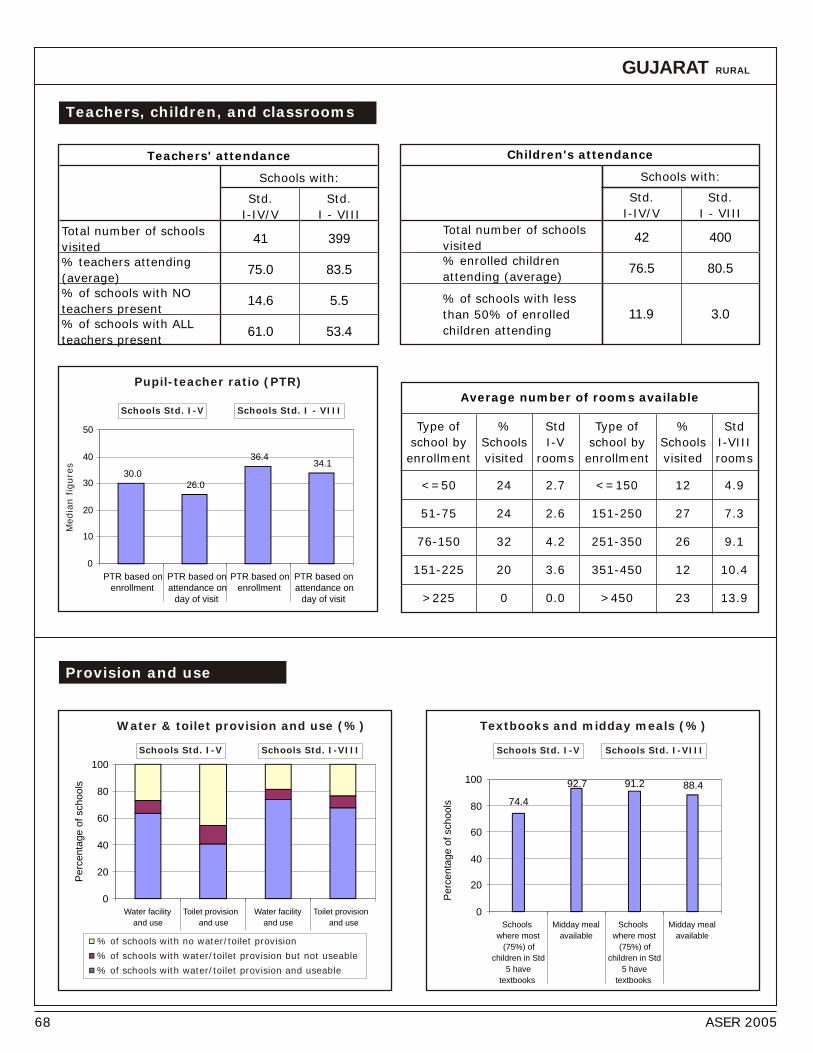
Teachers, children, and classrooms
Provision and use
GUJARAT RURAL
68 ASER 2005
Type of
school by
enrollment
%
Schools
visited
Std
I-V
rooms
Type of
school by
enrollment
%
Schools
visited
Std
I-VIII
rooms
<=50 24 2.7 <=150 12 4.9
51-75 24 2.6 151-250 27 7.3
76-150 32 4.2 251-350 26 9.1
151-225 20 3.6 351-450 12 10.4
>225 0 0.0 >450 23 13.9
Average number of rooms available
Pupil-teacher ratio (PTR)
Media
n fig
ure
s
Schools Std. I-V Schools Std. I - VIII
30.026.0
36.434.1
0
10
20
30
40
50
PTR based onenrollment
PTR based onattendance on
day of visit
PTR based onenrollment
PTR based onattendance on
day of visit
Std.
I-IV/V
Std.
I - VIII
Total number of schools
visited 41 399
% teachers attending
(average) 75.0 83.5
% of schools with NO
teachers present14.6 5.5
% of schools with ALL
teachers present 61.0 53.4
Teachers' attendance
Schools with:
Std.
I-IV/V
Std.
I - VIII
Total number of schools
visited 42 400
% enrolled children
attending (average) 76.5 80.5
Children's attendance
Schools with:
% of schools with less
than 50% of enrolled
children attending
11.9 3.0
% of schools with no water/toilet provision
% of schools with water/toilet provision but not useable
% of schools with water/toilet provision and useable
Water & toilet provision and use (%)
Schools Std. I-V Schools Std. I-VIII
0
20
40
60
80
100
Water facility
and use
Toilet provision
and use
Water facility
and use
Toilet provision
and use
Pe
rce
nta
ge
of sch
oo
ls
Textbooks and midday meals (%)
Schools Std. I-V Schools Std. I-VIII
Pe
rce
nta
ge
of sc
ho
ols 74.4
92.7 91.2 88.4
0
20
40
60
80
100
Schools
where most
(75%) of
children in Std
5 have
textbooks
Midday meal
available
Schools
where most
(75%) of
children in Std
5 have
textbooks
Midday meal
available

Performance of all districts
GUJARAT RURAL
All Children
% Out-of-school
% CAN read
level - 2
% CAN solve
subtraction
Ahmedabad 7.1 37.4 29.9
Amreli 2.2 36.7 36.2
Anand* 1.4 49.1 49.4
Banas Kantha 3.2 62.1 53.1
Bharuch 4.3 48.1 59.9
Bhavnagar 5.1 58.2 61.4
Dohad* 0.2 38.9 55.2
Gandhinagar 2.5 55.1 65.3
The Dangs 11.0 31.5 86.6
Jamnagar 4.9 31.7 43.5
Junagadh 0.0 23.0 50.0
Kachchh 9.8 37.1 43.6
Kheda 2.2 34.4 35.5
District
Std III to V childrenAll
Children
% Out-of-
school
% CAN
read
level - 2
% CAN
solve
subtraction
Mahesana 3.5 42.4 79.3
Narmada* 1.1 28.2 61.3
Navsari* 0.9 39.6 58.6
Panch Mahals 2.9 45.2 61.8
Patan* 1.2 21.5 98.9
Porbander* 2.0 7.7 38.5
Rajkot 2.2 34.7 45.0
Sabar Kantha 2.6 23.9 42.6
Surat 1.9 22.3 95.6
Surendranagar 5.1 49.4 73.1
Vadodara 5.6 27.4 48.5
Valsad 8.4 57.9 75.2
District
Std III to V children
Gujrath state 3.6 38.5 56.4
69ASER 2005

45%
55%50%50%
Government Private Madarsa EGSNever
EnrolledDrop Out
Age : 6-14 ALL 81.4 16.9 0.0 0.0 1.0 0.7 100
Age : 6-10 ALL 80.2 19.5 0.0 0.1 0.2 0.0 100
Age : 11-14 ALL 84.1 13.2 0.0 0.0 0.9 1.7 100
Age : 6-10 BOYS 79.9 19.9 0.0 0.0 0.2 0.0 100
Age : 6-10 GIRLS 80.6 19.0 0.0 0.1 0.2 0.0 100
Age : 11-14 BOYS 82.5 15.6 0.0 0.0 0.7 1.1 100
Age : 11-14 GIRLS 87.0 8.9 0.0 0.0 1.3 2.8 100
Total
% Children in each age
group not in school
Age 11-14Age 6-10
DAMAN & DIU RURAL
Out-of-school children: Proportion of girls and boys.Percentage of boys and girls in government and private schools
Gender differences
Out-of-school children
Enrollment
70 ASER 2005
20+
15 - 20
10 - 15
5 - 10
3 - 5
0 - 3
No data
Percentage of children
% Children in each age group in different
types of schools
0
20
40
60
80
100
Boys Girls Boys Girls
Govt school Pvt school
Children 6-14

% Children who CANNOT read ...% Children who CANNOT solve numerical
written sums of ...
Level 1* Level 2**Subtraction or
Division
Age : 7-14 ALL 36.3 63.7 34.9 66.3
Age : 7-10 ALL 51.9 82.0 47.0 84.6
Age : 11-14 ALL 14.1 37.4 17.8 40.4
Govt : Std II-V 49.3 80.3 47.0 84.4
Pvt : Std II-V 55.2 87.2 41.1 79.4
Govt : Std VI-VIII 9.8 33.2 17.6 38.8
Pvt : Std VI-VIII 16.7 53.4 15.8 45.8
DAMAN & DIU RURAL
Comparison of government and private schools
based on % Std. V children who CAN read level-2
and solve written numerical sums
Reading Arithmetic
Performance
Children who CAN read and solve numerical written sums Learning curves
**Level - 2: Ability to read a 'story' text with some long sentences of std 2 level difficulty.
* Level - 1: Ability to read a small paragraph with short sentences of std 1 level difficulty.
Division: 3 digit divided by 1 digit.
Subtraction: 2 digit subtraction with borrowing.
Learning
71
Std Nothing Letter Word Para-
Level I
Story-
Level IITotal
I 26.4 49.1 15.8 5.3 3.3 100
II 11.7 36.7 26.6 16.8 8.3 100
III 3.4 25.3 44.2 18.7 8.4 100
IV 1.6 5.7 34.2 44.9 13.6 100
V 1.4 6.0 14.7 40.4 37.6 100
VI 1.0 3.0 10.7 29.5 55.8 100
VII 2.3 2.9 4.1 25.9 64.8 100
VIII 0.8 2.1 5.1 19.1 72.9 100
Total 6.1 16.6 20.4 25.8 31.1 100
Std NothingNumber
recogn
Subtracti
onDivision Total
I 42.8 38.2 10.0 9.0 100
II 33.0 40.1 15.0 12.0 100
III 19.9 43.7 30.9 5.6 100
IV 10.2 22.0 59.2 8.6 100
V 5.7 18.4 40.5 35.4 100
VI 2.4 16.9 36.6 44.2 100
VII 4.8 10.1 15.1 69.9 100
VIII 3.7 14.8 15.6 65.9 100
Total 15.5 25.9 29.1 29.6 100
% All school children who can solve written
numerical sums - standardwise
All
Children
% Out-of-
school
% CAN
read
level - 2
% CAN solve
division and
subtraction
Diu 4.38 49.0 12.6
Daman 0.72 34.1 41.9
Std V children
38.8
33.331.4
50.0
0
10
20
30
40
50
60
Govt Pvt Govt Pvt
Std. V level-2 Reading Std. V can solve Division
ASER 2005
% All school children who can read-standardwise

0%
100%
0%
100%
Age 11-14Age 6-10
DADRA NAGAR HAVELI RURAL
Out-of-school children: Proportion of girls and boys.Percentage of boys and girls in government and private schools
Gender differences
Out-of-school children
Enrollment
72 ASER 2005
20+
15 - 20
10 - 15
5 - 10
3 - 5
0 - 3
No data
Percentage of children
Government Private Madarsa EGSNever
EnrolledDrop Out
Age : 6-14 ALL 97.2 2.1 0.0 0.1 0.4 0.2 100
Age : 6-10 ALL 96.6 2.9 0.0 0.0 0.4 0.2 100
Age : 11-14 ALL 98.5 0.9 0.0 0.3 0.0 0.3 100
Age : 6-10 BOYS 95.6 4.4 0.0 0.0 0.0 0.0 100
Age : 6-10 GIRLS 97.7 1.2 0.0 0.0 0.8 0.4 100
Age : 11-14 BOYS 99.0 1.0 0.0 0.0 0.0 0.0 100
Age : 11-14 GIRLS 97.8 0.7 0.0 0.7 0.0 0.7 100
Total
% Children in each age
group not in school
% Children in each age group in different
types of schools
0
20
40
60
80
100
Boys Girls Boys Girls
Govt school Pvt school
Children 6-14

Level 1* Level 2**Subtraction or
DivisionDivision
Age : 7-14 ALL 41.2 64.5 50.3 75.4
Age : 7-10 ALL 67.5 88.1 76.0 95.2
Age : 11-14 ALL 6.4 33.3 16.4 49.1
Govt : Std II-V 60.6 86.7 71.8 94.3
Pvt : Std II-V 50.0 50.0 30.0 60.0
Govt : Std VI-VIII 1.6 23.4 10.1 43.2
Pvt : Std VI-VIII 66.7 66.7 0.0 33.3
Comparison of government and private schools
based on % Std. V children who CAN read level-2
and solve written numerical sums
**Level - 2: Ability to read a 'story' text with some long sentences of std 2 level difficulty.
* Level - 1: Ability to read a small paragraph with short sentences of std 1 level difficulty.
Division: 3 digit divided by 1 digit.
Subtraction: 2 digit subtraction with borrowing.
level - 2
Dadra & Nagar state 0.6 35.0 19.533.6
100.0
17.7
100.0
0
20
40
60
80
100
120
Govt Pvt Govt Pvt
Std. V level-2 Reading Std. V can solve Division
DADRA NAGAR HAVELI RURAL
Learning
% Children who CANNOT read ...% Children who CANNOT solve numerical
written sums of ...
Children who CAN read and solve numerical written sums Learning curves
Reading Arithmetic
Performance
Children
% Out-of-
school
CAN solve
division and
subtraction
Std V children
ASER 2005
All
CAN % %
read
% All school children who can solve written
numerical sums - standardwise
Std NothingNumber Subtracti
Division Total recogn on
I 64.0 32.0
II 23.0 56.0
III 2.4 28.6 50.8
IV 0.0 10.2 38.7
V 0.0 4.1
VI 0.0 0.9
VII 0.0 0.0
VIII 0.0 0.0
Total 10.8 17.2
0.0 0.0 100
19.0 1.0 1.0 100
14.3 4.0 100
37.2 13.9 100
16.3 44.7 35.0 100
3.7 21.5 73.8 100
0.9 25.6 73.5 100
0.0 3.7 96.3 100
19.7 21.4 31.0 100
I 75.8 23.2 1.0 0.0
II 48.0 51.0 1.0 0.0
III 18.3 68.3 12.7 0.8
IV 6.6 59.9 29.2 4.4
V 3.3 33.3 43.9 19.5
VI 0.0 11.2 37.4 51.4
VII 1.7 9.4 34.2 54.7
VIII 0.0 0.0 11.1 88.9
Total 19.3 36.6 23.3 20.8
100
100
100
100
100
100
100
100
100
73
% All school children who can read-standardwise
Std Nothing Letter Word Para-
Level I
Story-
Level IITotal
4.0

46%54%
48%52%
All analyses based on data from 40 out of 45 districts
Age 11-14Age 6-10
MADHYA PRADESH RURAL
Out-of-school children: Proportion of girls and boys.Percentage of boys and girls in government and private schools
Gender differences
Out-of-school children
Enrollment
20+
15 - 20
10 - 15
5 - 10
3 - 5
0 - 3
No data
Percentage of children
74 ASER 2005
Government Private Madarsa EGSNever
EnrolledDrop Out
Age : 6-14 ALL 83.5 8.5 0.2 3.8 1.2 2.8 100
Age : 6-10 ALL 83.4 9.2 0.3 5.0 1.2 0.9 100
Age : 11-14 ALL 83.9 7.4 0.2 1.7 1.2 5.6 100
Age : 6-10 BOYS 82.2 10.6 0.2 5.1 1.0 0.9 100
Age : 6-10 GIRLS 84.9 7.4 0.4 4.7 1.5 1.0 100
Age : 11-14 BOYS 83.9 8.8 0.2 1.5 1.0 4.6 100
Age : 11-14 GIRLS 83.9 5.6 0.1 2.0 1.5 7.0 100
Total
% Children in each age group in different
types of schools
% Children in each age
group not in school
0
20
40
60
80
100
Boys Girls Boys Girls
Govt school Pvt school
Children 6-14
BHOPAL
BhindMorena
Gwalior
Sheopur
Shivpuri
Datia
Neemach
Barwani
Jhabua
DharIndore
Mandsaur
RatlamUjjain
Shajapur
Dewas
Rajgarh
Sehore
Vidisha
Raisen
Guna
Tikamgarh
Sagar
Damoh
Katni
Jabalpur
Narsimhapur
Mandla
Hoshangabad
Harda
Betul
ChhindwaraSeoni
Balaghat
Panna
ChhatarpurSatna
Rewa
Sidhi
East Nimar
Dindori
Umaria
Shahdol
West Nimar

Std Nothing Letter Word Para-
Level I
Story-
Level IITotal
I 57.1 20.9 9.4 4.8 7.8 100
II 27.2 30.7 23.1 7.4 11.7 100
III 11.4 25.1 25.4 23.1 15.1 100
IV 4.6 14.3 21.4 30.8 28.9 100
V 2.4 5.9 13.4 26.3 52.0 100
VI 1.8 4.0 9.1 19.4 65.7 100
VII 1.5 2.2 5.4 12.0 78.9 100
VIII 0.8 1.2 3.0 6.8 88.2 100
Total 15.7 15.3 15.5 17.1 36.5 100
MADHYA PRADESH RURAL
Performance of top five and bottom five districts in state based on % all children Std V
Comparison of government and private schools
based on % Std. V children who CAN read level-2
and solve written numerical sums
Reading Arithmetic
Children who CAN read and solve numerical written sums Learning curves
**Level - 2: Ability to read a 'story' text with some long sentences of std 2 level difficulty.
* Level - 1: Ability to read a small paragraph with short sentences of std 1 level difficulty.
Division: 3 digit divided by 1 digit.
Subtraction: 2 digit subtraction with borrowing.
Learning
% Children who CANNOT read ...% Children who CANNOT solve numerical
written sums of ...
75ASER 2005
Level 1* Level 2**Subtraction or
DivisionDivision
Age : 7-14 ALL 37.6 55.3 41.8 66.4
Age : 7-10 ALL 54.4 73.8 58.8 83.1
Age : 11-14 ALL 16.5 32.2 20.4 45.5
Govt : Std II-V 52.9 74.0 55.0 82.4
Pvt : Std II-V 36.5 59.1 41.0 71.3
Govt : Std VI-VIII 10.6 24.2 14.5 38.0
Pvt : Std VI-VIII 3.6 10.9 9.2 24.0
Std NothingNumber
recogn
Subtracti
onDivision Total
I 64.3 26.5 4.7 4.5 100
II 36.4 47.5 9.5 6.7 100
III 15.7 45.7 30.1 8.5 100
IV 9.3 32.4 37.2 21.2 100
V 5.4 20.7 35.9 38.0 100
VI 4.6 14.4 28.9 52.1 100
VII 3.3 10.4 21.3 65.0 100
VIII 1.9 6.7 17.1 74.3 100
Total 20.5 28.8 23.2 27.5 100
% All school children who can solve written
numerical sums - standardwise
Reading Arithmetic
Top - 5 Top - 5
West Nimar 0.0 Indore 0.0
Indore 0.0 Ratlam 6.2
Harda* 3.6 Dhar 8.4
Neemuch* 15.3 Ujjain 12.1
Shajapur 18.7 Sehore 14.2
Bottom - 5 Bottom - 5
Sheopur* 98.4 Rajgarh 78.7
Tikamgarh 91.4 Umaria* 77.3
Mandla 90.8 Guna 77.2
Guna 85.7 Jhabua 72.5
Rajgarh 82.7 Bhopal 72.2
% std III to
V CANNOT
read level-2
% std III to
V CANNOT
solve
subtraction
50.1
74.4
36.0
55.8
0
10
20
30
40
50
60
70
80
Govt Pvt Govt Pvt
Std. V level-2 Reading Std. V can solve Division
% All school children who can read-standardwise

Teachers, children, and classrooms
Provision and use
MADHYA PRADESH RURAL
76 ASER 2005
Average number of rooms available
Type of
school by
enrollment
%
Schools
visited
Std
I-V
rooms
Type of
school by
enrollment
%
Schools
visited
Std
I-VIII
rooms
<=50 9 2.7 <=150 14 4.1
51-75 14 2.6 151-250 31 5.2
76-150 46 3.4 251-350 31 5.3
151-225 23 3.9 351-450 16 5.8
>225 8 4.0 >450 8 7.0
% of schools with no water/toilet provision
% of schools with water/toilet provision but not useable
% of schools with water/toilet provision and useable
Water & toilet provision and use (%)
Schools Std. I-V Schools Std. I-VIII
Textbooks and midday meals (%)
Schools Std. I-V Schools Std. I-VIII
Pe
rce
nta
ge
of sc
ho
ols
91.2
74.8
96.9
82.6
0
20
40
60
80
100
Schools
where most
(75%) of
children in Std
5 have
textbooks
Midday meal
available
Schools
where most
(75%) of
children in Std
5 have
textbooks
Midday meal
available
Pupil-teacher ratio (PTR)
Media
n fig
ure
s
Schools Std. I-V Schools Std. I - VIII
42.2
33.0
48.2
40.8
0
10
20
30
40
50
PTR based onenrollment
PTR based onattendance on
day of visit
PTR based onenrollment
PTR based onattendance on
day of visit
Std.
I-IV/V
Std.
I - VIII
Total number of schools
visited 474 194
% teachers attending
(average) 75.9 69.3
% of schools with NO
teachers present10.8 11.3
% of schools with ALL
teachers present 58.2 38.1
Teachers' attendance
Schools with:
Std.
I-IV/V
Std.
I - VIII
Total number of schools
visited 477 194
% enrolled children
attending (average) 66.2 67.8
Children's attendance
Schools with:
% of schools with less
than 50% of enrolled
children attending
16.4 12.9
0
20
40
60
80
100
Water facility
and use
Toilet provision
and use
Water facility
and use
Toilet provision
and use
Pe
rce
nta
ge
of sch
oo
ls

Performance of all districts
MADHYA PRADESH RURAL
All Children
% Out-of-
school
% CAN
read
level - 2
% CAN
solve
subtraction
Barwani* 13.2 50.0 50.0
Bhind 1.4 31.2 48.4
Bhopal 4.9 20.8 27.8
Chhatarpur 2.0 24.4 33.7
Chhindwara 2.0 33.5 71.8
Damoh 4.2 30.1 28.4
Datia 3.2 21.7 55.9
Dewas 1.5 75.9 64.0
Dhar 1.8 42.9 91.6
Dindori* 11.9 24.3 50.0
East Nimar 11.7 29.4 78.9
Guna 7.8 14.3 22.8
Gwalior 4.8 25.9 46.0
Harda* 3.8 96.4 80.2
Hoshangabad 2.1 37.7 63.3
Indore 2.0 100.0 100.0
Jabalpur 5.6 32.9 52.6
Jhabua 0.0 25.8 27.5
Katni* 6.2 49.7 53.0
Mandla 1.2 9.2 40.9
District
Std III to V childrenAll
Children
% Out-of-
school
% CAN
read
level - 2
% CAN
solve
subtraction
Morena 4.2 37.0 30.8
Narsimhapur 4.8 22.0 60.5
Neemach* 7.0 84.7 84.8
Panna 9.0 22.1 48.8
Raisen 1.6 45.7 62.8
Rajgarh 3.6 17.3 21.3
Ratlam 4.0 56.3 93.8
Rewa 1.6 20.3 31.6
Sagar 2.6 19.5 61.2
Satna 1.5 31.4 62.1
Sehore 2.7 48.4 85.8
Seoni 3.3 20.4 63.6
Shahdol 6.5
Shajapur 3.1 81.3 79.9
Sheopur* 4.5 1.6 42.9
Shivpuri 4.9 19.0 36.5
Tikamgarh 0.6 8.6 41.3
Ujjain 2.1 77.3 87.9
Umaria* 0.0 74.1 22.7
West Nimar 2.5 100.0 67.6
District
Std III to V children
Madhya Pradesh state
4.0 32.4 57.1
77ASER 2005

45%
55%53%47%
Gender differences
Out-of-school children
Enrollment
All analyses based on data from 15 out of 16 districts
Age 11-14Age 6-10
CHHATTISGARH RURAL
Out-of-school children: Proportion of girls and boys.Percentage of boys and girls in government and private schools
78 ASER 2005
20+
15 - 20
10 - 15
5 - 10
3 - 5
0 - 3
No data
Percentage of children
Government Private Madarsa EGSNever
EnrolledDrop Out
Age : 6-14 ALL 90.9 4.4 0.0 0.1 1.2 3.5 100
Age : 6-10 ALL 93.2 4.1 0.0 0.1 1.1 1.5 100
Age : 11-14 ALL 87.3 4.8 0.0 0.0 1.4 6.5 100
Age : 6-10 BOYS 92.9 4.3 0.0 0.2 1.1 1.5 100
Age : 6-10 GIRLS 93.4 4.0 0.0 0.1 1.1 1.6 100
Age : 11-14 BOYS 88.6 5.0 0.0 0.0 1.1 5.4 100
Age : 11-14 GIRLS 85.7 4.6 0.0 0.0 1.9 7.8 100
% Children in each age group in different
types of schools
% Children in each age
group not in schoolTotal
0
20
40
60
80
100
Boys Girls Boys Girls
Govt school Pvt school
Children 6-14
RAIPUR
Dantewada
Kanker
Dhamtari
Raj Nandgaon
Durg
Mahasumund
Bilaspur
Janjgir
Raigarh
SurgujaKoriya
Jashpur
Korba
Kawardha
Bastar

Performance of top five and bottom five districts in state based on % all children Std V
Comparison of government and private schools
based on % Std. V children who CAN read level-2
and solve written numerical sums
Reading Arithmetic
Children who CAN read and solve numerical written sums Learning curves
**Level - 2: Ability to read a 'story' text with some long sentences of std 2 level difficulty.
* Level - 1: Ability to read a small paragraph with short sentences of std 1 level difficulty.
Division: 3 digit divided by 1 digit.
Subtraction: 2 digit subtraction with borrowing.
Learning
% Children who CANNOT read ...% Children who CANNOT solve numerical
written sums of ...
79ASER 2005
Level 1* Level 2**Subtraction or
DivisionDivision
Age : 7-14 ALL 30.8 45.9 35.0 60.8
Age : 7-10 ALL 47.0 64.9 51.4 79.5
Age : 11-14 ALL 9.9 21.4 13.9 36.8
Govt : Std II-V 36.6 56.7 41.2 70.8
Pvt : Std II-V 29.3 50.4 38.0 65.3
Govt : Std VI-VIII 4.8 14.1 8.1 28.5
Pvt : Std VI-VIII 1.4 3.7 6.5 28.1
Std Nothing Letter Word Para-
Level I
Story-
Level IITotal
I 33.3 46.3 11.6 4.3 4.4 100
II 9.2 35.4 36.3 8.0 11.0 100
III 2.7 16.0 28.7 25.9 26.7 100
IV 1.1 5.3 11.8 30.8 51.1 100
V 0.8 2.2 6.6 14.8 75.6 100
VI 1.0 1.4 3.3 10.9 83.4 100
VII 0.7 1.4 2.8 11.3 83.8 100
VIII 0.6 0.3 1.4 2.9 94.9 100
Total 7.3 16.0 15.0 15.5 46.4 100
Std NothingNumber
recogn
Subtracti
onDivision Total
I 51.6 43.9 2.6 2.0 100
II 25.2 59.0 11.1 4.7 100
III 11.8 37.7 39.5 11.0 100
IV 4.0 20.6 39.1 36.4 100
V 2.5 12.6 26.2 58.7 100
VI 1.4 8.7 19.6 70.3 100
VII 1.9 6.6 25.0 66.5 100
VIII 1.6 2.4 15.9 80.1 100
Total 14.8 28.0 23.5 33.8 100
% All school children who can solve written
numerical sums - standardwise
Reading Arithmetic
Top - 5 Top - 5
Bastar 0.4 Bastar 0.8
Durg 6.7 Dhamtari* 2.8
Bilaspur 21.5 Mahasamund 9.2
Raigarh 33.3 Dantewada 10.6
Dantewada 42.2 Kanker* 10.9
Bottom - 5 Bottom - 5
Janjgir 87.0 Janjgir 75.1
Rajnandgaon 74.6 Jashpur* 54.2
Mahasamund 71.5 Korba* 52.8
Kawardha* 57.3 Kawardha* 48.4
Raipur 53.8 Raipur 36.7
% std III to
V CANNOT
solve
subtraction
% std III to
V CANNOT
read level-2
CHHATTISGARH RURAL
75.380.4
58.0
71.9
0
10
20
30
40
50
60
70
80
90
Govt Pvt Govt Pvt
Std. V level-2 Reading Std. V can solve Division
% All school children who can read-standardwise

Type of
school by
enrollment
%
Schools
visited
Std
I-V
rooms
Type of
school by
enrollment
%
Schools
visited
Std
I-VIII
rooms
<=50 12 3.4 <=150 21 3.0
51-75 19 3.0 151-250 36 3.2
76-150 43 3.7 251-350 26 4.4
151-225 16 3.4 351-450 12 3.2
>225 10 4.3 >450 5 8.0
Average number of rooms available
Teachers, children, and classrooms
Provision and use
80 ASER 2005
% of schools with no water/toilet provision
% of schools with water/toilet provision but not useable
% of schools with water/toilet provision and useable
Water & toilet provision and use (%)
Schools Std. I-V Schools Std. I-VIII
Textbooks and midday meals (%)
Schools Std. I-V Schools Std. I-VIII
Pe
rce
nta
ge
of sc
ho
ols
96.9 94.8100.0 97.6
0
20
40
60
80
100
Schools
where most
(75%) of
children in Std
5 have
textbooks
Midday meal
available
Schools
where most
(75%) of
children in Std
5 have
textbooks
Midday meal
available
Pupil-teacher ratio (PTR)
Media
n fig
ure
s
Schools Std. I-V Schools Std. I - VIII
39.9
30.2
50.242.8
0
10
20
30
40
50
PTR based onenrollment
PTR based onattendance on
day of visit
PTR based onenrollment
PTR based onattendance on
day of visit
Std.
I-IV/V
Std.
I - VIII
Total number of schools
visited 228 45
% teachers attending
(average) 80.3 84.9
% of schools with NO
teachers present8.3 4.4
% of schools with ALL
teachers present 64.9 64.4
Teachers' attendance
Schools with:
Std.
I-IV/V
Std.
I - VIII
Total number of schools
visited 229 45
% enrolled children
attending (average) 71.4 74.5
% of schools with less
than 50% of enrolled
children attending
11.4 6.7
Children's attendance
Schools with:
CHHATTISGARH RURAL
0
20
40
60
80
100
Water facility
and use
Toilet provision
and use
Water facility
and use
Toilet provision
and use
Pe
rce
nta
ge
of sch
oo
ls

81ASER 2005
CHHATTISGARH RURAL
All Children
% Out-of-school
% CAN read
level - 2
% CAN solve
subtraction
Bastar 0.3 99.6 99.2
Bilaspur 2.3 78.5 84.1
Dantewada 5.7 57.8 89.4
Dhamtari* 1.8 50.9 97.2
Durg 5.0 93.3 88.6
Janjgir 1.1 13.0 24.9
Jashpur* 6.7 46.8 45.8
Kanker* 1.3 51.7 89.1
District
Std III to V childrenAll
Children
% Out-of-
school
% CAN
read
level - 2
% CAN
solve
subtraction
Kawardha* 9.1 42.7 51.6
Korba* 5.7 48.8 47.2
Mahasumund 0.6 28.5 90.8
Raigarh 2.3 66.7 68.3
Raipur 12.0 46.2 63.3
Rajnandgaon 1.9 25.4 77.4
Surguja 5.4 47.0 64.8
District
Std III to V children
Chhatisgarh state 4.7 52.4 70.9
Performance of all districts

47%53%
46%54%
Gender differences
Out-of-school children
Enrollment
All analyses based on data from 30 out of 30 districts
Age 11-14Age 6-10
ORISSA RURAL
Out-of-school children: Proportion of girls and boys.Percentage of boys and girls in government and private schools
82 ASER 2005
20+
15 - 20
10 - 15
5 - 10
3 - 5
0 - 3
No data
Percentage of children
% Children in each age group in different
types of schools
% Children in each age
group not in school
Government Private Madarsa EGSNever
EnrolledDrop Out
Age : 6-14 ALL 85.0 3.5 0.1 2.5 4.6 4.2 100
Age : 6-10 ALL 88.9 2.5 0.1 3.4 3.7 1.4 100
Age : 11-14 ALL 78.9 5.1 0.1 1.2 6.1 8.7 100
Age : 6-10 BOYS 89.2 3.1 0.1 3.2 3.4 1.1 100
Age : 6-10 GIRLS 88.7 2.0 0.1 3.6 3.9 1.8 100
Age : 11-14 BOYS 80.2 5.3 0.1 1.1 5.2 8.0 100
Age : 11-14 GIRLS 77.5 4.8 0.0 1.3 7.1 9.4 100
Total
0
20
40
60
80
100
Boys Girls Boys Girls
Govt school Pvt school
Children 6-14
BHUBANESWAR
Malkangiri
Koraput
NabarangpurRayagada
PuriKalahandi
NuaparhaBalangir
NayagarhPhulbani(Khandamal)
Sonapur
Bauda
Angul
Bargarh Sambalpur
Khorda
Cuttack
Jagatsinghpur
Kendrapara
Dhenkanal
Bhadrak
BaleshwarDeogarh
KendujhargarhJharsuguda
Sundargarh
Mayurbhanj
Jajpur
Ganjam
Gajapati
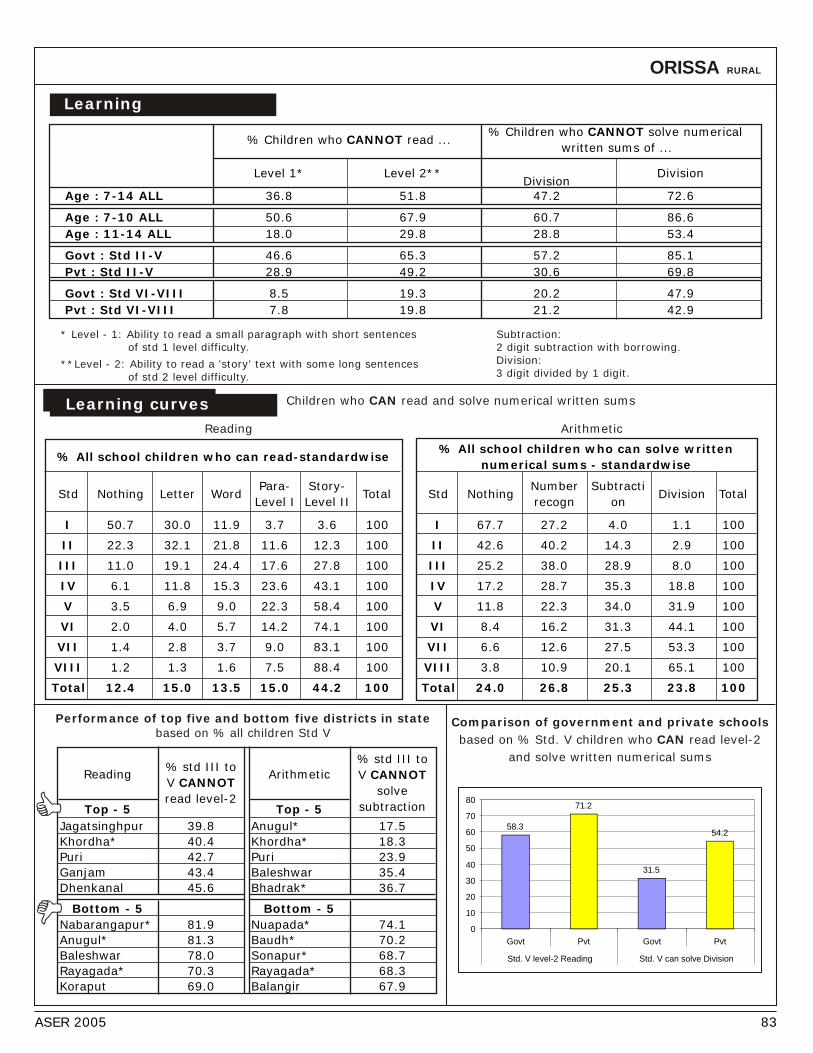
Std Nothing Letter Word Para-
Level I
Story-
Level IITotal
I 50.7 30.0 11.9 3.7 3.6 100
II 22.3 32.1 21.8 11.6 12.3 100
III 11.0 19.1 24.4 17.6 27.8 100
IV 6.1 11.8 15.3 23.6 43.1 100
V 3.5 6.9 9.0 22.3 58.4 100
VI 2.0 4.0 5.7 14.2 74.1 100
VII 1.4 2.8 3.7 9.0 83.1 100
VIII 1.2 1.3 1.6 7.5 88.4 100
Total 12.4 15.0 13.5 15.0 44.2 100
ORISSA RURAL
Performance of top five and bottom five districts in state based on % all children Std V
Comparison of government and private schools
based on % Std. V children who CAN read level-2
and solve written numerical sums
Reading Arithmetic
Children who CAN read and solve numerical written sums Learning curves
**Level - 2: Ability to read a 'story' text with some long sentences of std 2 level difficulty.
* Level - 1: Ability to read a small paragraph with short sentences of std 1 level difficulty.
Division: 3 digit divided by 1 digit.
Subtraction: 2 digit subtraction with borrowing.
Learning
% Children who CANNOT read ...% Children who CANNOT solve numerical
written sums of ...
83ASER 2005
Level 1* Level 2**Division
Division
Age : 7-14 ALL 36.8 51.8 47.2 72.6
Age : 7-10 ALL 50.6 67.9 60.7 86.6
Age : 11-14 ALL 18.0 29.8 28.8 53.4
Govt : Std II-V 46.6 65.3 57.2 85.1
Pvt : Std II-V 28.9 49.2 30.6 69.8
Govt : Std VI-VIII 8.5 19.3 20.2 47.9
Pvt : Std VI-VIII 7.8 19.8 21.2 42.9
Std NothingNumber
recogn
Subtracti
onDivision Total
I 67.7 27.2 4.0 1.1 100
II 42.6 40.2 14.3 2.9 100
III 25.2 38.0 28.9 8.0 100
IV 17.2 28.7 35.3 18.8 100
V 11.8 22.3 34.0 31.9 100
VI 8.4 16.2 31.3 44.1 100
VII 6.6 12.6 27.5 53.3 100
VIII 3.8 10.9 20.1 65.1 100
Total 24.0 26.8 25.3 23.8 100
% All school children who can solve written
numerical sums - standardwise
Reading Arithmetic
Top - 5 Top - 5
Jagatsinghpur 39.8 Anugul* 17.5
Khordha* 40.4 Khordha* 18.3
Puri 42.7 Puri 23.9
Ganjam 43.4 Baleshwar 35.4
Dhenkanal 45.6 Bhadrak* 36.7
Bottom - 5 Bottom - 5
Nabarangapur* 81.9 Nuapada* 74.1
Anugul* 81.3 Baudh* 70.2
Baleshwar 78.0 Sonapur* 68.7
Rayagada* 70.3 Rayagada* 68.3
Koraput 69.0 Balangir 67.9
% std III to
V CANNOT
read level-2
% std III to
V CANNOT
solve
subtraction
58.3
71.2
31.5
54.2
0
10
20
30
40
50
60
70
80
Govt Pvt Govt Pvt
Std. V level-2 Reading Std. V can solve Division
% All school children who can read-standardwise

Std.
I-IV/V
Std.
I - VIII
Total number of schools
visited 308 230
% teachers attending
(average) 73.5 65.2
% of schools with NO
teachers present4.9 3.5
% of schools with ALL
teachers present 45.1 26.1
Teachers' attendance
Schools with:
ORISSA RURAL
Teachers, children, and classrooms
Provision and use
84 ASER 2005
Average number of rooms available
Type of
school by
enrollment
%
Schools
visited
Std
I-V
rooms
Type of
school by
enrollment
%
Schools
visited
Std
I-VIII
rooms
<=50 14 2.4 <=150 22 5.1
51-75 17 3.4 151-250 44 5.9
76-150 40 4.0 251-350 23 8.8
151-225 20 5.3 351-450 5 7.0
>225 9 4.8 >450 6 10.6
Pupil-teacher ratio (PTR)
Media
n fig
ure
s
Schools Std. I-V Schools Std. I - VIII
36.3
29.5
39.9 41.7
0
10
20
30
40
50
PTR based onenrollment
PTR based onattendance on
day of visit
PTR based onenrollment
PTR based onattendance on
day of visit
Std.
I-IV/V
Std.
I - VIII
Total number of schools
visited 309 231
% enrolled children
attending (average) 66.0 64.3
% of schools with less
than 50% of enrolled
children attending
18.1 21.2
Children's attendance
Schools with:
% of schools with no water/toilet provision
% of schools with water/toilet provision but not useable
% of schools with water/toilet provision and useable
Water & toilet provision and use (%)
Schools Std. I-V Schools Std. I-VIII
0
20
40
60
80
100
Water facility
and use
Toilet provision
and use
Water facility
and use
Toilet provision
and use
Pe
rce
nta
ge
of sch
oo
ls
Textbooks and midday meals (%)
Schools Std. I-V Schools Std. I-VIII
Pe
rce
nta
ge
of sc
ho
ols
32.3
66.2
35.1
71.2
0
20
40
60
80
100
Schools
where most
(75%) of
children in Std
5 have
textbooks
Midday meal
available
Schools
where most
(75%) of
children in Std
5 have
textbooks
Midday meal
available

ORISSA RURAL
Performance of all districts
ASER 2005
All
Children
% Out-of-
school
% CAN
read
level - 2
% CAN
solve
subtraction
Anugul* 2.0 18.7 82.5
Balangir 4.7 39.3 32.1
Baleshwar 17.3 22.0 64.6
Bargarh* 5.5 40.0 35.3
Bauda* 4.8 50.3 29.8
Bhadrak* 1.0 45.7 63.3
Cuttack 6.8 46.5 50.4
Deogarh* 2.8 45.9 38.3
Dhenkanal 4.2 54.4 47.2
Gajapati* 20.6 49.1 47.3
Ganjam 8.3 56.6 42.2
Jagatsinghpur 3.8 60.2 62.6
Jajapur* 1.4 48.3 62.8
Jharsuguda* 4.3 37.8 50.4
Kalahandi 15.0 43.5 36.9
District
Std III to V childrenAll
Children
% Out-of-
school
% CAN
read
level - 2
% CAN
solve
subtraction
Pulbhani (Khandamal) 8.0 31.7 62.8
Kendrapara* 4.7 40.8 62.2
Kendujhargarh 4.3 44.5 35.1
Khorda* 1.7 59.6 81.7
Koraput 17.8 31.0 50.3
Malkangiri* 32.6 52.0 57.5
Mayurbhanj 8.2 52.7 58.9
Nabarangapur* 18.7 18.1 42.4
Nayagarh* 3.7 52.8 57.2
Nuaparha* 11.4 35.9 25.9
Puri 1.3 57.3 76.1
Rayagada* 30.8 29.7 31.7
Sambalpur 9.0 41.3 52.4
Sonapur* 3.9 32.3 31.3
Sundargarh 10.6 39.1 51.6
District
Std III to V children
ORISSA STATE 8.9 42.8 52.0
85


Maharshtra
Andhra Pradesh
Goa
Karnataka
Kerala
Tamil Nadu
Note : Goa does not have school tables as the numbers of observations are too small.

48%52%51%49%
Gender differences
Out-of-school children
Enrollment
MAHARASHTRA
Out-of-school children: Proportion of girls and boys.
All analyses based on data from 33 out of 33 districts
Percentage of boys and girls in government and private schools
Age 11-14Age 6-10
RURAL
88 ASER 2005
20+
15 - 20
10 - 15
5 - 10
3 - 5
0 - 3
No data
Percentage of children
Government Private Madarsa EGSNever
EnrolledDrop Out
Age : 6-14 ALL 78.1 18.2 0.3 0.6 0.8 2.0 100
Age : 6-10 ALL 90.5 7.3 0.3 0.4 0.8 0.7 100
Age : 11-14 ALL 59.1 34.9 0.4 0.9 0.9 3.9 100
Age : 6-10 BOYS 90.5 7.4 0.3 0.4 0.8 0.7 100
Age : 6-10 GIRLS 90.6 7.2 0.3 0.4 0.9 0.7 100
Age : 11-14 BOYS 59.9 34.4 0.4 0.9 0.7 3.7 100
Age : 11-14 GIRLS 58.2 35.5 0.4 0.9 1.0 4.1 100
% Children in each age group in different
types of schools
% Children in each age
group not in schoolTotal
0
20
40
60
80
100
Boys Girls Boys Girls
Govt school Pvt school
Children 6-14
MUMBAI
Nandurbar
Nashik
Thane
Raigad Pune
Ahmednagar
AurangabadJalna
Dhule
Jalgaon
Buldhana
Akola
Amravati
Wardha
Yavatmal
Washim
Hingoli
Bid
ParbhaniNanded
Latur
Satara
Ratnagiri Sangli
Kolhapur
Solapur
Gondia
Bhandara
Nagpur
Gadchiroli
Chandrapur
Sindhudurg
Usmanabad

89ASER 2005
Children who CAN read and solve numerical written sums Learning curves
**Level - 2: Ability to read a 'story' text with some long sentences of std 2 level difficulty.
* Level - 1: Ability to read a small paragraph with short sentences of std 1 level difficulty.
Division: 3 digit divided by 1 digit.
Subtraction: 2 digit subtraction with borrowing.
MAHARASHTRA RURAL
Performance of top five and bottom five districts in state based on % all children Std V
Comparison of government and private schools
based on % Std. V children who CAN read level-2
and solve written numerical sums
Reading Arithmetic
Learning
% Children who CANNOT read ...% Children who CANNOT solve numerical
written sums of ...
Level 1* Level 2**Subtraction or
Division
Age : 7-14 ALL 27.6 45.8 46.1 71.2
Age : 7-10 ALL 39.2 61.0 57.9 84.6
Age : 11-14 ALL 12.6 26.3 30.8 54.1
Govt : Std II-V 32.6 55.8 52.2 81.3
Pvt : Std II-V 23.9 44.1 44.0 72.4
Govt : Std VI-VIII 7.6 20.1 25.1 47.5
Pvt : Std VI-VIII 7.1 17.6 25.3 47.4
Std Nothing Letter Word Para-
Level I
Story-
Level IITotal
I 29.1 38.6 21.9 5.3 5.1 100
II 9.4 21.5 28.4 21.3 19.3 100
III 4.5 12.5 17.3 28.4 37.3 100
IV 3.1 6.2 10.2 22.0 58.6 100
V 2.5 4.7 6.4 19.0 67.3 100
VI 1.9 2.5 4.8 14.2 76.7 100
VII 1.5 1.9 2.6 10.5 83.6 100
VIII 1.4 2.0 3.2 8.6 84.8 100
Total 7.0 12.1 13.0 17.4 50.4 100
Std NothingNumber
recogn
Subtracti
onDivision Total
I 53.2 41.2 4.5 1.1 100
II 27.8 52.8 16.9 2.5 100
III 15.1 39.0 36.1 9.8 100
IV 10.9 27.3 33.6 28.2 100
V 8.4 24.2 28.0 39.5 100
VI 6.7 19.4 24.8 49.1 100
VII 4.9 19.0 20.8 55.3 100
VIII 6.0 20.3 19.5 54.1 100
Total 17.5 31.8 23.9 26.7 100
% All school children who can solve written
numerical sums - standardwise
Reading Arithmetic
Top - 5 Top - 5
Satara 27.3 Ratnagiri 19.3
Kolhapur 28.8 Sindhudurg 21.1
Wardha 33.1 Ahmednagar 23.5
Chandrapur 35.1 Jalna 25.5
Raigarh 35.5 Buldana 26.0
Bottom - 5 Bottom - 5
Nandurbar* 78.2 Nandurbar* 69.5
Aurangabad 68.0 Amravati 66.4
Amravati 61.3 Gadchiroli 62.0
Jalna 59.4 Gondiya* 62.0
Jalgaon 57.9 Bhandara 61.7
% std III to
V CANNOT
read level-2
% std III to
V CANNOT
solve
subtraction67.2 68.1
40.637.0
0
10
20
30
40
50
60
70
80
Govt Pvt Govt Pvt
Std. V level-2 Reading Std. V can solve Division
% All school children who can read-standardwise

Std.
I-IV/V
Std.
I - VIII
Total number of schools
visited 299 333
% teachers attending
(average) 82.3 80.0
% of schools with NO
teachers present8.4 9.3
% of schools with ALL
teachers present 62.2 45.0
Teachers' attendance
Schools with:
MAHARASHTRA RURAL
90 ASER 2005
Teachers, children, and classrooms
Provision and use
Average number of rooms available
Type of
school by
enrollment
%
Schools
visited
Std
I-V
rooms
Type of
school by
enrollment
%
Schools
visited
Std
I-VIII
rooms
<=50 23 2.6 <=150 21 5.0
51-75 15 2.9 151-250 42 7.0
76-150 32 4.8 251-350 20 8.8
151-225 17 5.8 351-450 10 11.0
>225 13 9.6 >450 7 14.0
% of schools with no water/toilet provision
% of schools with water/toilet provision but not useable
% of schools with water/toilet provision and useable
Water & toilet provision and use (%)
Schools Std. I-V Schools Std. I-VIII
Textbooks and midday meals (%)
Schools Std. I-V Schools Std. I-VIII
Pe
rce
nta
ge
of sc
ho
ols 73.7
86.4 90.981.6
0
20
40
60
80
100
Schools
where most
(75%) of
children in Std
5 have
textbooks
Midday meal
available
Schools
where most
(75%) of
children in Std
5 have
textbooks
Midday meal
available
Pupil-teacher ratio (PTR)
Media
n fig
ure
s
Schools Std. I-V Schools Std. I - VIII
29.027.0 28.8 28.6
0
10
20
30
40
50
PTR based onenrollment
PTR based onattendance on
day of visit
PTR based onenrollment
PTR based onattendance on
day of visit
Std.
I-IV/V
Std.
I - VIII
Total number of schools
visited 307 344
% enrolled children
attending (average) 82.2 82.5
Children's attendance
Schools with:
% of schools with less
than 50% of enrolled
children attending
5.5 3.8
0
20
40
60
80
100
Water facility
and use
Toilet provision
and use
Water facility
and use
Toilet provision
and use
Pe
rce
nta
ge
of sch
oo
ls

Performance of all districts
MAHARASHTRA RURAL
91ASER 2005
All Children
% Out-of-school
% CAN read
level - 2
% CAN solve
subtraction
Ahmednagar 1.6 61.0 76.5
Akola 0.3 43.8 53.7
Amravati 1.4 38.7 33.6
Aurangabad 5.7 32.0 40.2
Bhandara 0.8 54.4 38.3
Bid 6.5 43.6 55.8
Buldhana 0.4 56.8 74.0
Chandrapur 1.0 64.9 50.9
Dhule 3.0 43.1 59.7
Gadchiroli 6.2 43.3 38.0
Gondia* 0.2 51.2 38.0
Hingoli* 4.7 59.4 45.0
Jalgaon 2.6 42.1 49.0
Jalna 2.2 40.6 74.5
Kolhapur 2.2 71.2 44.9
Latur 3.5 58.8 62.6
Nagpur 2.0 46.2 42.5
District
Std III to V childrenAll
Children
% Out-of-school
% CAN read
level - 2
% CAN solve
subtraction
Nanded 2.8 43.7 52.7
Nandurbar* 16.4 21.8 30.5
Nashik 2.4 46.6 47.4
Usmanabad 0.2 55.0 65.7
Parbhani 1.2 42.3 57.4
Pune 1.9 61.6 70.9
Raigad 1.8 64.5 58.6
Ratnagiri 1.3 61.8 80.7
Sangli 0.7 57.2 71.4
Satara 1.7 72.7 72.9
Sindhudurg 0.3 56.4 78.9
Solapur 4.2 62.8 60.2
Thane 7.2 50.6 42.5
Wardha 0.7 66.9 58.6
Washim* 2.8 64.4 63.5
Yavatmal 4.1 48.9 46.5
District
Std III to V children
Maharashtra state 2.8 53.7 57.9

HYDERABAD
Adilabad
Nizamabad Karimnagar
Rangareddi
Mahbubnagar
Chittoor
Anantapur
CuddapahNellore
Guntur
Kurnool
Nalgonda
KhammamEast Godavari
Yaman (PONDICHERRY)
Warangal
Vishakhapatnam
Vizianagaram
Srikakulam
West Godavari
Krishna
Prakasam
Medak
52%48%
Government Private Madarsa EGSNever
EnrolledDrop Out
Age : 6-14 ALL 71.7 19.2 0.1 1.1 3.9 4.2 100
Age : 6-10 ALL 73.8 21.8 0.1 1.0 1.4 2.1 100
Age : 11-14 ALL 73.5 15.7 0.0 1.1 4.5 5.1 100
Age : 6-10 BOYS 72.2 23.4 0.1 0.9 1.3 2.1 100
Age : 6-10 GIRLS 75.5 20.1 0.0 1.0 1.4 2.0 100
Age : 11-14 BOYS 72.5 18.5 0.0 1.0 3.9 4.1 100
Age : 11-14 GIRLS 74.5 12.8 0.1 1.2 5.2 6.2 100
Total
% Children in each age group in different
types of schools
% Children in each age
group not in school
Gender differences
Out-of-school children
Enrollment
ANDHRA PRADESHAll analyses based on data from 21 out of 22 districts
Age 11-14Age 6-10
RURAL
Percentage of boys and girls in government and private schools
Out-of-school children: Proportion of girls and boys.
92 ASER 2005
20+
15 - 20
10 - 15
5 - 10
3 - 5
0 - 3
No data
Percentage of children
0
20
40
60
80
100
Boys Girls Boys Girls
Govt school Pvt school
Children 6-14
43%
57%

Std Nothing Letter Word Para-
Level I
Story-
Level IITotal
I 30.8 36.7 20.5 5.8 6.2 100
II 14.0 22.2 35.3 14.7 13.9 100
III 7.6 13.0 26.3 27.0 26.1 100
IV 4.3 6.9 16.6 24.5 47.8 100
V 4.1 2.8 8.7 22.8 61.7 100
VI 4.7 1.9 7.2 17.3 68.9 100
VII 4.1 1.5 3.4 12.3 78.7 100
VIII 3.4 1.1 2.5 9.2 83.8 100
Total 8.8 10.5 15.6 17.7 47.3 100
Reading Arithmetic
Top - 5 Top - 5
Vizianagaram 32.9 Nellore 11.0
Nellore 33.2 Chittoor 14.5
Prakasam 34.6 Vizianagaram 15.3
Guntur 43.5 Krishna 16.2
Chittoor 44.1 Prakasam 16.7
Bottom - 5 Bottom - 5
Medak 79.4 East Godavari 52.4
Nizamabad 74.3 Rangareddi 52.0
Vishakhapatnam 67.3 Mahbubnagar 51.8
East Godavari 66.1 Vishakhapatnam 46.3
Mahbubnagar 64.9 Warangal 44.0
% std III to
V CANNOT
read level-2
% std III to
V CANNOT
solve
subtraction
ANDHRA PRADESH RURAL
Reading Arithmetic
Performance of top five and bottom five districts in state based on % all children Std V
Comparison of government and private schools
based on % Std. V children who CAN read level-2
and solve written numerical sums
Children who CAN read and solve numerical written sums Learning curves
**Level - 2: Ability to read a 'story' text with some long sentences of std 2 level difficulty.
* Level - 1: Ability to read a small paragraph with short sentences of std 1 level difficulty.
Division: 3 digit divided by 1 digit.
Subtraction: 2 digit subtraction with borrowing.
Learning
Level 1* Level 2**Subtraction or
DivisionDivision
Age : 7-14 ALL 29.4 47.5 32.7 59.9
Age : 7-10 ALL 40.1 62.0 41.6 71.4
Age : 11-14 ALL 15.9 29.1 21.5 45.5
Govt : Std II-V 39.8 62.6 40.0 71.5
Pvt : Std II-V 33.8 55.6 37.8 68.0
Govt : Std VI-VIII 10.6 24.7 18.2 43.5
Pvt : Std VI-VIII 9.0 18.4 15.2 34.6
% Children who CANNOT READ &% Children who CANNOT solve numerical
written sums of ...
93ASER 2005
Std NothingNumber
recogn
Subtracti
onDivision Total
I 42.1 46.2 7.5 4.2 100
II 18.2 51.7 21.9 8.2 100
III 10.1 36.4 35.1 18.4 100
IV 6.9 23.8 33.3 36.0 100
V 5.8 13.2 32.6 48.4 100
VI 6.9 13.2 27.9 52.0 100
VII 6.0 11.5 23.4 59.1 100
VIII 4.8 9.8 20.4 65.0 100
Total 11.9 25.7 26.5 35.9 100
% All school children who can solve written
numerical sums - standardwise
60.4
67.6
46.6
57.1
0
10
20
30
40
50
60
70
80
Govt Pvt Govt Pvt
Std. V level-2 Reading Std. V can solve Division
% All school children who can read-standardwise

Type of
school by
enrollment
%
Schools
visited
Std
I-V
rooms
Type of
school by
enrollment
%
Schools
visited
Std
I-VIII
rooms
<=50 26 1.7 <=150 27 5.1
51-75 15 2.9 151-250 33 7.1
76-150 35 3.3 251-350 25 7.6
151-225 11 4.6 351-450 8 9.4
>225 13 6.2 >450 7 8.7
Average number of rooms available
ANDHRA PRADESH RURAL
94 ASER 2005
Teachers, children, and classrooms
Provision and use
Pupil-teacher ratio (PTR)
Media
n fig
ure
s
Schools Std. I-V Schools Std. I - VIII
27.7 26.7 26.7 25.4
0
10
20
30
40
50
PTR based onenrollment
PTR based onattendance on
day of visit
PTR based onenrollment
PTR based onattendance on
day of visit
Std.
I-IV/V
Std.
I - VIII
Total number of schools
visited 195 174
% teachers attending
(average) 76.9 78.6
% of schools with NO
teachers present4.1 1.1
% of schools with ALL
teachers present 45.6 28.2
Teachers' attendance
Schools with:
Std.
I-IV/V
Std.
I - VIII
Total number of schools
visited 196 175
% enrolled children
attending (average) 76.2 74.6
Children's attendance
Schools with:
% of schools with less
than 50% of enrolled
children attending
8.2 4.6
% of schools with no water/toilet provision
% of schools with water/toilet provision but not useable
% of schools with water/toilet provision and useable
Water & toilet provision and use (%)
Schools Std. I-V Schools Std. I-VIII
Textbooks and midday meals (%)
Schools Std. I-V Schools Std. I-VIII
Pe
rce
nta
ge
of sc
ho
ols
0
20
40
60
80
100
Water facility
and use
Toilet provision
and use
Water facility
and use
Toilet provision
and use
Pe
rce
nta
ge
of sch
oo
ls
79.670.3
84.6
74.0
0
20
40
60
80
100
Schools
where most
(75%) of
children in Std
5 have
textbooks
Midday meal
available
Schools
where most
(75%) of
children in Std
5 have
textbooks
Midday meal
available

95ASER 2005
ANDHRA PRADESH RURAL
Performance of all districts
All Children
% Out-of-school
% CAN
read
level - 2
% CAN
solve
subtraction
Adilabad 7.5 44.4 67.0
Anantapur 10.4 48.5 72.4
Chittoor 6.1 55.9 85.5
Cuddapah 11.4 40.1 66.2
East Godavari 12.3 33.9 47.6
Guntur 10.6 56.5 80.1
Karimnagar 3.2 38.7 65.5
Khammam 13.2 46.4 64.4
Krishna 3.7 54.7 83.8
Kurnool 17.1 53.4 73.9
Mahbubnagar 9.9 35.1 48.2
District
Std III to V childrenAll
Children
% Out-of-school
% CAN
read
level - 2
% CAN
solve
subtraction
Medak 3.7 20.6 62.4
Nalgonda 6.6 38.0 62.8
Nellore 5.8 66.8 89.0
Nizamabad 3.6 25.7 60.5
Prakasam 7.9 65.4 83.3
Rangareddi 4.2 38.1 48.0
Srikakulam 5.3 50.4 69.6
Vishakhapatnam 5.3 32.7 53.7
Vizianagaram 12.1 67.1 84.7
Warangal 10.8 39.1 56.0
West Godavari 5.0 47.4 69.5
District
Std III to V children
Andhra Pradeshstate
8.0 46.0 68.6

67%
33%
100%
0%
All analyses based on data from 2 out of 2 districts
Age 11-14Age 6-10
GOA RURAL
Out-of-school children: Proportion of girls and boys.Percentage of boys and girls in government and private schools
Gender differences
Out-of-school children
Enrollment
96 ASER 2005
20+
15 - 20
10 - 15
5 - 10
3 - 5
0 - 3
No data
Percentage of children
North Goa
South Goa
Government Private Madarsa EGSNever
EnrolledDrop Out
Age : 6-14 ALL 72.0 27.7 0.0 0.0 0.1 0.2 100
Age : 6-10 ALL 74.3 25.6 0.0 0.0 0.2 0.0 100
Age : 11-14 ALL 69.2 30.3 0.0 0.0 0.0 0.6 100
Age : 6-10 BOYS 72.3 27.5 0.0 0.0 0.3 0.0 100
Age : 6-10 GIRLS 76.7 23.3 0.0 0.0 0.0 0.0 100
Age : 11-14 BOYS 71.9 27.4 0.0 0.0 0.0 0.8 100
Age : 11-14 GIRLS 66.7 33.0 0.0 0.0 0.0 0.4 100
Total
% Children in each age group in different
types of schools
% Children in each age
group not in school
0
20
40
60
80
100
Boys Girls Boys Girls
Govt school Pvt school
Children 6-14
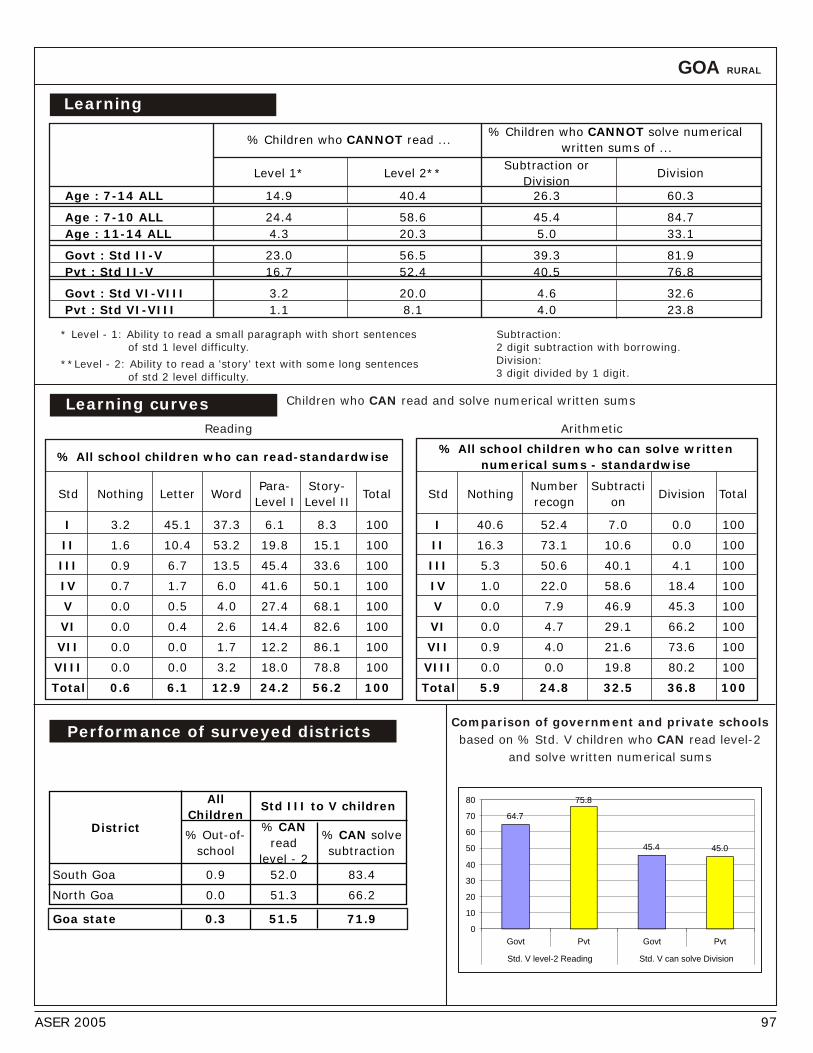
GOA RURAL
Comparison of government and private schools
based on % Std. V children who CAN read level-2
and solve written numerical sums
Reading Arithmetic
Children who CAN read and solve numerical written sums Learning curves
**Level - 2: Ability to read a 'story' text with some long sentences of std 2 level difficulty.
* Level - 1: Ability to read a small paragraph with short sentences of std 1 level difficulty.
Division: 3 digit divided by 1 digit.
Subtraction: 2 digit subtraction with borrowing.
Performance of surveyed districts
Learning
97
% Children who CANNOT read ...% Children who CANNOT solve numerical
written sums of ...
Level 1* Level 2**Subtraction or
Division
Age : 7-14 ALL 14.9 40.4 26.3 60.3
Age : 7-10 ALL 24.4 58.6 45.4 84.7
Age : 11-14 ALL 4.3 20.3 5.0 33.1
Govt : Std II-V 23.0 56.5 39.3 81.9
Pvt : Std II-V 16.7 52.4 40.5 76.8
Govt : Std VI-VIII 3.2 20.0 4.6 32.6
Pvt : Std VI-VIII 1.1 8.1 4.0 23.8
Std Nothing Letter Word Para-
Level I
Story-
Level IITotal
I 3.2 45.1 37.3 6.1 8.3 100
II 1.6 10.4 53.2 19.8 15.1 100
III 0.9 6.7 13.5 45.4 33.6 100
IV 0.7 1.7 6.0 41.6 50.1 100
V 0.0 0.5 4.0 27.4 68.1 100
VI 0.0 0.4 2.6 14.4 82.6 100
VII 0.0 0.0 1.7 12.2 86.1 100
VIII 0.0 0.0 3.2 18.0 78.8 100
Total 0.6 6.1 12.9 24.2 56.2 100
Std NothingNumber
recogn
Subtracti
onDivision Total
I 40.6 52.4 7.0 0.0 100
II 16.3 73.1 10.6 0.0 100
III 5.3 50.6 40.1 4.1 100
IV 1.0 22.0 58.6 18.4 100
V 0.0 7.9 46.9 45.3 100
VI 0.0 4.7 29.1 66.2 100
VII 0.9 4.0 21.6 73.6 100
VIII 0.0 0.0 19.8 80.2 100
Total 5.9 24.8 32.5 36.8 100
% All school children who can solve written
numerical sums - standardwise
All
Children
% Out-of-
school
% CAN
read
level - 2
% CAN solve
subtraction
South Goa 0.9 52.0 83.4
North Goa 0.0 51.3 66.2
Goa state 0.3 51.5 71.9
District
Std III to V children64.7
75.8
45.4 45.0
0
10
20
30
40
50
60
70
80
Govt Pvt Govt Pvt
Std. V level-2 Reading Std. V can solve Division
Division
ASER 2005
% All school children who can read-standardwise

47%53%53%
47%
Gender differences
Out-of-school children
Enrollment
All analyses based on data from 27 out of 27 districts
Age 11-14Age 6-10
KARNATAKA RURAL
Out-of-school children: Proportion of girls and boys.Percentage of boys and girls in government and private schools
98 ASER 2005
20+
15 - 20
10 - 15
5 - 10
3 - 5
0 - 3
No data
Percentage of children
Government Private Madarsa EGSNever
EnrolledDrop Out
Age : 6-14 ALL 88.5 9.5 0.1 0.0 0.3 1.6 100
Age : 6-10 ALL 89.9 9.5 0.0 0.0 0.1 0.4 100
Age : 11-14 ALL 87.0 9.5 0.1 0.0 0.5 2.9 100
Age : 6-10 BOYS 89.5 9.9 0.1 0.0 0.2 0.4 100
Age : 6-10 GIRLS 90.4 9.1 0.0 0.0 0.1 0.4 100
Age : 11-14 BOYS 87.3 9.3 0.1 0.0 0.4 2.8 100
Age : 11-14 GIRLS 86.8 9.6 0.1 0.0 0.5 3.0 100
% Children in each age group in different
types of schools
% Children in each age
group not in schoolTotal
0
20
40
60
80
100
Boys Girls Boys Girls
Govt school Pvt school
Children 6-14
KARNATAKA
BANGALORE
Bidar
Gulbarga
Raichur
Bijapur
Bagalkot
KoppalDharwadGadag
Belgaum
Haveri
ChitradurgaShimoga
Udipi Chikmangalur
Hassan
Mandya
Mysore
Chamaranj nagar
Tumkur
Kolar
Bellary
Dakshin Kannad
Uttar Kannad
Devangere
Kodagu
Tumkur
Banglore Rural

KARNATAKA RURAL
Performance of top five and bottom five districts in state based on % all children Std V
Comparison of government and private schools
based on % Std. V children who CAN read level-2
and solve written numerical sums
Reading Arithmetic
Children who CAN read and solve numerical written sums Learning curves
**Level - 2: Ability to read a 'story' text with some long sentences of std 2 level difficulty.
* Level - 1: Ability to read a small paragraph with short sentences of std 1 level difficulty.
Division: 3 digit divided by 1 digit.
Subtraction: 2 digit subtraction with borrowing.
Learning
% Children who CANNOT read ...% Children who CANNOT solve numerical
written sums of ...
99ASER 2005
Level 1* Level 2**Subtraction or
DivisionDivision
Age : 7-14 ALL 34.9 53.9 44.3 75.8
Age : 7-10 ALL 52.9 72.5 59.7 90.6
Age : 11-14 ALL 17.1 35.6 29.3 61.2
Govt : Std II-V 50.3 70.5 58.5 90.1
Pvt : Std II-V 40.6 62.4 45.3 82.5
Govt : Std VI-VIII 12.4 29.1 24.2 55.6
Pvt : Std VI-VIII 8.6 26.8 22.9 47.2
Std Nothing Letter Word Para-
Level I
Story-
Level IITotal
I 46.1 16.6 25.3 4.6 7.4 100
II 13.4 37.1 30.5 10.6 8.5 100
III 8.5 19.5 32.7 19.5 19.8 100
IV 5.4 10.4 22.2 25.6 36.4 100
V 3.5 6.6 14.4 24.2 51.3 100
VI 2.7 4.6 9.4 18.1 65.1 100
VII 1.3 2.3 6.1 17.2 73.1 100
VIII 0.9 1.9 4.2 13.4 79.7 100
Total 5.4 12.1 17.7 19.0 45.9 100
Std NothingNumber
recogn
Subtracti
onDivision Total
I 61.1 33.5 0.0 5.5 100
II 23.2 63.8 11.5 1.5 100
III 13.1 54.4 29.8 2.8 100
IV 7.8 37.4 43.8 11.0 100
V 5.9 29.5 40.3 24.3 100
VI 3.7 22.9 34.8 38.6 100
VII 2.4 19.8 29.2 48.6 100
VIII 2.1 20.3 24.8 52.8 100
Total 8.6 36.0 31.4 24.0 100
% All school children who can solve written
numerical sums - standardwise
Reading Arithmetic
Top - 5 Top - 5
Udipi* 18.4 Udipi* 9.0
Gadag* 41.2 Chitradurga 17.7
Hassan 44.7 Hassan 23.2
Shimoga 44.8 Uttara Kannad 30.4
Kodagu 45.6 Kolar 30.9
Bottom - 5 Bottom - 5
Kolar 84.6 Dharwad 79.5
Haveri* 84.5 Belgaum 70.6
Belgaum 83.6 Chamarajanagar 69.5
Dharwad 81.9 Koppal 60.4
Uttara Kannad 77.9 Haveri* 60.4
% std III to
V CANNOT
read level-2
% std III to
V CANNOT
solve
subtraction
50.7
58.8
23.2
38.1
0
10
20
30
40
50
60
70
Govt Pvt Govt Pvt
Std. V level-2 Reading Std. V can solve Division
% All school children who can read-standardwise

Teachers, children, and classrooms
Provision and use
KARNATAKA RURAL
100 ASER 2005
Average number of rooms available
Type of
school by
enrollment
%
Schools
visited
Std
I-V
rooms
Type of
school by
enrollment
%
Schools
visited
Std
I-VIII
rooms
<=50 62 2.4 <=150 23 5.6
51-75 19 2.8 151-250 26 7.3
76-150 19 3.6 251-350 22 9.3
151-225 0 0.0 351-450 13 9.8
>225 0 0.0 >450 16 12.5
% of schools with no water/toilet provision
% of schools with water/toilet provision but not useable
% of schools with water/toilet provision and useable
Water & toilet provision and use (%)
Schools Std. I-V Schools Std. I-VIII
Textbooks and midday meals (%)
Schools Std. I-V Schools Std. I-VIII
Pe
rce
nta
ge
of sc
ho
ols
92.5
84.0
96.8
80.0
0
20
40
60
80
100
Schools
where most
(75%) of
children in Std
5 have
textbooks
Midday meal
available
Schools
where most
(75%) of
children in Std
5 have
textbooks
Midday meal
available
Pupil-teacher ratio (PTR)
Media
n fig
ure
s
Schools Std. I-V Schools Std. I - VIII
21.8 23.0
33.4 32.5
0
10
20
30
40
50
PTR based onenrollment
PTR based onattendance on
day of visit
PTR based onenrollment
PTR based onattendance on
day of visit
Std.
I-IV/V
Std.
I - VIII
Total number of schools
visited 94 439
% teachers attending
(average) 76.9 77.5
% of schools with NO
teachers present3.2 1.4
% of schools with ALL
teachers present 54.3 23.5
Teachers' attendance
Schools with:
Std.
I-IV/V
Std.
I - VIII
Total number of schools
visited 94 439
% enrolled children
attending (average) 82.5 76.6
Children's attendance
Schools with:
% of schools with less
than 50% of enrolled
children attending
5.3 10.7
0
20
40
60
80
100
Water facility
and use
Toilet provision
and use
Water facility
and use
Toilet provision
and use
Pe
rce
nta
ge
of sch
oo
ls

Performance of all districts
KARNATAKA RURAL
101ASER 2005
All
Children
% Out-of-
school
% CAN
read
level - 2
% CAN
solve
subtraction
Bagalkot* 0.5 39.0 40.1
Bangalore 0.8 35.6 63.0
Bangalore Rural 1.1 44.1 58.2
Belgaum 1.6 16.4 29.4
Bellary 3.8 37.3 40.2
Bidar 2.2 53.6 48.2
Bijapur 2.4 36.7 44.0
Chamaranjnagar 2.5 27.9 30.5
Chikmangalur 0.6 39.6 54.4
Chitradurga 3.2 27.5 82.3
Dakshin Kannad 0.8 50.9 65.7
Devangere 1.2 42.8 46.8
Dharwad 2.8 18.1 20.5
Gadag* 3.2 58.8 43.1
District
Std III to V childrenAll
Children
% Out-of-school
% CAN read
level - 2
% CAN solve
subtraction
Gulbarga 1.9 47.0 43.7
Hassan 1.4 55.3 76.8
Haveri* 1.0 15.5 39.6
Kodagu 2.0 54.4 62.1
Kolar 2.3 15.4 69.1
Koppal 2.1 54.3 39.6
Mandya 1.7 31.7 50.0
Mysore 1.3 29.1 43.4
Raichur 7.6 33.0 58.1
Shimoga 1.3 55.2 54.8
Tumkur 0.6 42.6 54.3
Udipi* 0.2 81.6 91.0
Uttar Kannad 0.5 22.1 69.6
District
Std III to V children
Karnataka state 1.9 36.8 51.7

50%50%55%
45%
Gender differences
Out-of-school children
Enrollment
All analyses based on data from 14 out of 14 districts
Age 11-14Age 6-10
KERALA RURAL
Out-of-school children: Proportion of girls and boys.Percentage of boys and girls in government and private schools
102 ASER 2005
20+
15 - 20
10 - 15
5 - 10
3 - 5
0 - 3
No data
Percentage of children
Government Private Madarsa EGSNever
EnrolledDrop Out
Age : 6-14 ALL 75.5 22.2 0.3 0.5 1.6 0.1 100
Age : 6-10 ALL 77.2 21.8 0.2 0.4 0.5 0.0 100
Age : 11-14 ALL 75.4 23.2 0.3 0.2 0.7 0.1 100
Age : 6-10 BOYS 77.1 21.9 0.3 0.3 0.5 0.0 100
Age : 6-10 GIRLS 77.3 21.7 0.2 0.4 0.4 0.1 100
Age : 11-14 BOYS 77.4 21.5 0.1 0.2 0.7 0.1 100
Age : 11-14 GIRLS 73.3 25.1 0.5 0.2 0.7 0.2 100
% Children in each age group in different
types of schools
% Children in each age
group not in schoolTotal
0
20
40
60
80
100
Boys Girls Boys Girls
Govt school Pvt school
Children 6-14
THIRUVANANTHAPURAM
Kasargod
Kannur
MAHE(PONDICHERRY)
Kozhikode(Calicut)
Malappuram
Palakkad
Thrissur
Ernakulam
AlappuzhaKottayam
Pathanamthitta
Kollam
Wayanad
IdukkiKochi

KERALA RURAL
Performance of top five and bottom five districts in state based on % all children Std V
Comparison of government and private schools
based on % Std. V children who CAN read level-2
and solve written numerical sums
Reading Arithmetic
Children who CAN read and solve numerical written sums Learning curves
**Level - 2: Ability to read a 'story' text with some long sentences of std 2 level difficulty.
* Level - 1: Ability to read a small paragraph with short sentences of std 1 level difficulty.
Division: 3 digit divided by 1 digit.
Subtraction: 2 digit subtraction with borrowing.
Learning
% Children who CANNOT read ...% Children who CANNOT solve numerical
written sums of ...
103ASER 2005
Level 1* Level 2**Subtraction or
DivisionDivision
Age : 7-14 ALL 12.1 23.5 22.5 48.4
Age : 7-10 ALL 17.9 32.3 30.8 63.8
Age : 11-14 ALL 5.2 12.8 12.5 29.7
Govt : Std II-V 18.0 33.3 30.5 65.7
Pvt : Std II-V 18.6 31.5 31.0 53.3
Govt : Std VI-VIII 4.1 11.0 10.6 29.5
Pvt : Std VI-VIII 6.4 11.4 14.7 24.9
Std Nothing Letter Word Para-
Level I
Story-
Level IITotal
I 9.9 18.9 40.2 8.0 23.0 100
II 4.7 8.4 26.6 12.3 48.0 100
III 3.7 3.3 13.9 18.1 60.9 100
IV 2.4 1.6 6.4 15.9 73.8 100
V 1.9 1.1 2.6 12.9 81.5 100
VI 1.6 1.0 3.0 7.7 86.8 100
VII 2.0 0.5 2.3 6.3 88.9 100
VIII 1.6 0.0 1.0 5.8 91.7 100
Total 3.2 3.7 10.7 11.3 71.1 100
Std NothingNumber
recogn
Subtracti
onDivision Total
I 16.9 64.5 10.3 8.3 100
II 8.3 46.0 26.8 19.0 100
III 6.2 30.8 37.4 25.7 100
IV 3.1 17.2 39.5 40.3 100
V 3.1 12.7 28.2 56.0 100
VI 2.3 10.1 23.2 64.4 100
VII 2.5 9.5 15.4 72.7 100
VIII 1.6 6.5 12.8 79.2 100
Total 4.9 22.8 25.7 46.6 100
% All school children who can solve written
numerical sums - standardwise
Reading Arithmetic
Top - 5 Top - 5
Kollam 4.8 Kottayam 13.5Alappuzha 11.1 Alappuzha 13.5
Kannur 13.2 Ernakulam 15.5
Kozhikode 15.7 Pathanamthitta 18.8
Pathanamthitta 17.1 Kannur 22.6
Bottom - 5 Bottom - 5
Malappuram 51.4 Wayanad 33.7
Ernakulam 39.0 Kozhikode 31.8
Thrissur 37.2 Malappuram 31.2
Idukki 35.2 Thiruvananthapuram 30.2
Kasargod 32.0 Kasargod 28.1
% std III to
V CANNOT
read level-2
% std III to
V CANNOT
solve
subtraction 82.078.7
56.1 56.3
0
10
20
30
40
50
60
70
80
90
Govt Pvt Govt Pvt
Std. V level-2 Reading Std. V can solve Division
% All school children who can read-standardwise

Std.
I-IV/V
Std.
I - VIII
Total number of schools
visited 94 128
% teachers attending
(average) 53.1 65.6
% of schools with NO
teachers present37.2 25.8
% of schools with ALL
teachers present 34.0 28.1
Teachers' attendance
Schools with:
Teachers, children, and classrooms
Provision and use
KERALA RURAL
104 ASER 2005
Average number of rooms available
Type of
school by
enrollment
%
Schools
visited
Std
I-V
rooms
Type of
school by
enrollment
%
Schools
visited
Std
I-VIII
rooms
<=50 9 4.1 <=150 8 11.1
51-75 5 4.3 151-250 16 11.3
76-150 41 5.3 251-350 16 14.7
151-225 18 8.1 351-450 13 17.5
>225 27 12.1 >450 47 27.2
% of schools with no water/toilet provision
% of schools with water/toilet provision but not useable
% of schools with water/toilet provision and useable
Water & toilet provision and use (%)
Schools Std. I-V Schools Std. I-VIII
Textbooks and midday meals (%)
Schools Std. I-V Schools Std. I-VIII
Pe
rce
nta
ge
of sc
ho
ols
88.2
92.6 97.0 95.3
0
20
40
60
80
100
Schools
where most
(75%) of
children in Std
5 have
textbooks
Midday meal
available
Schools
where most
(75%) of
children in Std
5 have
textbooks
Midday meal
available
Pupil-teacher ratio (PTR)
Media
n fig
ure
s
Schools Std. I-V Schools Std. I - VIII
24.1
29.0
24.226.5
0
10
20
30
40
50
PTR based onenrollment
PTR based onattendance on
day of visit
PTR based onenrollment
PTR based onattendance on
day of visit
Std.
I-IV/V
Std.
I - VIII
Total number of schools
visited 97 132
% enrolled children
attending (average) 92.9 92.2
Children's attendance
Schools with:
% of schools with less
than 50% of enrolled
children attending
3.1 3.0
0
20
40
60
80
100
Water facility
and use
Toilet provision
and use
Water facility
and use
Toilet provision
and use
Pe
rce
nta
ge
of sch
oo
ls

Performance of all districts
KERALA RURAL
105ASER 2005
All
Children
% Out-of-
school
% CAN
read
level - 2
% CAN
solve
subtraction
Alappuzha 1.8 88.9 86.5
Ernakulam 0.0 61.0 84.5
Idukki 3.6 64.8 73.2
Kannur 3.1 86.8 77.4
Kasargod 0.6 68.0 71.9
Kollam 0.0 95.2 76.9
Kottayam 0.4 78.1 86.5
District
Std III to V childrenAll
Children
% Out-of-
school
% CAN
read
level - 2
% CAN
solve
subtraction
Kozhikode 3.5 84.3 68.2
Malappuram 0.8 48.6 68.8
Palakkad 4.6 81.9 77.0
Pathanamthitta 1.6 82.9 81.3
Thiruvananthapuram 1.6 70.6 69.8
Thrissur 0.5 62.8 74.9
Wayanad 1.8 70.3 66.3
District
Std III to V children
Kerla state 1.6 72.0 75.7

44%
56%
46%54%
Gender differences
Out-of-school children
Enrollment
All analyses based on data from 28 out of 29 districts
Age 11-14Age 6-10
TAMIL NADU RURAL
Out-of-school children: Proportion of girls and boys.Percentage of boys and girls in government and private schools
Gender differencesGender differences
106 ASER 2005
20+
15 - 20
10 - 15
5 - 10
3 - 5
0 - 3
No data
Percentage of children
% Children in each age group in different
types of schools
% Children in each age
group not in school
Government Private Madarsa EGSNever
EnrolledDrop Out
Age : 6-14 ALL 78.3 18.4 0.7 0.0 0.3 2.3 100
Age : 6-10 ALL 79.2 19.5 0.7 0.0 0.3 0.4 100
Age : 11-14 ALL 77.6 16.9 0.7 0.0 0.4 4.4 100
Age : 6-10 BOYS 78.9 19.8 0.7 0.0 0.3 0.4 100
Age : 6-10 GIRLS 79.5 19.1 0.6 0.0 0.3 0.4 100
Age : 11-14 BOYS 77.4 17.9 0.5 0.0 0.3 3.9 100
Age : 11-14 GIRLS 77.8 16.0 0.9 0.0 0.4 4.9 100
Total
0
20
40
60
80
100
Boys Girls Boys Girls
Govt school Pvt school
Children 6-14
PONDICHERRY
CHENNAI
Coimbatore
Tirunelveli
Thoothukkudi
RamanathapuramVirudunagar
ShivagangaMaduraiTheni
Dindigul
Pudukkottai
Thanjavur
Karur Tiruchirappalli
Nagapattinam
Thiruvarur
Karaikal (PONDICHERRY)
Erode
Namakkal Perambalur
AriyalurNagapattinam
Salem
Dharmapuri
Tiruvannamalai
Villupuram
Cuddalore
VelloreKancheepuram
Thiruvallur
Kanyakumari
The Nilgiris

TAMIL NADU RURAL
Performance of top five and bottom five districts in state based on % all children Std V
Comparison of government and private schools
based on % Std. V children who CAN read level-2
and solve written numerical sums
Reading Arithmetic
Children who CAN read and solve numerical written sums Learning curves
**Level - 2: Ability to read a 'story' text with some long sentences of std 2 level difficulty.
* Level - 1: Ability to read a small paragraph with short sentences of std 1 level difficulty.
Division: 3 digit divided by 1 digit.
Subtraction: 2 digit subtraction with borrowing.
Learning
% Children who CANNOT read ...% Children who CANNOT solve numerical
written sums of ...
107ASER 2005
Level 1* Level 2**Subtraction or
DivisionDivision
Age : 7-14 ALL 30.9 49.3 36.9 66.8
Age : 7-10 ALL 45.8 66.5 51.6 82.3
Age : 11-14 ALL 14.3 30.2 20.7 49.6
Govt : Std II-V 49.5 70.1 55.4 84.6
Pvt : Std II-V 43.0 60.4 47.4 77.6
Govt : Std VI-VIII 15.4 32.1 21.9 53.7
Pvt : Std VI-VIII 9.4 26.1 14.4 39.0
Std Nothing Letter Word Para-
Level I
Story-
Level IITotal
I 45.8 31.1 17.3 2.0 3.9 100
II 22.5 27.1 31.0 9.6 9.9 100
III 11.5 17.8 31.2 18.2 21.2 100
IV 6.4 10.3 20.9 24.5 37.8 100
V 4.4 5.3 15.4 24.3 50.7 100
VI 3.5 4.8 12.2 20.1 59.4 100
VII 2.3 2.8 6.9 16.7 71.3 100
VIII 1.8 1.9 5.3 12.6 78.4 100
Total 10.3 11.4 17.5 17.3 43.6 100
Std NothingNumber
recogn
Subtracti
onDivision Total
I 55.2 37.4 6.0 1.5 100
II 31.8 51.4 14.1 2.7 100
III 16.5 47.4 28.6 7.6 100
IV 9.8 34.6 36.6 19.0 100
V 6.9 26.4 34.9 31.8 100
VI 4.9 20.8 34.9 39.4 100
VII 3.7 16.1 28.4 51.9 100
VIII 3.0 11.7 28.3 57.1 100
Total 14.0 30.2 28.1 27.7 100
% All school children who can solve written
numerical sums - standardwise
Reading Arithmetic
Top - 5 Top - 5
The Nilgiris 33.0 The Nilgiris 11.6
Dindigul 38.4 Dindigul 19.0
Kanyakumari 39.6 Theni* 20.4
Ariyalur* 41.2 Pudukkottai 28.2
Tirunelveli 46.0 Tirunelveli 32.7
Bottom - 5 Bottom - 5
Theni* 86.6 Erode 66.7
Tiruvannamalai 80.3 Cuddalore 66.2
Thiruvallur 79.5 Viluppuram 64.1
Salem 78.5 Perambalur* 62.6
Shivaganga 78.3 Ramanathapuram 61.9
% std III to
V CANNOT
solve
subtraction
% std III to
V CANNOT
read level-2
48.4
60.4
29.9
41.2
0
10
20
30
40
50
60
70
Govt Pvt Govt Pvt
Std. V level-2 Reading Std. V can solve Division
% All school children who can read-standardwise

Type of
school by
enrollment
%
Schools
visited
Std
I-V
rooms
Type of
school by
enrollment
%
Schools
visited
Std
I-VIII
rooms
<=50 19 2.0 <=150 17 4.5
51-75 16 2.3 151-250 28 6.0
76-150 33 3.0 251-350 26 8.7
151-225 17 5.1 351-450 13 8.9
>225 15 7.2 >450 16 14.0
Average number of rooms available
Teachers, children, and classrooms
Provision and use
TAMIL NADU RURAL
108 ASER 2005
% of schools with no water/toilet provision
% of schools with water/toilet provision but not useable
% of schools with water/toilet provision and useable
Water & toilet provision and use (%)
Schools Std. I-V Schools Std. I-VIII
Textbooks and midday meals (%)
Schools Std. I-V Schools Std. I-VIII
Pe
rce
nta
ge
of sc
ho
ols
97.2
83.5
97.3
84.7
0
20
40
60
80
100
Schools
where most
(75%) of
children in Std
5 have
textbooks
Midday meal
available
Schools
where most
(75%) of
children in Std
5 have
textbooks
Midday meal
available
Pupil-teacher ratio (PTR)
Media
n fig
ure
s
Schools Std. I-V Schools Std. I - VIII
33.336.0 34.3 35.9
0
10
20
30
40
50
PTR based onenrollment
PTR based onattendance on
day of visit
PTR based onenrollment
PTR based onattendance on
day of visit
Std.
I-IV/V
Std.
I - VIII
Total number of schools
visited 283 192
% teachers attending
(average) 78.2 79.4
% of schools with NO
teachers present5.7 5.2
% of schools with ALL
teachers present 52.7 33.9
Teachers' attendance
Schools with:
Std.
I-IV/V
Std.
I - VIII
Total number of schools
visited 283 190
% enrolled children
attending (average) 86.6 85.9
Children's attendance
Schools with:
% of schools with less
than 50% of enrolled
children attending
6.0 4.7
0
20
40
60
80
100
Water facility
and use
Toilet provision
and use
Water facility
and use
Toilet provision
and use
Pe
rce
nta
ge
of sch
oo
ls

Performance of all districts
TAMIL NADU RURAL
109ASER 2005
Tamil Nadu State 13.1 53.6 74.7
All
Children
% Out-of-
school
% CAN
read
level - 2
% CAN
solve
subtraction
Ariyalur* 2.7 58.8 64.7
Coimbatore 1.0 37.6 51.9
Cuddalore 4.6 43.9 33.8
Dharmapuri 3.0 42.4 53.5
Dindigul 0.8 61.6 81.0
Erode 3.3 22.2 33.3
Kancheepuram 1.0 25.1 57.9
Kanyakumari 1.1 60.4 59.2
Karur* 8.5 40.5 62.7
Madurai 2.2 48.7 54.8
Nagapattinam* 2.7 29.6 54.1
Perambalur* 1.5 24.7 37.4
Pudukkottai 7.1 50.0 71.8
Ramanathapuram 2.2 36.6 38.1
District
Std III to V childrenAll
Children
% Out-of-
school
% CAN
read
level - 2
% CAN
solve
subtraction
Salem 3.2 21.5 58.8
Shivaganga 0.3 21.7 55.0
Thanjavur 1.7 40.2 43.5
Theni* 1.5 13.4 79.6
The Nilgiris 1.7 67.0 88.4
Thiruvallur 1.9 20.5 38.4
Thiruvarur 1.1 24.8 54.8
Thoothukkudi 2.8 41.6 63.4
Tiruchirappalli 2.1 36.9 58.5
Tirunelveli 0.6 54.0 67.3
Tiruvannamalai 1.6 19.7 46.1
Vellore 4.0 45.6 48.2
Villupuram 4.0 23.3 35.9
Virudunagar 7.5 23.0 51.2
District
Std III to V children


Tripura
Assam
Meghalay
Manipur
Nagaland
Arunachal Pradesh
Note : Arunachal Pradesh, Assam, Manipur, Meghalaya, Nagaland and Tripura have beenallocated two instead of four pages due to partial coverage of districts Mizoram was not covered.

% Children in each age group in different
types of schools
% Children in each age
group not in school
All analyses based on data from 1 out of 4 districts
TRIPURA RURAL
Out-of-school children
Enrollment
20+
15 - 20
10 - 15
5 - 10
3 - 5
0 - 3
No data
Percentage of children
Government Private Madarsa EGSNever
EnrolledDrop Out
Age : 6-14 ALL 96.0 1.6 0.0 0.7 0.5 1.3 100
Age : 6-10 ALL 96.9 2.2 0.0 0.4 0.0 0.4 100
Age : 11-14 ALL 97.2 0.9 0.0 0.0 0.0 1.9 100
Age : 6-10 BOYS 96.2 2.9 0.0 1.0 0.0 0.0 100
Age : 6-10 GIRLS 97.5 1.6 0.0 0.0 0.0 0.8 100
Age : 11-14 BOYS 97.6 1.6 0.0 0.0 0.0 0.8 100
Age : 11-14 GIRLS 96.6 0.0 0.0 0.0 0.0 3.5 100
Total
0%
100%
Age 11-14Age 6-10
25%
75%
Out-of-school children: Proportion of girls and boys.Percentage of boys and girls in government and private schools
Gender differences
112 ASER 2005
0
20
40
60
80
100
Boys Girls Boys Girls
Govt school Pvt school
Children 6-14
AGARTHALA
North Tripura
South Tripura
Dhalai
Kailashahar
West Tripura

TRIPURA RURAL
Comparison of government and private schools
based on % Std. V children who CAN read level-2
and solve written numerical sums
Reading Arithmetic
Children who CAN read and solve numerical written sums Learning curves
**Level - 2: Ability to read a 'story' text with some long sentences of std 2 level difficulty.
* Level - 1: Ability to read a small paragraph with short sentences of std 1 level difficulty.
Division: 3 digit divided by 1 digit.
Subtraction: 2 digit subtraction with borrowing.
Performance of surveyed districts
Learning
113ASER 2005
Level 1* Level 2**Subtraction or
DivisionDivision
Age : 7-14 ALL 18.4 34.4 22.1 59.1
Age : 7-10 ALL 29.2 47.4 31.8 78.3
Age : 11-14 ALL 8.0 22.0 13.0 41.0
Govt : Std II-V 18.9 38.6 22.3 66.2
Pvt : Std II-V 0.0 0.0 0.0 0.0
Govt : Std VI-VIII 1.0 10.3 4.2 27.4
Pvt : Std VI-VIII 0.0 0.0 0.0 0.0
Std Nothing Letter Word Para-
Level I
Story-
Level IITotal
I 0.0 25.0 36.5 17.3 21.2 100
II 3.5 15.8 15.8 22.8 42.1 100
III 2.5 7.6 19.0 15.2 55.7 100
IV 0.0 3.0 4.6 25.8 66.7 100
V 0.0 0.0 1.6 14.8 83.6 100
VI 0.0 0.0 0.0 13.2 86.8 100
VII 0.0 0.0 4.6 4.6 90.9 100
VIII 0.0 0.0 0.0 4.6 95.5 100
Total 1.0 7.3 11.7 16.8 63.4 100
Std NothingNumber
recogn
Subtracti
onDivision Total
I 10.0 54.0 34.0 2.0 100
II 14.0 29.8 43.9 12.3 100
III 6.4 18.0 50.0 25.6 100
IV 0.0 10.6 45.5 43.9 100
V 7.9 3.2 31.8 57.1 100
VI 1.9 3.8 22.6 71.7 100
VII 0.0 0.0 38.1 61.9 100
VIII 0.0 4.8 9.5 85.7 100
Total 5.9 17.1 37.4 39.6 100
% All school children who can solve written
numerical sums - standardwise
All
Children
% Out-of-
school
% CAN
read
level - 2
% CAN solve
subtraction
SouthTripura 1.8 67.5 84.1
Tripura state 1.8 67.5 84.1
District
Std III to V children83.3
100.0
56.5
100.0
0
20
40
60
80
100
120
Govt Pvt Govt Pvt
Std. V level-2 Reading Std. V can solve Division
% All school children who can read-standardwise

57%
43%51%49%
ASSAMAll analyses based on data from 8 out of 23 districts
Age 11-14Age 6-10
RURAL
Out-of-school children: Proportion of girls and boys.Percentage of boys and girls in government and private schools
Gender differences
Out-of-school children
Enrollment
114 ASER 2005
20+
15 - 20
10 - 15
5 - 10
3 - 5
0 - 3
No data
Percentage of children
Government Private Madarsa EGSNever
EnrolledDrop Out
Age : 6-14 ALL 77.5 13.7 0.7 0.6 4.4 3.1 100
Age : 6-10 ALL 82.1 12.5 0.6 0.7 2.8 1.3 100
Age : 11-14 ALL 69.4 15.6 1.1 0.3 7.1 6.6 100
Age : 6-10 BOYS 82.3 12.3 1.0 0.7 2.4 1.3 100
Age : 6-10 GIRLS 82.0 12.7 0.1 0.6 3.3 1.3 100
Age : 11-14 BOYS 68.2 15.8 1.4 0.2 7.4 7.0 100
Age : 11-14 GIRLS 70.9 15.3 0.7 0.4 6.7 6.0 100
% Children in each age group in different
types of schools
% Children in each age
group not in schoolTotal
0
20
40
60
80
100
Boys Girls Boys Girls
Govt school Pvt school
Children 6-14
DISPUR
Kokrajhar
Borpeta
Nalbari
GoalparaDhubri
Nagoan
Karimganj
Hailakandi
Karbi Anglang
Jorhat
Sibsagar
Dibrugarh
Dhemaji
Sonitpur
North Cachar Hills
Cachar
Kamrup
Bongaigaon
Darrang
Tinsukia
Golaghat
Lakhimpur
Morigaon
KarbiAnglang
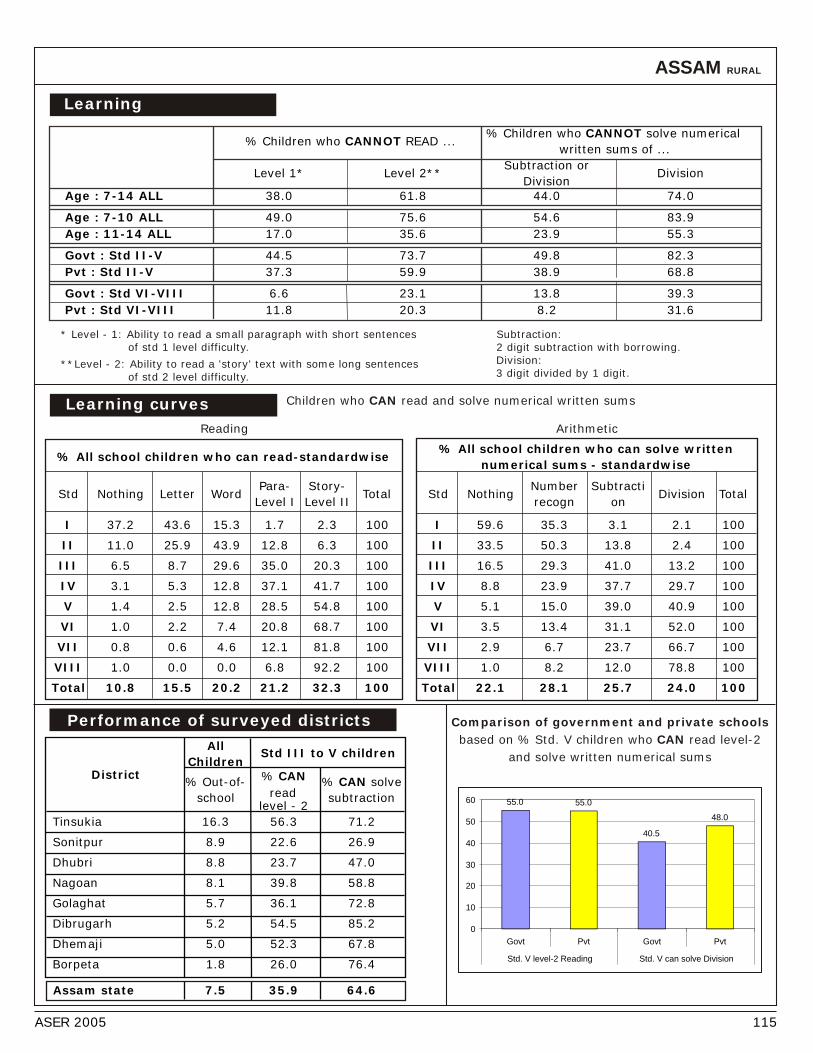
Std Nothing Letter Word Para-
Level I
Story-
Level IITotal
I 37.2 43.6 15.3 1.7 2.3 100
II 11.0 25.9 43.9 12.8 6.3 100
III 6.5 8.7 29.6 35.0 20.3 100
IV 3.1 5.3 12.8 37.1 41.7 100
V 1.4 2.5 12.8 28.5 54.8 100
VI 1.0 2.2 7.4 20.8 68.7 100
VII 0.8 0.6 4.6 12.1 81.8 100
VIII 1.0 0.0 0.0 6.8 92.2 100
Total 10.8 15.5 20.2 21.2 32.3 100
ASSAM RURAL
Comparison of government and private schools
based on % Std. V children who CAN read level-2
and solve written numerical sums
Reading Arithmetic
Children who CAN read and solve numerical written sums Learning curves
**Level - 2: Ability to read a 'story' text with some long sentences of std 2 level difficulty.
* Level - 1: Ability to read a small paragraph with short sentences of std 1 level difficulty.
Division: 3 digit divided by 1 digit.
Subtraction: 2 digit subtraction with borrowing.
Performance of surveyed districts
Learning
115ASER 2005
% Children who CANNOT solve numerical
written sums of ...
Level 1* Level 2**Subtraction or
DivisionDivision
Age : 7-14 ALL 38.0 61.8 44.0 74.0
Age : 7-10 ALL 49.0 75.6 54.6 83.9
Age : 11-14 ALL 17.0 35.6 23.9 55.3
Govt : Std II-V 44.5 73.7 49.8 82.3
Pvt : Std II-V 37.3 59.9 38.9 68.8
Govt : Std VI-VIII 6.6 23.1 13.8 39.3
Pvt : Std VI-VIII 11.8 20.3 8.2 31.6
% Children who CANNOT READ ...
Std NothingNumber
recogn
Subtracti
onDivision Total
I 59.6 35.3 3.1 2.1 100
II 33.5 50.3 13.8 2.4 100
III 16.5 29.3 41.0 13.2 100
IV 8.8 23.9 37.7 29.7 100
V 5.1 15.0 39.0 40.9 100
VI 3.5 13.4 31.1 52.0 100
VII 2.9 6.7 23.7 66.7 100
VIII 1.0 8.2 12.0 78.8 100
Total 22.1 28.1 25.7 24.0 100
% All school children who can solve written
numerical sums - standardwise
All
Children
% Out-of-
school
% CAN
read level - 2
% CAN solve
subtraction
Tinsukia 16.3 56.3 71.2
Sonitpur 8.9 22.6 26.9
Dhubri 8.8 23.7 47.0
Nagoan 8.1 39.8 58.8
Golaghat 5.7 36.1 72.8
Dibrugarh 5.2 54.5 85.2
Dhemaji 5.0 52.3 67.8
Borpeta 1.8 26.0 76.4
Assam state 7.5 35.9 64.6
District
Std III to V children
55.0 55.0
40.5
48.0
0
10
20
30
40
50
60
Govt Pvt Govt Pvt
Std. V level-2 Reading Std. V can solve Division
% All school children who can read-standardwise

61%
39%
63%
37%
All analyses based on data from 2 out of 7 districts
Age 11-14Age 6-10
0
20
40
60
80
100
Boys Girls Boys Girls
Govt school Pvt school
MEGHALAYA RURAL
Out-of-school children: Proportion of girls and boys.Percentage of boys and girls in government and private schools
Gender differences
Out-of-school children
Enrollment
116 ASER 2005
20+
15 - 20
10 - 15
5 - 10
3 - 5
0 - 3
No data
Percentage of children
% Children in each age group in different
types of schools
% Children in each age
group not in school
Government Private Madarsa EGSNever
Drop Out
Age : 6-14 ALL 48.4 41.9 0.0 1.5 5.2 3.0 100
Age : 6-10 ALL 47.3 44.5 0.0 1.7 5.5 1.1 100
Age : 11-14 ALL 50.3 38.2 0.0 1.1 4.9 5.5 100
Age : 6-10 BOYS 46.3 43.7 0.0 2.4 6.5 1.1 100
Age : 6-10 GIRLS 48.3 45.4 0.0 0.9 4.3 1.1 100
Age : 11-14 BOYS 50.5 36.6 0.0 0.7 4.8 7.4 100
Age : 11-14 GIRLS 50.1 40.0 0.0 1.5 5.0 3.4 100
Total
SHILLONG
West Garo Hills
South Garo Hills
East Garo Hills
West Khasi Hills
Ri Bhoi
Jaintia HillsEast Khasi Hills

MEGHALAYA RURAL
Comparison of government and private schools
based on % Std. V children who CAN read level-2
and solve written numerical sums
Reading Arithmetic
Performance of surveyed districts
Children who CAN read and solve numerical written sums Learning curves
**Level - 2: Ability to read a 'story' text with some long sentences of std 2 level difficulty.
* Level - 1: Ability to read a small paragraph with short sentences of std 1 level difficulty.
Division: 3 digit divided by 1 digit.
Subtraction: 2 digit subtraction with borrowing.
Learning
% Children who CANNOT read ...% Children who CANNOT solve numerical
written sums of ...
117
Level 1* Level 2**Subtraction or
DivisionDivision
Age : 7-14 ALL 32.5 40.3 34.6 61.3
Age : 7-10 ALL 46.1 55.7 51.6 81.8
Age : 11-14 ALL 18.3 24.2 17.7 40.9
Govt : Std II-V 25.1 33.5 31.0 64.7
Pvt : Std II-V 17.3 27.0 22.5 58.3
Govt : Std VI-VIII 6.2 15.5 3.1 33.5
Pvt : Std VI-VIII 0.0 0.0 0.0 5.9
Std NothingNumber
recogn
Subtracti
onDivision Total
I 18.5 63.1 17.9 0.4 100
II 18.2 39.6 34.0 8.2 100
III 10.0 10.3 46.3 33.3 100
IV 6.3 11.5 30.4 51.8 100
V 1.8 3.6 23.6 71.1 100
VI 0.0 2.9 24.5 72.6 100
VII 0.0 0.0 16.2 83.8 100
VIII 0.0 0.0 7.2 92.8 100
Total 10.1 25.2 27.6 37.2 100
% All school children who can solve written
numerical sums - standardwise
Std Nothing Letter Word Para-
Level I
Story-
Level IITotal
I 2.2 31.2 43.6 10.5 12.6 100
II 1.8 5.3 37.5 15.7 39.7 100
III 0.0 2.0 16.6 10.9 70.5 100
IV 0.5 1.6 10.6 3.4 84.0 100
V 0.0 0.0 4.8 4.8 90.4 100
VI 0.0 0.0 1.5 7.3 91.2 100
VII 0.0 0.0 3.9 3.9 92.2 100
VIII 0.0 0.0 4.8 0.0 95.2 100
Total 0.9 8.9 22.0 8.6 59.5 100
All Children
% Out-of-
school
% CAN read
level - 2
% CAN solve
subtraction
East Khasi Hills 12.6 86.6 81.7
West Garo Hills 3.5 73.6 87.2
Meghalaya state 8.1 80.6 84.3
District
Std III to V children82.6
98.3
60.3
81.6
0
20
40
60
80
100
120
Govt Pvt Govt Pvt
Std. V level-2 Reading Std. V can solve Division
ASER 2005
% All school children who can read-standardwise

45%
55%49%51%
All analyses based on data from 3 out of 9 districts
Age 11-14Age 6-10
0
20
40
60
80
100
Boys Girls Boys Girls
Govt school Pvt school
MANIPUR RURAL
Out-of-school children: Proportion of girls and boys.Percentage of boys and girls in government and private schools
Gender differences
Out-of-school children
Enrollment
118 ASER 2005
20+
15 - 20
10 - 15
5 - 10
3 - 5
0 - 3
No data
Percentage of children
% Children in each age group in different
types of schools
% Children in each age
group not in school
Government Private Madarsa EGSNever
Drop Out
Age : 6-14 ALL 33.7 52.3 0.0 0.3 10.5 3.3 100
Age : 6-10 ALL 36.6 58.3 0.0 0.4 3.5 1.1 100
Age : 11-14 ALL 35.3 53.6 0.0 0.0 4.3 6.8 100
Age : 6-10 BOYS 34.6 60.4 0.0 0.6 3.0 1.4 100
Age : 6-10 GIRLS 38.7 56.1 0.0 0.3 4.1 0.9 100
Age : 11-14 BOYS 30.9 59.1 0.0 0.0 4.2 5.8 100
Age : 11-14 GIRLS 39.6 48.3 0.0 0.0 4.3 7.9 100
Total
IMPHAL East
ChurachandpurChandel
ThoubalBishnupur
Imphal West
Ukhrul
Senapati
Tamenglong

MANIPUR RURAL
Comparison of government and private schools
based on % Std. V children who CAN read level-2
and solve written numerical sums
Reading Arithmetic
Children who CAN read and solve numerical written sums Learning curves
**Level - 2: Ability to read a 'story' text with some long sentences of std 2 level difficulty.
* Level - 1: Ability to read a small paragraph with short sentences of std 1 level difficulty.
Division: 3 digit divided by 1 digit.
Subtraction: 2 digit subtraction with borrowing.
Performance of surveyed districts
Learning
% Children who CANNOT read ...% Children who CANNOT solve numerical
written sums of ...
119
Level 1* Level 2**Subtraction or
DivisionDivision
Age : 7-14 ALL 42.3 57.1 39.9 65.9
Age : 7-10 ALL 53.4 69.4 52.2 80.6
Age : 11-14 ALL 29.3 42.8 25.7 48.9
Govt : Std II-V 48.2 62.5 40.3 71.4
Pvt : Std II-V 28.1 48.5 27.8 65.7
Govt : Std VI-VIII 13.9 23.4 15.6 37.3
Pvt : Std VI-VIII 4.7 10.9 6.0 18.1
Std Nothing Letter Word Para-
Level I
Story-
Level IITotal
I 21.3 20.2 28.2 15.0 15.3 100
II 12.3 18.4 29.2 18.6 21.5 100
III 7.5 8.9 21.4 16.8 45.5 100
IV 5.3 3.2 13.4 20.8 57.4 100
V 2.2 2.2 5.6 15.7 74.3 100
VI 4.9 0.0 1.6 11.6 81.9 100
VII 6.1 0.0 0.0 3.2 90.7 100
VIII 9.9 0.0 0.0 0.0 90.1 100
Total 10.6 10.7 18.7 15.7 44.4 100
Std NothingNumber
recogn
Subtracti
onDivision Total
I 31.5 43.9 12.7 11.9 100
II 16.9 35.4 36.6 11.1 100
III 9.9 25.2 35.4 29.4 100
IV 6.9 11.9 35.9 45.3 100
V 3.1 10.1 30.5 56.3 100
VI 4.0 2.4 18.6 74.9 100
VII 6.1 3.4 9.3 81.1 100
VIII 9.9 2.3 11.1 76.7 100
Total 14.4 24.7 26.9 34.0 100
% All school children who can solve written
numerical sums - standardwise
All
Children
% Out-of-
school
% CAN
read level - 2
% CAN solve
subtraction
Churachandpur 1.3 82.3 88.7
Bishnupur 20.3 57.0 66.7
Ukhrul 24.0 21.5 63.4
Manipur state 13.7 57.1 75.9
District
Std III to V children
67.7
77.9
60.054.5
0
10
20
30
40
50
60
70
80
90
Govt Pvt Govt Pvt
Std. V level-2 Reading Std. V can solve Division
ASER 2005
% All school children who can read-standardwise

All analyses based on data from 2 out of 8 districts
NAGALAND RURAL
Out-of-school children
Enrollment
20+
15 - 20
10 - 15
5 - 10
3 - 5
0 - 3
No data
Percentage of children
% Children in each age group in different
types of schools
% Children in each age
group not in school
Government Private Madarsa EGSNever
EnrolledDrop Out
Age : 6-14 ALL 70.9 10.2 0.0 0.0 7.3 11.5 100
Age : 6-10 ALL 79.5 10.8 0.0 0.0 7.2 2.5 100
Age : 11-14 ALL 60.0 9.9 0.0 0.0 8.6 21.5 100
Age : 6-10 BOYS 78.9 11.4 0.0 0.0 7.4 2.4 100
Age : 6-10 GIRLS 80.3 10.1 0.0 0.0 7.0 2.6 100
Age : 11-14 BOYS 62.9 9.6 0.0 0.0 6.4 21.1 100
Age : 11-14 GIRLS 55.9 10.4 0.0 0.0 11.7 22.1 100
Total
54%46%
56%
44%
Age 11-14Age 6-10
Out-of-school children: Proportion of girls and boys.Percentage of boys and girls in government and private schools
Gender differences
120 ASER 2005
0
20
40
60
80
100
Boys Girls Boys Girls
Govt school Pvt school
Children 6-14
KOHIMA
Phek
ZunhebotoWokha
Mokokchung
Tuensang
Mon
Dimapur

NAGALAND RURAL
Comparison of government and private schools
based on % Std. V children who CAN read level-2
and solve written numerical sums
Reading Arithmetic
Children who CAN read and solve numerical written sums Learning curves
**Level - 2: Ability to read a 'story' text with some long sentences of std 2 level difficulty.
* Level - 1: Ability to read a small paragraph with short sentences of std 1 level difficulty.
Division: 3 digit divided by 1 digit.
Subtraction: 2 digit subtraction with borrowing.
Performance of surveyed districts
Learning
% Children who CANNOT read ...% Children who CANNOT solve numerical
written sums of ...
121
Level 1* Level 2**Subtraction or
DivisionDivision
Age : 7-14 ALL 37.9 64.8 37.6 77.4
Age : 7-10 ALL 53.0 79.1 50.7 87.0
Age : 11-14 ALL 19.0 46.8 21.1 65.3
Govt : Std II-V 31.6 62.4 32.4 75.8
Pvt : Std II-V 12.0 48.5 21.6 61.8
Govt : Std VI-VIII 17.4 42.8 9.5 48.0
Pvt : Std VI-VIII
Std Nothing Letter Word Para-
Level I
Story-
Level IITotal
I 8.4 35.8 34.7 11.5 9.6 100
II 2.0 14.7 27.7 41.2 14.5 100
III 1.5 10.5 15.0 31.7 41.4 100
IV 0.7 7.2 10.7 20.1 61.3 100
V 0.0 0.0 3.0 15.6 81.4 100
VI 0.0 6.0 9.9 5.0 79.2 100
VII 0.0 0.0 26.3 10.5 63.2 100
VIII 0.0 0.0 0.0 42.9 57.1 100
Total 3.1 16.5 21.7 25.6 33.2 100
Std NothingNumber
recogn
Subtracti
onDivision Total
I 20.1 55.0 20.0 4.9 100
II 7.2 41.0 42.8 9.0 100
III 3.4 23.8 47.3 25.5 100
IV 0.0 18.8 37.7 43.5 100
V 0.0 6.4 44.0 49.7 100
VI 0.0 11.5 36.4 52.0 100
VII 0.0 11.1 22.2 66.7 100
VIII 0.0 0.0 30.0 70.0 100
Total 7.6 33.4 36.4 22.5 100
% All school children who can solve written
numerical sums - standardwise
All
Children
% Out-of-
school
% CAN read
level - 2
% CAN solve
subtraction
Dimapur* 21.8 48.7 79.9
Mon 15.5 56.5 74.7
Nagaland state 18.9 52.2 77.7
District
Std III to V children 86.5
71.3
34.4
73.7
0
10
20
30
40
50
60
70
80
90
100
Govt Pvt Govt Pvt
Std. V level-2 Reading Std. V can solve Division
ASER 2005
% All school children who can read-standardwise

58%
42%39%
61%
ARUNACHAL PRADESHAll analyses based on data from 3 out of 11 districts
Age 11-14Age 6-10
RURAL
Out-of-school children: Proportion of girls and boys.Percentage of boys and girls in government and private schools
Gender differences
Out-of-school children
Enrollment
122 ASER 2005
20+
15 - 20
10 - 15
5 - 10
3 - 5
0 - 3
No data
Percentage of children
Government Private Madarsa EGSNever
EnrolledDrop Out
Age : 6-14 ALL 81.4 13.4 0.0 0.2 3.1 1.8 100
Age : 6-10 ALL 82.1 14.9 0.0 0.1 2.1 0.8 100
Age : 11-14 ALL 85.9 9.1 0.0 0.6 1.9 2.5 100
Age : 6-10 BOYS 81.2 16.6 0.0 0.2 1.1 1.0 100
Age : 6-10 GIRLS 83.3 12.9 0.0 0.0 3.3 0.5 100
Age : 11-14 BOYS 84.5 10.6 0.0 0.0 2.1 2.8 100
Age : 11-14 GIRLS 87.4 7.6 0.0 1.1 1.7 2.2 100
% Children in each age group in different
types of schools
% Children in each age
group not in schoolTotal
0
20
40
60
80
100
Boys Girls Boys Girls
Govt school Pvt school
Children 6-14
Khonsa
Changlang
Tawang
YingkiongAnini
Tezu
West Kameng
East KamengPapum Pare
Lower Subansiri
Upper Subansiri
East Siang
Upper Siang
West Siang

ARUNACHAL PRADESH RURAL
Comparison of government and private schools
based on % Std. V children who CAN read level-2
and solve written numerical sums
Reading Arithmetic
Performance of surveyed districts
Children who CAN read and solve numerical written sums Learning curves
**Level - 2: Ability to read a 'story' text with some long sentences of std 2 level difficulty.
* Level - 1: Ability to read a small paragraph with short sentences of std 1 level difficulty.
Division: 3 digit divided by 1 digit.
Subtraction: 2 digit subtraction with borrowing.
Learning
123
% Children who CANNOT solve numerical
written sums of ...
Level 1* Level 2**Subtraction or
DivisionDivision
Age : 7-14 ALL 35.9 51.7 21.9 53.0
Age : 7-10 ALL 50.9 65.9 31.0 66.2
Age : 11-14 ALL 14.6 31.3 9.1 34.3
Govt : Std II-V 39.5 56.2 23.7 63.4
Pvt : Std II-V 28.2 37.9 8.9 44.3
Govt : Std VI-VIII 0.6 15.5 0.6 18.2
Pvt : Std VI-VIII 0.0 7.4 0.0 7.0
% Children who CANNOT READ ...
Std NothingNumber
recogn
Subtracti
onDivision Total
I 21.7 47.6 17.7 13.1 100
II 7.7 32.2 38.9 21.2 100
III 3.0 19.8 47.6 29.6 100
IV 3.7 8.3 33.5 54.5 100
V 4.5 2.4 34.2 58.9 100
VI 0.0 0.0 21.9 78.1 100
VII 0.0 1.3 17.8 80.9 100
VIII 0.0 0.0 2.8 97.2 100
Total 7.6 21.1 31.3 40.1 100
% All school children who can solve written
numerical sums - standardwise
Std Nothing Letter Word Para-
Level I
Story-
Level IITotal
I 19.7 37.4 31.8 3.5 7.6 100
II 7.5 22.4 36.4 13.4 20.3 100
III 3.3 7.7 36.8 16.1 36.2 100
IV 3.7 1.5 10.2 15.8 68.9 100
V 5.6 1.7 3.0 20.8 68.9 100
VI 0.0 0.0 0.0 24.5 75.5 100
VII 0.0 1.3 0.0 7.7 91.1 100
VIII 0.0 0.0 0.0 6.9 93.1 100
Total 7.2 13.5 21.6 13.3 44.4 100
All Children
% Out-of-
school
% CAN read
level - 2
% CAN solve
subtraction
Papum Pare* 9.1 36.1 75.5
East Siang 2.3 63.3 89.3
West Kameng 2.3 57.8 85.6
Arunachal PradeshState
5.0 55.0 84.8
District
Std III to V children
69.5 69.5
57.6
79.5
0
10
20
30
40
50
60
70
80
90
Govt Pvt Govt Pvt
Std. V level-2 Reading Std. V can solve Division
ASER 2005
% All school children who can read-standardwise

Support in cash and in kind
124 ASER 2005
More than one district supported
1 Aditi Aanchal
2 Arjun Saxena
3 Ashok Kamat
4 Abhijit Banerjee
5 Calcutta Foundation
6 Coca-Cola (Thailand)
7 ECAT-Bodhgram
8 Lalita Gopikrishna Piramal,
Anand Piramal
9 Gujarat State Petroleum Corporation
10 Kabir Mukaddam
11 Khan Bahadur Babukhan Foundation
12 Mehmood Khan
13 MicroInk
14 Nandvimal Memorial Trust
15 Naren Rau
16 Pawan Mehra
17 Pratham USA
18 Ramachandra Guha
19 Rukmini Banerji
20 PDCORP Limited, Jaipur
21 Ramachandra Guha
22 Reliance Industries
23 SRF Limited
24 T. V. Mohandas Pai
25 Torrent
26 Consul General of France
One district supported
27 A. Karati
28 Amul
29 Anand Padi
30 Anupam Patel
31 Anuradha B Hegde
32 Anuradha De
33 Aravali Institute of Management
34 Arun Chadavarkar
35 Arvind Amin
36 Ashish Karamchandani
37 Ashok Kotwal
38 Balakrishnan V
39 Bharat Patni
40 Chaitanya Divgi
41 C.V. Madhukar
42 Dipankar Purkayastha
43 Gautam Thakar
44 Harish Manwani
45 K. S. Varadhachary
46 K.B. Kothari
47 Kavita Ramdas and Zulfigar Ahmad
48 Kirits Parikh
49 Kush Wadhwa
50 Lalit Nirula
51 Lalit Wangikar
52 M. K. Bannerjee
53 M. Rajalakshmi
54 M. Rajan
55 Maitreyee Das
56 M. R. Madhavan
57 Madhav Chavan
58 Manoj Seshan
59 Meenakshi Mukherji
60 Mohan Jain
61 Mohan Ramachandran
62 Mukesh Eswaran
63 Mukul Chadda
64 Murthy Rajan
65 Muzaffar A. Chishti
66 Nandan Nilekani
67 Naveen Tahilyani
68 Nihar Kothari
69 Nikhil Prasad Ojha
70 Nilanjan Adhya
71 Niren Shah
72 P. J. Rajan
73 Parul Banerjee
74 Pradeep Parmeswaran
75 Prem Anand Bhatia
76 Prerana
77 R. Venkatesh Babu
78 Rahul Bedi
79 Rajesh Begur
80 Rakesh Varma
81 Rakshat Hooja
82 Raman Patel
83 Ramesh Mangaleshwaran
84 Ravindranath Madhavan
85 Rima Hooja
86 Rohini Mukherjee
87 Rohini Nilekani
88 Sanchar Infotech Pvt. Ltd
89 Sankalp Bhauuddeshiy Prakalp
90 Sarang Deo
91 Satprit Duggal
92 S Pradhan
93 Srinivas Rao
94 Siddharth kothari
95 Siddharth Thacker
96 Sidmark Sales Pvt. Ltd
97 Snehal Kulkarni
98 Sridhar Komandur
99 Sukeshi Dillon Sondhi
100 Sunil Chandra
101 Sunit Tilva
102 Suprabaht Mahila Mandal
103 Suvir Kaul
104 Suzanne Berger & Daniel Keniston
105 Suzanne Singh
106 Tanvi and Atul Varadhachary
107 Trans Corp.International Ltd.
108 Usha Mohan
109 Usha Rane
110 V. Mangaleshwaran
111 V. Ravichandar
112 Venkatesh Chittari
113 Vibha Rishi
114 Vidur Renjen
115 Vikram and Geetanjali Kirloskar
116 Vikrant Vora
117 Vimala Ramachandran
118 Vineet Mittal (Stream International)
119 Vivek Sharma
120 Yogesh Atal
121 Zarir Batliwala
122 Sandhya Gokhale
Partial district support
123 A. Jeevnath
124 A. Jhunjhunwala
125 Abhishek Typesetters & Publishers
126 Akshay Kumar Das
127 Allied Auto Agencies
128 Amit Gupta
129 Amrut Samudre
130 Anahita Bhatia
131 Anand Gaikwad
132 Anish Berry
133 Anmol Distributors
134 Anmol Prakashan
135 Anita Nair
136 Anuj Sharma
137 Anuradha V Wahi
138 Archana Mohite
139 Anuradha Lagad
140 Ashish Patnaik
141 Ashish Singla
142 Ashwin Hedge
143 Ashwin Venkatraman
144 Athar Qurashi
145 Atharva Desai
146 Aurangabad Prabhas
Bahuudesiya Prakalp
147 Avishek Sen
148 Awaghadi Ghodke
149 Ayan Dasgupta
150 B. P. Walawalkar
151 Balvinder Singh
152 Bansilal Kucheria Memorial Trust
153 Baroruchi Mishra
154 Bhavna Kamble
155 Bhawani Jewellers
156 Bijji
157 Borunda School
158 Borunda Village Panchyat
159 C. Vijay Dev
160 Chaitanya Divgi
161 Chakrapani M
162 Chetan Kapoor
163 Chinmay Darne
164 Chirag Trading Co.
165 Community from FN ward, Mumbai
166 Community from LNST ward, Mumbai
167 D. S. Kumar
168 Daljeet Singh
169 Dastana Ramchandra & Co.
170 Datta Bhujbal
171 Datta Salunke
172 Devendra Joshi
173 Deepakdada Asram
174 Depa Chahande
175 Devaki Jain
176 Dattatray Ingavale
177 Deepakrav P.Jadhav
178 Dhananjay Jadhav
179 Dr. (Mrs.) Vidya Naik
180 Dr. Prabodh Gaikwad
181 Dr. Pravin Patil
182 Digambar Toole
183 Dnyanada Publications Pvt. Ltd.
184 Dyaneshhwar Kambale
Vasti Vikas Samitee
185 Fonex Enterprises
186 French Consulate
187 G. Shivaram
188 Gajanan Rambhad
189 Gargi Patil
190 Gondals Press India Ltd
191 Govind Poul
192 Graphtone (India) Pvt. Ltd
193 Gulu Travels
194 Health Workers
195 Hemant Beniwal
196 Hemlata Sasane
197 Himanshu
198 Huma Poly Plast Ltd.
199 India Electronics
200 Indian Network for Rajasthan Studies
201 Indra Kothari
202 Indraneil Barkakoty
203 Iranna Mehtre
204 Ishwar Dayal
205 J. Dutta & Co.
206 J. K. Bhandari
207 Jamuna Rajan
208 Jagat Mehta
209 Jagdish Lade
210 Janaki Desai
211 Jayant Joshi
212 Jayashree Gohil
213 Jayashree Jadhav
214 Jayashree Mane
215 Jayshriben Dineshbhai Patel
216 Jaywant Metha
217 Jitesh Aggarwal
218 Jugai Bag works
219 Jyoti Salve
220 Jyotsna Prakashan
221 K Kiran Kumar
222 K. Sriharsha Shashank
223 Kairavi Sadanand Shetty
224 Kamal Mane
225 Kamble
226 Kamlkar W. Mhadgut
227 Karobi Acharjee
228 Kashila Shedmek
229 Kaushiki Rao
230 Kavita Asram
231 Keshav Dajiba Sahastrabuddhe
232 Khyati Enterparises
233 Kishor Bhamre
234 Kishor Shahu Jadhav
235 Kolhapur Pragati Sikshan Mandal
236 Kshipra Narain
237 Kuldeep Kothari
238 Kuldeep Anil Apradh
239 Kuldeep Kothari
240 Kulin Ashar
241 Kusham Dewara
242 Lakshminarayan Hariharan
243 L. D. Golade
244 L. Sriram
245 Lakshminarayan Hariharan
246 Lalita Ubhayker
247 Laxma Yedskar
248 Laxmi Pawar
249 Lions Club Jamnagar
250 M Rajagopal
251 M. C. Sevayiwar
252 M/s Zalani Paper Co.
253 Madhukar Kapoor
254 Madhura Mohan Jadhav
255 Madhuri Kodape
256 Mahesh Jayender
257 Malashree
258 Malvika Balsekar
259 Manika Chavan
260 Manip
261 Manju Ashar
262 Manshi Fansalkar
263 Maya Sharma
264 M Rajan
265 Manav Kothari
266 Mathur
267 Mehboob
268 Mukesh
269 Meenakshi Ramesh
270 Meera Tendolkar
271 Megha Bhoyar
272 Mukesh Aggarwal
273 M M Raut
274 M/s A.S. Infoways.
275 Mangesh Satamkar
276 Mukesh Sharma
277 N. G. Indai Fived Ltd.
278 N. Vrushabh
279 N.K.Kothari
280 Nava Bharat Prakashan Sanstha
281 Narayan Tale
282 N D Sararaf
283 Nakul Sharma
284 Neeraj
285 Nitesh Kaushik
286 Nidhi Kothari
287 Neha Kiran Agrawal
288 Neha Thakur
289 Nepalia Traders

125ASER 2005
290 Nilima
291 Nirmal Prakashan
292 Nisha Marble
293 Nital Chide
294 Nitin Thakur
295 P. C. Mathur
296 P. L. Agrawal
297 P. Unni Krishnan & T. Vasanthi
298 P. Vikas Rao
299 Paramount Book Mfg. Co.
300 Parismita Singh
301 Pace Marketing
302 Parimal Bardhan
303 Placements.Com Pvt. Ltd
304 Poonam
305 Prabhutva MahilaMandal
306 Prachi Samant
307 Pradeep Chapot
308 Pradeep Korde
309 Pradeep More
310 Pradnya Samant
311 Pranali Gaikwad
312 Pranav Kothari
313 Pranav Chaudhry
314 Prasad Samant
315 Prashant Ganvir
316 Prayag
317 PRAYAS
318 Premlata Narange
319 Pritesh Gandhi
320 Priyanka
321 R. H. Thakur
322 Rahul Kambale
323 Rahul Saini
324 Rahul Sharma
325 Raj Kr. Bhatia
326 Rajabhao Misal
327 Rajan Tendolkar
328 Rajashree Kabre
329 Rajiv Barve
330 Ralegaon Sankalp
Bahuudesiya Prakalp
331 R Neelakantan
332 Ramesh N. Bhoir
333 Ranjana Neelkant Shivshankar
334 Ratan Patil
335 Ravi Raja
336 Ramakrishnan. H
337 Ramesh Shingaljude
338 Ramsakal S.Yadav
339 Ramu Kennedy
340 Raosaheb Aswale
341 Rashmi Gupta
342 Rachit Haldiya
343 Rishab Kothari
344 Reena Ravindra More
345 Renuka Rane
346 Rekha Menon
347 Rinku Dewara
348 Ritu Kothari
349 Rohan Prakashan
350 Rohit Gulati
351 Rohit Shukla
352 Rupa Shah
353 Rupali Jadhav
354 Rustamji Yede
355 S. Ramakrishnan
356 S. S. Acharaya
357 S. S. Devra
358 S. Sabnis
359 S. Venkatakrishnan
360 S.S.Dewara
361 Sabyasachi Das
362 Sachin Chandorkar
363 Sachin Goel
364 Sachin Kambale
365 Sadhana Choudhari
366 Sahanimandal trust
367 Sai Chetan Chalks
368 Saifee Book Agency
369 Samir Kumar
370 Sampark
371 Sampurna Murti
372 Sandeep Gawde
373 Sandeep Malhotra
374 Sangram M Dhote
375 Sanjay Deshmukh
376 Sanjay Tendolkar
377 Santosh
378 Sarathi Krishna Berojgar Seva
Sahakari Sanstha Ltd.
379 Sarika Cheulkar
380 Satish Kasbe
381 Safiya Shaikh
382 Sandhya Rawale
383 Savita Parab
384 Savita Zoating
385 Samar
386 Sanjeev Sarraf
387 Senapathy Whiteley Private Limited
388 Seva Mandir
389 Shabnam Zamal
390 Shakuntla Mehta
391 Shakuntla Mehta
392 Shalini Sachdev
393 Shankar Abhyankar
394 Shapoorji Pallonji & Co.Ltd
395 Sharda Magar
396 Sharmishta Arsud
397 Shefali Pandit
398 Sheloden Enterprise
399 Shiela
400 Shivraj Singh
401 Shireen Rehman
402 Shree.P.G.Sathe
403 Sudhakar V.Bhadarge
404 Sumitra S.Patil
405 Shobhini Mukerji
406 Shree Printers
407 Shreeram Pednekar
408 Shushila Sharma
409 Shushma Sharma
410 Shymla Dupte
411 Simon Young
412 Sirish Auto Corporation
413 Nidhi Kothari
414 Sonal Chinchadkar
415 Sonali Angre
416 Sonali Kattigue
417 Sonia Soni
418 Sridhar Seshadri
419 Srikanth Nadhamuni
420 Sriram Munagala
421 Suchita Rane
422 Sudeep Sengupta
423 Sudhakar Sinh
424 Sugat Rahate
425 Suhas M. Thakur
426 Suhas Vaidya
427 Sunil Dutt Rane
428 Sunita Atolkar
429 Sunita Burra
430 Sushil S. Samel
431 Suvarna Chandrakant Phadtare
432 Swati Bandekar
433 Syed Shahid Mahdi
434 T. V. B. Subrahmanyam
435 Tejas and Tanvi Desai
436 Tejas Bhauuddeshiya Mahilamandal
437 Tejas Shelar
438 Tushar Kothari
439 Uday Singh Jadon
440 Ujjwala Jadhav
441 Usha Mehra
442 Ushma Sheth
443 Udai Pareek
444 V. M. Kati
445 V. S. Vyas
446 V. Srinivas Kumar
447 Vasant
448 Vaijyanath Transport
449 Vaishali Thosar
450 Vanita Phatak
451 Vujay K Bhala
452 Vyas
453 Veena Subhash Kolamkar
454 Venkat Pulsani
455 Vibha
456 Vibhor Sharma
457 Vidya Tiware
458 VidyaVikas Bahuddeshiya
Shikshan Sanstha, Solapur
459 Vijay Dan Detha
460 Vijay Vaidya
461 Vijaya Sawant
462 Vikas Kumar Chaudhri
463 Vikas Sawant
464 Vikram Mane
465 Vishaka Jagade
466 Vishal Narendra Raut
467 Vishwajit Lad
468 Vimal Jadhav
469 Vrushabh N
470 Vitthal Gurav
471 Vitthal Prakashan
472 Vridhali Kadam
473 Vrishali Shashank Shinde
474 Yogendra
Donations in kind
Karnataka
475 Andal Siddartha Chari Pushkarni Sch
476 Azim Premji Foundation
477 Basavaraju, Hegguru, Koppa Taluk
478 Basaveshwar Vidyavardhak Sangh
479 Belgaum Int Rural Devment
480 Chaluvaiah, Hampapur
481 Embark
482 Geleyar Balaga
483 Help
484 Initiatives for Devpmnt Foundation
485 Kuvempu Vedike
486 Mahatma Gandhi Trust
487 Malenadu Education Society
488 Nagesh, Saslu
489 Padmavathi, Sakharayapatna
490 Power
491 Rural Literacy and Health Project
492 Sadhana
493 Sarvodaya Sangh
494 Spoorthy
495 Subhulingeshwar Youth Organisation
496 Velored
Maharashtra
497 Jolly Offset-Printg material, Mumbai
498 Shree Printers-Printg material, Mum.
499 DEO hall for training, Akola
500 Amravati Mandal, Amravati
501 3 villages Amravati Mandal, Amravati
502 Travel 40 voltrs- Local mandal, Beed
503 Mahila Adhyapak Vidyalay -Bhandara
504 Karmaveer Vidyalay (Mul) ,
Chandrapur
505 Snacks & Stay-Shani Mandir Trust,
Dhule
506 Sankalp Bahudeshi Prakalp- Gadchiroli
507 MagasWargiya Mahila Vikas Mndl,
Gondiya
508 Stay (45 volunteers) by Kalamnoori,
Hingoli
509 Har Har Mahadev Mandal, Jalgaon
510 Hall -Jan Shikshan, Solapur
511 Sanmitra Ded College, Kolhapur
512 Shaksahm Upakram, Latur
513 Nusaid 6 village travelling, Nagpur
514 Nusaid, Nagpur
515 Vanchit, Nanded
516 Traveling -Local Mandal, Nadurbar
517 Shaksahm Upakram, Osmanabad
518 Swapna Bhumi, Parbhani
519 Hall by YOUTH CLUB, Raigad
520 Tilak Smrkk Bhavan, Rantnagiri
521 Travelling, Ratnagiri
522 Shiv Prathistan, Sangli
523 Rajaram Prabhudhini, Sangli
524 MAHAVIM, Satara
525 Savitri Bai Snuti Prathistan, Satara
526 Stay and Hall by VOICE, Satara
527 8 villages by VOICE, Satara
528 Suresh Dalvi , Sindhudurg
529 Hall -Rayat Shik Sanstha, Solapur
530 College:Talasari, Thane
531 College:Kelkar, Thane
532 NSS, Wardha
533 Nusaid, Yawatmal
534 Sankalp , Yawatmal
Rajasthan
536 CECOEDECON
537 CUTS
538 MVPSS
539 Institute of Rural Management
540 Educational & Rural Devpmnt
Society GRAVIS
Tamil Nadu
541 Grassroots
542 People’s Watch
543 GandhiGram University
544 VOCRDC
545 Dr. Rosari Williams Navjeevan Trust
546 SODEWS
547 AREDS
548 AID- India
549 Tamil Nadu Science Forum
Donors of Pratham UK supported all
the remaining districts and
additional costs at district, state,
and national level.

126 ASER 2005
No. of
districts
No. of
villages
No. of
household
s
Total no.
of
children
Boys GirlsNo. of
schools
Jammu&Kashmir 14 8 147 2878 4518 2590 1927 114
HimachalPradesh 12 5 98 1769 2540 1312 1228 87
Punjab 17 17 335 6668 10568 5849 4718 332
Uttaranchal 13 11 217 4278 6997 3919 3077 216
Haryana 19 19 380 7653 13787 7887 5900 392
Rajasthan 32 32 639 12766 27163 15635 11527 621
UP 70 69 1371 27316 54416 30619 23792 1328
Bihar 37 36 717 14644 31757 18164 13593 700
ArunachalPradesh 13 3 52 1017 1523 813 709 49
Nagaland 8 2 36 720 1324 760 564 39
Manipur 8 3 53 1107 1955 923 1032 49
Tripura 4 1 18 355 453 235 218 18
Meghalaya 7 2 36 651 1370 733 637 36
Assam 23 8 153 3018 5036 2774 2260 142
WestBengal 17 14 272 5483 7734 4245 3488 261
Jharkhand 22 20 396 8071 14736 8117 6618 376
Orissa 30 30 599 12069 19505 10206 9299 571
Chhatisgarh 16 15 291 5785 9288 4990 4298 287
MadhyaPradesh 45 40 768 15166 28434 16067 12367 758
Gujarat 25 25 500 9786 14239 8003 6235 472
Daman&Diu 2 2 15 796 1364 735 629 15
Dadra&NagarHaveli 1 1 20 400 862 466 396 24
Maharashtra 33 33 655 13025 20050 10600 9450 668
AndhraPradesh 22 22 423 8904 14810 7756 7049 414
Karnataka 27 27 540 10784 15628 7901 7726 534
Goa 2 2 40 799 959 486 473 40
Kerala 14 14 270 5807 8985 4599 4386 265
TamilNadu 30 28 552 10802 15807 7857 7937 520
Total 563 489 9593 192517 335808 184241 151533 9328
Sample DescriptionNo. of
districts in
Census
2001
State
Sample

127ASER 2005
Sample design1
Dr. Wilima Wadhwa
The purpose of the survey was to get reliable estimates at the district level of schooling (whether a child is in school or not, what type of school) and learning (whether a child could read simple text, do
2 basic arithmetic operations and write a short dictated sentence) All rural districts were to be surveyed. At the lowest level, the survey was to provide estimates at the district level which then could be aggregated to the state and all-India levels.
Since estimates were to be generated at the district level, the minimum sample size calculations had to start at the district level. The sample size was determined by the following considerations:
❑ Incidence of what is being measured in the population. Since a survey of learning of this kind has not been done in India, the incidence of what we are trying to measure is unknown in the population. In such cases, the standard methodology is to assume an incidence of 50% since that implies the largest sample size.
❑ Confidence level of estimates. The standard used is 95%.❑ Precision required on either side of the true value. The standard degree of accuracy most
surveys employ is between 5 and 10 per cent. A precision of 5 % along with a 95% confidence level implies that the estimates generated by the survey will be within 5 percentage points of the true values with a 95% probability.
With a 50 % incidence, 95% confidence level and 5% precision, the minimum sample size required in 3
each district is 384. On the other hand, if we were to require a precision of 6%, the sample size would drop to 267. Given these considerations, the sample size was decided to be 400 households in each
4district. Note that at the state level and at the all-India level the survey has many more observations lending estimates at those levels much higher levels of precision.
If we had complete house lists of all households at the district level, the 400 households could be randomly selected. In the absence of these, a two-stage sample design was adopted.
In the first stage, 20 villages were randomly selected using the village directory of the 2001 census as the sample frame.
❑ In the second stage 20 households were randomly selected in each of the 20 selected villages in the first stage.
Villages were selected using the probability proportional to size (PPS) sampling method. This method allows villages with larger populations to have a higher chance of being selected in the sample. It is most useful when the sampling units vary considerably in size because it assures that those in larger
5 6sites have the same probability of getting into the sample as those in smaller sites, and vice verse. ,
1 MODE provided technical advice on the sampling exercise.2 Eventually 509 rural districts participated.
3 The sample size is given by where z is the standard normal deviate corresponding to 95% probability (=1.96), p is the incidence in the population (0.5),
q=(1-p) and d is the degree of precision required (0.05).4
Sample size calculations assume simple random sampling. However, simple random sampling is unlikely to be the method of choice in an actual field survey. Therefore, often a “design effect” is added to the sample size. A design effect of 2 would double the sample size. At the district level a 7% precision along with a 95% confidence level would imply a sample size of 196, giving us a design effect of approximately two.
5Probability proportional to size (PPS) is a sampling technique in which the probability of selecting a sampling unit (village, in our case) is proportional to the size of its population. The method works as follows: First, in each district villages are arranged in ascending or descending order of their household population. Second, the
cumulative population by village calculated. Third, the total household population of the district is divided by the number of sampling units (2) to get the sampling interval (SI). Fourth, a random number between 1 and the SI is chosen. This is referred to as the random start (RS). The RS denotes the site of the first village to be selected
from the cumulated population. Fifth, the following series of numbers is formed: RS; RS+SI; RS+2SI; RS+3SI; …RS+19SI. The villages selected are those for which the cumulative population, contains the numbers in the series.
6Most large household surveys in India, like the National Sample Survey and the National Family Health Survey also use this two stage design and use PPS to select villages in the first stage.
Dr.Wilima Wadhwa in consultation with
2z pq2
d
Lava
Highlight

128 ASER 2005
In the selected villages, 20 randomly selected households were surveyed. Ideally, a complete house list of the selected village should have been made and 20 households selected randomly from it. However, given time and resource constraints a procedure for selecting households was adopted that preserved randomness as much as possible. The field investigators were asked to divide the village into four sections. This was done because villages often consist of hamlets and a procedure that randomly selects households from some central location may miss out households on the periphery of the village. In each of the four sections, investigators were asked to start at a central location and pick every 5th household in a circular fashion till 5 households were selected. In each selected
7household, all children in the age group of 6-14 were tested.
The survey provides estimates at the district, state and national levels. In order to aggregate estimates up from the district level households had to assigned weights --- also called inflation factors. The inflation factor corresponding to particular household denotes the number of households that the sampled household represents in the population. Given that 400 households are sampled in each district regardless of the size of the district, a household in a larger district will represent many more households and, therefore, have a larger weight associated with it than one in a sparsely populated district.
The advantage of using PPS sampling is that the sample is self weighting at the district level. In other words, in each district the weight assigned to each of the sampled household turns out to be the same. This is because, the inflation factor associated with a household is simply the inverse of the probability of it being selected into the sample times the number of households in the sample. Since PPS sampling ensures that all households have an equal chance of being selected at the district level, the weights associated with households in the same district are the same. Therefore, weighted estimates are exactly the same as the un-weighted estimates at the district level. However, to get estimates at the state and national levels, weighted estimates are needed since states have a different number of districts and districts vary by population.
Even though the purpose of the survey is to estimate learning levels among children, the household was chosen as the second stage sampling unit. This has a number of advantages. First, children are tested at home rather than in school, allowing all children to be tested rather than just those in school. Further, testing children in school might create a bias since teachers may encourage testing the brighter children in class. Second, a household sample will generate an age distribution of children which can be cross-checked with other data sources, like the census and the NSS. Third, a household sample makes calculation of the inflation factors easier since the population of children is no longer needed.
Often household surveys are stratified on various parameters of interest. The reason for stratification is to get enough observations on entities that have the characteristic that is being studied. For instance, the NSS uses a two stage stratified sample for their consumption surveys. In the first stage the sample is stratified by population and in the second stage households are stratified on the basis of their affluence. The reason for doing this is that the purpose of the survey is to generate poverty estimates for which a representative sample must include enough non-affluent households. The ASER survey stratifies the sample by population in the first stage. No stratification was done at the second stage. Since the proportion of population in the 6-14 age group is about 22% and the average
8household size is about 5, a simple random sample at the second stage would yield enough children in the sample. Finally, if we were to stratify on households with children in the 6-14 age group, we would need the population of such households in the village, which is not possible without a complete house list of the village. 7
In larger villages, the investigators increased the interval according to a rough estimate of the number of households in each part. For instance, if a village had 2000 households, each part in the village would have roughly 500 households. Selecting every 5th household would leave out a large chunk of the village un-surveyed. In such situations, investigators were asked to increase the interval between selected households
8NSS 55th Round.

129ASER 2005
ASER Results—Some Comparisons With Other Data
“It is a capital mistake to theorise in advance of the facts,” Sherlock Holmes once told Dr 9Watson. So in the paragraphs that follow, we present some facts from ASER 2005 and alternate
sources—and leave you to draw the conclusions you will…
Out of school children
Estimates of out of school children have long varied in India. They range from 5% of the population between the ages of six to fourteen years, to as much as 15-25%, depending upon the assessment you choose to believe. The ASER data indicates that the actual number of children 6-14 who are not in school is approximately 14 million (1.4 crores), which compares quite closely with the figure of 13.4 million (1.34 crores) for 6-13 years reported by an independent IMRB survey commissioned by the Government of India. The IMRB survey, which was carried out between July-December 2005, covered 55442 rural and 32432 urban households. ASER estimates indicate that the number of out of school children represents approximately 6.6% of the population between six to fourteen years. On the other hand, IMRB calculates that around 6.94% of the estimated population of 19.40 crore children between the ages of six to thirteen are out of school (7.8% and 4.34% in rural and urban areas respectively). State Governments themselves have estimated these numbers to be approximately 0.95 crores, as in November 2005.
1
9 “The Adventure of the Second Stain”, The Return of Sherlock Holmes, Sir Arthur Conan Doyle.
Table 1: State-wise percentage of out of school children (in relation to total child population of the State)
State ASER Dec.-05 IMRB Sep-05
Punjab 4.4 2.87
Haryana 5.3 4.51
Rajasthan 10.4 6.9
UP 7.3 8.15
Bihar 13.5 8.91
WB 4.4 8.67
Jharkhand 9.8 10.88
Orissa 8.8 5.37
Chattisgarh 4.7 6.05
MP 4 8.63
Gujarat 3.6 3.96
Maharashtra 2.8 3.17
AP 7.3 4.29
Karnataka 1.9 1.42
Kerala 1.7 0.55
TN 2.6 2.14
Lava
Highlight
Lava
Highlight

ASER NCERT rank ASER NCERT rank
13 West Bengal 2
11 Haryana 5
16 Bihar 1
2 Uttaranchal 15
3 Chattisgarh 16
7 Kerala 4
Kerala
Uttaranchal
Chattisgarh
West Bengal
Bihar
Haryana
Goa 17 Andhra Pradesh 13
Reading/language Arithmetic
130 ASER 2005
Of particular interest is the following table (Table 2 ), which ranks the top seven States that account for the highest number of out of school children across the country.. With a few exceptions, the same States appear in both columns of these tables, indicating that the highest numbers of out of school children are to be found in these areas. While ASER data indicate that 72% of all out of school children are accounted for by the five States of Bihar, UP, Rajasthan, Andhra Pradesh and Orissa, IMRB data suggests that it is the five States of Bihar, UP, West Bengal, Madhya Pradesh and Rajasthan that account for 68.8% of this number.
Table 2: Top 7 States Ranked In Terms of Percentage of Out of School Children (in relation to total child population of the State)
Table 3: Learning Results from ASER and NCERTIn both surveys, results for Bihar, West Bengal and Haryana appear to be consistent, with children
from these States returning high test scores.
ASER IMRB
Bihar Jharkhand
Rajasthan Bihar
Jharkhand WB
Orissa MP
UP UP
AP Rajasthan
Haryana Chattisgarh
Learning Levels
According to ASER 2005, based on tests conducted in the household on one-on-one basis, the five best States in reading were Kerala, Uttaranchal, Chattisgarh, West Bengal and Bihar, while the top five in arithmetic were West Bengal, Haryana, Bihar, Uttaranchal and Chattisgarh. This may be contrasted with the results of an achievement survey carried out by NCERT in 2002. The NCERT-administered written achievement tests in schools, covering 88271 Grade V students in 4787 schools and 105 districts of 27 States and 3 UTs, (excluding Jharkhand and Meghalaya), indicated that the top five States in language were Tamil Nadu, West Bengal, Bihar, Maharashtra and Orissa, while Bihar, West Bengal, Tamil Nadu, Kerala and Haryana were the best in arithmetic. The relative NCERT ranks of the top five States in reading/language and arithmetic (according to ASER 2005) are indicated in Table 3.
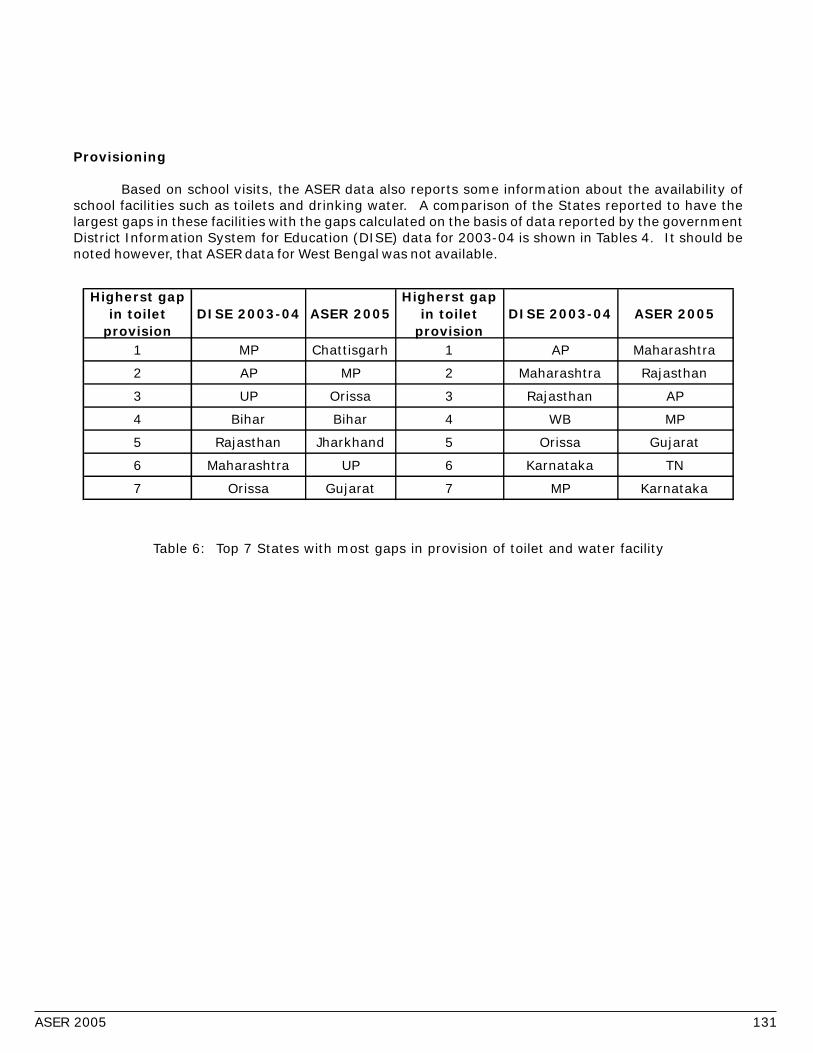
131ASER 2005
Provisioning
Based on school visits, the ASER data also reports some information about the availability of school facilities such as toilets and drinking water. A comparison of the States reported to have the largest gaps in these facilities with the gaps calculated on the basis of data reported by the government District Information System for Education (DISE) data for 2003-04 is shown in Tables 4. It should be noted however, that ASER data for West Bengal was not available.
Table 6: Top 7 States with most gaps in provision of toilet and water facility
Higherst gap
in toilet
provision
DISE 2003-04 ASER 2005
Higherst gap
in toilet
provision
DISE 2003-04 ASER 2005
1 MP Chattisgarh 1 AP Maharashtra
2 AP MP 2 Maharashtra Rajasthan
3 UP Orissa 3 Rajasthan AP
4 Bihar Bihar 4 WB MP
5 Rajasthan Jharkhand 5 Orissa Gujarat
6 Maharashtra UP 6 Karnataka TN
7 Orissa Gujarat 7 MP Karnataka

132 ASER 2005

133ASER 2005

134 ASER 2005

135ASER 2005

136 ASER 2005