
Final Report Cardiac Patient Services Improvement
89
Cardiac Patient Services Improvement Final Report Management Systems Department The University of Michigan Hospitals Thursday, December 12, 1991 Lee DeKay Karen Webb Anne Wilczak
Transcript of Final Report Cardiac Patient Services Improvement
Cardiac Patient Services ImprovementFinal Report
Management Systems DepartmentThe University of Michigan Hospitals
Thursday, December 12, 1991
Lee DeKayKaren Webb
Anne Wilczak
TABLE OF CONTENTS
Executive SummaryIntroduction and Background 1Approach and Methodology 2Current Situation 4Alternatives Considered 9Findings and Conclusions 11Recommendations 31Action Plan 35References 36Appendix 1 37Appendix 2 39Appendix 3 42
EXECUTIVE SUMMARY
There is currently concern that cardiac inpatients are experiencing an unnecessary delay in
transport between the seventh floor inpatient units and the basement level (BI) cardiac
procedure areas at the University of Michigan Hospital in Ann Arbor. It is the goal of this
study to attempt to identify the source of these delays and to recommend alternatives to reduce
them. The departments specifically involved in this study were the Cardiac Intensive Care
unit (7D), the Cardiac Step-Down unit (7C), the Electrophysiology lab, and the
Catheterization lab.
There exists a cardiac transportation policy drafted by Dr. Bertram Pitt on March 9, 1989
which matches patient conditions with the type of transportation needed. A copy of the policy
may be found in Appendix 3 of the full report. All cardiac care staff members are not familiar
with this policy. At the present time, stable cardiac patients are transported by the
centralized Patient Transportation department. Unstable patients may be transported by a
nurse or a resident fellow in addition to or as a substitute for a transporter.
It was mentioned in staff interviews that a contributing source of the delays is finding
stretchers for transport. This may improved by designating stretchers ‘for cardiac use only’.
Wait times were determined through data collection and it was found that wait times for
transporters are greater than staff expectations (15 - 20 minutes). The mean time waited for
transport is approximately 30 minutes.
Lack of Cardio-Pulmonary Resuscitation Certification (CPR) was stated as a problem area
and CPR training was cited as a way to improve the system. This was not within the scope of
our project, so it is mentioned for your consideration.
Based on data collected and observations of the cardiac transportation process and the
staff, it is recommended that the current transportation system be improved through greater
communication between departments. Methods of improving the existing system include:
I Developing a step by step procedure that the affected units should follow consistently
for better communication.
I Holding a brainstorming session with representatives from 7C, 7D, the Catheter lab,
the EP lab, and the Patient Transportation department.
It is also recommended that a student nurse be used to transport or accompany critical
patients from the floor to the lab. This would reduce the workload for the seventh floor nursing
staff, provide hands-on experience for the students, and provide patients with a qualified
transporter.
INTRODUCTION AND BACKGROUND
There is currently concern that cardiac inpatients are experiencing an
unnecessary delay in transport between the seventh floor inpatient units and
the basement level WI) cardiac procedure areas at the University of Michigan
Hospital in Ann Arbor. It is the goal of this study to attempt to identify the
source of these delays and to recommend alternatives to reduce them. The
departments specifically involved in this study were the Cardiac Intensive
Care unit (7D), the Cardiac Step-Down unit (7C), the Electrophysiology lab,
and the Catheterization lab. Concern has also been expressed regarding the
qualifications of the staff transporting these patients.
On September 12, 1991, a meeting of cardiac care staff was held to
discuss these issues. The representatives attending this meeting were:
Heather Wurster Director Associate - Seventh Floor
Nursing
Joyce Sorrentino Head Nurse - 7C Cardiac Step-Down
Laura Gorman Manager - Invasive Cardiology
Maureen Flaherty-Thompson Head Nurse - 7D Cardiac Intensive Care
A copy of the minutes of the meeting can be found in Appendix 1. Topics
discussed included inpatient flow, professional standards and qualifications,
and transportation waiting times. The Management Systems department was
contracted to perform a study of the cardiac patient transportation system. The
project was delegated to Dr. Richard Coffey’s Industrial and Operations
Engineering 481 class - “Special Projects in Hospital Systems”. The students
assigned to this project were Lee DeKay, Karen Webb, and Anne Wilczak with
Elizabeth Othman acting as the Project Coordinator.
1
APPROACH AND METHODOLOGY
In order to gain an accurate understanding of the cardiac transport
process, it was necessary to collect actual transport times. Data collection
forms were given to the staffs of the Catheter and EP labs, the nurses of 7C,
and the clerks of 70. Examples of these forms can be found in Appendix 2.
They were asked to record the time the Patient Transportation department
was called and the time the transporter arrived at and left their respective
units. Data collection forms from the seventh floor were matched with those
from the B1 labs and recorded times were subtracted to give the intermediate
times of the process. This study was carried out from Tuesday, October 29,
1991 to Friday, November 1, 1991 and from Monday, November 4, 1991 to
Friday, November 8, 1991. A total of 47 transports were recorded during this
period. Four of the transports were to or from 7D and the remaining 43 were
to or from 7C.
Because this data was not sufficient for a clear understanding of the
process, a second study was performed with the authors acting as data
gatherers. The same collection method was used. A total of ten transports
were recorded during the December 1 - 2, 1991 collection period. Two of the
transports were to or from 70 and eight were to or from 7C.
In addition to the data collected specifically for this study, transport
time data was also provided by the Patient Transportation department in the
form of transport logs listing request times, dispatch times, and completion
times.
Flowcharts of the transportation process from room to lab and from lab
to room were created to determine the location of problem areas.
2

Interviews with cardiac staff and transporters were conducted to gauge
the level of understanding of the process. Suggestions for improvement of
the system were also welcomed.
Hospitals throughout the country were contacted to provide
information on their cardiac transportation systems. The hospitals selected
were of approximately the same size and caliber as the University of Michigan
Hospital. Information was obtained from Beaumont Hospital, the Cleveland
Clinic, Georgetown University Hospital, the Mayo Clinic, Sacramento Mercy
General, the Ohio State University Hospital, and St. Joseph’s Hospital.
Other general information regarding cardiac transportation practices,
procedures, and volumes was obtained through conversations with Joyce
Sorrentino, Maureen Flaherty-Thompson, Laura Gorman, Terry
Schuenemeyer, Michelle Troy, Gregory Cox, and Jeannie Collins.
3
CURRENT SITUATION
At the present time, stable cardiac patients are transported by the
centralized Patient Transportation department. There are eight full-time
transporters working during the day shift and they are responsible for
transports throughout the entire hospital. The majority are not BCLS trained.
Unstable patients may be transported by a nurse or a resident fellow in
addition to or as a substitute for a transporter. There exists a cardiac
transportation policy drafted by Dr. Bertram Pitt on March 9, 1989 which
matches patient conditions with the type of transportation needed. A copy of
the policy may be found in Appendix 3. All members of the EP and Catheter
staffs are not familiar with this policy. The staff is uncertain in assigning
patients to proper diagnostic categories. This may cause improper staffing on
transports.
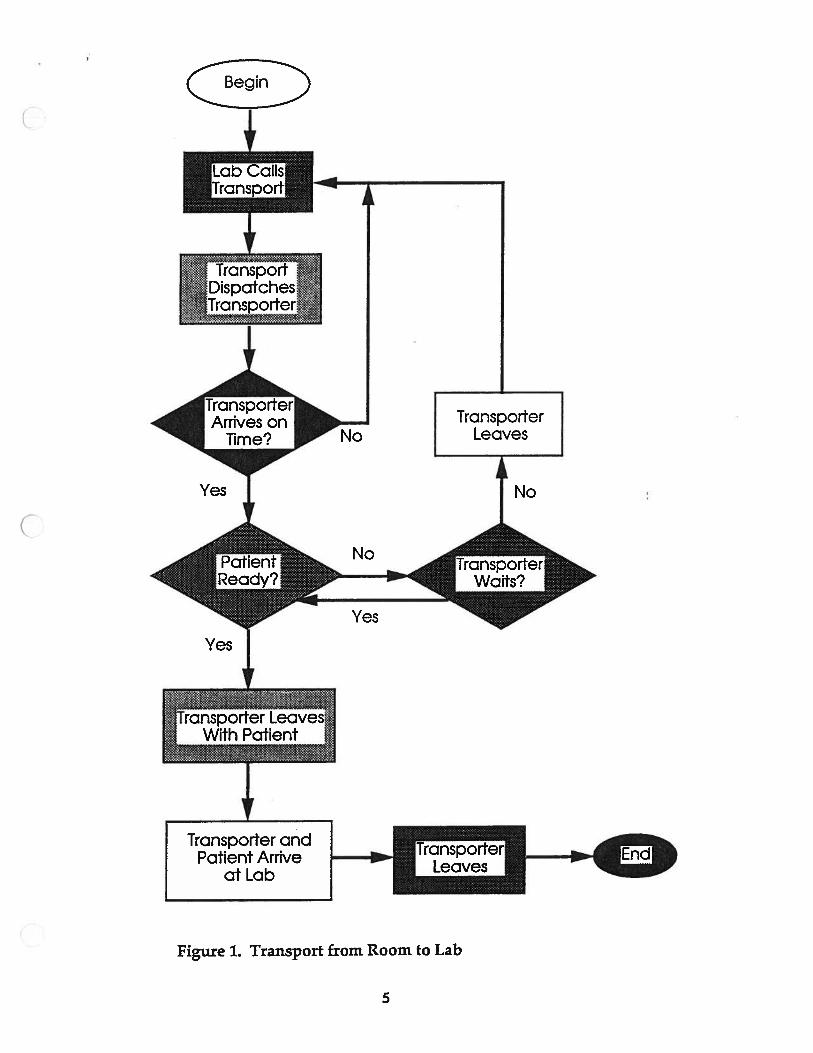
The transportation process from the seventh floor to the EP and
Catheter labs is handled entirely by the labs. A flowchart of the process is
shown in Figure 1.
4
TranspcrtDispatches
Transpoder
Figure 1. Transport from Room to Lab
I,
No
Yes
TransporterLeaves
No
>-r
Yes
cnsporterWaits?
Yes
Transporter andPatient Arrive
at Lab
5
To begin the process, the lab calls the Patient Transportation
department to request that a patient be picked up from the seventh floor. The
Patient Transportation department typically expects 20 to 30 minutes advance
notice for patient transports. The lab then calls the seventh floor to inform
them to expect a transporter and the floor puts the patient “on call”. The
Patient Transportation department typically dispatches a transporter about 15
minutes before the patient’s lab appointment time. When the transporter
arrives on the seventh floor, the patient should be on a stretcher ready for
transport. In the case of 70 - Cardiac Intensive Care, the patient is not moved
to a stretcher but is transported in his or her own bed. When the patient is
not ready, the transporter uses a “Five Minute Rule” to decide whether or not
to wait. If the patient will not be ready within approximately five minutes;
the transporter leaves to complete other tasks and the Patient Transportation
department must again be called when transport is needed. The patient is
transported between floors via the West Staff Elevators. When the patient
arrives at the lab, the transporter calls the dispatch center to inform them that
the run has been completed. As of October 8, 1991, all transport times are
recorded by the dispatch center on ‘Patient Transportation System, Version
3.0” software by Headlee Systems.
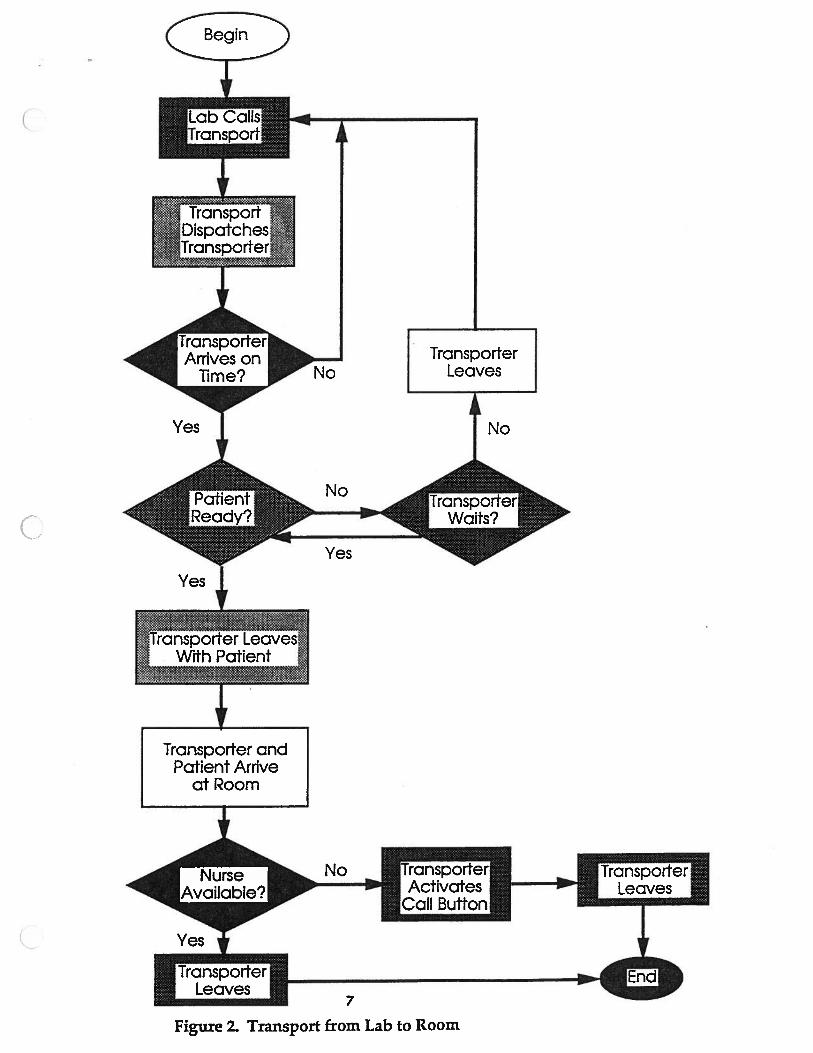
When a patient is to be transported from the lab to the seventh floor,
the lab again makes all of the arrangements. A flowchart of this process is
shown in Figure 2.
6
4cIc’ TransportDispatches’
‘Transporter.
J Arrives on Ilime? j
Yes
ITr5p01t LeavesWith Patient ‘
“y ‘
No
No
V
TransporterLeaves
No
Yes
Yes
Transporter andPatient Arrive
at Room
I
No Tra
Call Bufton1
wter
7
Figure 2. Transport from Lab to Room
The EP lab usually calls the Patient Transportation department near the
end of the patient’s procedure to request a transporter. When the transporter,
after collecting the patient, arrives on the seventh floor, he or she notifies the
nurse if the nurse is not present by activating the “Nurse Call” button in the
patient’s room. After leaving, the transporter notifies the dispatcher that the
run has been completed.
Nurses and resident fellows transport or accompany unstable patients
from the EP lab and typically all patients from the Catheter lab to the seventh
floor.
8
ALTERNATIVES CONSIDERED
The utilization of a satellite transporter for the cardiac units has been
proposed by staff at a variety of levels as an alternative solution to the
problem. He or she would be responsible for transporting patients to and
from the cardiac procedure areas with a nurse or fellow if required.
Advantages
Transporter more accessible
Shorter waiting time
BCLS trained
Disadvantages
May still need fellow or nurse to accompany patient (Depends on
amount of training)
Conflicting requests for transport (Which lab or unit gets priority?)
Staffing problems (Number of transporters needed)
Idle time
Cross-training?
Location of satellite headquarters
Cost
A second alternative considered was a transporter from the Patient
Transportation department assigned to cardiac areas.
Advantages
BCLS trained
More familiar with cardiac units
9
Disadvantages
Utilization
Higher costs (Higher level of training Higher Wages)
Controlled by Patient Transportation department
The final alternative considered was to use student nurses in place of
cardiac floor nurses to accompany and transport unstable patients to the
procedure areas. These students would be on a rotating schedule and would
be assigned to handle critical transports only from floor to lab. In addition,
they could perform any additional floor duties.
Advantages
Qualified to transport unstable patients
Reduces nursing time required for transports
Gives students hands-on experience
Disadvantages
Scheduling
Less experience than floor nurses
10
FINDINGS AND CONCLUSIONS
Hospital Survey
The hospitals in the survey were selected based on size (approximately 800
beds), and type (research/university) in order to set a benchmark. This shows
where the University of Michigan stands relative to the transportation
methods of other hospitals. The results are shown in Table 1.
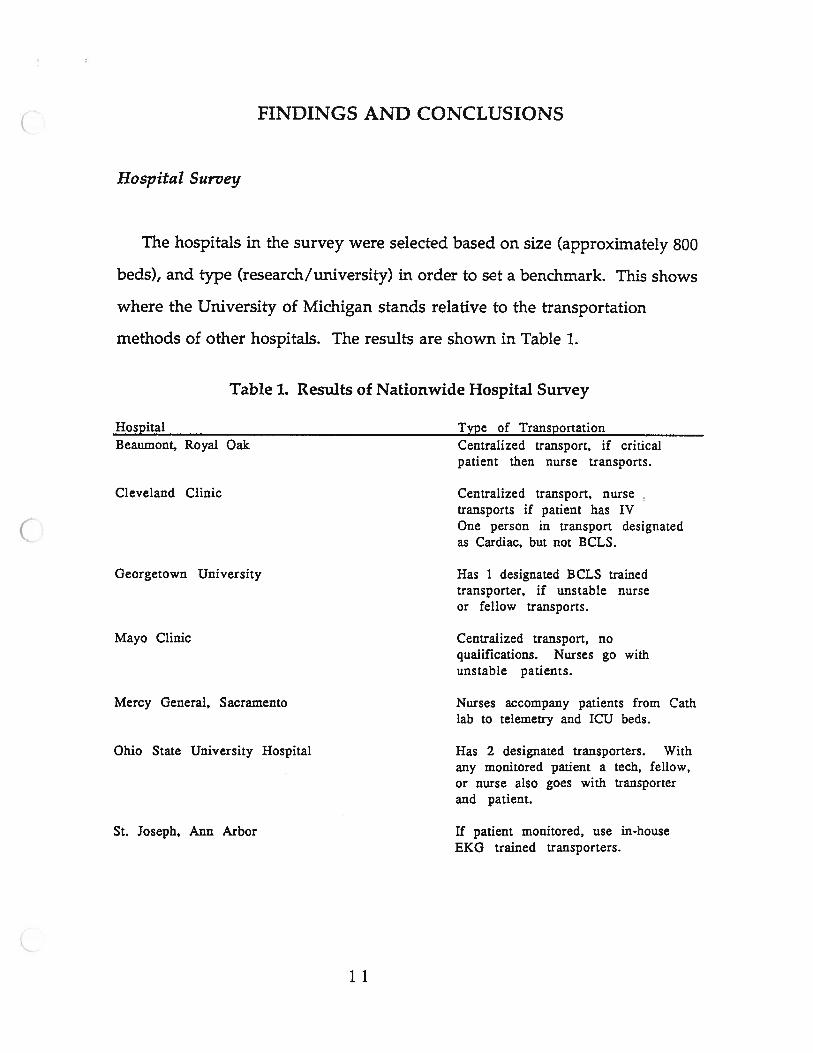
Table 1. Results of Nationwide Hospital Survey
Hospital Type of TransportationBeaumont, Royal Oak Centralized transport, if critical
patient then nurse transports.
Cleveland Clinic Centralized transport, nursetransports if patient has IVOne person in transport designatedas Cardiac, but not BCLS.
Georgetown University Has 1 designated BCLS trainedtransporter, if unstable nurseor fellow transports.
Mayo Clinic Centralized transport, noqualifications. Nurses go withunstable patients.
Mercy General, Sacramento Nurses accompany patients from Cathlab to telemetry and ICU beds.
Ohio State University Hospital Has 2 designated transporters. Withany monitored patient a tech, fellow,or nurse also goes with transporterand patient.
St. Joseph, Ann Arbor If patient monitored, use in-houseEKG trained transporters.
11
The survey shows a wide variety of transportation methods used. The
University of Michigan Hospital uses a system no different from several
other comparable institutions. Georgetown University Hospital uses a BCLS
trained designated transporter yet unstable patients still require a nurse or
doctor to accompany transports. The University of Michigan is the only
hospital of those surveyed with a formal, written cardiac transportation
policy.
Survey of Transporters
A discussion was held with several transporters to discover what the
general feelings of the Patient Transportation department are concerning the
problems arising in transporting between the cardiac care units and the
procedure areas. Questions asked included:
What amount of time does it take you to get to your pick-up destination after
you receive a call?
Is there a problem with the nurses not being there when you arrive with the
patient on the floor (transporting from the lab)?
What percentage of the time do you feel that the patients aren ‘t ready when
you arrive?
The transporters believe that the they reach their destination
approximately five minutes after they are notified of a transport request. The
12
EP and Catheter labs have priority on transport so the transporters will be sent
to these destinations first.
Generally, a nurse is present when the patient is returned to the cardiac
care units. On 7C, the clerk is notified and the “Nurse Call” button is
activated if the nurse is not present. On 7D, because of the critical condition of
the patient, a nurse waits for the patient to arrive.
When transporting from 7D, there is usually a significant wait since the
patient must be disconnected from equipment by a nurse or doctor. The wait
is approximately 20 to 30 minutes for this procedure. The transporters
unanimously agreed that the patient is not ready for transport 100% of the
time. On 7C, the patient is not ready for transport 25% of the time.
It was mentioned that a contributing source of the delays is finding
stretchers for transport. Stretchers are missing about 50% of the time.
It was mentioned by the transporters surveyed that a designated
transporter responsible for cardiac patients would be advantageous. This
solution was suggested by a transporter who had previously worked in a
department where a designated transporter was present and another
transporter readily agreed that this would be a good solution.
Survey of Cardiac Staff
A discussion was also held with several cardiac staff members to
determine their understanding of the cardiac transportation situation.
Questions asked included:
What amount of time do you expect to wait for a transporter?
What do you think is a reasonable amount of time to wait for a transporter?
13
What percentage of transports are done by nurses and/or fellows?
Where are the problem areas in the transport process?
What ideas do you have as to how to improve the system?
Do you feel the transportation system adequately meets your needs?
The responses of the staff regarding the expected wait time for a
transporter ranged from five minutes to one hour. Apparently, this wait
time is fairly inconsistent.
All of the staff surveyed felt that a reasonable amount of time to wait for a
transporter to arrive is about fifteen to twenty minutes. The actual mean wait
time is about twenty minutes.
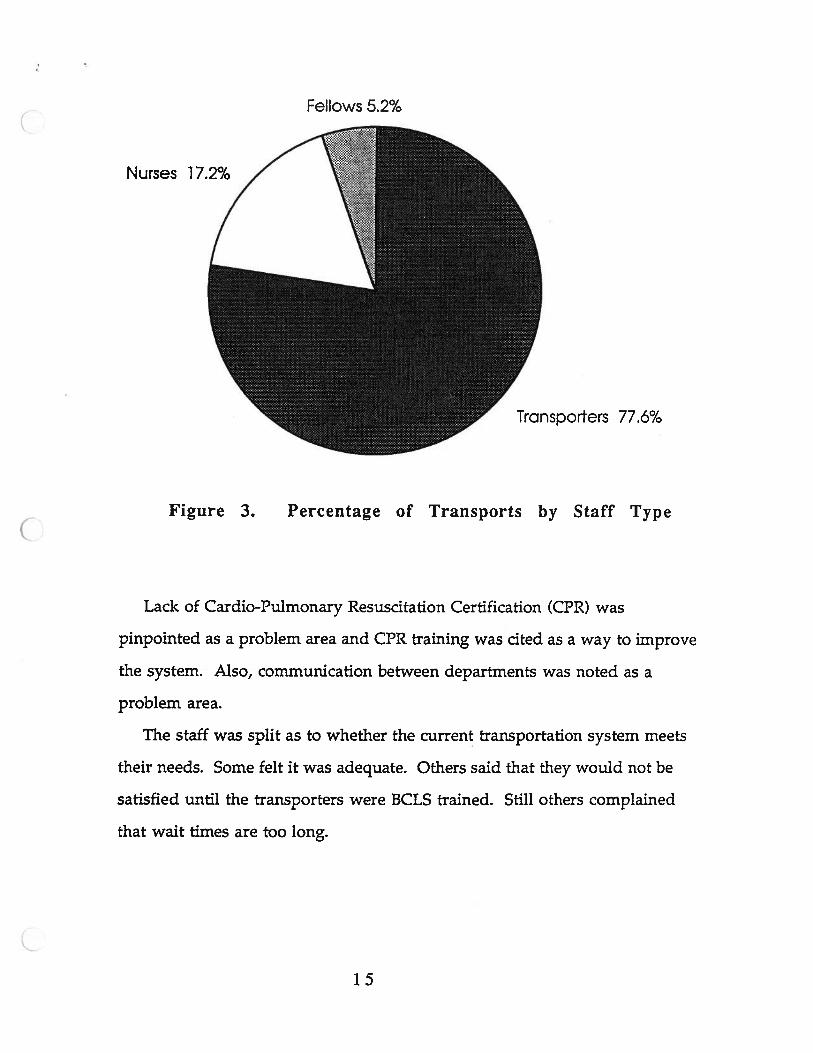
It is generally believed that 20% of the transports to and from the EP lab
are accompanied by a nurse. In the Catheter lab, about 85% are done by
cardiac staff. The results from the two data collection periods show that
approximately 77.6% of transports are performed by transporters, 17.2% by
nurses, and 5.2% by resident fellows. (See Figure 3.) This shows a sizable
amount of nursing time is required for transports.
14
Fellows 5.2%
Nurses 17.2%
Transporters 77.6%
Lack of Cardio-Pulmonary Resuscitation Certification (CPR) was
pinpointed as a problem area and CPR training was cited as a way to improve
the system. Also, communication between departments was noted as a
problem area.
The staff was split as to whether the current transportation system meets
their needs. Some felt it was adequate. Others said that they would not be
satisfied until the transporters were BCLS trained. Still others complained
that wait times are too long.
Figure 3. Percentage of Transports by Staff Type
15
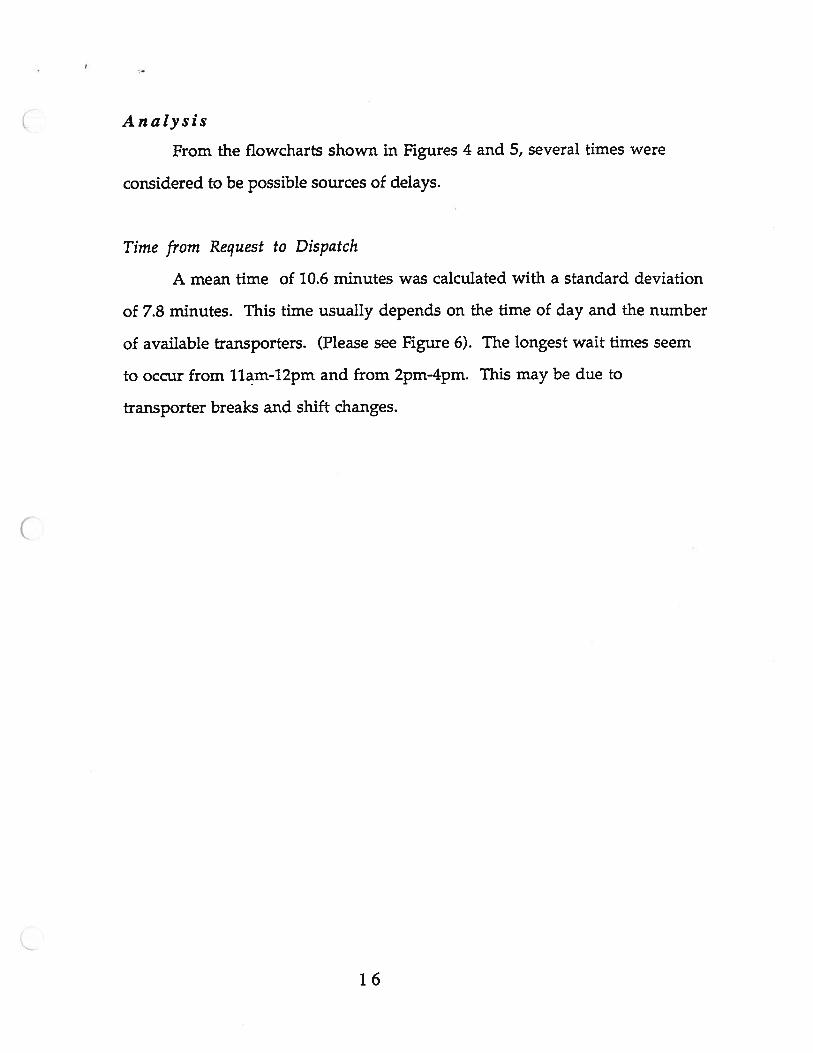
Analysis
From the flowcharts shown in Figures 4 and 5, several times were
considered to be possible sources of delays.
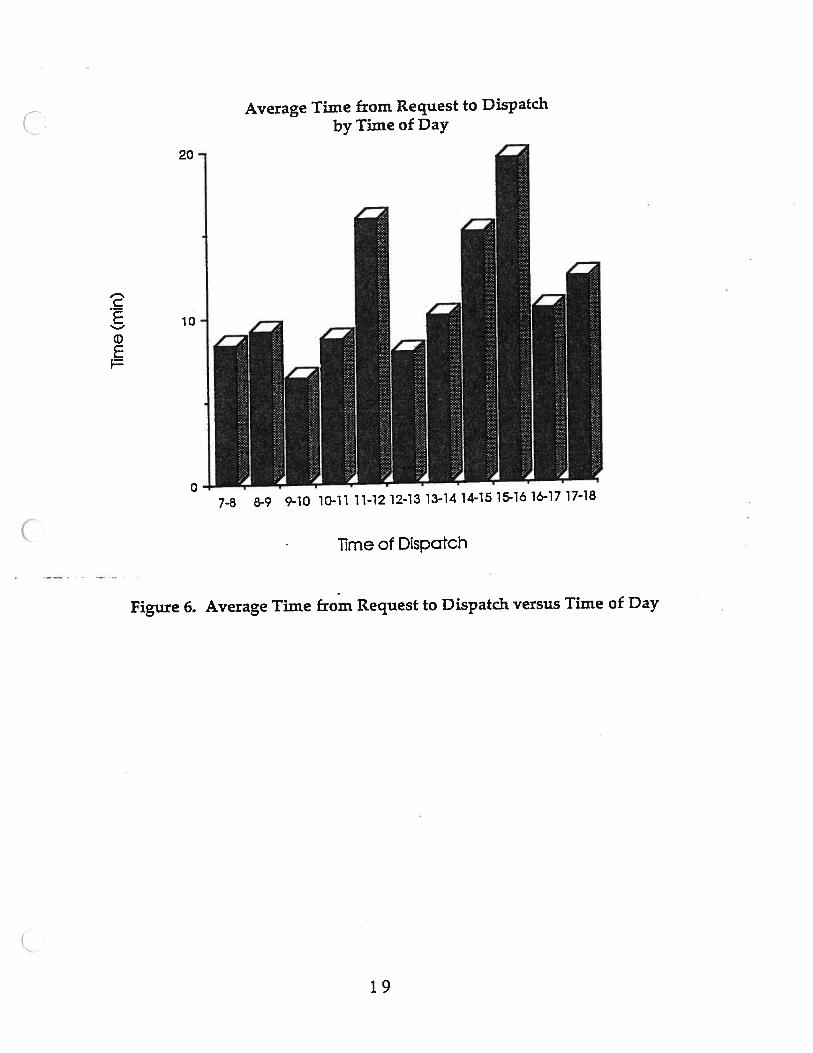
Time from Request to Dispatch
A mean time of 10.6 minutes was calculated with a standard deviation
of 7.8 minutes. This time usually depends on the time of day and the number
of available transporters. (Please see Figure 6). The longest wait times seem
to occur from llam-l2pm and from 2pm-4pm. This may be due to
transporter breaks and shift changes.
16

I
mean = 10.6std dev = 7.8
TransSrtDispatchesTransporter
mean = 10.4 I
TransporterLeaves
mean = 7.2std dev = 5.7
Transporter
Figure 4. Mean Times for Transports from Room to Lab
std dev = 4.7
Nolime?
Yes1
No
Yes
ransporterWaits?
Yes
*!.Transporter Leaves.Wi Patent
Transporter andPatient Arrive
at Lab
17
mean = 5.8
:..Transporter Leavesi.With
std dev = 3.73 V
TransporterActivates
18
Transporter
mean = 10.6std dev = 7.8
mean = 9.6
std dev = 4.6
NoArrives on
lime?
Yes
TransporterLeaves
No
Yes
Yes
Transporter andPatient Arrive
at Room
+
Yes*
ITransporterLeaves
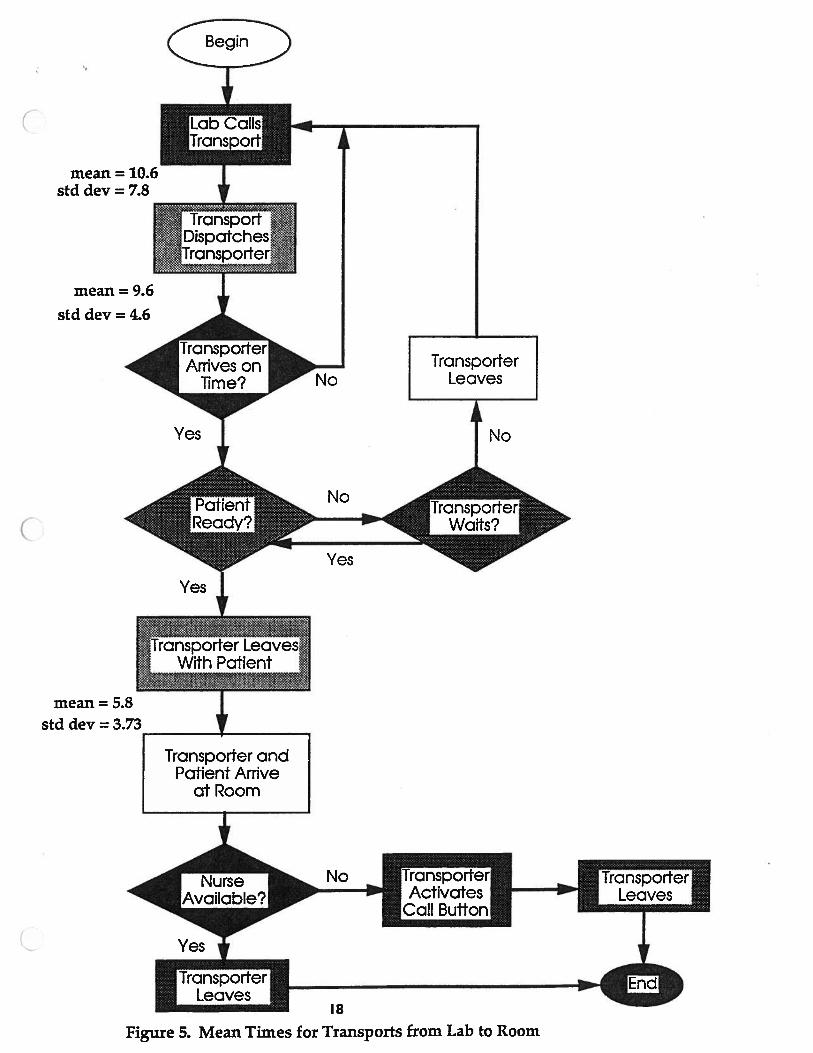
Figure 5. Mean Times for Transports from Lab to Room
0
Average Time from Request to Dispatch
by Time of Day
lime of Dispatch
Figure 6. Average Time from Request to Dispatch versus Time of Day
7-8 8-9 9-10 10-11 11-12 12-13 13-14 14-15 15-16 16-17 17-18
19
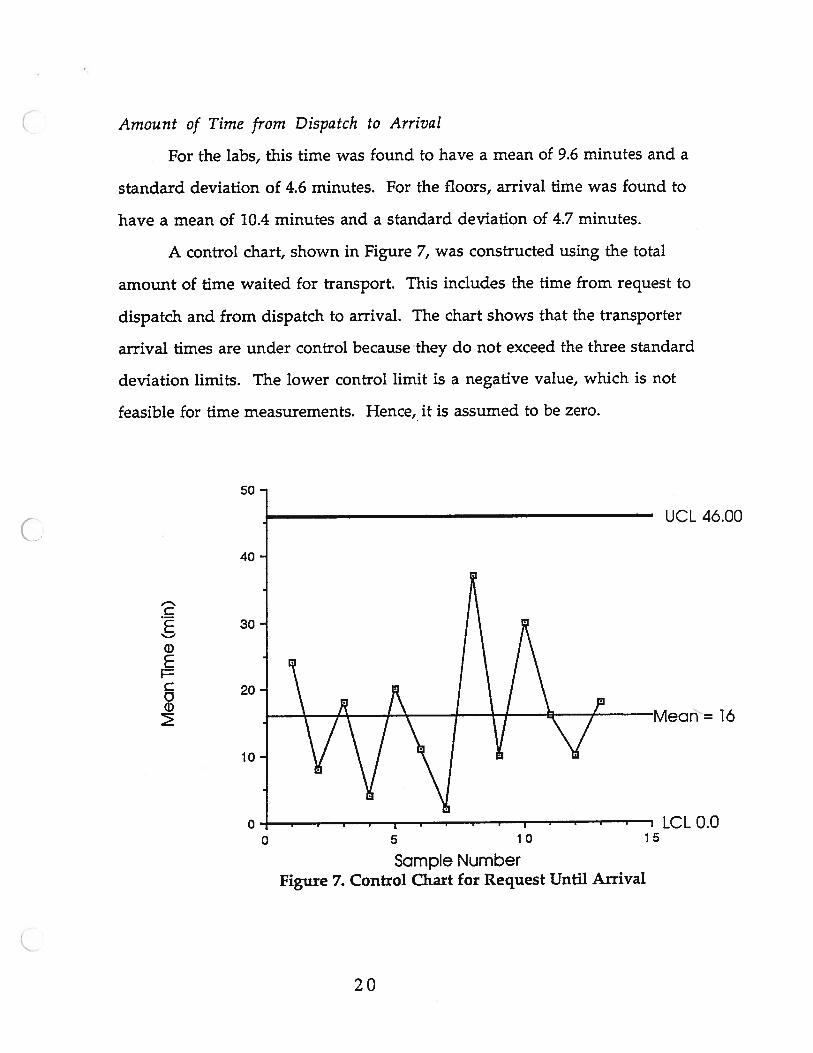
Amount of Time from Dispatch to Arrival
For the labs, this time was found to have a mean of 9.6 minutes and a
standard deviation of 4.6 minutes. For the floors, arrival time was found to
have a mean of 10.4 minutes and a standard deviation of 4.7 minutes.
A control chart, shown in Figure 7, was constructed using the total
amount of time waited for transport. This includes the time from request to
dispatch and from dispatch to arrival. The chart shows that the transporter
arrival times are under control because they do not exceed the three standard
deviation limits. The lower control limit is a negative value, which is not
feasible for time measurements. Hence,, it is assumed to be zero.
50
UCL 46.00
40
C30•
ci)E
20
Mean=16
0- . . cLCLO.00 5 10 15
Sampfe NumberFigure 7. Control Chart for Request Until Arrival
20
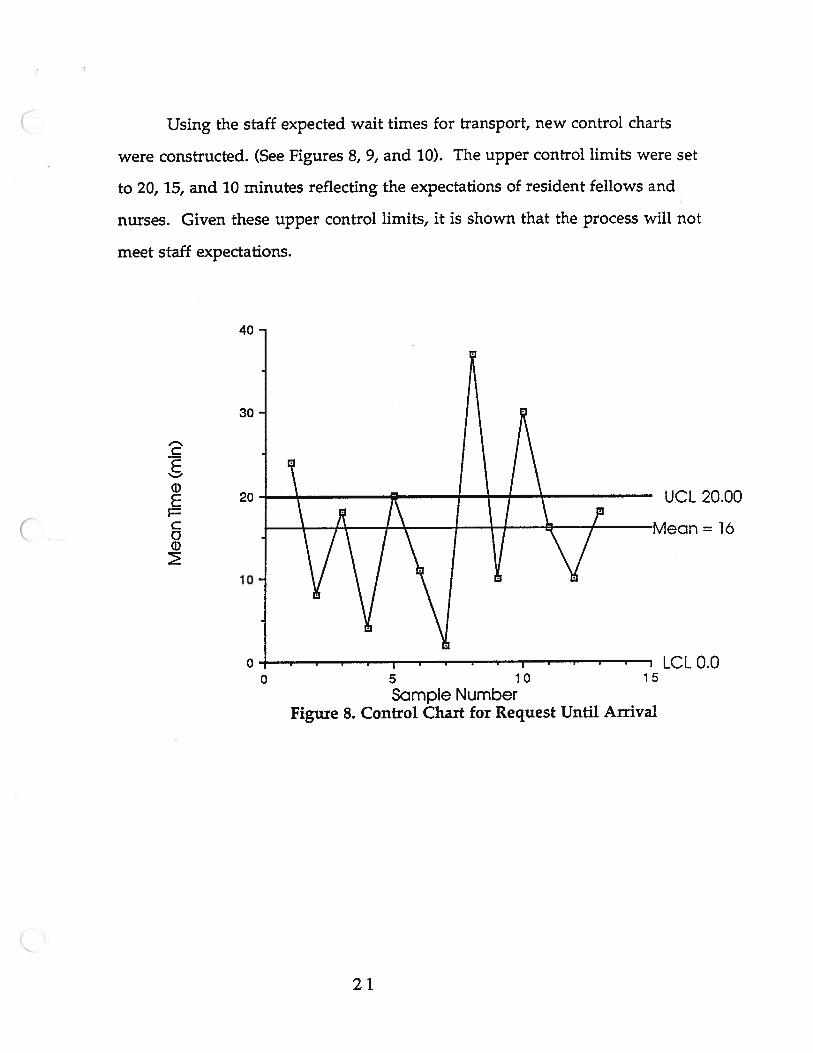
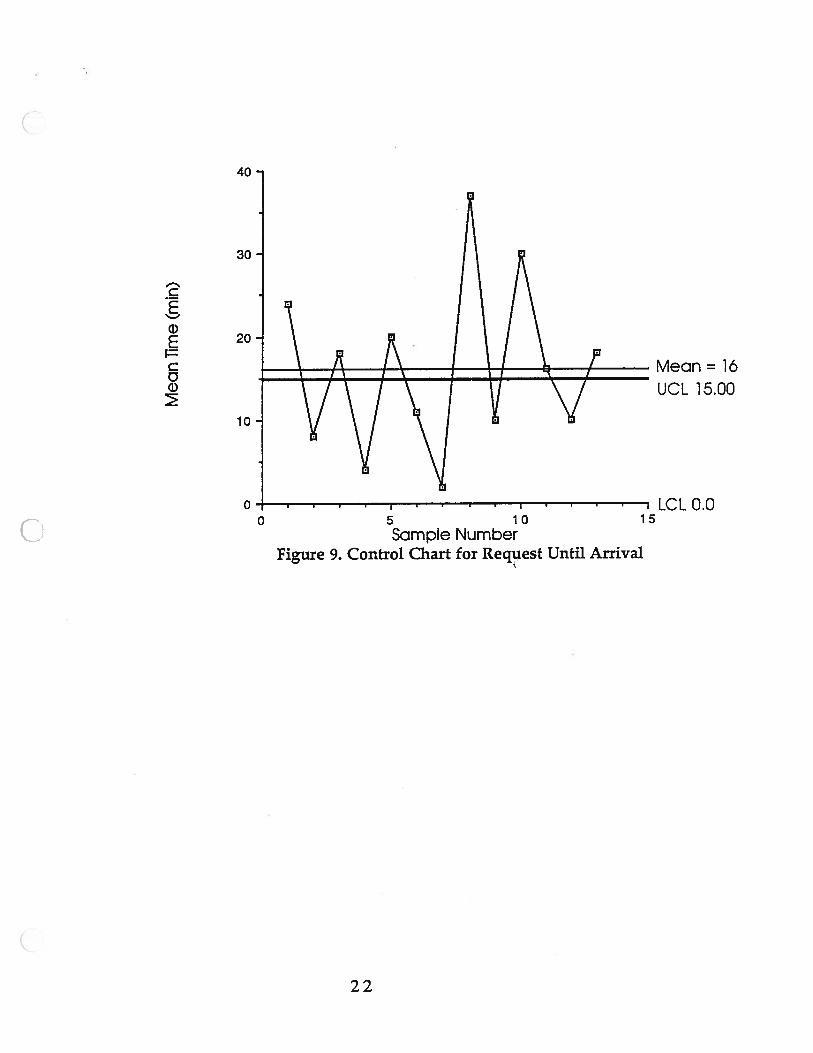
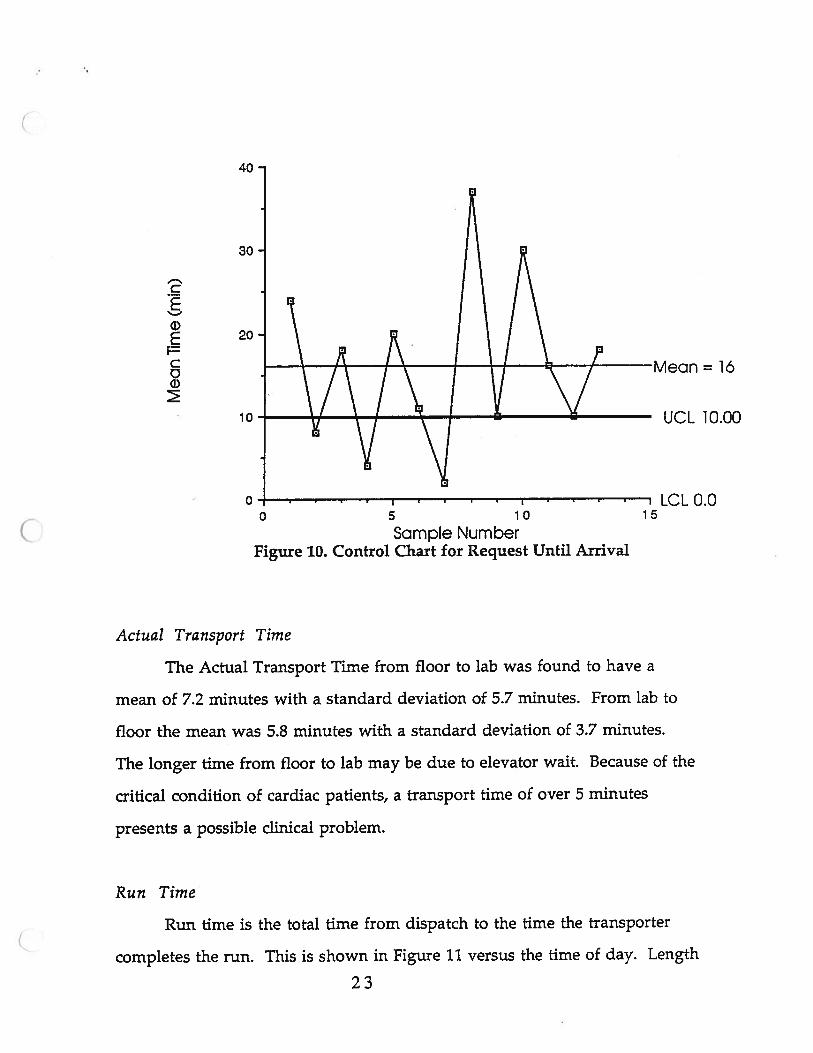
Using the staff expected wait times for transport, new control charts
were constructed. (See Figures 8, 9, and 10). The upper control limits were set
to 20, 15, and 10 minutes reflecting the expectations of resident fellows and
nurses. Given these upper control limits, it is shown that the process will not
meet staff expectations.
I-.’
C
0E
1=
C0
40
30
20
10
0
UCL 20.00
= 16
0 5 10 15
Sample NumberFigure 8. Control Chart for Request Until Arrival
LCLO.0
21
40
vy\Vv’5 10Sample Number
Figure 9. Control Chart for Request Until Arrival
ci)SCC0
30
20 -
10-
00
Mean=1á
UCL 15.00
LCLO.015
22
40
Sample NumberFigure 10. Control Chart for Request Until Arrival
Actual Transport Time
The Actual Transport Time from floor to lab was found to have a
mean of 7.2 minutes with a standard deviation of 5.7 minutes. From lab to
floor the mean was 5.8 minutes with a standard deviation of 3.7 minutes.
The longer time from floor to lab may be due to elevator wait. Because of the
critical condition of cardiac patients, a transport time of over 5 minutes
presents a possible clinical problem.
Run Time
Run time is the total time from dispatch to the time the transporter
completes the run. This is shown in Figure 11 versus the time of day. Length
23
F-’c
0EC00
30
20
10
0
ean = lá
UCL 10.00
LCL 0.00 5 10 15
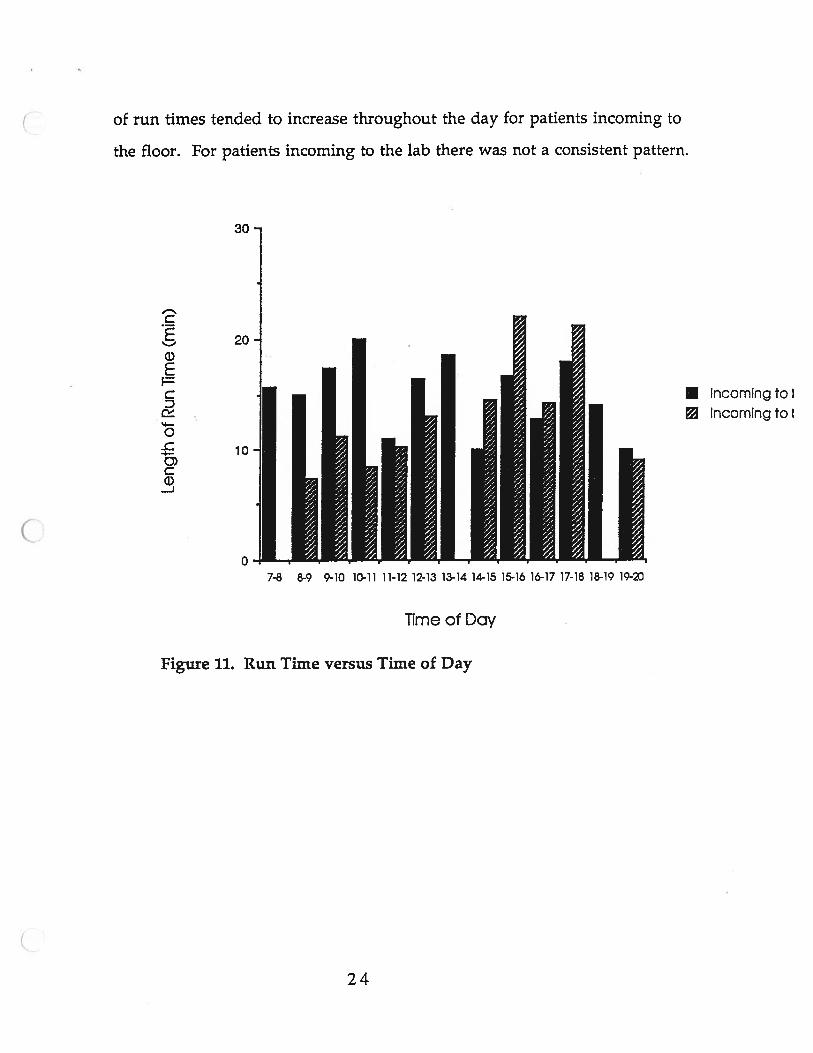
Figure 11. Run Time versus Time of Day
• Incoming to I
Incoming to I
of run times tended to increase throughout the day for patients incoming to
the floor. For patients incoming to the lab there was not a consistent pattern.
30
C
200E
CD
0
3)C0-J
07-8 8-9 9-10 10-11 11-12 12-13 13-14 14-15 15-16 16-17 17-18 18-19 19-
Time of Day
24
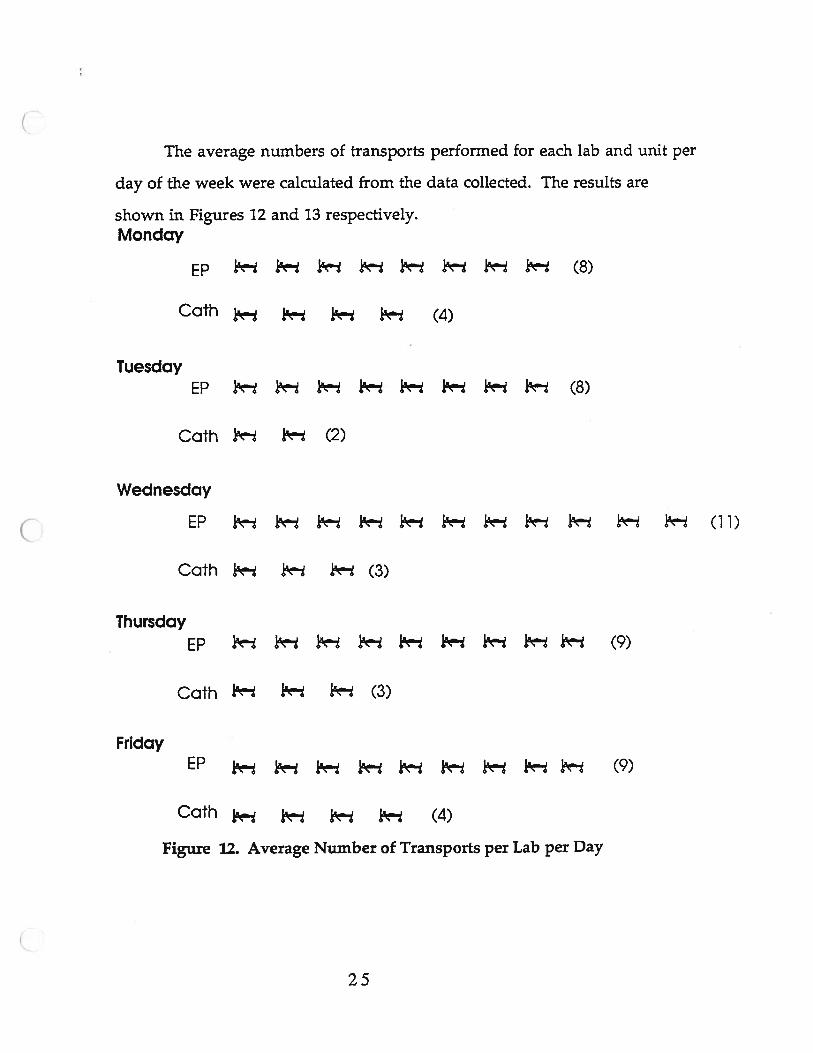
The average numbers of transports performed for each lab and unit per
day of the week were calculated from the data collected. The results are
shown in Figures 12 and 13 respectively.Monday
EP I i- i— i 1- 1 (8)
Cath j (4)
TuesdayEP I- ik” I ? ?- (8)
Cath ? (2)
Wednesday
EP i- (11)
Cam (3)
ThursdayEP 1’- 1 (9)
Oath 1’ (3)
FridayEP (9)
Oath (4)
Figure 12. Average Number of Transports per Lab per Day
25
Monday
7C (10)
7D (2)
Tuesday7C 1 i (8)
7D (2)
Wednesday
7C i 1 (1 1)
7D ? i (3)
Thursday
70 j- (11)
7D ja (1)
Friday
70 j3
7D (1)
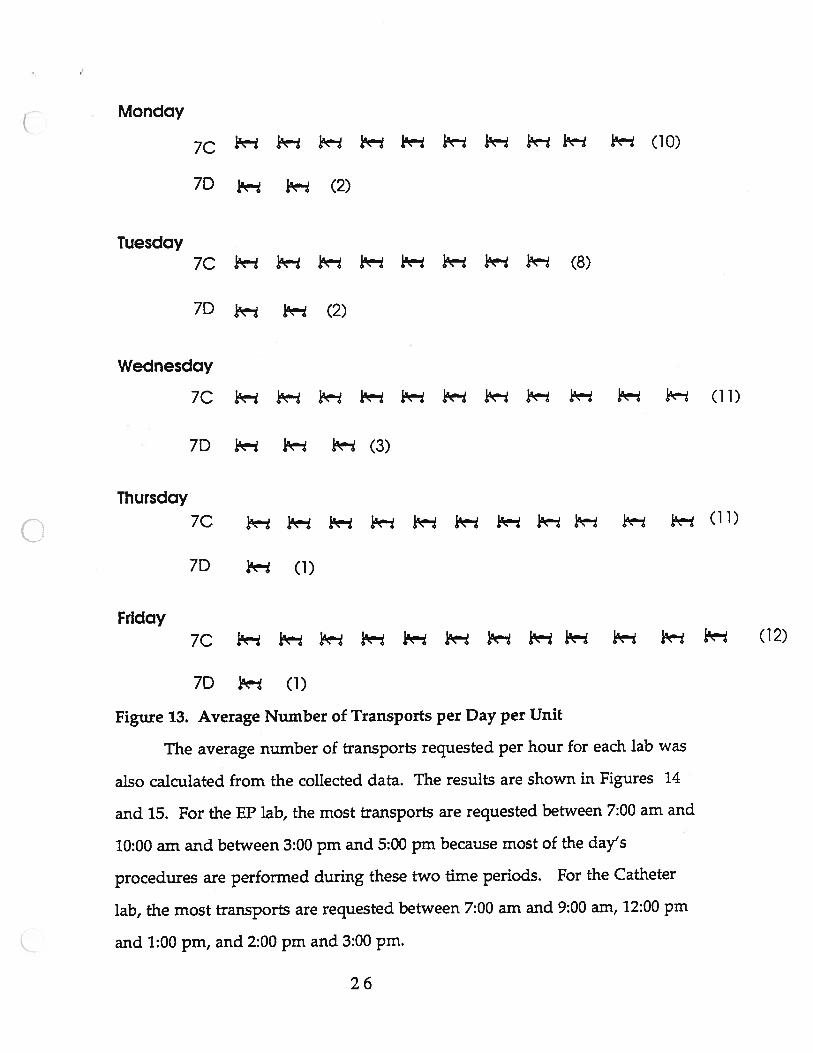
Figure 13. Average Number of Transports per Day per Unit
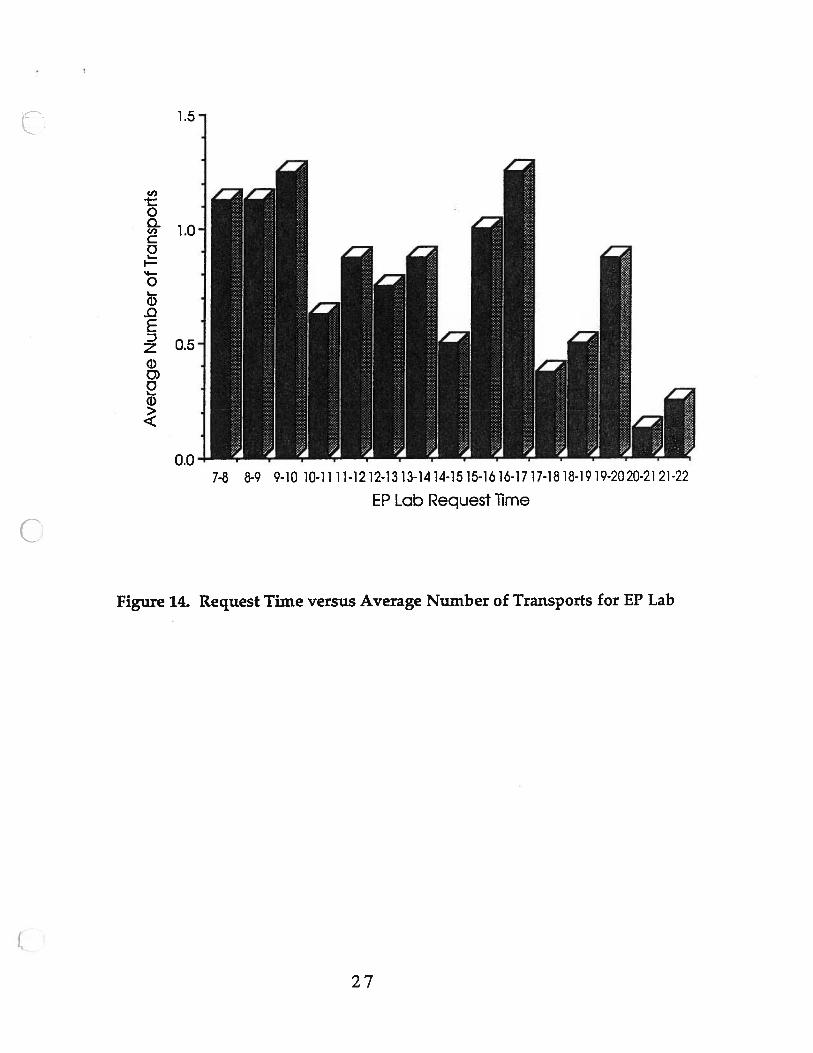
The average number of transports requested per hour for each lab was
also calculated from the collected data. The results are shown in Figures 1.4
and 15. For the EP lab, the most transports are requested between 7:00 am and
10:00 am and between 3:00 pm and 5:00 pm because most of the day’s
procedures are performed during these two time periods. For the Catheter
lab, the most transports are requested between 7:00 am and 9:00 am, 12:00 pm
and 1:00 pm, and 2:00 pm and 3:00 pm.
26
C,,
00Cl)C01
I‘4—
01)0Sz1)0)0ci)
1.5-
1.0-
0.5-
0.0 -I7-8 8-9 9-10 10-1111-1212-1313-1414-1515-161o-1717-1818-1919-2020-2121-22
EP Lab Request lime
Figure 14. Request Time versus Average Number of Transports for EP Lab
27
0.4 -
(I)
1:0a 0.3-C,,Co
01.
0 -
0SDz
0.07-8 8-9 9-10 10-11 1 1-12 12-13 13-14 14-15 15-la 16-17 17-18
Oath Lab Request Time
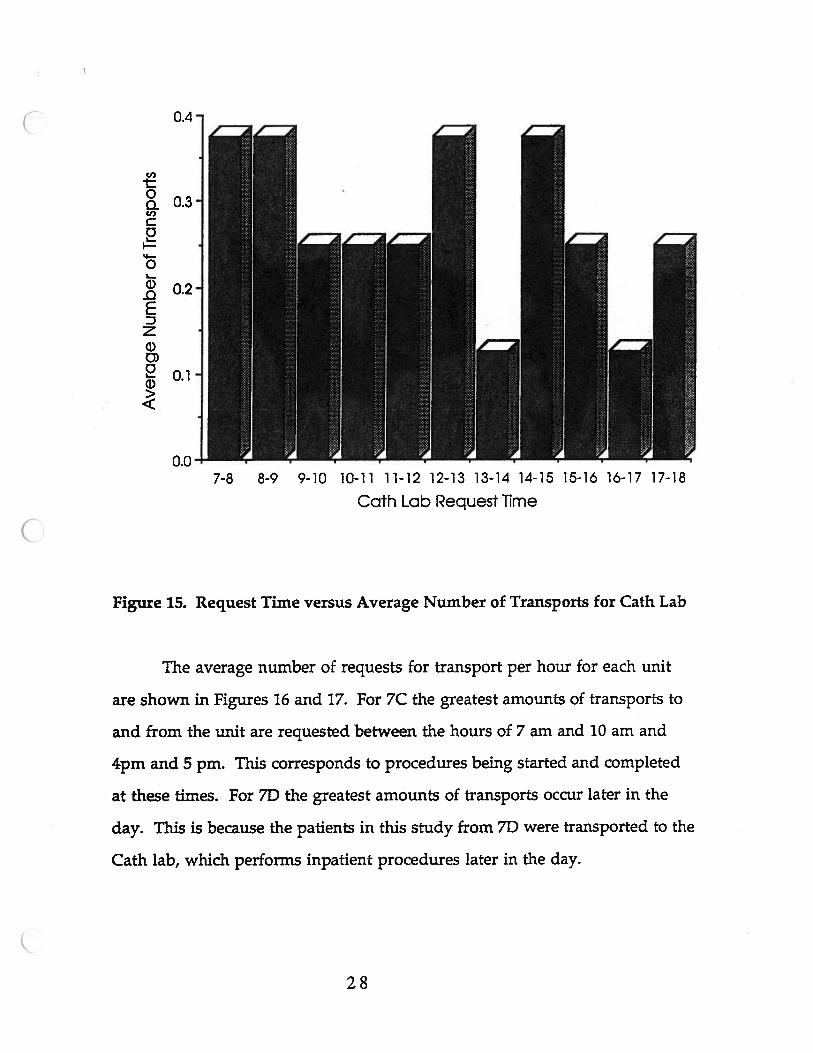
Figure 15. Request Time versus Average Number of Transports for Cath Lab
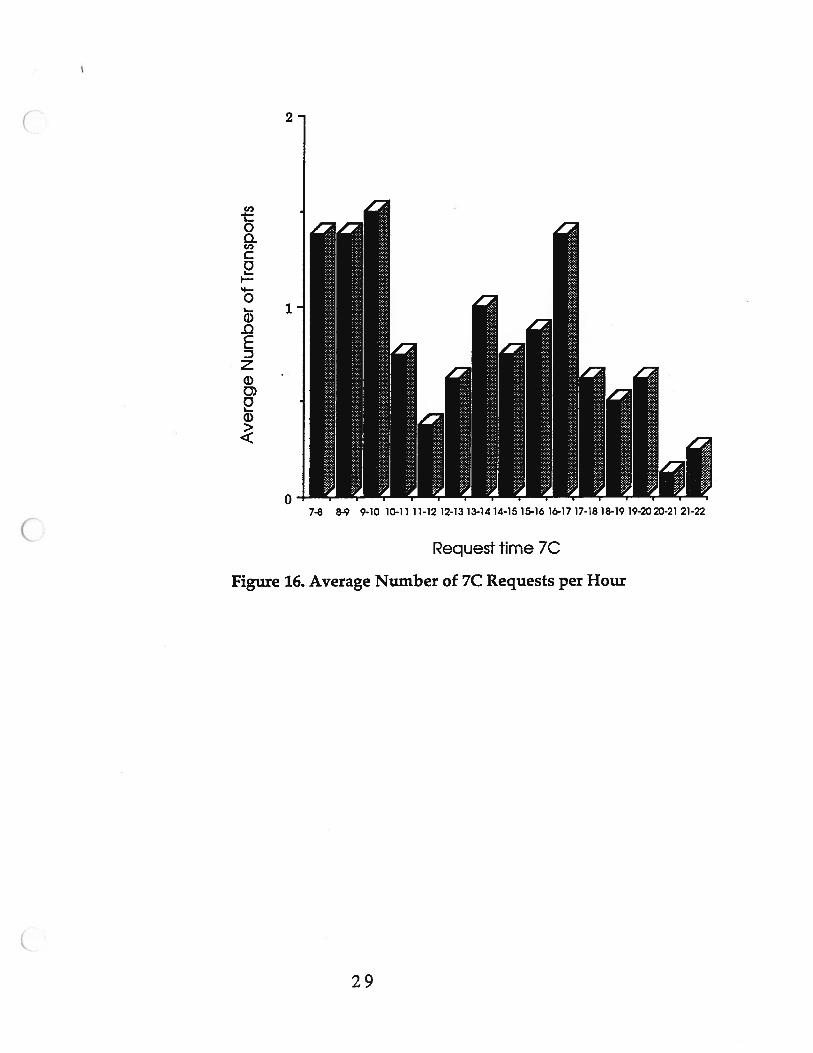
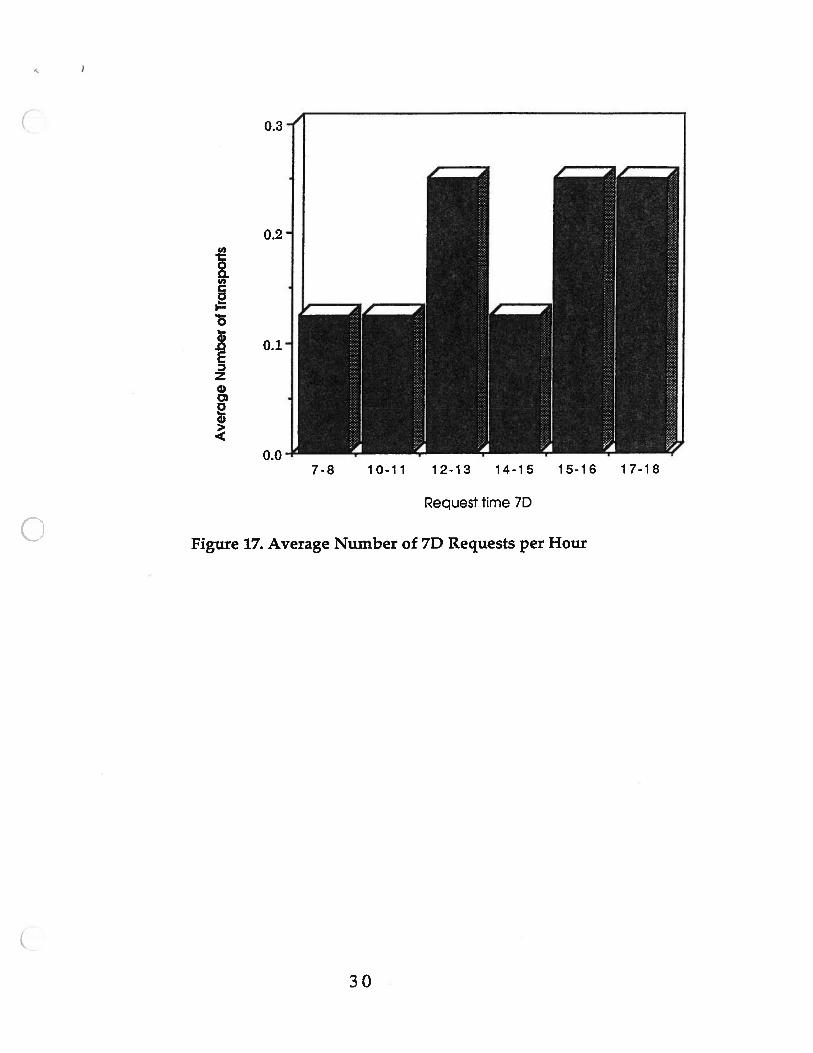
The average number of requests for transport per hour for each unit
are shown in Figures 16 and 17. For 7C the greatest amounts of transports to
and from the unit are requested between the hours of 7 am and 10 am and
4pm and 5 pm. This corresponds to procedures being started and completed
at these times. For 7D the greatest amounts of transports occur later in the
day. This is because the patients in this study from 71) were transported to the
Cath lab, which performs inpatient procedures later in the day.
28
Cl)-t:01Cl,C0I
0
ci)-QSDzci)
L.
0>
Request time 7C
Figure 16. Average Number of 7C Requests per Hour
7-8 8-9 9-10 10-11 11-12 12-13 13-1414-1515-1616-1717-1818-1919-2023-21 21-22
29
(I,
‘5
Ez0
20>
Figure 17. Average Number of 70 Requests per Hour
Request time 7D
30
RECOMMENDATIONS
Based on data collected and observations of the cardiac transportation
process and the staff, the resulting recommendation is to improve the current
transportation system. From this small study of the cardiac procedure areas,
sufficient evidence was not found to support the need for a satellite or
designated transporter. As shown in the small survey of nationwide
hospitals, the University of Michigan Hospital uses a transportation system
that is comparable to those of other institutions. While a satellite or
designated transporter would be BCLS trained, they still would require a
nurse or resident fellow to accompany critical transports. The transporter
would be more accessible but conflicting requests would require the use of
centralized transport as a back-up system. The volume and frequency of
cardiac transports (as shown in Figures 12, 14, and 15) would cause congestion
one minute and idleness the next. Furthermore, cardiac procedures are
performed from 7:00 am until approximately 10:00 pm and one transporter
would not be able to cover this entire time period. However two transporters
would not be fully utilized because of the low volume encountered within
this study. In order to be effective, they would have to be cross-trained for
other duties.
‘Hurry up and wait,’ frustration, long waiting times for patients... are
symptoms of a poorly designed system for patient flow”(Rising,1977, p.3).
Long wait times and frustration were observed within the existing system.
As was shown in Figures 8, 9, and 10, staff expectations far exceed actual
performance times. This leads to undue stress on the staff. The key to
improving the current system is increased communication between all
parties involved in the cardiac transportation process. It is important that the
31
cardiac staff realize the mean time waited for transport is approximately 30
minutes. The expectations of the staff should be adjusted to this fact, as the
process is under control. The only way to meet current staff expectations
would be to radically change the transport system. By increasing
communication between 7C, 7D, the Catheter lab, the EP lab, and the Patient
Transportation department, this will lead to more realistic expectations.
There are two methods recommended to improve communication between
the affected groups.
I Develop a step by step procedure that the involved units should follow
consistently for better communication.
Suggestions include:
Floor to Lab
1. Lab calls Transport to request transport and give patient appointment
time.
2. Lab calls floor and tells the floor appointment time.
3. Nurse goes to the room and gets patient ready 20 minutes before
appointment time. This will attempt to reduce the amount of time the
patient spends on the stretcher.
4. Transporter transports patient to lab.
Lab to Floor
1. Lab calls Transport and requests transport
2. Lab calls floor and gives the approximate transport time.
3. Transporter arrives and transports patient to floor.
4. Lab calls to notify the floor that the patient is on the way up to the f
loor, this gives the nurse approximately five minutes.
32
5. Transporter and Nurse arrive at the room at approximately the same
time and Nurse returns the patient to bed.
Although some of these suggestions are already used, they are not used
consistently. This causes breakdowns of the system to occur. The new
procedure could be tested for a one or two week trial period to determine the
feasibility of formal implementation.
The second recommendation is to:
I Hold a brainstorming session with representatives from 7C, 7D,
the Catheter lab, the EP lab, and the Patient Transportation
department.
At this meeting, the suggested procedure and the results of its trial period
could be discussed in more detail. An idea to discuss during this meeting
might be a way to reduce the problem of unavailable stretchers. This might
be accomplished by marking the stretchers ‘for cardiac use only’ or by storing
several in an unused storage area in case needed. A future possibility to
explore would be to put the proposed communication procedure into a
computer system linked to the Patient Transportation department computer
system. For example, if the lab calls the dispatcher, then the dispatcher only
has to type in that the patient is being picked up at 7C. The computer would
then send a message to a computer on 7C telling the unit of the patient to be
transported and the appointment time.
It is suggested that student nurses be used for accompaning or
transporting critical patients from floor to lab. This would reduce the
workload for seventh floor nursing staff and provide the students with
33
valuable hands-on experience. They would also be qualified to deal with
most cardiac emergencies.
If more supporting data is desired, a supplemental study is suggested.
Other cardiac units and procedure areas could be included in this study to
show the entire transportation process for all cardiac patients.
34
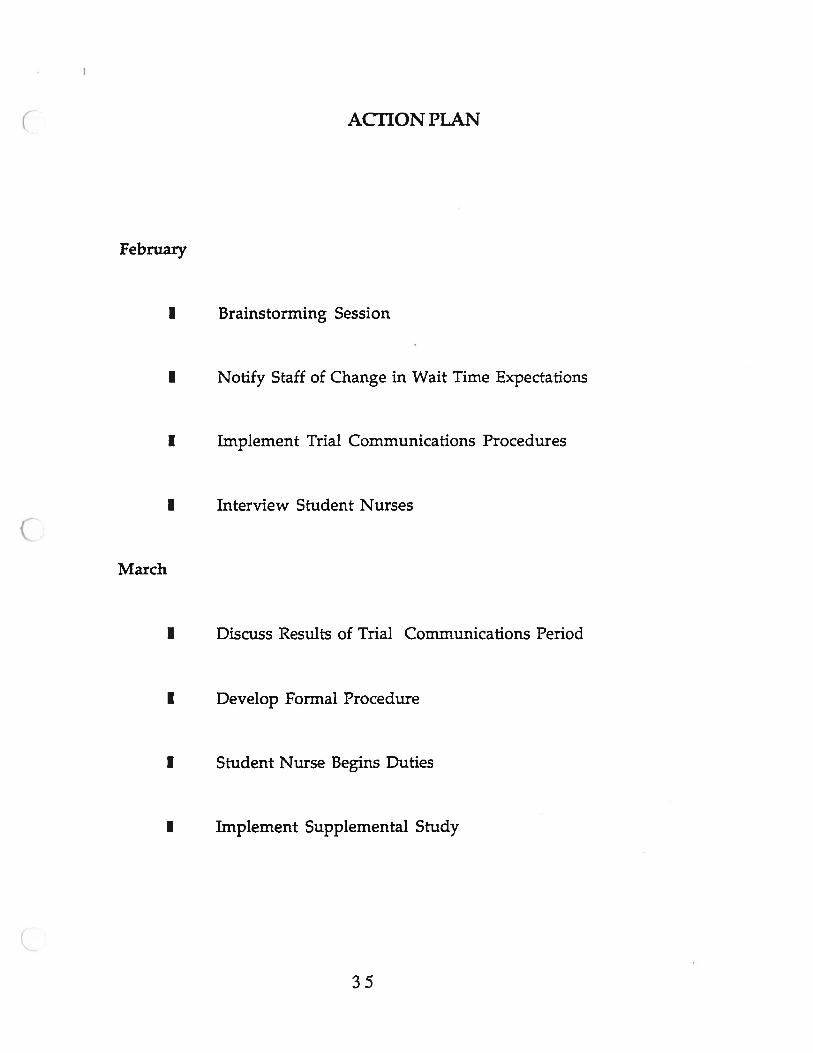
ACTION PLAN
February
I Brainstorming Session
I Notify Staff of Change in Wait Time Expectations
I Implement Trial Communications Procedures
I Interview Student Nurses
March
I Discuss Results of Trial Communications Period
I Develop Formal Procedure
I Student Nurse Begins Duties
I Implement Supplemental Study
35

REFERENCES
Rising, F. J. U977). Design for Improved Patient Flow Lexington,Massachusetts: D. C. Heath and Company.
APPENDIX 1.MINUTES FROM SEPTEMBER 12, 1991
CARDIOLOGY MEETING
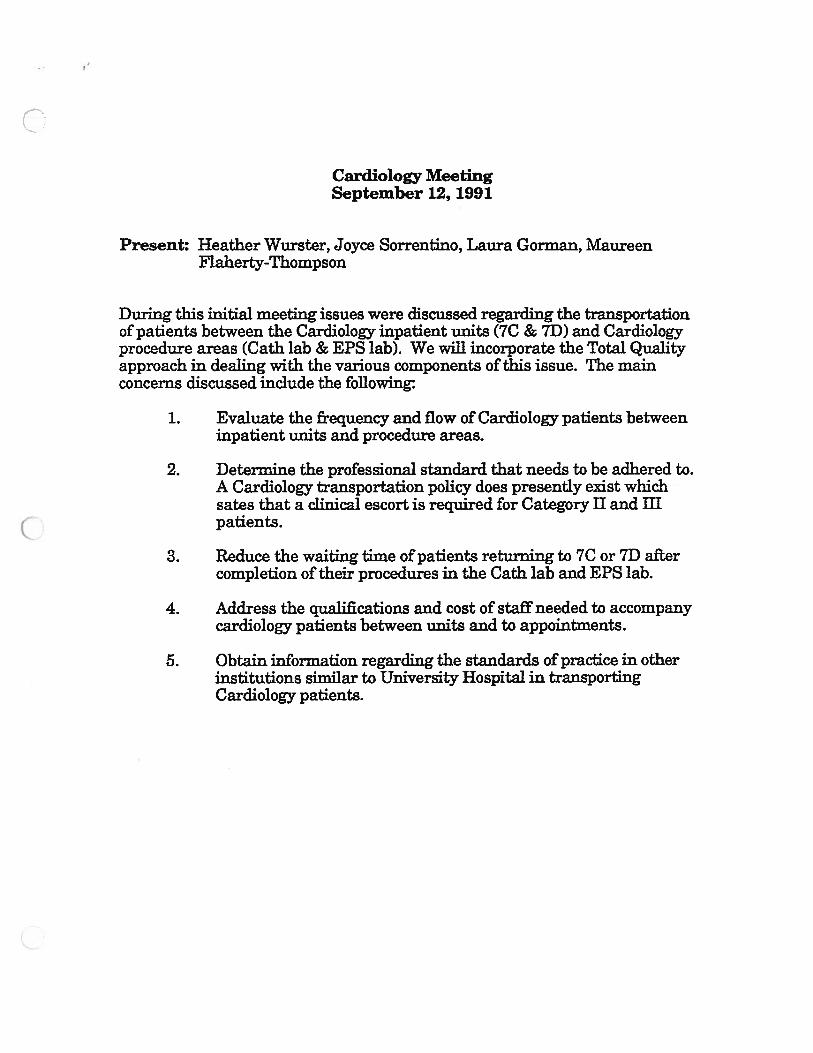
Cardiology MeetingSeptember 12, 1991
Present: Heather Wurster, Joyce Sorrentino, Laura Gorman, MaureenFlaherty-Thompson
During this initial meeting issues were discussed regarding the transportationof patients between the Cardiology inpatient units (7C & 7D) and Cardiologyprocedure areas (Cath lab & EPS lab). We will incorporate the Total Qualityapproach in dealing with the various components of this issue. The mainconcerns discussed include the following
1. Evaluate the frequency and flow of Cardiology patients betweeninpatient units and procedure areas.
2. Determine the professional standard that needs to be adhered to.A Cardiology transportation policy does presently exist whichsates that a clinical escort is required for Category II and IIIpatients.
3. Reduce the waiting time of patients returning to 7C or 7D aftercompletion of their procedures in the Cath lab and EPS lab.
4. Address the qualifications and cost of staff needed to accompanycardiology patients between units and to appointments.
5. Obtain information regarding the standards of practice in otherinstitutions similar to University Hospital in transportingCardiology patients.
APPENDIX 2.DATA COLLECTION FORMS
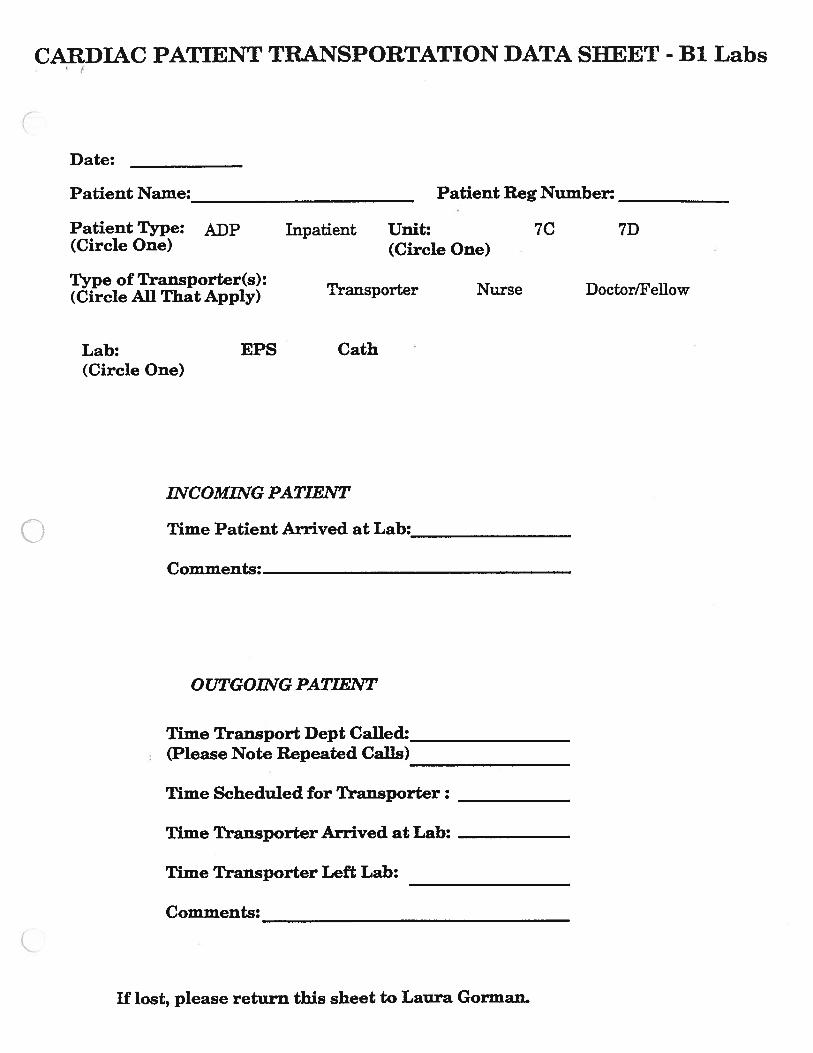
CARDIAC PATIENT TRANSPORTATION DATA SifEET - Bi Labs
Date:
____________
Patient Name:_____________________ Patient Reg Number:
_______
Patient Type: ADP Inpatient Unit: 7C 7D(Circle One) (Circle One)
Type of Transporter(s):(Circle All That Apply) Transporter Nurse Doctor/Fellow
Lab: EPS Cath(Circle One)
INCOMING PATIENT
Time Patient Arrived at Lab:____________
Comments:
OUTGOING PATIENT
Time Transport Dept Cafleth__________(Please Note Repeated Calls)___________
Time Scheduled for Transporter:
______
Time Transporter Arrived at Lab:
_______
Time Transporter Left Lab:
Comments:_______________________________
If lost, please return this sheet to Laura Gorman.
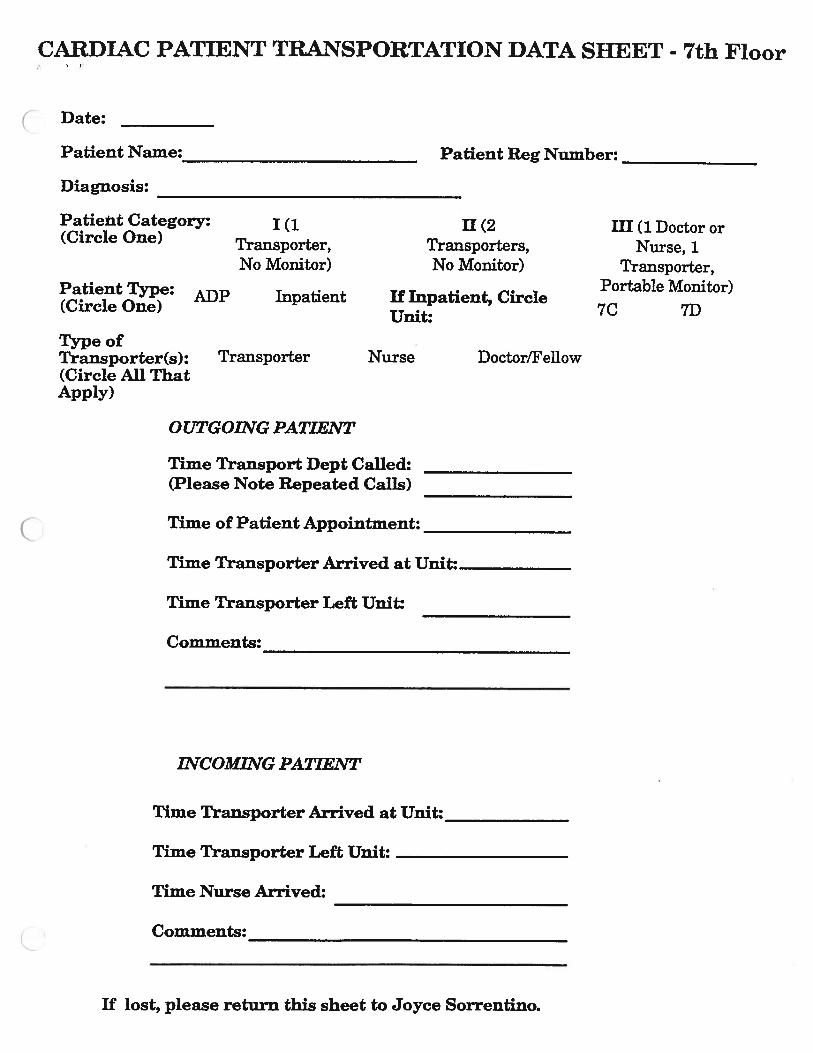
CARDIAC PATIENT TRANSPORTATION DATA SHEET - 7th Floor
Date:
__________
Patient Name:_______________________ Patient Reg Number:
___________
Diagnosis:
_________________________________
Patient Category: i (1 II (2 III (1 Doctor or(Circle One) Transporter, Transporters, Nurse, 1
No Monitor) No Monitor) Transporter,Patient TyPe: ADP Inpatient If Inpatient, Circle
Portable Monitor)(Circle One) 7C 7D
Type ofTransporter(s): Transporter Nurse Doctor/Fellow(Circle All ThatApply)
OUTGOING PATIENT
Time Transport Dept Called:
__________
(Please Note Repeated Calls)
___________
Time of Patient Appointment:___________
Time Transporter Arrived at Unit:________
Time Transporter Left Unit:
Comments:______________________________
INCOMING PATIENT
Time Transporter Arrived at Unit:_________
Time Transporter Left Unit:
______________
Time Nurse Arrived:
Comments:_________________________________
If lost, please return this sheet to Joyce Sorrentino.
APPENDIX 3.CARDIAC TRANSPORTATION POLICY
Division of Cardiology• The University of Michigan Department of Internal Medicine
Mecncai Center (313) 936-5260Ann Ar Michigan 48109-0366
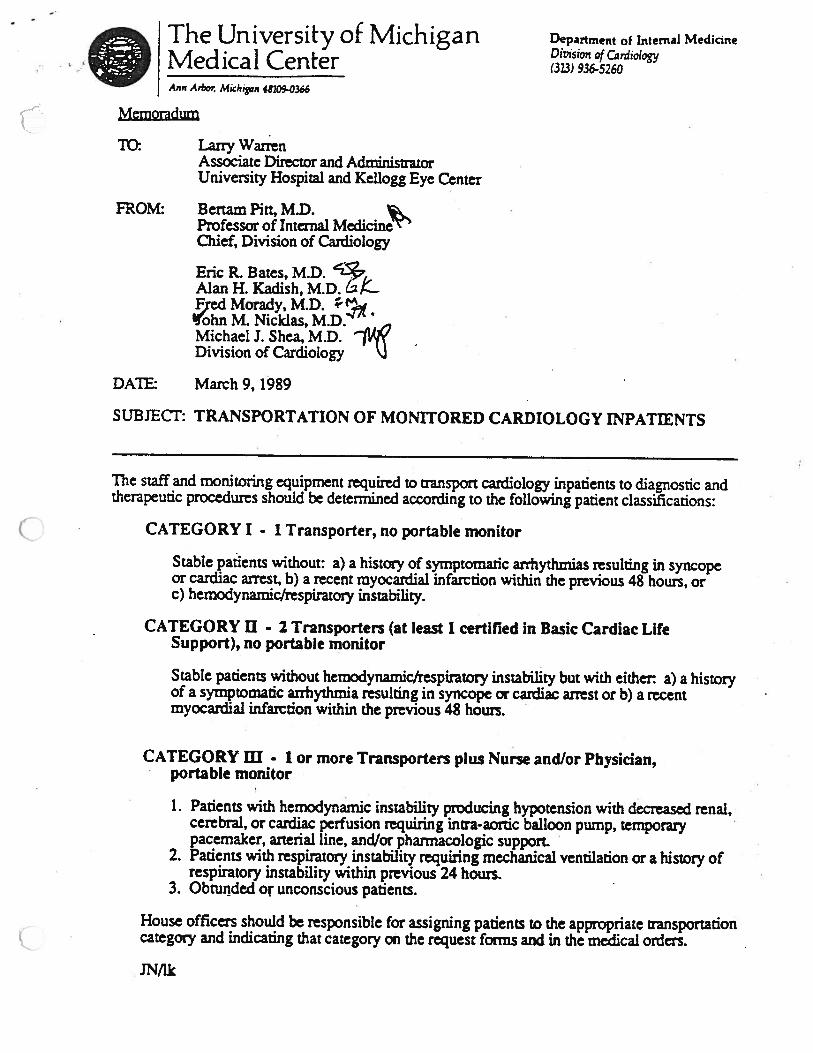
Memoradum
TC Larry WarrenAssociate Director and AdministratorUniversity Hospital and Kellogg Eye Center
FROM: Bertam Pitt, M.D.Professor of Internal MedicineChief, Division of Cardiology
Eric R. Bates, M.D. ‘Z*
Alan H. Kadish, M.D. &ed Morady, M.D.
0Michael 3. Shea, M.D.Division of Cardiology
DATh: March9, 1989
SUBJECT: TRANSPORTATION OF MONiTORED CARDIOLOGY INPATTENTS
The staff and monitoring equipment required to transport cardiology inpatients to diagnostic andtherapeutic procedures should be determined according to the following patient classifications:
CATEGORY I • 1 Transporter, no portable monitor
Stable patients without: a) a history of symptomatic arrhythmias resulting in syncopeor cardiac arrest, b) a recent myocardial infarction within the previous 48 hours, orc) hemodynamic/respiratory instability.
CATEGORY U - 2 Transporters (at least 1 certified in Basic Cardiac LifeSupport), no portable monitor
Stable patients without hemodynamicfrespiratory instability but with either: a) a historyof a symptomatic arrhythmia resulting in syncope or cardiac arrest or b) a recentmyocardial infarction within the previous 48 hours.
CATEGORY III. 1 or more Transporters plus Nurse and/or Physician,portable monitor
1. Patients with hemodynamic instability producing hypotension with decreased renal,cerebral, or cardiac perfusion requiring inna-aortic balloon pump, temporary V
pacemaker, arterial line, and/or pharmacologic support.V
2. Patients with respiratory instability requiring mechanical ventilation or a history ofrespiratory instability within previous 24 hours.
3. Obrunded or unconscious patients.
House officers should be responsible for assigning patients to the appropriate transportationcategory and indicating that category on the request fonns and in the medical orders.
IMk
I
1•
LI
DL
L
r1
L
r1
r
OErI
L
U
L
L
r
—
I
SEISVDNO-UGV
UX1UNIddV
L
Dr
0a)
CARDIAC
#OFCASES
0•1
GYN
a)
NEURO
ORAL
ORTHO
OTO
PLASTICSCl)m
C,m
SEC
SGI
z0CD30CD-‘
-
CDCD
I
0zC.)
C’)mC’)
SON
STX
SVA
TBE
THORACIC
UROLOGY
C-
-I-
01
CC
U)Ci)
)
CD’30CD
CDCI)cDm LU)
HOURS-L1%)
000001
ooa)0
I CARDIAC
GYN
NEURO
ORAL
ORTHO
OTO
PLASTICSC,)m
SECC)Ill
SGI
SON
STX
SVA
TBE
THORACIC
UROLOGY
i
0C-
-I-
_1
00CC
Cd)Cd)
CD’30CD
(0(1)corn —La,
HOURS
C000III
Cfl0)oo
Cl)m
C,m
CARDIAC
GYN
NEURO
ORAL
ORThO
OTOI
PLASTICS
SEC
SGI
SON
STX
SVA
TBE
THORACIC
UROLOGY
ii
-.
$.L, ..:.•....•..:-:.:::::.....j
::
:4—I0C)
r
I
C
C
L.
C
r
C
L
L
--
M010)
#OFCASES
00,‘CC)U)U)mU)
CARDIAC
GYN
NEURO
ORAL
ORTHO
OTO
PLASTICS
SEC
SGI
SON
STX
SVA
TBE
THORACIC
UROLOGY
D
F
F
1L.
r
L
I
C
CD
#OFCASES
HOURS
#OFCASES
4=00-IlCC)U)U)mU)
U.
0Cø).cn
Cl)m
C)m
CARDIAC
GYN
NEURO
ORAL
ORTHO
OTO
PLASTICS
SEC
SGI
SON
STX
SVA
TBE
THORACIC
UROLOGY
z0CD30CD
CoCD
0>
oàC)
0>CC,)
CflCI)
F
rL
a
r
L
APPENDIX C
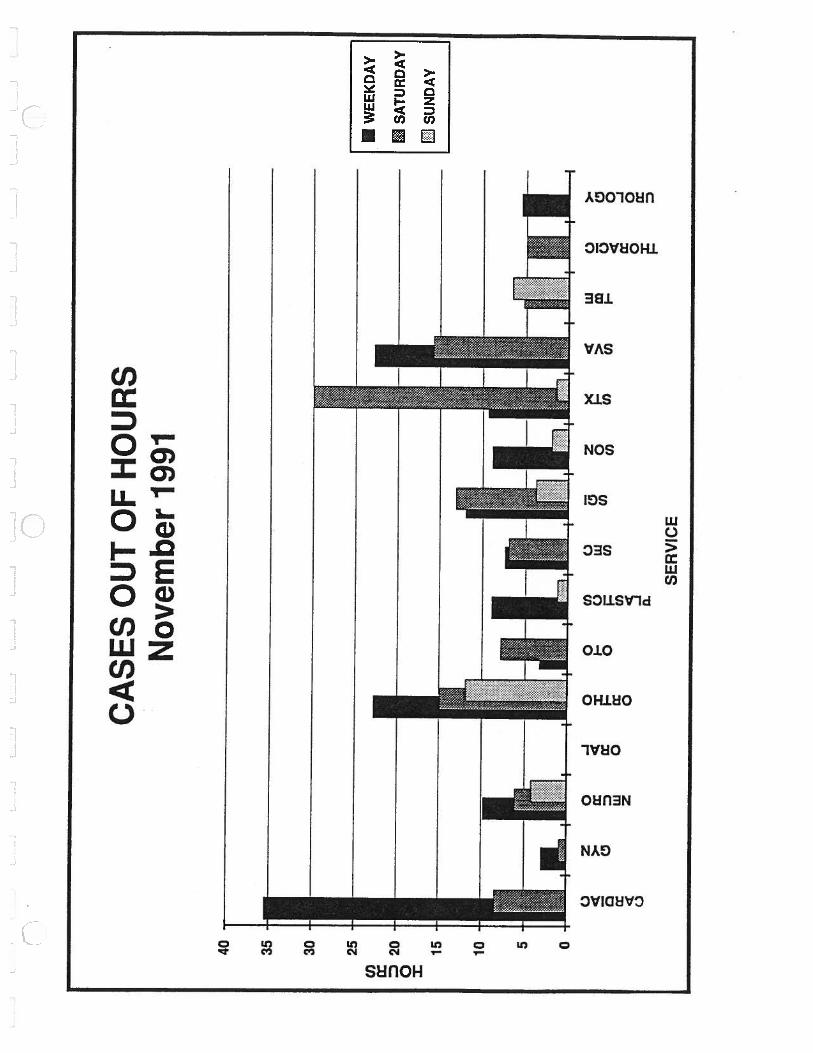
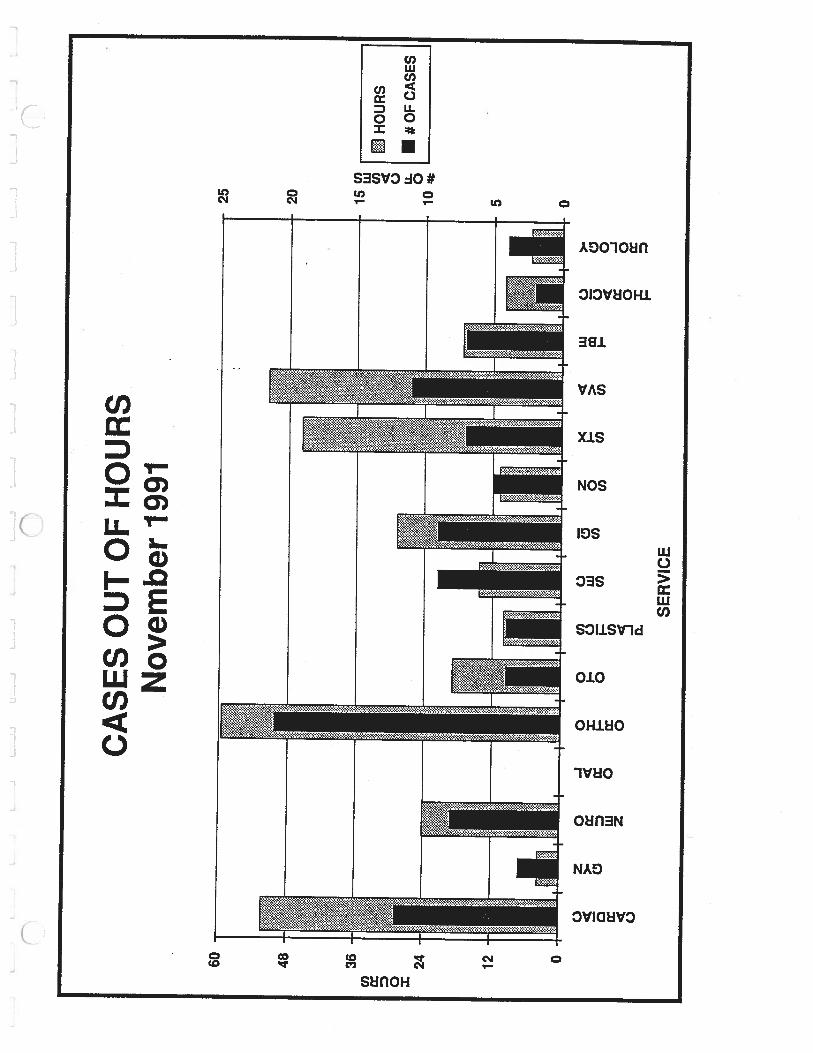
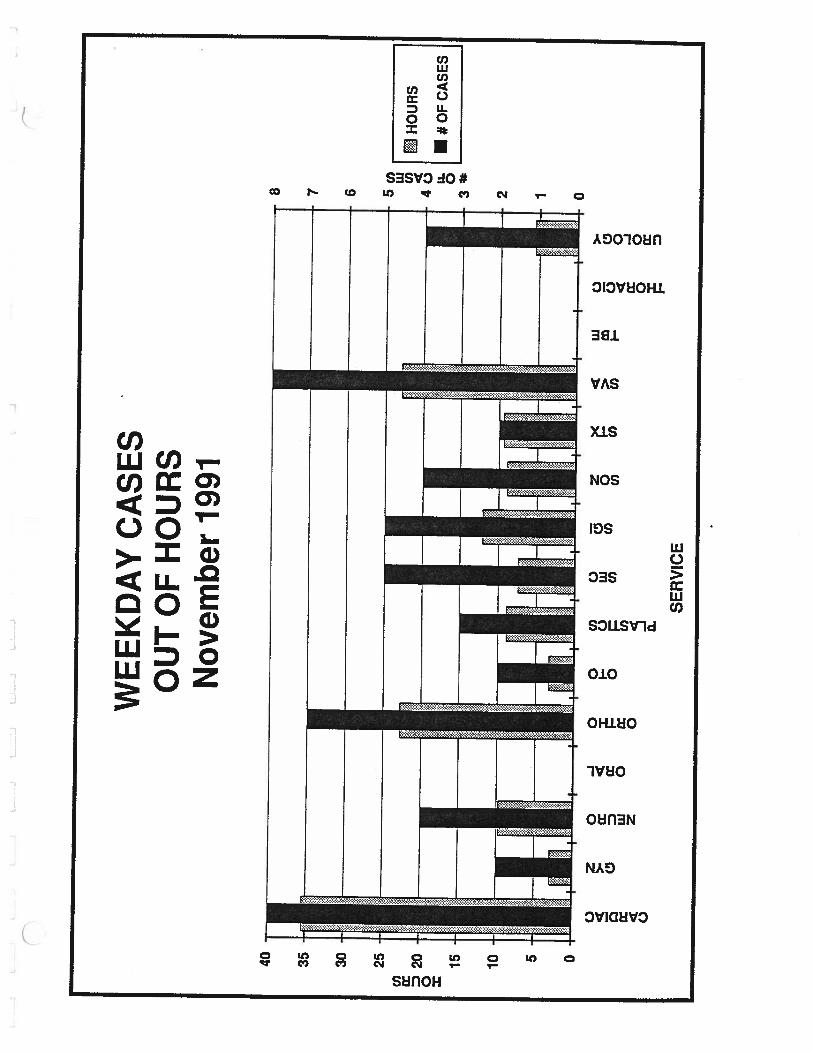
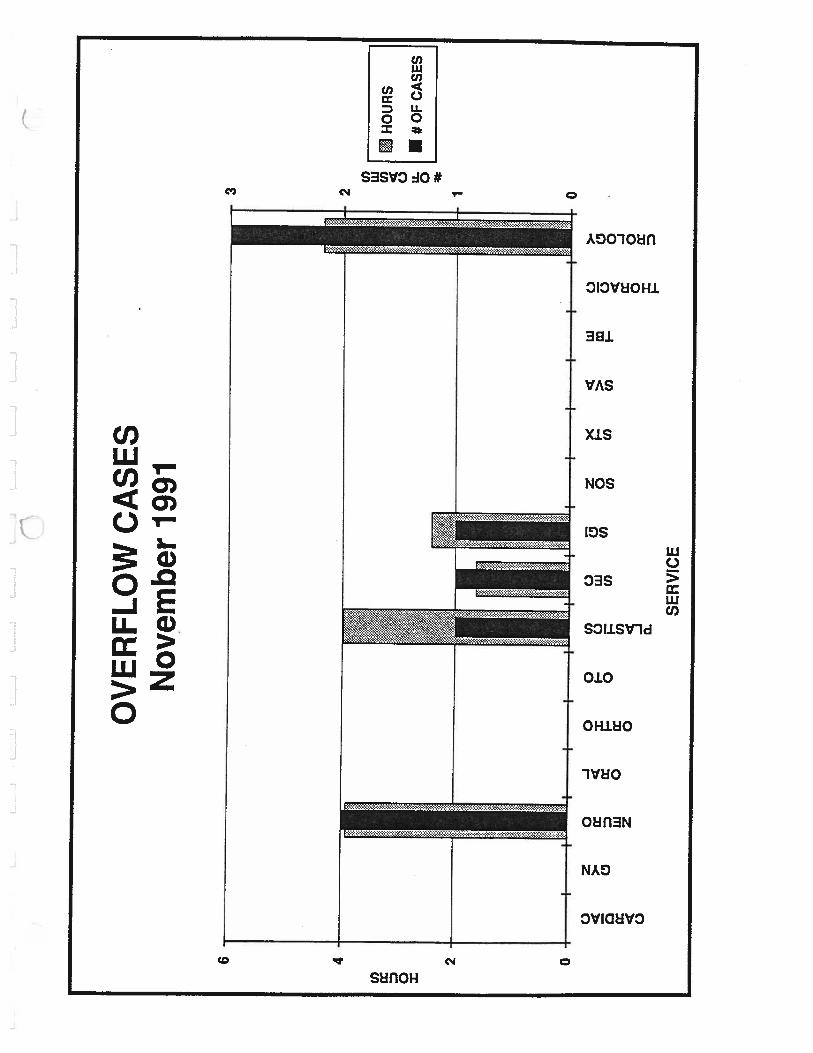
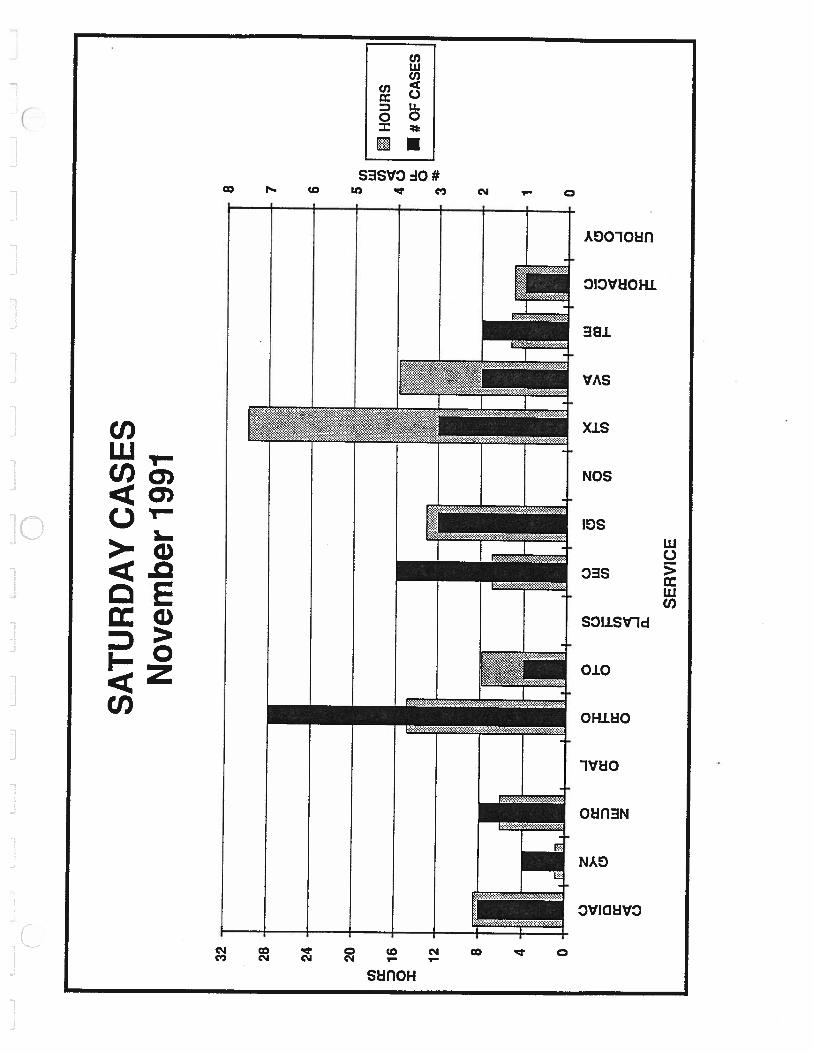
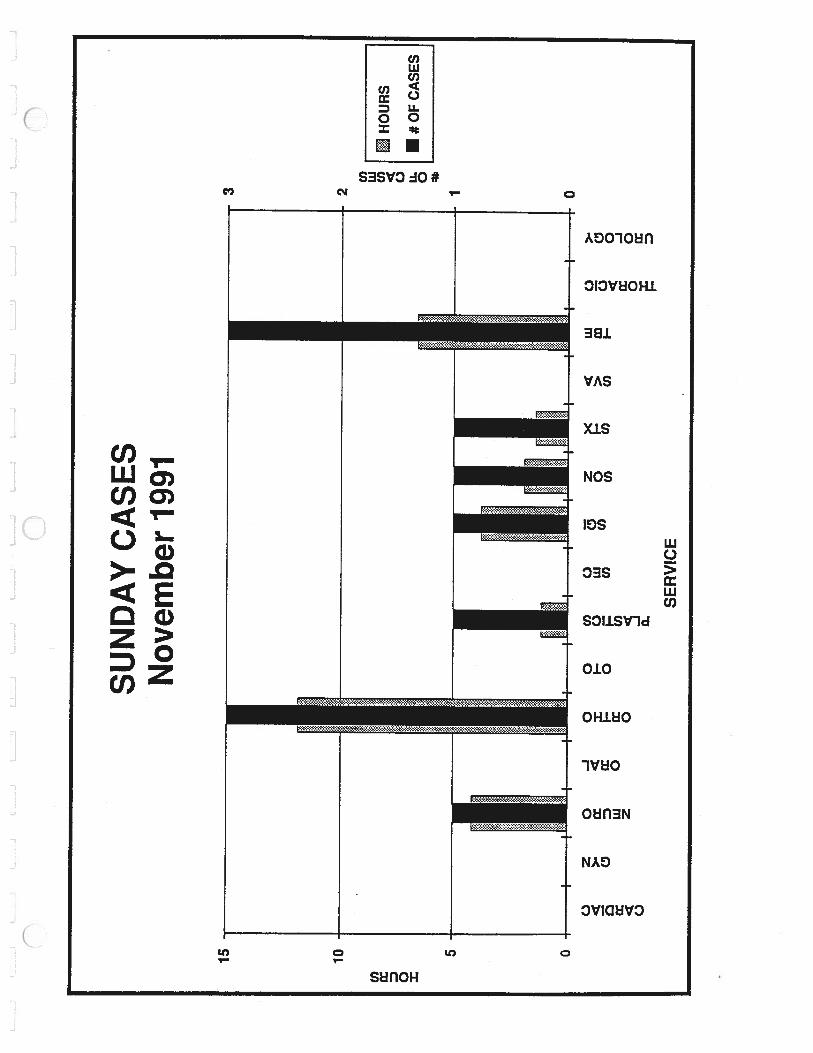
CASES OUT OF HOURS
CA
SE
SO
UT
OF
HO
UR
SN
ovem
ber
1991
U) U)
HO
UR
S3
00
•#O
FC
AS
ES
160
140
-
120
-
100
-
U) cc D 0 =
•60
-50
•40
80-
60-
40-
20-
0
•20
•10 0
WE
EK
DA
YO
UT
OF
HO
UR
SSA
TU
RD
AY
CA
SES
SUN
DA
YC
ASE
S
#OFCASES0-F.)CZ.bUiC)-C)
CARDIAC
GYN
NEURO
ORAL
ORTHO
OTO
PLASTICS
SEC
SGI
SON
STX
SVA
TBE
THORACIC
C’)m
C)m
z0CD
CD-‘
CDCD-
C-)
Cl)mCl)
CC-IC-n=CC
Cl)
UROLOGY
U)Cl)
-m C
-C
)
C)>Cl)
ZmCI)(DO
CD
(0=
C
C,)
HOURS•p.)p.)C)C).
0Cfl0CJi0CJ10
C,)m
C)m
CARDIAC
GYN
NEURO
ORAL
ORTHO
OTO
PLASTICS
SEC
SGI
SON
STX
SVA
TBE
THORACIC
UROLOGY
csCi)Ci)m Z-‘m C
-C
HOURS-L
oC’)a)
0)0
CARDIAC
GYN
NEURO
ORAL
ORTHO
OTO
PLASTICSU)m
SECC,m
SGI
SON
STX
SVA
TBE
ThORACIC
UROLOGY
C)
Cl)ZmCl)mO3CcT-ICDI-’
(Dz
C
C,)
r
r
)
0CnL.L0Cfl0UI
#OFCASES
m.=
00-nCC, .U)Cl)mU)
ThORACIC
UROLOGY
0-rzC).Cli
#OFCASES
00-nCC)>0)U)mU)
0)-.10)
HOURS-r.3
0Cli0Cli0MC.)C).Cli0(310
CARDIAC
GYN
NEURO
ORAL
ORThO
OTO
PLASTICS
SEC
SGI
SON
STX
SVA
U)m
C,m
r
I
L
z0CD3CD-
CDCD
cc,C>JU)cn
TBE
HOURS0
CARDIAC
a)r
1 GYN
NEURO
ORAL
ORThO
OTO
PLASTICS
SEC
SGI
SON
STX
SVA
U)m
C•)m
z0CD3CD
CoCD-
0m-n0
C.)
C’)mC’)
TBE
THORACIC
UROLOGY
0
#OFCASES
00C
c•)C,)U)mU)
HOURS-r’3r%)c,
o.ao..
Cl)
<CCD
CD-< -‘
&C)CD>(Dcl)
Cl)
CARDIAC
GYN
NEURO
ORAL
ORTHO
OTO
PLASTICSC’)rn
SECC)m
SGI
SON
STX
SVA
TBE
THORACIC
UROLOGY
L
rL
I—
L o•,..,C)fJiO
#OFCASES
o0C
C•)C’)Cl)mcr
0
HOURS
0
CARDIAC
GYN
NEURO
ORAL
ORThO
OTO
PLASTICSCl)m
SECC,m
SGI
SON
STX
SVA
TBE
THORACIC
UROLOGY
Cl)
CD3I
CD
(DC,)(DmCl)
)
r
r
:j.
1
C)
#OFCASES
S
00,1CC,C/)U)mC/)
JL.
JJ
I.J
.J
LJ
LL
....
JL
.J
•••
0 n
rn z I:
CARDIAC
GYN
NEURO
ORAL
ORTHO
OTO
PLASTICSm
SECC)m
SGI
SON
STX
SVA
-DCl)>CZ
OmC•)G)Cl)mm-
z-<m
m0Iz
-D
zmm
CD
CD
mC,,
%OFTOTALCASETIME-C.C1O4CD 0000000000
TBE
THORACIC
UROLOGY
)
%OFTOTALCASETIME--‘
CC0
CARDIAC
PLASTICS
ci) m
C-)m
z0CD30CD
CDCD-L
+-DCCl)
C
zG)
m
m
m
zmcr-I
mCl)
C
-<
ThORACIC
UROLOGY
CARDIAC
GYN
NEURO
ORAL
ORThO
OTO
PLASTICS
Cr)m
SECC,m
SGI
SON
STX
SVA
TBE
THORACIC
UROLOGY
%OFTOTALCASETIME-%)c)01O-.J 00000000
a2a2a2a2a2a2a2a2CD
00a2
m
CDcI)
CD
CD—L-<
m
%OFTOTALCASETIME-
00)0)0
CARDIAC
C,)m
C,m
GYN
NEURO
ORAL
ORTHO
OTO
PLASTICS
SEC
SGI
SON
STX
SVA
TBE
THORACIC
z0CD
0•CD
CDCD
m
C)m-D
0C•)mC
mmz
m
UROLOGY
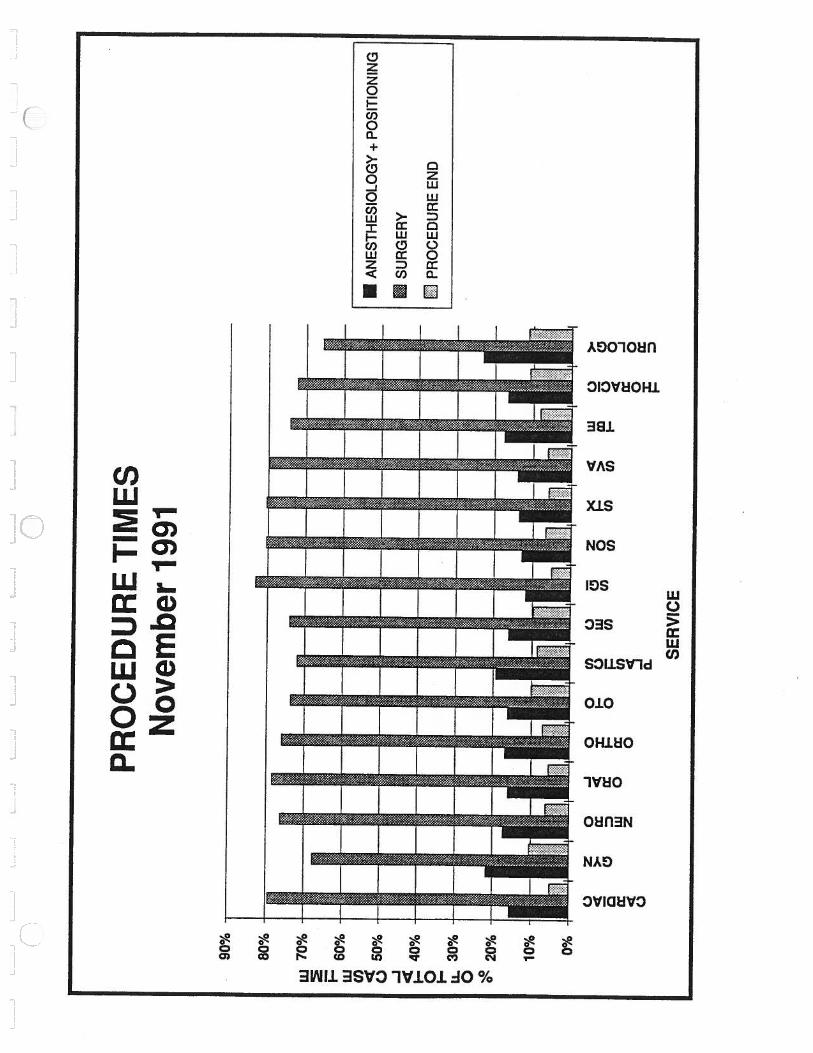
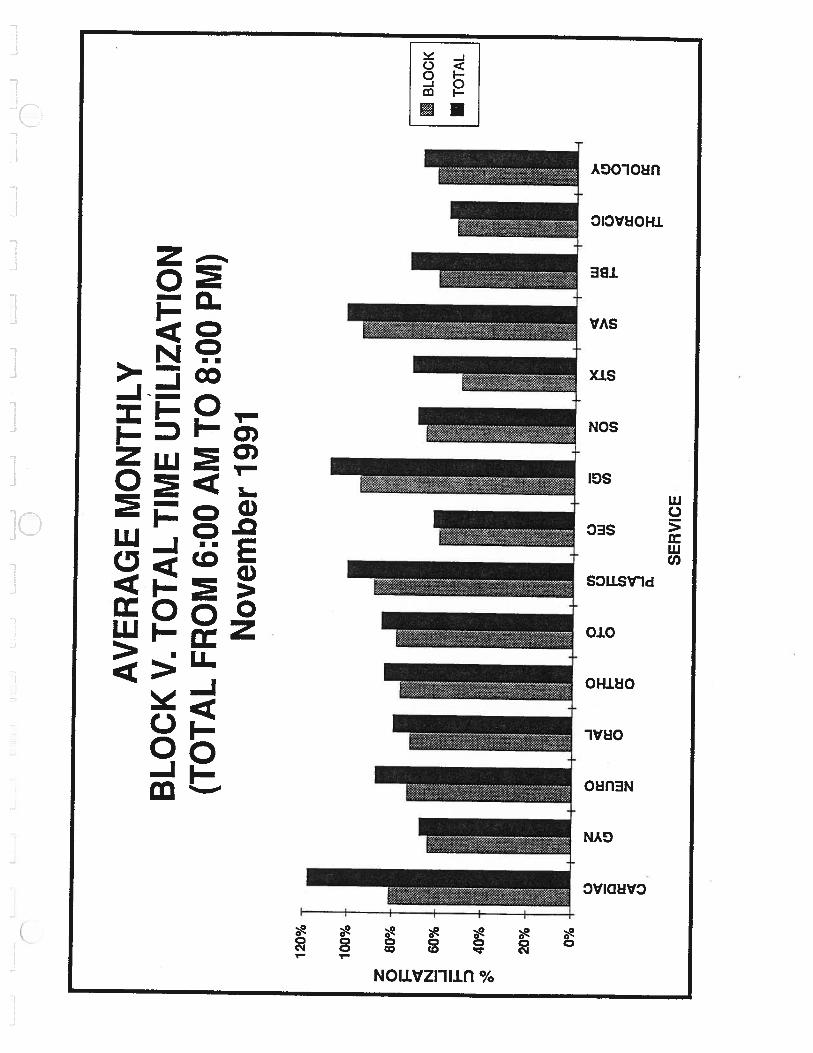
APPENDIX F
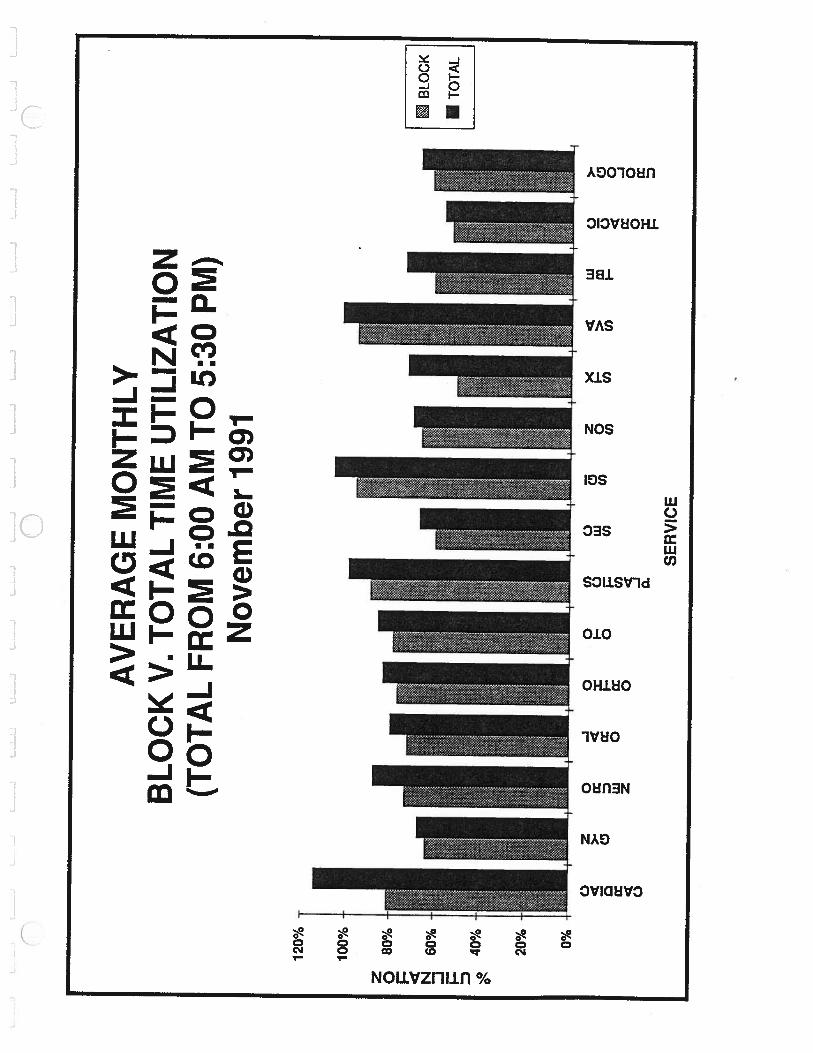
BLOCK TIME AND TOTALTIME UTILIZATION
•1
J
z 0 N -J D
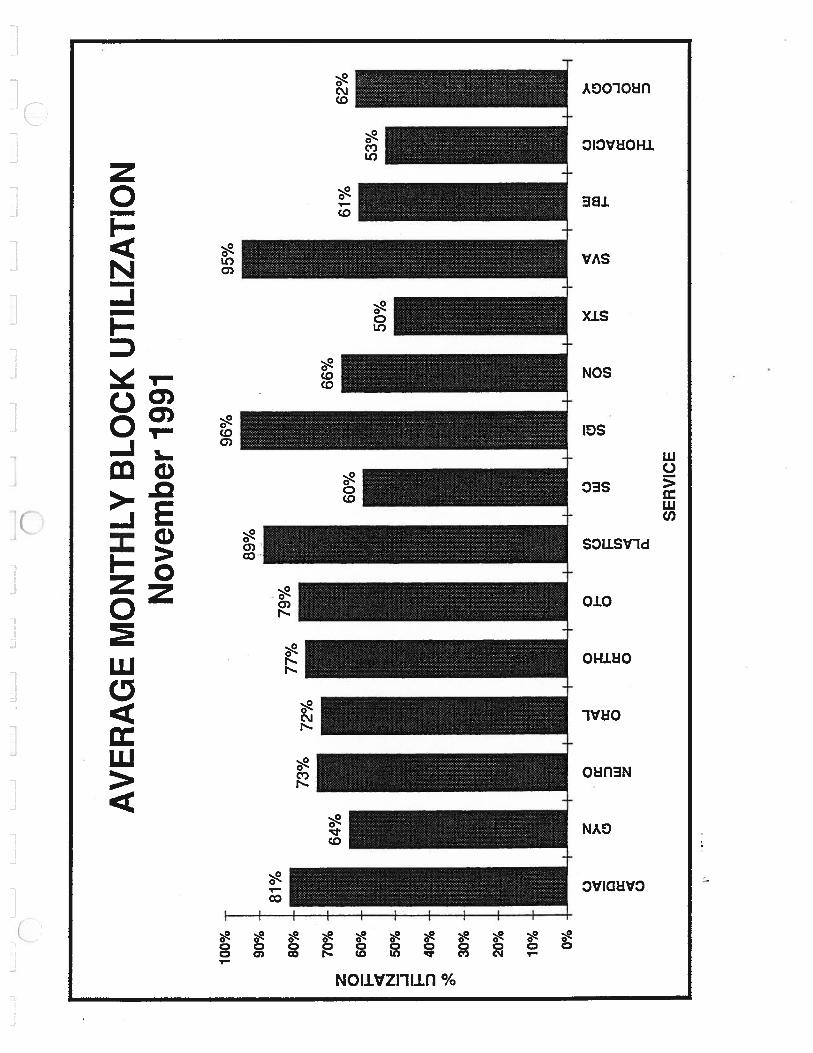
AV
ER
AG
EM
ON
THLY
BL
OC
KU
TILI
ZATI
ON
Nov
embe
r19
91
81%
100% 90%
80%
70%
60%
50%
40%
30%
20%
10% 0%
C.)
ci C.)
z0
-J0
0Cl
)C.
)>
.x
I-C.
)LU
0D
I.-0
Cl)
LU0
rrU
)Z
0
LU>
-
SER
VIC
E
LUC
)Cl
)U
)cc 0
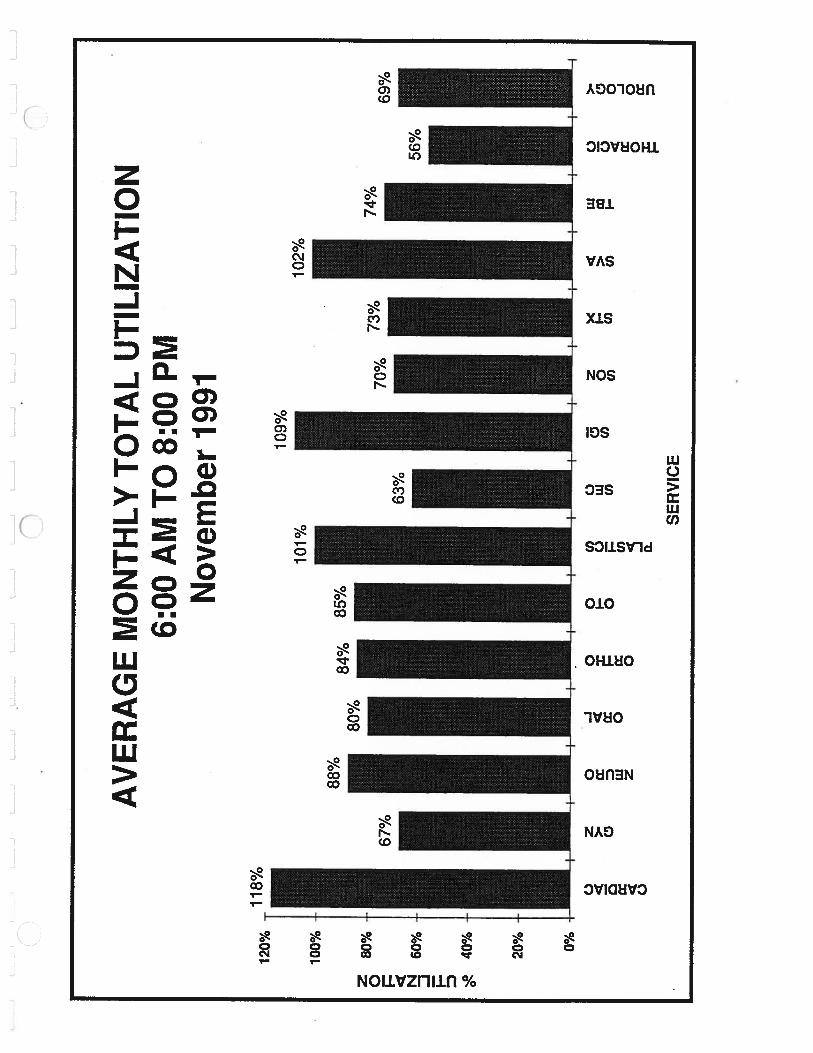
118%
AV
ER
AG
EM
ON
THLY
TO
TA
LU
TILI
ZATI
ON
6:O
OA
MT
O8:
OO
PMN
ovem
ber
1991
z 0 I N -J I
120%
100%
80%
60%
40%
20% 0%
C) 4 a: 4 C)
Z0
>-
a: LU z
-J0
4 a: occ 0
oco
I-.C)
o
a.
C) LU U)
>- C:,
0 -J 0 cc
SE
RV
ICE

L—
-JL-
.J
L..1
IL
_2
z 0 I N -J I D
120%
114%
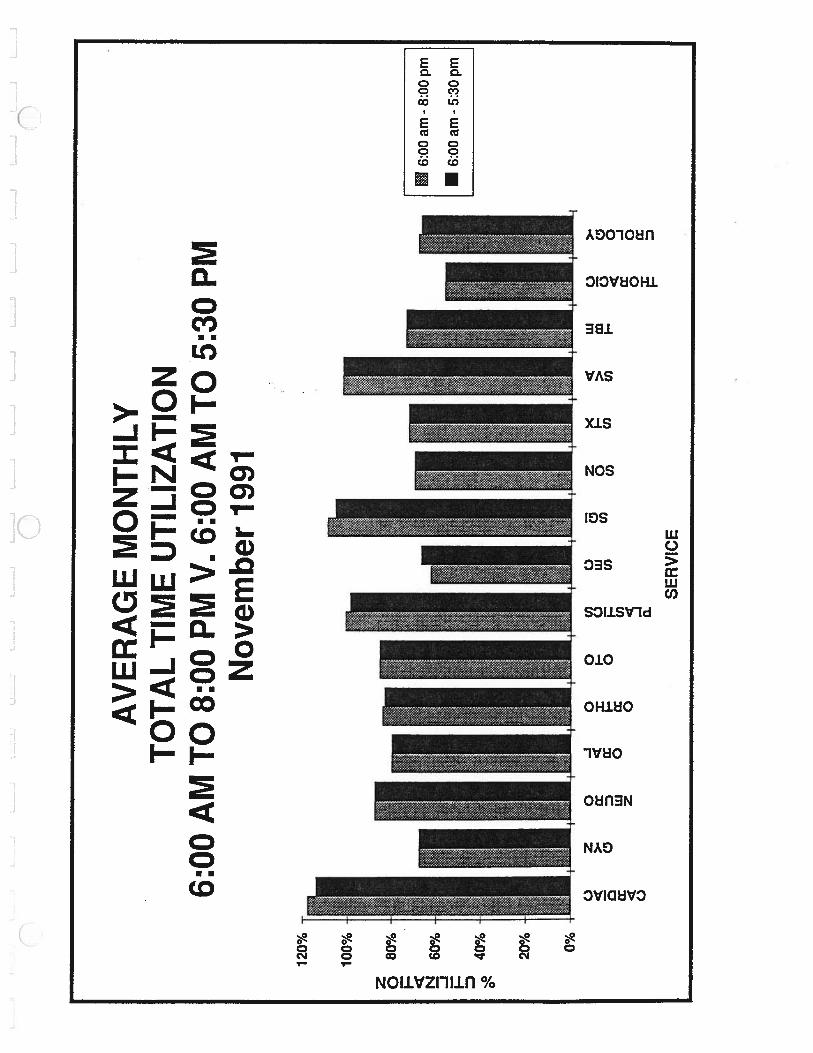
AV
ER
AG
EM
ON
THLY
TO
TA
LU
TILI
ZATI
ON
6:00
AM
TO
5:30
PMN
ovem
ber
1991
100%
80%
60%
40%
20% 0%
C.) cc 0 cc C.)
z0
>.
0D w z
-J0
cc oix 0
oCl
)I-
C)
oU
,
0
zLi
iC
)0
F-
>m
Cl)
U)
Cl)
I—
SER
VIC
E
%UTILIZATION
0)
0
00-1>
zm<0_>
<mm
Coo—z CDN
—Io-<(.71
0-D
.L
r).0)00000000
CARDIAC
GYN
NEURO
Cl)m
C,m
/>/
/
STX
SVA
TBE
THORACIC
UROLOGY
0)0)ocooD3301C.,000D33
%UTILIZATIONr%).
000
1—
--
a)01%)0000
+ C’)‘ii
C.)m
CARDIAC
GYN
NEURO
ORAL
ORThO
OTO
PLASTICS
SEC
SGI
SON
STX
SVA
TBE
THORACIC
UROLOGY
+
z0
CD
CD-
CDCo
-IiO-Ic-) >;‘<>,,a<
-Im
—4>‘>G)‘m0
>omzC0—rco!-<
M0
oZ
-1or- -0>C)
)
%UTILIZATION
THORACIC
-Ii
T1.
a)>G)•
0>
)
Lt).0)0)0 0000000
CARDIAC
GYN
NEURO
ORAL
ORTHO
OTO
PLASTICS
SEC
SGI
SON
STX
SVA
TBE
Cl)m
C,m
z0CD3CD
CDCD
UROLOGY
-4Wo>C)I-ç
180%
160%
140%
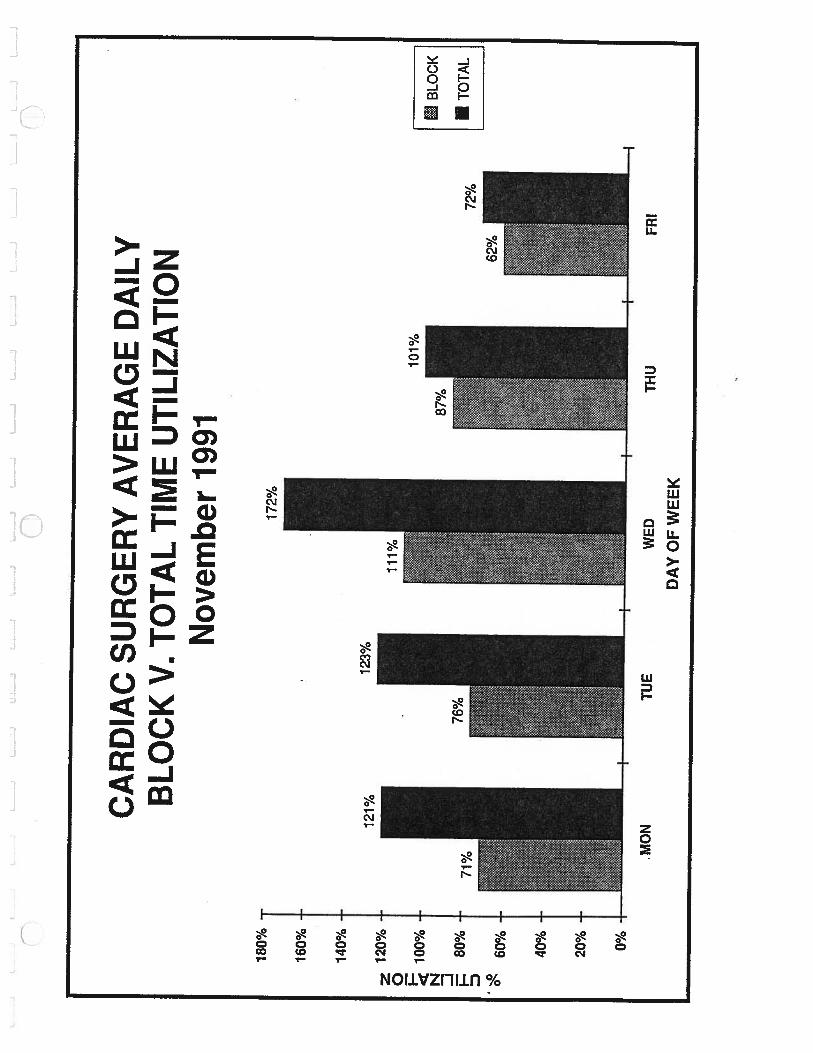
CA
RD
IAC
SUR
GE
RY
AV
ER
AG
ED
AIL
YB
LO
CK
V. T
OT
AL
TIM
EU
TILI
ZATI
ON
Nov
embe
r19
91
tB
LOC
K
72%
STO
TAL
1
z 0 I-.
icE N -J I D
112
0%
100%
80%
60%
40%
20% 0%
101%
MO
NT
UE
WED
THU
DA
YO
FW
EE
K
FRI
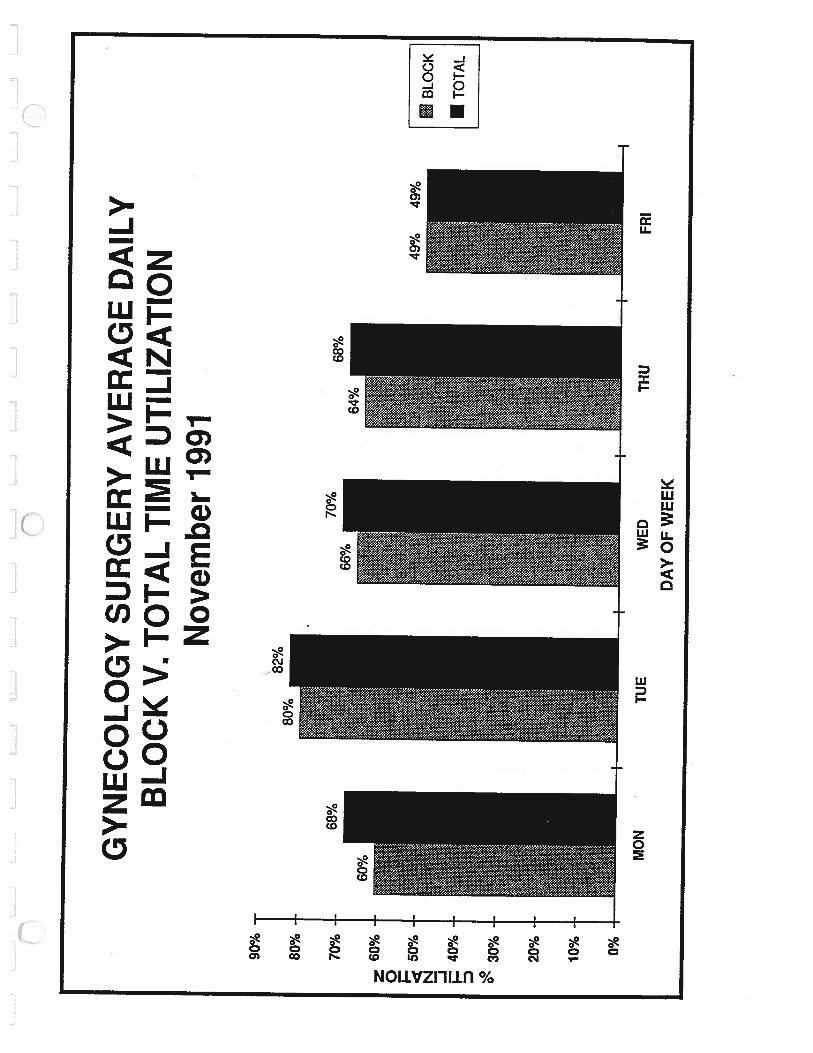
GY
NE
CO
LO
GY
SUR
GE
RY
AV
ER
AG
ED
AIL
YB
LO
CK
V. T
OT
AL
TIM
EU
TILI
ZATI
ON
Nov
embe
r19
91
90%
80%
70%
z60
%0
_______
5Q%
BLO
CK
N -J jz40
%TO
TAL
D °‘
30%
20%
10% 0%
MO
NTU
EW
EDTH
UFR
I
DA
YO
FW
EE
K
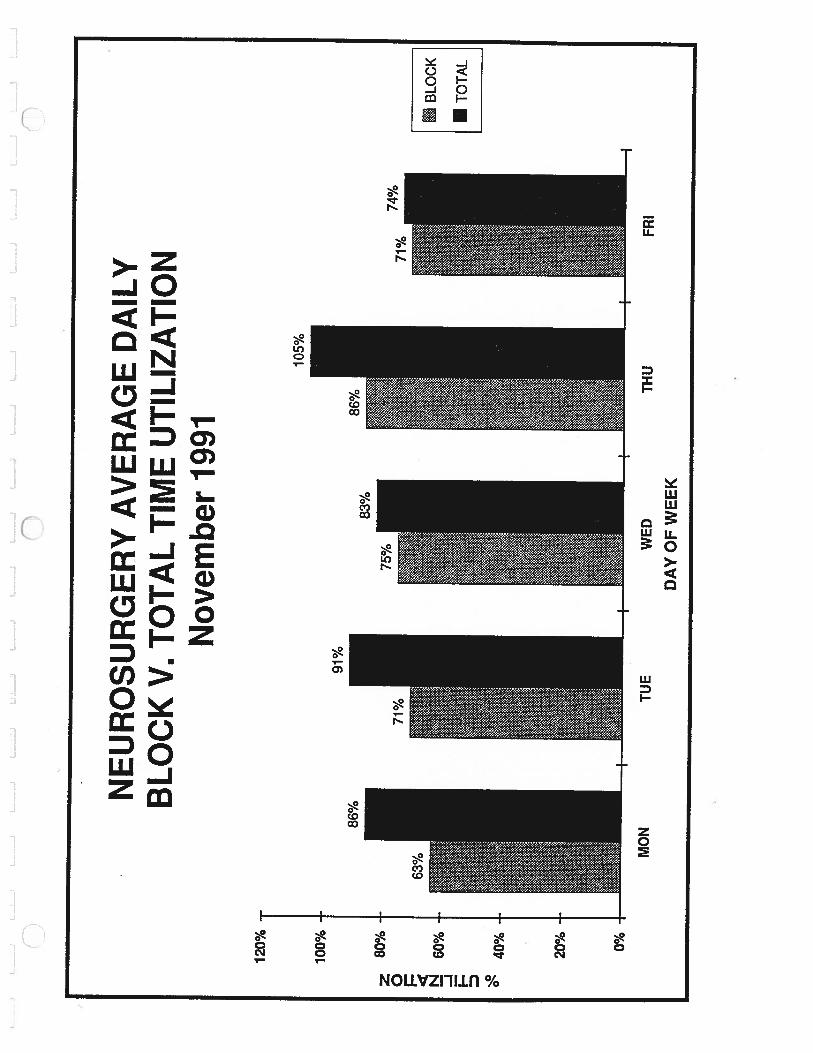
NE
UR
OSU
RG
ER
YA
VE
RA
GE
DA
ILY
BL
OC
KV
. TO
TA
LTI
ME
UTI
LIZA
TIO
NN
ovem
ber
1991
BLO
CK
LmTO
TAL
120%
100% 80%
86%
z 0 N -J I— D
60%
40%
20% 0%
MO
NTU
EW
ED
THU
FRI
DA
YO
FW
EE
K
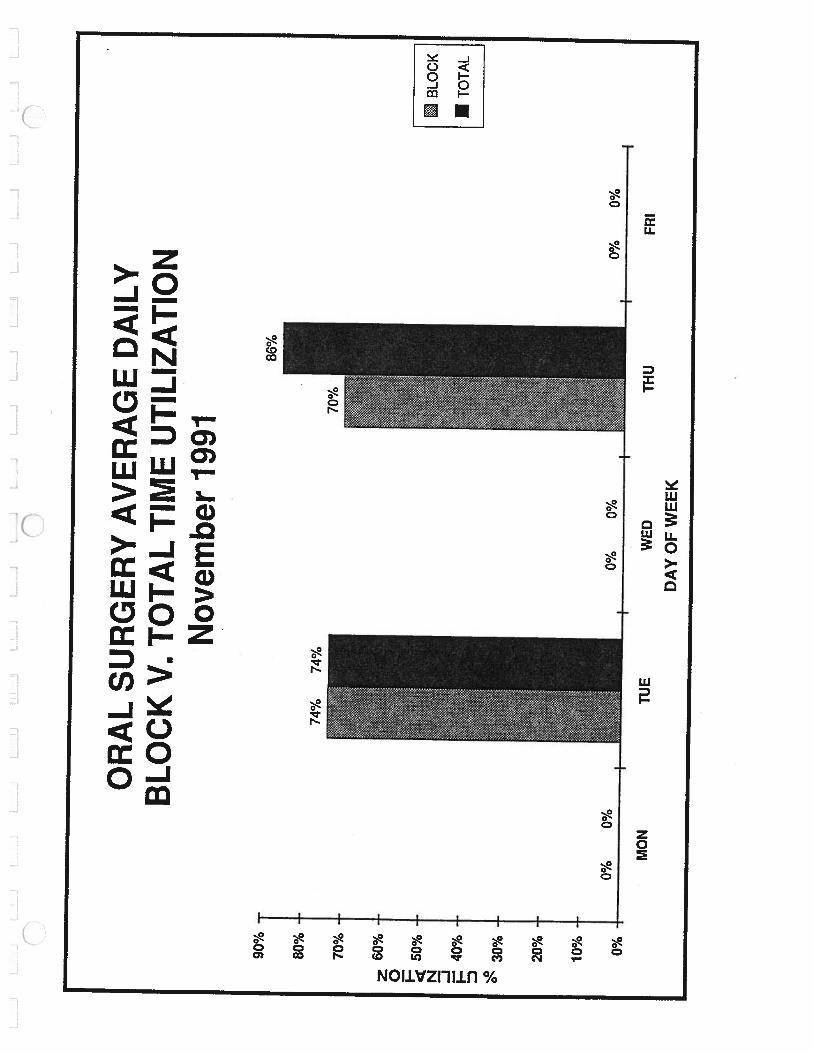
OR
AL
SUR
GE
RY
AV
ER
AG
ED
AIL
YB
LO
CK
V. T
OT
AL
TIM
EU
TILI
ZATI
ON
Nov
embe
r19
91
20%
-
10% 0%
WED
DA
YO
FW
EE
K
BLO
CK
ITO
TAL
90%
-
80%
-
70%
-
60%
50%
40%
30%
z 0 N -j I— D 0’
0%0%
+
MO
NTU
E
0%0%
0%0%
THU
FRI
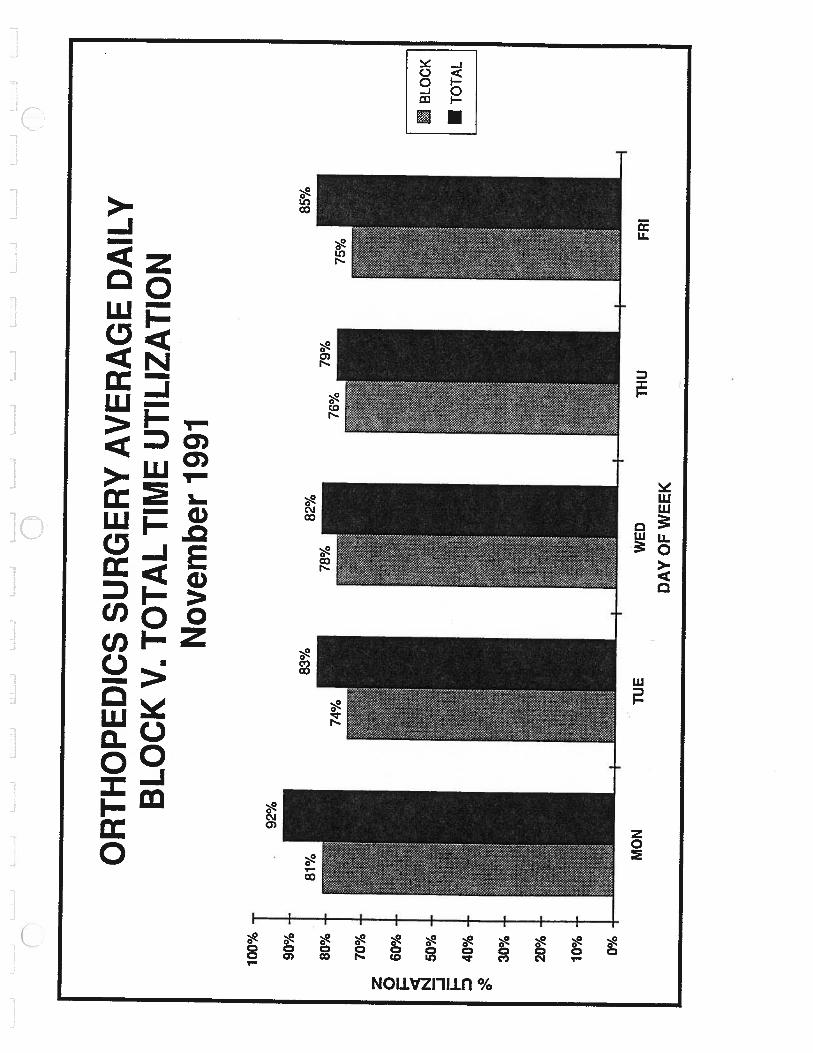
OR
TH
OPE
DIC
SSU
RG
ER
YA
VE
RA
GE
DA
ILY
BL
OC
KV
. TO
TA
LTI
ME
UTI
LIZA
TIO
NN
ovem
ber
1991
WED
DA
YO
FW
EE
K
BLO
CK
ITO
TAL
92%
z 0 I N -J
100% 90%
80%
70%
60%
50%
40%
30%
20%
10% 0%
I
——--
MO
NT
UE
THU
FRI
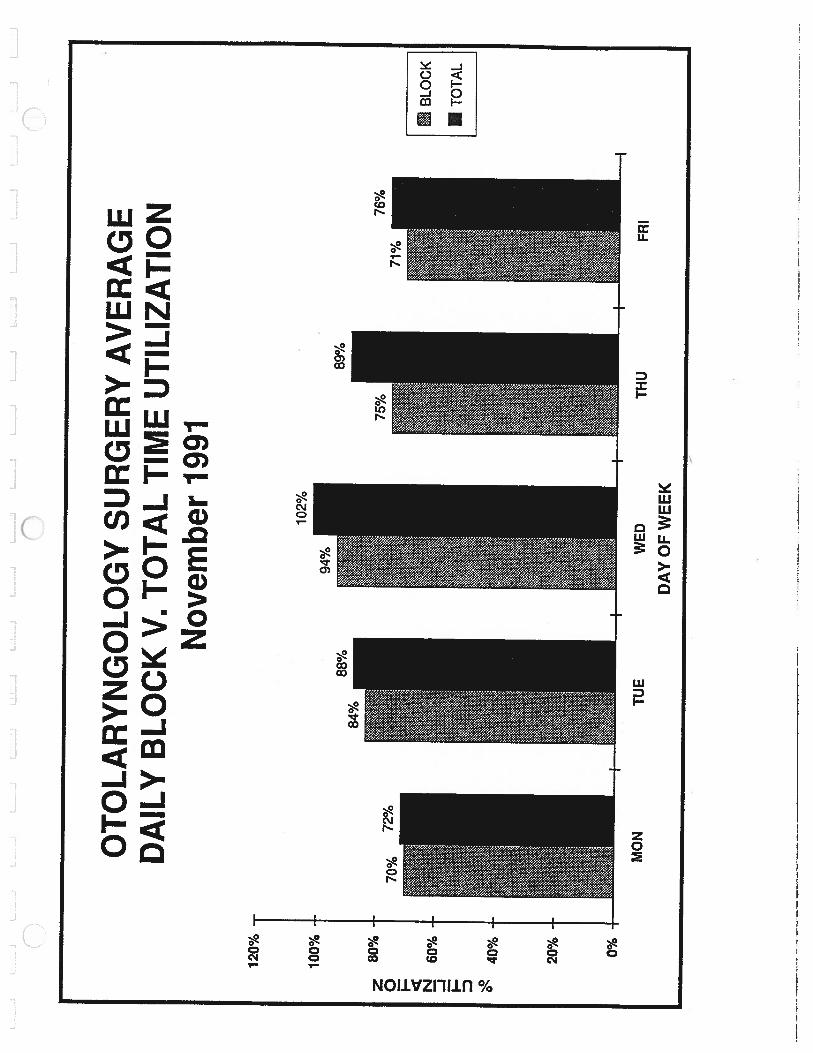
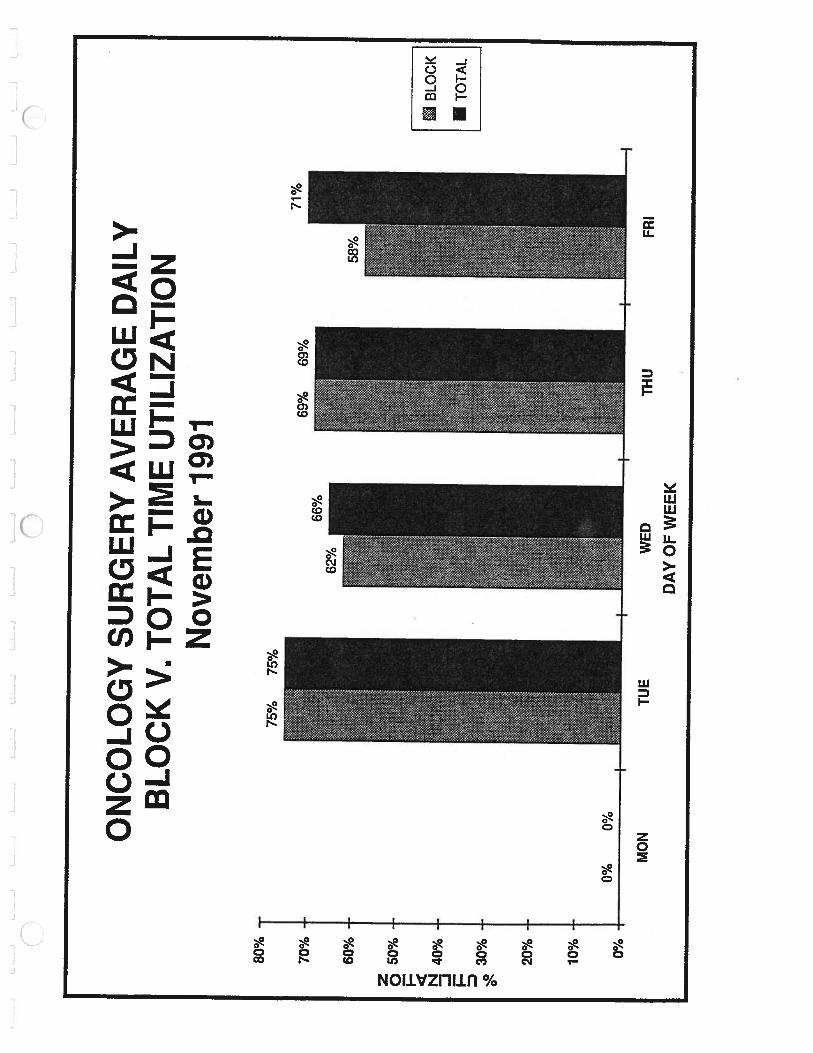
OT
OL
AR
YN
GO
LO
GY
SUR
GE
RY
AV
ER
AG
ED
AIL
YB
LO
CK
V. T
OT
AL
TIM
EU
TILI
ZATI
ON
Nov
embe
r19
91
BLO
CK
ITO
TAL
88%
84%
102%
70%
z 0 I— N -J I
120%
100% 80%
60%
40%
20% 0%
89%
76%
MO
NTU
EW
EDTH
UFR
ID
AY
OF
WE
EK
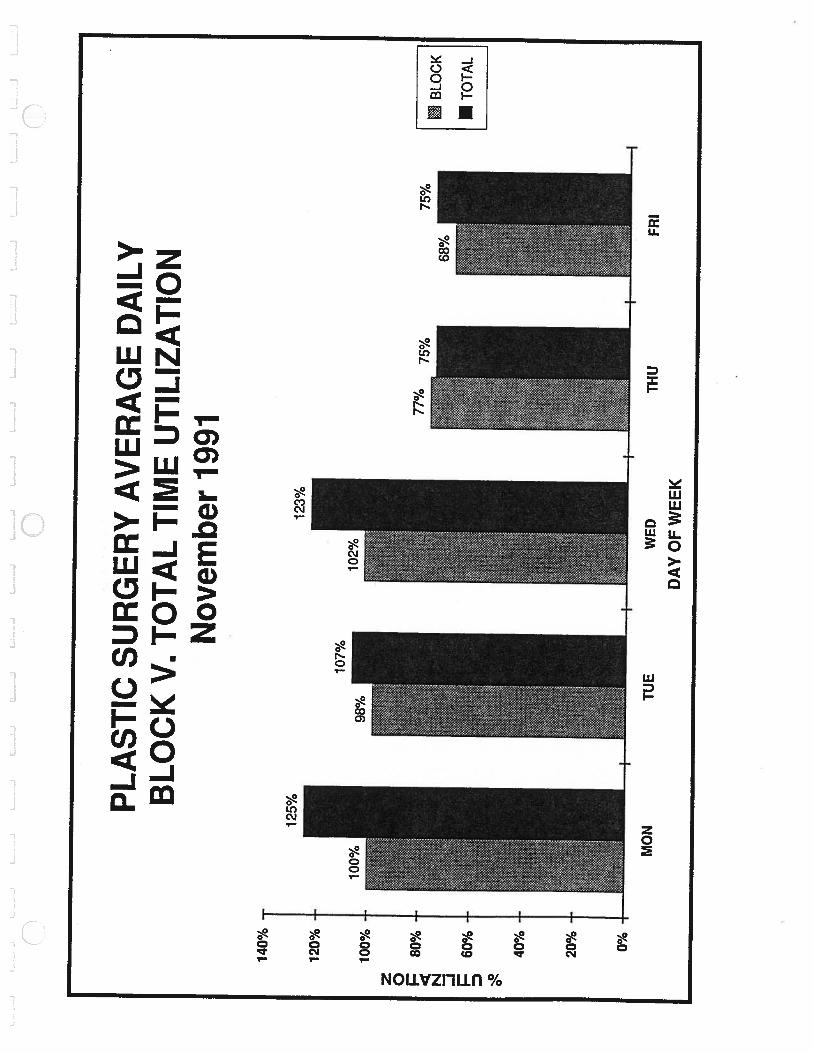
PLA
STIC
SUR
GE
RY
AV
ER
AG
ED
AIL
YB
LO
CK
V. T
OT
AL
TIM
EU
TILI
ZATI
ON
Nov
embe
r19
91
WED
THU
DA
YO
FW
EE
K
riBLO
CK
ITO
TAL
125%
123%
107%
z 0 N -J D
140%
120%
100% 80%
60%
40%
20% 0%
75%
MO
NT
UE
FRI
70%
60%
50%
I-.
40%
I
30%
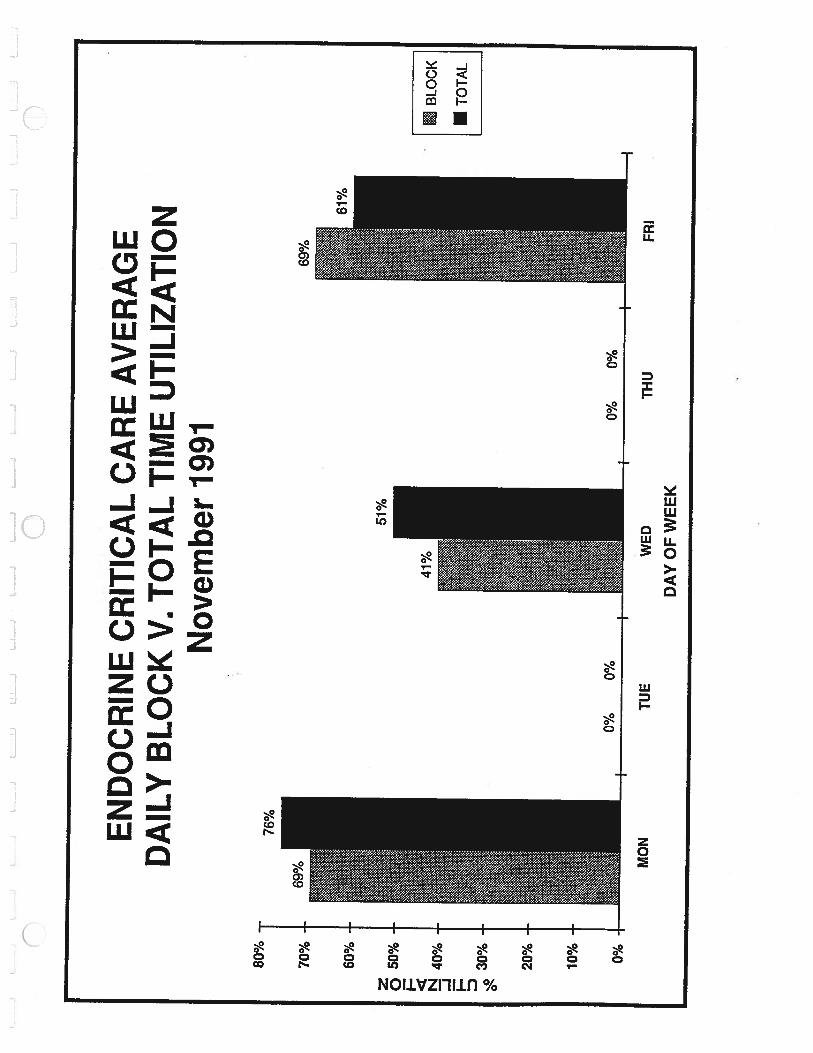
EN
DO
CR
INE
CR
ITIC
AL
CA
RE
AV
ER
AG
ED
AIL
YB
LO
CK
V. T
OT
AL
TIM
EU
TILI
ZATI
ON
Nov
embe
r19
91
80%
51%
20%
10% 0%
BLO
CK
ITO
TAL
0%0%
I-—
—-
II
I
0%0%
MO
NTU
EW
EDTH
UFR
ID
AY
OF
WE
EK
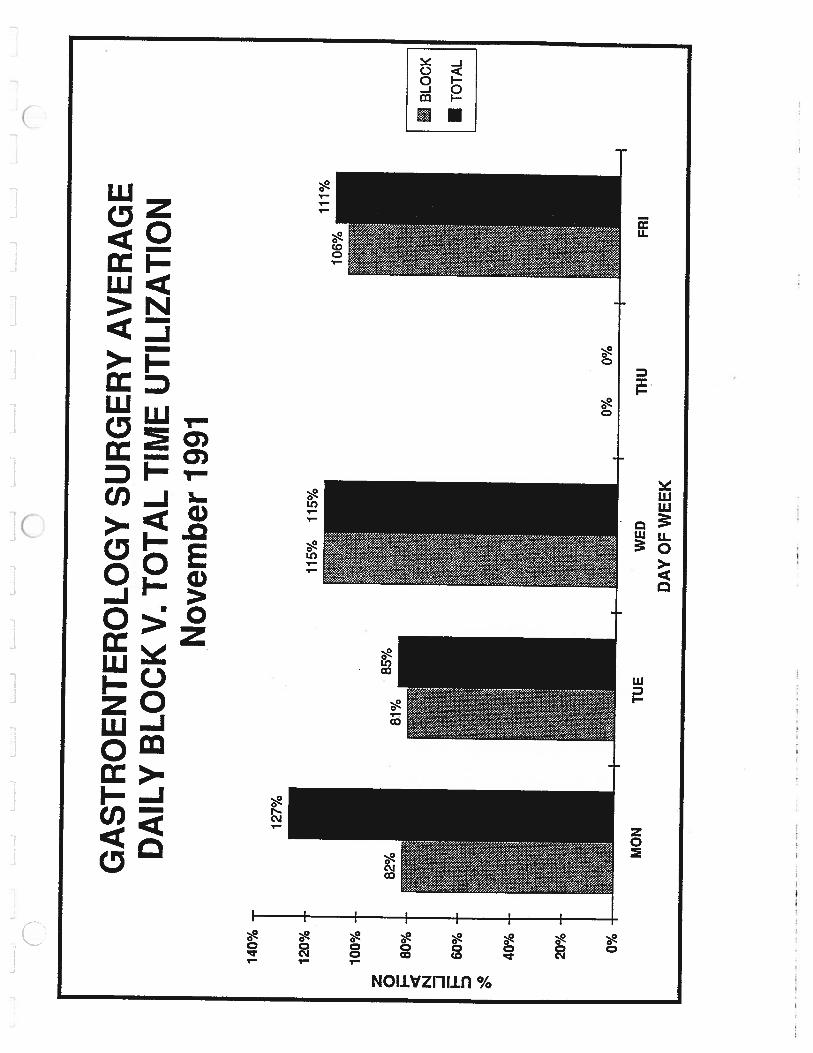
GA
STR
OE
NT
ER
OL
OG
YSU
RG
ER
YA
VE
RA
GE
DA
ILY
BL
OC
KV
. TO
TA
LTI
ME
UTI
LIZA
TIO
NN
ovem
ber
1991
WE
D
DA
YO
FW
EE
K
:B
LOC
K
aTO
TAL
140%
120%
115%
115%
z 0 I-.
N -J I D
100%
80%
60%
40%
20% 0%
MO
NT
UE
0%0%
THU
FRI
ON
CO
LO
GY
SUR
GE
RY
AV
ER
AG
ED
AIL
YB
LO
CK
V. T
OT
AL
TIM
EU
TILI
ZATI
ON
Nov
embe
r19
91
WE
D
DA
YO
FW
EE
K
BLO
CK
ITO
TAL
75%
75%
66%
z 0 N -J I
69%
69%
80%
70%
60%
50%
40%
30%
20%
10% 0%
-
71%
fiO
/(W
Iy
bv
io
MO
NTU
E
II
I
THU
FRI
120%
100%
L-J
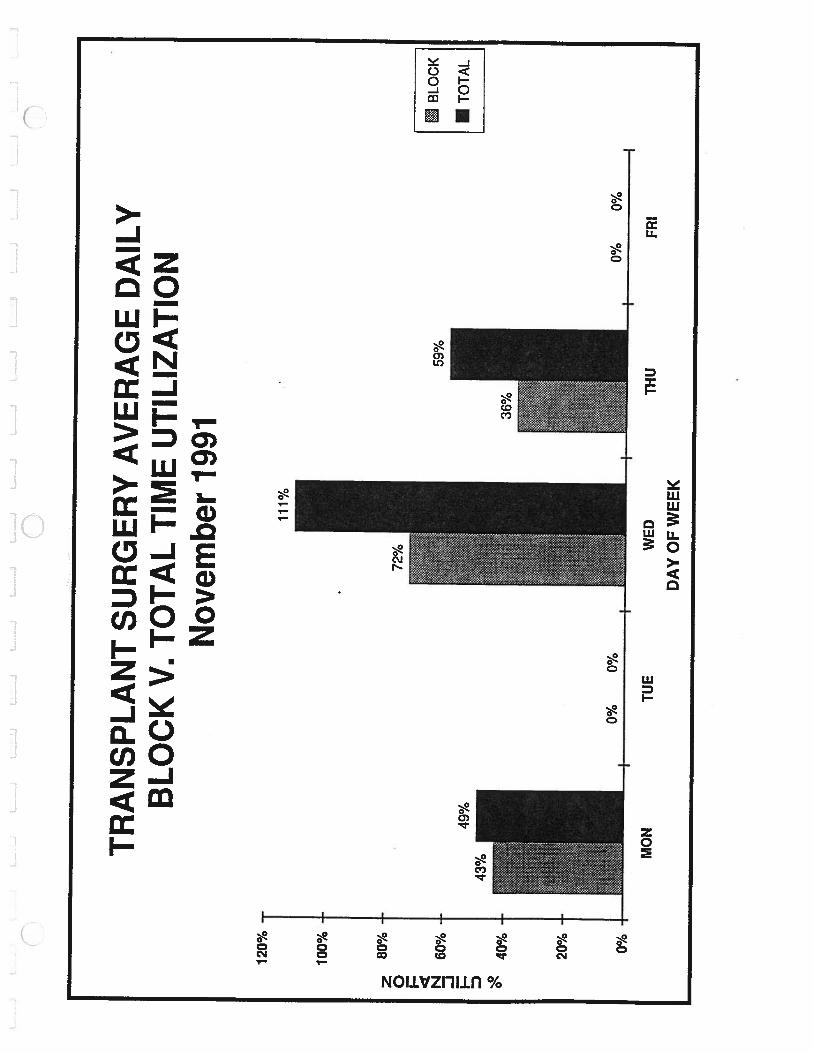
TR
AN
SPL
AN
TSU
RG
ER
YA
VE
RA
GE
DA
ILY
BL
OC
KV
. TO
TA
LTI
ME
UTI
LIZA
TIO
NN
ovem
ber
1991
111%
80%
-
60%
40%
20% 0%
—
MO
N
0%0%
TUE
+
WED
THU
0%0%
FRI
BLO
CK
TOTA
L
z 0 I N -J I— 0”
72%
59%
I
DA
YO
FW
EE
K
140%
120%
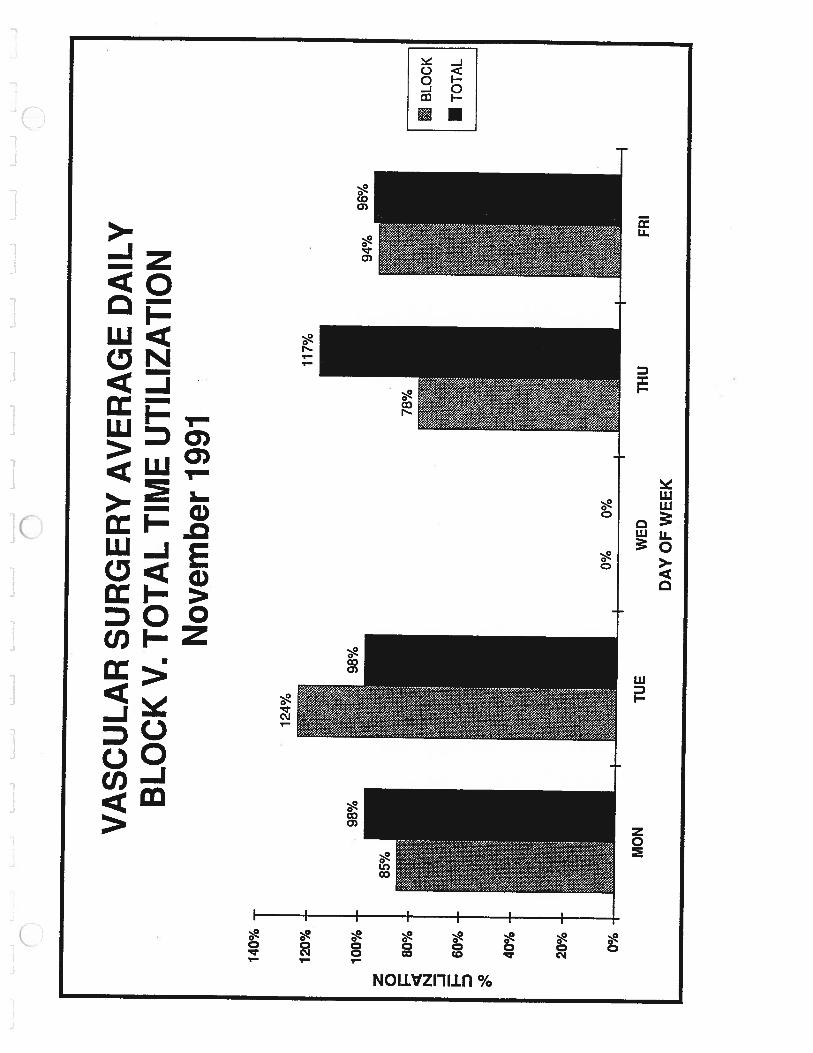
VA
SCU
LA
RSU
RG
ER
YA
VE
RA
GE
DA
ILY
BL
OC
KV
. TO
TA
LTI
ME
UTI
LIZA
TIO
N
124%
Nov
embe
r19
91
WED
DA
YO
FW
EE
K
98%
x 0 N -J I D
100% 80%
60%
40%
20% 0%
-
•iBL
OCK
•T
OT
AL
MO
NI
TUE
0%0%
THU
FRI
z 0 I N -J I— D
180%
160%
140%
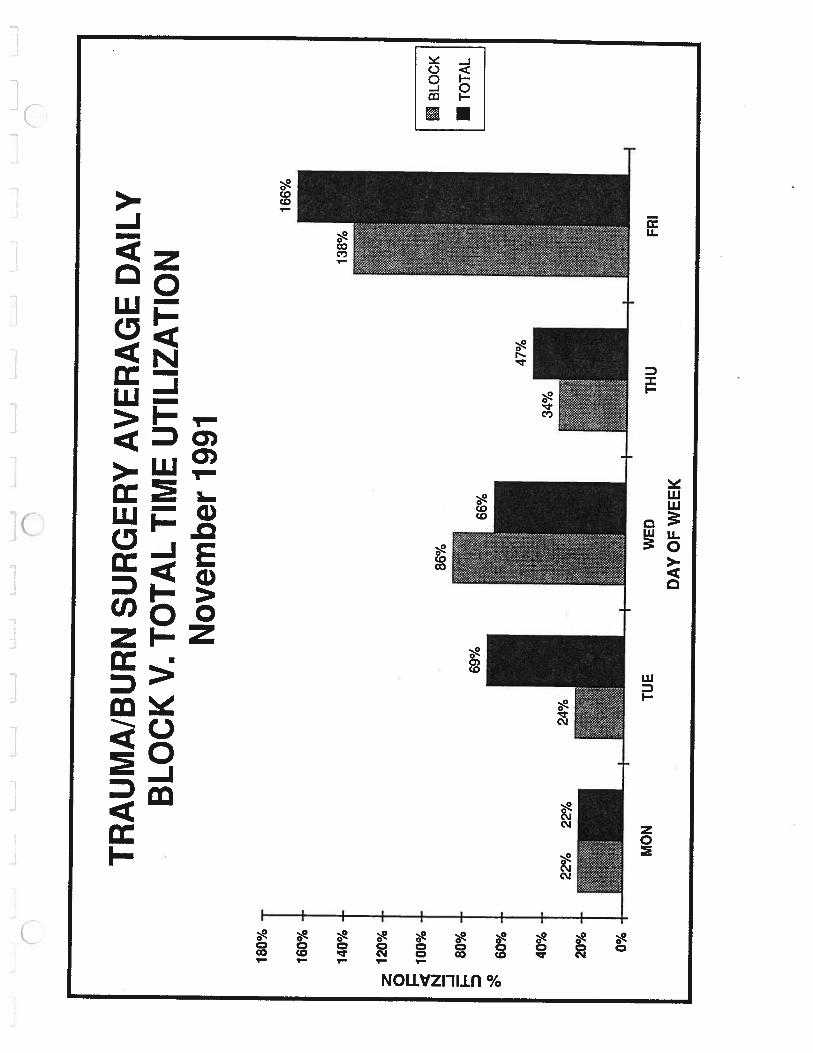
TR
AU
MA
/BU
RN
SUR
GE
RY
AV
ER
AG
ED
AIL
YB
LO
CK
V. T
OT
AL
TIM
EU
TILI
ZATI
ON
Nov
embe
r19
91
._._
jJ
j
120%
100%
80%
60%
40%
20% 0%
138%
66%
22%
22%
BLO
CK
ITO
TAL
MO
NT
UE
WED
THU
FRI
DA
YO
FW
EE
K
70%
60%
50%
z 040
%N -J
30%
20%
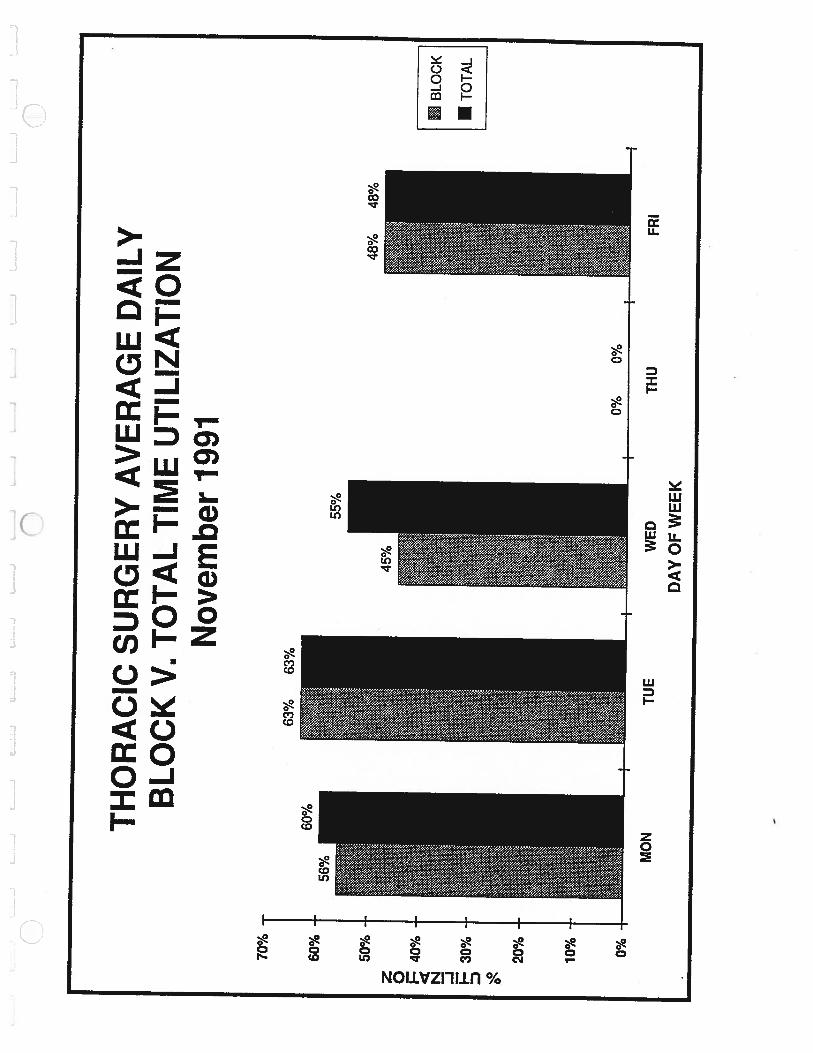
TH
OR
AC
ICSU
RG
ER
YA
VE
RA
GE
DA
ILY
BL
OC
KV
. TO
TA
LTI
ME
UTI
LIZA
TIO
NN
ovem
ber
1991
63%
63%
48%
48%
10% 0%
BLO
CK
ITO
TAL
MO
NTU
E
I——
0%0%
WED
THU
FRI
DA
YO
FW
EE
K

4.....t.I$t.‘%.Aef.
1,Ti••...
•.•.%V.,:•.......•.•••“r•—
L
4-
I.
...••-mga.flj•:.4•1....•I.•..W..•4W•...%i••.•.I......%•I*.
%.r. I
t
£
zI
.L£
I’‘I
)
I.r
4’......
/a
4
‘I
4
t
I
.1•
..•.•4f
.a
.....4
.1
I
3Er
4.
r
L
a
e.I.C.—

i....i
t_..
‘lJ
k.J
L...J
I-.
-0t—
.-J
t..—
JL
JL
JL
.._3
1.1
Ji.
J
n•C
)


