
FINAL REPORT August 2001 - The Official Web Site for … ESTABLISHING DRIVEWAY GRADES FOR NEW JERSEY...
32
FHWA/NJ-2001-28 ESTABLISHING DRIVEWAY GRADES FOR NEW JERSEY HIGHWAYS Volume II – Sight Distance Standards FINAL REPORT August 2001 by Tauseef A. Shamsi, M.S. Shahid Iqbal, Ph.D., P.E. Gene Reilly Wu Sun, Ph.D. and Louis J. Pignataro, Ph.D., P.E. Executive Director The National Center for Transportation and Industrial Productivity Institute for Transportation New Jersey Institute of Technology Newark, New Jersey NJDOT Research Project Manager Robert Sasor In Cooperation with New Jersey Department of Transportation Division of Research & Technology and U.S. Department of Transportation Federal Highway Administration
Transcript of FINAL REPORT August 2001 - The Official Web Site for … ESTABLISHING DRIVEWAY GRADES FOR NEW JERSEY...

FHWA/NJ-2001-28
ESTABLISHING DRIVEWAY GRADES FOR NEW JERSEY HIGHWAYS
Volume II – Sight Distance Standards
FINAL REPORT August 2001
by
Tauseef A. Shamsi, M.S.
Shahid Iqbal, Ph.D., P.E.
Gene Reilly
Wu Sun, Ph.D.
and
Louis J. Pignataro, Ph.D., P.E.
Executive Director
The National Center for Transportation and Industrial Productivity Institute for Transportation
New Jersey Institute of Technology Newark, New Jersey
NJDOT Research Project Manager
Robert Sasor
In Cooperation with New Jersey Department of Transportation
Division of Research & Technology and
U.S. Department of Transportation Federal Highway Administration

DISCLAIMER
The contents of this report reflect the views of the authors, who are responsible for the facts and the accuracy of the data presented herein. The contents do not necessarily reflect the official views or policies of the New Jersey Department of Transportation or the Federal Highway Administration. This report does not constitute a standard, specification, or regulation.
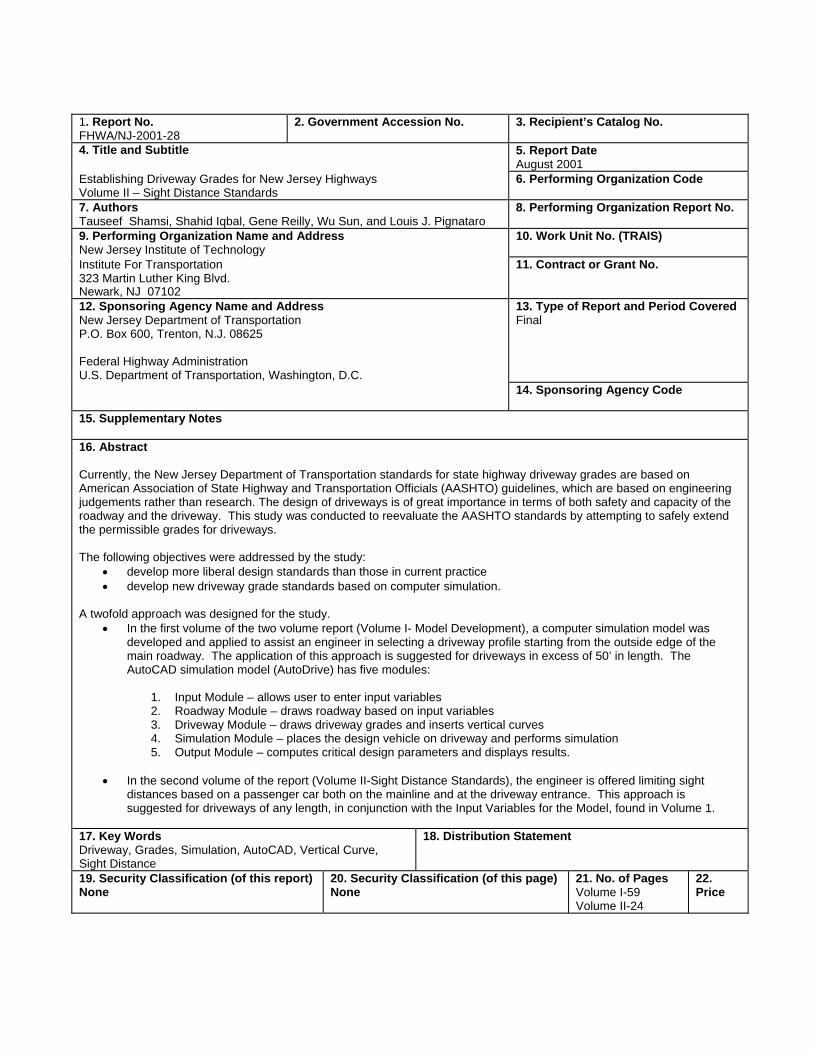
1. Report No. FHWA/NJ-2001-28
2. Government Accession No. 3. Recipient’s Catalog No.
4. Title and Subtitle
5. Report Date August 2001
Establishing Driveway Grades for New Jersey Highways Volume II – Sight Distance Standards
6. Performing Organization Code
7. Authors Tauseef Shamsi, Shahid Iqbal, Gene Reilly, Wu Sun, and Louis J. Pignataro
8. Performing Organization Report No.
9. Performing Organization Name and Address New Jersey Institute of Technology
10. Work Unit No. (TRAIS)
Institute For Transportation 323 Martin Luther King Blvd. Newark, NJ 07102
11. Contract or Grant No.
12. Sponsoring Agency Name and Address New Jersey Department of Transportation P.O. Box 600, Trenton, N.J. 08625 Federal Highway Administration U.S. Department of Transportation, Washington, D.C.
13. Type of Report and Period Covered Final
14. Sponsoring Agency Code
15. Supplementary Notes
16. Abstract Currently, the New Jersey Department of Transportation standards for state highway driveway grades are based on American Association of State Highway and Transportation Officials (AASHTO) guidelines, which are based on engineering judgements rather than research. The design of driveways is of great importance in terms of both safety and capacity of the roadway and the driveway. This study was conducted to reevaluate the AASHTO standards by attempting to safely extend the permissible grades for driveways. The following objectives were addressed by the study:
• develop more liberal design standards than those in current practice • develop new driveway grade standards based on computer simulation.
A twofold approach was designed for the study.
• In the first volume of the two volume report (Volume I- Model Development), a computer simulation model was developed and applied to assist an engineer in selecting a driveway profile starting from the outside edge of the main roadway. The application of this approach is suggested for driveways in excess of 50’ in length. The AutoCAD simulation model (AutoDrive) has five modules:
1. Input Module – allows user to enter input variables 2. Roadway Module – draws roadway based on input variables 3. Driveway Module – draws driveway grades and inserts vertical curves 4. Simulation Module – places the design vehicle on driveway and performs simulation 5. Output Module – computes critical design parameters and displays results.
• In the second volume of the report (Volume II-Sight Distance Standards), the engineer is offered limiting sight
distances based on a passenger car both on the mainline and at the driveway entrance. This approach is suggested for driveways of any length, in conjunction with the Input Variables for the Model, found in Volume 1.
17. Key Words Driveway, Grades, Simulation, AutoCAD, Vertical Curve, Sight Distance
18. Distribution Statement
19. Security Classification (of this report) None
20. Security Classification (of this page) None
21. No. of Pages Volume I-59 Volume II-24
22. Price

ii
ACKNOWLEDGMENTS This study has been made possible by the support of New Jersey Department of Transportation (NJDOT), NJIT and the National Center for Transportation and Industrial Productivity. The authors would like to extend our thanks to Mr. Arthur Eisdorfer and Mr.Robert Sasor (NJDOT) who initiated and monitored this project. The authors are also indebted to the Office of Major Access Permits (NJDOT) for their comments on the reports.

iii
TABLE OF CONTENTS (VOLUME I) EXECUTIVE SUMMARY……………………………………………………………………….1 1 INTRODUCTION AND STUDY PURPOSE………………………………………………..5 1.1 Study Problem………………………………………………………………………………5 1.2 Study Objective………………………………………………………………...…………...5 1.3 Literature Review…………………………………………………………………………...6 2 STUDY DESIGN…………………………………………………………………………….11 2.1 Introduction………………………………………………………………………………...11 2.2 Procedure for Model Development……………………………………………………...11 2.3 Selection of Input Variables for Model…………………………………………………..11 2.3.1 Design Vehicle…………………………………………………………………………..11 2.3.2 Design Vehicle Dimensions……………………………………………………………12 2.3.3 Design Vehicle Operating Characteristics on Grades………………………………14 2.3.4 Initial Vehicle Speed……………………………………………………………………15 2.3.5 Minimum Speed…………………………………………………………………………16 2.4 Selection of Design Conditions………………………………………………………….18 2.5 Vertical Curve Design…………………………………………………………………….19 2.5.1 Stopping Sight Distance(S)……………………………………………………………19 2.5.2 Heights of Driver’s Eye and Object…………………………………………………...19 2.5.3 Minimum Length of Crest Vertical Curve (Lmin)………………………………………20 2.5.4 Minimum Length of Sag Vertical Curve (Lmin)………………………………………..21 2.5.5 Vertical Grade…………………………………………………………………………...22 2.5.6 Length of Vertical Grade……………………………………………………………….23 3 MODEL DEVELOPMENT…………………………………………………………………..24 3.1 Module I (Input Module)…………………………………………………………………..25 3.2 Module II (Roadway Module)…………………………………………………………….26 3.3 Module III (Driveway Module)……………………………………………………………26 3.4 Module IV (Simulation Module)………………………………………………………….26 3.5 Module V (Output Module)……………………………………………………………….26 4 SAMPLE DESIGN PROBLEMS……………………………………………………………27 4.1 Design Problem 1…………………………………………………………………………28 4.2 Design Problem 2…………………………………………………………………………32 5 FINDINGS……………………………………………………………………………………37 6 FUTURE RESEARCH………………………………………………………………………38 ACKNOWLEDGMENTS………………………………………………………………………40 APPENDIX A AutoDRIVE Installation……………………………………………………….43 APPENDIX B AutoDRIVE User’s Guide…………………………………………………….46 APPENDIX C Field Measurement of Vehicle……………………………………………….53

iv
TABLE OF CONTENTS (VOLUME II) EXECUTIVE SUMMARY……………………………………………………………………….1 1. INTRODUCTION AND STUDY PURPOSE……………………………………………….5
1.1 Introduction............................................................................................................ 5 1.2 Study Scope and Objective ................................................................................... 5 1.3 Study Approach .................................................................................................... 6
2. DEVELOPMENT OF SIGHT DISTANCE STANDARDS………………………………..7 2.1 CASE – 1: Design Vehicle (P) Turning Left From the Driveway into the Main Road From A Stopped Position............................................................................................. 8 2.2 CASE – 2: Design Vehicle (P) Turning Right From the Driveway into the Main Road From A Stopped Position ................................................................................. 15
3. EFFECTS OF DRIVEWAY GRADE ON SIGHT DISTANCE…………………………..18 4. DESIGN PROCEDURE...………………………………………………………………….19 5. CONCLUSION AND RECOMMENDATIONS……………………………………………22 6. FUTURE RESEARCH……………………………………………………………………...23 REFERENCES…………………………………………………………………………………24

v
LIST OF FIGURES (VOLUME I)
Figures Page 1.1 Suggested Driveway Profile……………………………………………………………….8 1.2 Critical Dimensions and Angles of Design Vehicles……………………………………9 1.3 Guidelines for Grade Design…………………………………………………..………….9 3.1 Flow Chart of AutoDRIVE Model………………………………………………………..24 4.1 Input Data for Design Problem 1……………………………………………….……….28 4.2 Profile of Driveway (AutoDRIVE Model)……………………………………………….29 4.3 Input Data for Design Problem 2………………………………………………………..32 4.4 Plan View of Driveway……………………………………………………………………33 4.5 Profile of Driveway………………………………………………………………………..34 A.1 Using Windows……………………………………………………………………………44 A.2 Creating DRIVEWAY Folder…………………………………………………………….45 B.1 Loading AutoDRIVE Lisp Files from AutoCAD Application Box…………………….47 B.2 Setting 3D Viewpoint Manually AutoDRIVE DDVPOINT Variable………………….48 B.3 AutoDRIVE Input Module Box………………………………………………….……….49 B.4 AutoDRIVE Input Module Box for Vehicle Dimensions………………………………50 B.5 Project 2.lsp Draws the Roadway Surface…………………………………………….51 B.6 Project 3.lsp Draws the Roadway Surface…………………………………………….52
LIST OF FIGURES (VOLUME II) Figures Page 1.Sight Distance at Intersections, Minimum Sight Triangle…………………….………….7 2.Case –1, Stopped Vehicle Turning Left Onto Two-Lane Highwa…………….…………8 3.Sight Distances at Driveway Intersections……….………………………………………10 4.Acceleration Curves……………...…………………………………………………………12 5.Intersection Sight Distances at At-Grade Intersection ……………..…………………..15 6.Case–2, Stopped Vehicle Turning Right Onto Two-Lane Highway…………………...16

vi
LIST OF TABLES (VOLUME I)
Tables Page 2.1 Vehicle Dimensions……………………………………………………………………….13 2.2 Maximum Grade Changes……………………………………………………………….13 2.3 Default Vehicle Dimensions in Simulation Model……………………………………...13 2.4 Maximum Grades Samples……………………………………………………………....17 2.5 Maximum Grades By Vehicle Type and Speeds………………………………………17 2.6 Grade Lengths for Tractor+Trailer……………………………………………………….18 4.1 Input Parameters (Design Problem 1)…………………………………………………..30 4.2 Model Results (Design Problem 1)……………………………………………………...31 4.3 Input Parameters (Design Problem 2)…………………………………………………..35 4.4 Model Results (Design Problem 2)…………………………………………….………..36 C.1 Field Measurement of Critical Dimensions (Passenger Cars)……………………….55 C.2 Field Measurement of Critical Dimensions (Tractors and Trailers)………………….58 C.3 Field Measurement of Critical Dimensions (Single Unit Trucks)…………………….59 C.4 Measurements of Critical Dimension (Buses)…………………………………………59
LIST OF TABLES (VOLUME II) Tables Page 1 Acceleration Rates For Passenger Vehicles………….…………..…………...…………13 2 Sight Distances For a Passenger Car (P), Turning Right or Left From a Driveway Into Two-Lane Mainline……….……………..…..……………...………………16 3 Grades Effects on Accelerating Time, on Grade to That of Time on Level Grade,ta………..………………...……….……………………………………..…………...18

1
EXECUTIVE SUMMARY
Introduction Currently, the New Jersey Department of Transportation’s standards for State highway driveway grades are based on American Association of State Highway and Transportation Officials(AASHTO) guidelines, which are based on engineering judgements rather than research. The design of driveways is of great importance in terms of both safety and capacity of the roadway and the driveway. This study was conducted to reevaluate the AASHTO standards by attempting to extend the permissible grades for driveways.
Objectives The following issues are some of those that the study addresses. • determine the possibility of developing more liberal design standards than those in
current practice, and • develop new driveway grade standards based on data collected throughout the U.S.
and by computer simulation.
Volume I – Design for the Simulation Model The basic approach to the study is the development and application of a computer simulation model to assist an engineer in selecting a driveway profile starting from the outside edge of the main roadway. The AutoCAD simulation model (AutoDRIVE) has five modules: 1. Input Module – allows user to enter input variables. 2. Roadway Module – draws roadway based on input variables. 3. Driveway Module – draws driveway grades and inserts vertical curves. 4. Simulation Module – places the design vehicle on driveway and performs simulation. 5. Output Module – computes critical design parameters and displays results. The Input Module prompts the user to enter the following parameters: • Design vehicle. • Entering/initial speed (U) of the design vehicle. • Minimum allowable speed on upgrades. • Physical elements of roadway. • Physical elements of roadway shoulder and driveway. • Lengths of driveway vertical curves. In the Roadway Module, the following functions are performed: • Set the drawing limits. • Draw the roadway. In the Driveway Module, the following functions are performed:

2
• Draw the driveway surface. • Place the design vehicle on the driveway surface. In the Simulation Module, the following functions are performed: • Move the vehicle. • Check appropriateness of cross-over, departure, and approach angles. • Check for minimum standards. • Check appropriateness of stopping sight distance. Simulation Model AutoDRIVE is a 3D CAD based program that simulates the movement of selected design vehicle on the driveway profile. The program was developed using AutoLISP programming language, and it is written in DOS text using a suitable text editor. AutoDRIVE operates in AutoCAD environment and can be run on a personal computer (PC). The step by step instructions for using and installing AutoDRIVE on a PC are given in the manuals in the appendix. Users are allowed to enter design vehicle types, design vehicle dimensions, initial vehicle speed, and minimum speed. Although AASHTO lists several design vehicle types, there are practical limits in measuring clearances on vehicles. A field study was conducted to obtain clearance information. The vehicle operation characteristics on grades are governed by a vehicle speed-loss formula proposed by Thomas Gillespie (18), which follows. DU/dX= 0.465[375(P/W)/U-Gr]g/U where, U = initial vehicle speed, or speed of vehicle entering grade (mph) X = distance (ft) Gr = road grade (percent/100) g = gravitational constant (32.2 ft/sec2) P/W = ratio of drive horsepower to vehicle weight At the end of the program run, the model checks appropriateness of cross-over, departure, and approach angles, minimum standards, (such as minimum speed), and the appropriateness of stopping sight distance by advancing the vehicle. The major outputs of the simulation module include: • Simulated speed at the end of Grade 1 (Km/h) (converted to km/h). • Simulated speed at the end of Grade 2 (Km/h) (converted to km/h). • Maximum allowable approach angle (degrees). • Maximum allowable cross-over angle (degrees). • Maximum allowable departure angle (degrees). • Grade combination approach/departure angle (degrees). • Grade combination cross-over angle (degrees). • Stopping sight distance required (m). • Length of curve between G1 & G2 is OK (Y/N). • Length of curve between shoulder & G1 is OK (Y/N).

3
• Length of curve between G2 & property elev. Grade is OK (Y/N). • Grade 1 is OK (Y/N). • Grade 2 is OK (Y/N). • Length of Grade 1 is OK (Y/N). • Length of Grade 2 is OK (Y/N). Vertical Curve Design This study incorporates symmetrical parabolic vertical curves for the driveways to achieve better safety and comfortable operations on the grades. The design of vertical curves follows the AASHTO standards. Sample Designs Two design examples illustrate how the guidelines, methodologies, and models can be used in designing and evaluating the vertical alignment of driveways.
Volume II – Sight Distance Standards This research effort has been designed to achieve the following objectives:
• Determine and develop the design standards that ensure safe sight distance for vehicles entering a driveway from the main line and for vehicles exiting from the driveway onto the major road, for the most critical conditions.
• Determine the possibility of developing more liberal design standards when
the above mentioned situations are complicated by adverse combinations of curvatures and grades. This may happen on either the main road or the driveway, or when there are lateral obstructions along the main road or the driveway that can reduce in the sight distance from the main road to the driveway or vice versa.
The second volume discusses the minimum sight distance design requirements for passenger cars on the mainline and the driveway. Case studies and resulting tables are presented for perpendicular driveway alignments and for a range of driveway vertical grades (not to exceed a crossover grade of 9.4% as noted in Table 2.2 of Volume 1).
Future Research In future studies, the following issues need to be addressed: • Beside perpendicular driveways, the issues related to the combination of horizontal
curves and grades need to be considered, because some driveways do not proceed perpendicular from the edge of the main road to the property.
4
• In this study the design of vertical curves on grades follows the AASHTO standards, which is suitable only for regular roadways. In future studies, a vertical curve design should be established specifically for driveways.
• The cross-over, approach and departure angles of a moving vehicle are significantly different from those of a stopped vehicle. In future studies, moving vehicle suspensions need to be included in the checking stage of the program.
• The current simulation model is an iterative procedure. In future studies, it could be upgraded to an optimization procedure to help engineers and transportation planners in their decision-making regarding driveway design.

5
1. INTRODUCTION AND STUDY PURPOSE
1.1 Introduction As part of "Establishing Driveway Grades For the New Jersey State Highways,” this report (Volume - II), addresses sight distance requirements for the design vehicle on the main road in the vicinity of a driveway and for an exiting vehicle from the driveway. A reevaluation was made of the standards of New Jersey State highway driveway grades, based upon the American Association of State Highway and Transportation Officials (AASHTO) guidelines. The study team conducted a detailed research and literature review, along with field surveys. Based on these inputs, a CAD simulation model was developed to assist engineers in designing driveways and with proposed design procedures. The design of safe driveways encompasses many elements, namely, spacing, volume, use of property, angle of exit and entry, width, radii, throat length, alignment, superelevation, grade of the highway, and grade of the driveway. The importance of considering these elements in the driveway design would be reflected in the safety and capacity of the roadway and the driveway. As noted in the literature review (summarized in Volume – I), there have been several studies, and some statements of practice, providing guidelines for the selection of various design factors.
There are occasions when an increase, beyond the accepted guidelines, in the positive or negative grade of a driveway, would considerably reduce the cost of providing driveway access to the land parcel. It is further noted that most driveways are (Reference
1). It is because of this situation that the current study was conducted.
1.2 Study Scope and Objective
This research effort has been designed to achieve the following objectives:
• Determine and develop the design standards that ensure safe sight distance for vehicles entering a driveway from the main line and for vehicles exiting from the driveway onto the major road, for the most critical conditions.
• Determine the possibility of developing more liberal design standards when
the above mentioned situations are complicated by adverse combinations of curvatures and grades. This usually happens with either the main road or the driveway, or when there are lateral obstructions along the main road that can cause severe reduction in the sight distance from the main road to the driveway or vice versa.
Two distinct and separate approaches to the problem were developed. The first volume of the two-volume report discusses the development and use of a simulation model.

6
The model development includes information on vehicle design, vehicle dimensions, vehicle operating characteristics on grade, and a vehicle’s initial and minimum speed on grade. The second volume discusses the minimum sight distance design requirements for passenger cars on the mainline and the driveway. Case studies and resulting tables are presented for perpendicular driveway alignments and for a range of driveway vertical grades (not to exceed a crossover grade of 9.4% as noted in Table 2.2 of Volume 1).
1.3 Study Approach The sight distance requirements are established considering the following: • Design vehicle is passenger car (P). • Horizontal alignment of the driveway perpendicular to main roadway. • Stop control on the driveway. First, the sight distance standards are developed based on AASHTO (Reference 2) procedures for level driveway grade (see Section 2.1). Next, adjustment factors are established for effect of driveway approach and departure grades (see Section 3.0). A design procedure is presented in Section 4.0.

7
2. DEVELOPMENT OF SIGHT DISTANCE STANDARDS The sight distance requirements are established for three design speeds of the main line highway: 50 km/hr, 70 km/hr and 100 km/hr. As indicated in the scope of work, only critical parameters are considered. The design vehicle is a passenger car (for both the driveway and the main road). The sight distances d1 and d2, as shown in Figure 1 indicate minimum sight distance triangles. The distance from the near edge of the traveled way to the front of a stopped vehicle is shown as ‘D’ in figure 1, (a value of 3.0 meters is assumed in our case). The traveled way width is ‘W’ along the path of the crossing or accelerating vehicle. Also, refer to Table 2.3 of Volume –I, of the report for the default vehicle dimensions, where ‘L’, the length of the passenger vehicle is 5.8 meters.
Figure 1 Sight Distance at Intersections, Minimum Sight Triangle (Source: AASHTO, 1994 (2) )
The sight distance requirements for varying driveway grades are given for values up to a maximum negative grade of –11.4% (equivalent to a crossover grade change of 9.4%), and a maximum positive grade of 10% (equivalent to a maximum approach or departure grade change of 12%) as measured from the edge of the pavement (see Table 2.2 in Volume I). These driveway grades are based on a 2% normal crown slope for the main road. This maximum change in grade presents the problem of limiting sight distance. These sight distance requirements for the passenger cars are based upon a 3.5 ft. (1,060 mm) height of the driver eye and a 4.25 ft. (1,300 mm) height of the approaching vehicle. The operating speed on each approach of the main line is assumed to be the 85th percentile of the design speed.
8
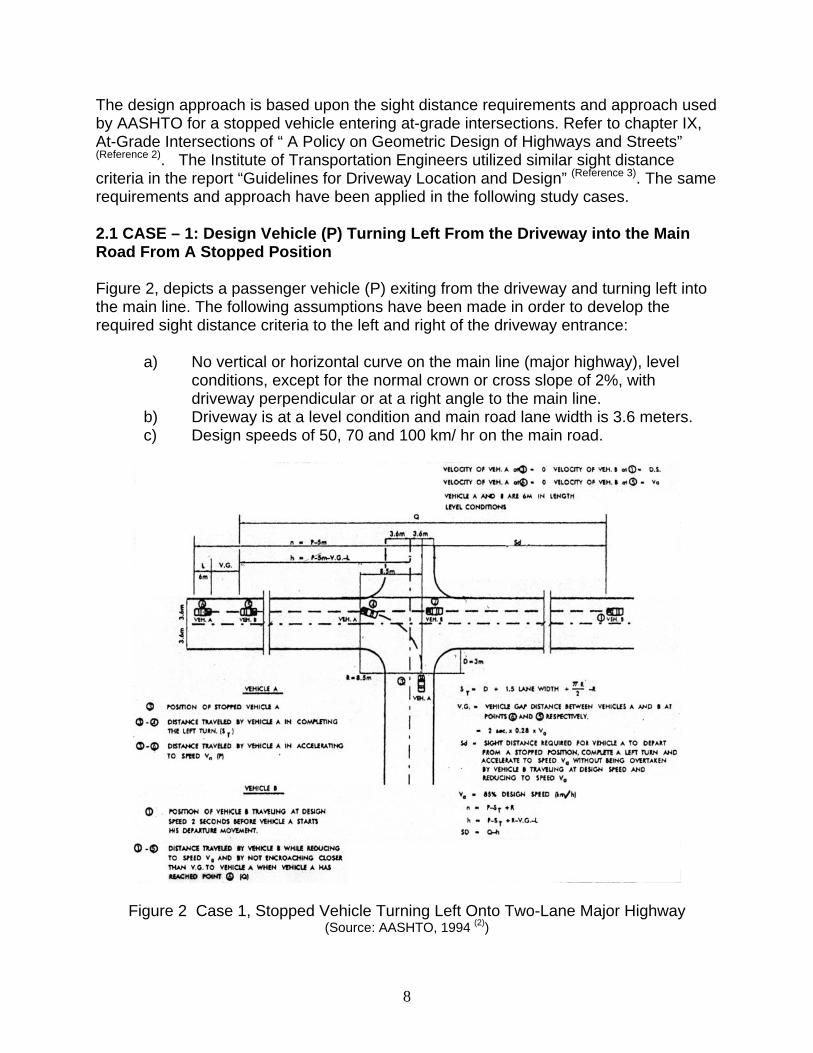
The design approach is based upon the sight distance requirements and approach used by AASHTO for a stopped vehicle entering at-grade intersections. Refer to chapter IX, At-Grade Intersections of “ A Policy on Geometric Design of Highways and Streets” (Reference 2). The Institute of Transportation Engineers utilized similar sight distance criteria in the report “Guidelines for Driveway Location and Design” (Reference 3). The same requirements and approach have been applied in the following study cases. 2.1 CASE – 1: Design Vehicle (P) Turning Left From the Driveway into the Main Road From A Stopped Position Figure 2, depicts a passenger vehicle (P) exiting from the driveway and turning left into the main line. The following assumptions have been made in order to develop the required sight distance criteria to the left and right of the driveway entrance:
a) No vertical or horizontal curve on the main line (major highway), level conditions, except for the normal crown or cross slope of 2%, with driveway perpendicular or at a right angle to the main line.
b) Driveway is at a level condition and main road lane width is 3.6 meters. c) Design speeds of 50, 70 and 100 km/ hr on the main road.
Figure 2 Case 1, Stopped Vehicle Turning Left Onto Two-Lane Major Highway (Source: AASHTO, 1994 (2))

9
For a vehicle to safely complete the maneuver as given in Case -1 above, the driver must have sufficient sight distance to the left to cross the near lane without interfering with oncoming traffic in this lane. The required sight distance, Sd (in figure 2), to the left, is calculated from the equation:
Sd=0.28 V (J + ta) ---------- (Equation 1, Reference # 2) Where, Sd = Required sight distance along the major highway from the driveway entrance. V=Design speed on the major highway (km/hr)
J=Sum of perception time and the time required to actuate the clutch or an automatic shift (in seconds). ta=time required accelerating and traversing the distance to clear the traffic in the lane approaching from the left. On a two-lane highway, 13.5 meters is the distance traveled along an 8.5 meter radius arc (see figure 2).
The driver’s perception and reaction time is the time from the driver’s first look for possible oncoming traffic to the instant the car begins to move. For driveway design, this is assumed to be 2.0 seconds, which represents the value for J. The time, “ta” required to cover a given distance during acceleration, depends on the vehicle acceleration, which for the passenger car seldom equals the rate the vehicle is capable of. Actually, the vehicle acceleration rate is considerably less, as governed by the temperament and other characteristics of the individual driver and by the existing conditions. Using figure 3, the solid line in the figure labeled ‘P’, is the recommended time–distance relationship of a typical passenger vehicle to be used in computing ta, to clear the sight distance to the left, as illustrated below in Condition 1(A). The time distance data was developed from studies performed by the Michigan Transportation Research Institute (UMTRI, Reference 4). CONDITION 1 (A): Sight distance to the left, d1, for the vehicles turning left into the major road, where the design speed on the main line is 50 km/hr, under level conditions. The total distance traveled during acceleration, ST, to clear the traffic in the lane approaching from the left as given in figure 2, of this report =13.25 meters From figure 3, the acceleration time, ta =4.3 seconds Perception reaction time, J =2.0 seconds Using Equation 1, the required sight distance to the left along the major highway from the driveway, d1, as shown in figure 1, can be computed as: The sight distance d1, for 50 km/hr design speed=0.28 X 50 (6.3)

10
=88.2 meters. Say 90 meters. This also corresponds to the value of required sight distance shown in Figure 5 for Curve B-1, (Reference 2) – the sight distance required for a P vehicle turning left into a two lane highway across P vehicle approaching from left, for the design speed of 50.0 km/hr.
Figure 3 Sight Distances at Driveway Intersection (Source: AASHTO, 1994 (2) ) CONDITION 1 (B): Sight distance to the right, Sd (figure 2) or d2 (figure 1), for the vehicles turning left into the major road as shown in Figure 2, at a design speed of 50 km/hr, under level conditions.

11
Figure 2 illustrates a passenger car (P) entering the main line from a stopped position within a driveway onto a two lane major highway, by clearing the approaching vehicle from the left and entering the traffic stream approaching from the right with no median barrier. The stopped vehicle must have sufficient sight distance to the right to allow the vehicle to turn left and accelerate to a speed where it does not significantly interfere with the vehicle coming from the right. The necessary sight distance to the right, to make a left turn from a stopped position is derived by considering that the mainline vehicle approaching from the right, will slow down to a speed 85 percent of the design speed. There shall be at least a 2 seconds vehicle gap (VG), between the turning vehicle from the driveway and the approaching vehicle from the main line. To calculate the required sight distance, Sd, as shown in Figure 2, first determine the distance required for the left turning vehicle ‘A’ to reach the speed (Va) of 85 percent of the main line speed in advancing from Position - 3 to Position - 6. This is calculated from the acceleration curve given in Figure 4 (Reference 2). Therefore, for the 85th percentile of the design speed of 50 km/hr., the distance-traveled will be 60 meters (at a speed of 42.5 km/hr.), as obtained from the Figure 4.
The distance required for the turning vehicle = 60 meters

12
Figure 4 Acceleration Curves (Source: AASHTO, 1994 (2)) Next determine the time required traveling 60 meters, by using Equation 1 or getting the value directly from Table 1, in case of level conditions. However, in cases where the driveway grade is exceeding the ± 3% threshold value, the values obtained by the Equations 1 or 2 and the value for travel time “ta”, obtained from Table 1, must be adjusted by the factors as given in Table 3. d=0.28 (Va/2) ta ----------------- Equation 2 (Reference 2) 60=0.28 (0.85 x 50/2) ta Therefore, ta =10.08 seconds (*). To this time, add J seconds.

13
(*) Note: Also use Table 1, under level conditions, to check and verify the time required “ta” value, obtained from the above equations. Using Table 1, ta is 9.8 seconds. 10.0 seconds is also the same value given in the ITE design guidelines for driveways (Reference 3), as a sight distance visibility time for the vehicles exiting a driveway to turn left or right onto a two lane highway, to see an approach vehicle. This enables the passenger car to turn onto a major highway to reach the 85th percentile of the main line speed. To this time add the value for J, therefore, (ta + J) = 10+2 = 12 seconds. Multiply this time by 0.28 and the 95th percentile (reference 2, page 712) of the highway design speed, vehicle – B, approaching from the right of the major highway. This will give the distance ‘Q’, traveled by vehicle B, as shown in figure 2. Distance, Q =12 x 0.28 x 0.95 x 50=159.6 meters. Say 160 meters Distance, h =d - ST + R - V.G. - L=60 - 13.25 + 8.5 - 23.8 - 5.8
h =25.65 meters. (As shown in Figure 2) The sight distance (Sd) required for the vehicle A to depart from the stopped position, complete a left turn, and accelerate to a speed Va without being overtaken by vehicle B, will therefore be:
Sd=Q – h=160.0 – 25.65=134.35 meters. Say 135 meters.
Table 1 Acceleration Rates for Passenger Vehicles
Speed (Km/hr.) Distance (meters) Travel time, ta (seconds) 30 25 5.7 40 40 7.3 50 70 9.8 60 110 12.3 70 160 15.2 80 235 18.8 90 325 22.4 100 455 27.4 110 650 33.9
Source: AASHTO, 1994 (2) CONDITION 2 (A): Sight distance to the left, d1, for the vehicles turning left into the major road where design speed at the main line is 70 km/hr. The sight distance to the left along the major highway from the driveway, d1 as shown in the Figure 1, can be computed in the same way as given in Condition 1(A), for the change in the design speed at 70 km/hr.

14
The sight distance d1, for 70 km/hr design speed=0.28 x 70 (6.3)
=123.48 meters. Say 125 meters CONDITION 2 (B): Sight distance to the right, Sd or d2, for the vehicles turning left into the major road at a design speed of 70 km/hr. As given in Condition 1 (B), the sight distance at a design speed of 70 km/hr on the mainline is calculated in the same manner and the value comes out to be: The sight distance Sd or d2, for 70 km/hr design speed=200 meters. CONDITION 3 (A): Sight distance to the left, d1, for the vehicles turning left into the major road where design speed at the main line is 100 km/hr. The sight distance to the left along the major highway from the driveway, d1 as shown in Figure 1, can be computed in the same way as given in Condition 1 (A). The sight distance d1, for 100 km/hr design speed=0.28 x 100 (6.3)
=176.40 meters. Say 177 meters CONDITION 3 (B): Sight distance to the right, Sd or d2, for the vehicles turning left into the major road at a design speed of 100 km/hr. As given in Conditions 1 (B) and 2 (B), the sight distance at a design speed of 100 km/hr on the mainline is calculated in the same manner: The sight distance Sd or d2, for 100 km/hr design speed=360 meters. Table 2 summarizes the sight distance requirements for various cases under level conditions. The computed sight distances correspond to the sight distances shown in figure 5. Figure 5 presents the sight distance requirements for the different design speeds at level conditions for a P design vehicle turning left or right onto a two lane major road.

15
Figure 5 Intersection Sight Distance at At-Grade Intersection (Case 1 and Case 2) (Source: AASHTO, 1994 (2) )
Where the grades of the intersecting legs are other than level, corrections should be made to the sight distances. The factors given in Table 3 account for the effect of gradient on the acceleration time ‘ta’ at intersections. The sight distance requirements for the vehicle turning left from a major road into the driveway may be computed from the formula d = 0.28 V (J+ta). The time (ta) required to accelerate and traverse the distance to clear the traffic from the approaching lane can be obtained from Figure 3. As the sight distance computation for this case reveals that the sight distance requirements are non-critical in most cases, they have not been considered in detail here. 2.2 CASE – 2: Design Vehicle (P) Turning Right From the Driveway into the Main Road From A Stopped Position Figure 1 illustrates a vehicle departing from a stopped position, turning right and merging with the traffic from the left. The right turning vehicle must have sufficient sight distance to complete its right turn and to accelerate to the required speed without being overtaken by the approaching vehicle (leaving a vehicle gap of 2 seconds). The sight distance requirement for the right turn maneuver is a little less than that required for the left turn maneuver, as outlined in Case -1, Conditions 1(B), 2(B) and 3B, respectively.

16
Figure 6 Case 2, Stopped Vehicle Turning Right onto Two-Lane Major Highway (Source: AASHTO, 1994 (2) )
Table 2 shows the sight distance required for a passenger vehicle to turn right into the main line and accelerate to 85% of the design speed before being overtaken by the approaching vehicle from the left. In Figure 5, curve Cb is the sight distance for a passenger vehicle to turn right into a major roadway and accelerate to the 85th percentile of the design speed of the major road without being overtaken by vehicles approaching the intersection from the left, that are reducing their speed to the 85th percentile of the design speed.
Table 2 Sight Distance Requirements for a Passenger Car (P), Turning Right or Left from a Driveway into Two-Lane Main Line
Design Speed (in km/hr)
Sight Distance, d1 For Case - 1 (meters)
Sight Distance, Sd For Case - 1 (meters)
Sight Distance, Sd For Case- 2 (meters)
50 90 135 134 70 125 200 199 100 177 360 359
The sight distance requirements of Table 2 are consistent with the data reflected in figure 5.

17
It is important to note that where the grades of the intersecting legs are other than level, corrections should be made to the sight distances given above. Also the effect of skew has not been considered. In general, for the above-mentioned cases, the sight distance is larger for oblique angles than for the right angle intersections.

18
3. EFFECTS OF DRIVEWAY GRADE ON SIGHT DISTANCE Typically, driveways approaching the main road may not be level. A vehicle descending a grade on the driveway tends to require more distance to stop. However, the more serious concern is the reduction in the height of the line of sight when a vehicle ascends a grade on a driveway. Measuring grades from the edge of the pavement, the maximum negative grade can be as much as 11.4% and a maximum positive grade 10%. These values based on a 2% normal cross slope at the mainline (as stipulated in Volume I, Establishing Driveway Grades for New Jersey Highways). The effects of various grades on the stopping sight distance for the intersections are the same as that for the design controls for vertical curves for the open highway conditions. However, as mentioned earlier in section 2.1 for Case – 1, grades up to 3 percent have little effect on the stopping sight distance (refer page 271, of reference 2). The effect of grade on acceleration is expressed as a factor applied to the time (ta) for level conditions. The approximate ratio of the accelerating time, ‘Ta’ on the grade, to that of ‘ta’ on the level grade as computed previously is given in Table 3. The Institute of Transportation Engineers issued guidelines in 1987 (Reference 3) that suggested maximum driveway grades similar to those given in Volume I, of this report. The report also suggested maximum driveway grades for the three classes of driveways, the residential, commercial and industrial driveways (refer to Figure 1.1 of Volume I). The driveway grades as given in Table 3 are measured from the edge of the pavement.
Table 3 Grade Factors applied to Level Grade Accelerating Time, ta Vehicle Driveway Grades (%) __________ -11.4 -10 -8 -6 -4 -2 0 +2 +4 +6 +8 +10
Critical condition Non-critical condition
----------------------------------------------------------------------------------------------------------------------------- 2.04 1.9 1.7 1.5 1.3 1.1 1 0.90 0.70 0.50 0.30 0.10 Source: AASHTO, 1994 (2) Notes: 1. Extrapolated values from –6 % to – 11.4 % and + 6 % to + 10 %.
2. The above driveway grades are measured from the edge of the roadway or pavement.
3. Table refers to factors for passenger cars. The value of acceleration time (ta), should be adjusted by the appropriate factor to determine the proper sight distance, for different driveway grades.

19
4. DESIGN PROCEDURE Example The design procedure is given as an example to calculate the stopping sight distance requirement for any of previous case scenarios, with the following parameters: 1) A residential driveway for a design vehicle (P) with a grade = – 8.0% 11) A two lane, major highway with a 2% cross slope, design speed of 70 km./hr and
the driveway intersects the highway at right angles. III) Lane width of the major highway is 3.6 meters; length of the passenger car (P) is
5.8 meters. IV) The distance from the near edge of traveled way to the front of a stopped car, D
= 3.0 meters with Radius of arc = 8.5 meter. Compute the minimum stopping sight distance required along the left and right side of the major highway for a vehicle turning left into the highway. Sight Distance Calculations Refer to Case - 1, passenger vehicle (P) turning left from the driveway into the main road from a stopped position. The sight distance requirement for the right turn maneuver will be less than that is required for the left turn. Step 1): Determine the sight distance requirement to the left, d1, for the
design speed of 70 km/hr. Refer to Condition 1 (A) and Figure 2, to determine the distance ST ,
ST =D + 1.5 lane Width + πR/2 - R ST=3+(1.5 x 3.6)+(3.142 x 8.5/2)-8.5 ST=13.25 meters. Step 1a): From Figure 3, calculate the acceleration time, ta: ta=4.10 Seconds
ta (adjusted for driveway grade)=4.10 x 1.7(factor from Table 3) ta (adjusted)=Ta=6.97 Seconds.
The perception reaction time, J=2.0 Seconds. Step 1b): Using Equation 1, compute the required sight distance to the left along the
major highway, from the driveway: Sight distance, d1, for 70 km/hr design speed = 0.28V (J + Ta)

20
d1 =0.28 x 70(6.97+2)=175.81 meters. Say 176 meters. Step 1c): Check the sight distance value with Figure 5, sight distance curve B-1
yields around 135.0 meters, for level conditions. Select the higher value. Therefore, the sight distance, d1= 176 meters.
Step 2): Determine the sight distance requirement to the right, Sd or d2, for
the 85th percentile of the design speed of 70 km/hr. Refer to Condition 1 (B), of the design approach and use figure 2, to determine the distance ST : Step 2a): Determine the distance required for the left turning vehicle A to reach the
85th percentile of the design speed (Va), from the acceleration curve in figure 4. The 85th percentile of the design speed of 70 km./hr (59.5 km/hr), shows a distance traveled of 110 meters.
Step 2b): Next, determine the time required to travel this distance by using equation
2 and verify the value from Table 1. Therefore, d =0.28(Va/2) ta (adjust ta, for –8% driveway grade)
110=0.28 x (0.85 x 70/2) x ta ta=13.20 seconds
ta (adjusted)=13.20 x 1.7 (adjustment factor for –8% driveway grade from Table 3) ta (adjusted)=22.44 seconds. Say 22.5 seconds. ta (adjusted) + J=22.50 + 2 =24.5 Seconds Step 2c): Now, determine the distance traveled by vehicle B; ‘Q’ as shown in figure 2 Q=24.5 x 0.28 x 0.95 x 70 =456.19 meters.
The distance, h=d – ST + R - V.G -L =110 - 13.25 + 8.5 - 33.32 - 5.8 =66.20 meters.
Step 2d): The required sight distance, Sd required for the vehicle A to start from the
stopped position and complete a left turn and accelerate to a speed Va, without been overtaken by the vehicle B, is given by:
Sd=Q – h

21
The required sight distance, Sd=456.19 - 66.20= 389.99 meters. Therefore, Sd=390 meters. Therefore, for design speed of 70 km/hr. at a driveway grade of –8%, the proposed sight distance to the left, d1, when the passenger car is making a left turn should be equal to 176 meters. The sight distance required along the right side of major highway is equal to 390 meters.

22
5. CONCLUSION AND RECOMMENDATIONS
• Procedures have been developed to determine the permissible grades on driveways using a simulation model (Vol. I). Within the model, the grades are dependent on the type of vehicle, length of grade, and the speed of the vehicle entering the grade. The conditions of design for each situation will determine the allowable grades to be used for the driveway, which may exceed the suggested guidelines from the ITE publication (9).
• The more liberal use of design standards can apply to the lower speeds of
vehicles that exist on driveways. Lower grades can permit grades to meet at points of intersection, rather than providing vertical curves. The limitation to the intersecting grades is based on the approach/departure and crossover angles of the design vehicle. If steeper intersecting grades are required, the design of a vertical curve is provided.
• Relying on AASHTO’s Policy of Geometric Design of Streets and Highways,
procedures were developed to ensure safe sight distances for vehicles entering the mainline from the driveway (Vol. II).
• When the criteria for sight distances for left turn onto a major road cannot be met,
the need for a driveway can be met by prohibiting left turns.
• Deficient sight distance for right turns in and out of the driveway, can be met with the provision of a right turn acceleration or deceleration lane, designed in accordance with AASHTO and “New Jersey Department of Transportation Design Manual - Roadway Standards”.
• Direct access to and from the driveway should be denied when the minimum
sight distances required cannot be attained. However, under these circumstances, constructing a frontage road serving the subject property and connecting to the highway at a location where safe access can be provided should be considered, keeping in mind the economic justification of the improvement.
• A number of design considerations have been established to improve efficiency
and safety with respect to driveway design including safe stopping sight distance in the New Jersey State Highway Access Management Code (Reference 5) and in the ITE report on the “Guidelines for Driveway Location and Design” (Reference 3). These include consideration of traffic volumes and generation data, improvement of the width and radii of the swept path and the curb returns, angle between the driveway centerline and roadway edge, the spacing of the driveways, median cuts, left-turn access/egress and crossovers. When combined with sound engineering judgement, the result will be a better design.

23
6. FUTURE RESEARCH The establishment of safe driveway design standards and criteria is a complicated procedure that requires the careful consideration of the geometric characteristics, vehicle operation characteristics, traffic volume and generation data and other relevant issues. In future studies, the following issues need to be considered: • Besides the driveway perpendicular to the roadway, as some driveways do not
proceed perpendicular from the edge of the main road to the property, the issues related to the combination of horizontal curves and vertical grades on the major roadway need to be considered.
• Vertical curve design on grades in this study follows the standard AASHTO design
procedure, which is suitable for regular roadways. The combination of vertical curves and their standards needs to be established in detail specifically for driveway design.
• The crossover, approach and departure angles of a moving vehicle are significantly
different from those of a stopped vehicle considered in this study. In future studies, the moving vehicle suspensions and characteristics need to be determined.
24
REFERENCES 1. Conversation with Art Eisdorfer, Manager NJDOT Bureau of Civil Engineering,
December 14, 1998, and April 25, 2000. 2. A Policy on Geometric Design of Highways and Streets. American Association of
State Highway and Transportation Officials, 1994. 3. Guidelines for Driveway Location and Design. ITE Technical Committee 5B-13,
1987. 4. Francher, P.S., UMTRI, Vehicle Acceleration Characteristics Influencing Highway
Design Appendix F. NCHRP Report No. 270, 1984. 5. New Jersey State Highway Access Management Code. The New Jersey
Department of Transportation (NJDOT), April 1992.


![Guyana: Poverty Reduction Strategy Paper Progress Report 2004 …€¦ · IMF Country Report No. 04/407 [Month, Day], 2001 August 2, 2001 January 29, 2001 [Month, Day], 2001 August](https://static.fdocuments.net/doc/165x107/5f9184235b646d7fdc46350c/guyana-poverty-reduction-strategy-paper-progress-report-2004-imf-country-report.jpg)


