Final report - theigc.org 33 Pakistan's cane or beet sugar exports in 2015 ... business...
75
Final report Agriculture sector opportunities in the context of China-Pakistan Economic Corridor Consortium for Development Policy Research (CDPR) January 2018 When citing this paper, please use the title and the following reference number: S-37414-PAK-1
Transcript of Final report - theigc.org 33 Pakistan's cane or beet sugar exports in 2015 ... business...

Final report
Agriculture sector
opportunities in
the context of
China-Pakistan
Economic
Corridor
Consortium for Development Policy Research (CDPR)January 2018 When citing this paper, please use the title and the followingreference number:S-37414-PAK-1

A G R I C U L T U R E S E C T O R O P P O R T U N I T I E S I N C P E C ’ S C O N T E X T
Consortium for Development Policy Research

2 AGRICULTURE SECTOR OPPORTUNITIES IN CPEC’S CONTEXT
Consortium for Development Policy Research / International Growth Center
------ Back of the title page -------
AGRICULTURE SECTOR OPPORTUNITIES IN CPEC’S CONTEXT 3
Consortium for Development Policy Research / International Growth Center
Table of Contents
LIST OF FIGURES ............................................................................................................................... 5 LIST OF TABLES ................................................................................................................................. 7 1. INTRODUCTION, BACKGROUND & CONTEXT ................................................................. 8
1.1 INTRODUCTION .......................................................................................................................................... 8 1.2 CONTEXT OF CPEC ................................................................................................................................... 8 1.3 CHINA’S OBJECTIVES IN OBOR ............................................................................................................... 9 1.4 SIGNIFICANCE OF AGRICULTURE WITHIN CPEC .................................................................................. 9 1.5 PUNJAB’S OBJECTIVES IN AGRICULTURAL SECTOR ............................................................................ 11 1.6 PLANNING FOR CPEC ............................................................................................................................ 12
2. MAPPING THE OPPORTUNITY CANVAS FOR AGRICULTURAL SECTOR...................13 2.1 SIZE OF THE PRIZE - CHINA’S IMPORTS ............................................................................................... 13 2.2 PAKISTAN’S AGRICULTURE EXPORTS ................................................................................................... 17
2.2.1 Pakistan’s agricultural exports to China................................................................................. 23 2.3 CHINA’S AGRICULTURAL IMPORTS FROM THE WORLD ..................................................................... 23
SECTIONS 3, 4 & 5 - DIGGING DEEPER .....................................................................................28 3. RICE .................................................................................................................................................29
3.1 TRADE POTENTIAL ................................................................................................................................. 30 3.2 BOTTLENECKS TO EXPORT .................................................................................................................... 34
3.2.1 Tariff analysis ...................................................................................................................................... 34 3.2.2 Non-tariff barriers and competitiveness ................................................................................. 35
3.3 RECOMMENDATIONS .............................................................................................................................. 37 4. CITRUS ...........................................................................................................................................39
4.1 TRADE POTENTIAL ................................................................................................................................. 39 4.2 BOTTLENECKS TO EXPORT .................................................................................................................... 45
4.2.1 Tariff analysis ...................................................................................................................................... 45 4.2.2 Non-tariff barriers and competitiveness ................................................................................. 46
4.3 RECOMMENDATIONS .............................................................................................................................. 47 5. CITRUS AND MANGO PREPARATIONS ................................................................................50
5.1 TRADE POTENTIAL ................................................................................................................................. 50 5.1.1 Mango pulp ........................................................................................................................................... 50 5.1.2 Fruit juices ............................................................................................................................................. 52 5.1.3 Unfrozen orange juice (HS 200919) .......................................................................................... 53
5.2 BOTTLENECKS TO EXPORT .................................................................................................................... 58 5.2.1 Tariff analysis ...................................................................................................................................... 58 5.2.2 Non-tariff barriers and competitiveness ................................................................................. 59
5.3 RECOMMENDATIONS .............................................................................................................................. 61 6. OTHER HIGH OPPORTUNITY CATEGORIES .......................................................................63
6.1 GUAVAS AND MANGOES ........................................................................................................................ 63 6.2 SUGAR ....................................................................................................................................................... 65 6.3 VEGETABLES ............................................................................................................................................ 66
7. RECOMMENDATIONS AND CONCLUSION ...........................................................................70 7.1 VALUE CHAIN COMPETITIVENESS ....................................................................................................... 70 7.2 TARIFF AND NON-TARIFF BARRIERS .................................................................................................. 71 7.3 TECHNOLOGY PARTNERSHIP PROGRAM ............................................................................................. 71
4 AGRICULTURE SECTOR OPPORTUNITIES IN CPEC’S CONTEXT
Consortium for Development Policy Research / International Growth Center
7.4 OPPORTUNITY RADAR ........................................................................................................................... 72 7.5 INVESTOR FORA ...................................................................................................................................... 72 7.6 PROJECT PIPELINE FOR PRIVATE INVESTMENT ................................................................................ 72 7.7 CONCLUSION ............................................................................................................................................ 72

AGRICULTURE SECTOR OPPORTUNITIES IN CPEC’S CONTEXT 5
Consortium for Development Policy Research / International Growth Center
LIST OF FIGURES
Figure 1 Planning for CPEC - an iterative approach ........................................................................ 12
Figure 2 Concentration of exporting countries and average distance with their destination countries for agricultural products exported in 2015 ................................. 16
Figure 3 Pakistan's exports, 2015 ........................................................................................................... 19
Figure 4 Pakistan's agriculture exports, 2015 ................................................................................... 20
Figure 5 Pakistan's supply and international demand for agricultural products, grains, sugar and cotton, 2015 ...................................................................................................................... 21
Figure 6 Pakistan's supply and international demand for agricultural products, fruit and fruit preparations, 2015 .................................................................................................................... 22
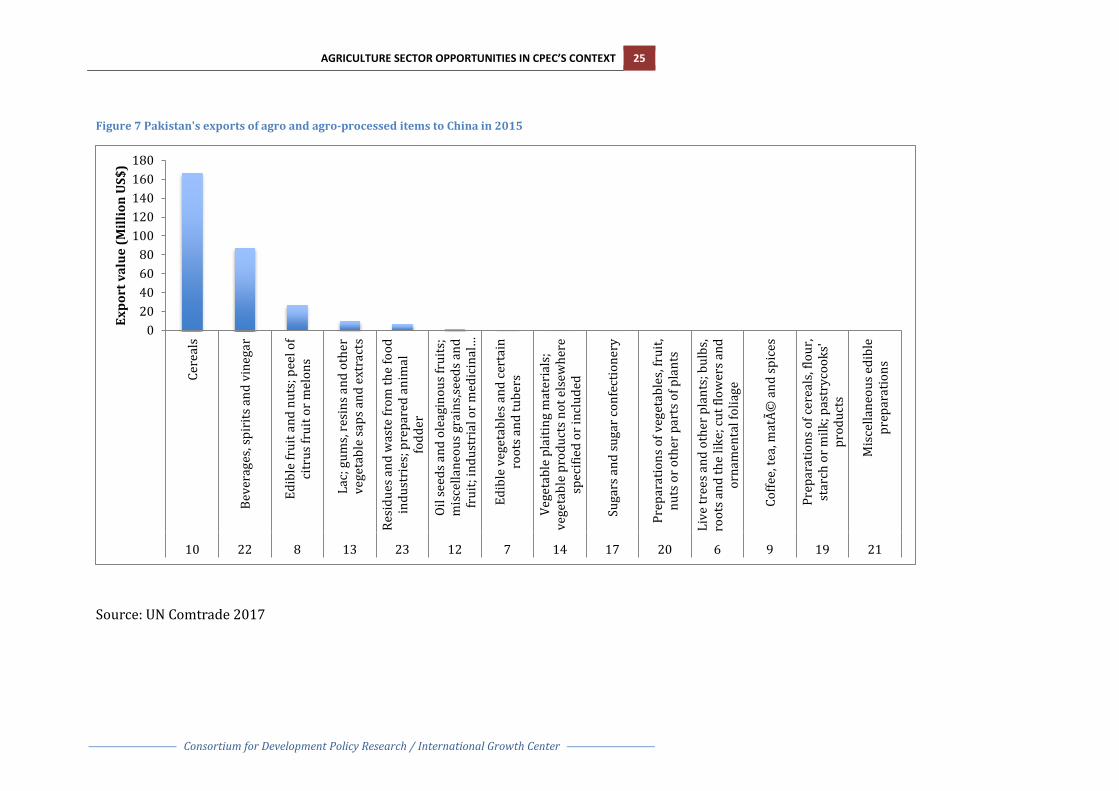
Figure 7 Pakistan's exports of agro and agro-processed items to China in 2015 ............... 25
Figure 8 China's imports of agro and agro-processed items in 2015 ...................................... 26
Figure 9 Top ten rice exporting countries in 2016 .......................................................................... 29
Figure 10 Pakistan's rice exports, 2003-2015 ................................................................................... 29
Figure 11 Pakistan's basmati and non-basmati rice exports to the world, 2005-2015 ... 30
Figure 12 Pakistan's basmati and non-basmati rice exports to China, 2005-2015 ........... 31
Figure 13 Pakistan's top export partners for rice in 2015 ........................................................... 32
Figure 14 China's import partners for rice in 2015 ........................................................................ 32
Figure 15 FTA status of Pakistan's rice exports ................................................................................ 34
Figure 16 Comparison of tariff rates for top importing country and Pakistan's imports to China .......................................................................................................................................................... 35
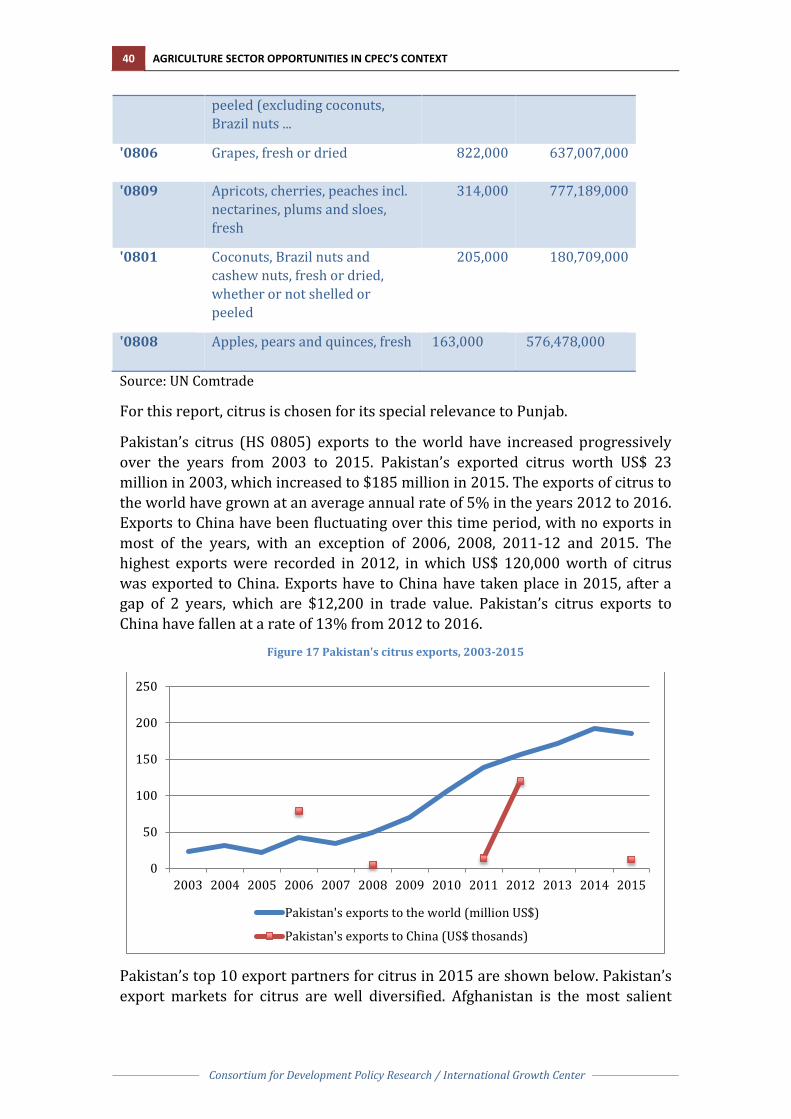
Figure 17 Pakistan's citrus exports, 2003-2015 ............................................................................... 40
Figure 18 Pakistan's top export partners for citrus, 2015 ........................................................... 41
Figure 19 China's import partners for citrus, 2015 ........................................................................ 41
Figure 20 Prospects for market diversification for Pakistan, HS0805 Citrus, fresh or dried .......................................................................................................................................................... 44
Figure 21 World exports of fruit juice (HS2009), 2001-2016 .................................................... 50
Figure 22: Pakistan's mango pulp (HS 08045050) exports to the world, 2005-2015 ...... 51
Figure 23: Pakistan's top exporting partners for mango pulp in 2015 ................................... 51
Figure 24 Pakistan's fruit juice exports in HS2009, 2003-2015 ................................................ 52
Figure 25: Pakistan's top export partners in fruit juices in 2015 (HS2009) ........................ 53
Figure 26: China's main import partners for fruit juices in 2015 ............................................. 53
6 AGRICULTURE SECTOR OPPORTUNITIES IN CPEC’S CONTEXT
Consortium for Development Policy Research / International Growth Center
Figure 27: Pakistan's exports of unfrozen orange juice, 2003-2015 ....................................... 54
Figure 28: Pakistan's top export partners for unfrozen orange juice in 2015 ..................... 55
Figure 29: China's import markets of unfrozen orange juice in 2015 ..................................... 55
Figure 30 Pakistan's exports in guava, mangoes, mangosteens in 2015 ................................ 63
Figure 31 Pakistan's export partners for guavas, mangoes, mangosteens in 2015 ........... 64
Figure 32 China's import partners of guavas, mangoes, mangosteens in 2015 .................. 64
Figure 33 Pakistan's cane or beet sugar exports in 2015 ............................................................. 65
Figure 34 China's main import partners for sugar, 2015 ............................................................. 66
Figure 35 Pakistan's vegetable exports, 2003-2015 ....................................................................... 67
Figure 36 Pakistan's top 20 export partners for vegetables, 2015 ........................................... 68
Figure 37 China's top import partners for vegetables, 2015 ...................................................... 68
AGRICULTURE SECTOR OPPORTUNITIES IN CPEC’S CONTEXT 7
Consortium for Development Policy Research / International Growth Center
LIST OF TABLES
Table 1: Pakistan's export of rice varieties to the world in 2015 .............................................. 33
Table 2 China's imports of rice varieties from the world, 2015 ................................................. 33
Table 3: Indicative trade potential for Pakistan's rice exports to CARs and China in 2015 ................................................................................................................................................................ ..... 34
Table 4 Pakistan's top fruit exports, 2015 .......................................................................................... 39
Table 5 Fruit trade complementarities with China, 2015............................................................. 39
Table 6: Pakistan's citrus exports to the world in 2015 ................................................................ 42
Table 7 China's imports of HS0805 in 2015 ....................................................................................... 42
Table 8 Pakistan's indicative trade potential for citrus, 2015 .................................................... 43
Table 9 Pakistan's citrus exports in Category 1 of Pak-China FTA ........................................... 45
Table 10: China’s top import partners in HS0805 ........................................................................... 45
Table 11: Pakistan's exports of fruit juices and pulp to the world in 2015 ........................... 56
Table 12 China's imports of fruit juices from the world, 2015 ................................................... 56
Table 13: Indicative trade potential for fruit juices in 2015 ........................................................ 57
Table 14 FTA Status of Pakistan’s fruit juice and pulp ................................................................... 58
Table 15 Comparison of tariff rates for Pakistan and top exporting country ...................... 59
Table 16 Pakistan's trade potential in guavas, mangoes and mangosteens in 2015 ......... 65
Table 17 Pakistan’s vegetable exports, 2015 ..................................................................................... 66
Table 18 Alignment of Pakistan's vegetable exports with China's vegetable imports ..... 69

8 AGRICULTURE SECTOR OPPORTUNITIES IN CPEC’S CONTEXT
Consortium for Development Policy Research / International Growth Center
1. Introduction, Background & Context
1.1 Introduction Agriculture Department, Government of Punjab requested the IGC Pakistan to help the Department inform its decision-making regarding agriculture sector opportunities in the context of China-Pakistan Economic Corridor (CPEC). Consequently IGC deployed technical support, to help Government of Punjab in looking at agriculture trade opportunities vis-à-vis CPEC. The support was provided in close coordination with the department.
The objectives of this work are to:
• Provide a framework to determine the Department of Agriculture’s priorities vis-à-vis CPEC
• Develop a template to analyze specific opportunities in priority sectors • Undertake illustrative case studies on three priority sectors and provide
recommendations on leveraging CPEC for these priority sectors
This report presents the final output of the project, describing the agriculture opportunity canvas that the Government of Punjab must focus on to capitalize on CPEC. It must be noted that this work presents a framework to identify Agriculture Department’s priorities vis-à-vis CPEC and digs deeper on a few product categories to illustrate this framework. The research has also identified three other opportunity areas that should be explored further. It is expected that the government will make full use of this framework by continuously running diagnostics and further exploring the opportunity frontier.
It is important to note that presently, the Government of Punjab is in the process of formulating the provincial agriculture policy. It is expected that this work will also inform the agriculture policy.
1.2 Context of CPEC One Belt One Road (OBOR) initiative is an integral part of China’s ‘Going Global’ strategy. Launched by China’s president, Xi Jinping in 2013, OBOR is arguably the largest initiative of this kind, spanning over 65 countries, 4.4 billion people and almost 40% of global GDP. 1 The project focuses on building a global infrastructure network by improving and creating trading routes, links and business opportunities with China via two main channels: 21st Century Maritime Silk Road (MSR) and the Silk Road Economic Belt (SREB). The Maritime Silk Route plans to connect regional waterways by construction of ports and other coastal infrastructure in countries located in Southeast Asia and East Africa,
1http://blogs.worldbank.org/eastasiapacific/china-one-belt-one-road-initiative-what-we-know-thus-far

AGRICULTURE SECTOR OPPORTUNITIES IN CPEC’S CONTEXT 9
Consortium for Development Policy Research / International Growth Center
enhancing their connectivity with China. The Silk Road Economic Belt, on the other hand, is a network of land and rail routes that extend along the ancient silk route from China through Central Asia and Middle East, all the way to Europe, including six economic corridors: New Eurasian Land Bridge (NLEB); China-Central and West Asia Economic Corridor (CCWAEC); China-Indo-China Peninsula Economic Corridor (CICPEC); China-Pakistan Economic Corridor (CPEC); and Bangladesh-China-India-Myanmar Economic Corridor (BCIMEC).
1.3 China’s objectives in OBOR Through OBOR, China aims to look for new growth drivers to accelerate its slowing economic growth in the last few years. In 2007, China’s GDP growth rate was 14.2%, however the growth rates slowed down in the following years, plummeting to 6.9 in 2015, a record low of the last 25 years. OBOR presents an opportunity for China to promote investments and gain access to new opportunities that can lead to sustainable economic growth, so that China and Asia can continue to fuel the global economic engine. With increased connectivity as a result of OBOR, China will be able to stimulate trade relations with ASEAN, Central Asian and European countries, which will spur a demand for China’s goods and services. It will also enable China to export its surplus productive capacity, especially in areas such as construction, engineering, technology, steel and cement. Overcapacity in these sectors has diminished returns on domestic investment and therefore China has turned to the international market to bolster commercial relations and capitalize on higher investment returns. OBOR comprises a host of current, planned and future infrastructure projects, for which China has directed significant capital towards construction of ports, roads, railways, oil and gas pipelines along with supporting IT and communication infrastructure. Through OBOR, China also aims to develop its landlocked and underdeveloped western and southern regions by providing better connectivity to international markets. Within this context, China-Pakistan Economic Corridor, stretching from Xinjiang to Gawadar port in Pakistan, will play a central role in development and modernization of Xinjiang.
1.4 Significance of Agriculture within CPEC China Development Bank (CDB) initially developed a long-term plan (LTP) for CPEC on behalf of Chinese government, laying out proposed details of the initiative for various areas of cooperation and investment, including agriculture.2
The main areas of collaboration in agricultural development and poverty alleviation are aimed at strengthening and upgrading of agricultural infrastructure adjoining the route of CPEC. Construction of water resources and water-saving modern agricultural demonstration zones will be promoted and medium- and low-yielding land will be remediated to achieve efficient use of
2 The detailed LTP was replaced by a much shorter summary version, which formed the basis of formalizing CPEC cooperation. So far there is no officially released formalized LTP document available.
10 AGRICULTURE SECTOR OPPORTUNITIES IN CPEC’S CONTEXT
Consortium for Development Policy Research / International Growth Center
resources. As a part of CPEC, technical exchange and cooperation in fields such as crop seed reproduction, livestock and poultry breeding, breeding and production technology, agricultural products processing, animal & plant epidemic prevention & control, mechanization demonstration and ICT-enabled agriculture will be strengthened. Post-harvest handling, storage and transportation of agricultural products will be improved, and innovation of advanced marketing and sales models has also been proposed. Cooperation between Pakistan and China will also work together to improve flood management, develop rangeland & deserts and strengthen remote sensing technologies. In order to improve agricultural practices, production of agriculture inputs particularly pesticides, fertilizer, machinery will be enhanced and support services including agriculture education and research will be provided to the farmers to ease adoption of better quality inputs. Collaboration in horticulture, fisheries and livestock medicines and vaccines is also one of the key areas covered in the LTP.
In particular, within agriculture, China aims to develop different stages of the value-chain, as proposed in the detailed LTP. A set of steps will be taken in order to improve pre-harvest agricultural practices. To develop breeding and plantation, agricultural practices will be modernized along the corridor by guiding farmers regarding agricultural mechanization and optimum scale production and encouraging use of improved varieties to improve productivity. An agricultural mechanization demonstration will be provided to the farmers and a leasing center will be constructed in Punjab to promote drip irrigation under plastic film and other water-saving agricultural techniques. Protected cultivation for the development of facility agriculture will also be encouraged. It has been planned to establish a plant and animal disease prevention and control system in Faisalabad and Lahore to reinforce R&D in view of the current cotton leaf roll virus and other plant viral diseases.
Post-harvest agricultural practices, including storage, transportation and agricultural processing will also be enhanced. Warehousing and logistics facilities in Islamabad and Lahore will be strengthened to form a warehousing and logistics network system connecting cities and covering the area along the CPEC. To develop agricultural processing capacity, modern agricultural product processing equipment and facilities will be provided to the processing units. It is also proposed to develop agricultural industry cluster around Islamabad and Lahore to create a processing base meeting international standards. These measures will help overcome some of the existing bottlenecks and upgrade post-harvest handling and processing of agriculture.
China and Pakistan have potential for symbiotic trade relations, whereby China can take advantage of the low-cost production resources available in Pakistan, and Pakistan can benefit from the technology and financing that China has to offer. Pakistan has an abundance of labor force, available at cheap rates, which can be employed by the Chinese companies to produce cost competitive products. Moreover, there is a large demand for Chinese products in Pakistan, so an increased ease of trade will lead to a spur in Chinese exports. Pakistan, on the
AGRICULTURE SECTOR OPPORTUNITIES IN CPEC’S CONTEXT 11
Consortium for Development Policy Research / International Growth Center
other hand, can modernize and develop its production processes by importing technology from China. Chinese investment can also provide the much needed financing for different projects in Pakistan. It will also allow domestic producers to learn by working closely with experienced Chinese investors. Through increased connectivity, both countries can benefit by playing to their comparative advantages.
Xinjiang Production and Construction Corps (XPCC), also commonly known as Bingtuan, is the autonomous administrative authority in Xinjiang Uyghur Autonomous Region of the China having expertise in modern agriculture and it is expected that Pakistan can greatly benefit from this expertise through technical cooperation.
1.5 Punjab’s objectives in agricultural sector According to the Punjab Agriculture Sector Plan 2015, the main objectives of Punjab government in the agricultural sector for the next 5 years include enhancing productivity, encouraging farmer-centric service delivery and private sector led growth. Government is targeting an increase in the growth rate of agriculture from the current level of 2.1% to 7%. This will be achieved by meeting the goal of 40% increase in crop productivity of wheat and sugarcane, 50% for cotton, 30% for rice and 20% for maize.3 Service delivery to farmers will also be strengthened to achieve 100% farmer access to evidence-based and diagnostic driven extension services. Agricultural Department will be transformed into a farmer centric institution, with use of information and communications technology to communicate with the farmers. In order to modernize and develop the sector, private investment worth PKR 150 billion will be mobilized.
Government has identified four major channels to meet these objectives. Firstly, farmer’s access to requisite inputs and knowledge should be increased. Information regarding modern farming practices, technology and machinery should be disseminated to farmers. Access to required inputs, such as seeds, fertilizer, pesticides and modern machinery should be ensured at a wide scale. Information and access will ensure easy adoption of productive farming techniques. Secondly, farmers should have efficient access to market in downward and upward linkages. Farmer should have access not only to inputs and value addition equipment, but also to market information so he is able to buy inputs at a lower cost. Farmer should also be able to sell produce in the market with adequate profit margins. The third channel is promotion of new investment and access to finance. This will ensure that farmers and other players of the value chain have access to credit and are able to afford high yielding inputs. Moreover, with higher investment, additional area will be brought under cultivation each year. The fourth enabler focuses on improving quality standards, which will bring Pakistan's products closer to the international benchmarks and quality standards, making it easier to export to other countries.
3http://www.agripunjab.gov.pk/system/files/Agri%20Sectoral%20plan%202015.pdf

12 AGRICULTURE SECTOR OPPORTUNITIES IN CPEC’S CONTEXT
Consortium for Development Policy Research / International Growth Center
1.6 Planning for CPEC Within the agriculture sector, Punjab’s approach to the CPEC investments should be informed by understanding the opportunities that these investments present through a mapping of the opportunity canvas. This can then lead to identification of key complementarities between Pakistan’s supply and Chinese demand, and vice versa. This report was commissioned by the Agriculture Department Punjab for this purpose, in collaboration with IGC and CDPR.
The research includes analyzing trade prospects with China in both export of agricultural products to China and beyond. A comprehensive examination of the export basket of Pakistan and the import basket of China was undertaken to identify promising agriculture and agro-processed products that offer opportunities to increase and diversify Pakistan’s exports to China. Once the opportunity canvas was mapped out, a more comprehensive analysis of the specific products/technologies with greatest potential was undertaken, including analysis to understand international and domestic market dynamics, bottlenecks and barriers and the issues highlighted pertained to domestic value chain and competitiveness or tariff and non-tariff barriers that hamper trade. It was imperative to involve the private sector in the process to develop a better understanding of the practical issues on ground. It is expected that in order to work through the bottlenecks, evidence-based targeted interventions should be designed and implemented by Agriculture Department, based on this research. This will result in expanding the canvas of Pakistan and lead to increased opportunities and exports to China and beyond. The same approach should be taken towards other products.
Figure 1 Planning for CPEC - an iterative approach
Mapping Opportunity
Canvas
Digging Deeper
Looping in Private
Sector
Designing Targeted
Interventions
Expanding the Canvas
AGRICULTURE SECTOR OPPORTUNITIES IN CPEC’S CONTEXT 13
Consortium for Development Policy Research / International Growth Center
2. Mapping the Opportunity Canvas for Agricultural Sector
2.1 Size of the prize - China’s imports China has a population of 1.3 billion people. Remarkable economic growth in the past three decades has resulted in sustained growth in consumer incomes, consumption and urbanization. This has increased the demand for food, with $1 trillion worth of food consumed every year. This is projected to increase by another $500 billion in the next 10 years. Rising incomes have also led to changes in food consumption patterns, with a demand for higher diversity, quality and imported food. Since 2009, China’s food imports have been increasing at an average rate of 15% per annum4 and in 2012, China surpassed USA to become world’s largest importer of agricultural products. Sales of packaged food have also quadrupled in the last 15 years in China. Therefore, China offers a huge market of imported food products.
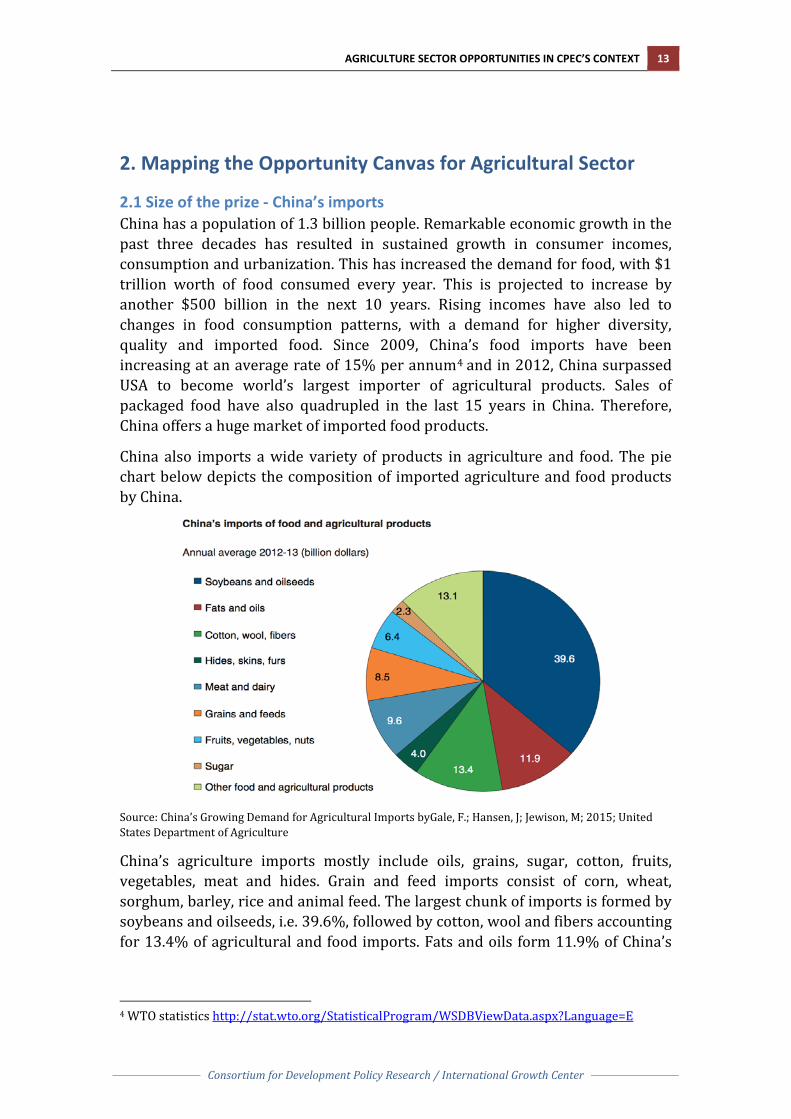
China also imports a wide variety of products in agriculture and food. The pie chart below depicts the composition of imported agriculture and food products by China.
Source: China’s Growing Demand for Agricultural Imports byGale, F.; Hansen, J; Jewison, M; 2015; United States Department of Agriculture
China’s agriculture imports mostly include oils, grains, sugar, cotton, fruits, vegetables, meat and hides. Grain and feed imports consist of corn, wheat, sorghum, barley, rice and animal feed. The largest chunk of imports is formed by soybeans and oilseeds, i.e. 39.6%, followed by cotton, wool and fibers accounting for 13.4% of agricultural and food imports. Fats and oils form 11.9% of China’s
4 WTO statistics http://stat.wto.org/StatisticalProgram/WSDBViewData.aspx?Language=E

14 AGRICULTURE SECTOR OPPORTUNITIES IN CPEC’S CONTEXT
Consortium for Development Policy Research / International Growth Center
imports, and meat and dairy products constitute 9.6% of imports. This diverse range of products is also being imported from several countries.
Leading exporters of agricultural products to China include USA, Brazil and Australia, followed by Canada, New Zealand and Argentina. During 2012-13, USA alone accounted of almost 24% of China’s imports in agriculture, occupying the first place in imports of soybeans and oilseeds, cotton, meat, cereal grains and hides among others. Brazil is the second largest import partner of China, constituting almost 20% of China’s agricultural imports, followed by Australia. These countries have increased exports to China manifold over the years, capitalizing on China’s increasing demand for quantity and variety of agricultural products. The following graph presents the trend for Chinese imports by these supplying markets from 2000 to 2013.
Source: China’s Growing Demand for Agricultural Imports by Gale, F.; Hansen, J; Jewison, M; 2015; United States Department of Agriculture
The graph indicates that there is a rising trend in the exports of all the countries supplying agricultural products to China from 2000 to 2013. Moreover, the rate of increase has also gone up over the years, especially after 2009, after which, as mentioned earlier, the imports of China have increased at a rate of 14%. Among the countries supplying agricultural exports to China, USA has experienced the largest increase. From almost $3 billion in 2000, USA’s exports have increased to $25 billion in 2013. USA is followed by Brazil, for which the exports have increased by over 10 times from 2000 to 2013. Similarly, Australia’s agricultural exports to China, which surpassed Argentina to be the third highest largest supplying country for China’s agricultural exports in 2010, have gone up from around $2 billion to $7 billion in a span of 13 years. There is a similar opportunity for Pakistan to increase its share in the agricultural imports of China.

AGRICULTURE SECTOR OPPORTUNITIES IN CPEC’S CONTEXT 15
Consortium for Development Policy Research / International Growth Center
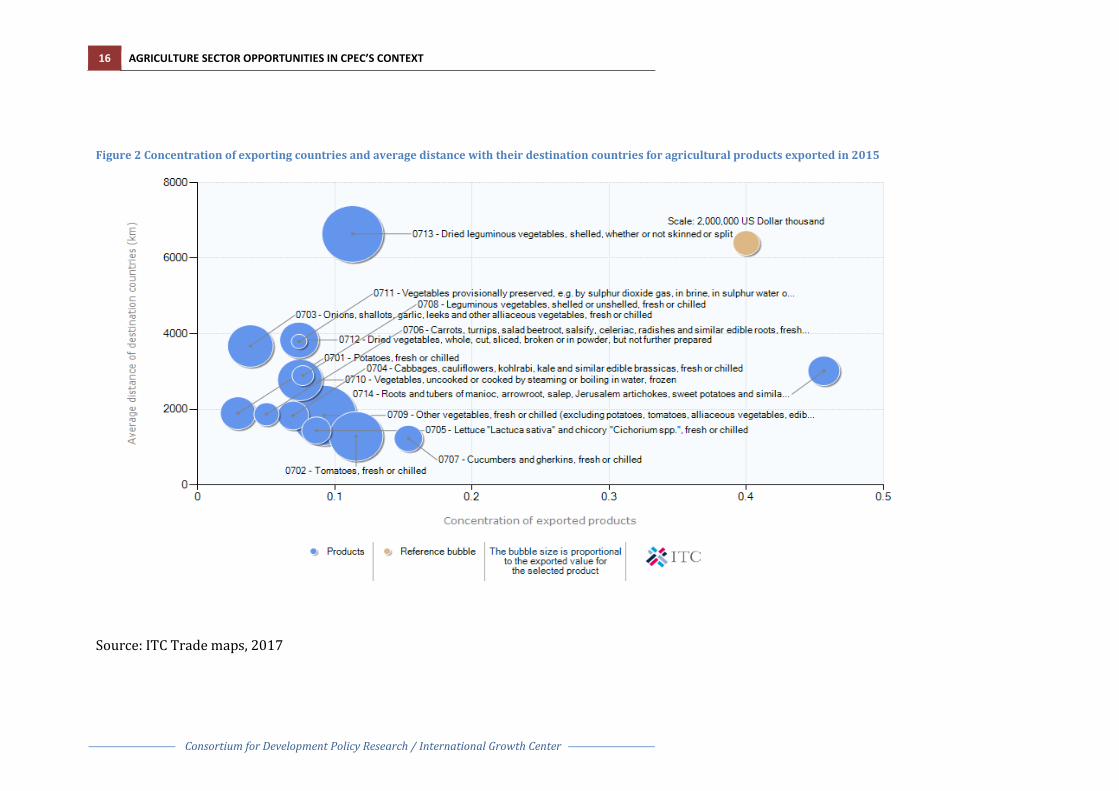
Distances play an important role in trade because smaller distances mean lower transportation cost. However, in case of food products, proximity is all the more important since the items are perishable. Risk of spoilage and contamination in transit increases in longer distances, due to which additional cost has to be incurred for preservation and packaging. Extra pesticides also have to be sprayed to increase shelf-life of food and prevent damage in the transport. All these factors made it unfavorable to trade perishable food items over long distances. The diagram below depicts the concentration of exported products and the average distance between the countries trading in food items.
16 AGRICULTURE SECTOR OPPORTUNITIES IN CPEC’S CONTEXT
Consortium for Development Policy Research / International Growth Center
Figure 2 Concentration of exporting countries and average distance with their destination countries for agricultural products exported in 2015
Source: ITC Trade maps, 2017

AGRICULTURE SECTOR OPPORTUNITIES IN CPEC’S CONTEXT 17
Consortium for Development Policy Research / International Growth Center
The size of the bubble in the graph above indicates the traded value of the item – the larger the bubble, the higher the traded value. The vertical axis represents the distance between the trading countries and the horizontal axis show the concentration of exported product, calculated by Herfindahl index, in terms of the number and share of exporting countries. As it can be seen, most of the bubbles are clustered towards the bottom left corner of the graph. This indicates that there is a variety of countries that are exporting these products globally, hence the concentration is low. It also shows that for most of the exported food items, the average distance between the trading countries is less than 4500 km. Therefore, it can be inferred that although export of food items is taking place in several countries, trade is higher between neighboring and regional countries, compared with countries that are far away. The only food item with an average distance higher than 6000 km is dried vegetables, which have a longer shelf-life.
2.2 Pakistan’s agriculture exports Current exports of Pakistan comprise of a variety of products. Figure 3 shows the export portfolio of Pakistan and each commodity group’s share in total exports of Pakistan. The most prominent category in Pakistan’s exports is textile and clothing, which make up more than half of Pakistan’s exports. The second largest export category is vegetables, accounting for 14% of Pakistan’s exports. Food products are the fourth important item in Pakistan’s exports, constituting almost 4% of total exports. Therefore, Pakistan’s bulk of export basket is reliant on agriculture. Even the food products alone form two of the major export categories of Pakistan, accounting for a cumulative of 18% of Pakistan’s exports.
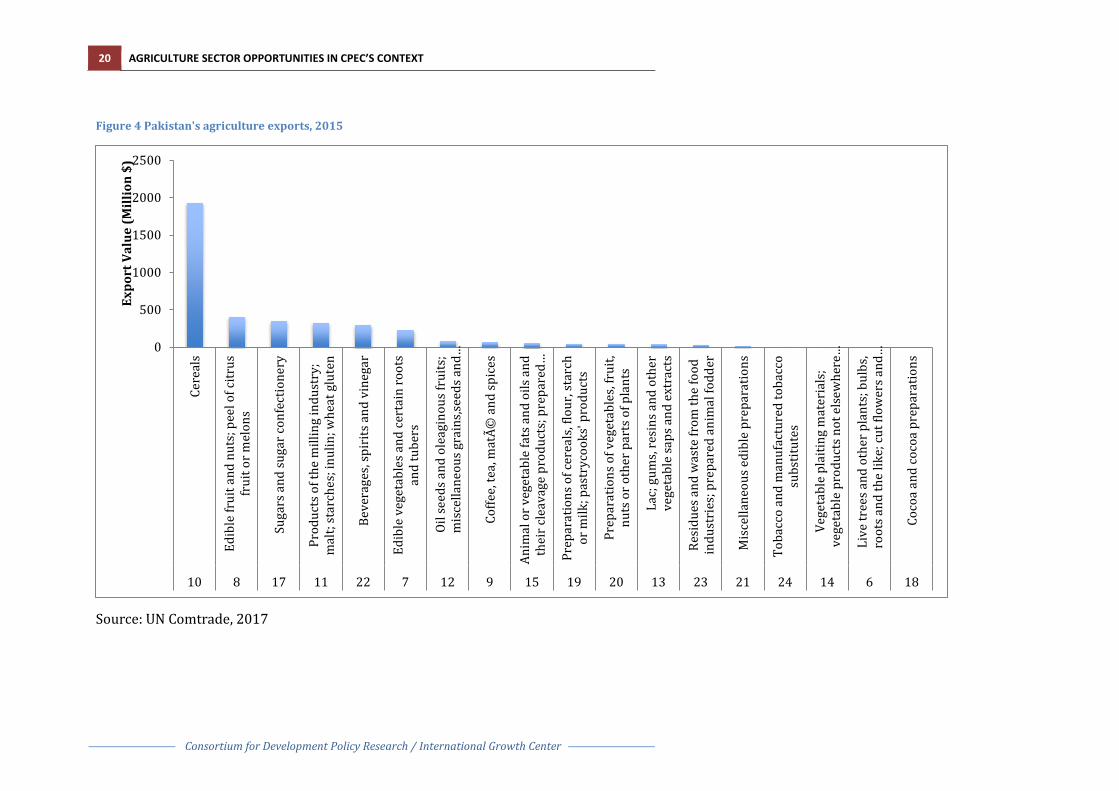
The structure of Pakistan’s exports to the world within agricultural and agro-processed excluding cotton and livestock-related products (HS codes up to HS24) is presented in Figure 4. It can be seen that the exports of Pakistan in agriculture and agro-based based products are somewhat diversified. The most dominant exports of Pakistan are cereals (HS code 10) earning $1,942 million, which is almost half of the over-all agro and agro-processed export earnings. The second highest category is edible fruit, nuts and fruit peels, with a value of $415 million, accounting for 10% of the total earnings. Both of the top two export categories are raw agricultural products; most of the value-added processed agricultural commodities constitute a smaller share of the total exports. Cumulative exports of Pakistan in agricultural and agro-processed items amount to $4.06 billion.
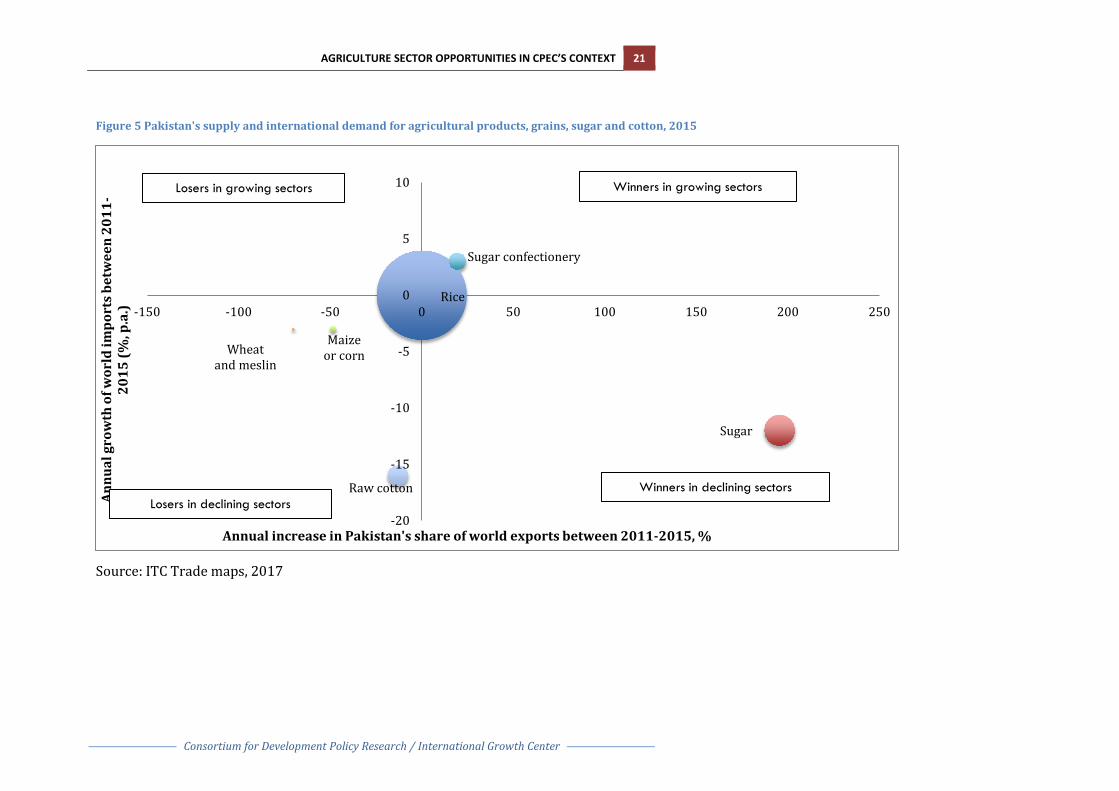
Figure 5 presents the performance of Pakistan’s exports of grains, sugar and cotton by comparing the annual growth of Pakistan’s share in world exports (horizontal axis) to the growth in international demand (vertical axis) of the same product, over the period 2011 and 2015. Products to the right of the vertical line, such as sugar confectionary and sugar, have grown faster than world exports; hence they have an increased share in the world’s market. For sugar confectionary, world imports have also been growing, but Pakistan has

18 AGRICULTURE SECTOR OPPORTUNITIES IN CPEC’S CONTEXT
Consortium for Development Policy Research / International Growth Center
been able to outperform world’s imports by increasing its share in the world market. For sugar, Pakistan’s share in the world market has been growing; however, the growth of world imports has been declining. Products to the left of the vertical line, such as wheat and muslin, maize or corn and raw cotton have grown at a slower pace than world’s exports, thereby decreasing Pakistan’s share in the world’s market. All of these products lie in the bottom left quadrant, which indicates that world imports have declined and Pakistan’s market share has also gone down. For rice, the growth in world imports has been stagnant and Pakistan’s share in world exports between 2011 and 2015 has also stayed constant over the years.
Similarly, the performance of fresh and prepared fruits is illustrated in Figure 6. From the size of the bubbles, it can be seen that among all the products in the chart, citrus fruit has the highest export value in 2015, followed by fresh or dried dates. Products in the top right quadrant, which are dried peaches and pears etc., jams, preserved vegetable or fruit in vinegar and citrus fruit have outperformed the market. Pakistan has an increasing market share of these products in an internationally growing market. Guavas, mangoes and mangosteens and dates are experiencing erosion in the share in international market although the international imports have been growing at an above average rate. For fruit juices, the growth of the international market has been negative, which implies that the international imports have been declining and Pakistan’s market share in these products has also been falling.

AGRICULTURE SECTOR OPPORTUNITIES IN CPEC’S CONTEXT 19
Consortium for Development Policy Research / International Growth Center
Figure 3 Pakistan's exports, 2015
Source: WITS World Bank
20 AGRICULTURE SECTOR OPPORTUNITIES IN CPEC’S CONTEXT
Consortium for Development Policy Research / International Growth Center
Figure 4 Pakistan's agriculture exports, 2015
Source: UN Comtrade, 2017
0
500
1000
1500
2000
2500
Cere
als
Edib
le fr
uit a
nd n
uts;
pee
l of c
itrus
frui
t or m
elon
s
Suga
rs a
nd su
gar c
onfe
ctio
nery
Prod
ucts
of t
he m
illin
g in
dust
ry;
mal
t; st
arch
es; i
nulin
; whe
at g
lute
n
Beve
rage
s, sp
irits
and
vin
egar
Edib
le v
eget
able
s and
cer
tain
root
san
d tu
bers
Oil s
eeds
and
ole
agin
ous f
ruits
;m
isce
llane
ous g
rain
s,see
ds a
nd…
Coffe
e, te
a, m
até
and
spic
es
Anim
al o
r veg
etab
le fa
ts a
nd o
ils a
ndth
eir c
leav
age
prod
ucts
; pre
pare
d…
Prep
arat
ions
of c
erea
ls, f
lour
, sta
rch
or m
ilk; p
astr
ycoo
ks' p
rodu
cts
Prep
arat
ions
of v
eget
able
s, fr
uit,
nuts
or o
ther
par
ts o
f pla
nts
Lac;
gum
s, re
sins
and
oth
erve
geta
ble
saps
and
ext
ract
s
Resi
dues
and
was
te fr
om th
e fo
odin
dust
ries
; pre
pare
d an
imal
fodd
er
Mis
cella
neou
s edi
ble
prep
arat
ions
Toba
cco
and
man
ufac
ture
d to
bacc
osu
bstit
utes
Vege
tabl
e pl
aitin
g m
ater
ials
;ve
geta
ble
prod
ucts
not
els
ewhe
re…
Live
tree
s and
oth
er p
lant
s; b
ulbs
,ro
ots a
nd th
e lik
e; cu
t flo
wer
s and
…
Coco
a an
d co
coa
prep
arat
ions
10 8 17 11 22 7 12 9 15 19 20 13 23 21 24 14 6 18
Expo
rt V
alue
(Mill
ion
$)
AGRICULTURE SECTOR OPPORTUNITIES IN CPEC’S CONTEXT 21
Consortium for Development Policy Research / International Growth Center
Figure 5 Pakistan's supply and international demand for agricultural products, grains, sugar and cotton, 2015
Source: ITC Trade maps, 2017
Rice
Sugar
Sugar confectionery
Maize or corn Wheat
and meslin
Raw cotton
-20
-15
-10
-5
0
5
10
-150 -100 -50 0 50 100 150 200 250
Annu
al g
row
th o
f wor
ld im
port
s bet
wee
n 20
11-
2015
(%, p
.a.)
Annual increase in Pakistan's share of world exports between 2011-2015, %
Losers in growing sectors Winners in growing sectors
Losers in declining sectors Winners in declining sectors

22 AGRICULTURE SECTOR OPPORTUNITIES IN CPEC’S CONTEXT
Consortium for Development Policy Research / International Growth Center
Figure 6 Pakistan's supply and international demand for agricultural products, fruit and fruit preparations, 2015
Source: ITC Trade maps, 2017
Citrus fruit
Fresh or dried dates Dried peaches, pears, papaws
papayas, tamarinds etc
Guavas, mangoes and mangosteens
Fruit juices
Veg/fruit in vinegar
Jams, jellies, marmalades
-6
-4
-2
0
2
4
6
8
10
12
14
-20 -10 0 10 20 30 40
Annu
al g
row
th o
f wor
ld im
port
s be
twee
n 20
11-2
015
(%, p
.a.)
Annual increase in Pakistan's share of world exports between 2011-2015, %
Losers in growing sectors Winners in growing sectors
Losers in declining sectors Winners in declining sectors
AGRICULTURE SECTOR OPPORTUNITIES IN CPEC’S CONTEXT 23
Consortium for Development Policy Research / International Growth Center
2.2.1 Pakistan’s agricultural exports to China In 2015, Pakistan exported agriculture and agro-processed products worth $303 million to China. As seen in Figure 7, Pakistan’s exports to China are mainly concentrated in a few products – cereals, beverages, edible fruit and nut, lac gums and residue of food industry. Almost half of the Pakistan’s total agro and agro-based exports to China comprise cereals, which include rice, wheat, muslin, maize or corn, barley, rye and oats. The second largest category is beverages, spirits and vinegar, which constitute almost $90 million of export earnings. This is followed by edible fruit and nuts, which constitute around one-tenth of Pakistan’s agro and agro-processed exports to China. Raw agricultural products constitute 68% of total exports to China, while value-added processed items account for 32% of agro and agro-processed exports to China.
2.3 China’s agricultural imports from the world As shown in Figure 8, China’s imports of agro and agro-processed items from the world amounted to a cumulative $76 billion in 2015. A variety of agricultural and agri-processed products are imported by China, ranging from oil seeds to preparations of fruit, vegetable and flour. As can be seen in the graph below, the most dominant category in imports is oil seeds, which constitute $40 billion in import expenditure, forming 53% of total imports of China. Cereals follow this, accounting for 12% of total imports. The third highest category is formed by edible fruit, nuts and peels of fruit, which account for 8% of China’s imports from the world. Raw agricultural products form 23% of China’s imports, compared to 77% constituted by value-added agro-processed items.
Pakistan exports to China in two of its top three imported agriculture and agro-processed product categories. However, the percentage of Pakistan’s exports in total imports of China is nominal. Pakistan’s exports in cereal, for instance, form a meager 1.8% of total Chinese exports in cereal. Similarly, edible fruit and nuts form 0.4% of the edible fruit import of China. The highest share of Pakistan’s exports in China’s imports is represented by lac, gums, resins, etc., which is 4.5% of Chinese imports, however these constitute a small portion of China’s imports.
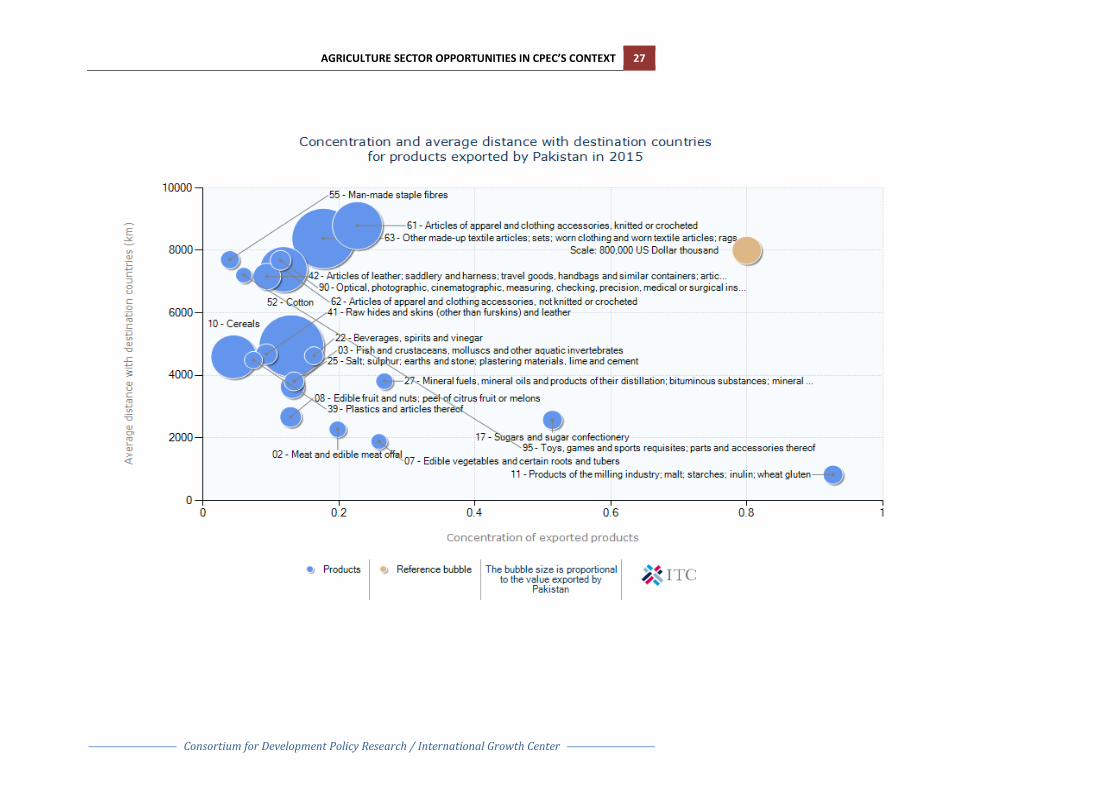
Similar to world trends, Pakistan’s exports to the world are sensitive to the distance between the trading partners. As seen, the bubbles with higher distances are mostly textile articles. For all of the food items, the bubbles are concentrated in the bottom left corner, indicating the greater sensitivity of food items to distance. The concentration of destination countries is low, which implies that Pakistan is exporting to a variety of countries and the average distance of these countries from Pakistan for food and agricultural products is below 6000 km. The lowest average distance between Pakistan and destination country is about 1900 km, for edible vegetables, followed by meat, fruit and nuts and sugar.
Regional trade in food items is higher than exports to far away countries. Despite this, exports to China, with whom Pakistan shares a border, are low,
24 AGRICULTURE SECTOR OPPORTUNITIES IN CPEC’S CONTEXT
Consortium for Development Policy Research / International Growth Center
which represents an underutilized opportunity as Pakistan has an edge over countries like the USA and Australia in terms of transport costs and travel times.
AGRICULTURE SECTOR OPPORTUNITIES IN CPEC’S CONTEXT 25
Consortium for Development Policy Research / International Growth Center
Figure 7 Pakistan's exports of agro and agro-processed items to China in 2015
Source: UN Comtrade 2017
020406080
100120140160180
Cere
als
Beve
rage
s, sp
irits
and
vin
egar
Edib
le fr
uit a
nd n
uts;
pee
l of
citr
us fr
uit o
r mel
ons
Lac;
gum
s, re
sins
and
oth
erve
geta
ble
saps
and
ext
ract
s
Resi
dues
and
was
te fr
om th
e fo
odin
dust
ries
; pre
pare
d an
imal
fodd
erOi
l see
ds a
nd o
leag
inou
s fru
its;
mis
cella
neou
s gra
ins,s
eeds
and
frui
t; in
dust
rial
or m
edic
inal
…
Edib
le v
eget
able
s and
cer
tain
root
s and
tube
rs
Vege
tabl
e pl
aitin
g m
ater
ials
;ve
geta
ble
prod
ucts
not
els
ewhe
resp
ecifi
ed o
r inc
lude
d
Suga
rs a
nd su
gar c
onfe
ctio
nery
Prep
arat
ions
of v
eget
able
s, fr
uit,
nuts
or o
ther
par
ts o
f pla
nts
Live
tree
s and
oth
er p
lant
s; b
ulbs
,ro
ots a
nd th
e lik
e; cu
t flo
wer
s and
orna
men
tal f
olia
ge
Coffe
e, te
a, m
até
and
spic
es
Prep
arat
ions
of c
erea
ls, f
lour
,st
arch
or m
ilk; p
astr
ycoo
ks'
prod
ucts
Mis
cella
neou
s edi
ble
prep
arat
ions
10 22 8 13 23 12 7 14 17 20 6 9 19 21
Expo
rt v
alue
(Mill
ion
US$
)

26 AGRICULTURE SECTOR OPPORTUNITIES IN CPEC’S CONTEXT
Consortium for Development Policy Research / International Growth Center
Figure 8 China's imports of agro and agro-processed items in 2015
Source: UN Comtrade 2017
0
10
20
30
40
50
Oil s
eeds
and
ole
agin
ous f
ruits
;m
isce
llane
ous g
rain
s,see
ds a
nd fr
uit;
indu
stri
al o
r med
icin
al p
lant
s; st
raw
…
Cere
als
Edib
le fr
uit a
nd n
uts;
pee
l of c
itrus
frui
t or m
elon
s
Resi
dues
and
was
te fr
om th
e fo
odin
dust
ries
; pre
pare
d an
imal
fodd
er
Beve
rage
s, sp
irits
and
vin
egar
Prep
arat
ions
of c
erea
ls, f
lour
, sta
rch
or m
ilk; p
astr
ycoo
ks' p
rodu
cts
Edib
le v
eget
able
s and
cer
tain
root
san
d tu
bers
Suga
rs a
nd su
gar c
onfe
ctio
nery
Mis
cella
neou
s edi
ble
prep
arat
ions
Prep
arat
ions
of v
eget
able
s, fr
uit,
nuts
or o
ther
par
ts o
f pla
nts
Coffe
e, te
a, m
até
and
spic
es
Lac;
gum
s, re
sins
and
oth
er v
eget
able
saps
and
ext
ract
s
Live
tree
s and
oth
er p
lant
s; b
ulbs
,ro
ots a
nd th
e lik
e; cu
t flo
wer
s and
orna
men
tal f
olia
ge
Vege
tabl
e pl
aitin
g m
ater
ials
;ve
geta
ble
prod
ucts
not
els
ewhe
resp
ecifi
ed o
r inc
lude
d
12 10 8 23 22 19 7 17 21 20 9 13 6 14
Impo
rt v
alue
(bill
ion
US$
)
AGRICULTURE SECTOR OPPORTUNITIES IN CPEC’S CONTEXT 27
Consortium for Development Policy Research / International Growth Center

28 AGRICULTURE SECTOR OPPORTUNITIES IN CPEC’S CONTEXT
Consortium for Development Policy Research / International Growth Center
Sections 3, 4 & 5 - Digging Deeper From the section above, it can be seen that China represents a large opportunity for Pakistani agricultural products, which is currently severely underutilized. This section focuses on three specific agricultural products with a more detailed analysis: rice, citrus and basic fruit preparations namely juices, pulp and concentrate.

AGRICULTURE SECTOR OPPORTUNITIES IN CPEC’S CONTEXT 29
Consortium for Development Policy Research / International Growth Center
3. Rice Pakistan’s rice exports represented 5.3% of global rice exports in 2016, placing Pakistan in the top five exporters of rice in the world.
Figure 9 Top ten rice exporting countries in 2016
Source: ITC Trade maps
Pakistan’s rice exports to the world have shown an increasing trend over the years. From 2003, the exports have increased from $626 million to $1.9 billion in 2015, a three-fold increase. Exports to the world peaked in 2008, with a value of $2.4 billion. The average annual growth rate of Pakistan’s exports in the years 2012 to 2016 is -4%.
Figure 10 Pakistan's rice exports, 2003-2015
Source: UN Comtrade
0
1
2
3
4
5
6
India Thailand UnitedStates ofAmerica
Viet Nam Pakistan Italy Uruguay China Cambodia Brazil
Rice
exp
orts
(US$
bill
ions
)
0
0.5
1
1.5
2
2.5
2003 2004 2005 2006 2007 2008 2009 2010 2011 2012 2013 2014 2015
Billi
on U
S$
Pakistan's exports to the world Pakistan's exports to China
30 AGRICULTURE SECTOR OPPORTUNITIES IN CPEC’S CONTEXT
Consortium for Development Policy Research / International Growth Center
Four varieties are grown in Pakistan: Basmati, Long Grain, IRRI 6 and Extra Long Grain. These can be categorized as basmati, which is the aromatic variety, and non-basmati rice. Basmati rice is mainly produced in India and Pakistan and fetches a higher price in the international market than non-basmati rice due to its aroma. It is therefore a premium product. In 2015, Pakistan’s exports of non-basmati rice to the world were 4.5 times the export of basmati rice in quantity (3054680 metric tons for non-basmati compared to 676360 metric tons for basmati), however the export earnings for non-basmati rice were less than 2 times that of basmati rice (US$1.2 billion for non-basmati and US$0.86 billion for basmati).5
3.1 Trade potential Rice exports to China remained stagnant over the years till 2011, when the Chinese approved rice exports from Pakistan, certifying that they met SPS requirements. Following this, there was a sharp increase in 2012, with exports peaking at $254 million. Since then exports have tapered off and currently stand at US$160 million. In 2003, the share of Pakistan’s rice exports to China was 0.01% of Pakistan’s total rice exports to the world, which has increased to 8.7% in 2015. However, Pakistan’s exports of rice to China have declined with an average annual rate of 2% in the years 2012 to 2016.
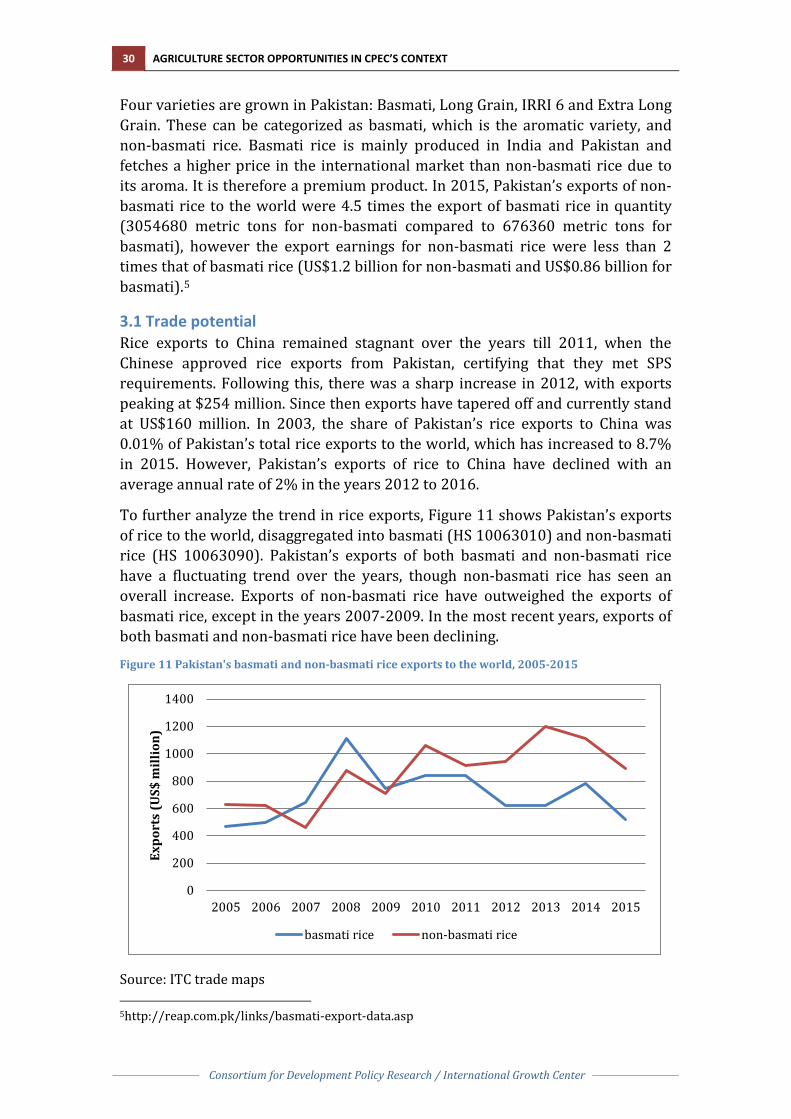
To further analyze the trend in rice exports, Figure 11 shows Pakistan’s exports of rice to the world, disaggregated into basmati (HS 10063010) and non-basmati rice (HS 10063090). Pakistan’s exports of both basmati and non-basmati rice have a fluctuating trend over the years, though non-basmati rice has seen an overall increase. Exports of non-basmati rice have outweighed the exports of basmati rice, except in the years 2007-2009. In the most recent years, exports of both basmati and non-basmati rice have been declining.
Figure 11 Pakistan's basmati and non-basmati rice exports to the world, 2005-2015
Source: ITC trade maps 5http://reap.com.pk/links/basmati-export-data.asp
0
200
400
600
800
1000
1200
1400
2005 2006 2007 2008 2009 2010 2011 2012 2013 2014 2015
Expo
rts
(US$
mill
ion)
basmati rice non-basmati rice
AGRICULTURE SECTOR OPPORTUNITIES IN CPEC’S CONTEXT 31
Consortium for Development Policy Research / International Growth Center
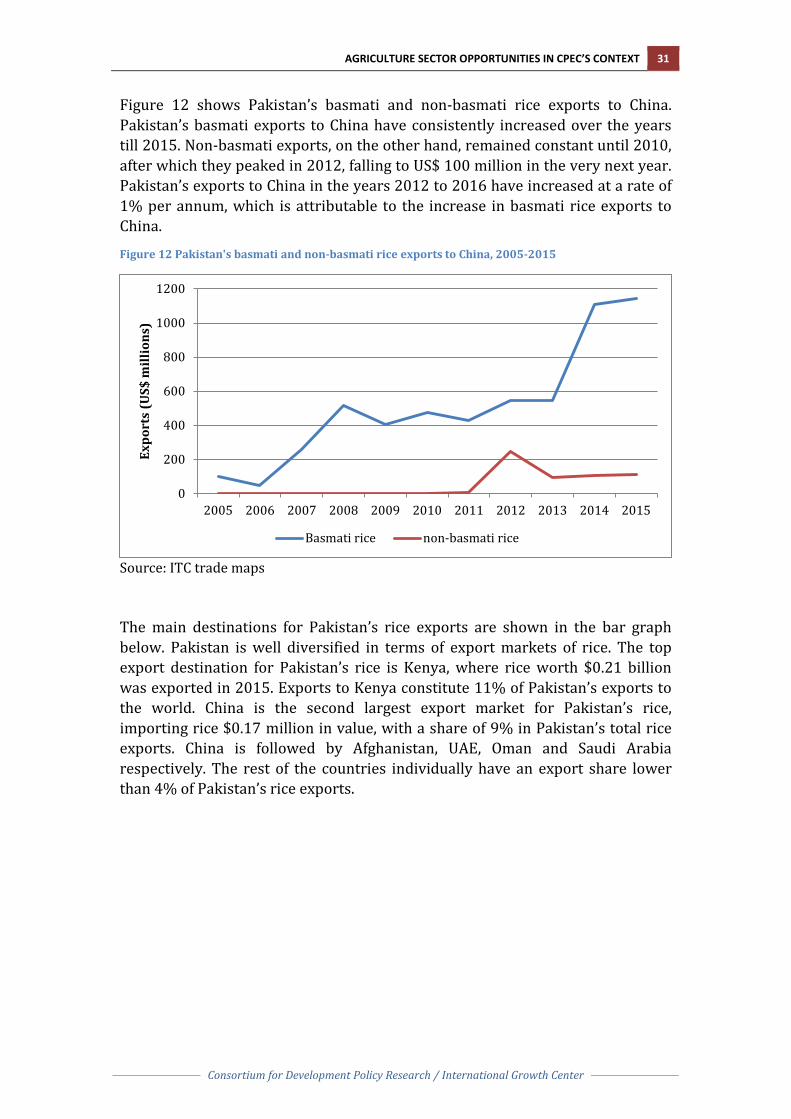
Figure 12 shows Pakistan’s basmati and non-basmati rice exports to China. Pakistan’s basmati exports to China have consistently increased over the years till 2015. Non-basmati exports, on the other hand, remained constant until 2010, after which they peaked in 2012, falling to US$ 100 million in the very next year. Pakistan’s exports to China in the years 2012 to 2016 have increased at a rate of 1% per annum, which is attributable to the increase in basmati rice exports to China.
Figure 12 Pakistan's basmati and non-basmati rice exports to China, 2005-2015
Source: ITC trade maps
The main destinations for Pakistan’s rice exports are shown in the bar graph below. Pakistan is well diversified in terms of export markets of rice. The top export destination for Pakistan’s rice is Kenya, where rice worth $0.21 billion was exported in 2015. Exports to Kenya constitute 11% of Pakistan’s exports to the world. China is the second largest export market for Pakistan’s rice, importing rice $0.17 million in value, with a share of 9% in Pakistan’s total rice exports. China is followed by Afghanistan, UAE, Oman and Saudi Arabia respectively. The rest of the countries individually have an export share lower than 4% of Pakistan’s rice exports.
0
200
400
600
800
1000
1200
2005 2006 2007 2008 2009 2010 2011 2012 2013 2014 2015
Expo
rts
(US$
mill
ions
)
Basmati rice non-basmati rice

32 AGRICULTURE SECTOR OPPORTUNITIES IN CPEC’S CONTEXT
Consortium for Development Policy Research / International Growth Center
Figure 13 Pakistan's top export partners for rice in 2015
China’s import partners for rice are shown in Figure 14. China’s imports for rice amount to US$ 1.4 billion. China’s rice import market is concentrated, with only four countries major import partners. The top import partner for rice in China is Vietnam, accounting for 50% of China’s rice imports. Vietnam is followed by Thailand, which constitutes 32% of China’s import. Pakistan comes in third with rice imports accounting for 11% of China’s total rice imports in 2015.
Figure 14 China's import partners for rice in 2015
The following table shows the varieties of rice exported by Pakistan. Other varieties of rice, i.e. non-basmati, account for 46% of Pakistan’s rice exports and form the largest chunk in rice exports to the world. The second largest export category is basmati rice, constituting 27% of Pakistan’s exports, followed by broken rice with 26% of the share. Husked rice and rice in the husk are also part of the export mix, however, they form a small portion of total rice exports.
-
50
100
150
200
250Va
lue
( US$
Mill
ions
)
0100200300400500600700800
Valu
e (U
S$ m
illio
ns)
AGRICULTURE SECTOR OPPORTUNITIES IN CPEC’S CONTEXT 33
Consortium for Development Policy Research / International Growth Center
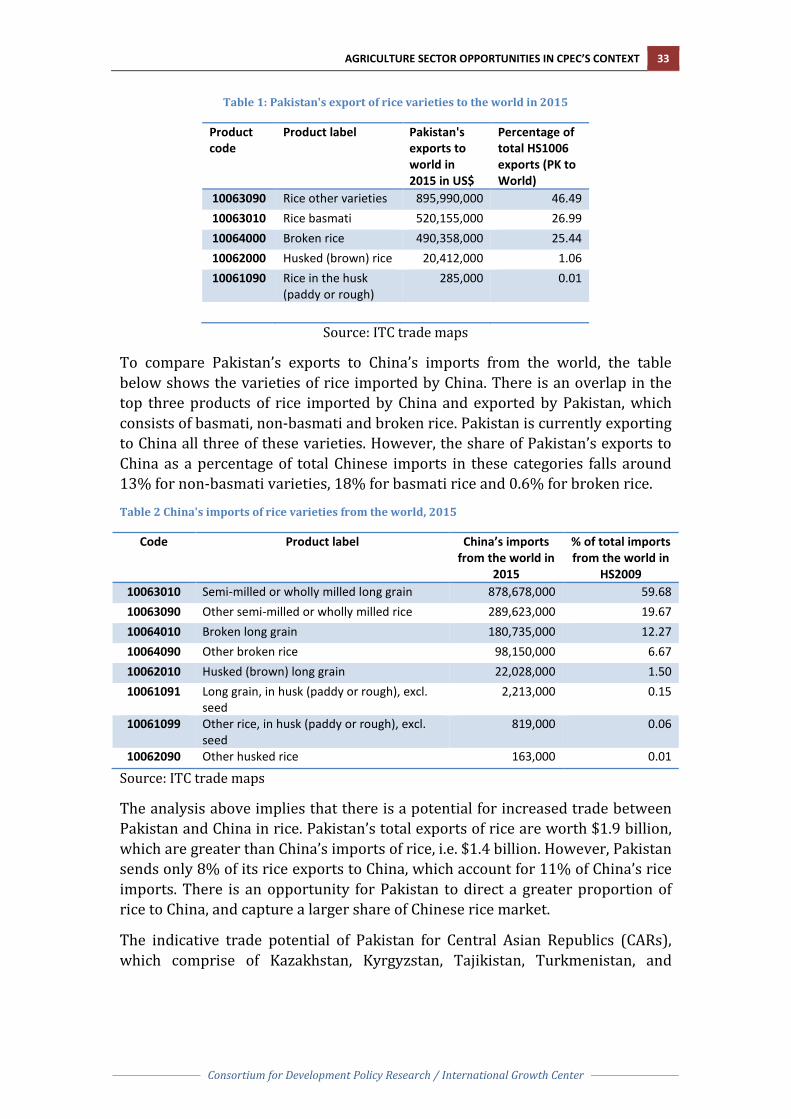
Table 1: Pakistan's export of rice varieties to the world in 2015
Product code
Product label Pakistan's exports to world in 2015 in US$
Percentage of total HS1006 exports (PK to World)
10063090 Rice other varieties 895,990,000 46.49 10063010 Rice basmati 520,155,000 26.99 10064000 Broken rice 490,358,000 25.44 10062000 Husked (brown) rice 20,412,000 1.06 10061090 Rice in the husk
(paddy or rough) 285,000 0.01
Source: ITC trade maps
To compare Pakistan’s exports to China’s imports from the world, the table below shows the varieties of rice imported by China. There is an overlap in the top three products of rice imported by China and exported by Pakistan, which consists of basmati, non-basmati and broken rice. Pakistan is currently exporting to China all three of these varieties. However, the share of Pakistan’s exports to China as a percentage of total Chinese imports in these categories falls around 13% for non-basmati varieties, 18% for basmati rice and 0.6% for broken rice.
Table 2 China's imports of rice varieties from the world, 2015
Code Product label China’s imports from the world in
2015
% of total imports from the world in
HS2009 10063010 Semi-milled or wholly milled long grain 878,678,000 59.68 10063090 Other semi-milled or wholly milled rice 289,623,000 19.67 10064010 Broken long grain 180,735,000 12.27 10064090 Other broken rice 98,150,000 6.67 10062010 Husked (brown) long grain 22,028,000 1.50 10061091 Long grain, in husk (paddy or rough), excl.
seed 2,213,000 0.15
10061099 Other rice, in husk (paddy or rough), excl. seed
819,000 0.06
10062090 Other husked rice 163,000 0.01
Source: ITC trade maps
The analysis above implies that there is a potential for increased trade between Pakistan and China in rice. Pakistan’s total exports of rice are worth $1.9 billion, which are greater than China’s imports of rice, i.e. $1.4 billion. However, Pakistan sends only 8% of its rice exports to China, which account for 11% of China’s rice imports. There is an opportunity for Pakistan to direct a greater proportion of rice to China, and capture a larger share of Chinese rice market.
The indicative trade potential of Pakistan for Central Asian Republics (CARs), which comprise of Kazakhstan, Kyrgyzstan, Tajikistan, Turkmenistan, and

34 AGRICULTURE SECTOR OPPORTUNITIES IN CPEC’S CONTEXT
Consortium for Development Policy Research / International Growth Center
Uzbekistan, and China is presented in the table below.6 As seen Pakistan currently exports rice worth US$ 12.64 million to CARs, which is much lower than the imports of CARs from the world. The indicative trade potential shows that there is an opportunity for Pakistan to increase its rice exports to CARs by almost US$ 85 million. Similarly, Pakistan’s rice exports to China have a potential to increase up to US$ 1300 million. These potentials are currently unexploited by Pakistan.
Table 3: Indicative trade potential for Pakistan's rice exports to CARs and China in 2015
US Million $ CARs China
Pakistan's exports 12.64 167
Imports from the world 97.43 1472.4
Indicative trade potential 7 84.6 1300
Source: ITC trade maps
Pakistan’s current rice exports to China form a nominal share of China’s rice imports. There is a potential for Pakistan to increase its exports to China by a significant amount, however the potential is underutilized. The section below delves into the bottlenecks in exporting to China.
3.2 Bottlenecks to export This section explores the reasons that the Chinese market is currently underutilized by Pakistan, by exploring tariff and non-tariff barriers and other impediments such as competitiveness and market demand.
3.2.1 Tariff analysis All categories of rice (HS1006) are either a part of category 5 in China’s offer list, which does not grant any tariff concession, or are not a part of Pak-China FTA. Therefore, no preferential tariff is applicable to Pakistan’s exports of rice to China under the FTA.
Figure 15 FTA status of Pakistan's rice exports
Product code
Product label Pakistan's exports to China in 2015 in US$
Pakistan's exports to world in 2015 in US$
Percentage of total HS1006 exports (PK to World)
Categories
10063090 Rice other varieties 113,268,000 895,990,000 46.49 Cat 5 10063010 Rice basmati 1,142,000 520,155,000 26.99 Cat 5 10064000 Broken rice 52,639,000 490,358,000 25.44 Not in FTA 10062000 Husked (brown) rice 0 20,412,000 1.06 Not in FTA
6 Trade potential = min {country’s exports; partner country’s imports} – actual bilateral trade The trade potential formula described uses export and import data as proxies for a country’s supply and demand potentials, respectively. For this reason, this formula does not consider the supply side constraints that a country may face in producing and exporting a specific product. It is for this reason that trade potential serves only as a starting point to inform further research. 7 Indicative trade potential for rice has been calculated as the sum of trade potentials for HS 100620, HS 100640, HS 100610 and HS 100630.

AGRICULTURE SECTOR OPPORTUNITIES IN CPEC’S CONTEXT 35
Consortium for Development Policy Research / International Growth Center
10061090 Rice in the husk (paddy or rough)
0 285,000 0.01 Not in FTA
Source: ITC trade maps, http://www.commerce.gov.pk/?page_id=205
Tariffs may therefore be one of the factors restricting exports to China. China maintains Tariff Rate Quota (TRQ) on import of rice as Most Favored Nation (MFN) duty. According to this a low-tariff of 1% is levied on import of a quota of 5.3 million tons of rice (cumulative imports from all countries), while import of rice beyond this quota is subject to a tariff of 65%.8 This two-tiered tariff is applicable to all countries, except ASEAN and those that have not been granted MFN status by China. As shown in the table below, the same TRQ is levied on import of rice from Pakistan as well. However, ASEAN countries, which are the top exporters of rice to China, enjoy preferential tariff rates as a part of ASEAN-China FTA. They are granted tariff rates of 20% in non-basmati and broken rice and 50% of tariff in basmati rice imported in China.
Figure 16 Comparison of tariff rates for top importing country and Pakistan's imports to China9
Product code Product label Top importing country
ASEAN tariff in 2015
Pakistan tariff in 2015
10063090 Rice other varieties Vietnam 20% OQTR: 65.00% IQTR : 1.00%
10063010 Rice basmati Thailand 50% OQTR: 65.00% IQTR : 1.00%
10064010 Rice: Broken rice Vietnam 20% OQTR: 65.00% IQTR : 1.00%
Source: ITC trade maps10
The analysis above shows that tariff rates negotiated under the Pakistan-China FTA are higher than those available to the ASEAN countries under the China-ASEAN FTA, which puts Pakistan’s rice exports at a disadvantage.
3.2.2 Non-tariff barriers and competitiveness In order to explore other non-tariff bottlenecks to export, a focus group session was conducted which was attended by farmers, aartis (middlemen), the Director of Rice Research Board and rice exporters. The discussion below draws on the focus group discussion.
The success that Pakistan has had in Chinese markets so far (relative to India, which is Pakistan’s main competitor for rice) is ascribed to two factors. Firstly, there is a preference for hybrid rice in China, not basmati, and Pakistan’s IRRI-6 is being exported to meet that demand. Secondly, exports to China were allowed after the Chinese approved the phyto-sanitary standards of the rice in 2011. This
8http://www.fao.org/giews/food-prices/food-policies/detail/en/c/447214/ 9 10064000, which is reported by Pakistan as exported to China, is not there in the tariff analysis on ITC. 10http://www.macmap.org/QuickSearch/FindTariff/FindTariff.aspx

36 AGRICULTURE SECTOR OPPORTUNITIES IN CPEC’S CONTEXT
Consortium for Development Policy Research / International Growth Center
is the reason given for the peak in rice exports in 2012. Last year, in November 2016, 14 Indian companies were also approved for exporting rice to China, being previously not allowed, and therefore Pakistan is likely to face increased competition from India now.
Pakistan started losing market share to India in recent years. Rice growers maintain that Pakistani rice is more expensive as Indian rice growers are subsidized. For example, subsidized fertilizer and free water bring down Indian prices. In addition, unlike Pakistan, there is a drainage plan for each village in India, which ensures that the crop is not harmed by excess and untimely water.
Furthermore, Pakistani rice growers claim that India is also actively carrying out research in rice, and has developed high yielding varieties of rice, which increase their yield/acre and reduces incidence of pest attacks. India has developed five new rice varieties in the last 10 years; on the other hand, in Pakistan the last rice variety, i.e. Super Basmati, was introduced in 1977. New varieties that have been experimented with after Super Basmati were non-aromatic, and did not receive much patronage. India has also invested in effective marketing and branding of its rice and India’s rice exports are properly packaged and labeled. In comparison, most of the rice exported from Pakistan is in bulk, without any packaging and branding. All these factors contribute to making India’s rice more price-competitive than Pakistan’s.
Aside from competitiveness issues, Pakistan is losing market share due to being unable to target the desired customers. Basmati rice is premium quality rice, known for its flavor and aroma, which targets high-end consumers and fetches a higher price in the international market than other rice varieties. In the last few years, India has been exporting non-aromatic rice labeled as basmati, at lower prices than Pakistan. This has interrupted market segmentation, because of which Pakistan is unable to target high-end consumers for its elite rice variety and is facing a decline in market share. In 2010, Pakistan exported 1.1 million tons of basmati rice to the world, which has fallen to 0.7million tons in 2014-15. In comparison, India’s basmati export to the world has doubled from 2.3 million metric tons in 2010 to 4 million metric tons in 2015.11 Therefore, Pakistani rice growers feel that Pakistan is losing market share due to incorrect labeling and marketing of Indian non-aromatic rice as basmati.
Another impeding factor is the lack of coordination among the key players of rice value chain. Although Pakistan Rice Board brings all the stakeholders together, this body is seen merely as advisory, with little power to resolve issues. There is a dearth of funds and resources available to the board, because of which it is not able to function properly. Another platform that can act as a coordinating platform is Rice Exporters Association of Pakistan (REAP); however, the association does not have fair representation of each stage of the value chain. There is no representation of producers or other stockholders, due to which there is a conflict of interest and most propositions made by the association are 11http://agriexchange.apeda.gov.in/indexp/genReport_combined.aspx#content

AGRICULTURE SECTOR OPPORTUNITIES IN CPEC’S CONTEXT 37
Consortium for Development Policy Research / International Growth Center
bent towards favoring the exporters. Additionally, the association board consists of a majority of non-basmati rice exporters from Sindh, who have a greater say in the decisions of the association. REAP is also supposed to act as a bridge between public and private sector, however rice growers feel that even in cases where it has communicated the issues to Ministry of Commerce, no steps have been taken towards their resolution by the ministry. Therefore, there is an absence of an effective formal coordinating body between different stakeholders of the rice supply chain and between the government and rice sector.
Yet another impediment is that conventional farming practices lead to low crop yields and high wastage. On a large scale, rice seeds are being planted by hand and mechanization of farms has been very limited. The fields are set on fire in order to remove the straw that remains after harvesting, which destroys some of the essential nutrients and useful bacteria of the soil as well. Use of modern technology in farming techniques can increase efficiency in production. However, 98% of farms in Punjab are smaller than 25 acres due to which farmers do not find it profitable to invest in expensive agricultural machinery. Most of the implements used in rice cultivation, such as transplanters, are not produced domestically but have to be imported from other countries, which further increases the cost of mechanization. Agricultural Machinery Research Institute was formed to facilitate farmers in the introduction of modern technology; however, this institute is dysfunctional and has not been able to work towards its purpose.
In summary, Pakistan faces high tariffs relative to other countries that China imports rice from. However, there do not appear to be China specific non-tariff barriers to export. The main issues that impede competitiveness are domestic, such as low research and development in seed varieties, outdated plantation and harvesting techniques, and poor coordination between rice stakeholders and government.
3.3 Recommendations In order to increase yield, there is a need to modernize Pakistan’s rice production and alleviate domestic constraints to competitiveness. These include importing and providing time limited subsidies to encourage the use of modern machinery such as transplanters, research and development support, providing funding for farmers to invest in improving their productivity.
Secondly, Pakistani rice needs better marketing and branding efforts in order to expand market share in China, and in other international markets where Pakistan is losing market share. This would also allow consumers to differentiate between authentic and sub-quality basmati rice.
Thirdly, it is important to negotiate a better tariff under the FTA. Pakistan currently has no concessions under the FTA, and does not compare favorably with China’s other trade partners.

38 AGRICULTURE SECTOR OPPORTUNITIES IN CPEC’S CONTEXT
Consortium for Development Policy Research / International Growth Center
Finally, it is essential to ensure that all the players of the value chain from research and development to exporters are integrated and well-informed. This can be done by creating an Agriculture Produce and Export Authority, which has fair representation of each player of the value chain, including stakeholders for both basmati and non-basmati rice. It should be made sure that this is an active body that identifies issues at different stages and among different individuals of value chain, and has the power to resolve them. The body should also act as an outlet for public-private dialogue, where public sector can cater to the concerns and queries of rice sector.
AGRICULTURE SECTOR OPPORTUNITIES IN CPEC’S CONTEXT 39
Consortium for Development Policy Research / International Growth Center
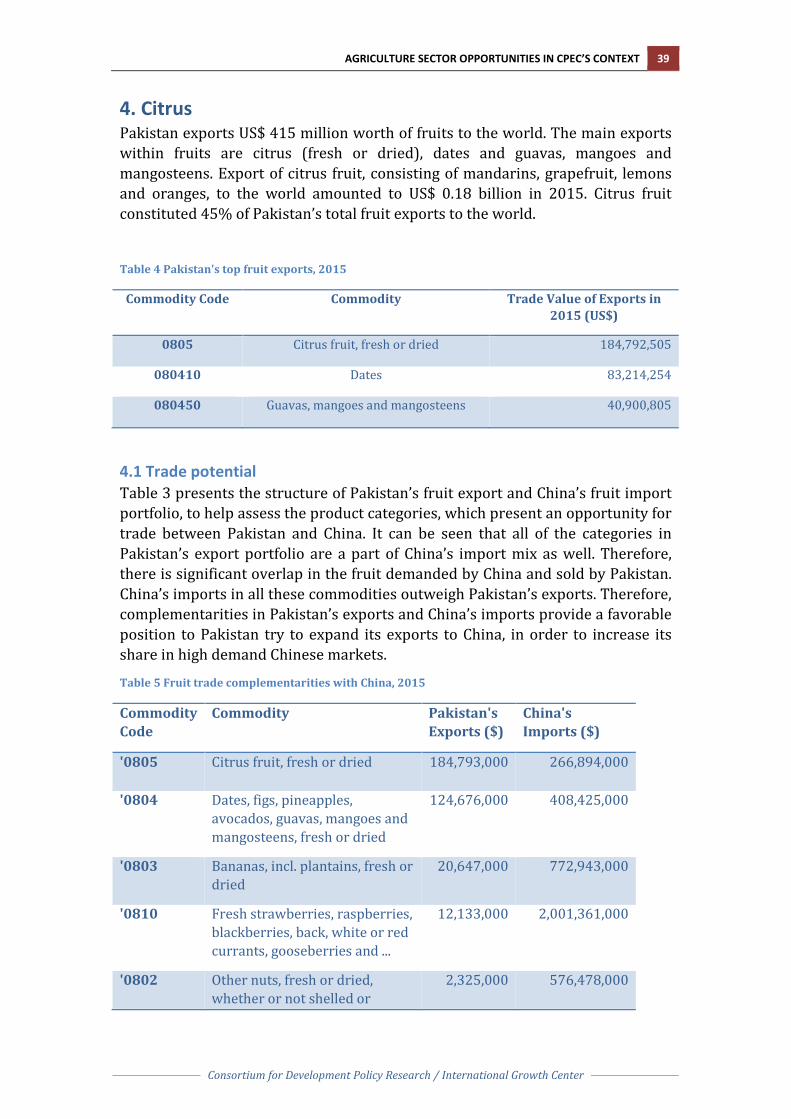
4. Citrus Pakistan exports US$ 415 million worth of fruits to the world. The main exports within fruits are citrus (fresh or dried), dates and guavas, mangoes and mangosteens. Export of citrus fruit, consisting of mandarins, grapefruit, lemons and oranges, to the world amounted to US$ 0.18 billion in 2015. Citrus fruit constituted 45% of Pakistan’s total fruit exports to the world.
Table 4 Pakistan's top fruit exports, 2015
Commodity Code Commodity Trade Value of Exports in 2015 (US$)
0805 Citrus fruit, fresh or dried 184,792,505
080410 Dates 83,214,254
080450 Guavas, mangoes and mangosteens 40,900,805
4.1 Trade potential Table 3 presents the structure of Pakistan’s fruit export and China’s fruit import portfolio, to help assess the product categories, which present an opportunity for trade between Pakistan and China. It can be seen that all of the categories in Pakistan’s export portfolio are a part of China’s import mix as well. Therefore, there is significant overlap in the fruit demanded by China and sold by Pakistan. China’s imports in all these commodities outweigh Pakistan’s exports. Therefore, complementarities in Pakistan’s exports and China’s imports provide a favorable position to Pakistan try to expand its exports to China, in order to increase its share in high demand Chinese markets.
Table 5 Fruit trade complementarities with China, 2015
Commodity Code
Commodity Pakistan's Exports ($)
China's Imports ($)
'0805 Citrus fruit, fresh or dried 184,793,000 266,894,000
'0804 Dates, figs, pineapples, avocados, guavas, mangoes and mangosteens, fresh or dried
124,676,000 408,425,000
'0803 Bananas, incl. plantains, fresh or dried
20,647,000 772,943,000
'0810 Fresh strawberries, raspberries, blackberries, back, white or red currants, gooseberries and ...
12,133,000 2,001,361,000
'0802 Other nuts, fresh or dried, whether or not shelled or
2,325,000 576,478,000
40 AGRICULTURE SECTOR OPPORTUNITIES IN CPEC’S CONTEXT
Consortium for Development Policy Research / International Growth Center
peeled (excluding coconuts, Brazil nuts ...
'0806 Grapes, fresh or dried 822,000 637,007,000
'0809 Apricots, cherries, peaches incl. nectarines, plums and sloes, fresh
314,000 777,189,000
'0801 Coconuts, Brazil nuts and cashew nuts, fresh or dried, whether or not shelled or peeled
205,000 180,709,000
'0808 Apples, pears and quinces, fresh 163,000 576,478,000
Source: UN Comtrade
For this report, citrus is chosen for its special relevance to Punjab.
Pakistan’s citrus (HS 0805) exports to the world have increased progressively over the years from 2003 to 2015. Pakistan’s exported citrus worth US$ 23 million in 2003, which increased to $185 million in 2015. The exports of citrus to the world have grown at an average annual rate of 5% in the years 2012 to 2016. Exports to China have been fluctuating over this time period, with no exports in most of the years, with an exception of 2006, 2008, 2011-12 and 2015. The highest exports were recorded in 2012, in which US$ 120,000 worth of citrus was exported to China. Exports have to China have taken place in 2015, after a gap of 2 years, which are $12,200 in trade value. Pakistan’s citrus exports to China have fallen at a rate of 13% from 2012 to 2016.
Figure 17 Pakistan's citrus exports, 2003-2015
Pakistan’s top 10 export partners for citrus in 2015 are shown below. Pakistan’s export markets for citrus are well diversified. Afghanistan is the most salient
0
50
100
150
200
250
2003 2004 2005 2006 2007 2008 2009 2010 2011 2012 2013 2014 2015
Pakistan's exports to the world (million US$)
Pakistan's exports to China (US$ thosands)

AGRICULTURE SECTOR OPPORTUNITIES IN CPEC’S CONTEXT 41
Consortium for Development Policy Research / International Growth Center
export destination, importing US$ 73 million worth of citrus which constitutes 40% of total Pakistan’s citrus exports. The second largest export market is Russian Federation, accounting for 30% of Pakistan’s exports, followed by UAE with a share of 11% in citrus exports. As it can be seen, China is not one of the export markets for Pakistan’s citrus. Pakistan exports a nominal 0.01% of citrus to China, with a value of US$ 12,202.
Figure 18 Pakistan's top export partners for citrus, 2015
Source: UN Comtrade 2017
China’s top import partners, on the other hand, are South Africa, Australia and USA. China’s total citrus imports were worth $267 million in 2015. Imports from South Africa were worth US$ 0.11 billion, with a share of 40% in China’s citrus imports. The second highest importer for citrus in China was Australia, accounting for 21% of Chinese imports. Pakistan is not one of the top import partners for citrus in 2015, despite the geographical proximity.
Figure 19 China's import partners for citrus, 2015
Source: UN Comtrade
- 10 20 30 40 50 60 70 80
Valu
e (U
S$ m
illio
n)
-
20
40
60
80
100
120
Valu
e (U
S$ m
illio
ns)

42 AGRICULTURE SECTOR OPPORTUNITIES IN CPEC’S CONTEXT
Consortium for Development Policy Research / International Growth Center
The table below shows Pakistan’s citrus exports to the world in 2015. Pakistan’s exports within citrus are concentrated in kinnow, which forms 92% of citrus exports to the world. This is followed by other citrus varieties, such as tangerines, clementines, wilkings, etc with a share of 7%. Other citrus hybrids and oranges form a small share of Pakistan’s citrus exports.
Table 6: Pakistan's citrus exports to the world in 2015
Product code Product description Pakistan's exports to world in 2015 (US$)
Percentage of total HS0805 exports (PK to World)
08052010 Kinnow, fresh 170,644,000 92.34
08059000 Other citrus fruits fresh/dried. 12,861,000 6.96
08052090 Other similar citrus hybrids 1,076,000 0.58
08051000 Citrus fruit, fresh or dried: Oranges
212,000 0.11
Source: ITC trade maps
To compare Pakistan’s exports with China’s imports, the table below shows the citrus varieties being imported by China in HS0805 code. It can be seen that the highest percentage of imports accrues to oranges and grapefruits, 61.9% and 13.7% respectively, followed by lemons with 13% and mandarins with 11% of the total import share. Kinnow only forms 0.41% of total Chinese imports, with trade value amounting to $1,105,000.
Table 7 China's imports of HS0805 in 2015
Product code Product description China's imports from World in 2015 (US$)
Percentage of China’s imports from the world in HS0805 category
08051000 Oranges, fresh or dried 165,309,000 61.94 08054000 Grapefruit, including pomelos, fresh or dried 36,667,000 13.74 08055000 Lemons and limes, fresh or dried 33,995,000 12.74
08052090 Mandarins, clementines, wilkings& similar hybrids, fresh or dried, nes
29,648,000 11.11
08052010 Kinnow, fresh or dried 1,105,000 0.41 08052020 Latifolia citrus, fresh or dried 163,000 0.06 08059000 Citrus fruit, fresh or dried, nes 7,000 0.00
Source: ITC trade maps
As evident, there is a discrepancy in the citrus varieties exported by Pakistan and those imported by China. Moreover, kinnow, which is the common product in both, constitutes only a small part of China’s total kinnow imports. Despite these problems, there is an opportunity for Pakistan in terms of targeting the entire share of China’s kinnow imports and for marketing the Pakistani kinnow to expand Chinese demand. Given the preferential treatment in terms of tariff waiver, Pakistan should make efforts to increase its share of kinnow exports to China, which at the time make up only 1% of total China’s kinnow imports.
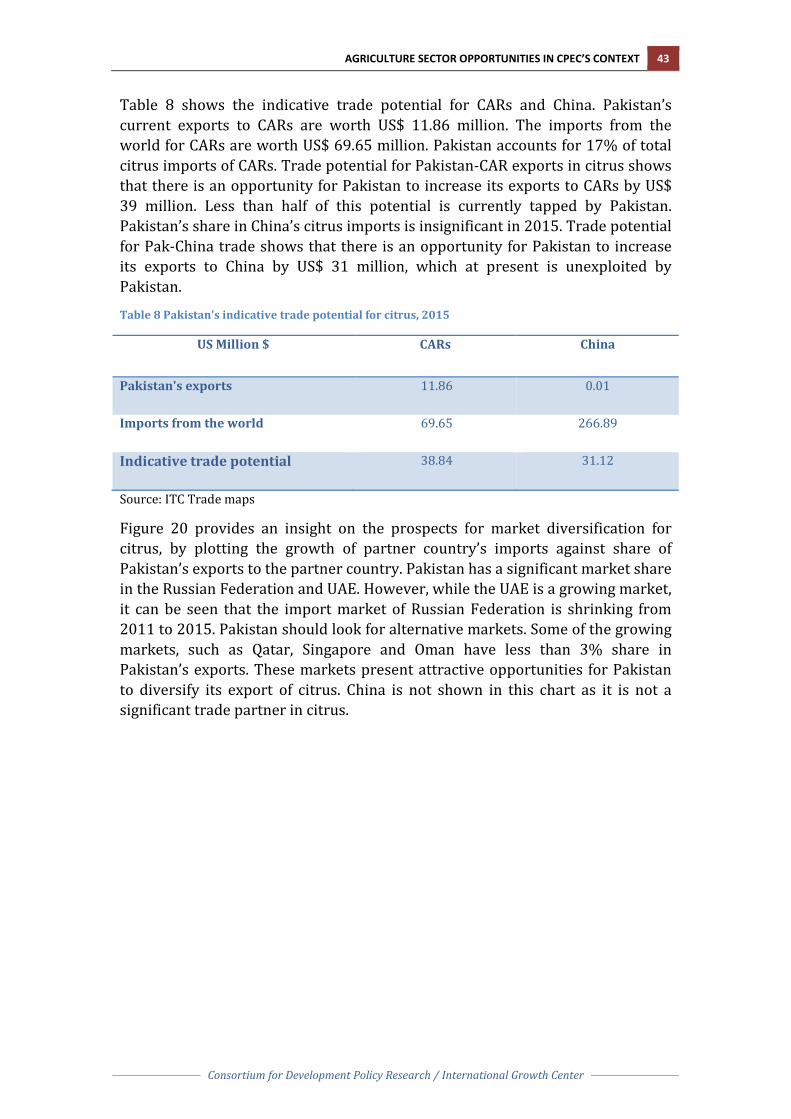
AGRICULTURE SECTOR OPPORTUNITIES IN CPEC’S CONTEXT 43
Consortium for Development Policy Research / International Growth Center
Table 8 shows the indicative trade potential for CARs and China. Pakistan’s current exports to CARs are worth US$ 11.86 million. The imports from the world for CARs are worth US$ 69.65 million. Pakistan accounts for 17% of total citrus imports of CARs. Trade potential for Pakistan-CAR exports in citrus shows that there is an opportunity for Pakistan to increase its exports to CARs by US$ 39 million. Less than half of this potential is currently tapped by Pakistan. Pakistan’s share in China’s citrus imports is insignificant in 2015. Trade potential for Pak-China trade shows that there is an opportunity for Pakistan to increase its exports to China by US$ 31 million, which at present is unexploited by Pakistan.
Table 8 Pakistan's indicative trade potential for citrus, 2015
US Million $ CARs China
Pakistan's exports 11.86 0.01
Imports from the world 69.65 266.89
Indicative trade potential 38.84 31.12
Source: ITC Trade maps
Figure 20 provides an insight on the prospects for market diversification for citrus, by plotting the growth of partner country’s imports against share of Pakistan’s exports to the partner country. Pakistan has a significant market share in the Russian Federation and UAE. However, while the UAE is a growing market, it can be seen that the import market of Russian Federation is shrinking from 2011 to 2015. Pakistan should look for alternative markets. Some of the growing markets, such as Qatar, Singapore and Oman have less than 3% share in Pakistan’s exports. These markets present attractive opportunities for Pakistan to diversify its export of citrus. China is not shown in this chart as it is not a significant trade partner in citrus.

44 AGRICULTURE SECTOR OPPORTUNITIES IN CPEC’S CONTEXT
Consortium for Development Policy Research / International Growth Center
Figure 20 Prospects for market diversification for Pakistan, HS0805 Citrus, fresh or dried
Source: ITC Trade maps
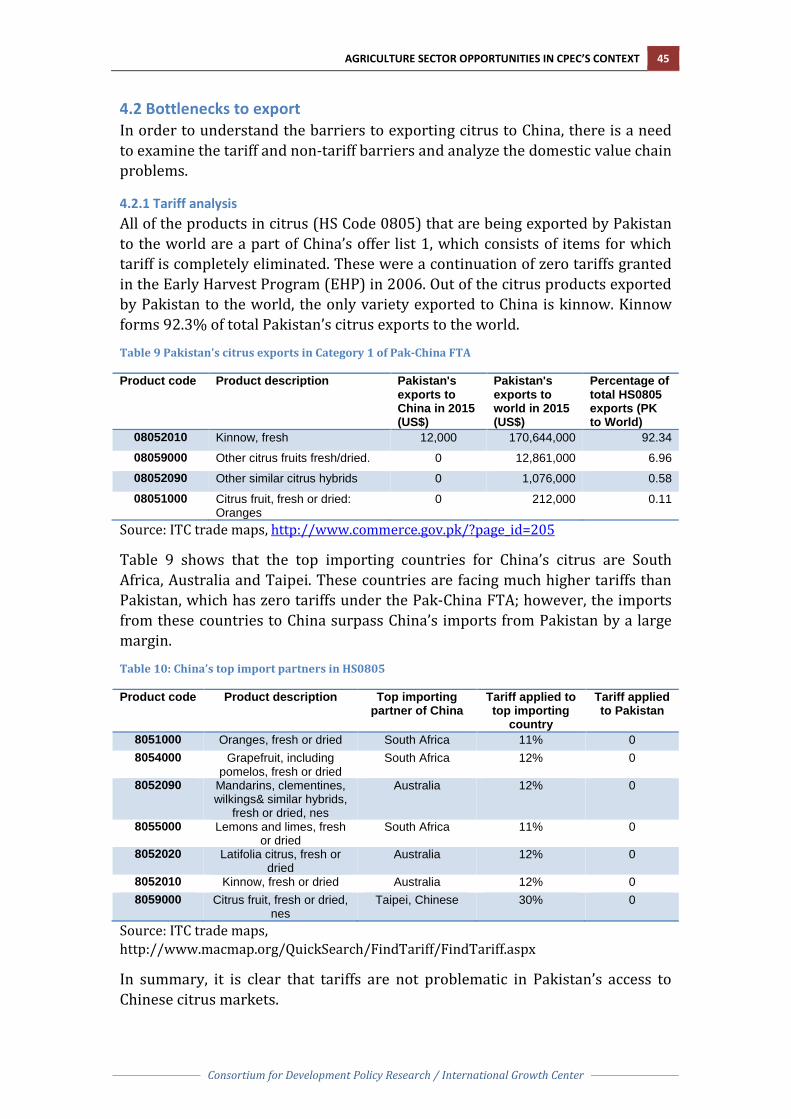
AGRICULTURE SECTOR OPPORTUNITIES IN CPEC’S CONTEXT 45
Consortium for Development Policy Research / International Growth Center
4.2 Bottlenecks to export In order to understand the barriers to exporting citrus to China, there is a need to examine the tariff and non-tariff barriers and analyze the domestic value chain problems.
4.2.1 Tariff analysis All of the products in citrus (HS Code 0805) that are being exported by Pakistan to the world are a part of China’s offer list 1, which consists of items for which tariff is completely eliminated. These were a continuation of zero tariffs granted in the Early Harvest Program (EHP) in 2006. Out of the citrus products exported by Pakistan to the world, the only variety exported to China is kinnow. Kinnow forms 92.3% of total Pakistan’s citrus exports to the world.
Table 9 Pakistan's citrus exports in Category 1 of Pak-China FTA
Product code Product description Pakistan's exports to China in 2015 (US$)
Pakistan's exports to world in 2015 (US$)
Percentage of total HS0805 exports (PK to World)
08052010 Kinnow, fresh 12,000 170,644,000 92.34
08059000 Other citrus fruits fresh/dried. 0 12,861,000 6.96
08052090 Other similar citrus hybrids 0 1,076,000 0.58
08051000 Citrus fruit, fresh or dried: Oranges
0 212,000 0.11
Source: ITC trade maps, http://www.commerce.gov.pk/?page_id=205
Table 9 shows that the top importing countries for China’s citrus are South Africa, Australia and Taipei. These countries are facing much higher tariffs than Pakistan, which has zero tariffs under the Pak-China FTA; however, the imports from these countries to China surpass China’s imports from Pakistan by a large margin.
Table 10: China’s top import partners in HS0805
Product code Product description Top importing partner of China
Tariff applied to top importing
country
Tariff applied to Pakistan
8051000 Oranges, fresh or dried South Africa 11% 0 8054000 Grapefruit, including
pomelos, fresh or dried South Africa 12% 0
8052090 Mandarins, clementines, wilkings& similar hybrids,
fresh or dried, nes
Australia 12% 0
8055000 Lemons and limes, fresh or dried
South Africa 11% 0
8052020 Latifolia citrus, fresh or dried
Australia 12% 0
8052010 Kinnow, fresh or dried Australia 12% 0 8059000 Citrus fruit, fresh or dried,
nes Taipei, Chinese 30% 0
Source: ITC trade maps, http://www.macmap.org/QuickSearch/FindTariff/FindTariff.aspx
In summary, it is clear that tariffs are not problematic in Pakistan’s access to Chinese citrus markets.
46 AGRICULTURE SECTOR OPPORTUNITIES IN CPEC’S CONTEXT
Consortium for Development Policy Research / International Growth Center
4.2.2 Non-tariff barriers and competitiveness In order to investigate non-tariff barriers and other issues relating to citrus market access in China, a focus group session was conducted with representatives of the citrus value chain in Pakistan. The focus group was attended by four exporters of citrus from Sargodha, three citrus processors, Director of Citrus Research Institute Sargodha, three citrus growers and director of Kinnow Growers Association.
Access to China is one of the major problems facing the export of kinnow from Pakistan, according to the stakeholders. Although Pakistan is adjoining China, stakeholders maintain that citrus trade is not permitted via land route. The allowed ports of entry for import of citrus by China are Dalian, Tianjin, Beijing, Shanghai, Qingdao and Nanjing, which have to be accessed by sea.12 These are located on the eastern border of China, whereas Pakistan shares China’s western border. Export to areas such as Kashgar, which are closer to Pakistan, is not possible as air transport is not allowed. This restricts Pakistan’s access to China, precluding capitalization of the geographical advantage afforded to Pakistan. Shipping to the eastern ports also increases the transport time and cost significantly and necessitates adoption of additional measures to prevent fruit from perishing in the journey. This adversely affects the competitiveness of Pakistani citrus in Chinese markets, especially in eastern cities, such as Beijing, where competition from domestic and other international markets is high.
Quarantine requirements also pose a challenge in export of citrus to China. One of the requirements in the protocol states that the shipping containers have to undergo a cold treatment in transit, for which temperatures have to be maintained and logged throughout the journey. Moreover, the cold treatment has to be provided to citrus for a specific number of days, which if not completed during the transport, have to be met at the port where the shipment is left to wait for the required number of days. If the temperature drops even briefly, the cold treatment starts again from scratch. This cold storage process cannot be initiated at Pakistan’s ports because the relevant authorities have not granted permission. This arrangement at Pakistan’s ports can make the process smoother and easier for the exporters.
Sanitary and Phytosanitary requirements also vary for different countries. There is a general protocol, which includes plant protection certification, which is a pre-requisite for export to any country. Other than this, there are country specific protocols, which need to be followed. Exporters find that information on these protocols is difficult to obtain, due to which they are unable to follow the required export standards. Exporting citrus which is not fulfilling the required standard brings the country a bad name and can result in imposition of ban by the importing country on importing citrus from Pakistan.
Stakeholders also report difficulties in transit trade. In current export to Russia, exports transit through Afghanistan and Central Asian Republics (CARs). The 12http://www.phdec.org.pk/download/china/PhytosanitaryReqofCitrus.pdf
AGRICULTURE SECTOR OPPORTUNITIES IN CPEC’S CONTEXT 47
Consortium for Development Policy Research / International Growth Center
duties levied on citrus by these countries are very high and subject to frequent variation. These duties are levied according to the market value of the citrus set by the importing country and are not mindful of discrepancies between the fixed and actual selling price. Our export variety, kinnow, sells at a lower price than the rest of citrus varieties; therefore these duties form a disproportionately high percentage of total prices for Pakistani exporters as the duties are based on the higher average price of citrus. High duties lead to a decline in competitiveness of Pakistani citrus in the international market. Moreover, volatility in duties makes it difficult for exporters to track and forecast their revenues and plan exports.
There is also a discrepancy between the variety of citrus demanded by the international market and that grown in Pakistan. Majority of citrus grown in Pakistan is seeded kinnow, which forms 92% of our citrus exports. However, in the international market, there is a higher demand for seedless citrus varieties. Many competing countries, including Spain, Morocco, Turkey and other Mediterranean countries have shifted to producing seedless citrus varieties. Average number of seeds in a kinnow fruit was reported to be 12.2 where as Pakistani kinnow contains up to 54 seeds (Agribusiness project-USAID). Moreover, kinnow blemishes and size are also one of the main impediments in kinnow export. These blemishes and small size of kinnows are a result of conventional farming practices, especially at the stage of picking of fruit. Since most of Pakistan’s kinnows have greater than 5% blemishes, it is considered to be of grade B quality, at best. Pakistani kinnow fruit is, therefore, not only unable to reach the high end citrus market but only fetches a much lower price than other citrus products in the market in the countries that it is exported to.
Conventional farming practices being followed result not just in blemishes, but are also reducing productivity. Farmers do not have information regarding the timing and quantity of fertilizer application to their fruit. Crop rotation is not being practiced, which has reduced the fertility of land over the years. The shelf-life of fruit has declined over the years and its taste and size has also been compromised. There is a need to improve pre-harvesting farming practices in order to make sure that exportable surplus of kinnows is produced and the quality requirements needed for export can be met.
In Pakistan, the shipping lines currently being used for export of citrus are foreign as there are no containerized domestic shipping lines. This increases the freight charges, which compromise the competitiveness of Pakistani fruit. Moreover, duties charged on Pakistani port, such as fuel adjustment charges have not been updated according to the current fuel prices but are the same as that applied several years ago.
4.3 Recommendations The fundamental problem for citrus exports to China at the moment is limited demand for seeded kinnow, which is Pakistan’s primary citrus export. This requires marketing the current product in the short term, and developing varieties with fewer seeds to cater to Chinese and international markets in the
48 AGRICULTURE SECTOR OPPORTUNITIES IN CPEC’S CONTEXT
Consortium for Development Policy Research / International Growth Center
longer term. On both fronts, Pakistan will need substantial investments in R&D and marketing.
In addition, non-tariff barriers constitute an important impediment to exports. Pakistan’s location advantage is crucial for this perishable and transit sensitive product. However, this advantage is entirely eroded by the requirement that citrus be transported by sea and enter through border ports that are furthest away from Pakistan. Effective negotiation would allow Pakistan to tap into new markets within China and export to areas closer to Pakistan, exploiting its geographical advantage due to proximity. Areas in the north-east of Pakistan, such as Potohar region, have access to China by road. If granted permission, trade via these routes will result in lower transportation cost and time, saving the need for cold treatment as well.
To facilitate exporters, a portal should be developed that consolidates and periodically updates the SPS and other import requirements for different countries that citrus can be exported to. This will ensure that the exporters have access to this information and are able to properly follow the guidelines. The portal should also indicate which departments should be contacted in order to obtain the required certifications.
In order to shift towards higher paying and seedless varieties of citrus, there is a need to encourage research and development in citrus so these varieties can be developed. Citrus Research Institute in Sargodha and Nuclear Institute for Agriculture and Biology (NIAB) have been working towards development of seedless varieties, however, they have not been very successful. Previously, the variety developed and sold as seedless was not properly tested and started producing seeded fruit after a few cycles of production. Therefore, there is a need to strengthen research in the area. To this end, government should collaborate with international research agencies, such as Citrus Research Centre in California and research centers in Italy, which have developed seedless varieties of kinnow. These can then be modified to suit the climate and soil conditions of Pakistan.
This research should go hand in hand with strengthening of extension services, which disseminate information to the farmers regarding new seed varieties, and techniques that enhance productivity, reduce wastage and help meet the cosmetic requirements for export of citrus. Field assistants should be educated and trained in citrus growing and should go door to door to facilitate farmers. They should impart information regarding the application and timings of fertilizer, irrigation and make it easier for farmers to adopt modern farming practices.
There is a need to encourage regional trade. Previously, a significant amount of trade was conducted with Iran and Afghanistan. However, due to political tensions between Afghanistan and Pakistan, trade remains unreliable. Recently, due to closure of border, many trucks of citrus could not reach Afghanistan and Central Asian states. Due to this, kinnow exporters had to incur significant losses.

AGRICULTURE SECTOR OPPORTUNITIES IN CPEC’S CONTEXT 49
Consortium for Development Policy Research / International Growth Center
These markets have a high demand for the type of kinnow produced in Pakistan. There is a need to find alternative markets so Pakistani kinnow exports can be expanded.
In order to move towards domestic shipping lines, there is an opportunity for joint ventures with China. This will reduce freight charges and transit time for the export of kinnow.

50 AGRICULTURE SECTOR OPPORTUNITIES IN CPEC’S CONTEXT
Consortium for Development Policy Research / International Growth Center
5. Citrus and Mango preparations Exporting fruit in processed form offers several advantages over exporting fresh fruit. Firstly, it is a growing market globally as shown in Figure 21. Secondly, it reduces wastage as product utilization and shelf life increases substantially. Thirdly, it is easier to meet the SPS requirements of processed food relative to fresh fruit. Finally, it generates greater revenue as it is a value-added product. This is particularly important for B grade fruit, which might not meet the appearance and size requirements to fetch high prices when sold as fresh fruit.
In this section, we focus on mango pulp and fruit juices and concentrates.
Figure 21 World exports of fruit juice (HS2009), 2001-2016
Source: ITC Trade maps
5.1 Trade potential
5.1.1 Mango pulp Pakistan has recently started exporting mango pulp (HS 08045050), and does not export a consistent quantity of mango pulp annually (Figure 22). Pakistan has not exported mango pulp to China, and in fact China does not import mango pulp from any country.
0
2
4
6
8
10
12
14
16
18
2001 2002 2003 2004 2005 2006 2007 2008 2009 2010 2011 2012 2013 2014 2015 2016
Wor
ld e
xpor
ts o
f fru
it ju
ice
(US$
bi
llion
s)

AGRICULTURE SECTOR OPPORTUNITIES IN CPEC’S CONTEXT 51
Consortium for Development Policy Research / International Growth Center
Figure 22: Pakistan's mango pulp (HS 08045050) exports to the world, 2005-2015
Source: ITC trade map
Pakistan’s current export partners of mango pulp are shown in the bar graph below. Pakistan’s exports of mango pulp are not very diversified. Libya, Turkey, UK and Saudi Arabia are the top importing countries for Pakistan’s mango pulp. Libya is the top export partner of Pakistan, importing 51% of Pakistan’s mango pulp exports. Mango pulp exported to Turkey accounts for 23% of total Pakistan’s mango pulp exports, followed by UK and Saudi Arabia with a share of 11% and 10% respectively.
Figure 23: Pakistan's top exporting partners for mango pulp in 2015
Source: ITC trade maps
0
0.2
0.4
0.6
0.8
1
1.2
1.4
2005 2006 2007 2008 2009 2010 2011 2012 2013 2014 2015
Valu
e (U
S$ m
illio
n)
Mango pulp (Exports to the world)
0
50
100
150
200
250
300
350
Libya, State of Turkey UnitedKingdom
Saudi Arabia United ArabEmirates
United Statesof America
Philippines
Valu
e (U
S$ th
ousa
nds)

52 AGRICULTURE SECTOR OPPORTUNITIES IN CPEC’S CONTEXT
Consortium for Development Policy Research / International Growth Center
5.1.2 Fruit juices Figure 24 shows Pakistan’s exports of fruit juices in HS2009 to China and to the world from 2003 to 2015. From the chart it is evident that while Pakistan’s exports of fruit juice to the world have been increasing overall, exports to China are consistently low. Pak-China FTA came into effect in 2007, however according to the graph below a significant impact of the FTA cannot be seen.
Figure 24 Pakistan's fruit juice exports in HS2009, 2003-2015
Source: UN Comtrade
Pakistan is well diversified in its exports of fruit juices to the world. Top export partners in fruit juices are Angola, Netherlands, Afghanistan and Iran. Exports to Angola, which is the top export partner, account for 24% of Pakistan’s total fruit juice exports. Exports to Netherlands constitute 16% of fruit juice exports, followed by Afghanistan, which has a share of 9% in over-all fruit juice exports. China is not one of the main export partners for Pakistan’s fruit juice as only 0.18% of Pakistan’s fruit juice exports are sent to China.
051015202530354045
0
200
400
600
800
1000
1200
Paki
stan
's e
xpor
ts to
the
wor
ld in
m
illio
n US
$
Paki
stan
's e
xpor
ts to
Chi
na in
th
ousa
nds U
S$
Pakistan's exports to the China Pakistan's exports to the world
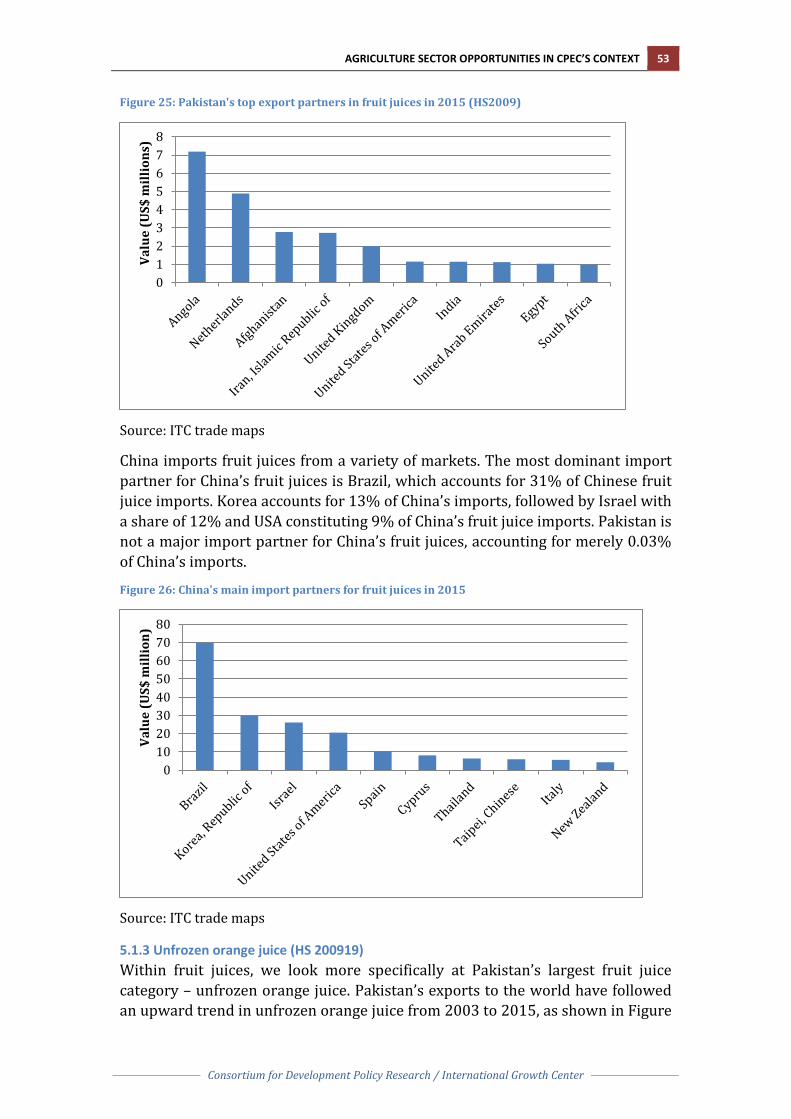
AGRICULTURE SECTOR OPPORTUNITIES IN CPEC’S CONTEXT 53
Consortium for Development Policy Research / International Growth Center
Figure 25: Pakistan's top export partners in fruit juices in 2015 (HS2009)
Source: ITC trade maps
China imports fruit juices from a variety of markets. The most dominant import partner for China’s fruit juices is Brazil, which accounts for 31% of Chinese fruit juice imports. Korea accounts for 13% of China’s imports, followed by Israel with a share of 12% and USA constituting 9% of China’s fruit juice imports. Pakistan is not a major import partner for China’s fruit juices, accounting for merely 0.03% of China’s imports.
Figure 26: China's main import partners for fruit juices in 2015
Source: ITC trade maps
5.1.3 Unfrozen orange juice (HS 200919) Within fruit juices, we look more specifically at Pakistan’s largest fruit juice category – unfrozen orange juice. Pakistan’s exports to the world have followed an upward trend in unfrozen orange juice from 2003 to 2015, as shown in Figure
012345678
Valu
e (U
S$ m
illio
ns)
01020304050607080
Valu
e (U
S$ m
illio
n)
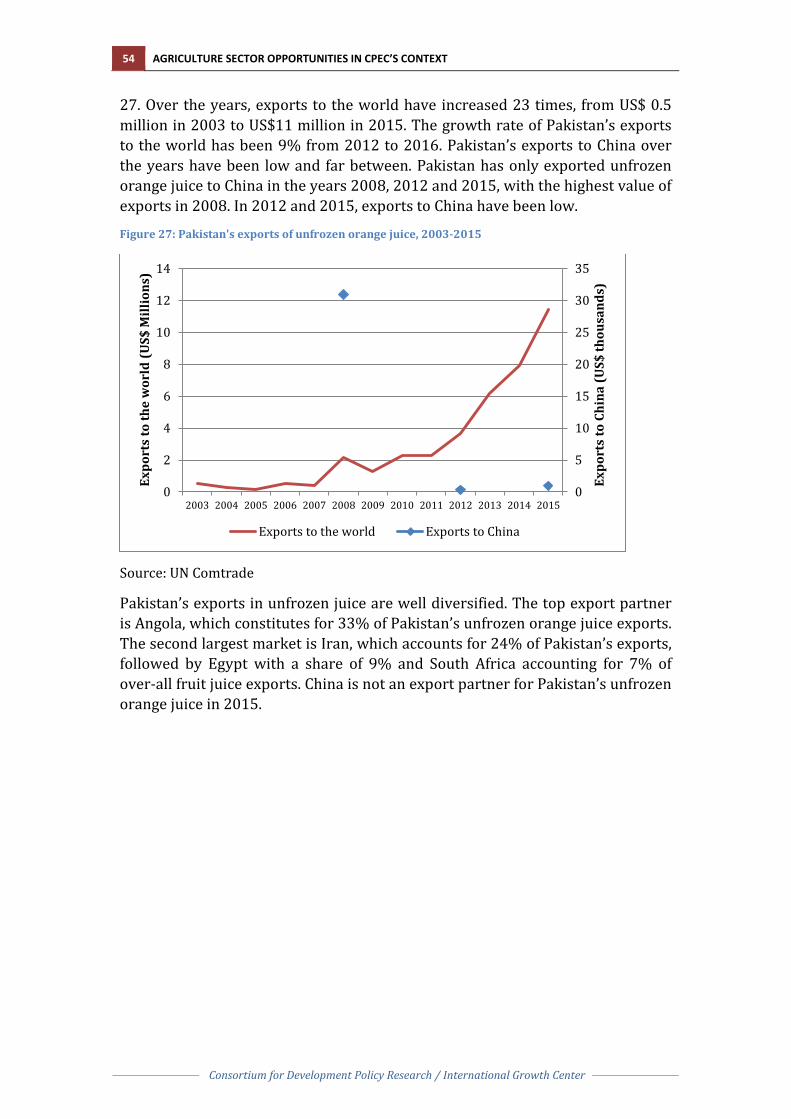
54 AGRICULTURE SECTOR OPPORTUNITIES IN CPEC’S CONTEXT
Consortium for Development Policy Research / International Growth Center
27. Over the years, exports to the world have increased 23 times, from US$ 0.5 million in 2003 to US$11 million in 2015. The growth rate of Pakistan’s exports to the world has been 9% from 2012 to 2016. Pakistan’s exports to China over the years have been low and far between. Pakistan has only exported unfrozen orange juice to China in the years 2008, 2012 and 2015, with the highest value of exports in 2008. In 2012 and 2015, exports to China have been low.
Figure 27: Pakistan's exports of unfrozen orange juice, 2003-2015
Source: UN Comtrade
Pakistan’s exports in unfrozen juice are well diversified. The top export partner is Angola, which constitutes for 33% of Pakistan’s unfrozen orange juice exports. The second largest market is Iran, which accounts for 24% of Pakistan’s exports, followed by Egypt with a share of 9% and South Africa accounting for 7% of over-all fruit juice exports. China is not an export partner for Pakistan’s unfrozen orange juice in 2015.
0
5
10
15
20
25
30
35
0
2
4
6
8
10
12
14
2003 2004 2005 2006 2007 2008 2009 2010 2011 2012 2013 2014 2015
Expo
rts
to C
hina
(US$
thou
sand
s)
Expo
rts
to th
e w
orld
(US$
Mill
ions
)
Exports to the world Exports to China
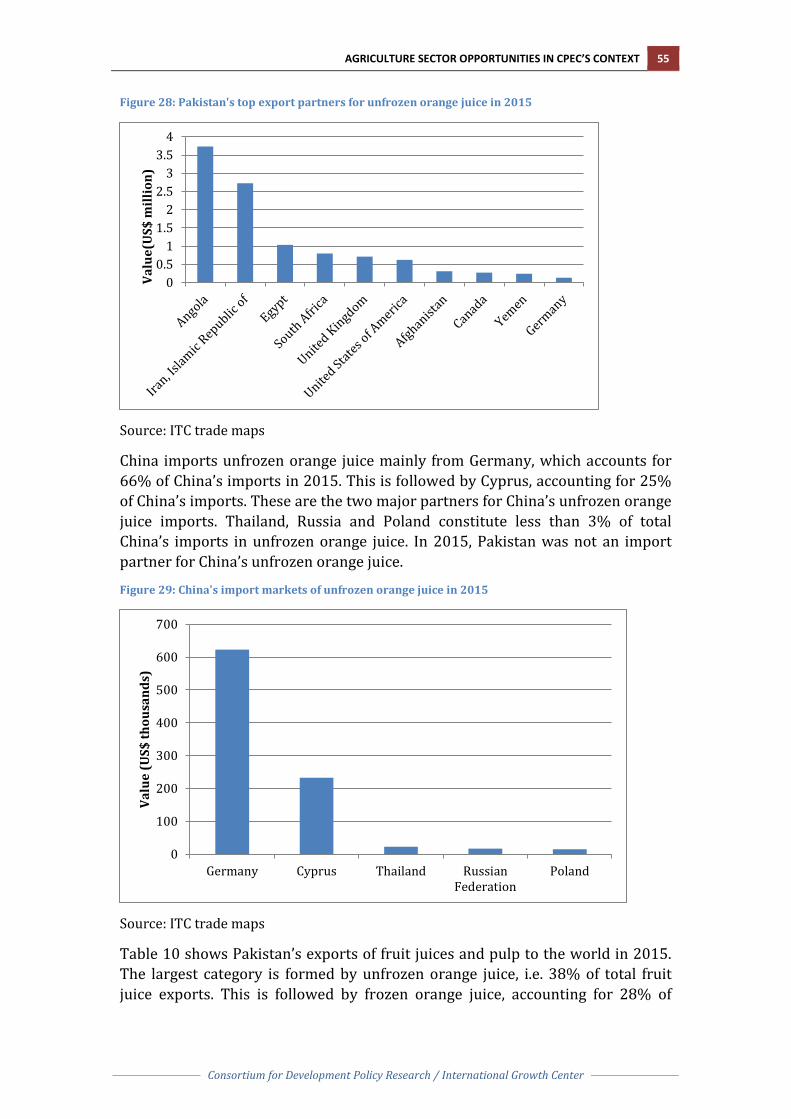
AGRICULTURE SECTOR OPPORTUNITIES IN CPEC’S CONTEXT 55
Consortium for Development Policy Research / International Growth Center
Figure 28: Pakistan's top export partners for unfrozen orange juice in 2015
Source: ITC trade maps
China imports unfrozen orange juice mainly from Germany, which accounts for 66% of China’s imports in 2015. This is followed by Cyprus, accounting for 25% of China’s imports. These are the two major partners for China’s unfrozen orange juice imports. Thailand, Russia and Poland constitute less than 3% of total China’s imports in unfrozen orange juice. In 2015, Pakistan was not an import partner for China’s unfrozen orange juice.
Figure 29: China's import markets of unfrozen orange juice in 2015
Source: ITC trade maps
Table 10 shows Pakistan’s exports of fruit juices and pulp to the world in 2015. The largest category is formed by unfrozen orange juice, i.e. 38% of total fruit juice exports. This is followed by frozen orange juice, accounting for 28% of
00.5
11.5
22.5
33.5
4Va
lue(
US$
mill
ion)
0
100
200
300
400
500
600
700
Germany Cyprus Thailand RussianFederation
Poland
Valu
e (U
S$ th
ousa
nds)
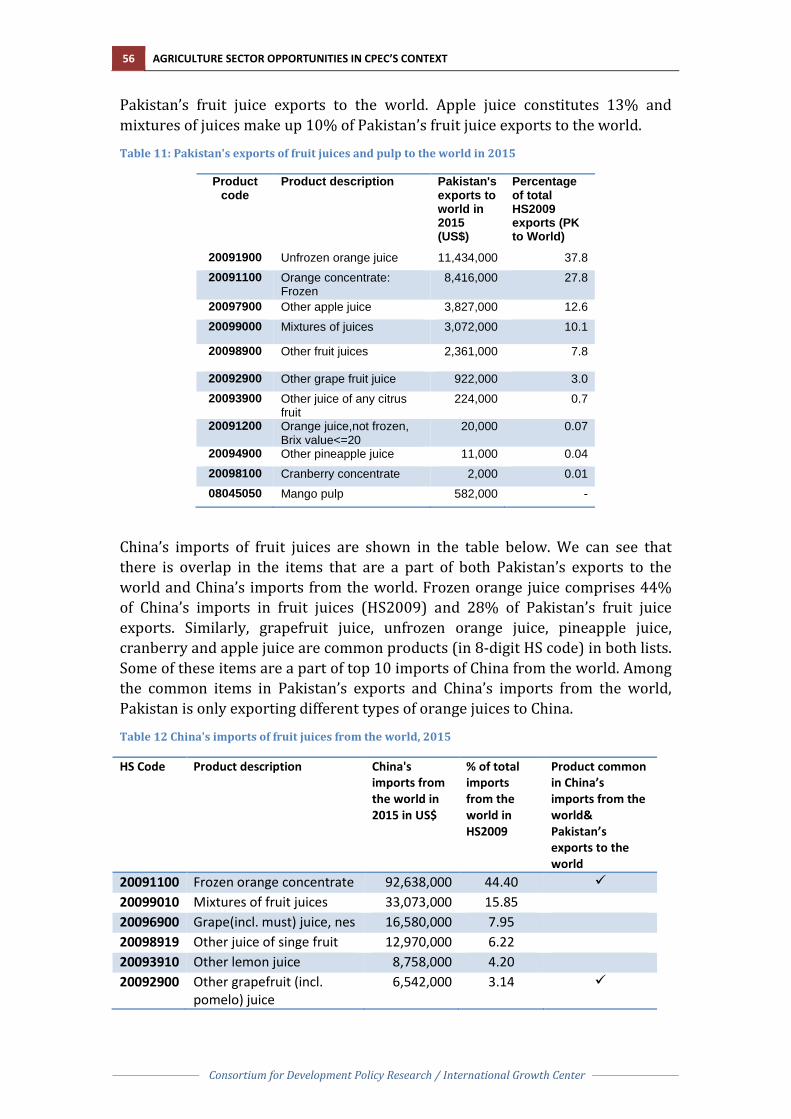
56 AGRICULTURE SECTOR OPPORTUNITIES IN CPEC’S CONTEXT
Consortium for Development Policy Research / International Growth Center
Pakistan’s fruit juice exports to the world. Apple juice constitutes 13% and mixtures of juices make up 10% of Pakistan’s fruit juice exports to the world.
Table 11: Pakistan's exports of fruit juices and pulp to the world in 2015
Product code
Product description Pakistan's exports to world in 2015 (US$)
Percentage of total HS2009 exports (PK to World)
20091900 Unfrozen orange juice 11,434,000 37.8 20091100 Orange concentrate:
Frozen 8,416,000 27.8
20097900 Other apple juice 3,827,000 12.6 20099000 Mixtures of juices 3,072,000 10.1
20098900 Other fruit juices 2,361,000 7.8
20092900 Other grape fruit juice 922,000 3.0 20093900 Other juice of any citrus
fruit 224,000 0.7
20091200 Orange juice,not frozen, Brix value<=20
20,000 0.07
20094900 Other pineapple juice 11,000 0.04 20098100 Cranberry concentrate 2,000 0.01 08045050 Mango pulp 582,000 -
China’s imports of fruit juices are shown in the table below. We can see that there is overlap in the items that are a part of both Pakistan’s exports to the world and China’s imports from the world. Frozen orange juice comprises 44% of China’s imports in fruit juices (HS2009) and 28% of Pakistan’s fruit juice exports. Similarly, grapefruit juice, unfrozen orange juice, pineapple juice, cranberry and apple juice are common products (in 8-digit HS code) in both lists. Some of these items are a part of top 10 imports of China from the world. Among the common items in Pakistan’s exports and China’s imports from the world, Pakistan is only exporting different types of orange juices to China.
Table 12 China's imports of fruit juices from the world, 2015
HS Code Product description China's imports from the world in 2015 in US$
% of total imports from the world in HS2009
Product common in China’s imports from the world& Pakistan’s exports to the world
20091100 Frozen orange concentrate 92,638,000 44.40 20099010 Mixtures of fruit juices 33,073,000 15.85 20096900 Grape(incl. must) juice, nes 16,580,000 7.95 20098919 Other juice of singe fruit 12,970,000 6.22 20093910 Other lemon juice 8,758,000 4.20 20092900 Other grapefruit (incl.
pomelo) juice 6,542,000 3.14

AGRICULTURE SECTOR OPPORTUNITIES IN CPEC’S CONTEXT 57
Consortium for Development Policy Research / International Growth Center
20091200 Unfrozen orange juice, Brix value<=20
6,226,000 2.98
20097100 Apple juice, Bris value<=20 4,183,000 2.00 20093110 Lemon juice, Brix
value<=20 4,119,000 1.97
20096100 Grape(incl. must) juice 3,399,000 1.63 20093190 Juice of any single citrus
fruit 2,982,000 1.43
20098912 Mango juice 2,964,000 1.42 20098913 Passion-fruit juice 2,152,000 1.03 20094100 Pineapple juice, Bris
value<=20 1,957,000 0.94
20099090 Mixtures of vegetable/fruit & vegetable juices
1,956,000 0.94
20092100 Grapefruit (incl. pomelo) juice,
1,557,000 0.75
20094900 Pineapple juice, nes 1,333,000 0.64 20098920 Juice of singe vegetable 1,163,000 0.56 20091900 Unfrozen orange juice, nes 941,000 0.45 20098914 Guava juice 817,000 0.39 20098100 Cranberry concentrate 812,000 0.39 20095000 Tomato juice 482,000 0.23 20098915 Pear juice 397,000 0.19 20093990 Juice of any other single
citrus fruit 370,000 0.18
20097900 Apple juice, nes 273,000 0.13 Source: ITC trade maps
Table 13 shows the indicative trade potential for fruit juices for exports to CARs and China in 2015. As seen, the current export of fruit juices to CARs is very nominal compared to the total imports of juices by CARs. The trade potential indicates that there is an opportunity for Pakistan to increase its exports to CARs by US$ 14.3 million. Similarly, our exports to China form an insignificant share of total China’s imports from the world, and there is a potential to increase fruit juice exports to China up to US$ 16.2 million. Both these potentials are largely unexploited by Pakistan.
Table 13: Indicative trade potential for fruit juices in 2015
US Million $ CARs China
Pakistan's exports 0.022 0.055
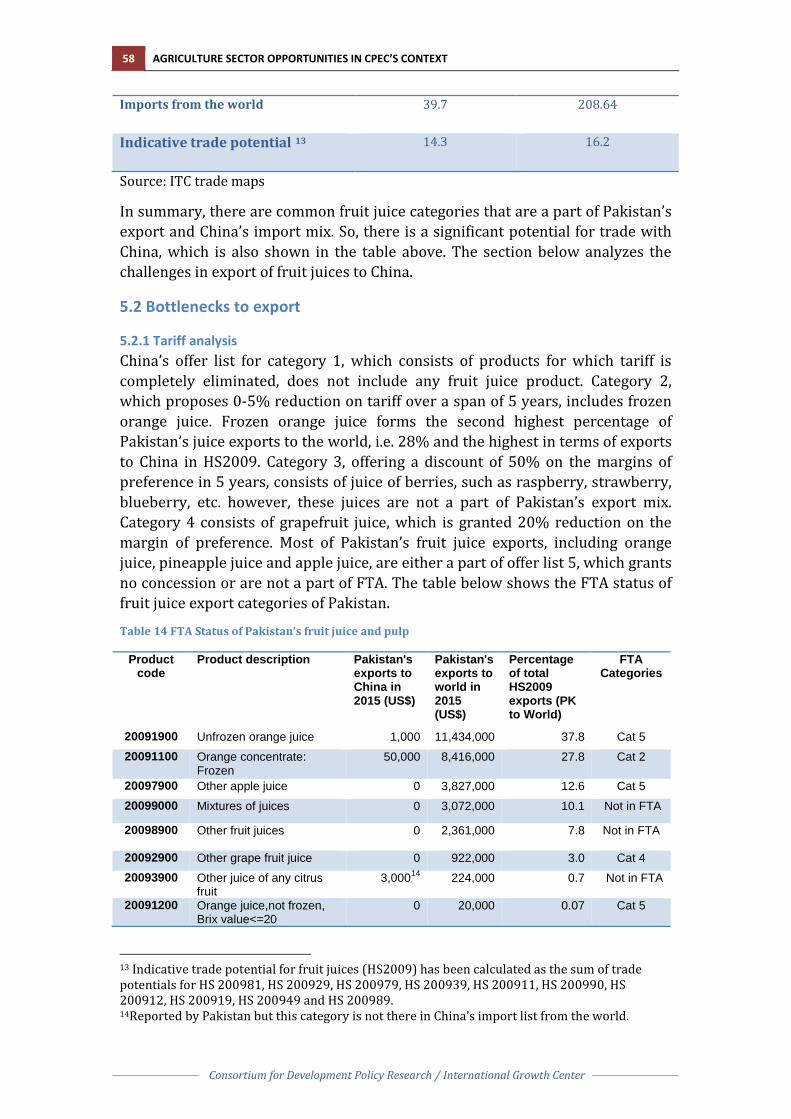
58 AGRICULTURE SECTOR OPPORTUNITIES IN CPEC’S CONTEXT
Consortium for Development Policy Research / International Growth Center
Imports from the world 39.7 208.64
Indicative trade potential 13 14.3 16.2
Source: ITC trade maps
In summary, there are common fruit juice categories that are a part of Pakistan’s export and China’s import mix. So, there is a significant potential for trade with China, which is also shown in the table above. The section below analyzes the challenges in export of fruit juices to China.
5.2 Bottlenecks to export
5.2.1 Tariff analysis China’s offer list for category 1, which consists of products for which tariff is completely eliminated, does not include any fruit juice product. Category 2, which proposes 0-5% reduction on tariff over a span of 5 years, includes frozen orange juice. Frozen orange juice forms the second highest percentage of Pakistan’s juice exports to the world, i.e. 28% and the highest in terms of exports to China in HS2009. Category 3, offering a discount of 50% on the margins of preference in 5 years, consists of juice of berries, such as raspberry, strawberry, blueberry, etc. however, these juices are not a part of Pakistan’s export mix. Category 4 consists of grapefruit juice, which is granted 20% reduction on the margin of preference. Most of Pakistan’s fruit juice exports, including orange juice, pineapple juice and apple juice, are either a part of offer list 5, which grants no concession or are not a part of FTA. The table below shows the FTA status of fruit juice export categories of Pakistan.
Table 14 FTA Status of Pakistan’s fruit juice and pulp
Product code
Product description Pakistan's exports to China in 2015 (US$)
Pakistan's exports to world in 2015 (US$)
Percentage of total HS2009 exports (PK to World)
FTA Categories
20091900 Unfrozen orange juice 1,000 11,434,000 37.8 Cat 5 20091100 Orange concentrate:
Frozen 50,000 8,416,000 27.8 Cat 2
20097900 Other apple juice 0 3,827,000 12.6 Cat 5 20099000 Mixtures of juices 0 3,072,000 10.1 Not in FTA
20098900 Other fruit juices 0 2,361,000 7.8 Not in FTA
20092900 Other grape fruit juice 0 922,000 3.0 Cat 4 20093900 Other juice of any citrus
fruit 3,00014 224,000 0.7 Not in FTA
20091200 Orange juice,not frozen, Brix value<=20
0 20,000 0.07 Cat 5
13 Indicative trade potential for fruit juices (HS2009) has been calculated as the sum of trade potentials for HS 200981, HS 200929, HS 200979, HS 200939, HS 200911, HS 200990, HS 200912, HS 200919, HS 200949 and HS 200989. 14Reported by Pakistan but this category is not there in China’s import list from the world.

AGRICULTURE SECTOR OPPORTUNITIES IN CPEC’S CONTEXT 59
Consortium for Development Policy Research / International Growth Center
20094900 Other pineapple juice 0 11,000 0.04 Cat 5 20098100 Cranberry concentrate 0 2,000 0.01 Not in FTA 08045050 Mango pulp 0 582,000 - Not in FTA
Source: ITC trade maps
In order to understand the factors responsible for low exports to China, the table below shows the tariff rates applicable to the top exporting country in China’s imports juxtaposed with the tariff applied to Pakistan’s exports to China in those HS Code commodities. It can be seen that among the products that are Pakistan’s top exports to the world (frozen orange juice, unfrozen orange juice and apple juice), only frozen orange concentrate is given preferential tariff rates. The rest of the commodities face the same tariffs as the top importing country of China. Lower tariff rate is applicable to grapefruit juice and cranberry concentrate, which form a very small share of Pakistan’s fruit juice exports. In the rest of the categories, while Pakistan is not disadvantaged with higher tariff rates than competitors, it does not have preferential rates despite signing an FTA.
Table 15 Comparison of tariff rates for Pakistan and top exporting country
HScode Product description Top importing country of
China
Tariff applied to top importing
country in 2015
Tariff applied to Pakistan in 2015
20091900 Unfrozen orange juice Germany 30% 30% 20091100 Orange concentrate:
Frozen Brazil 7.50% 5%
20097900 Other apple juice Ukraine 20% 20% 20092900 Other grape fruitjuice Israel 15% 12% 20091200 Orange juice not frozen Cyprus 30% 30%
20094900 Other pineapple juice Thailand 10% 10% 20098100 Cranberry concentrate USA 20% 10% Source: ITC trade maps, http://www.macmap.org/QuickSearch/FindTariff/FindTariff.aspx
The analysis above indicates that there is scope for negotiating better tariff access to Chinese markets, since Pakistan’s top juice exports all have no concessions under the Pak-China FTA.
5.2.2 Non-tariff barriers and competitiveness In order to explore non-tariff barriers and competitiveness issues in the fruit juice value chain, a focus group session was held with value chain stakeholders. The focus group was attended by mango growers, mango processors and a mango pulp exporter. The pulp exporting company was vertically integrated and managed operations from buying from the grower and using fruit grown on their own farms, processing the fruit and exporting pulp.
A common finding was that the greatest value addition occurs in processed fruit such as fruit leather. It is also far easier to meet the SPS requirements of processed fruit as compared to fresh fruit. However, the capital and coordination
60 AGRICULTURE SECTOR OPPORTUNITIES IN CPEC’S CONTEXT
Consortium for Development Policy Research / International Growth Center
requirements have prevented moving up the value chain for large parts of the market, and fruit faces high wastage at all post-harvest stages.
Exporters of mango pulp also face problems with custom procedures at the ports of Pakistan. Facilities such as scanners and sniffer dogs are not available, due to which each container has to be opened by the custom officers and physically examined. One exporter reported that the seals of containers were broken by the officers and cartons were opened, without any prior notice and without sharing information on the reasons for physical inspection. This increases the cost and time required for the export procedures, resulting in delays, which are inconvenient for exporters. It also disrupts the packaging and increases the risk of preserved food going bad. Moreover, when the product arrives to the consumer it has a high risk of being rejected since it has been compromised by the customs officials.
Another major issue in the export of fruit pulp is lack of information and compliance of SPS requirements. Exporters struggle to find sources for consolidated information on SPS requirements; hence fruit processing units find it difficult to aexport. SPS controls, such as percentage of sugar content, types of preservatives, etc. vary from country to country, due to which each country’s requirements have to be tracked individually. Lack of information about these requirements creates problems for the processing units and exporters and makes compliance more difficult. Moreover, there is an absence of domestic certification bodies that are internationally accepted. So in order to obtain SPS certification, samples have to be sent to international accreditation labs. This is a costly and time-consuming process in itself, especially if the chances of falling short of the standards are high due to lack of information.
Another challenge facing Pakistan in processed fruit is the lack of access to technology by farmers and processing units. Farmers use conventional farming practices rather than modern techniques. For example, fruit is picked manually, instead of using mechanized assistance that allows higher fruit to be reached without damaging them. These primitive techniques result in lower efficiency in production and greater wastage of fruit. Similarly, machinery such as fillers for processing units are not available domestically. Cold storage transport facilities also need to be developed further. Due to variation in temperatures during transport, fruit goes bad. In recent years, government has taken steps to strengthen cold storage, by offering loans on concessional rates for establishment and modernization of cold storage and purchase of local and imported equipment for cold storage.15 In a similar manner, cold storage transportation also needs to be developed.
There is also poor coordination between key players of the fruit processing value chain. Most of the stakeholders are working in silos, with limited integration with players in other stages of production. Although events like mango festivals
15http://smebank.org/products/loan-facilities/financing-facility-for-storage-of-agricultural-produce/
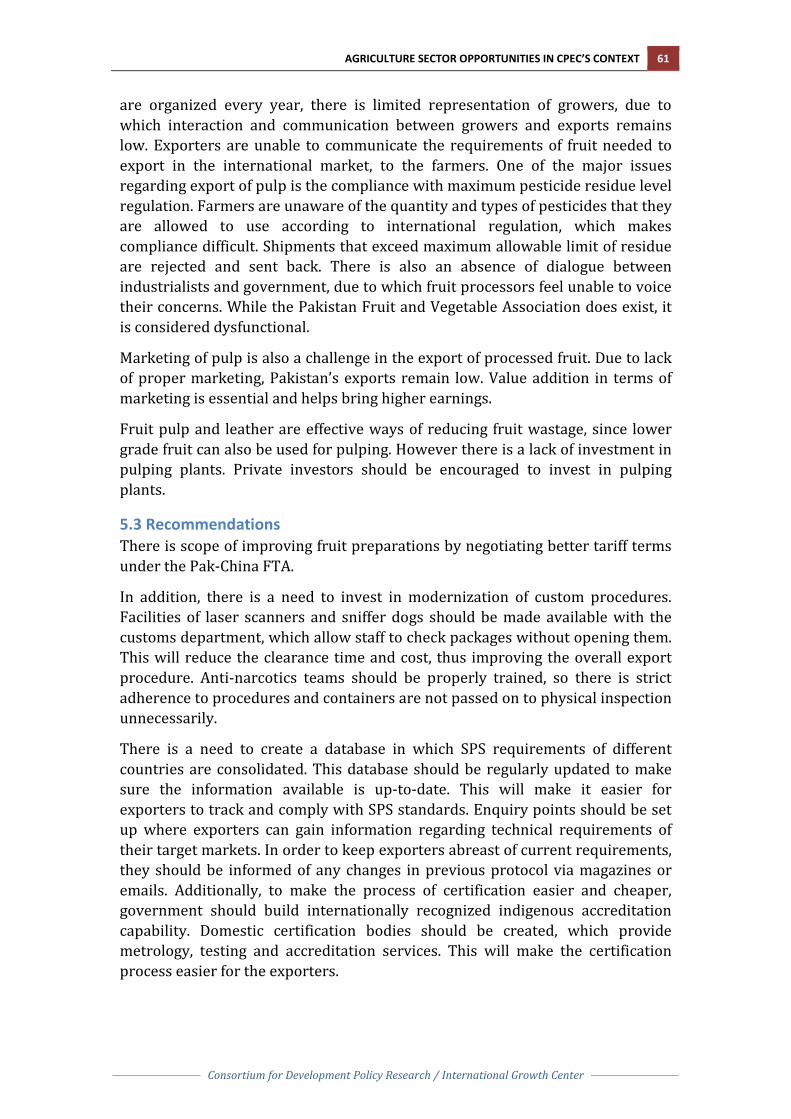
AGRICULTURE SECTOR OPPORTUNITIES IN CPEC’S CONTEXT 61
Consortium for Development Policy Research / International Growth Center
are organized every year, there is limited representation of growers, due to which interaction and communication between growers and exports remains low. Exporters are unable to communicate the requirements of fruit needed to export in the international market, to the farmers. One of the major issues regarding export of pulp is the compliance with maximum pesticide residue level regulation. Farmers are unaware of the quantity and types of pesticides that they are allowed to use according to international regulation, which makes compliance difficult. Shipments that exceed maximum allowable limit of residue are rejected and sent back. There is also an absence of dialogue between industrialists and government, due to which fruit processors feel unable to voice their concerns. While the Pakistan Fruit and Vegetable Association does exist, it is considered dysfunctional.
Marketing of pulp is also a challenge in the export of processed fruit. Due to lack of proper marketing, Pakistan’s exports remain low. Value addition in terms of marketing is essential and helps bring higher earnings.
Fruit pulp and leather are effective ways of reducing fruit wastage, since lower grade fruit can also be used for pulping. However there is a lack of investment in pulping plants. Private investors should be encouraged to invest in pulping plants.
5.3 Recommendations There is scope of improving fruit preparations by negotiating better tariff terms under the Pak-China FTA.
In addition, there is a need to invest in modernization of custom procedures. Facilities of laser scanners and sniffer dogs should be made available with the customs department, which allow staff to check packages without opening them. This will reduce the clearance time and cost, thus improving the overall export procedure. Anti-narcotics teams should be properly trained, so there is strict adherence to procedures and containers are not passed on to physical inspection unnecessarily.
There is a need to create a database in which SPS requirements of different countries are consolidated. This database should be regularly updated to make sure the information available is up-to-date. This will make it easier for exporters to track and comply with SPS standards. Enquiry points should be set up where exporters can gain information regarding technical requirements of their target markets. In order to keep exporters abreast of current requirements, they should be informed of any changes in previous protocol via magazines or emails. Additionally, to make the process of certification easier and cheaper, government should build internationally recognized indigenous accreditation capability. Domestic certification bodies should be created, which provide metrology, testing and accreditation services. This will make the certification process easier for the exporters.

62 AGRICULTURE SECTOR OPPORTUNITIES IN CPEC’S CONTEXT
Consortium for Development Policy Research / International Growth Center
In order to increase exports of processed fruit, the entire value chain needs to be strengthened. Government should make farmers aware of better farming practices. Some steps are being taken in this regard by Fauji Fertilizer, which have launched a farmer facilitation project. Training teams are sent to individual farmers to disseminate information regarding farming practices, such as application of fertilizer, timings of irrigation, method of spraying pesticides to control pest attacks such as fruit flies and desapping techniques. These advisory services are provided free of cost. A toll free telephone line is also operational to assist farmers. Farmers are also provided information regarding global gap certification. Such initiatives should be encouraged by the government and initiated at a larger scale.
To promote mechanization of farms, there is a need to make modern machinery and technology available to farmers. Since harvesting machines, which are needed for picking fruit efficiently, are not being manufactured domestically, government should facilitate the import of this technology. These machines should be customized according to local requirements. Similarly, fruit processing technology such as fillers and pulping machines should also be imported. There is a scope for cooperation with China in processing technology. Chinese investors are interested in bringing and installing technology and machinery in Pakistan. Joint ventures should be initiated with Chinese companies. These machines can eventually be reverse-engineered domestically and sold at affordable prices.
Pakistan should focus on the development of individual sectors and their value chains. Instead of targeting products from different value chains and sector to increase the export base, it will be more effective if steps are taken to develop multiple product lines of the same sector. For example, the entire value chain of mango should be strengthened to increase exports of different types of mango products: fresh mango, packaged mango, mango pulp and mango leather. This will help realize maximum benefits of investment as developed segments of the value chain will be able to work efficiently in integration, achieve economies of scale leading to magnifying of returns.
Organic markets should be explored as well. Organic certification can be obtained in 3 years and organically certified products fetch a higher price in the market.

AGRICULTURE SECTOR OPPORTUNITIES IN CPEC’S CONTEXT 63
Consortium for Development Policy Research / International Growth Center
6. Other High Opportunity Categories
6.1 Guavas and Mangoes Pakistan’s exports of guavas, mangoes and mangosteens (HS 80450) to the world have gone up from 2003 to 2015. In 2003, exports to the world stood at US$ 22 million, which increased almost two-fold by 2013, and amounted to US$ 41 million. In the years 2012 to 2016, the average annual growth rate of Pakistan’s exports to the world was -6%. Pakistan’s exports to China remained less than US$ 10,000 until 2011, after which there was a sharp increase to US$ 69,000 in 2012. After 2012, some fluctuation in exports was observed, with exports worth $18,000 traded in 2015. Pakistan’s exports to China have declined at a rate of 23% annually on average in the years 2012 to 2016.
Figure 30 Pakistan's exports in guava, mangoes, mangosteens in 2015
Pakistan’s main export partners in guavas and mangoes are UAE, UK and Saudi Arabia. US $16 million worth of guavas and mangoes are exported to UAE, which constitutes 40% of Pakistan’s exports of these fruits. Exports to UK, which is the second important export market, accounts for 19% of Pakistan’s guava, mango and mangosteen exports, while 11% of guavas, mangoes and mangosteens are exported to Saudi Arabia. Exports to China constitute a meagre 0.04% of Pakistan’s export of these fruits, with a trade value of US$ 17,786, although China is located in greater proximity to Pakistan than most of the existing trade partners.
0
20
40
60
80
100
0102030405060
Expo
rts
to C
hina
(US$
th
ousa
nds)
Expo
rts
to th
e w
orld
(US$
m
illio
ns)
Pakistan's exports to the world (US$ millions)
Pakistan's exports to China (US$ thousands)
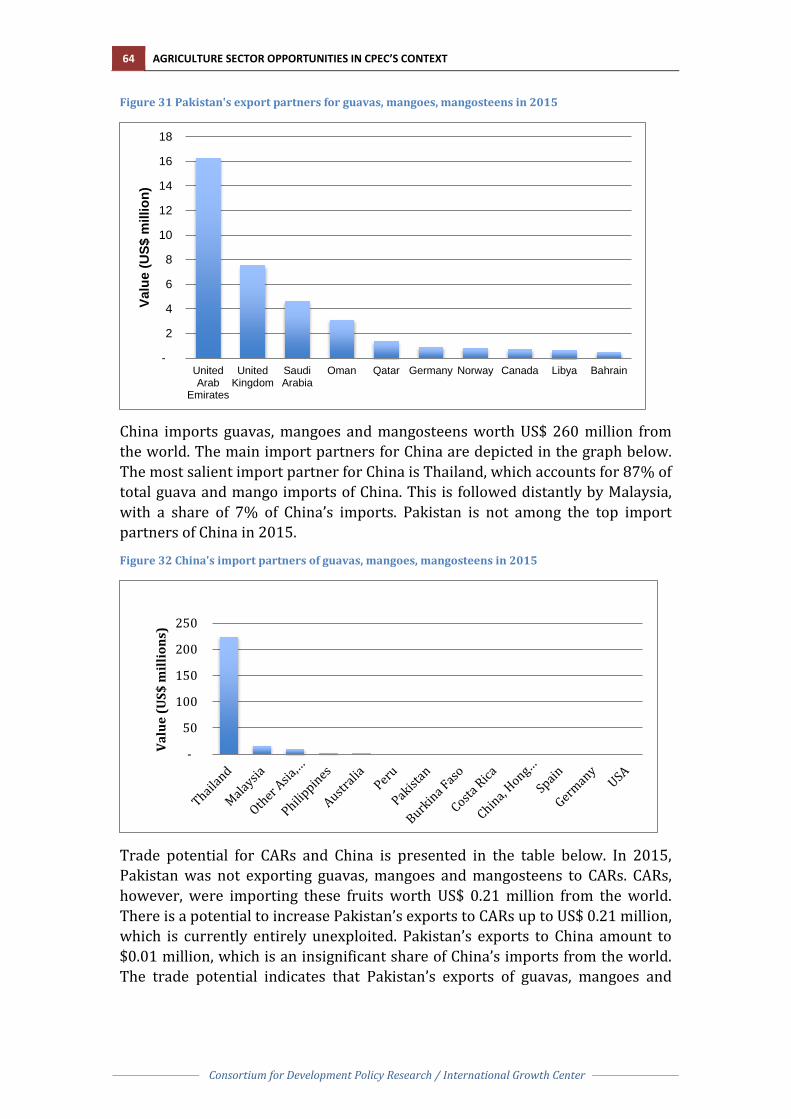
64 AGRICULTURE SECTOR OPPORTUNITIES IN CPEC’S CONTEXT
Consortium for Development Policy Research / International Growth Center
Figure 31 Pakistan's export partners for guavas, mangoes, mangosteens in 2015
China imports guavas, mangoes and mangosteens worth US$ 260 million from the world. The main import partners for China are depicted in the graph below. The most salient import partner for China is Thailand, which accounts for 87% of total guava and mango imports of China. This is followed distantly by Malaysia, with a share of 7% of China’s imports. Pakistan is not among the top import partners of China in 2015.
Figure 32 China's import partners of guavas, mangoes, mangosteens in 2015
Trade potential for CARs and China is presented in the table below. In 2015, Pakistan was not exporting guavas, mangoes and mangosteens to CARs. CARs, however, were importing these fruits worth US$ 0.21 million from the world. There is a potential to increase Pakistan’s exports to CARs up to US$ 0.21 million, which is currently entirely unexploited. Pakistan’s exports to China amount to $0.01 million, which is an insignificant share of China’s imports from the world. The trade potential indicates that Pakistan’s exports of guavas, mangoes and
-
2
4
6
8
10
12
14
16
18
UnitedArab
Emirates
UnitedKingdom
SaudiArabia
Oman Qatar Germany Norway Canada Libya Bahrain
Valu
e (U
S$ m
illio
n)
-
50
100
150
200
250
Valu
e (U
S$ m
illio
ns)

AGRICULTURE SECTOR OPPORTUNITIES IN CPEC’S CONTEXT 65
Consortium for Development Policy Research / International Growth Center
mangosteens have a potential to export guavas, mangoes and mangosteens up to US$ 41 million, which is largely untapped.
Table 16 Pakistan's trade potential in guavas, mangoes and mangosteens in 2015
US Million $ CARs China
Pakistan's exports - 0.01
Imports from the world 0.21 260.1
Indicative trade potential 0.21 40.8
6.2 Sugar Pakistan’s exports of beet or cane sugar (HS 1701) to the world remained low and almost constant from 2003 to 2011, with the exception of 2008 when the exports increased to US$ 93.5 million. After 2011, there has been a steep increase, with export earnings peaking in 2013, at US$ 492 million. After 2013, the exports have declined and in 2015, the sugar worth US$ 234 million was exported. Sugar exports to the world have declined at an average annual growth rate of 52% in the years 2012 to 2016. A similar trend is followed by the Pakistan’s exports to China, with exports increasing in 2008 and peaking in 2013. No sugar has been exported to China in 2014 and 2015.
Figure 33 Pakistan's cane or beet sugar exports in 2015
The main export partner of Pakistan in sugar is Afghanistan, in 2015. More than 90% of sugar is exported to Afghanistan. China’s main import partners in sugar are demonstrated in the bar graph below. China sugar imports in 2015 are worth $1.7 billion. Brazil is the most important import partner for China, from which half of China’s sugar imports are sourced. This is followed by Thailand with a
0
500
1000
1500
2000
2500
3000
3500
4000
4500
5000
0
50
100
150
200
250
300
350
400
450
500
2003 2004 2005 2006 2007 2008 2009 2010 2011 2012 2013 2014 2015
Expo
rts
to C
hina
in th
ousa
nds U
S$
Expo
rts
to th
e w
orld
in m
illio
n US
$
Pakistan's exports to the world (million US$)
Pakistan's exports to China (thousands $)
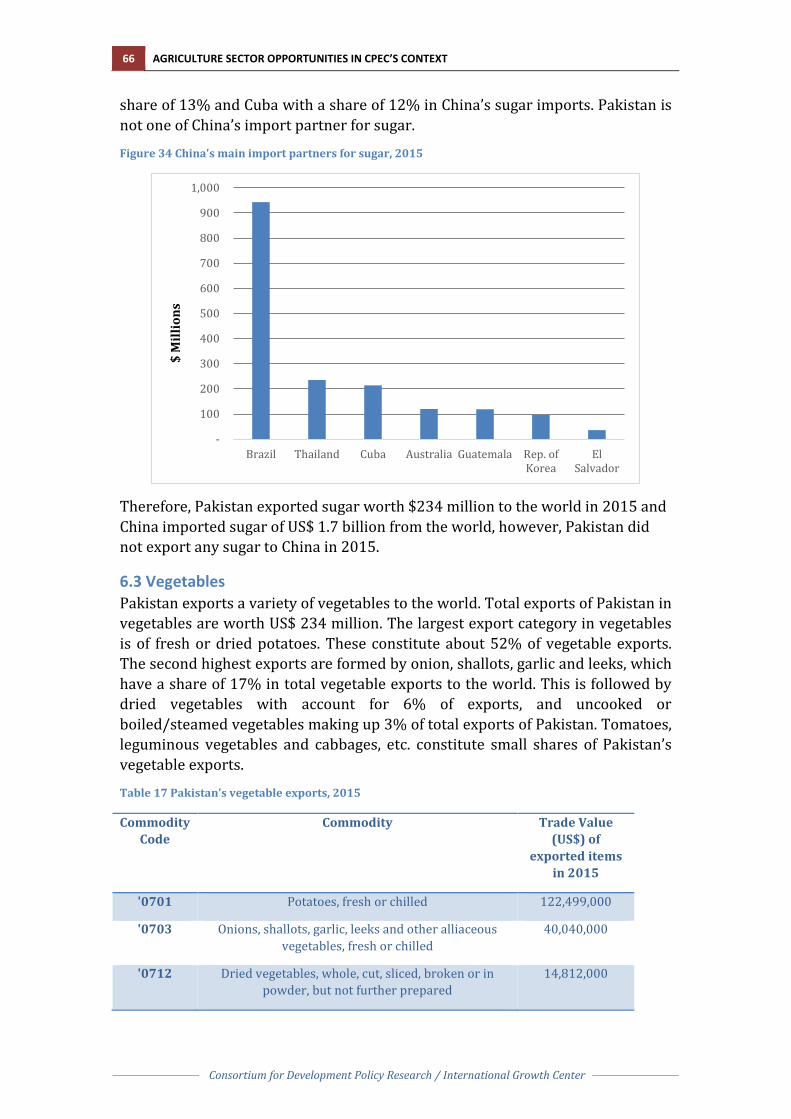
66 AGRICULTURE SECTOR OPPORTUNITIES IN CPEC’S CONTEXT
Consortium for Development Policy Research / International Growth Center
share of 13% and Cuba with a share of 12% in China’s sugar imports. Pakistan is not one of China’s import partner for sugar.
Figure 34 China's main import partners for sugar, 2015
Therefore, Pakistan exported sugar worth $234 million to the world in 2015 and China imported sugar of US$ 1.7 billion from the world, however, Pakistan did not export any sugar to China in 2015.
6.3 Vegetables Pakistan exports a variety of vegetables to the world. Total exports of Pakistan in vegetables are worth US$ 234 million. The largest export category in vegetables is of fresh or dried potatoes. These constitute about 52% of vegetable exports. The second highest exports are formed by onion, shallots, garlic and leeks, which have a share of 17% in total vegetable exports to the world. This is followed by dried vegetables with account for 6% of exports, and uncooked or boiled/steamed vegetables making up 3% of total exports of Pakistan. Tomatoes, leguminous vegetables and cabbages, etc. constitute small shares of Pakistan’s vegetable exports.
Table 17 Pakistan’s vegetable exports, 2015
Commodity Code
Commodity Trade Value (US$) of
exported items in 2015
'0701 Potatoes, fresh or chilled 122,499,000
'0703 Onions, shallots, garlic, leeks and other alliaceous vegetables, fresh or chilled
40,040,000
'0712 Dried vegetables, whole, cut, sliced, broken or in powder, but not further prepared
14,812,000
-
100
200
300
400
500
600
700
800
900
1,000
Brazil Thailand Cuba Australia Guatemala Rep. ofKorea
ElSalvador
$ M
illio
ns

AGRICULTURE SECTOR OPPORTUNITIES IN CPEC’S CONTEXT 67
Consortium for Development Policy Research / International Growth Center
'0710 Vegetables, uncooked or cooked by steaming or boiling in water, frozen
8,348,000
'0702 Tomatoes, fresh or chilled 3,541,000
'0708 Leguminous vegetables, shelled or unshelled, fresh or chilled
945,000
'0704 Cabbages, cauliflowers, kohlrabi, kale and similar edible brassicas, fresh or chilled
730,000
The evolution of Pakistan’s vegetable exports to the world and to China from 2003 to 2015 is depicted in the graph below. Pakistan’s exports to the world have been fluctuating almost every two years, but have an overall increasing trend. Exports to the world in 2015, i.e. US$ 234 million, are three times the exports in 2003, which were US$ 81 million. There has been a sharp increase in vegetable exports to the world in the time period 2008 to 2011, after which variation is observed until 2015. Exports to the world have declined at a rate of 8% from 2012 to 2016. Pakistan’s exports to China have remained low until 2012, when the exports surged to US$3.9 million. In 2013, exports plummeted to about US$ 600,000 after which exports have gradually increased to US$ 923,000. Over the time period 2003 to 2015, Pakistan’s exports to China have increased 14 times, however in the last 5 years the exports have fallen at a rate of 45%.
Figure 35 Pakistan's vegetable exports, 2003-2015
Pakistan’s has a diversified market for vegetable exports. The top market for Pakistan’s exports is to the regional partner Afghanistan, which accounts for 47% of total vegetable exports. This is followed by UAE, which accounts for 14% of Pakistan’s exports. The third largest market is Sri Lanka, which constitutes 9% of total vegetable exports to the world. A small share of Pakistan’s exports is also occupied by China, i.e. 0.4%, where vegetable exports worth $923,000 were exported in 2015.
-
1,000
2,000
3,000
4,000
5,000
6,000
-
50
100
150
200
250
300
Paki
stan
's e
xpor
ts to
Chi
na (U
S$
thou
sand
s)
Paki
stan
;s e
xpor
ts to
the
wor
ld (U
S$
mill
ions
)
Exports to the world (US$ millions) Exports to China (US$ thousands)
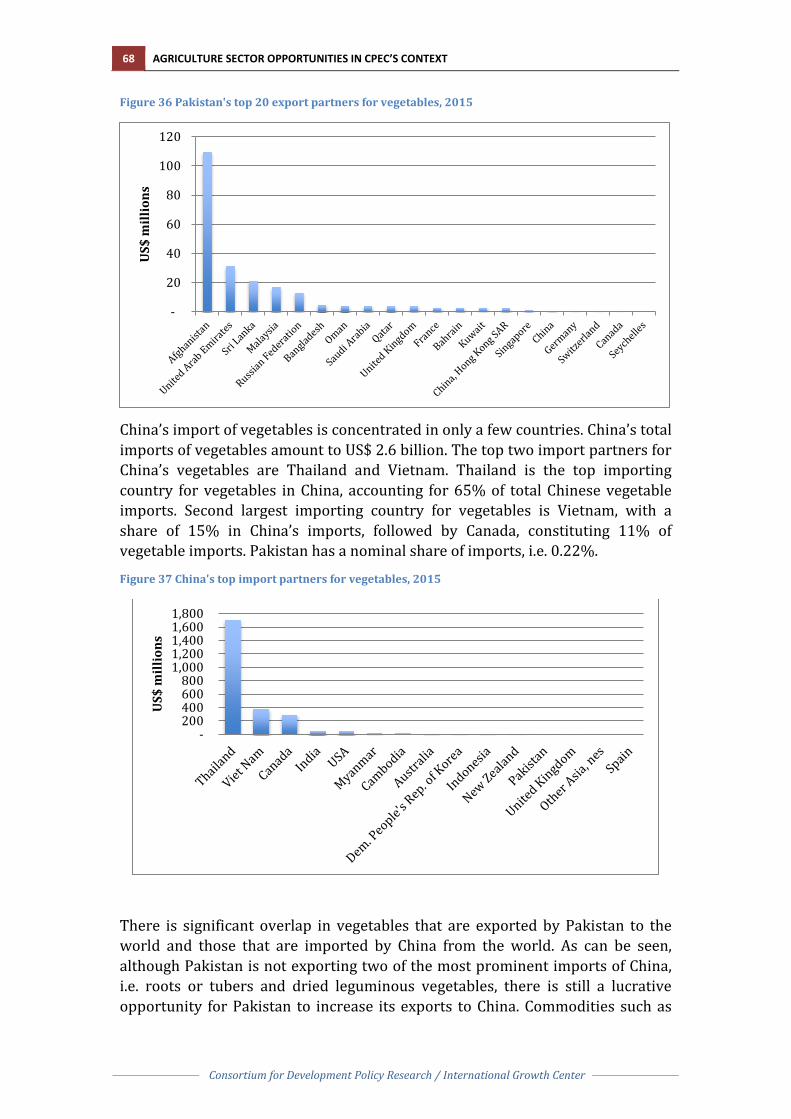
68 AGRICULTURE SECTOR OPPORTUNITIES IN CPEC’S CONTEXT
Consortium for Development Policy Research / International Growth Center
Figure 36 Pakistan's top 20 export partners for vegetables, 2015
China’s import of vegetables is concentrated in only a few countries. China’s total imports of vegetables amount to US$ 2.6 billion. The top two import partners for China’s vegetables are Thailand and Vietnam. Thailand is the top importing country for vegetables in China, accounting for 65% of total Chinese vegetable imports. Second largest importing country for vegetables is Vietnam, with a share of 15% in China’s imports, followed by Canada, constituting 11% of vegetable imports. Pakistan has a nominal share of imports, i.e. 0.22%.
Figure 37 China's top import partners for vegetables, 2015
There is significant overlap in vegetables that are exported by Pakistan to the world and those that are imported by China from the world. As can be seen, although Pakistan is not exporting two of the most prominent imports of China, i.e. roots or tubers and dried leguminous vegetables, there is still a lucrative opportunity for Pakistan to increase its exports to China. Commodities such as
-
20
40
60
80
100
120U
S$ m
illio
ns
- 200 400 600 800
1,000 1,200 1,400 1,600 1,800
US$
mill
ions

AGRICULTURE SECTOR OPPORTUNITIES IN CPEC’S CONTEXT 69
Consortium for Development Policy Research / International Growth Center
onions or shallots etc., dried vegetables, uncooked or boiled/steamed vegetables, preserved vegetables and carrots or turnips etc. are a part of both Pakistan’s export portfolio and China’s import mix. Moreover, with the exception of processed vegetables Pakistan’s exports in the overlapping commodities outweigh China’s imports. This means that given favorable conditions, Pakistan can even cater to entire demand of China’s imports of these items.
Table 18 Alignment of Pakistan's vegetable exports with China's vegetable imports
Commodity Code
Commodity Pakistan's Exports ($)
China's Imports ($)
0709 Other vegetables, fresh or chilled 42,818,000 2,985,000
0703 Onions, shallots, garlic, leeks and other alliaceous vegetables, fresh or chilled
40,040,000 403,000
0712 Dried vegetables, whole, cut, sliced, broken or in powder, but not further prepared
14,812,000 8,100,000
0710 Vegetables, uncooked or cooked by steaming or boiling in water, frozen
8,348,000 27,743,000
0711 Vegetables provisionally preserved 257,000 2,934,000
0706 Carrots, turnips, salad beetroot, salsify, celeriac, radishes and similar edible roots
71,000 58,000
0714 Roots and tubers of manioc, arrowroot, salep, Jerusalem artichokes, sweet potatoes and similar
2,120,845,000
0713 Dried leguminous vegetables, shelled, whether or not skinned or split
458,287,000

70 AGRICULTURE SECTOR OPPORTUNITIES IN CPEC’S CONTEXT
Consortium for Development Policy Research / International Growth Center
7. Recommendations and Conclusion
Agriculture sector forms an important theme of CPEC whereby an effective cooperation strategy between Pakistan and China can prove to be greatly beneficial for both countries. For Pakistan and Punjab specifically these dividends could come in the form of new export opportunities, improved technology, private investment flows and growth for local enterprises within agri-business sector. However, in order to facilitate such opportunities, the government must play an effective role by paving the way for private sector led growth. While the previous sections have highlighted a number of sector and product-specific recommendations, overall the government needs to focus on the following threads.
7.1 Value Chain Competitiveness Improve value chain competitiveness in targeted areas, based on rigorous diagnostics and identification of high opportunity areas. This work has identified some early value chain improvement areas, around which the government needs to develop interventions. However this should be a continuous process. Agriculture Department may plan to develop a Value Chain Competitiveness Fund to undertake all such interventions, geared towards capitalizing on CPEC opportunities whereby government could address a market failure through this fund. Some of these identified early areas for interventions include the following (as mentioned in previous chapters):
• Rice - importing and providing time limited subsidies to encourage the use of modern machinery such as transplanters, research and development support, providing funding for farmers to invest in improving their productivity; better marketing and branding efforts in order to expand international market share to promote differentiation between authentic and sub-quality basmati rice;
• Citrus - marketing the current product kinnow in the short term; developing varieties with fewer seeds to cater to Chinese and international markets in the longer term; partnerships of Citrus Research Institute in Sargodha and Nuclear Institute for Agriculture and Biology (NIAB) with Citrus Research Centre in California and research centers in Italy, which have developed seedless varieties of kinnow and can be modified to suit the climate and soil conditions of Pakistan; strengthening of extension services, which disseminate information to the farmers regarding new seed varieties and techniques which enhance productivity, reduce wastage and help meet the cosmetic requirements for export of citrus
• Fruit preparations – strengthening of extension services on private sector model whereby training teams are sent to individual farmers to disseminate information regarding farming practices, such as application of fertilizer, timings of irrigation, method of spraying pesticides to control

AGRICULTURE SECTOR OPPORTUNITIES IN CPEC’S CONTEXT 71
Consortium for Development Policy Research / International Growth Center
pest attacks such as fruit flies and desapping techniques; developing a toll free telephone line for farmers; awareness of farmers regarding global gap certifications; promote mechanization of farms, with customized harvesting machines for picking fruit efficiently
7.2 Tariff and Non-Tariff Barriers It is clear that tariff and non-tariff barriers impede export growth in a number of areas. This work has already shed light on a few of these areas, where there is a need to overcome such barriers. This lies within the purview of the federal government, which could take these issues up during bilateral trade negotiations. Pak-China Free Trade Agreement that was signed in 2006 is also reportedly up for re-negotiations and many of these issues must be addressed at this stage. However, there is a need to continually identify such constraints and provincial governments should feed them regularly to federal government to inform any bilateral trade negotiations. As mentioned earlier, there is also a need to develop a repository of all such regulations to inform the trade community. Some of the identified tariff and non-tariff barriers pertaining to selected opportunities include the following (as mentioned in previous chapters):
• Rice - better tariff under the FTA at par with China’s other trade partners • Citrus – Removal of non-tariff barriers gaining access to China by road
with lower transportation cost and time and saving the need for cold treatment; development of a portal consolidating SPS and other import requirements for different countries
• Fruit preparations - negotiating better tariff terms under the Pak-China FTA; modernization of custom procedures with laser scanners and sniffer dogs should to allow checking packages without opening them; training of anti-narcotics teams for strict adherence to procedures and no unnecessary physical inspection; setting up of enquiry points where exporters can gain information regarding technical requirements of their target markets; government to build internationally recognized indigenous accreditation capability; creation of domestic certification bodies to provide metrology, testing and accreditation service
7.3 Technology Partnership Program The Chinese side has mentioned a number of areas, where there is potential for technology partnership. Some of these areas include water resources and water-saving techniques, crop seed reproduction, breeding and production technology, agricultural products processing, animal & plant epidemic prevention & control, mechanization demonstration, ICT-enabled agriculture and remote sensing technologies, post-harvest agricultural practices, including storage, transportation and agricultural processing. In order to benefit from China in these areas and others, Agriculture Department may develop a technology partnership program, whereby modern agricultural demonstration zones can be established and individual enterprises and farmers can be supported. However, in order to further develop this thread, the Department must arrange a few

72 AGRICULTURE SECTOR OPPORTUNITIES IN CPEC’S CONTEXT
Consortium for Development Policy Research / International Growth Center
stakeholder exposure visits to Xinjiang Production and Construction Corps (XPCC), where these areas cam be studied further.
7.4 Opportunity Radar This work is aimed at presenting a framework to develop the agriculture opportunity canvas within CPEC’s context. Subsequently, the work has provided more details on a few product categories – rice, citrus and fruit preparations - to illustrate how this framework can be used. The research has also identified three other opportunity areas – mangoes & guavas, sugar and vegetables – that should be explored further. However, there is a need to also broaden the opportunity frontier and look into other agriculture product categories. There is also a need to look more deeply at other international markets, which could be easily accessed through the improved CPEC infrastructure and earlier CAREC investments. Therefore, the Agriculture Department should develop in-house research capacity to undertake this work and develop Opportunity Radar, which should then inform the proposed Value Chain Competitiveness Fund, annual ADP formulation and other interventions.
7.5 Investor Fora Much of this work was informed by stakeholder consultations, organized by Agriculture Department. However these consultations built upon the research work done by carefully evaluating trade data. These stakeholders from different parts of the value chain within a product category face on-ground challenges and can very well inform where the government interventions should be targeted. Therefore, it is proposed that these consultations should be undertaken regularly. The Department can also form loose investor fora around specific products and have periodic meetings, especially targeting export opportunities and how government can help in overcoming any barriers.
7.6 Project Pipeline for Private Investment The CPEC is supposed to pave way for private investments in a number of areas including agriculture sector. However this would require cooperation at the enterprise level to promote strategic acquisitions, joint ventures, technology partnerships, etc. The government can play a dual role to catalyze such investment flows. On one hand Agriculture Department can promote business-to-business facilitation to provide relevant information to interested investors and possibly help in matchmaking. This however is easier said than done since it would require a highly responsive capacity within the department. On the other hand, the Department can also identify areas, where government is seeking private investment to kick-start the process. However, this would require developing feasibility studies feeding into a sizable pipeline of projects, which can be presented during investment roadshows.
7.7 Conclusion CPEC provides immense opportunities for agriculture sector. In order to capitalize on these opportunities, the government will need to play an instrumental role. There is a need to clearly articulate Punjab’s priorities and

AGRICULTURE SECTOR OPPORTUNITIES IN CPEC’S CONTEXT 73
Consortium for Development Policy Research / International Growth Center
align them with what CPEC has to offer. This should be followed by developing a CPEC Readiness Plan. The plan should include developing the capacity of CPEC unit already established in Agriculture Department, which can spearhead this process. The government should be engaged in a continuous public-private dialogue work solely around addressing constraints to private sector growth. The government should start working on immediate priorities identified in this work, while running further diagnostics to identify other priority areas.

Designed by soapbox.co.uk
The International Growth Centre (IGC) aims to promote sustainable growth in developing countries by providing demand-led policy advice based on frontier research.
Find out more about our work on our website www.theigc.org
For media or communications enquiries, please contact [email protected]
Subscribe to our newsletter and topic updates www.theigc.org/newsletter
Follow us on Twitter @the_igc
Contact us International Growth Centre, London School of Economic and Political Science, Houghton Street, London WC2A 2AE