FINAL PROJECT REPORT PHASOR MEASUREMENT …
254
i FINAL PROJECT REPORT PHASOR MEASUREMENT APPLICATION STUDY Prepared for CIEE By: KEMA, Inc. Project Manager: Damir Novosel Author: Damir Novosel Date: June, 2007 A CIEE Report
Transcript of FINAL PROJECT REPORT PHASOR MEASUREMENT …
i
FINAL PROJECT REPORT
PHASOR MEASUREMENT APPLICATION STUDY
Prepared for CIEE By: KEMA, Inc.
Project Manager: Damir Novosel Author: Damir Novosel Date: June, 2007
A CIEE Report


Acknowledgments
This draft report is a collaborative effort of power system technical and business professionals,
leading researchers, and academics. The project team very much appreciates leadership,
support and directions provided by the dedicated sponsors:
Jim Cole and Merwin Brown, California Institute for Energy and Environment
Jamie Patterson, California Energy Commission
Phil Overholt, Department of Energy
Bonneville Power Administration, Pacific Gas and Electric (PG&E), Sempra Utilities, Sand
Diego Gas and Electric (SDG&E), Southern California Edison (SCE) and other contributing
members
Success of this project is based on a collective support, direction, and commitment from the
Transmission Research Program and other industry leaders. Our profound appreciation is
extended to our team of distinguished experts for their continued guidance and contributions:
Dmitry Kosterev and Ken Martin, BPA
Kris Bucholz, Fred Henderson, Vahid Madani, and Glen Rounds, PG&E
Bharat Bhargava, Anthony Johnson, John Minnicucci, and George Noller, SCE
Lu Kondragunta, SDG&E
Tami Elliot and David Hawkins, California Independent System Operator
Lisa Beard and Mike Ingram, Tennessee Valley Authority
Floyd Galvan, Entergy
Stan Johnson, Bob Cummings, and T. Vandervort, North American Electric Reliability
Corporation
Western Electricity Coordinating Council ‐ Remedial Action Scheme Reliability
Subcommittee – Chair, Vahid Madani
We are very grateful to the Policy Advisory Committee members, utility executives, and other
leading stakeholders in California that have provided valuable feedback and direction on the
project process.
We would also thank the California Energy Commission Peer review members and the Eastern
Interconnect Phasor Project leadership team on joint efforts and support, as well as to all
industry colleagues who have shared their ideas.
Sincere appreciation is extended to the project team consisting of:
Yi Hu, David Korinek, Ralph Masiello, Bill Snyder, Siri Varadan, Khoi Vu, KEMA
Virgilio Centeno, Arun Phadke, and James Thorp, Virginia Polytechnic Institute
Miroslav Begovic, Georgia Institute of Technology
Yuri Makarov, Pacific Northwest National Laboratory, supported by the Department of
Energy
Srdjan Skok, University of Zagreb, Croatia


Preface
The Public Interest Energy Research (PIER) Program supports public interest energy research
and development that will help improve the quality of life in California by bringing
environmentally safe, affordable, and reliable energy services and products to the marketplace.
The PIER Program, managed by the California Energy Commission (Energy Commission)
conducts public interest research, development, and demonstration (RD&D) projects to benefit
the electricity and natural gas ratepayers in California.
The PIER program strives to conduct the most promising public interest energy research by
partnering with RD&D organizations, including individuals, businesses, utilities, and public or
private research institutions.
PIER funding efforts are focused on the following RD&D program areas:
Buildings End‐Use Energy Efficiency
Industrial/Agricultural/Water End‐Use Energy Efficiency
Renewable Energy Technologies
Environmentally Preferred Advanced Generation
Energy‐Related Environmental Research
Energy Systems Integration
Transportation
Phasor Measurement Application Study is the draft final report for the PIER Final Project 500‐99‐
013, BOA130‐P‐05, conducted by KEMA Inc. The information from this project contributes to
PIER’s Energy Systems Integration program.
For more information about the PIER Program, please visit the Energy Commission’s website at
www.energy.ca.gov/pier or contact the Energy Commission at 916‐654‐5164.
DISCLAIMER
This draft report was prepared as the result of work sponsored by the California Energy Commission. It does not necessarily represent the
views of the Energy Commission, its employees or the State of California. The Energy Commission, the State of California, its employees,
contractors and subcontractors make no warrant, express or implied, and assume no legal liability for the information in this report; nor does
any party represent that the uses of this information will not infringe upon privately owned rights. This report has not been approved or
disapproved by the California Energy Commission nor has the California Energy Commission passed upon the accuracy or adequacy of the
information in this report.


Table of Contents
Acknowledgments ............................................................................................................................. iiiii
Preface ................................................................................................................................................ v
List of Figures ..................................................................................................................................... ixiii
List of Tables ....................................................................................................................................... ixiii
Abstract ............................................................................................................................................... xi
Executive Summary ........................................................................................................................... 1
1.0 Introduction .......................................................................................................................... 9
2.0 Project Approach ................................................................................................................. 13
3.0 Project Outcomes ................................................................................................................. 15
3.1. Key Overall Benefits ...................................................................................................... 15
3.2. Application Benefits ....................................................................................................... 19
3.3. Applications Roadmap .................................................................................................. 38
3.4. Business Case Analysis Guidebook ............................................................................. 42
3.5. System Architecture and Deployment Gaps .............................................................. 48
4.0 Recommendations and Conclusions ................................................................................. 53
4.1. Recommendations and Key Success Factors .............................................................. 53
4.2. Conclusions ..................................................................................................................... 54
5.0 Reference ............................................................................................................................... 57
6.0 Glossary ................................................................................................................................ 58
Appendix A ‐ Western Interconnection Phasor Based Projects
Appendix B ‐ Technology Review
Appendix C ‐ Business Case Evaluation Matrix
Appendix D ‐ Anecdotal
Appendix E – Business‐Case Study Examples
Appendix F ‐ EIPP‐CIEE Survey – May 19, 2006


List of Figures
Figure 1. Synchronized measurements and industry needs .............................................................. 40
Figure 2. Road map for deploying PMU applications ........................................................................ 42
Figure 3. Business Case Analysis Process ............................................................................................. 43
List of Tables
Table 1a. Utility stock price after the August 14, 2003 blackout for involved utilities................... 16
Table 1b. Utility stock price after the August 14, 2003 blackout for uninvolved. ........................... 17
Table 2. Estimated market penetration ................................................................................................. 42
Table 3. Steps in collecting data for Phase I, ʺIdentify Areas for Analysisʺ ..................................... 44
Table 4. Steps in collecting data for Phase II, ʺAnalyze Opportunities for Improvementʺ ........... 44
Table 5. Steps in collecting data for Phase III, ʺIdentify Stakeholdersʺ ............................................ 45
Table 6. Steps in collecting data for Phase IV, ʺEstimate Deployment Plan and Costʺ .................. 45
Table 7. Steps in collecting data for Phase V, ʺPerform Payback Analysisʺ .................................... 46
Table 8. Summary of Illustrative Business Case Results .................................................................... 48


Abstract
This project conducted a business case study for synchronized measurements, a technology that
can help to better plan, operate, and maintain the power grid. The study has identified that the
base hardware (Phasor Measurement Units, or PMU) is a proven technology, and that
commercial implementation of selected applications is both possible and warranted. Many
implementations and demonstrations around the world (especially in California and the US
West Coast) have verified the capability of the technology to provide information about fast‐
changing system conditions.
The study analyzed major PMU applications and their business and reliability benefits, status of
development and deployment, and identified implementation gaps. This resulted in
recommendations for a near‐, mid‐, and long‐term roadmap and a process to transition PMU
technology to full commercial application. This roadmap could serve as a base for individual
roadmaps by PMU users, and could guide vendors to prioritize their development and focus on
“low‐hanging fruit” applications and system components.
Implementing a large‐scale PMU system presents some unique challenges. Such systems need
to transmit and store large amounts of data, and involve a large number of legal entities. For
that reason, this study also addressed how to deploy a system that engages users with diverse
requirements and varying needs to achieve success.
Keywords: phasor, phasor measurement units, PMU, synchronized measurements, Global
Positioning System, GPS, power grid, software applications, monitoring, system architecture,
large‐scale deployment, roadmap.

xii

1
Executive Summary
Introduction
This study, An Independent Public Interest ʺBusiness Caseʺ Study on Applying Phasor Measurement
Technology and Applications in California/WECC Grid, is undertaken to:
(i) Review the current state of the electric industry involvement and interest in the
research, development, and deployment of synchronized phasor measurements units
(PMUs) in grid planning, operations, and maintenance.
(ii) Assess the potential benefits, costs and barriers to the near‐term deployment of
promising PMU applications, and likelihood of future investments in the Western
Electricity Coordinating Council (WECC) /California.
(iii) Identify actions required, by various stakeholders, to bring promising PMU
applications into widespread commercial use.
The general term business case or business justification is used throughout this report. This should
be interpreted as whether there is economic rationale for transmission owners, independent
system operators, regulators and other stakeholders to encourage investment in the technology
and promising applications because the reliability, operating cost savings and other benefits
exceed the costs of deployment of this technology, within the context of an integrated network
of PMUs at desired locations throughout the WECC, including California.
This project has assembled a team of leading technical and business experts to provide an
independent, comprehensive assessment of business and public interest benefits of
synchronized PMU applications for electricity consumers, transmission owners, independent
system operators and other market participants, to identify deployment and development gaps
and opportunities, and to recommend a deployment path.
The North American electric utility industry has undergone significant change since
deregulation in many states. Systems initially designed and operated in a vertically integrated
manner became subject to increased complexity with the inclusion of independent power
producers, transmission companies, distributed energy resources, and market forces. The
increased system complexity did not come with the tools necessary to address or understand
the changing system dynamics. This was further exacerbated by economic pressures (e.g.
bankruptcy and insolvency) and the elimination of most research development and deployment
(RD&D) efforts at California’s investor‐owned utilities. The historic, longer‐term foci on
infrastructure, reliability and the environment were replaced with the singular focus on short‐
term financials. This has resulted in increased reliability problems, congestion, and increased
O&M costs. Understanding short to long term needs (business, reliability, environment, etc.)
and how promising technologies (such as synchronized measurements) help with those needs
require creation of strategic roadmaps to utilize technology advancements and adapt to
changing environments.

2
In spite of the above impediments, California/WECC member systems have been worldwide
industry leaders in realizing the potential of the PMUs and in developing first industry
prototypes and applications. A challenge to California/WECC and the industry in harvesting
benefits offered by PMUs is highlighting and promoting the key benefits to move from RD&D
to commercial operation.
As an early‐on business case study, while quite approximate given the large number and
immaturity of PMU technology applications and its’ market, this effort provides useful insights
to the expected commercial success and the societal and rate‐payer value of efforts in the
deployment and applications of PMUs. Such a study also identifies policy, economic and
financial barriers to commercial deployment, and technology gaps. It also provides information
to help develop technology transfer strategies and educate potential users and policy
developers for increased adoption of these technologies.
Purpose
The Department of Energy (DOE) report to Congress (Steps to Establish a Real‐Time Transmission
Monitoring System for Transmission Owners and Operators within the Eastern and Western
Interconnection, February 2006) finds that:
Technology currently exists that could be used to establish a real‐time transmission
monitoring system to improve the reliability of the nation’s bulk power system; and
Emerging technologies hold the promise of greatly enhancing transmission system
integrity and operator situational awareness, thereby reducing the possibility of regional
and inter‐regional blackouts.
The synchronized PMU technology referred by the DOE is a known quantity. Many
implementation and demonstration projects around the world have verified the capability of
the technology to provide synchronized, time‐stamped information about system conditions. At
present, PMUs are the most sophisticated time‐synchronized technology available for wide‐area
applications. This technology has been made possible by advancements in computers and
availability of GPS signals. One can foresee a future where all time‐synchronization with high
precision will be a normal part of any measurement.
The purpose of this study is to analyze major existing and potential applications required to
realize reliability and financial benefits of the PMU technology, identify deployment costs and
barriers, and to recommend steps to transition promising technology to full commercial
operation. The broader goal is to collaborate with Political Action Committee (PAC) member
organizations and other stakeholders to expand the applications of synchronized measurements
and related technologies by transmission owners and independent system operators throughout
the WECC to yield reliability, congestion management and other market related benefits for
California electric customers.

3
Project Objectives
This study was undertaken with three primary objectives:
Evaluate if there is business justification for investing in deploying the PMU technology
in California/WECC through assessment of benefits of various applications for
Electricity Consumers, Transmission Owners, and other market participants and
identify present implementation gaps for those applications.
Develop a flight plan/roadmap for the deployment of PMU applications in the near‐term
(1‐3 years), mid‐term (3‐5 years), and longer‐term (5‐10 years) and gain support for that
plan from stakeholder groups at state, regional, and national levels.
Develop business case guidelines that provide methodology of how to approach
evaluation of comprehensive benefits and costs of various PMU applications and gain
support from certain stakeholder groups for the methodology.
In support of these objectives, KEMA has performed a comprehensive study and analysis to
determine the current state of the art of various PMU applications, potential new PMU
applications, the potential infrastructure costs and gaps, and the expected benefits for use of the
applications in grid operations. As a part of business case guidelines, the study generated
quantitative examples of business benefits for selected applications based on concrete utility
data, primarily for illustrative purposes, but also to help draw general conclusions and
recommendations.
Project Outcomes
This study emphasizes that synchronized measurements are the next generation of paradigm‐
shift technology, enabling improvements in planning, operating, and maintaining the electrical
grid that would otherwise not be possible. This study has identified a large number of existing
and potential applications (either already deployed or under development) of the synchronized
measurement technology. Additionally, the study has uncovered that major financial benefits
may potentially be realized in using PMUs in market operations, such as more accurate
Locational Marginal Pricing (LMP)‐based clearing price calculations and improved congestion
management through accurate detection of transfer capabilities. Some new applications have
also been identified (such as real‐time system model adjustment for fault location calculations
and monitoring phase unbalance with State Estimation [SE] applications). Details are given in
Appendices B and E. It is concluded that as this technology is deployed and applied and as
users gain experience and comfort, new applications will continue to be identified.
Although there are a huge number of potential applications, this study has identified two key
application categories that benefit from the synchronized measurement technology:
Analysis and avoidance of outages that have extreme manifestations in blackouts
Recent increase in blackouts (usually low‐probability, high‐impact events) has
created questions as to the vulnerability, capacity, and operational management
of the power grid.

4
PMU technology is a paradigm shift that enables the higher levels of reliability
improvement required for outage/blackout prevention.
PMU applications improve early warning systems to detect conditions that lead
to catastrophic events, help with restoration, and improve the quality of data for
event analysis.
Market and system operations
Congestion mitigation through better system margin management is facilitated
through PMU applications
PMU applications allow real time knowledge of actual system conditions as
opposed to conditions defined by system models that may not reflect current
conditions
State estimation solutions can be improved significantly for use in locational
marginal pricing calculations thereby improving overall accuracy of calculations
and associated energy clearing charges
In addition to this general analysis, very detailed analysis of key individual applications
resulted in the following outcome:
Applications that either have a major improvement impact with PMUs or cannot be
implemented without PMUs: Angle/Frequency Monitoring and Visualization, Post‐
mortem Analysis, Model Benchmarking, Outage Prevention (including Planned Power
System Separation), State Measurement and Real‐time Control. For other applications,
non‐PMU technologies are available; however, the deployment of PMUs allows the
same measurements to be used to realize additional benefits from the same investment.
“Low‐hanging fruit” applications – those opportunities for which needs are immediate,
PMUs are required, infrastructure requirements are relatively modest, and products are
available. These applications are angle/frequency monitoring and visualization, and
post‐mortem analysis (including compliance monitoring).
State Estimation Improvement – conventional SE improvement or evolutionary
improvement, boundary conditions SE, and State Measurement or revolutionary
application development ‐ Revolutionary solution is actually a natural extension of the
evolutionary approach as numbers of PMUs installed continues to increase locally and
regionally. Use of PMUs for representing boundary conditions will stem from system‐
wide regional deployment. (Section 3.2.2 provides detailed analysis of State Estimation
applications.)
The results above have served as a base to develop a near‐, mid‐, and long term development
and deployment roadmap. This roadmap and the process to transition PMU technology to full
commercial application in California/WECC are key outcomes of the study that should help
California/WECC and the overall industry benefit from the PMU technology. As results are
based on the interview process with key stakeholders, this roadmap could serve as a base for
deployment of individual user deployment roadmaps and could guide the vendors to prioritize

5
their development focusing on “low‐hanging fruit” deployment applications and system
components.
Conclusions
This independent study concludes that PMU applications offer large reliability and financial
benefits for customers/society and the California/WECC electrical grid if implemented across
the interconnected grid. Therefore, it provides motivation for regulators to support deployment
of this technology and its’ applications. PMU technology is instrumental in improving early
warning systems, System Integrity Protection Scheme (SIPS), detecting and analyzing thermal
limits; and angular, voltage, and small signal stability; faster system restoration (including
natural disasters), post‐disturbance data analysis, etc. For some of those applications (such as
data analysis, angular stability warning), PMUs offer means and benefits not possible with any
other technology. In addition, individual utilities could realize financial benefits if several
integrated applications are deployed using basic PMU system infrastructure. The above
conclusions have been achieved through comprehensive analysis of various applications and
related benefits, concrete data on PMU system related costs and financial benefits obtained
through interviews, and industry experience with PMU implementation.
It is the conclusion of this study that phasor measurement capability is advanced
technologically to the point that commercial implementation of selected applications is both
possible and warranted, representing prudent investment. Further, the implementation and use
of this capability is necessary for the levels of grid operational management that are required
for efficient use of the infrastructure currently in place as well as for infrastructure
enhancements of the future. To gain the benefits offered by this technology, a coordinated effort
among utilities, the California (CAISO) System Operator and California/WECC must be
undertaken, with a coordination level beyond the present disparate activities. Without a
system‐wide approach, the capabilities and associated benefits will not be achieved in the
manner possible. This requires an effort that includes a bottom‐up approach from utilities in
defining the needs and PMU applications and a top‐down approach from the system operators
and coordinators to define an integrated infrastructure to optimize the benefits offered by the
technology.
There is a need for vendors to fully productize applications presently in an RD&D phase and to
develop new, promising applications. Vendors need both common system and common
application requirements from users to be able to justify investments in new products.
Regulators at both federal and state levels need to provide incentives for technology
deployment, particularly considering significant benefits for rate‐payers and transmission
system reliability. Also, North American Electric Reliability Council electric reliability
organization (NERC ERO) should facilitate required data exchange and need to facilitate certain
system wide deployment levels required to achieve key application benefits, such as “low‐
hanging fruit” applications.

6
Recommendations and Key Success Factors
Although working prototypes are proven for some applications and can be implemented with
relatively small efforts, the lack of commercialization of the technology inhibits full‐scale
implementations. Operational and business processes and models have not been developed in
most companies to address all the issues associated with the implementation of this technology
and therefore, the move to operational status is restricted. Further, additional focus on a system
infrastructure (e.g. at the Independent System Operator or Regional Coordinating Council level)
to guide implementation in a consistent and coordinated manner should facilitate wider
investment in and deployment of the technology.
To gain the benefits offered by this technology to the US Western grid and the overall industry,
a coordinated effort among utilities, the CAISO and WECC must be undertaken. The following
process is proposed to the industry to speed up and minimize costs of deployment.
Each PMU user in the grid should develop a near‐, mid‐, and long‐term application and
technology deployment roadmap. This roadmap would include application
requirements that would guide PMU installations and system architecture needs locally
and regionally.
NERC ERO and/or WECC should champion required data exchange and the
development of the overall system infrastructure. Based on individual user
requirements, it is necessary to develop system architecture design, specification, and
deployment plan. All users connecting to the overall architecture would need to fulfill
key integration requirements (hardware/software interoperability, data quality, etc). It is
also beneficial to prioritize applications from the grid perspective.
Develop uniform requirements and protocols for data collection, communications, and
security through standards (NERC, IEEE, WECC, Eastern Interconnect Phasor Project
[EIPP]). Engage vendors in standard development and provide clear requirements for
both accepted system architecture and industry application priorities.
Provide adequate economic regulation and incentives that will justify deployment
(requires support by the regulators).
Each user should set up operational and business processes for installations, operations,
maintenance, and benefits sharing. This would comprise of creating projects with
defined deliverables and deadlines; identifying asset owner, manager, and service
provider; setting up procedures and rules; educating and training users; and facilitating
culture change.
Continue investing in RD&D (DOE, PIER, vendors, users, etc.) and promote developing
and sharing test cases to develop new applications. Continue using a proven approach
of pilot projects to gain experience and confidence.
Only by having all the stakeholders contributing, will this promising technology fulfill its’
potential for achieving financial and reliability benefits. Those benefits will be accomplished by
significant market penetration of this technology that is dependent on vendors developing
required products. A commitment from key stakeholders (e.g. PAC, regulators) on the extent of

7
planned PMU system implementation, including providing common application and
architecture needs and requirements, should be communicated to the vendors, so they could
create their product roadmaps, minimizing high development costs associated with customized
developments. Vendor roadmaps would guide development of key applications and system
components that are planned to be implemented by the larger number of users to enable the
expected return on investment.
As a large number of applications are in an initial development stage and there are potential
new applications, it is necessary to continue investing in RD&D (DOE, PIER, vendors, users,
etc.) A research and development roadmap by NERC/EIPP/ Consortium for Electric Reliability Technology Solutions (CERTS) and a deployment roadmap from this study are important to
provide structured and consistent directions that would focus efforts, avoid unnecessary
duplication, and optimize RD&D investments. The very successful practice of joint pilot projects
needs to continue.
Benefits to California
This study has provided particular focus on California/WECC needs and requirements.
Deployment of PMU technology among California utilities could provide cost‐effective
solutions to solve or minimize some of the problems faced by the California/WECC grid users.
The WECC power grid is spread across a large territory with significant power transfers over
long lines. The grid faces congestion issues and is vulnerable to stability and inter‐area
oscillation problems. California/WECC has implemented automated System Integrity Protection
Schemes (SIPS) designed to act during major disturbances and reduce the burden on the
operators.
The PMU technology can provide solutions to aid with the California needs, such as more
accurate and comprehensive planning and operations tools, better congestion tracking,
visualization and advanced warning systems, information sharing over a wide region,
improvements to SIPS, grid restorations, and other operational improvement that will result
from experience with basic applications. The overall benefit can be characterized as a more
reliable, efficient, cost‐effective California/WECC grid operation resulting from better
information and the ability to manage the grid dynamically, as opposed to reactive
management in the face of unusual, and potentially catastrophic, events.

8

9
1.0 Introduction World‐wide disturbances and congestion have emphasized a need for a grid to be enhanced
with wide area monitoring, protection, and control (WAMPAC) systems as a cost‐effective
solution to improve system planning, operation, maintenance, and energy trading.
Synchronized Measurement technology and applications are an important element and enabler
of WAMPAC.
The Department of Energy (DOE) report to Congress (Steps to Establish a Real‐Time Transmission
Monitoring System for Transmission Owners and Operators within the eastern and Western
Interconnection, February 2006) finds that:
Technology currently exists that could be used to establish a real‐time transmission
monitoring system to improve the reliability of the nation’s bulk power system; and
Emerging technologies hold the promise of greatly enhancing transmission system
integrity and operator situational awareness, thereby reducing the possibility of regional
and inter‐regional blackouts.
The Western Electricity Coordinating Council (WECC) has been an industry leader in realizing
the potential of the Phasor Measurement Unit (PMU) technology and developing first industry
prototypes and applications. The first research‐grade demonstration of phasor technologies
was undertaken by DOE/Electric Power Research Institute (EPRI)/Bonneville Power
Administration (BPA)/Western Area Power Administration (WAPA) in the early 1990s. The
system was effectively used to investigate causes of the major 1996 west coast blackouts. DOE
has continued to support outreach for these technologies, and has provided technical support to
the WECC committees that rely on these data for off‐line and model validation reliability
studies. The Public Interest Energy Research (PIER) program supported research, development,
and prototype‐testing of a real‐time dynamic monitoring system (RTDMS) workstation for
offline analysis by California Independent System Operator (CAISO) staff in 2002. From 2003
through 2005, PIER supported the deployment of a real‐time phasor data analysis, voltage and
dynamic stability assessment, and data visualization applications to monitor grid actual
conditions, using wide‐area phasor data from BPA, Pacific Gas and Electric (PG&E), Southern
California Edison (SCE), and (WAPA). These power companies have deployed PMUs in their
systems, already realizing some benefits of phasors, particularly for near real‐time disturbance
analysis and modeling validation. BPA, PG&E, SCE, and Sempra continue to develop new
applications to fully utilize benefits of the PMU technology and all have projects (in conjunction
with DOE and PIER funding) on PMU applications planned for 2007. For example, SCE and
BPA have maintained a long‐standing research, development and deployment (RD&D)
programs on PMUs as a tool for real‐time monitoring and control. This effort has shown the
potential of this technology to positively impact grid stability, outage avoidance and congestion
management. One example of a direct benefit is SCE’s Power Systems Outlook software, which
is currently being used for post‐disturbance analysis and will demonstrate its real‐time display
capabilities in the first quarter of 2007.

10
Recently, some large‐scale phasor measurement deployment projects have been initiated, such
as the Eastern Interconnection Phasor Project (EIPP) supported by DOE, and the Brazilian
Phasor Measurement System led by ONS (the Brazilian ISO). EIPP will be transition to North
American Electric Reliability Council electric reliability organization (NERC ERO) in 2007.
As an early‐on business case study, while quite approximate given the large number and
immaturity of PMU technology applications and its market, can provide useful insights to the
expected commercial success, and the societal and rate‐payer value, of research efforts in the
deployment and applications of PMUs. This study also identifies policy, economic and financial
barriers to commercial deployment, and technology gaps. It can also provide information to
help develop technology transfer strategies and educate potential users and policy developers
for increased adoption of these technologies.
The broader goal of this project is to collaborate with Policy Advisory Committee (PAC)‐
member organizations and other stakeholders to expand the applications of phasor‐
measurement and related data analysis, operator diagnostic and actionable information
visualization technologies by transmission owners and independent system operators (ISO)
across the California/WECC grid leading to reliability, congestion management and other
market related benefits for the California electric customers. Potential economic benefits could
include avoiding major system disturbances and blackouts, which can cost consumers several
billion dollars per major incident, reducing congestion costs estimated to be approximately $250
million per year in California and reducing cost and time to analyze power system events, and
providing means for quicker restorations following major grid outages.
Time synchronization is not a new concept or a new application in power systems. As
technology advances, the time frame of synchronized information has been steadily reduced
from minutes, to seconds, milliseconds, and now microseconds. At present, PMUs are the most
comprehensive time‐synchronized technology available to power engineers and system
operators for wide‐area applications. This technology has been made possible by advancements
in computer and processing technologies and availability of Global Positioning System (GPS)
signals. We are rapidly approaching an era where all metering devices will be time‐
synchronized with high precision and accurate time tags as part of any measurement.
To achieve the potential benefits, advancements in time synchronization must be matched by
advancements in other areas. One example is data communications, where communication
channels have become faster and more reliable in streaming PMU data from remote sites to a
central facility. Improvements in instrument transformers (such as optical transducers) are
important for the quality of the signals supplied to the PMU. A third area is in developing
applications, i.e., software that operates on the data provided by the PMUs. Although academia,
vendors, utilities, and consultants have developed a large number of methods and algorithms
and performed system analysis and studies to apply the technology, like any other advanced
tool, PMUs are good only in the hands of trained users. For example, one of the proposed
applications of PMUs is their use on control for monitoring, alarm, and control operations. The
technology exists today to bring the PMU information into the control centers and present it to
the operators in a graphical format.

11
A number of vendors are either offering or developing components, platforms, and applications
for a Phasor measurement system. Technology components and platforms (such as PMUs, Data
Concentrators, Data Acquisition systems, Communication Systems, Energy Management
System (EMS)/Supervisory Control And Data Acquisition (SCADA), Market Operations
Systems, etc.) required to implement and benefit from the synchronized measurement
applications are already available. While a number of applications based on phasor data have
already been developed, there is a need for vendors to either fully productize applications
presently in an RD&D phase or to develop new promising applications. As a number of these
applications are new, with business benefits not yet clearly defined, vendors need both system
and application requirements from utilities to be able to justify investments in new products.
This study reviews in detail the issues of technology, implementation gaps, and potential
benefits as discussed above. Specifically the objectives of this study are to:
Evaluate if there is business justification for investing in deploying the PMU technology
in California/WECC through assessment of benefits of various applications for
Electricity Consumers, Transmission Owners, and other market participants and
identify present implementation gaps for those applications.
Develop a flight plan/roadmap for the deployment of PMU applications in the near‐term
(1‐3 years), mid‐term (3‐5 years), and longer‐term (5‐10 years) and gain support for that
plan from stakeholder groups at state, regional, and national levels.
Develop business case guidelines that provide methodology of how to approach
evaluation of comprehensive benefits and costs of various PMU applications and gain
support from certain stakeholder groups for the methodology.
It is intended that results of this study help various stakeholders (utilities, system operators,
regulators, and vendors) with next steps in supporting, deploying, and developing PMU
systems and applications. The overall deployment roadmap should help prioritize applications
for deployment (short to long term), based on their benefits to the users, addressing cost of
deployment and technology advancements.
Implementation of phasor measurement technology requires investment and commitment by
regulators, utilities and system operators to install both individual devices and for
implementation on a grid level. The necessary investments include: studies, equipment
purchase and upgrade, maintenance, resource allocation and training. For utilities and system
operators to make a step toward system‐wide implementation of phasor measurement
technology they need to be supported by the regulators, WECC, and NERC. It is also required
to identify major requirements for the overall system and select major applications that would
benefit both the individual systems and the interconnected grid.

12

13
2.0 Project Approach The approach taken by KEMA in conduct of this study has been to assemble a team of leading
experts in the field of phasor measurements; to locate, study, and understand the current body
of knowledge on the subject; and, with the assistance of representatives from utility companies
and other interested organizations, review the current state of the industry in terms of working
prototypes and full scale applications, as well as identify future research and deployment plans.
The team included some of the leading researchers in the field of phasor measurements from
technical universities that are regarded as the most active and most advanced in the field. The
participation by these representatives provided the project team with knowledge of the latest
developments and an understanding of the outstanding issues to be addressed in further
development of PMU applications. In addition to the resources from universities, DOE has
supported a Pacifica Northwest National Laboratory (PNNL) expert that has evaluated and
summarized California/WECC Phasor Based Projects (Appendix A). The study also included
research into the various vendor offerings in the field at the present time.
The work process associated with this project began with an extensive literature search of the
current research and applications of phasor measurement technology. An extensive library of
technical papers, articles, and other literature was created and used by the project content
experts in developing the applications reports found in detail in Appendix B of this project
report.
Collaboration with industry representatives that are currently deploying PMU technology was
an integral part of the project process. Interviews and workshops with California utilities that
have deployed PMU technology were conducted as input to this study. Also multiple
interviews and workshops with participants in the DOE sponsored Eastern Interconnect Phasor
Project (EIPP) were conducted. The workshops and interviews also included representatives
from organizations such as NERC and other regional and regulatory agencies, as well as
vendors. A Business Case Evaluation Matrix (Appendix C) was used to collect information on
industry needs, map importance of PMU to help with those needs, qualify investments
required, and identify development/deployment status of individual applications. In addition,
anecdotal benefits to illustrate some practical experiences by people interviewed have been
listed in Appendix D.
In addition to the technical applications research, this study has focused on developing
guidelines to build a business case for the PMU technology. This work has generated
quantitative examples (Appendix E), primarily for illustrative purposes, but also to help draw
general conclusions and recommendations. Significant focus was put on investigating the
market operations aspects of phasor technology. Specifically, research was conducted on grid
congestion and the resulting financial impacts, financial market responses to major outage
events, locational marginal pricing models, operation of the Southern California Import
Transmission (SCIT), and other issues. This work was done to confirm how PMU applications
may offer benefits to market operations through better quality data on grid conditions resulting
in more efficient and cost effective market operations.

14
The above effort resulted in reaching conclusion and recommendations and creating the
roadmap for commercial deployment of the technology.
Finally, an integral part of the project process has been the presentation and discussion of the
project with the Policy Advisory Committee members, utility executives, and other leading
stakeholders in California. These periodic meetings and interviews have provided valuable
feedback on the project process and status and provided the project team with direction for the
overall project.

15
3.0 Project Outcomes
3.1. Key Overall Benefits Synchronized measurements are the next generation of paradigm‐shift technology, enabling
improvements in planning, operating, and maintaining the electrical grid that would otherwise
not be possible. This study has identified a large number of existing and potential applications
(either already deployed or under development) of the synchronized measurement technology.
It is concluded that as this technology is deployed and applied and as users gain experience and
comfort, new applications will continue to be identified.
It is expected that synchronizing measurement with high accuracy and using these
measurements for various applications will become a part of the standard system planning and
operations. If proper measures are taken (including an adequate investment mechanism) to
achieve the benefits identified in this study, the expectations are that market penetration of this
technology will grow rapidly.
Although a huge number of applications are expected in grid operations, this study has
identified two key categories of applications that could benefit from the technology:
Analysis and avoidance of outages, with extreme manifestations in blackouts
Market and system operations
Both categories above share common application modules using a PMU system. For example, a
PMU application module to detect angular instability condition and margins using angular
stability analysis is beneficial for both avoiding outages and improving market operations (e.g.
better congestion management); improvements in State Estimation would benefit both
preventing disturbance propagation and more accurate locational marginal pricing.
3.1.1. Avoidance of outages
Recent wide‐area electrical blackouts have raised many questions about the specifics of such
events and the vulnerability of interconnected power systems. Historically, after each
widespread cascading failure in the past 40 years, the power industry has focused attention on
the need to understand the complex phenomena associated with blackouts. For example, major
reliability improvements have been made after major blackouts events in the US in 1965, 1977,
and 1996. Within the last two years, as the power systems are again pushed closer to the limits,
the number and size of wide‐area outages has increased, affecting more than 150 million
customers worldwide.
Although large‐scale blackouts are still very low probability events, they carry immense costs
and consequences for customers and society in general as well as for power companies. It is
easy to misjudge the risk of such extreme cases. The high costs of extensive mitigation strategies
(e.g. building new transmission lines), combined with inaccurate probabilistic assessments
(“blackouts will not happen in my system”), have led to inadequate risk management practices,

16
including not focusing on cost‐effective prevention and mitigation initiatives. Such initiatives
can provide value through avoidance of huge blackout costs.
There are two stakeholders that benefit from outage/blackout avoidance:
The society/rate‐payers, whose benefits can be quantified using methods that estimate
the cost of blackout on the society and the economy (as described in Appendix E,
Business‐case study examples). Those costs are enormous. For example, society costs for
August 14, 2003 blackout in the US and Canada and for August 2006 WECC blackout
were estimated at $6B and $1B, respectively.
The utility company, whose benefits arise from avoiding cost of litigation, cost of service
restoration, undelivered energy, and the negative impact on stock price and on valuable
management time.
Utility stock price is affected by a blackout, although this impact may be temporary. In general,
stock price is based on three factors: expected profits, expected profit growth, and perceived
risk. With regard to risk for utilities, perhaps the most important aspect is regulatory risk since
regulators ultimately determine the maximum profit that a utility is allowed to make.
Blackouts, and a utility’s response to blackouts, can materially alter perceptions of regulatory
risk, and can significantly affect share price. Table 1a shows an example of stock movement
after the August 14, 2003 blackout, showing the loss for the utilities involved in the blackout. A
few days after the blackout, the stock price of First Energy slid further, by another 9.3%,
although it recovered in few months.
Utilities Involved in the Blackout
Utility Day
Before
Day
After Change
First Energy 29.35 28.84 -1.74%
AEP 29.35 28.84 -1.74%
Con Ed 23.49 23.27 -0.94%
Detroit Edison 32.15 31.99 -0.50%
National Grid 29.92 29.53 -1.30%
Average 1.24% Loss
Table 1a. Utility stock price after the August 14, 2003 blackout for utilities involved in the blackout.
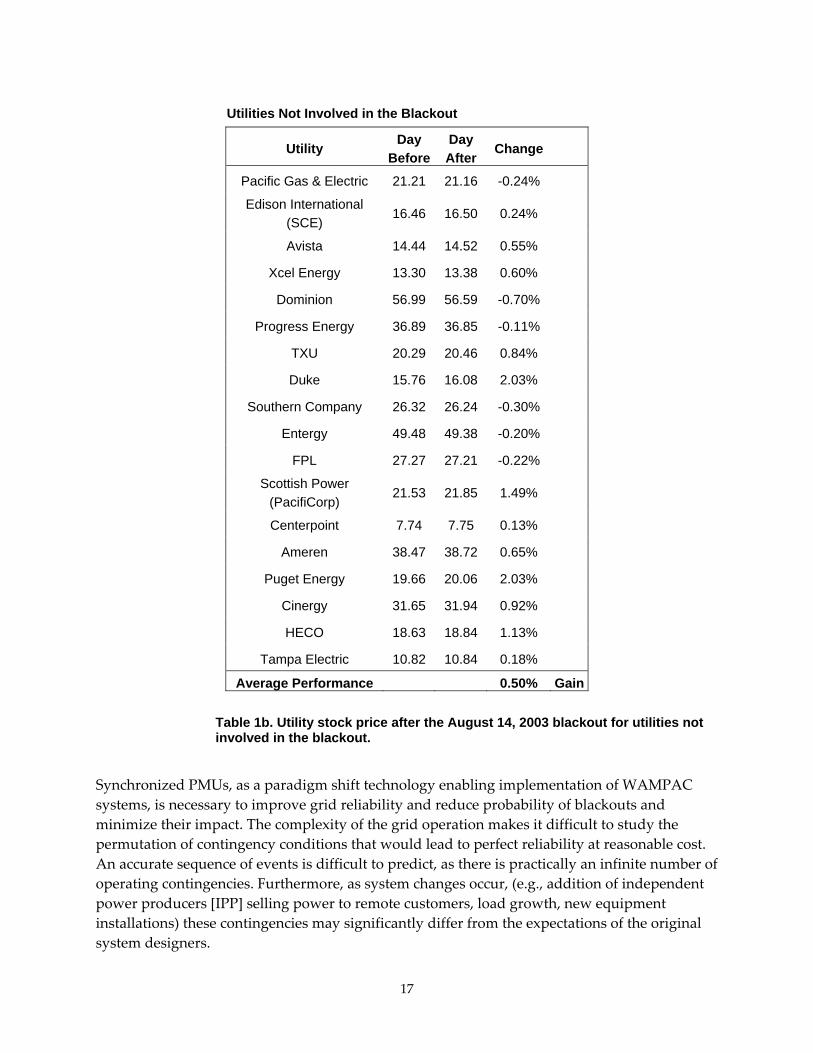
For utilities not involved in the blackout, stock price movement for the same days followed a
more typical daily pattern of gains and losses with an overall average gain of 0.5%, as detailed
in Table 1b.
17
Utilities Not Involved in the Blackout
Utility Day
Before
Day
After Change
Pacific Gas & Electric 21.21 21.16 -0.24%
Edison International
(SCE) 16.46 16.50 0.24%
Avista 14.44 14.52 0.55%
Xcel Energy 13.30 13.38 0.60%
Dominion 56.99 56.59 -0.70%
Progress Energy 36.89 36.85 -0.11%
TXU 20.29 20.46 0.84%
Duke 15.76 16.08 2.03%
Southern Company 26.32 26.24 -0.30%
Entergy 49.48 49.38 -0.20%
FPL 27.27 27.21 -0.22%
Scottish Power
(PacifiCorp) 21.53 21.85 1.49%
Centerpoint 7.74 7.75 0.13%
Ameren 38.47 38.72 0.65%
Puget Energy 19.66 20.06 2.03%
Cinergy 31.65 31.94 0.92%
HECO 18.63 18.84 1.13%
Tampa Electric 10.82 10.84 0.18%
Average Performance 0.50% Gain
Table 1b. Utility stock price after the August 14, 2003 blackout for utilities not involved in the blackout.
Synchronized PMUs, as a paradigm shift technology enabling implementation of WAMPAC
systems, is necessary to improve grid reliability and reduce probability of blackouts and
minimize their impact. The complexity of the grid operation makes it difficult to study the
permutation of contingency conditions that would lead to perfect reliability at reasonable cost.
An accurate sequence of events is difficult to predict, as there is practically an infinite number of
operating contingencies. Furthermore, as system changes occur, (e.g., addition of independent
power producers [IPP] selling power to remote customers, load growth, new equipment
installations) these contingencies may significantly differ from the expectations of the original
system designers.

18
PMU technology is instrumental in improving early warning systems, System Integrity
Protection Scheme (SIPS), detecting and analyzing thermal limits and angular, voltage, and
small signal stability, faster system restoration (including natural disasters), post‐disturbance
data analysis, etc. For some of those applications (such as data analysis, angular stability
warning), PMUs offer means and benefits not possible with any other technology.
3.1.2. Market and system operations and planning
Lack of investments in transmission infrastructure in last couple of decades has resulted in
significant congestion costs. In the case of CAISO, congestion costs exceeded 250 MUSD in 2005.
For day‐to‐day congestion management, actual flow on a line is compared to a Nominal
Transfer Capability (NTC) based on thermal limitations, voltage limitations, or stability
limitations. The assumptions used in offline NTC calculations may lead to unused transfer
capability and lost opportunity costs in the dispatch process. The extent that excessive margins
contributed to the total congestion costs is unknown. Congestion relief occurs through the
ability to use actual transfer limits instead of conservative limits imposed due to angle and
voltage constraints. PMU technology has been identified as either necessary (e.g. stability
limitations) or beneficial (e.g. thermal and voltage limitations) in addressing this issue.
The intent is not to reduce transfer capability margins, but to accurately identify what dynamic,
real‐time margins are and act accordingly. If those margins are higher than margins calculated
based on off‐line analysis, there is a possibility to utilize them and, consequently, reduce
congestion and associated costs. If it is found that the margins are less than calculated, the
congestion costs would go up, but system reliability would be enhanced and potential outages
prevented (see the previous section on avoidance of outages).
This study has uncovered a new area where PMUs could provide major benefits, improving
accuracy of Locational Marginal Pricing (LMP). Although LMP is not currently part of the
CAISO market model, it is expected to play a key role in the CAISO’s pending market
redesign.1 The cost of energy injections and deliveries at each bus in the CAISO controlled grid
will be set by an LMP equal to the sum of the marginal energy bid price, congestion costs and
losses. For the purpose of Day Ahead (DA) markets and Hour Ahead (HA) markets, nodal
prices will be calculated using offline power‐flow cases. However, in the Real Time (RT)
market, LMP calculations will use results of State Estimation (SE) runs performed each 5
minutes. These cases will then be used to calculate the marginal congestion costs and losses for
each bus, which will be added to the marginal energy bid price to determine the real‐time LMP
at each node. This calculated value will be used for settlement with all providers and loads at
each bus. Therefore, any error or noise in the SE solution will result in incorrect prices to
customers and invalid price signals to the market. Implementing SE algorithms that include
PMUs can improve the quality of the SE solution. Even slight improvements in SE accuracy
could affect CAISO’s marginal loss calculations and congestion cost calculations performed for
calculating LMP in real‐time. With approximately $14 billion in energy charges clearing the
1 CAISO is proposing to implement its market redesign or “MRTU” in 2007, subject to FERC approval.

19
CAISO market each year, even a 0.5% improvement in LMP accuracy could have a $70 million
impact on settlement costs each year.
Besides the use of PMUs to augment the inputs to the State Estimator and thus improve its
output, PMUs can help in providing more accurate parameters for the grid model. The LMP
Calculator can therefore calculate the actual LMPs as opposed to the estimated LMPs that come
from using assumed values for the key system parameters. The difference in actual LMPs and
SE‐based LMPs can be significant and warrant its own investigation.
3.1.3. Overall Benefits for Industry and California/WECC
In conclusion, poorly recognized dynamic constraints can endanger reliability and
unnecessarily narrow operating limits and prevent optimal energy transactions, resulting in lost
revenues. Deployment of a PMU system for better congestion and disturbance tracking,
visualization, information sharing over a wide region, and protection and control in real time is
essential to manage the grid more reliably and cost‐effectively on a day‐to‐day basis, as well as
in emergencies.
The WECC power grid, including California, is spread across a large territory with significant
power transfers over long lines. The grid faces congestion issues and is vulnerable to stability
and inter‐area oscillation problems. These issues resulted in major blackouts in 1996 with
further effect of de‐rating of the power lines with ensuing financial losses to the grid users.
California/WECC has initiated extensive measures to counteract those problems, such as
extensively implementing automated Power System Protection Schemes (PSPS) designed to act
during major disturbances and reduce the burden on the operators.
Deployment of PMU technology could provide cost‐effective solutions to solve or minimize
some of the problems faced by the California/WECC grid users by helping provide more
accurate and comprehensive planning and operations tools, better congestion tracking,
visualization and advanced warning systems, information sharing over a wide region,
improvements to special protection schemes, etc. Some example benefits have been
experienced by SCE, PG&E, and BPA even with a limited deployment of the technology.
3.2. Application Benefits A goal of this study has been to analyze major applications to provide independent and
objective analysis of business and reliability benefits of the PMU technology for various
stakeholders with a major goal to help industry transition to full commercial operation. This
study has evaluated state‐of‐the‐art research, development and initial deployment of numerous
existing and potential PMU applications grouped in 10 major categories. Although this study
has tried to provide a comprehensive analysis of all major applications, as the applications area
has not fully matured, some applications or variations of identified applications are not fully
covered in the study. In addition, as PMU systems are becoming more widely deployed by
utilities, it is expected that new applications will continue to be identified. The study has also
identified some new applications and benefits, such as more accurate LMP calculations,
monitoring phase unbalance with SE applications, and real‐time system model adjustment for
fault location calculations. (Details are given in Appendices B and E.)

20
Various challenges related to deployment of applications have been addressed, such as:
System architecture and data exchange needs
Integration of PMU functionality in intelligent electronic devices (IEDs)
Number and optimal location of PMUs
A large number of software applications benefit from time‐synchronized data. Once the
adequate PMU system is built, incremental costs of adding applications are minimal in
comparison to the added value achieved. In addition, some of the major benefits of PMU
application result from the system‐wide applications (e.g. avoiding major blackouts) that
require PMUs to be installed and connected across utility boundaries. For some applications
(e.g. angular separation alarming on a situational awareness dashboard), benefits to an
individual entity (e.g. utility) are achieved only by having system‐wide information. As a result
of the above, a well‐planned, system‐wide PMU deployment, implementing optimal system
architecture, is necessary to take a full advantage of the technology.
System architecture needs to be designed, specified, and implemented to serve present and
future application needs for the whole grid. These are not easy tasks as requirements from a
large number of applications, as well as a large number of users, need to be considered.
Challenges with system architecture (including issues with integrated IEDs) are described in
Section 3.6, while recommendations on a process are described in Section 4.1
(Recommendations and Key Success Factors).
The challenge related to determining the optimal locations for equipment is to support the
broadest number of applications and uses. The marginal difference in data from one area of the
grid to another as it relates to specific applications and potential problems must be evaluated to
determine the required number and location of PMUs to support the intended use. This
requires development of an application deployment roadmap to guide deployment needs.
In general, for the reasons above, to transfer the PMU technology from RD&D to production, it
is necessary for each user to create an application deployment roadmap that will guide PMU
installations and system architecture needs. The following sections in this chapter represent a
summary of 10 major application areas with focus on benefits and implementation gaps. More
detailed description of each area is in Appendix B.
3.2.1. Real Time Monitoring & Control
Description: This application of phasor measurement technology facilitates the dynamic, real‐
time capture of system operating conditions. This information, provided to the system operator,
allows for increased operational efficiency under normal system conditions and allows the
operator to anticipate, detect and correct problems during abnormal system conditions.
Compared to current EMS monitoring software that uses information from state estimation and
SCADA over several second intervals, time‐synchronized PMUs introduce the possibility of
directly measuring the system state instead of estimating it based on system models and
telemetry data. As measurements are reported 20‐60 times per second, PMUs are well‐suited to
track grid dynamics in real time.

21
Phasor measurement technology is the only known technology that can offer real time
monitoring application and benefit in three specific areas:
Angular separation analysis and alarming – enables operators to assess stress on the
grid. Measurement of phase angle separation allows early identification of potential
problems both locally and regionally.
Monitoring of long‐duration, low frequency, inter‐area oscillations – accurate
knowledge of inter‐area oscillations allows operators to adopt a power transfer limit
higher than the limit currently in use.
Monitoring and control of voltage stability – provides for a backup to EMS voltage
stability capability.
Each of these three areas offer potential benefits and although each may not be ready for
commercial implementation, the phased implementation of the capabilities of real time
monitoring is feasible and provides for immediate harvesting of low‐hanging fruit. Direct
benefits to the utility are possible through these applications as outlined below.
Benefits and Status: Real time information of angular separation informs operators that they
face imminent problems in their area and also provides the information to neighboring areas.
This capability would have provided early indication of problems in northern Ohio in 2003.
Additionally, angular separation data allows for correction of conservative planning
assumptions or operating limits developed from planning studies or off‐line operational
studies. The continuous monitoring and analysis of real time conditions facilitates operation of
transmission corridors closer to their real stability limits without sacrificing confidence levels
for secure operation. This directly impacts operating capacity and perhaps allows for deferment
of upgrades or new facilities.
The detection and analysis of inter‐area oscillation modes provides the capability to improve
existing dynamic system models. In turn, increased confidence in system studies allows for
optimization of system stabilizers and potentially the coordination of damping controllers with
neighboring utilities. Net benefit again, as with angular separation, is the capability to increase
operating limits and reduce congestion.
Monitoring and control of voltage stability offers benefits in the areas of congestion
management and blackout prevention. Knowledge of actual voltage stability facilitates the
transfer of more MW in a given corridor. The ability to prevent blackouts requires detailed
system studies that use both dynamic and static analysis techniques. The system dynamics are
not adequately tracked with currently available monitoring devices but can be captured with
PMU technology.
There are varying degrees of commercial use of these monitoring capabilities. Experimental
implementation of wide area monitoring has been accomplished in the US, Asia, Europe and
Mexico. In the US, implementations in New York, Florida, Georgia and California have
provided data for validation of models and further development of monitoring systems. The
current Eastern Interconnection Phasor Project (EIPP) of the DOE continues to grow in

22
participation and interest with the Tennessee Valley Authority (TVA) having developed an
experimental monitoring system.
Beneficiaries of this application area are primarily: Rate‐payers, Utilities, ISOs, neighbors,
Implementation Gaps and Costs: There is a huge difference in requirements for real time
monitoring and real time control. As communication and data requirements for real time
control are very demanding, initial deployment should focus on real time monitoring to gain
experience and acceptance.
Two primary issues currently restricting wider implementation and use of PMU technology for
real time monitoring in the control centers are availability of commercial computational tools
and established process to use this information (including the studies required for optimal
location of PMUs and training and cultural change). A gap exists between observing an
oscillation (and alerting the operator) and translating it into a to‐do‐list for the operator. In an
industry where reliability of operation is one of the most important criteria, skills and trust are
developed through experience. Implementation of PMUs for monitoring applications requires a
training program that includes clear explanations, real case studies, and carefully planned
scenarios that will help the engineers and operators not only understand the technology but to
trust the information it provides. For example, information that a critical angle is changing fast
may only help an operator if clear procedures on actions required are provided. Generally,
there is a lack of actionable information provided by existing software applications. Performing
studies to determine the area of a particular network where the greatest issues of stability or
congestion exist is not a difficult issue to overcome as the capability exists currently to do this.
The current data communications and processing capabilities also restricts wider
implementation and use of PMU technology for real time monitoring. Data communications
from the PMU to the user interface requires robust data concentration, management, and
transfer capability that in many cases does not exist commercially today. While the basic data
processing technology is available, the hardware and software to support data collected,
processed and transferred for these applications is still considered developmental.
In general, vendors are not advancing rapidly in this area due to lack of immediate market
applications. Users, on the other hand, are not pushing the vendors forward until some
prototypes are proven.
A number of other less critical issues exist from one application to another and, in most cases,
are specific to those applications. None of these issues are in any way insurmountable for real
time monitoring as the knowledge and technology to overcome them exists today.
3.2.2. State Estimation
Description State Estimation, a statistical analysis to determine a “best” possible
representation of the system state based on imperfect telemetered data, is widely used in
transmission control centers and ISO operations today to supplement directly telemetered real
time measurements in monitoring the grid; to provide a means of monitoring network
conditions which are not directly telemetered; and to provide a valid best estimate of a

23
consistent network model which can be used as a starting point for real time applications such
as contingency analysis, constrained re‐dispatch, volt VAR optimization, and congestion
management. State estimation has a number of ancillary applications with varying degrees of
successful utilization in the industry such as bad data detection, parameter estimation, status
estimation, and external model. State Estimation implementations typically execute at
periodicities from 10 seconds to 10 minutes.
The inclusion of PMUs in SE algorithms is numerically/algorithmically relatively easy. A
number of researchers have developed algorithmic refinements around the bad data detection
and parameter estimation application of PMUs. PMUs have been included in at least one
successful SE deployment (New York Power Authority [NPA]) and a number of pilot
installations are in progress. A pilot project between TVA, Entergy, PG&E, and Manitoba
Hydro, with interest from SCE and BPA is under way. San Diego Gas and Electric (SDG&E) is
pursuing a similar project.
There are three complementary approaches in using PMU technology with SE:
“Evolutionary” solution, with improvements achieved by adding phasor measurements
to existing SE measurement set and applying ‘meter placement’ methods to determine
most beneficial PMU locations.
“Revolutionary” (next generation SCADA), State Measurement solution with all PMU
measurements provided. This approach would require massive PMU deployment (30% ‐
50% of buses), but would allow much more frequent calculations and would be a
foundation for “closed loop” control.
“Equivalent” solution to use PMUs is for ISO/Regional Transmission Operator state
estimator applications to help represent “boundary conditions” for the utility state
estimators.
In fact, the “revolutionary” solution will be a natural extension of the evolutionary approach as
the number of PMUs installed continues to increase.
Benefits Phasor measurements can benefit state estimators in several ways. First, another
input measurement is available. This may or may not improve redundancy depending upon
whether the PMU is deriving its phase angle from the same current and potential transformers
as are used for measuring MW and MVAR, but probably improves redundancy in some sense.
More importantly, the direct measurement of a state variable (phase angle) will improve
algorithmic stability and convergence. In the case where sufficient PMUs are available to
provide network visibility on their own (revolutionary approach), a linear estimator can be
developed which is not iterative and a very high speed estimator becomes a possibility. The
accuracy of the estimated line flows as compared to measured line flows will be affected
dramatically by the accuracy of the PMUs.
The availability of PMUs in state estimation will no doubt enhance the ability of the estimator to
detect bad data, if only by adding to redundancy. One related benefit may be to make the
detection of topology errors more realistic.

24
Beyond the direct benefits to the state estimation, there are potential benefits to analytic
applications which depend upon state estimation results. One notable example is congestion
analysis and congestion costs in an ISO framework with nodal pricing. The congestion cost
depends upon day ahead bids and scheduling as determined by network optimization and
dispatch. That analysis depends upon operating limits for the various transmission facilities. If
more accurate state estimation could be used to operate transmission closer to real limits,
congestion costs could be reduced at the margin. Estimates of the improvement are in the range
of 1‐2% of congestion cost.
Finally, a PMU derived SE opens the door to have a three phase or a three sequence state
estimator. This possibility has not been discussed in the literature. The potential benefits of
such an estimator could be to monitor phase unbalance – which could be symptomatic of
grounding or equipment degradation.
Beneficiaries of this application area are primarily: Utilities, ISOs, and rate‐payers
Implementation Gaps and Costs Adding PMU data to the state estimation problem is
straightforward mathematically and not complicated from a software perspective. Bringing
PMU data back to the control center for the purpose requires either a data link to the PMU
master or a way of getting the PMU data directly into the SCADA system – which would
require an analog output from the PMU going into a Remote Terminal Unit (RTU), or
preferably, the ability for the SCADA system to read the PMU directly via a data concentrator –
possible for more modern SCADA systems but difficult for older (5 yrs +) ones.
The downstream benefits of having slightly more accurate/reliable state estimation in other
applications does not require any modifications to those algorithms but would require
modification of operating practices to use less conservative limits.
Given the existence of PMUs and their availability to the control center, the cost is negligible.
The cost of a data link from the control center to a PMU master is also negligible.
3.2.3. Real Time Congestion Management
Description: This application of phasor measurement technology facilitates the ability to
maintain real‐time flows across transmission lines and paths within reliable transfer capabilities
through dispatch adjustments in a least‐cost manner.
PMUs provide additional, synchronized, highly accurate system meter data that offer
significant benefit through improved calculation of path limits and path flows. The higher scan
rate and precision of PMU data will enhance computation of Real‐time Transfer Capability
(RTC), which in many cases will exceed the NTC (Nominal Transfer Capability) for the same
path. PMU technology can also improve real‐time congestion management through providing a
more accurate state estimator solution of the real‐time flow on a line or path.
The extent excessive margins contribute to congestion is unknown at this time; however, in 2005
the CAISO congestion costs exceeded 250 MUSD. Assuming only a small percentage of this cost
is attributable to conservative margins that could be better managed with PMU capability
results in an ongoing financial benefit of significance. In some cases, it may be identified that

25
margins were too optimistic. Although, congestion costs could increase as a result, accurate
margins would improve reliability and prevent outages.
Benefits: Improvement in real time congestion management would benefit all stakeholders in
the transmission grid, e.g., utilities, ISO, regional operations. Society at large also benefits
through improved power flow and reliability even in times of maximum load and power
transfer. For example, in August 2005, CAISO experienced a Pacific DC Intertie outage that
required curtailment of 950 MW of firm load for 40 minutes (633 MWh) plus 860 MW of non‐
firm or interruptible load for 77 minutes (1,047 MWh). The curtailments were required to
balance loads and mitigate congestion. Data from PMU tools on the potentially congested paths
in such a case could reduce the need for such curtailments by providing operators with real‐
time data on the capacity of the system to move energy across specific paths.
Also, at a minimum, information from PMU tools would provide for verification of NTCs and
support decisions on investment in additional capacity or in remedial measures.
Beneficiaries of this application area are primarily: Rate‐payers, Utilities, ISOs, Power
Producers.
Implementation Gaps and Costs The major issue is that no commercial grade applications
for real‐time congestion management currently exist. Development and testing of PMU based
real‐time rating applications have been conducted in a limited manner. A particularly
promising field test has been conducted on a voltage stability constrained corridor between
Norway and Sweden.
Also, there is competition for this solution from other methodologies. Voltage/stability limits
can be addressed through the use of fast pattern matching techniques to calculate limitations
based on off‐line studies. This method, while an improvement over the less dynamic techniques
in use today, ultimately depends on the off‐line studies developed for a given range of
conditions that may or may not accurately represent actual system conditions. Only PMU‐based
methodologies will adapt to the existing system state regardless of whether or not that state has
been previously envisioned and simulated in off‐line studies. Further, there exist today a
number of non‐PMU applications to determine the real‐time rating of thermally limited paths
and one vendor offers a PMU based application for this use.
Costs of PMU technology for congestion management are estimated to be relatively low,
approximately $100K per control center, once certain pre‐requisites are in place. These include
adequate system visibility through RTU and PMU hardware placement and incorporation of
basic PMU measurements into the EMS/SE.
There are other issues of implementation for PMU based congestion management. The level of
uncertainty regarding the number and concentration of PMUs required to achieve the desired
level of improvement in state estimator solutions and on‐line rating calculations is a primary
challenge. Further, the length of time that will be needed for the power industry to adopt PMU
based real‐time calculations of transfer limits on congested paths is unknown and a major

26
variable in attempting to quantify benefits. The cultural issue of operator acceptance must also
be addressed through demonstrated accuracy and reliability of equipment and applications.
California/WECC should seek additional targeted opportunities to improve congestion
management through PMU based applications, particularly on those paths where power
deliveries are limited by voltage or stability constraints. In such cases it may be possible to
improve the real‐time congestion management process by the two‐fold combination of (1)
improved path flow calculations, and (2) increases in path ratings through real‐time rating
algorithms utilizing PMU inputs.
3.2.4. Benchmarking; System Model Validation & Fine-Tuning
Description: The goal of model verification and Parameter Estimation (PE) is to identify
questionable power system modeling data parameters (network, generator, load models, etc.)
and calculate improved estimates for such quantities.
In general, automated means are not available to build power system models. Therefore, model
building tends to be labor intensive, subject to engineering judgment and human error.
Furthermore, once an error enters the modeling database it is difficult to identify and may go
undetected for years.
The implementation of phasor measurement based tools, methods and applications offer a
means of improving models. By providing precise, time synchronized measurements from
various nodes in a power system, PMU deployment provides new opportunities for identifying
errors in system modeling data and for fine‐tuning power system models utilized throughout
the industry for both on‐line and off‐line applications (power flow, stability, short circuit, OPF,
security assessment, congestion management, modal frequency response, etc.). Synchronized
phasor measurements can be used to enhance the performance of Parameter Estimation (PE)
algorithms currently incorporated into commercial EMS applications and to find and correct
steady state modeling errors, e.g. impedances, admittances and tap data. In Europe, a
commercial application of PMUs currently computes transmission line impedance.
Use of phasor measurement for benchmarking and fine‐tuning dynamic and oscillatory
modeling parameters is more complex and less advanced than for steady‐state models. A
variety of Wide Area Measurement system (WAMS) applications are under development using
phasor measurements that may prove useful for model benchmarking and tuning of dynamic
models. For example, Southern California Edison has dynamic and oscillatory mode analysis
software capability in its Power System Outlook program to compare real‐time measurements
with simulated events. PNNL also has capabilities to analyze modal oscillations and compare
simulated events with measurements.
Benefits: Model validation is one the primary utility benefit from phasor measurements. For
example, actual measured nodal phasor values can be used to replace simulated values, thereby
enhancing the performance of Parameter Estimation algorithms. This in turn improves the
network model as the PE algorithm identifies errors in the models. In short, better and more
precise data in gives better data out.

27
Validation of dynamic models is also facilitated by PMU recorded information. The best
validation procedure for dynamic system models is through the recording of dynamic events by
PMUs. The recorded events can then be compared to the response of the model for similar
events and ultimately, the model parameters can be changed until it replicates the actual
response recorded by the PMUs. Finally, fault locations can be more correctly identified
through the PMU line impedance computation. The improvement in fault location allows for
improvement in diagnosis and restoration of faults.
Beneficiaries of this application area are primarily: Utilities and ISOs.
Implementation Gaps and Costs; Implementation issues for PMUs for model validation and
benchmarking fall into two categories: steady state applications and dynamic model
applications. For application to steady state models, phasor measurement technology would be
a secondary use and benefit of a network of PMUs deployed for another primary use such as
congestion management or real‐time monitoring. In this context, the incremental issues are
minimal, as are the costs. This is based on the assumption that the Parameter Estimation
application is supported by the EMS in use in the area. Significantly higher costs would be
incurred if this were not the case.
Applications using PMU technology for benchmarking of dynamic and oscillatory modes of
system response need to be further developed and could take significant investments to move
beyond RD&D. The potential benefits are large, especially if major forced outages could be
avoided through model improvements.
The implementation of PMU based Parameter Estimation faces several gaps for widespread use.
Lack of a systematic approach: The industry needs to develop a systematized approach
for deploying PMUs for model validation and parameter estimation
Need for commercial applications: Algorithms and methods that integrate PMU
measurements into parameter estimation need to be commercially available.
Need for additional field experience: Actual field data need to be available for model
development and parameter estimation.
Organizational issues: The confidence of system operators in the software tools and
models is extremely important in taking decisive actions to operate the system during
unusual events. Detailed PMU data used to validate and correct state estimator
modeling errors can enhance operator confidence.
3.2.5. Post Disturbance Analysis
Description: The goal of a post‐mortem or post‐disturbance analysis is to reconstruct the
sequence of events after a power system disturbance has occurred. The application of phasor
measurements to this process offers potential benefit in the high degree of time synchronization
that is available through the PMUs. Post disturbance analysis typically involves a team of
engineers collecting and studying data from multiple recorders that are dispersed throughout
the grid. The data recorders that have been in use in the industry for many years are not time‐

28
synchronized and therefore make the job of reconstructing the timeline of a disturbance a time
consuming and difficult task.
Recently, Global Positioning System (GPS) technology has been used as a universal time source
for various types of data loggers, including PMUs. The blackouts in the US and Italy in 2003
were a major factor in the recommendation by authorities, such as NERC and DOE in the U.S.
and Union for the Co‐ordination of Transmission of Electricty (UCTE) in Europe, to deploy GPS
capable devices. As more GPS time synchronization capability is deployed, utilities are finding
that post disturbance analysis time can be reduced significantly.
The Northeast blackout of August 2003 was studied without the benefit of time‐synchronized
data. Over 800 events occurred during this blackout, most of them in the cascading failures
between 16:06 and 16:12 EDT. The magnitude of data from a four‐minute period without
synchronization reference proved to be a daunting reconstruction task for the investigators. A
finding of the task force investigating the events was the realization that the analysis could have
been much easier and faster with wider use of synchronized data recording devices. The
analysis required 3 people spending 70% of their time on average for about 10 months. With the
help of PMUs, the same analysis would take only 1 month with 3 people working full time.
WECC is making extensive use of post disturbance analysis. Data for various significant events
is stored from various utilities and analyzed. Better tools are needed for post‐disturbance
analysis, however.
Use of PMUs for post‐disturbance data collection and analysis does not have the same technical
requirements as real‐time applications; however, PMU installations for real‐time data streaming
can also be used for post‐disturbance analysis.
Benefits: Based on the lessons learned from major blackouts, the primary benefit from having
GPS synchronized data recording is to reduce the time spent on analyzing vast amounts of data.
The time reduction can be from months to days or even hours depending on the volume of data.
Some utilities currently using time synchronized data report that for more common events, such
as transmission line faults, the time spent on sorting through events is virtually eliminated as
the data is already synchronized.
Real‐time data monitoring through PMUs, as outlined under that heading, provides the data
record required for post‐disturbance analysis but also provides the opportunity of observing
system dynamics prior to events occurring. For post‐disturbance analysis there is the additional
benefit of having data from the period immediately before the event that may provide helpful
clues in the event analysis. This in addition to the capability of recognizing, through real‐time
data, the potential for disturbance and the possibility of taking actions to avoid an event.
For disturbances that occur more frequently than a grid blackout, such as transmission faults,
some utilities have reported that investing in a GPS‐synced data‐recording system is
worthwhile:

29
“Before the [time synchronization system], we spent one to two hours every day rearranging
the sequence of events. We can now perform disturbance diagnosis without spending any time
on sorting through the events.
“If we save two hours on fault diagnosis time, that’s two hours less time our customers have to
go without power.”2
As the ability to synchronize data very accurately is not possible without PMU technology,
accurate analysis of some fast, dynamic events may not even be possible without PMUs.
All the above benefits become even more pronounced with NERC and regulatory compliance
monitoring requirements. Ability to document and analyze disturbances and quickly respond
to public inquiries has both tangible and intangible benefits.
Beneficiaries of this application area are primarily: Utilities, Regulators, ISOs.
Implementation Gaps and Costs: The cost and complexity of installing PMUs for post‐
disturbance analysis is low. This is because this application of PMU technology does not require
real‐time data streaming and the associated communications infrastructure. Data can be stored
in substation computers for retrieval as needed. Examples are the logging devices in use in
Europe since 1998. These devices are GPS time‐synchronized and are read remotely. Data from
these devices were used to analyze the 2003 Italian blackout.
Other devices are currently available to perform time‐synchronized data recording of system
disturbances. They include digital fault recorders, dynamic swing recorders, and sequence of
event recorders. In some cases these types of recorders may be more effective than PMUs. The
overall benefit of PMUs, however, is in the capability to compress and store large amounts of
data over longer time periods and the ability of PMUs to capture trending events that occur
over long periods of time. The other recorders are usually triggered by events and therefore
miss the system data immediately preceding an event. Data loggers have improved in size, cost,
data resolution and storage making their use more economically feasible than in the past. GPS
time synchronization can also be achieved with data loggers although not to the same accuracy
as with PMUs.
The primary barrier to widespread implementation of PMUs for post‐disturbance analysis is the
development of supporting software to further streamline the data analysis after events. While
not a necessity, the increasing amount of data collected and stored through technology leads to
a higher need for automated tools to process data. This need is not unique to PMUs, however,
phasor measurement capability at this time somewhat exceeds the industry ability to manage
the data.
2 “Southwest Transmission Power Implements GPS Time Source to Synchronize Substations,” T&D
World, January 2006.

30
3.2.6. Power System Restoration
Description: Standard operating procedures at most utilities define the steps to be followed for
system restoration after an event. These procedures are generally based on some standard set of
system conditions and associated operating parameters, which may or may not exist at the time
of the incident. The dynamic nature of the power system, particularly following outage or
unusual events, creates the risk that the conditions on which the operating procedures are based
may not exist at the time restoration efforts are undertaken. PMU measurements, therefore, can
provide a valuable input into the decision processes, as the measurements are real‐time
quantities that give the operators current information on system status.
One of the potential applications is an extension of the real‐time monitoring and control
application in that phase angle measurement is a primary parameter used in power system
restoration procedures. During power restoration, system operators often encounter an
excessive standing phase angle (SPA) difference across a breaker, which connects adjacent
substations. By using the PMUs to monitor such a phase angle directly, the operators can make
proper decision about when to close the circuit breaker without damaging equipment or risking
grid stability. In addition to risk mitigation in the restoration process, PMUs can also help
reduce the time needed for system restoration.
Benefits: The primary benefit of PMU technology in power system restoration is the ability to
provide operators with real‐time information about the phase angles in relevant parts of the
grid. This information helps the operator with critical decisions about timing, sequences, and
feasibility of prospective restoration actions. In that respect, phasor measurement technology
can expedite restoration and reduce the blackout time.
PMUs can also provide thermal monitoring of a tie‐line thereby giving operators information on
how long the tie‐line can be relied upon in the restoration process before other actions may be
required. Similarly, interconnection of distributed generation can be monitored to ensure that
the DG unit(s) can safely be brought on line.
PMUs are currently in service for this application in some locations. An often cited example is
the installation of PMUs following the Italy 2003 blackout. Review of the sequence of events
showed that phase angle information was not known when operators were attempting to
restore the initial line outage. Significant time was lost in attempts to restore the line ultimately
resulting in overloads on other lines, which in turn tripped and caused the Italian system to
blackout. Analysis showed the phase angle settings of the synchro‐check relay were being
exceeded, information that PMU measurement would have given the operators.
Beneficiaries of this application area are primarily: Rate‐payers, Utilities, ISOs, Power Producers
Implementation Gaps and Costs: Phase angle monitoring is a commercial application of
PMUs that is currently available. The issues associated with implementation of the application
are cost, data communications and display of data on existing operator consoles. As outlined in
the real‐time monitoring summary, data communications can be an issue for large, integrated
applications but is not considered a problem for phase angle monitoring.

31
Another issue to be considered is commercial competition for this application. Synchro‐check
relays are considered a competing technology as they have the capability to monitor phase
angles and frequency and voltage on either side of an open circuit breaker. The preset
parameters of the relay will determine if it is acceptable to close the breaker under the measured
conditions. While adequate for this application, these relays are considered to be single‐purpose
devices and therefore quite limited in scope and usage when compared to PMUs.
This example highlights one of the challenges for implementation of PMUs in general and
specifically for this application. Operators must be well trained and become confident with the
equipment and information they would receive from phasor measurements. New technology
providing new information is a circumstance that will take an adjustment period to become
fully utilized and for benefits to be fully realized.
Protection and Control Applications for DG
Description: Growth of distributed generation (DG) and microgrid projects is expected to
continue and to increase as more legislative action mandating renewable portfolios occurs. The
pricing trends, opening of the competition in the electricity retail business, and convenience of
having generation resources close to load centers will drive further proliferation of DG
technologies. Distributed generation creates challenges for utilities it interconnects with in
terms of protection, control, monitoring and safety.
While providing many benefits in enabling local access to generation, improving (potentially)
reliability and providing some of the ancillary services such as frequency responsive spinning
reserve, local voltage regulation, sag support with energy storage, power leveling and peak
shaving, congestion management, and power flow control, distributed generation has not yet
evolved to the point where transmission networks are with respect to large scale utility
generation. Potential problems of interconnection with utility grids include, among other
things, forced islanding of the DG in case of disconnection from the main source of supply and
coordination of protection. Development of standards for interconnection is progressing slowly
due to a number of issues, including the sheer number of parties that are taking active roles in
the process.
Interconnection standards are also inhibited by the wide variety of DG designs and
technologies. Issues include, but are not limited to, system impacts and analysis, DG
penetration levels, safety, operation, reliability, various liabilities, allowing fully autonomous
remote operation, and integration of control and protective relaying functions. The strongest
support PMUs could provide in such an environment would be in control and protection.
The issue of “islanding” is of primary concern to utilities because of the inherent safety and
operational problems an islanded DG system could create. Islanding of a DG system occurs
when a section of the utility system is isolated from the main utility voltage source, but the DG
continues to energize that section. A number of both passive and active control schemes have
been devised over time to detect islanding. Utilities, standards‐making bodies, and power
conditioning system manufacturers have a common interest in determining the method that
detects islanding most reliably.

32
An additional consideration is that the evolution of DG and increased proliferation is likely to
create desirability for allowing islanding. Such action would promote a single DG or a group of
DGs to operate in a multibus microgrid structure, where many of the functions and
requirements of the transmission networks, would also be needed and where PMU monitoring
and information infrastructure may be beneficial.
Proper operation of a microgrid requires high performance power flow and voltage regulation
algorithms both in grid‐connected and islanded modes. PMU technology seems very promising
in monitoring DG and microgrids in both modes. However, low‐cost design will be needed for
broad market penetration.
Benefits: PMU technology for DG applications has potential benefits for utilities connected
to DG sources, owner/operators of DG, and ultimately to all consumers through better
integrated use of DG. Benefits fall into the areas of:
Control: PMU technology can provide the foundation for solving technical difficulties associated
with the monitoring and control of a significant number of microsources.
Operation and investment: The multiple DG sources that may exist behind a single utility
interface in a microgrid can be optimally coordinated through real‐time state information from
PMU technology. The dynamic coordination of microgrid sources can be used for volt/var
support, congestion management, loss reduction and other operating needs.
Power quality/reliability: Increase in reliability can be achieved if DG is allowed to operate
autonomously during transient conditions, especially when the source of disturbances is
upstream in the grid. PMU facilitated coordination can allow a microgrid to continue to operate
in island mode until the utility grid disturbance is resolved. Likelihood of complete blackout
conditions is thereby substantially lessened.
Beneficiaries of this application area are primarily: Independent Power Producers, Utilities,
Regulators.
Implementation Gaps and Costs: The number of DG designs, installations and interconnections
with utilities creates a large variable in the design of PMUs for DG operations. As PMUs and
the associated applications are presently being designed for transmission network operations, it
is likely that the same designs will not be adequate for microgrid operations. Different models
and applications will need to be developed for large scale, low‐cost implementation in the DG
market.
As the cost of interconnection protection and control can represent as much as 50% of the total
DG project cost, a cost competitive PMU solution will have high interest. Distributed generation
installations, especially small capacity systems, are extremely cost sensitive operations that do
not enjoy the economies of scale of larger generation systems. With the current state of the
industry in applying PMUs to transmission networks being in its’ infancy, it is unlikely that
PMU technology for DG applications will be developed with any urgency.

33
The benefits of this application can be realized as proven through some field trials. A prototype
system has been proven capable of detecting islanding conditions with as little as 1% power
imbalance. Traditional frequency based systems typically require 4% imbalance or more for
detection. The desire of many regulatory jurisdictions to increase the amount of DG in a utility
portfolio will be a primary driver in the development of PMU technology for this market.
3.2.7. Overload Monitoring and Dynamic Rating
Description: Standard loadings on many overhead transmission lines in the US are based on
conservative criteria to avoid overloads. Easy‐to‐use, cost‐effective technology to enable real‐
time monitoring and dynamic rating of transmission lines has a major potential to avoid
overloads and optimally utilize transmission lines. Line capacity is limited by performance of
the conductor at high temperature and by safety standards that specify the minimum ground
clearances. The use of PMUs can offer some degree of monitoring at a high time resolution.
Although PMU‐based systems for overload monitoring and dynamic rating cannot match the
features offered by existing equipment monitoring systems, an advantage is in that the same
PMUs can be used for other purposes.
There is a commercially available application based on PMUs for the monitoring of overhead
lines. With PMUs at both the ends of a line, the resulting measurements allow calculating the
impedance of the line in real time. The direct use of this is to estimate the average temperature
over the length of the conductor. This method, however, does not provide information about
hotspots, conductor sags or critical spans.
PMUs are well‐suited, and commercial applications exist, for measuring impedance of a
transmission line. One vendor takes this concept one step further by observing the resistance of
the line connecting the substations in real time. The line resistance can change due to ambient
and loading conditions. Knowing the characteristics of the conductor, an estimate of the
conductor temperature can be made from the line resistance. The line being monitored by the
pair of PMUs must have no line taps or substations in between. Another limitation is that the
output of the method represents the average temperature along the conductor length. The
advantage with the PMU‐based method for monitoring a line is its low cost, relative ease of
installation and use for other purposes. For example, the line impedance generated as a by‐
product can improve the accuracy of fault‐locating algorithms.
Benefits: Line impedances are usually estimated based on line length, tower height, conductor
size and spacing. Their Ohmic values are rarely verified. The PMU technology allows tracking
the line impedance in real time, and thus helps improve any application (traditional as well as
new) that makes use of line‐impedance data.
For California, the benefits from overload monitoring and dynamic ratings of overhead
transmission lines have been analyzed in a PIER study. We recite some key figures here:
A 2‐5% increase in the power transfer capabilities of the existing grid
A 20‐30% improvement in the transmission efficiency of existing lines that are limited by
ground clearances

34
A 15‐25% reduction in the need for acquisition and construction of additional right‐of‐
way and the associated environmental impacts
Deferral of capital expenditures of $150‐200 million for the construction of new
transmission lines in the next 10 years
Long‐term or permanent deferral of capital expenditures of $70‐90 million per year for
reconductoring projects
Short‐term deferral of capital expenditures of $8‐12 million per year for reconductoring
projects.
While we do not expect a PMU‐based system for overhead line monitoring to deliver all the
quantified benefits listed above, we believe that the PMU technology can provide additional
inputs to the decision process related to transmission lines. For example, the transmission
owner installs specific devices such as Sagometer™ to monitor critical spans (details) and PMUs
at the two ends of the line to monitor the whole length (averages).
Beneficiaries of this application area are primarily: Rate‐payers, Utilities, ISOs.
Implementation Gaps and Costs: The cost of implementation is very modest as only a pair of
PMUs is needed for each line. The installation is similar to that for a relay at a substation, and
does not involve clamping or attaching devices on overhead spans or transmission tower.
There have been at least two known installations of PMUs for the purpose of overhead line
monitoring. A field comparison of several technologies has been done for a line in Switzerland
(This was the line that initially tripped and triggered the onset of the 2003 Italian blackout).
Even though these technologies seem to produce consistent results for a relatively low
temperature range, it is difficult to (a) have an absolute benchmark, and (b) translate the
temperature information into sags.
One issue that remains to be verified with the PMU‐based approach is the impact of
instrumentation errors on the results. This is especially true for short lines (30 miles or less)
where line resistances are already small to begin with. Even small errors in instrumentation
(voltage and current) may generate relatively large percentage error in the calculated resistance,
and thus the estimated conductor temperature.
The PMU‐based system for overhead line monitoring is still largely untested. The commercial
product, namely Line Thermal Monitoring from ABB, has been installed at two locations in
Europe. However, the output (which is merely conductor temperature) has not been used in
any decision‐making process.
Adaptive Protection
Description: Adaptive protection is a philosophy of protection design that provides for
adjustments in protection functions, automatically, as system conditions change. In short, the
protection scheme “adapts,” within defined parameters, to prevailing system conditions unlike
conventional protective systems that respond to faults or abnormal events in a fixed,
predetermined manner.

35
Digital relays have two important characteristics that make them vital to the adaptive relaying
concept. Their functions are determined through software and they have a communication
capability, which can be used to alter the software in response to higher‐level supervisory
software, under commands from a remote control center or in response to remote
measurements.
Though exact financial impact of adaptive protection using PMU measurement versus
traditional protection schemes is difficult to quantify and varies from scheme to scheme, some
of the benefits of adaptive protection using PMU measurement can be identified. Some
examples are improved reliability balance between security and dependability of a protection
scheme and better utilization of power generation, transmission and distribution equipment
capabilities.
The protection applications that are identified as best suited for use with PMUs are out‐of‐step
relays, adaptive line relays, adaptive security and dependability, adaptive reclosing, and fault
location. In each of these applications, introduction of PMU data offers either new functionality
or enhanced operation of existing relay functions.
Benefits: Some benefits resulting from adaptive protection are improved operations for the
utility including improved reliability of a protection scheme, and better utilization of power
generation, transmission, and distribution equipment.
Out‐of‐step relays: Actual angle measurements can be provided such that during a transient
swing, a fast and accurate determination can be made regarding breaker operation for stable or
unstable swings.
Adaptive line relays: The use of PMUs for other reasons provides incremental benefit in
improvement of line relaying. PMU line data provides information that will improve existing
relay solutions for certain primary protection issues associated with multi‐terminal lines, series
compensated lines, and parallel transmission lines to name a few.
Adaptive security and dependability: Phasor measurements can be used to determine when to alter
the security‐dependability balance in protection scheme. The redundant primary protection in
existing protection systems clears virtually all faults, with the expense of some false trips. As
false trips have been shown to contribute to large disturbances and allow cascading, an
adaptive scheme triggered by system stress, could alter the relaying logic to ensure that false
trips are avoided. This greatly reduces the possibility of cascading failures thereby increasing
system reliability.
Adaptive reclosing: Phasor measurements provide the necessary input to ensure that a breaker
recloses into only phase‐to‐ground or phase‐to‐phase faults and avoid reclosing into multi‐
phase faults.
Fault location: PMU technology allows tracking line impedance in real time, and thus helps
improve any fault locations application that makes use of line impedance data.
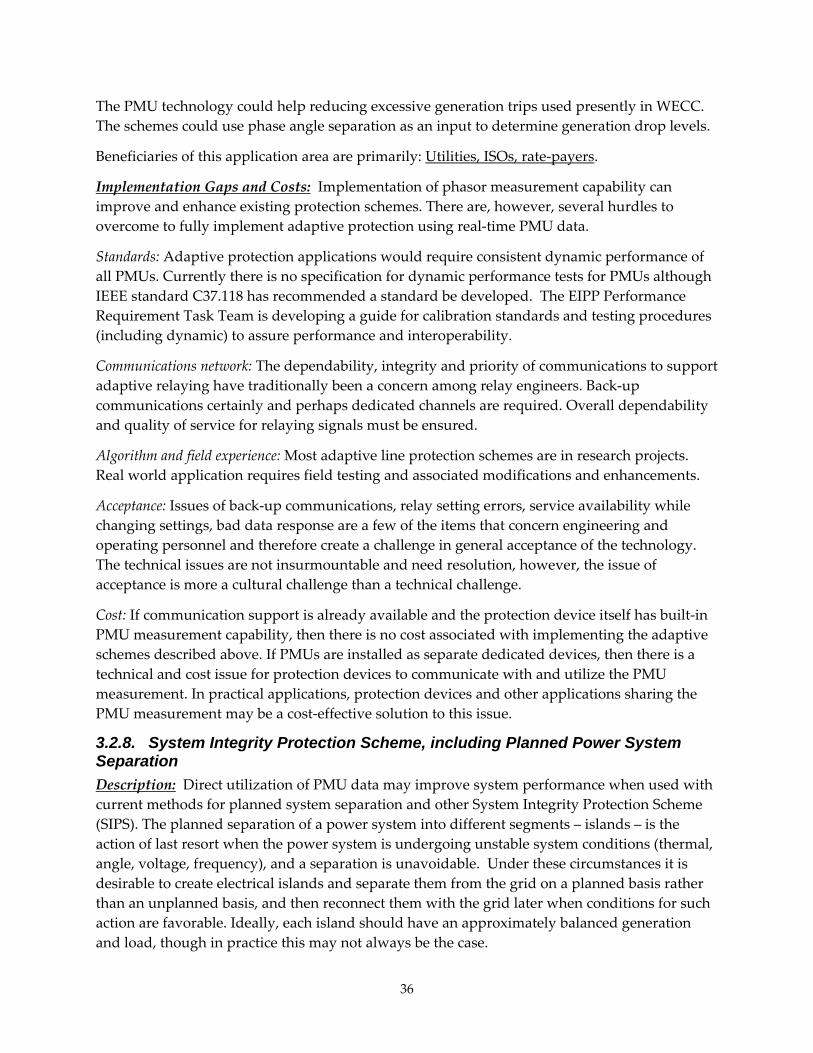
36
The PMU technology could help reducing excessive generation trips used presently in WECC.
The schemes could use phase angle separation as an input to determine generation drop levels.
Beneficiaries of this application area are primarily: Utilities, ISOs, rate‐payers.
Implementation Gaps and Costs: Implementation of phasor measurement capability can
improve and enhance existing protection schemes. There are, however, several hurdles to
overcome to fully implement adaptive protection using real‐time PMU data.
Standards: Adaptive protection applications would require consistent dynamic performance of
all PMUs. Currently there is no specification for dynamic performance tests for PMUs although
IEEE standard C37.118 has recommended a standard be developed. The EIPP Performance
Requirement Task Team is developing a guide for calibration standards and testing procedures
(including dynamic) to assure performance and interoperability.
Communications network: The dependability, integrity and priority of communications to support
adaptive relaying have traditionally been a concern among relay engineers. Back‐up
communications certainly and perhaps dedicated channels are required. Overall dependability
and quality of service for relaying signals must be ensured.
Algorithm and field experience: Most adaptive line protection schemes are in research projects.
Real world application requires field testing and associated modifications and enhancements.
Acceptance: Issues of back‐up communications, relay setting errors, service availability while
changing settings, bad data response are a few of the items that concern engineering and
operating personnel and therefore create a challenge in general acceptance of the technology.
The technical issues are not insurmountable and need resolution, however, the issue of
acceptance is more a cultural challenge than a technical challenge.
Cost: If communication support is already available and the protection device itself has built‐in
PMU measurement capability, then there is no cost associated with implementing the adaptive
schemes described above. If PMUs are installed as separate dedicated devices, then there is a
technical and cost issue for protection devices to communicate with and utilize the PMU
measurement. In practical applications, protection devices and other applications sharing the
PMU measurement may be a cost‐effective solution to this issue.
3.2.8. System Integrity Protection Scheme, including Planned Power System Separation
Description: Direct utilization of PMU data may improve system performance when used with
current methods for planned system separation and other System Integrity Protection Scheme
(SIPS). The planned separation of a power system into different segments – islands – is the
action of last resort when the power system is undergoing unstable system conditions (thermal,
angle, voltage, frequency), and a separation is unavoidable. Under these circumstances it is
desirable to create electrical islands and separate them from the grid on a planned basis rather
than an unplanned basis, and then reconnect them with the grid later when conditions for such
action are favorable. Ideally, each island should have an approximately balanced generation
and load, though in practice this may not always be the case.

37
System separation under these conditions is accomplished using System Integrity Protection
Scheme (SIPS) often called remedial action schemes (RAS) or if only the local angle is
considered, out‐of‐step relaying. These schemes are designed based on pre‐calculated system
behavior upon assumed state of the system: loading levels, topology, planned and unplanned
outages, etc. In many practical situations the prevailing system conditions are quite different
from those upon which the protection scheme settings are based. Consequently, the
performance of these systems may not be optimal for the existing system state.
The use of PMU measurements instead of pre‐calculated scenarios would improve a planned
system separation in two key areas: (1) whether a power system is heading to an unstable state
and among which groups of generators the loss of stability is imminent will be determined
more accurately with real‐time measurement, and (2) islanding boundaries could be determined
dynamically according to the prevailing system conditions.
The use of real‐time positive sequence voltage and current measurements provided by PMUs
offers for the first time the ability to take note of what is happening on the power system at any
moment, and by tracking the actual system behavior, determine if a planned separation of the
network is necessary to avoid a catastrophic failure.
The application of PMU measurements to perform planned system separation on systems
which are peninsular (such as Florida‐Georgia, or remote generators feeding a large power
system) has been shown to work quite well. However, when the power system is tightly
meshed – as is the case of the California/WECC network, no such real‐time applications have
been implemented. However, several research ideas have been discussed in the literature.
Benefits: Though exact financial impact of a successful planned system separation versus an
uncontrollable system disintegration (or a planned system separation with existing control and
protection schemes) after a large system disturbance is difficult to quantify and the results vary
from case to case, the major benefits of planned system separations using PMU measurement
are clear. These include minimizing lost revenues and reducing generator restarting cost for
utilities, and limiting the direct impact to customers.
The pay‐off of a completed and successfully implemented scheme in terms of fewer service
interruptions, and higher power transfer limits (where those were limited due to pre‐calculated
stability imposed conditions) would be substantially greater making the application well worth
pursuing.
Since a SIPS system using PMU measurement does not require extensive system studies to
determine upon which assumed system conditions that the system should initiate a system
separation, an added benefit is the saved manpower and time involved in such studies.
Beneficiaries of this application area are primarily: Rate‐payers, utilities, ISOs, power producers.
Implementation Gaps and Costs: The planned system separation using real‐time PMU
measurements and other SIPS hold the promise of greatly improved performance of such a
scheme. The choice of locations where PMUs must be placed is relatively simple. SIPS are well

38
entrenched in the California/WECC system, and have been accepted by the system operators.
Adding PMU measurement should still require extensive demonstration before it is accepted.
Implementation requirements depend on type and complexity of the scheme and the role of
PMU measurements. If PMU measurements are added to the existing SIPS to improve and
speed up instability detection, requirements are well within the scope of present technology.
However, requirements for implementing a very fast and accurate system‐wide separation
scheme are more demanding. The data must be communicated to a central location, where a
data concentrator and application processor must be located. In all likelihood the
communication must be handled by dedicated fiber optic channels so that data latency can be
limited to about 20‐50 milliseconds. The implementation of this system would call for hundreds
of PMUs to be installed with a need of a communication infrastructure to support the large
amount of real‐time PMU data transfer.
The implementation would need a central control system to support the system able to process
data from hundreds, and possibly thousands in the future, PMUs in real‐time and issue control
commands based on the real‐time detection/prediction of system instability. The analytical
development of the needed coherency detection algorithms and self‐sufficient island
identification algorithms still needs to be done. There are some research studies which have
reported on methods of achieving this objective, but they must be suitable for applying to the
California/WECC system in particular. In practical terms, the research and development of
algorithms needed has a very good chance of success.
Application of PMU in planned system separation requires consistent dynamic performance of
all PMUs. The new IEEE C37.118 standard has recommended but has not specified the required
dynamic performance tests for PMUs. This should be resolved for this application. The cost of
the project would be substantial – involving PMUs, some new communication facilities,
interfaces to trip and block logic in existing relaying schemes, and research on the new methods
of detecting instability.
3.3. Applications Roadmap Deployment of this technology typically involves a large number of entities (utilities in a
connected grid, ISOs, regional organizations, regulators). Each owner/operator is responsible
for a part of the system, and has their own interest for information. These systems need to
support a wide range of applications for their stakeholders, thus need to accommodate diverse
requirements of different applications. Deploying a system that engages multiple users with
diverse requirements, varying needs, and different perspectives is a major challenge and
requires a common perspective.
A challenge for this study, given that deployment needs depend on regional and individual
stakeholder (e.g. utility, ISO) requirements and existing infrastructure, that many applications
are still in the research and development stage, and that the individual deployment roadmaps
(applications and their requirement) are not fully developed, has been to provide a common
near, mid, long‐term deployment roadmap. Given the nature of PMU implementation requiring
broad user participation, this step is necessary to design and deploy the overall PMU system.

39
Based on an interview process with key stakeholders, this roadmap could serve as a base for
development of individual deployment roadmaps and guidance to the vendors to prioritize
their developments.
The roadmap presented here is related to technology deployment of the PMU system. It uses as
inputs the business needs of an application, the commercial availability and cost, and the
complexity with deploying the application.
To arrive at the roadmap, the project team follows the following steps:
Step 1: Conduct a critical review of PMU applications, summarizing the benefits, the
implementation gaps and costs for each application. This is reported in Appendix B,
Application Benefits
Step 2: Discuss results with utility PMU leaders and executives, to understand their
system‐specific needs and how each application can meet each of those needs. Vendors
are also contacted during this step. The document used in this step is the Business‐case
Evaluation Matrix.
Table C‐1 of Appendix C shows the template that was distributed to a number of utility
engineers and managers. The intention of this matrix is to gauge the business needs of
each application (regardless of the technology to be used), the role of the PMU to the
working of the application, the commercial status of the application, and whether a
business case has been built for the application. Participants of the survey can also
indicate whether the needs for the application are immediate or long term.
Individual survey returns are assembled to arrive at a consensus. Table C‐2 of Appendix
C shows the collective results from the survey.
Step 3: Use the results of the survey (Table C‐2, Appendix C) as a basis; correlate the
needs for each application with its commercial status and the complexity of its
deployment.
Figure 1 shows the summary on how the technology meets the needs of the industry. Firstly,
industry needs (critical, moderate, unknown) are identified regardless of technology. Secondly,
the value of the PMU technology, for each identified application, has been mapped related to
importance (necessary, offers additional benefit, requires more investigation) in serving
industry needs. Thirdly, deployment challenges (low, medium, high) have been mapped for
each application. The deployment challenges are defined based on technology (communications
and HW/SW requirements and development status) and applications status (commercially
available, pilot installation, in the research phase, not developed yet). Business case examples
(Section 3.4.4. and Appendix E), although intended primarily for illustrative purpose, have
provided data to create information in Figure 1.
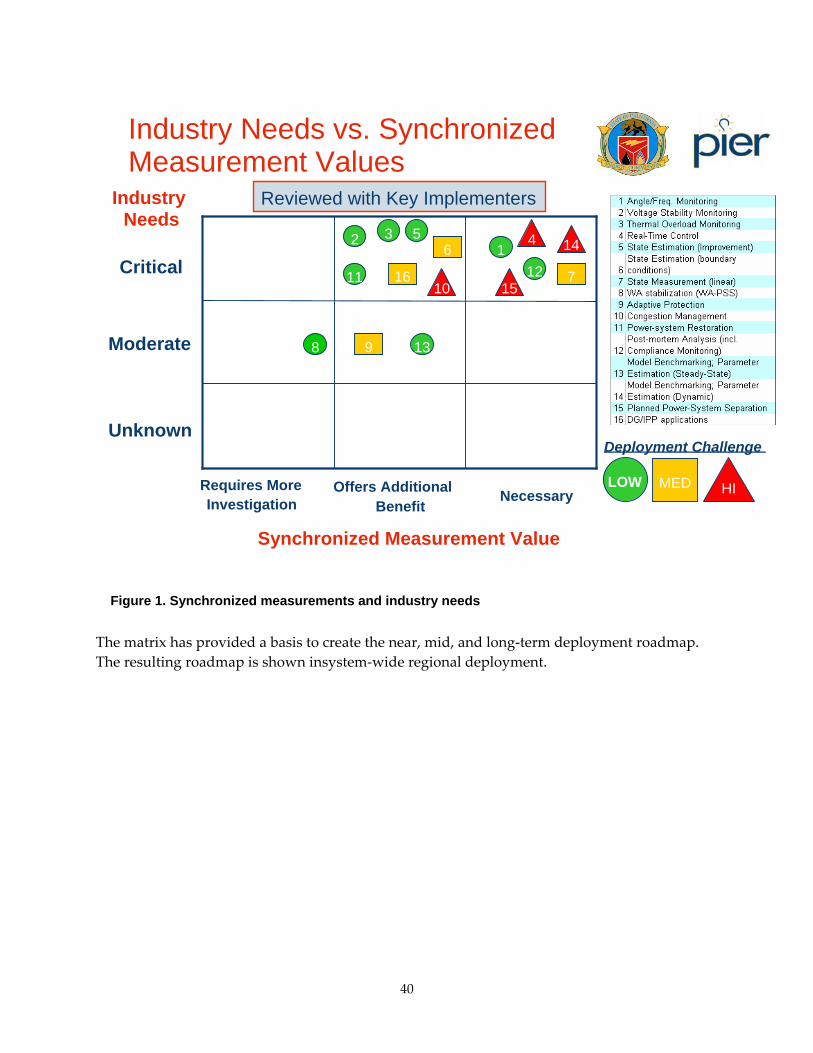
40
Figure 1. Synchronized measurements and industry needs
The matrix has provided a basis to create the near, mid, and long‐term deployment roadmap.
The resulting roadmap is shown insystem‐wide regional deployment.
Industry Needs vs. Synchronized Measurement Values
NecessaryOffers Additional
Benefit
Requires More Investigation
Critical
Industry Needs
Moderate
Unknown
Synchronized Measurement Value
12 3 5
8
1211
13
Deployment Challenge
LOW
Reviewed with Key Implementers
MED
9
16
6
7
HI
10
4 14
15

41
Figure 2, where the applications are grouped into near‐term (1‐3 years), medium‐term (3‐5
years) or long‐term (more than 5 years). This roadmap differs from the RD&D roadmap (e.g.,
from CERTS/EIPP, see Appendix B‐1) as it focuses on business and reliability needs to
commercialize and deploy PMU technology and applications.
The list of applications in Figure 1 and Figure 2 appears to be larger than the 10 groups
reviewed in Section 3.2. This is because some groups in Section 3.2 are broad and need to be
subdivided to address specific utility problems. For example, Real‐time Monitoring & Control is
subdivided into Angle/Frequency Monitoring, Voltage Stability Monitoring, Real‐time control
and Wide‐Area Stabilization.
Applications in the near‐term group reflect the reality that the needs are immediate, and the
applications are commercially available (either at present time, or will be soon offered by a
vendor based on the status of the working prototypes). They also reflect the fact that the
deployment can be achieved rather quickly due to factors such as the applications can be used
for specific spots on the grid, and the infrastructure requirements are relatively modest. These
applications can be termed “low‐hanging fruit”. The most obvious “low‐hanging fruit” for
which PMUs provide major benefits are angle/frequency monitoring and post‐mortem analysis
(including compliance monitoring).

42
Applications in the medium‐term group largely reflect that even though the needs are great, the
commercial prospect is still far off as no working prototypes are known to exist.
Applications in the long‐term group indicate a combination of distant commercial status,
extensive infrastructure requirements (and thus costs), and/or that lengthy field trials are
required to gain acceptance. (The Wide‐area Stabilization application, even though
commercially ready, remains to show its superiority to the conventional Power System
Stabilizer.)
Of all the applications, six either have a major improvement impact with PMUs or cannot be
implemented without PMUs. They are: Angle/Frequency Monitoring, Post‐mortem Analysis,
Model Benchmarking, Outage Prevention (including Planned Power System Separation), State
Measurement and Real‐time Control.
As for the rest of the applications, non‐PMU technologies are available; however, the
deployment of PMUs allows the same measurements to be used to realize additional benefits
from the same investment.
Three complementary approaches in using PMU technology with State Estimation –
conventional SE improvement (evolutionary), boundary conditions SE, and State Measurement
(revolutionary), ‐ are considered to be elements of short to long term PMU deployment strategy
using increasing number of PMUs locally and regionally. In fact, the revolutionary case is a
natural extension of the evolutionary approach as numbers of PMUs installed continues to
increase. Use of PMUs for representing boundary conditions will stem from system‐wide
regional deployment.
1. Angle/Freq. Monitoring
Deployment needs depend
on regional & utility
requirements
Necessary
Additional Benefits More Investigation
Role of PMUs

43
Figure 2. Road map for deploying PMU applications
Based on the Deployment Roadmap of Figure 2, Table 2 below provides a rough estimate of the
percentage of full penetration of the Synchronized Measurement technology and major
applications in utility/ISO planning and operating practices. Some external factors are taken
into account, such as rate of upgrades of IEDs and RTUs to incorporate GPS time signal.
Table 2. Estimated market penetration
Year 2010 2015 2020 and beyond
Market penetration (%) 15 - 35 30 - 55 50 – 90
3.4. Business Case Analysis Guidebook
3.4.1. Background of the Guidebook
Synchronized measurements represent a next generation of paradigm‐shift technology,
enabling improvements in planning and operating electrical grids. The companion Application
Benefits in Appendix B addresses technical benefits that the technology can bring and the
practical experience by the industry. At present, related projects however have been in the R&D
stage, and implementers have found it difficult to economically justify a wide‐scale
deployment.

44
3.4.2. Objective of the Guidebook
This guidebook is intended to provide general guidance for building a business case for the
PMU technology. This guide provides a framework and tools for conducting improvement
efforts while directing the user to existing info and available support.
3.4.3. Overview of the Guidebook
There are five general phases to do a business case analysis for PMU technology deployment.
These phases are summarized in Figure 3.
Figure 3. Business Case Analysis Process
Phase I (Table 3) involves determining the desired state based on the current and projected
operating environment. The focus is on understanding performance gaps with the existing
technologies and practices, and on understanding what the PMU can help bridging those gaps.
The key objective is to identify an organization, function, activity and/or process to improve and
to define the criteria for success.
Phase II (Table 4) includes the delineation of issues specific to the organization that can be
addressed by the PMU technology. Key activities in this phase include: focusing on the problem
area for analysis; collecting data/information to quantify the benefits.
Phase III (Table 5) identifies the stakeholders and the benefits that PMU may mean to them.
This is important in the case that the investment must be made by more than one organization.
Understanding the benefits to each stakeholder can help articulate the “sale” of the technology
to that particular stakeholder.
Phase IV (Table 6) provides an expected plan for PMU deployment. The deployment typically
takes several years, with associated costs for each year.
Phase V (Table 7) compares the projected benefits over a time horizon with the initial
investment costs and recurring (annual) costs. A number of project valuation techniques can be
used to arrive at a decision of whether the project should start or not.
Identify Areas for Analysis
Analyze Opportunities for
Improvement
Identify Stakeholders
Estimate Deployment Plan
and Costs
Perform Financial Analysis
Identify Areas for Analysis
Identify Areas for Analysis
Analyze Opportunities for
Improvement
Analyze Opportunities for
Improvement
Identify Stakeholders
Identify Stakeholders
Estimate Deployment Plan
and Costs
Estimate Deployment Plan
and Costs
Perform Financial Analysis
Perform Financial Analysis

45
Table 3. Steps in collecting data for Phase I, "Identify Areas for Analysis"
Steps Inputs Outputs Available Support Comments
1. List the major functions,
activities, processes that
Synchronized
Measurements might help
with
Synchronized
Measurements
technical capability;
List of functions,
activities, processes
Technical Report of this
CIEE project
2. Identify the current
performance of each
function, activity, process,
…
Documented
performance
indicators
List of performance by
function, activity,
process
Engineering department
3. Identify existing use of
PMU in the industry and
experience in enhancing
planning and operations.
List of initial targets
and list of achieved
targets.
List of improvements
brought about by
PMU.
List of unfulfilled goals.
Technical Report of this
CIEE project. Public-
domain reports,
publications, IEEE, IEE,
CIGRE. Industry
surveys
See Appendix F for
a typical industry
survey
4. Identify government
mandates, if any.
NERC, DOE, FERC
announcements
Required
performance and
penalty
Table 4. Steps in collecting data for Phase II, "Analyze Opportunities for Improvement"
Steps Inputs Outputs Available Support Comments
1. Delineate benefits of
PMU to specific activities
in your organization
Phase I findings Organization-specific
targets
Engineering
Department
2. Quantify the benefits as
(a) direct revenue, (b)
avoided cost.
Historical record of
events, incidents.
List of pre-PMU cost
per event.
List of post-PMU
(projected) reduction
in cost per event
Company’s financial
record
3. Identify needed
equipment to achieve the
benefits
Hardware
performance;
communications
reliability, delays and
bandwidth; available
applications
Design specification
for a system
Engineering
department; Industry
sources on other PMU
projects; Vendors
4. Prioritize the benefits List of targets (Step
1)
List of benefits and
associated rankings
Management

46
Table 5. Steps in collecting data for Phase III, "Identify Stakeholders"
Steps Inputs Outputs Available Support Comments
1. Identify benefits of PMU
to personnel from
departments within the
organization
Phase II findings List of improvements Various departments
2. Articulate benefits of
PMU to identified
stakeholders in the
organization
Phase II findings.
Historical record
related to regional
incidents: stock-price
movement; Litigation
costs;
Restoration cost;
troubleshooting cost
Estimated dollar
figures for each
benefit
3. Identify of benefits of
PMUs to stakeholders
outside the organization
Formulae to estimate
benefits due to
avoided cost of
blackouts
Estimate of PMU
benefits for incidents
in local area
Table 6. Steps in collecting data for Phase IV, "Estimate Deployment Plan and Cost"
Steps Inputs Outputs Available Support Comments
1. Estimate capital costs
Phase II findings
(List of components
and associated
costs)
List of components to
deploy per year;
List of costs of these
components.
CERTS publication;
Vendors
See Appendix G for
estimated
component costs
2. Estimate variable costs
List of expected
upgrades,
maintenance of
system
Annual costs Past EMS projects, IT
projects
3. Form alternatives Phase II findings
(Step 1).
Priority list (Phase II,
Step 4)
List of alternative
deployment plans, and
associated costs.
Company’s business
plan
4. Sketch deployment
plans
Output from Step 3 Number of years for
deployment, and list of
annual expectations
Vendors, consultants

47
Table 7. Steps in collecting data for Phase V, "Perform Payback Analysis"
Steps Inputs Outputs Available Support Comments
1. Form projection of
quantified benefits
Phase II findings;
Phase III findings;
Economic trends and
rates
List of benefits per
year for each
stakeholder;
discounted rate,
growth rates (of
annual expense, load)
Accounting dept Benefits can be
cost savings,
avoided costs, hour
savings, or direct
revenue
2. Form projection of
capital investment and
annual expenses
Phase IV findings
(esp. Steps 3-4)
List of expenditure per
year
Accounting dept
3. Evaluate project
alternatives
Deployment plans
(outputs from Step 4,
Phase IV); outputs
from Steps 1-2
Go/No Go decisions NPV, Modified NPV,
Real Options
Use NPV;
If negative NPV,
use modified NPV
or Real Options
To address the first four steps, a questionnaire such as that in Appendix F, “Sample survey for
collecting data as input for Business Case Analysis Technical Experience with PMU devices,”
can be used as the starting point to collect data. A 2005 published report from CERTS (CERTS,
2005) can also be consulted for cost estimates of various elements of a deployment.
Business techniques to decide if a project should be pursued that are used in this study and are
recommended for the user are described below:
NPV (Net Present Value). In this traditional approach, one projects all future benefits,
expenses and needed investment for a number of years. The numbers are discounted to
present time and are summed to produce the Net Present Value. The project gets a Go
when NPV is positive. Simple probabilistic elements are sometimes used in conjunction
with the traditional NPV, as the modified NPV. For example, one might consider three
scenarios: optimistic, pessimistic, and average.
Real Options Analysis (ROA). This method takes the modified NPV one step further by
taking into account the probabilities of the projected benefits. ROA is suitable for phased
investments, and is particularly suitable for PMU projects as they are deployed over
several years. In an example, it takes 4 years to build up the project. For each year, as the
knowledge about the perceived benefits becomes clearer, the management has the
option of stopping the project, postponing or expanding it. ROA is used when NPV
results are negative, yet the project is deemed strategic enough that the management
finds it necessary to conduct a phased approach; they will capture the upside should
favorable scenarios develop over the course of time. In an illustrative example
(Appendix E), the deployment of a PMU system to improve Congestion Management
yields negative NPV. Since in the proposal phase of the project, there is a considerable
uncertainty with the benefits (Congestion Management is a new application), Real

48
Options is used to valuate that uncertainty and the management flexibility during the
course of the project.
It is left to the user to decide which technique would better fit concrete needs.
3.4.4. Examples and Recommendations
Examples of how the Guidebook is used are given in Appendix E. Even though the quantitative
numbers were based on an interview with a utility company, they are primarily for illustrative,
test purposes. More detailed, fully developed analysis is required for a rigorous and accurate
business case analysis. In any case, this study helped draw some general conclusions:
A multiple‐purpose deployment is the means to reap major benefits from the PMU
technology. This is because the same capital investment can be used by different subject
areas, stacking up the benefits. This kind of deployment, however, requires a careful
analysis and planning as the capital investment is high.
A partial deployment (or ad hoc) that targets a limited objective is suitable for R&D.
Lacking a careful plan for integrated use of the infrastructure, several partial
deployments when combined at a later time can be costlier than a full deployment.
Partial deployments, when evaluated individually in the proposal phase, are likely to
show poor or unacceptable payback. However, if a partial deployment is an initial phase
for a full‐deployment scheme, Real Options Analysis is a recommended method for
project valuation. This technique takes into account two elements that the traditional
NPV does not: (a) the uncertainty in the projected benefits, and (b) the management
flexibility to stop the project or to expand it into next phases.
A brief summary of the quantitative results is described next. For more details, please see
Appendix E.
Identified applications are grouped into common subject areas:
Outage Prevention
Post‐mortem Analysis, which can be deployed with or without Outage Prevention.
Congestion Management
The following deployment plans have been analyzed:
Case 1 Full deployment of above identified applications.
Case 2 Partial deployment with Post‐mortem Analysis only, with the following assumptions:
The cost is the base deployment.
Conservative assumptions, including only time saved, but not stock‐price change,
avoided costs, and avoided outages due to better preparation (in some cases only
possible by using PMU data).

49
Case 3 Partial deployment with Outage Prevention and Post‐mortem analysis with following
assumptions:
The cost is base deployment, equipment upgrade and annual costs.
Conservative assumptions, including lost revenue and restoration costs, but not stock‐
price change and avoided costs
Preventing catastrophic blackouts (from “1 event in 5 yrs” to “1 in 10”)
Reducing disturbances due to voltage excursions (from “3 to 1 event/yr”)
Enhanced RAS arming study (from “6 to 2 events/yr”)
Case 4 Partial deployment with Congestion Management only. The cost is base deployment,
software applications, and annual costs.
Results of those illustrative, test business cases are summarized in Table 8.
Table 8. Summary of Illustrative Business Case Results
Case NPV Results (k$)
1. Full deployment 43,667 - 317,759 3
2. Post-mortem Analysis only -78
3. Outage Prevention and Post-mortem analysis only 19,023 – 314,932 4
4. Congestion Management only 1,258 (using ROA)
Case 2 clearly shows that calculating business benefits for partial deployment with partial
benefits may result in misleading conclusions. For a large disturbance the size of 2003 Northeast
blackout, NERC allocated 2‐3 people on a 75% time working over 9‐10 months. Based on NERC
estimates, it is expected that with PMUs, this resource requirement would be 1‐2 months with 2‐
3 people full time. One can expect that affected utilities devoted much more person‐hours to the
effort. The collective savings with PMUs would justify the cost of investing in a large number of
PMUs. Such a detailed benefit analysis, however, is beyond the scope of this project.
3.5. System Architecture and Deployment Gaps Implementing a large‐scale PMU system presents some unique challenges. Such systems need
to transmit and store large amount of data. Deployment of this technology typically involves a
large number of entities (utilities in a connected grid, ISOs, regional organizations, regulators).
Each owner/operator is responsible for a part of the system. These systems need to support a
wide range of applications for their stakeholders and thus need to accommodate diverse
requirements by various applications. Various applications have different requirements on the
number of PMUs, data‐reporting rate, data accuracy and reliability, etc. For example, an out‐of‐
3 Two different estimates are due to different ways the costs of blackout/outage are estimated: GDP
(lower figure), LBNL (higher figure).
4 ibid.

50
step relay using PMU data may need only two PMUs with very high data‐reporting rate and
communications reliability. A State‐Estimator using PMU data may need hundreds of PMUs in
order to achieve a major performance improvement, but need a much slower data rate.
As many applications are still in the research and development stage and the deployment
roadmaps are not fully developed, requirements are not clearly defined. This is one of the main
reasons that there is a lack of available products to support large‐scale implementation. How to
design a system that meets all those diverse requirements under current situations is a major
challenge and the key to the deployment success. Ensuring the consistent performance of all
PMUs that will be acquired from multiple vendors, and installed, operated and maintained by
different entities is another major challenge.
While the applications area is still in the development phase, PMU hardware is based on proven
technology. Phasor measurement technology was developed near the end of 1980s and the first
products appeared on the market in the early 1990s. Presently, a significant number of vendors
are offering PMUs. Most of the products are either based on existing platforms or have PMU
functionality added to the existing platforms by simply adding hardware, such as a GPS
receiver, to achieve accurate time stamping, and in some cases, by adding required
communication interfaces (if they do not already exist). Technology required for the necessary
communication infrastructure already exists as well,
Although benefits of using PMU technology are evident and the key technologies are available,
the main hurdles for applying PMU technology are in:
PMU device procurement, installation, operation, and maintenance cost.
Packaging and productization of communication and integration infrastructure required
for PMU applications. This challenge is further increased by the need to build a system‐
wide architecture
Regarding the former, using existing IED platforms with integrated PMU functionality or by
planned integration of stand‐alone PMUs in enterprise level communication and data
management infrastructure reduces overall deployment costs. The retrofit/upgrade approach
using IEDs with integrated PMU functionality makes it easier and less costly to make
improvements requiring PMU functionality in future applications. Also, one can expect that in
the near future there will be thousands of IEDs in operation with built‐in PMU functions.
Although there are concerns with implementing PMUs in devices like protective relays, those
issues could be overcome with the following:
Test performance of integrated devices under fault conditions using defined guidelines.
For example, the EIPP Performance Requirement Task Team is developing a guideline
that is planned to become a NERC standard and is coordinated with IEEE 37‐118
standard activities (http://phasors.pnl.gov/resources_performance.html).
Define standard procedures (data collection, communications, security, etc.) and
responsibilities for commercial O&M of PMU systems, including:
o PMU installation, commissioning, and maintenance

51
o Access to data and setting and set‐up changes
o Security procedures and issues
o Needs for separate access by various groups
In some cases, it may still be beneficial to use stand‐alone PMUs. In general, where the PMU
function should reside depends on various factors (applications and their requirements,
communication architecture, upgrade requirements, etc.).
In any case, when such IEDs reach a critical mass, there will be a paradigm shift in applying
synchronized phasor technology in power systems. The challenge will be in how to use those
IEDs and their associated software applications more effectively to improve the system
operation, and to achieve desired financial benefits. This trend requires that special attention be
paid to the PMU system architecture. Even now, the main cost is with the system components,
such as data concentrators, the software applications, and the supporting communications
systems.
An ideal PMU system architecture should properly address the following issues:
Scalability: As the number of installed PMUs and IEDs with integrated PMU functions
increase gradually, the system architecture must be designed so that it can keep up with
this trend.
Flexibility: As many of the system components will be acquired, installed, operated and
maintained by different entities, the system architecture should very flexible in order to
accommodate the diverse requirements of these entities.
Communications bandwidth and latency: In the new paradigm, on‐going
communications cost (if leased from communications service providers) could become
the main cost item of a PMU system. Reducing the bandwidth requirement will help to
reduce the on‐going cost of PMU applications. Minimizing the communication
bandwidth requirement will also help to reduce the latency of the PMU data
transferring. For real‐time applications, reducing the communication latency is a must.
Ease with adding/removing PMUs/IEDs and enabling/disabling PMU applications: To
accommodate the growth of IEDs with PMU functionality, the architecture must be so
that it is easy to add a new device to the PMU system. Occasionally, devices need to be
taken off‐line, such as for routine maintenance; their temporary removal should be
accomplished easily and should not hamper related applications. Similarly for the
software side, the design should also allow easy enabling or disabling applications when
needed.
Existing RD&D projects are striving to achieve the above‐mentioned features, such as the
GridStat initiative to design the next‐generation communications system for the power grid5.
However, in practice, there is still a large gap to overcome as PMU systems today are designed
5 GridStat, information available on‐line: http://www.gridstat.net

52
to accommodate near‐term needs. They are small systems consisting of one data concentrator
and a few PMUs.
Currently, there are some efforts, notably the WECC and EIPP projects in the US, to connect
small PMU systems implemented by individual utilities together to form a larger system. Yet,
the total number of installed PMUs is still well below 100 for each system. The number of
installed PMUs is projected to increase to a few hundreds in next few years for these two
systems. Both systems use their master data concentrators developed in‐house by BPA and TVA
respectively, due to lack of commercial products at the time these systems were started and
developed.
The EIPP system uses a master data concentrator to aggregate the PMU data either from PMUs
directly or indirectly from connected utility data concentrators, and then re‐transmit aggregated
PMU data back to utility data concentrators. The system architecture may not meet the
requirements of the optimal system and is facing the challenge that the weakest link in the
system is determining a performance of the system. As the number of installed PMUs grows,
the system may have difficulties to keep up with the demand. Relying on utility data
concentrators to relay PMU data not only adds time delays, but also make it difficult for the
system to accommodate the growing number of applications. It is likely that the number of
installed PMUs and IEDs will quickly out‐grow the capacity of the master data concentrators.
Lack of vendor support is also a major concern.
An obstacle to wide‐area implementation of PMUs is that vendors are reluctant to develop
system components, such as data concentrators for substations and control centers, as there is
no clear specification for an accepted system architecture and the related system components.
The market demand for such system components is not clear to vendors.
To facilitate a large‐scale deployment of PMUs in California/WECC and to meet the diverse
requirements of different applications, there is a need to design, specify, and develop an
optimal architecture. An optimal system architecture would provide a solid foundation for
implementing a California/WECC PMU system that is highly scalable, flexible, easy to operate
and maintain, and requires minimal communication bandwidth and low latency. The chosen
architecture should generate clear specifications of various system components. The
specifications will help vendors to develop products to allow shared use of PMU data among
various applications, and to meet the performance requirement of each application.
PMU deployment at California/WECC is at the stage when it is necessary to design, specify, and
develop an optimal architecture that will serve present and future application needs for the
whole western grid. As more effort and money is spent on individual utility systems in
California/WECC, it becomes more important to deploy a common California/WECC PMU
system connecting utility systems to take full advantage of the PMU technology.

53

54
4.0 Recommendations and Conclusions
4.1. Recommendations and Key Success Factors Although this study identifies that PMU technology provides major tangible and intangible
benefits to various stakeholders, transfer to commercial implementation has not been easy so
far. Even utilities that have led the industry in installing PMUs through early RD&D projects
are still in the process of technology transfer.
Major success factors for technology transfer are summarized below:
Even though individual utilities will benefit from local implementation, full benefits are
realized through regional and grid‐wide deployment. System‐wide deployment requires
implementing common system architecture and data sharing (not easy to accomplish in
the de‐regulated environment).
Major benefits will be realized after deploying the basic infrastructure, as benefits of
adding new applications are far bigger than incremental costs of new applications. This
also requires utilities to set up operational and business processes to support short to
long term technology deployment.
Even though a number of vendors provide PMU HW products, one obstacle to wide‐
area implementation of PMUs is that vendors have not developed either key
applications or other system components (such as fully productized high performance
data concentrators). The market demand for applications and system components needs
to be clear to vendors. Vendors will be less reluctant to invest in developing a full
product portfolio if there are clear specifications for industry application priorities and
required system architecture.
Economic regulation must provide mechanism to support investments in the technology
that will result in full benefits of implementing the technology grid wide.
In conclusion, to gain the benefits offered by this technology to the US Western grid and the
overall industry, a coordinated effort among utilities, the CAISO and WECC must be
undertaken. This requires an effort that includes a bottom‐up approach from utilities in
defining the needs, applications and uses of PMUs and an top‐down approach from the system
operators and coordinators to define an integrated specification, architecture and operational
scheme to optimize the benefits offered by the technology.
The following process is proposed to the industry to speed up and minimize costs of
deployment.
Each PMU user in the grid should develop a near‐, mid‐, and long‐term
application/technology deployment roadmap. This roadmap would include application
requirements that would guide PMU installations and system architecture needs locally
and regionally.
NERC/ERO and/or WECC should champion required data exchange and the
development of the overall system infrastructure to facilitate achieving benefits of

55
deploying key application (e.g. low‐hanging fruit applications emphasized in the study).
Based on individual user requirements, it is necessary to develop system architecture
design, specification, and deployment plan. All users connecting to the overall
architecture would need to fulfill key integration requirements (HW /SW
interoperability, data quality, etc). It is also beneficial to prioritize applications from the
grid perspective.
Develop uniform requirements and protocols for data collection, communications, and
security through standards (NERC, IEEE, WECC, EIPP). Engage vendors in standard
development and provide clear requirements for both accepted system architecture and
industry application priorities.
Regulators at both federal and state levels need to provide incentives for technology
deployment, particularly considering significant benefits for rate payers and
transmission system reliability.
Each user should set up operational and business processes for installations, operations,
maintenance, and benefits sharing. This would comprise of creating projects with
defined deliverables and deadlines; identifying asset owner, manager, and service
provider; setting up procedures and rules; educating and training users; and facilitating
culture change.
Continue investing in R&D (DOE, PIER, vendors, users, etc) and promote developing
and sharing test cases to develop new applications. Continue using a proven approach
of pilot projects to gain experience and confidence.
Only by having all the stakeholders contributing will this promising technology fulfill its’
promise for achieving financial and reliability benefits. Those benefits will be accomplished
only by significant market penetration of this technology that is dependent on vendors
developing required products. If commitment from key stakeholders (e.g. PAC, regulators) on
the extent of PMU system implementation, including providing application and architecture
requirements, is communicated to the vendors, they will be able to achieve return on
investment required to build key applications and system components.
4.2. Conclusions As transmission grid upgrades are planned, designed and implemented for the future, phasor
measurement technology should be an integral part of the specification and design to enhance
overall operational reliability. This independent study has concluded that the synchronized
phasor measurement technology is necessary to improve the safety, reliability, and efficiency of
the grid. This study has concluded that there are large reliability and financial benefits for
customers/society and the California/WECC electrical grid, thus providing motivation for
regulators to support deployment of this technology and its’ applications. In addition,
individual utilities could realize financial benefits if several integrated applications are
deployed using basic PMU system infrastructure. These conclusions have been reached through
comprehensive analysis of various applications and related benefits, concrete data on PMU
system related costs and benefits, and industry experience with PMU implementation.

56
The technology of PMUs is a known quantity. Many implementations and demonstrations
around the world (with California/WECC utilities representing some of the industry leaders)
have verified the capability of the technology to provide synchronized, time‐stamped
information about system conditions. This information offers operators the opportunity to
avoid catastrophic outages, improve system utilization, and accurately assess and predict the
status of the system under varying conditions. The level of technological readiness does vary,
however, across the various applications that may be addressed through PMUs. For example,
the use of PMUs for real time monitoring and control has been proven by a number of utilities
and can be considered ready for commercial operations. Similarly, PMU data for post‐mortem
outage analysis offers much greater efficiency and accuracy in determining root causes of
blackouts. It is realized that accurate event analysis may not even be possible without PMUs.
Other applications, however, require more development and testing before working prototypes
can be developed and implemented.
A challenge to the industry in harvesting benefits offered by PMUs is in the movement from a
research and development environment to commercial operation. Although working
prototypes are proven for some applications and can be implemented with relatively small
efforts, the lack of commercialization of the technology inhibits full‐scale implementations.
Operational and business processes and models have not been developed in most companies to
address all the issues associated with the implementation of this technology and therefore, the
move to operational status is restricted. Further, the lack of a system architecture developed at
the ISO or Regional Coordinating Council level to guide implementation in a consistent and
coordinated manner is an issue that prevents utilities from investing in the technology. Without
question, the specification for a system implementation must be an integrated, cooperative
effort between utilities and the operating and coordinating entities.
As PMU projects can involve significant costs in infrastructure and technology, the
identification of quantifiable benefits can facilitate the acceptance and funding of projects.
Benefits for PMU applications fall into tangible and intangible categories and, depending upon
the financial evaluation practices of a utility, can vary widely. Tangible benefits can be derived
from the increased quantity and quality of data provided through PMU applications that
facilitate better utilization of system capacity, more efficient use of manpower, and improved
reliability of operations. In many cases the first cost of implementation will not be offset by the
tangible operational benefits but through incremental applications and capabilities provided by
PMU technology, the direct benefits grow considerably.
Most compelling however are the benefits that come in less tangible form. These include the
avoided costs associated with outage investigation, blackout recovery costs, and avoided costs
of political and regulatory activities following major system events. Also not to be overlooked
are the costs associated with market perception of utility capability and the associated stock
value impact that can result from negative publicity. Finally, on a larger scale, are the societal
costs associated with system blackouts resulting in lost productivity as well as lost opportunity
for economic expansion. This study has raised awareness that major potential financial benefits
may be realized in using PMUs in market operations, such as congestion management and
accurate LMP pricing.

57
It is the conclusion of this study that phasor measurement capability is advanced
technologically to the point that commercial implementation of selected applications is both
possible and warranted. Further, the implementation and use of this capability is necessary for
the levels of grid operational management that are required for efficient use of the
infrastructure currently in place as well as for infrastructure enhancements of the future. To
gain the benefits offered by this technology, a coordinated effort among utilities, the CAISO and
California/WECC must be undertaken. Without a system‐wide approach, the capabilities and
associated benefits will not be achieved in the manner possible. This requires an effort that
includes a bottom‐up approach from utilities in defining the needs, applications and uses of
PMUs and an top‐down approach from the system operators and coordinators to define a
integrated specification, architecture and operational scheme to optimize the benefits offered by
the technology.
This study recommends guidelines to realize benefits of this paradigm shifting technology. The
general near‐, mid‐, and long‐term application/technology deployment roadmap, developed
through analysis of financial benefits of various applications, deployment challenges, and
interviews with key stakeholders and industry leaders, serves as a base to guide users and
vendors in taking appropriate actions for transition to commercial operation. For example,
“low‐hanging fruit” applications – for which needs are immediate, PMUs are required, and
infrastructure requirements are relatively modest ‐ are angle/frequency monitoring and
visualization, and post‐mortem analysis.
It is recommended that each user creates an application deployment roadmap that will guide
PMU installations and system architecture needs. If required, the business case guidebook
could support creation of this application deployment roadmap. As a part of the deployment
process, users need to initiate productization projects including setting up operations and
maintenance procedures and rules and training users.
As a large number of applications are in initial stage and there are potential new applications, it
is necessary to continue investing in RD&D (DOE, PIER, vendors, users, etc). RD&D roadmap
by EIPP/CERTS and deployment roadmap from this study are important to provide structured
and consistent directions that would focus efforts, avoid unnecessary duplication, and optimize
RD&D investments. Very successful practice of joint pilot projects needs to continue to gain
experience and confidence.
Finally, commitment from key stakeholders (e.g. PAC, regulators) on the extent of PMU system
implementation needs to be communicated to the vendors so they could develop their
development roadmaps (for key applications and system components) with expected return on
investment

58
5.0 Reference CERTS (2005). ”Phasor Measurement Unit (PMU) Installation Process and Cost Estimates,”
Consortium for Electric Reliability Technology Solutions, May 2005.

59
6.0 Glossary
BPA Bonneville Power Administration
CAISO California Independent System Operator
CERTS Consortium for Electric Reliability Technology Solutions
CIEE California Institute for Energy and Environment
DA Day Ahead
DG Distributed Generation
DOE Department of Energy
EIPP Eastern Interconnection Phasor Project
EMS Energy Management System
EPRI Electric Power Research Institute
ERO Electric Reliability Organization
GPS Global Positioning System
HA Hour Ahead
IED Intelligent Electronic Devices
IPP Independent Power Producers
ISO Independent System Operators
LMP Locational Marginal Pricing
NITC Nominal Transfer Capability
NERC North American Electric Reliability Council
NPA New York Power Authority
NPV Net Present Value
PAC Political Action Committee
PE Parameter Estimation
PIER Public Interest Energy Research
PMU Phasor Measurement Unit
PNNL Pacific Northwest National Laboratory
PSPS Power System Protection Schemes
RAS Remedial Action Scheme
RD&D Research, Development and Demonstration
ROA Real Options Analysis

60
RT Real Time
RTC Real Time Transfer Capacity
RTDMS Real time Dynamic Monitoring System
SCADA Supervisory Control And Data Acquisition
SCE Southern California Edison
SCIT Southern California Import Transmission
SDG&E San Diego Gas & Electric
SE State Estimation
SIPS System Integrity Protection Scheme
SPA Standing Phase Angle
TVA Tennessee Valley Authority
UCTE Union for the Co-ordination of Transmission of Electricity
WAMPAC Wide Area Monitoring, Protection and Control
WAMS Wide Area Measurement System
WAPA Western Area Power Administration
WECC Western Electricity Coordinating Council

61

Appendix A - Western Interconnection Phasor Based Projects
Prepared by
Yuri Makarov
Pacific Northwest National Lab


i
Table of Contents
Preface ................................................................................................................................................ iii
1.0 Western Electricity Coordinating Council (WECC) WAMS (Wide Area Measurement
System) Project ..................................................................................................................... A‐1
1.1. PMU Testing and Evaluation ....................................................................................... A‐3
1.2. WAMS Information Manager8 ..................................................................................... A‐3
1.3. Algorithms and Tools Development8 .......................................................................... A‐4
1.4. On‐line Disturbance Monitoring Tool8 ........................................................................ A‐5
1.5. System Benchmarking8 .................................................................................................. A‐6
1.6. Disturbance Analysis and Monitoring8 ....................................................................... A‐8
1.7. Early Warning Detection ............................................................................................... A‐8
2.0 Bonneville Power Administration .................................................................................... A‐11
2.1. Overview ......................................................................................................................... A‐11
2.2. DSI Toolbox ..................................................................................................................... A‐12
2.3. Development of State‐of‐the‐Art Algorithms and Prototype Tools for Real time and
Post‐Processing of Wide‐Area PMU Measurements ................................................. A‐13
2.4. Power System Identification Using Injected Probing Signals .................................. A‐14
2.5. Performance Validation and Noise Injection Staged Tests ..................................... A‐14
2.6. Wide Area Stability Control System (WACS) ............................................................ A‐14
2.7. Power System Robustness Indicators .......................................................................... A‐15
3.0 California ISO ....................................................................................................................... A‐17
3.1. Grid Dynamics Monitoring / Psymetrix ..................................................................... A‐17
3.2. Frequency Data Collection Project ............................................................................... A‐17
3.3. Real time Dynamics Monitoring System (RTDMS) ................................................... A‐18
3.4. Use of PMUs to Provide More Accurate Data on the CAISO Interchange ............ A‐21
4.0 Southern California Edison ................................................................................................ A‐22
4.1. Synchronized Phasor Measurement activities at SCE ............................................... A‐24
4.2. PMU‐based RAS ............................................................................................................. A‐24
5.0 San Diego Gas & Electric .................................................................................................... A‐25
5.1. Improved State Estimation ........................................................................................... A‐25
5.2. Disturbance Monitoring Work Group (DMWG) ...................................................... A‐25
5.3. Modeling and Validation .............................................................................................. A‐25
5.4. Real time Observation of System Performance .......................................................... A‐28
6.0 Glossary ................................................................................................................................ A‐31

ii

iii
List of Figures
Figure A‐1. WAMS andEIPP areas and participants ........................................................................ A‐2
Figure A‐2. WAMS Information Manager .......................................................................................... A‐4
Figure A‐3. DSI Toolbox Window ....................................................................................................... A‐5
Figure A‐4. Online Disturbance Monitoring Tool ............................................................................. A‐6
Figure A‐5. Example of event analysis ................................................................................................ A‐7
Figure A‐6. Example of system test ..................................................................................................... A‐7
Figure A‐7. Waterfall Diagram for Western Interconnection Blackout in 1996 ............................ A‐8
Figure A‐8. Waterfall Diagram for August 14 Blackout in 2003 ...................................................... A‐9
Figure A‐9. Integration of multi‐source data with the DSI Toolbox ............................................. A‐13
Figure A‐10. Analysis of properties as measured on the California Oregon Intertie at Malin
Substation. ..................................................................................................................................... A‐16
Figure A‐11. Wide Area Visualization with Phasors – Illustrative RTDMS Situational Awareness
Screen ............................................................................................................................................. A‐20
Figure A‐12. Phasor Measurement Units installed in SCE ............................................................ A‐22

iv

iv
Preface
This document is prepared as a part of the project “CIEE Phasor Measurement Application
Study” sponsored by the California Energy Commission’s (CEC) Public Interest Energy
Research (PIER) Transmission Research & Development Program (TRP) and conducted by
KEMA, Inc.
PNNL participation in the abovementioned CEC/CIEE/KEMA project is sponsored by the
Department of Energy through the Eastern Interconnection Phasor Project (EIPP) being
managed by Consortium for Electric Reliability Technology Solutions (CERTS).
The objective of this document is to provide the most comprehensive view (based on available
information) of the previous very successful work conducted by the WECC Members and
participating research institutions and Universities and related to the subsecond phasor
measurements. This information is essential for acknowledging of the multi‐year previous and
ongoing related work in the Western Interconnection and for adequate shaping the “CIEE
Phasor Measurement Application Study” and building the future road mapping activities.
The main activities in the area of phasor‐based applications have been around the Wide‐Area
Measurement System (WAMS) and Wide Area Stability Control System (WACS). Many utilities
and grid operators and have been very active and contributed significantly to these and other
relevant projects including Bonneville Power Administration, South California Edison, Pacific
Gas and Electric, San Diego Gas and Electric, California ISO, B.C. Hydro & Power Authority,
Alberta Electric System Operator, Arizona Public Service Company, ESBI Alberta, Western Area
Power Administration, and others. The Western Electricity Coordinating Council (WECC), in
particular, its Disturbance Monitoring Work Group (DMWG), served as a forum and
coordinating agent in these projects. Among the research and development organizations,
PNNL, EPG, and many others should be mentioned. Many outstanding researchers and
engineers have contributed to the area of phasor‐based applications.
The content of this document was collected due to contributions made by the WECC engineers
and researchers engaged in the area. Their help is highly appreciated and is acknowledged in
the text.
Drs. Henry Huang, Ning Zhou and Ning Lu (PNNL) have contributed to the document.

iv

A‐1
1.0 Western Electricity Coordinating Council (WECC) WAMS (Wide Area Measurement System) Project The Wide Area Measurement System (WAMS) project6 is an effort by the US Department of
Energy (DOE) to reinforce power system reliability. It also has very strong ties, historically and
logically to asset management visions such as intelligent energy system and flexible AC
transmission systems (FACTS). In 1989, the DOE was joined by Bonneville Power
Administration (BPA) and the Western Area Power Administration (WAPA), in an assessment
of long‐term research and development needs for the future electric power system. Under the
initiative for real time control and operation, the WAMS project was first laid out as the
Western System Dynamic Information Network (WeSDINet) and then reduced to its initial
form. The “information backbone” for WesDINet is the BPA/WAPA WAMS network.
Nowadays, as shown in
Figure the WECC WAMS is both a distributed measurement system and a general
infrastructure for dynamic information that conventional supervisory control and data
acquisition (SCADA) technologies cannot resolve. In addition to measurement facilities, the
WAMS infrastructure also includes staff, procedures, and practices that are essential to effective
use of WAMS data. WECC has 11 PDC (phasor data concentrator) units, operated by 9 data
owners, 53 integrated phasor measurement units (PMUs), 7 stand‐alone PMUs, about 23
portable power system monitor (PPSM) units and 10 monitor units of other kinds. This
constitutes about 1500 primary signals from the ʺbackboneʺ system of PMUs and PPSMs (about
half of them are phasors) 8.
The applications of WAMS data can be categorized as:
Real time monitoring
Control
Model validation
The suggested and running WECC applications for WAMS data7 include:
Real time observation of system performance
Early detection of system problems
Real time determination of transmission capacities
6 J. F. Hauer., “List of WECC Working Documents Produced with Support by the WAMS Outreach
Activity Funded Under the DOE Program for Transmission Reliability, DOE/CERTS Working Note,
January 19, 2006. 7 W. A. Mittelstadt, J. F. Hauer, K. E. Martin, and Harry Lee, “Evaluating the Dynamic Performance of
Phasor Measurement Units: Experience in the Western Power System,” WECC Disturbance Monitoring
Work Group, Interim Report of August 5, 2005. Available at:
ftp://ftp.bpa.gov/pub/WAMS_Information/1F_PMUevaluation_DynamicResponseH6.doc#_Toc111006798

A‐2
Analysis of system behavior, especially major disturbances
Special tests and measurements, for purposes such as
special investigations of system dynamic performance
validation and refinement of planning models
commissioning or re‐certification of major control systems
calibration and refinement of measurement facilities
Refinement of planning, operation, and control processes essential to best use of
transmission assets
Grid America
PPL
Ameren
AEP
ATC
BCH
BPA
CAISO
Cinergy
Duke
Entergy
Exelon First Energy
FPL
HydroOne ISO-NE
ITCKeyspan
ConEd
Manitoba Hydro
MISO
NYISO
NYPA
PG&EProgress
PJM
Hydro Quebec
SCE SouthernSRP
TVA
WAPATrans Elect
WAMS EIPPAlberta
Grid America
PPL
Ameren
AEP
ATC
BCH
BPA
CAISO
Cinergy
Duke
Entergy
Exelon First Energy
FPL
HydroOne ISO-NE
ITCKeyspan
ConEd
Manitoba Hydro
MISO
NYISO
NYPA
PG&EProgress
PJM
Hydro Quebec
SCE SouthernSRP
TVA
WAPATrans Elect
WAMS EIPPAlberta
Figure A-1. WAMS and Eastern Interconnection Phasor Project (EIPP) areas and participants
The suggested and running real time applications for phase angle measurements7 includes:
Basis for high quality bus frequency signals
Validation of system dynamic performance
Angle‐assisted state estimation
System restoration
Operator alerts for high‐stress operating conditions
Arming of special stability controls
Supervision of fast stability controls

A‐3
Real time power flow control (e.g., phase shifters, slow thyristor controlled series
capacitor (TCSC))
Modulation inputs for “bang‐bang” stability controls (e.g., phase‐plane controllers)
Modulation inputs to other controller types.
Wide area stability control system (WACS)
In the following sections, major WECC WAMS projects will be presented. Participants and the
objectives of these projects will be briefly introduced.
1.1. PMU Testing and Evaluation8 Source: Dr. Henry Huang, PNNL
Participants: BPA and PNNL
BPA (Ken Martin, Bill Mittelstadt) and PNNL have been collaborating on PMU testing for the
last few years (1995‐2005). Testing procedures and methods have been developed. BPA has set
up a testing facility and many PMU models have been tested, including Macrodyne 1690, ABB
RES521, Ametek RIS200 and Hathaway IDM. Test reports have been used by WECC Dynamic
Monitoring Working Group to certify PMU models for use in the WECC WAMS. In 2005, PNNL
leveraged DOE funds and set up a PMU testing facility with help and support from BPA. John
Hauer and Henry Huang worked with Ken Martin and tested a SEL421 PMU model.
1.2. WAMS Information Manager8 Source: Dr. Henry Huang, PNNL
Participants: EPRI, BPA, PNNL, and University of Wyoming
This was a 1999 project jointly supported by EPRI and BPA on developing a WAMS data
management system. PNNL, Montana Tech, and University of Wyoming participated in this
project. This study led to the implementation and use of PDCs in WECC WAMS. Methods for
analyzing WAMS data and identifying dynamic events were studied and developed, as shown
in Figure A‐2.
8 Henry Huang, “WAMS Studies at Pacific Northwest National Laboratory”, Presentation, April 4, 2006.

A‐4
RemoteArchives
RemoteMonitors
LocalMonitors
Operator Alerts
Cross Triggers
Display Controls
Data Retention Requests
Record-Value Tags
Diagnostic
Event
Scanner
(DES)
Local user inputs
LocalArchive #1
LocalArchive #n
INTERNET/WWW
Remote
DBM Unit
RemoteArchives
RemoteMonitors
RegionalMonitors
WAMS Information Manager (WAMS IM)
LocalEMS
OASISWAMS
Database
Manager
(WAMS DBM)data routing &
processing controls
Remote
DBM Unit
Security &Control
Figure A-2. WAMS Information Manager
1.3. Algorithms and Tools Development8 Source: Dr. Henry Huang, PNNL
Participants: BPA, PNNL, University of Wyoming and Montana Tech
BPA has funded research by PNNL, University of Wyoming and Montana Tech, collaborating
for more than a decade on developing WAMS data analysis algorithms and tools (from 1990’s to
present). Prony’s methods, N4SID, Inverse FFT, and many other algorithms were studied and
applied to power system WAMS data analysis. Tools developed include Dynamic System
Identification (DSI) toolbox (MATLAB‐based), StreamReader (LabView‐based), and Spectral
Analysis Tool (LabView‐based). These algorithms and tools provide excellent functions for joint
time‐frequency WAMS data analysis. Figure A‐3 shows an output window of the DSI toolbox,
which can be used to detect the magnitude and phase of each mode to detect faults at an early
stage.

A‐5
Figure A-3. DSI Toolbox Window
1.4. On-line Disturbance Monitoring Tool8 Source: Dr. Henry Huang, PNNL
Participants: PNNL
With the algorithms and tools developed in the past, attempts are being made to move many of
the functions from off‐line use onto an on‐line environment. Figure A‐4 shows the structure of
an online monitoring tool. Phasor data collected at each phasor data concentrator (PDC) will be
fed to data analysis tools such as Mode Meters and the DSI toolbox. The extracted information
such as the magnitudes and phases of major modes will be analyzed. Warning signals will be
sent to operators. The objective is to provide useful information for operators to gain more
insights into current system status and thus ensure system reliability and safety. This is a FY06
project currently funded by BPA.

A‐6
Phasor Data Feed
Phasor Data Feed
DisplayMath Algorithms
PDCDataReaderStreamReader
WACS……
PronyModeMeter
(N4SID)Fourier
Inverse FFT……
Operations
Figure A-4. Online Disturbance Monitoring Tool
PNNL had an internal project on fast Prony analysis (2005). Prony analysis has been applied in
many areas with great success. It has significant advantages over Fourier analysis in many
aspects. However, Prony analysis is not as widely used as Fourier analysis. The main reason has
been lack of efficient algorithms. Fourier analysis did not gain general acceptance until Fast
Fourier Transform (FFT) was invented. This project aims to develop a Fast Prony Analysis
(FPA) algorithm and it is anticipate that FPA will improve Prony calculation speed by a factor
of 100. It will greatly promote the use of Prony analysis, as FFT did to Fourier.
1.5. System Benchmarking8 Source: Drs. John Hauer and Henry Huang
Participants: WECC members
One important objective of WAMS is to help identify abnormal system status so control actions
can be taken to prevent abnormal status leading to unstable system or system collapse. To
detect what is abnormal, one needs to determine what is normal. Two approaches – event
analysis and system test – have been used to benchmark system dynamic behavior to determine
system norm. Using historical event data, analysis results are consistent, resulting in validation
of normal system operating. The WECC system typically has ~0.3 Hz North‐South mode and
~0.4Hz Alberta mode. System dynamic tests have been routinely performed on the WECC.
Besides system benchmarking, system tests can also serve to validate those WAMS data
analysis algorithms. An event analysis has been shown in Figure A‐5. The magnitude changes
of each mode clearly indicate the critical modes at different locations.
Figure A‐6 shows the system responses after a test signal was injected
into the system. Benchmarking the system will be an important task for fault detection and
system monitoring.

A‐7
0 0.2 0.4 0.6 0.8 1 1.2
RAS Brake 112903
Brake #1,060700
40
60
80
100
120
140
160
0
20
180
120
Au
tos
pec
tru
min
dB
Frequency in Hertz0 0.2 0.4 0.6 0.8 1 1.2
Brake120299Brake120299Brake120299
Brake041897
Brake041698
Brake042500B
Brake041000
Brake042799
Brake041897
Brake041698
Brake042500B
Brake041000
Brake042799
RAS Brake 112903
Brake 050703
Brake #1,060700
40
60
80
100
120
140
160
0
20
180
120
40
60
80
100
120
140
160
0
20
180
120
Au
tos
pec
tru
min
dB
Frequency in Hertz
(signals vertically offset for clarity)
AlbertaMode
N-SMode
0 0.2 0.4 0.6 0.8 1 1.2
RAS Brake 112903
Brake #1,060700
40
60
80
100
120
140
160
0
20
180
120
40
60
80
100
120
140
160
0
20
180
120
Au
tos
pec
tru
min
dB
Frequency in Hertz0 0.2 0.4 0.6 0.8 1 1.2
Brake120299Brake120299Brake120299Brake120299Brake120299Brake120299Brake120299
Brake041897
Brake041698
Brake042500B
Brake041000
Brake042799
Brake041897
Brake041698
Brake042500B
Brake041000
Brake042799
Brake041897
Brake041698
Brake042500B
Brake041000
Brake042799
Brake041897
Brake041698
Brake042500B
Brake041000
Brake042799
RAS Brake 112903
Brake 050703
Brake #1,060700
40
60
80
100
120
140
160
0
20
180
120
40
60
80
100
120
140
160
0
20
180
120
Au
tos
pec
tru
min
dB
Frequency in Hertz
(signals vertically offset for clarity)
AlbertaModeAlbertaMode
N-SModeN-S
Mode
Figure A-5. Example of event analysis (Hauer, 2004)
-100
0
100
-50
0
50
-20
0
20
-20
0
20
360 370 380 390 400 410 420 430 440 450 460-50
0
50
Time in Seconds
Measurement #1 MW
Measurement #2 MW
Measurement #3 MW
Measurement #4 MW
PDCI Power MW
(mid-level probing signal)
-100
0
100
-50
0
50
-20
0
20
-20
0
20
360 370 380 390 400 410 420 430 440 450 460-50
0
50
Time in Seconds
Measurement #1 MW
Measurement #2 MW
Measurement #3 MW
Measurement #4 MW
PDCI Power MW
(mid-level probing signal)
Figure A-6. Example of system test (Hauer, 2004)
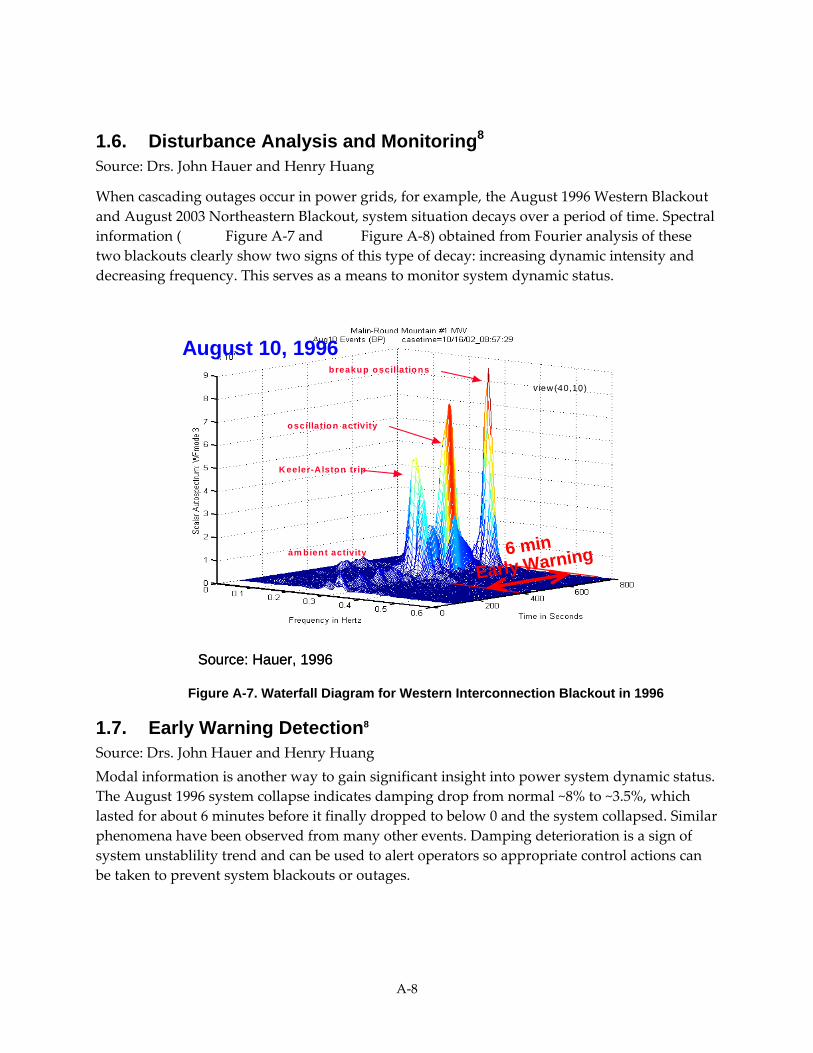
A‐8
1.6. Disturbance Analysis and Monitoring8 Source: Drs. John Hauer and Henry Huang
When cascading outages occur in power grids, for example, the August 1996 Western Blackout
and August 2003 Northeastern Blackout, system situation decays over a period of time. Spectral
information ( Figure A‐7 and Figure A‐8) obtained from Fourier analysis of these
two blackouts clearly show two signs of this type of decay: increasing dynamic intensity and
decreasing frequency. This serves as a means to monitor system dynamic status.
v iew(0,20)
v iew(40,10)
K eeler-Alston trip
oscillation activity
breakup oscillations
am bient activity
v iew(0,20)
v iew(40,10)
K eeler-Alston trip
oscillation activity
breakup oscillations
am bient activity
Source: Hauer, 1996
August 10, 1996
Early Warning6 min
v iew(0,20)
v iew(40,10)
K eeler-Alston trip
oscillation activity
breakup oscillations
am bient activity
v iew(0,20)
v iew(40,10)
K eeler-Alston trip
oscillation activity
breakup oscillations
am bient activity
Source: Hauer, 1996
August 10, 1996
Early Warning6 min
Figure A-7. Waterfall Diagram for Western Interconnection Blackout in 1996
1.7. Early Warning Detection8 Source: Drs. John Hauer and Henry Huang
Modal information is another way to gain significant insight into power system dynamic status.
The August 1996 system collapse indicates damping drop from normal ~8% to ~3.5%, which
lasted for about 6 minutes before it finally dropped to below 0 and the system collapsed. Similar
phenomena have been observed from many other events. Damping deterioration is a sign of
system unstablility trend and can be used to alert operators so appropriate control actions can
be taken to prevent system blackouts or outages.

A‐9
Eastlake 5 trips
Stuart-Atlanta 345kV trips
Harding-Chamberlin345kV trips
Hanna-Juniper
345kV trips
Sammis-Star 345kV trips
Eastlake 5 trips
Stuart-Atlanta 345kV trips
Harding-Chamberlin345kV trips
Hanna-Juniper
345kV trips
Sammis-Star 345kV trips
Source: Hauer, 2004
August 14, 2003
Eastlake 5 trips
Stuart-Atlanta 345kV trips
Harding-Chamberlin345kV trips
Hanna-Juniper
345kV trips
Sammis-Star 345kV trips
Eastlake 5 trips
Stuart-Atlanta 345kV trips
Harding-Chamberlin345kV trips
Hanna-Juniper
345kV trips
Sammis-Star 345kV trips
Source: Hauer, 2004
August 14, 2003
Figure A-8. Waterfall Diagram for August 14 Blackout in 2003

A‐10

A‐11
2.0 Bonneville Power Administration
2.1. Overview Source – William A. Mittelstadt, BPA
Ken Martin, BPA
Carson Taylor, BPA, retired
Dmitry Kosterev, BPA
Jim Burns, BPA
BPA has been heavily involved with western interconnection phasor based projects since late
1980s. BPA is interested in extraction of information from PMU data both in real time
processing and post processing. Real time processing is useful for: (1) providing alarms to
system operators for impending trouble, and (2) observing the state of the systems during
staged system tests. Post Processing is useful for improvements in modeling and understanding
power system behavior.”9
Under its WAMS and Wide‐Area Stability and Voltage Control Systems (WACS) projects, BPA
cooperates closely with the Ciber Inc. (Dennis Erickson) implementing a variety of LabVIEW
modal analysis tools, with the emphasis on potential real time applications including
emergency control. BPA is also involved in developing offline MATLAB tools with the goal to
evaluate system safe operating limits, validate system models, provide event analysis, and
improve control system design. BPA has cooperation links with the PNNL, University of
Wyoming, Montana Tech, and Washington State University in these areas.
BPA participates in the WECC Disturbance Monitoring Work Group focusing on the PMU
network and application development. BPA has developed and installed its own PMUs and
PDCs to collect real time subsecond data over its network and some other western interconnect
locations. Currently, BPA has a useful library of system events and various probing signals
tests, as well as a model test system from which synthetic data can be produced to evaluate
various system identification techniques under known condition.
Some of multiple projects conducted by BPA have already been described in the previous
section. The following sections will discuss in more detail some of the BPA lead projects.
9 “Development of State‐of‐the‐Art Algorithms and Prototype Tools for Real‐Time and Post‐Processing of
Wide‐Area PMU Measurements”, Working Document, December 2005.

A‐12
2.2. DSI Toolbox10 Project participants: BPA and PNNL.
As shown in Figure the DSI toolbox is the latest Matlab version of BPA system analysis tools
that trace their origins to wide area control projects in the mid‐1970, and that have undergone
extensive use and refinement since that time. The DSI Toolbox accepts both measured and
modeled data for power system performance.
The DSI toolbox is an ʺinteractive batchʺ tool that is optimized for dynamic systems analysis in a
planning or control engineering environment. It is initially designed for design and operation of
advanced stability controls and has been extensively used in HVDC and FACTS control. The
DSI toolbox has been optimized for dynamic system analysis in a planning or control
engineering environment and oriented toward high volume analysis and report generation. It
has been written in open Matlab code and can be readily linked to third party tools for signal
analysis, controller design and other special tasks. It has supported BPA and WSCC
performance validation work since 1975. The structure of DSI toolbox is listed as follows:
Power System Measurements (PSM) Tools:
Data management, high volume analysis, report generation
Signal extraction, repair, integration, analysis, and display
Translation and export of data in standard forms
Ringdown Graphic User Interface (GUI):
Prony analysis with Fourier accessories
Analysis of oscillatory dynamics
Model construction for controller design
10 J. F. Hauer , “PSMtools: Matlab Utilities for Processing of Power System Response Records Summary
Description”, October 4, 2002. Available at ftp://ftp.bpa.gov/pub/WAMS_Information/

A‐13
AnalysisResults
IntegratedData
ReportMaterials
OtherMonitors
StabilityPrograms
DSI
Toolbox
StreamReaderArchive
StreamReader
StreamReaderArchive
StreamReader
PMU
PMU
Local PDC
PDCArchive
PMU
Remote PDC
PDCArchive
PMU
PMU
PhasorMeasurement
System
StreamReaderAdd-Ons
Rea
l-T
ime
Inte
rfac
e
digital network
Figure A-9. Integration of multi-source data with the DSI Toolbox
2.3. Development of State-of-the-Art Algorithms and Prototype Tools for Real time and Post-Processing of Wide-Area PMU Measurements9 Project Participants: BPA (William A. Mittelstadt, Jim Gronquist, Terry Doern), PNNL (Henry
Huang, John Hauer), EPG (Manu Parashar, Matthew Varghese), University of Wyoming (John
Pierre, Frank Tuffner), Washington State University, Cyber Inc. (Dennis Erickson), University of
Wisconsin (Ian Dobson), Montana Tech (Dan Trudnowski).
The project goals for 2005‐2006 include:
Demonstration of a prototype system capable of identifying in real time very lightly
damped or conditions of growing oscillation in sufficient time to initiate corrective
operator action.
Demonstrate a prototype system suitable to high estimation accuracy of power system
characteristics including dominant modal frequency and damping, tracking the
relationship of modal behavior to system stress, identifying trends that may result in
lower than adequate damping, tracking during power system tests, and off‐line analysis.

A‐14
2.4. Power System Identification Using Injected Probing Signals11 Project Participants: BPA (D. Kosterev, W. A. Mittelstadt), University of Wyoming (J. W. Pierre)
This research builds upon prior work extending the application of advanced signal processing
and system identification techniques to estimate power system characteristics from measured
data. For this project system identification techniques will be tested on actual and model system
data to bring them closer to serving as online and offline analysis tools. The measurements
leading to the greatest accuracy in system identification will be determined. Real time LabView
as well as MATLAB based algorithms will be compared for accuracy and efficiency.
2.5. Performance Validation and Noise Injection Staged Tests12 13 BPA has conducted comprehensive probing tests of WECC system dynamics under summer
conditions. The tests will include the following staged events:
Energization of the Chief Joseph dynamic brake
Insertion of brief sine waves and square waves by modulation of the Pacific HVDC
intertie
Insertion of sustained random noise by modulation of the Pacific HVDC Intertie
The main objectives of these tests include the following:
Obtain a seasonal benchmark for dynamic performance of the WECC system
Develop comparative data to evaluate and refine the realism of WECC modeling tools
Refine and validate methods that identify power system dynamics with minimal or no
use of probing signals
A key objective in the proposed tests is to ʺrefine and validate methods that identify power
system dynamics with minimal or no use of probing signals.ʺ Key real time resources for this
are PDC StreamReaders, located at key locations, plus the spectral analysis tool provided as an
add‐on for the PDC StreamReader. Other documents refer to this tool as dynamic signal
analyzer (DSA), and that terminology is used here.
2.6. Wide Area Stability Control System (WACS) Source: The following information is extracted from materials prepared by Carson Taylor,
originator of the WACS project while working at BPA.
Project participant: BPA
11 “Power System Identification Using Injected Probing Signals”, Statement of Work, September 10, 2005. 12 “Performance Validation and Noise Injection Staged Tests”, BPA Memorandum for DOE, August 30,
2005 (September 12 ‐ Updated). Available at:
http://www.transmission.bpa.gov/ORGs/opi/system_news/PDCITestSep05.doc
13 Dan Trudnowski, “An Initial Comparison of Mode Estimation Methods Applied Test Series D of the
BPA September 2005 Probing Tests, Working Note, Montana Tech, September 2005.

A‐15
Pacific intertie reliability and transfer capability dominates much of western interconnection
planning and operation. WACS provides wide‐area feedback (response‐based) control,
presently limited to discontinuous stabilizing actions to improve Pacific AC intertie reliability
and transfer capability.
The WACS Pacific intertie application uses WAMS synchronized positive sequence phasor
measurements communicated over self‐healing SONET rings for inputs. RAS transfer trip
circuits are available for capacitor/reactor bank and generator tripping output actions. The real
time embedded system controller has been moved from an on‐line laboratory installation to
Dittmer for final R&D monitoring and testing (especially important is testing the PDC function
programmed into WACS). Many reports, papers, and presentations on WACS are available.
WACS provides a flexible platform for control algorithms. Presently two algorithms are used.
One algorithm (Vmag) is based on 12 voltage magnitude measurements at 7 500‐kV stations.
The second algorithm (VmagQ) combines voltage magnitude measurements and generator
reactive power measurements using fuzzy logic. WACS stabilizing actions can be taken in a1
second time frame. First swing stability can be maintained, with control action reducing stress
for increased damping of subsequent swings. For growing oscillations, WACS will operate
when the oscillations become severe enough. WACS, mainly the VmagQ algorithm, will also
respond appropriately in the post‐disturbance time frame. Generator tripping is the most
powerful and important stabilizing action, especially considering that capacitor/reactor bank
switching for events not covered by RAS can also occur by local voltage relay, fast AC reactive
insertion (FACRI), or SCADA.
Potential benefits of WACS, include improved power system reliability, increased transfer
capability, a real time platform for sophisticated system monitoring and alarming, and cost
reduction for RAS‐type control.
2.7. Power System Robustness Indicators Project Participant: BPA
In the past, BPA has experimented with the idea of measuring power system robustness using
only the random behavior observed on transmission line flow or the same data in combination
with probing signal events. These measurements may in some cases be used to identify
network properties such as the slope of a P‐V curve or the slope of a P‐angle curve, both
important indicators of power system robustness. Figure A‐10 illustrates this as applied to
measurements on the California – Oregon intertie (COI). Close examination shows the slope of
the P‐V and power‐angle curves to be approximately the same for the probing signal ringdown
and the random behavior to follow.

A‐16
Figure A-10. Analysis of properties as measured on the California Oregon Intertie at Malin Substation: (a) Malin – Round Mt. MW; (b) frequency spectrum of MW flow; (c) slope of P-V curve using Malin Voltage; (c) slope of power-angle curve using John Day to Malin phase angle.
A‐17
3.0 California ISO
3.1. Grid Dynamics Monitoring / Psymetrix Source ‐ Dave Hawkins, CAISO
Participant: CAISO
The purpose of Psymetrix is to detect system dynamic operating problems and to provide
warning to the system operator so that system adjustments can be made in time to prevent wide
spread system outages and/or regional blackouts14. The Psymetrix boxes were installed at two
locations in California in Vincent Substation and Los Banos. The Psymetrix system’s proprietary
algorithm processes the local signals in the megawatt flows on the transmission grid and
determines parameters for up to five oscillatory modes. These parameters include frequency,
magnitude, and damping of oscillations. Only this information is provided to the CAISO
control center. The advantage of this system was very effective display screens to show the
operator there was a potential reliability problem. The disadvantage was there was not enough
information to determine the source or cause of the oscillations. The conclusion was many
more data points from many locations throughout the western interconnection to analyze
potential problems. The Psymetrix system has been disconnected and replaced by the Phasor
Measurement System.
3.2. Frequency Data Collection Project Contact and source ‐ Dave Hawkins, CAISO
Participant: CAISO
This is an operational system to collect and store GPS time‐stamped subsecond frequency data
from several key locations within the Western Interconnection. This project was implemented in
response to the NERC Operations Committee request. The subsecond frequency data is needed
to analyze frequency disturbances in the WECC system. The data sources are two Arbiter boxes
(similar to the ones that are used by the Independent System Operator (ISO) as frequency
sources for its EMS system – they provide 20 frequency samples per second), and PMU units
installed at selected key locations (future development). Up to 5 years of data can be stored in
the PI Historian (a database used to store frequency data).
14 “Electricity Transmission Research and Development Assessment and Gap Analysis”, CEC Public
Interest Energy Research Program (Energy Systems Integration Team), Final Consultant Report P500‐03‐
011F, Navigate Consulting, February 2003.
A‐18
3.3. Real time Dynamics Monitoring System (RTDMS) Contact and source15 – Dr. Manu Parashar, EPG
Participant: CAISO, CERTS
RTDMS is a California Energy Commission’s PIER TRP funded multi‐year project. It is
currently being conducted by CERTS in cooperation with CAISO aimed at research and
demonstration activities of real time applications of phasors for monitoring, alarming, and
control.
The emphasis of this project over the next few years is to focus on applications that are uniquely
suited for phasors. These applications will provide the real time operating staff with the
previously unavailable tools to monitor grid reliability and avoid voltage and dynamic
instability. It will also provide key metrics for tracking grid performance, such as generator
response to abnormal significant system frequency excursions.
In the near term, the measurement infrastructure will provide CAISO with an alternate,
independent real time monitoring system that could act as an end‐of‐line backup for failures
affecting CAISO’s current SCADA/EMS; in the long term, it would become a key element of
CAISO’s next generation monitoring system necessary for advanced real time control.
The initial phasor network consisted of only 14 phasor measurement units (PMUs) gathering
data at the sub‐second resolution (30 samples/second) from Bonneville Power Administration
(BPA) and Southern California Edison (SCE) and sending it in real time to CAISO. This has
subsequently grown to 42 PMUs with expanded coverage including WAPA and PG&E regions.
The RTDMS currently offers wide‐area visibility and monitoring capabilities to CAISO
operators and WECC reliability coordinators across the western interconnection. Some of the
proposed applications include the use of phasor measurements for wide area visibility, real
time monitoring and alarming, small‐signal stability assessment, frequency data collection,
nomogram validation and improvements, improved state estimation, and real time control.
The phasor RTDMS system supports a centralized RTDMS server performing key data
management functions such as data reading, cleansing, computing and archiving (short‐term,
long‐term and event archiving). Multiple RTDMS client applications may simultaneously
access the data from the central RTDMS server and present real time or historical information of
key metrics within various geographic and graphic displays. Some of the key features of this
platform include:
Server and multi‐client system architecture
Central and/or local configurability through GUI
15 See also David Hawkins, “California ISO Phasor Measuring System”, Presentation at the Eastern
Interconnect Phasor Project (EIPP) Meeting, Portland, Oregon, December 6‐7, 2004. – Available at:
http://phasors.pnl.gov.

A‐19
Synchronized sub‐second phasor data currently read in real time PDCStream format
Data access and visualization capability across local area network on secure web
connection.
Data quality filters to cleanse data in real time
Real time data cached in memory for fast access
Historical data archived onto disk
Event archiving into files for post‐disturbance assessment.
Real time alarming and event detection capability
Visualization of key metrics within multi‐panel displays, graphic‐geographic and textual
visuals, navigational tools including zooming and panning capabilities, and color coded
visual alarms.
Replay capability of cached data
Report generation on long‐term trends of key metrics, PMU or PDC performance and
historical records of events and alarms.
Working with CAISO, various applications that are well suited for phasor measurements and
meet the CAISO needs have been identified and are either under development or planned for
development on the existing RTDMS platform. These applications include:
1) Visualization: The focus here is to identify and address wide‐area visualization needs
on this phasor data within standardized displays and situational awareness screens with
special attention toward avoiding screen clutter (Figure A‐11).
Some of the existing visualization capabilities that have already been developed on the platform
include:
Summary Dashboard Display
Provides integrated information in a common centralized display
Provides real time situational information at a glance
Voltage Magnitude and Relative Angles
comprehensive profile of voltage angles and magnitudes
identify the high and low voltage regions within the grid
monitor angles relative to a specific reference
Angle Differences across Identified Transmission Flowgates
provides a birds‐eye view of the sources and sinks of power
monitor phase angle differences across key flowgates

A‐20
Figure A-11. Wide Area Visualization with Phasors – Illustrative RTDMS Situational Awareness Screen
System and Local Frequencies
assess system coherency and dynamic stress under normal operating conditions
identify approximate point of acceleration or deceleration (loss or load or
generation)
Real and Reactive Power Flows Across Monitored Lines
monitor actual MW and MVAR flows at key flowgates track flows with respect to
predefined thresholds
2) Monitoring: The focus of this task is to develop real time monitoring, alarming and reporting
capabilities based on advanced monitoring metrics and indicators derived from this high
resolution phasor data. Examples of advanced metrics whose performance could be monitored
and tracked include sensitivity computations (such as voltage sensitivities at load buses or
angle sensitivities at generator buses), and generator frequency response characteristics.

A‐21
3) Small‐Signal Stability: The focus of this task is to develop a prototype application that
analyzes phasor data in real time to identify dominant low‐frequency electromechanical modes
in the system and detect lightly damped oscillations under ambient conditions (i.e., mode
frequencies, shapes, and damping). The idea is to alert operators when the system is
experiencing poor damping. Bonneville Power Administration (BPA) also shares a common
interest in the area of small‐signal stability. BPA has been a pioneer in the phasor technology
area and presently has over 15 of their own PMUs installed and connected to the WECC phasor
network. They are interested in extracting data both for real time processing to provide alarms
for system operators for impending trouble as well as observing the state of the system during
staged system tests. Both CERTS and BPA are collaborating on this small‐signal stability
prototype application research and development effort, thereby leveraging each others
expertise and eliminating unnecessary duplication.
4) Frequency Data Collection: The focus of the Frequency Data Collection project has been to
collect and archive sub‐second frequency data from PMUs to meet new NERC‐WECC Western
Interconnection frequency data collection requirements.
5) Stability Nomogram Validation: This task addresses wide‐area research needs that extend
beyond the CAISO, which is the use of phasor measurements for real time wide‐area control.
As a first step towards achieving this goal, the objective is to research and develop methods for
utilizing phasor measurement to validate and possibly improve stability nomograms. A
feasibility assessment study proposing several approaches of using these time synchronized,
high resolution PMU measurements, and possibly other EMS/SCADA data, for better
assessment of the system operating conditions with respect to their stability limits has already
been conducted.
Additionally, CERTS continues to provide technical assistance and coordination to each of the
California utilities in support of their chosen interests in this technology (e.g., local remedial
action controls, state estimation using phasor measurements, and critical path monitoring) as
well as WECC‐EIPP collaboration and knowledge exchange, and collaboration with industry
and academic experts.
3.4. Use of PMUs to Provide More Accurate Data on the CAISO Interchange Participant: CAISO
As every control area, the ISO system is surrounded by the EMS/SCADA meters measuring the
active power flows on the interties connecting it with the neighboring control areas. This
information provided by these meters is fed into the CAISO Automatic Generation Control
(AGC) system, where it is used to calculate the Area Control Error (ACE). The correct ACE
calculation is very important to ensure the correct operation of the control area. The described
project aims to supplement the EMS/SCADA meters by PMUs to improve the accuracy and
synchronization of the CAISO interchange data. The ultimate goal is to use the time
synchronized data from the interconnection points to improve the accuracy of the EMS State
Estimator Program.
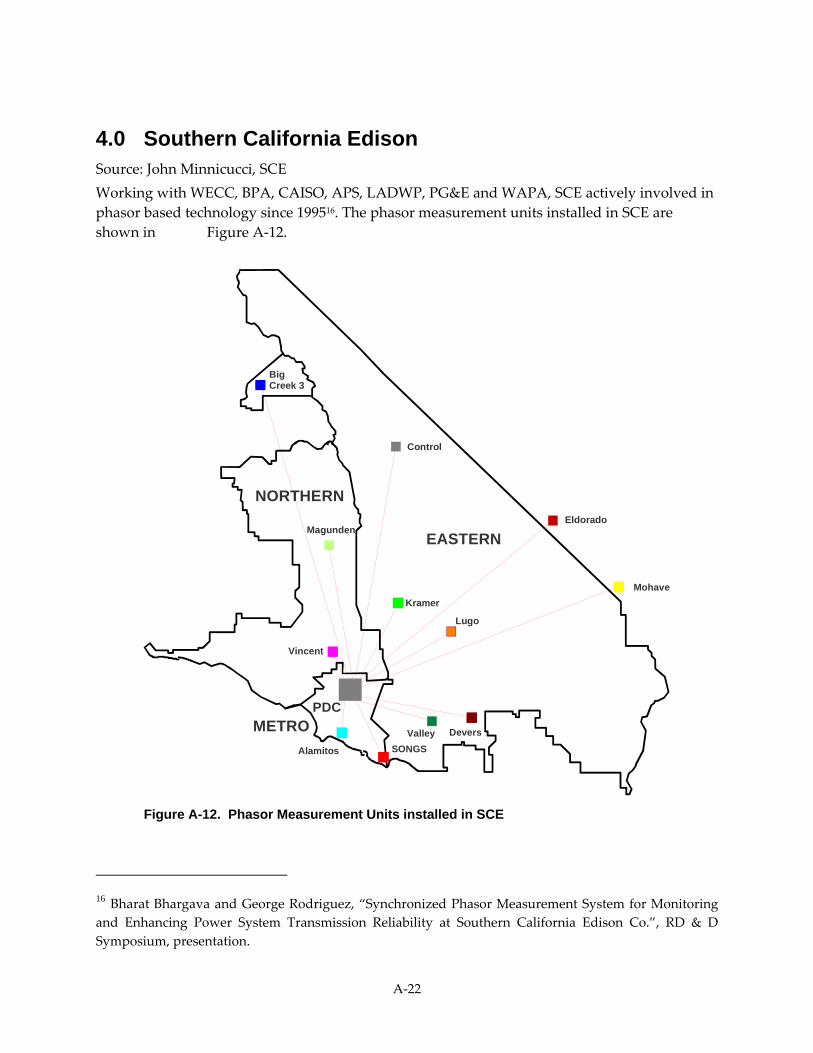
A‐22
4.0 Southern California Edison Source: John Minnicucci, SCE
Working with WECC, BPA, CAISO, APS, LADWP, PG&E and WAPA, SCE actively involved in
phasor based technology since 199516. The phasor measurement units installed in SCE are
shown in Figure A‐12.
Big Creek 3
EASTERN
Devers
Mohave
SONGS
Vincent
Kramer
Alamitos
PDC
NORTHERN
METRO
Control
Magunden
Valley
Eldorado
Lugo
Figure A-12. Phasor Measurement Units installed in SCE
16 Bharat Bhargava and George Rodriguez, “Synchronized Phasor Measurement System for Monitoring
and Enhancing Power System Transmission Reliability at Southern California Edison Co.”, RD & D
Symposium, presentation.

A‐23
The following applications of synchronized phasor measurements have been outlined as
follows:
1) Off‐line Applications:
Monitoring system stress (Phase‐angle separations)
Monitoring voltage support at critical locations
Monitoring modal oscillations and modal damping
Monitoring dynamic power swings
Post disturbance analysis (what operated correctly or incorrectly)
Model validation for off‐line analysis tools
Monitoring machine excitation and governor systems
System voltage and reactive power management
Pattern recognition and artificial intelligent (AI) tools for quick event analysis
System load response to voltage and frequency variations
2) Real time Applications:
Monitoring system stress (Phase‐angle separations)
Monitoring critical voltage support
Monitoring frequency and df/dt
Monitoring critical line status and outages
Monitoring modal oscillations and modal damping
Monitoring dynamic power swings
Integration with SCADA and EM systems
Real time control such as on HVDC modulation and FACTS devices
Monitoring machine excitation and governors
Voltage and reactive power management
AI and pattern recognition tools for quick event analysis
3) Data Interchange with other Utilities/RTOs
Data is high resolution and very sensitive/informative
Need to share with others to see the full system picture
Will help operators to immediately determine the loss of generation/load in other
control areas, assess system separations and system situation
Will help in early system restoration
Requires appropriate agreements to safeguard data use

A‐24
Working with WECC Disturbance Monitoring group
Exchanging data with BPA and Cal‐ISO real time
Planning to interchange data with PG&E, APS, LADWP and WAPA in near future
4.1. Synchronized Phasor Measurement activities at SCE Installed 14 phasor measurement Units
Installed two phasor data concentrators, which are now in operation at Grid Control
Center at Alhambra
Developed Power System Outlook program to view MW, MVAR, voltage, currents,
modal oscillations and their damping
Developing real time displays and will be installing them in Grid Control Center early
2007
Storing streaming and event data files and compressing files for viewing larger time
frame history
Participating in WECC, DOE and CEC efforts in advancing this technology
Installing PMUs to cover all 500 kV substations
Working with Grid Control Center to enhance visualization and monitoring critical
subsystems and bulk power system reliability (WECC system)
Need to improve reliability of the overall system so that it can be used as a tool by our
system operators
Providing SCE data to California ISO for improving California system reliability
Presented papers on this technology at CIGRE (Paris)
4.2. PMU-based RAS SCE is taking the lead in developing a Public Interest Energy Research (PIER) research project
using phasor information to inform a remedial action scheme near one of its hydro power
plants. With phasor technology, SCE hopes to eliminate several unnecessary transmission
circuit trips per year while improving the accuracy and reliability of the control system17.
17 “Strategic Transmission Investment Plan”, California Energy Commission Report CEC 100‐2005‐006‐
CMF, November 2005.

A‐25
5.0 San Diego Gas & Electric
5.1. Improved State Estimation SDG&E is taking the lead in developing a PIER research project using phasor information to
increase the accuracy of its state estimator, which predicts the state of the transmission grid by
sampling key parameters and locations. It is eventually expected that results of this research
will contribute to enhanced transfer capability at the Miguel Substation, helping to relieve a
significant congestion problem17.
5.2. Disturbance Monitoring Work Group (DMWG) 18 Source: Peter Mackin (TANC)
Darren McCrank (AESO)
The Disturbance Monitoring Work Group (DMWG) monitors NERC requirements for system
disturbance and performance monitoring. The Disturbance Monitoring Work Group also
oversees periodic reviews and updates of the WECC Plan for Dynamic Performance and
Disturbance Monitoring (Plan), compiling and maintaining required performance monitoring
databases for the region, recommending WECC budget items and drafting other procedures as
required. The projects that DMWG is involved in are listed in the following sections.
5.3. Modeling and Validation The modeling and validation task includes two major tasks: the load modeling and validation
and the generation modeling and validation.
5.3.1. Load modeling
Application of local PPSM units help to understand the static and dynamic nature of system
loads. Load behavior has a marked effect on power system dynamics. Motor stalling following
a network fault can lead to slow voltage recovery or even voltage collapse. Motor dynamics
have been shown to be a contributing factor to North‐South oscillations in the Western
Interconnection
Southern California Edison (SCE) installed PMUs in their load centers. These PMUs provided
valuable data for model validation of the August 5, 1997 Lugo and July 24, 2004 Valley events.
5.3.2. Generator modeling
Generator monitoring provides a means to understand the level of agreement between the
system and the simulation, and if detailed testing is needed.
18R. Peter Mackin, Dmitry Kosterev, Bill Mittelstadt; John Hauer et al., ʺBenefits of Power System
Dynamic Performance Monitoring In the Western Power System,ʺ Interim Report of the WECC
Disturbance Monitoring Work Group, August 17, 2005.

A‐26
To restore confidence in the simulations and the generator models, the Western Systems
Coordinating Council (WSCC) instituted a requirement that all generators greater than 10 MW
be tested to confirm the data used to represent them in dynamic simulations was accurate. More
than 75% of generator owners have complied with the WSCC testing requirements to date.
Power plant data has been updated, and the correspondence between the simulations and
disturbance recordings has improved, as evidenced by recent studies done by WECC Governor
Task Force.
Several issues came up with the present WECC generator testing program, including:
verifying that the test data is adequate, and
keeping the database current.
The ultimate goal is to have the model data reasonably represent the power plant response to
grid disturbances. Therefore, the best model validation is done by comparing the simulated
and recorded responses of system disturbances. Then, based on the correspondence between
simulations and recordings, the decision can be made on model data adequacy and need for
testing. In BPA validation studies, the test data for The Dalles and John Day did not reproduce
the recorded generator responses to system frequency excursions. Model revision and
additional testing were needed to get a reasonable correspondence between simulations and
recordings. In the same study, simulations with Grand Coulee test data were in close
agreement with the disturbance recordings.
To address the issue of keeping the database current, the WSCC required periodic 5‐year re‐test
of generators for model validation. Generator owners have been questioning the need for
repetitive testing. Repeating the original testing is possible. The direct cost of testing has been
larger than initially estimated but is still manageable. But simply repeating the special tests is
not the only alternative. Generating equipment testing is not the goal, but is rather a vehicle for
validating model data. Disturbance monitoring can be a cost‐effective alternative to the direct
testing, particularly for large steam‐turbine generators.
To facilitate the validation process using disturbance recordings, General Electric developed a
“playback” function in GE’s PSLF program. The recorded bus voltage and frequency are
inserted as driving functions into dynamic simulation. The power plant’s real and reactive
powers are used as “measures of success.” The comparison between simulated and recorded
results is used to validate the model performance for grid voltage and frequency disturbances.
To date, continuous high‐speed monitors have been installed at interconnection points of major
power plants, totaling more than 25,000 MW of generating capacity. BPA is using the collected
disturbance data for routine model validation of generators in its control area.
5.3.3. System Test Monitoring
The tests include:
Probing signal testing
Slatt thyristor controlled series capacitor (TCSC) testing

A‐27
Braking resistor tests
Generator tripping tests for frequency regulation reserves (FRR)
5.3.4. Control System Certification and Monitoring
5.3.5. High side voltage control
A high‐speed, high side voltage control (HSVC) developed by Mitsubishi was tested at two
units at The Dalles power plant in September 2002. The HSVC is an advanced line drop
compensation that interfaces with existing voltage regulators. Beneficial for hydro plants with
distant switchyards, high side voltage measurement is not used. For terminal connected units,
cross‐current compensation is included and was tested. The tests were successful. Existing BPA
phasor measurements from Big Eddy 230‐kV substation were recorded at the BPA control
center and immediately emailed to the test team at The Dalles.
5.3.6. Generator Voltage Control
With the recent surge in wind power facilities (WPF) being interconnected on the Alberta
Interconnected Electric System (AIES), there has been an increasingly growing focus on how
this emerging technology will effect and control voltage. The Alberta Electric System Operator
(AESO) has voltage control requirements for these WPFs that ensures the AIES obtains the
necessary local area voltage support during steady state conditions and system disturbances.
The AESO recognizes that WPFs will utilize different technologies for voltage control and
regulation, and it is extremely important that the AESO’s requirements are being met. The
PMU has become a critical tool in performing these assessments, giving the AESO continuous
and high frequency data showing the WPF voltage regulating response and effects.
All recent large WPF projects in Alberta have been specified to have a PMU installed. The PMU
monitors the high side transmission voltage, low side (collector bus or buses) voltage, and any
bus where Var support may flow from (example: a bus connecting a Static Var Compensator).
During commissioning of the WPF, traces are captured to monitor the reactive power dynamic
responses caused by system events and induced voltage step events. These responses are
assessed to determine if they are caused by voltage regulating control loops and if the responses
are stable and timely. The PMU provides the AESO with a tool that records at a high enough
sample rate to be able to provide a picture of the speed of response of the WPF.
A recent example of this assessment using a PMU came in the commissioning of a WPF in
Southern Alberta.
5.3.7. Reactive current compensator (Dmitry Kosterev, BPA)
Field testing and monitoring were used to tune and verify that reactive current compensation
implemented at several hydro plants is working correctly.
5.3.8. HVDC Voltage Dependent Current Order Limiter (VDCOL) (Dmitry Kosterev, BPA)
Monitoring and simulations were used to design and certify operation of HVDCOL

A‐28
5.3.9. Fast AC Reactive Insertion (FACRI)
Monitoring is used to verify that FACRI is inserting correctly when needed.
5.3.10. Transient Excitation Boost (TEB) (Carson Taylor and Bill Mittelstadt)
Phasor measurements were used to verify that TEB was operating correctly for HVDC line
outages. There were concerns about the effect of temporary 500‐kV over‐voltage on the 550‐kV
cables from the power plant.
5.3.11. Keeler and Maple Valley SVCs
PPSMs at these locations are used to provide detailed information on operation of the SVCs and
to verify proper operation. These led to making correction in the SVC simulation
representation.
5.4. Real time Observation of System Performance
5.4.1. Phase-angle Monitor
The precise measurement of system phase angles across a wide geographic area provides
unique opportunities for indicating the relative stress of the power system. The current PMUs
offered by vendors have demonstrated their capability in reliably delivering real time phasor
measurements to a central point where the angles can then be easily computed.
Integration of this information to EMS or SCADA systems providing additional indication of
power system components such as reactive support, transmission lines, generators, etc. could
provide novel operator displays, which can show the relative stress across the power system
and therefore its susceptibility to stability problems likely under those operating conditions.
5.4.2. Oscillation Monitor
There have been recent events in the WECC grid that have indicated small amplitude
oscillations can occur given the correct operating conditions. WECC installed PMUs recorded
these events and provided excellent post‐disturbance data for analysis. This information is
streamed continuously to centralized host computers, which in turn can provide an opportunity
to monitor the presence of these oscillations in real time.
Critical paths and identified oscillation modes have been under study in the WECC for many
years. These oscillations can indicate more serious conditions developing if left unchecked. In
addition to computing the magnitude and spectrum of the oscillation components, real time
knowledge of the system angles also help in identifying participating nodes as well.
Finally the oscillation monitor can also be used to estimate power system damping including
the presence of low damping conditions as an indication of the security of the power system.
5.4.3. Operator Robustness Tool
Robustness tools are being developed to provide dispatchers with an indication of power
system synchronizing strength and voltage stability. The real time streaming of the phasor data
provides an opportunity to use novel visualization tools that could indicate in a graphical
manner the overall condition of the power system.

A‐29
Recent demonstrations by third‐party software suppliers have shown the concept is workable.
Additional work is required to determine those parameters that need to the presented and the
type of visual presentation that would give the most information. Clearly, flashing numbers on
a SCADA screen is not desirable. Colored graphs, contour plots, virtual meters, etc. have been
investigated that would give operators instant knowledge of system security under changing
conditions.

A‐30

A‐31
6.0 Glossary
AESO Alberta Electric System Operator
AIES Alberta Interconnected Electric System
BPA Bonneville Power Administration
CAISO California Independent System Operator
CEC California Energy Commission
CERTS Consortium for Electric Reliability Technology Solutions
CIEE California Institute for Energy and Environment
COI California-Oregon Interties
DMWG Disturbance Monitoring Work Group of the WECC
DOE Department of Energy
DSA Dynamic Signal Analyzer
DSI Dynamic System Identification
EIPP Eastern Interconnection Phasor Project
EMS Energy Management System
EPG Electric Power Group
EPRI Electric Power Research Institute
FACTS Flexible AC Transmission System
FACRI Fast AC Reactive Insertion
FFT Fast Fourier Transform
FPA Fast Prony Analysis
FRR Frequency Regulating Reserves
GE General Electric
GUI Graphic User Interface
HSVC High Side Voltage Control
HVDC High Voltage DC (Direct Current)
M&VWG Monitoring & Validation Work Group of the WECC
PDC Phasor Data Concentrator
PIER Public Interest Energy Research
PMU Phasor Measurement Unit
PNNL Pacific Northwest National Laboratory
PPSM Portable Power System Monitor
PSLF Positive Sequence Load Flow

A‐32
PSM(1) Power System Monitor (primary definition)
PSM(2) Power System Measurements (secondary definition)
RAS Remedial Action Scheme
RTDMS Real time Dynamic Monitoring System
SCADA Supervisory Control And Data Acquisition
SCE Southern California Edison
SDG&E San Diego Gas & Electric
SRP Salt River Project
SVC Static VAR Compensator
TCSC Thyristor-Controlled Series Capacitor
TRP Transmission Research Program
WACS Wide Area Stability Control System
WAMS Wide Area Measurement System
WAPA Western Area Power Administration
WECC Western Electricity Coordinating Council
WeSDINet Western System Dynamic Information Network
WPF Wind Power Facilities
WSCC Western Systems Coordinating Council

i
Appendix B - Technology Review


Table of Contents
Acknowledgments ............................................................................................................................. iii
Preface v
List of Figures ..................................................................................................................................... ix
List of Tables ....................................................................................................................................... ix
Executive Summary ........................................................................................................................... 1
1.0 Introduction .......................................................................................................................... 9
2.0 Project Approach ................................................................................................................. 13
3.0 Project Outcomes ................................................................................................................. 15
3.1. Key Overall Benefits ...................................................................................................... 15
3.2. Application Benefits ....................................................................................................... 19
3.3. Applications Roadmap .................................................................................................. 38
3.4. Business Case Analysis Guidebook ............................................................................. 42
3.5. System Architecture and Deployment Gaps .............................................................. 48
4.0 Recommendations and Conclusions ................................................................................. 53
4.1. Recommendations and Key Success Factors .............................................................. 53
4.2. Conclusions ..................................................................................................................... 54
5.0 Reference ............................................................................................................................... 57
6.0 Glossary ................................................................................................................................ 58
Appendix A ‐ Western Interconnection Phasor Based Projects................................................... 1
List of Figures ..................................................................................................................................... iii
Preface iii
1.0 Western Electricity Coordinating Council (WECC) WAMS (Wide Area Measurement
System) Project ..................................................................................................................... 1
1.1. PMU Testing and Evaluation ....................................................................................... 3
1.2. WAMS Information Manager7 ..................................................................................... 3
1.3. Algorithms and Tools Development7 .......................................................................... 4
1.4. On‐line Disturbance Monitoring Tool7 ........................................................................ 5
1.5. System Benchmarking7 .................................................................................................. 6
1.6. Disturbance Analysis and Monitoring7 ....................................................................... 8
1.7. Early Warning Detection ............................................................................................... 8
2.0 Bonneville Power Administration .................................................................................... 11
2.1. Overview ......................................................................................................................... 11

ii
2.2. DSI Toolbox ..................................................................................................................... 12
2.3. Development of State‐of‐the‐Art Algorithms and Prototype Tools for Real time and
Post‐Processing of Wide‐Area PMU Measurements8 ............................................... 13
2.4. Power System Identification Using Injected Probing Signals .................................. 14
2.5. Performance Validation and Noise Injection Staged Tests ..................................... 14
2.6. Wide Area Stability Control System (WACS) ............................................................ 14
2.7. Power System Robustness Indicators .......................................................................... 15
3.0 California ISO ....................................................................................................................... 17
3.1. Grid Dynamics Monitoring / Psymetrix ..................................................................... 17
3.2. Frequency Data Collection Project ............................................................................... 17
3.3. Real time Dynamics Monitoring System (RTDMS) ................................................... 18
3.4. Use of PMUs to Provide More Accurate Data on the CAISO Interchange ............ 21
4.0 Southern California Edison ................................................................................................ 22
4.1. Synchronized Phasor Measurement activities at SCE ............................................... 24
4.2. PMU‐based RAS ............................................................................................................. 24
5.0 San Diego Gas & Electric .................................................................................................... 25
5.1. Improved State Estimation ........................................................................................... 25
5.2. Disturbance Monitoring Work Group (DMWG) ...................................................... 25
5.3. Modeling and Validation .............................................................................................. 25
5.4. Real time Observation of System Performance .......................................................... 28
6.0 Glossary ................................................................................................................................ 31
List of Figures ..................................................................................................................................... vii
List of Figures ..................................................................................................................................... xi
List of Tables ....................................................................................................................................... xi
1.0 Project Overview ................................................................................................................. 1
1.1. Background ..................................................................................................................... 1
1.2. Introduction .................................................................................................................... 2
1.3. Key Overall Benefits ...................................................................................................... 4
1.4. Western Interconnection Phasor‐Based Projects ........................................................ 7
2.0 Application Benefits ............................................................................................................ 9
2.1. Real time monitoring and control ................................................................................ 9
2.2. State of the Art Review .................................................................................................. 20
2.3. Benefits ............................................................................................................................. 20
2.4. Implementation Considerations ................................................................................... 21

iii
2.5. Previous Experience ....................................................................................................... 24
2.6. Gap Analysis ................................................................................................................... 24
3.0 Real‐Time Congestion Management ................................................................................ 28
3.1. State of the Art Review .................................................................................................. 28
3.2. Benefits ............................................................................................................................. 29
3.3. Implementation Considerations ................................................................................... 30
3.4. Previous Experience ....................................................................................................... 31
3.5. Gap Analysis ................................................................................................................... 31
4.0 Benchmarking, validation and fine‐tuning of system models ...................................... 34
4.1. State of the Art Review .................................................................................................. 34
4.2. Benefits ............................................................................................................................. 36
4.3. Implementation Considerations ................................................................................... 37
4.4. Previous Experience ....................................................................................................... 37
4.5. Gap Analysis ................................................................................................................... 38
5.0 Post‐Disturbance Analysis ................................................................................................. 40
5.1. State of the Art Review .................................................................................................. 40
5.2. Benefits ............................................................................................................................. 41
5.3. Implementation Considerations ................................................................................... 41
5.4. Previous Experience ....................................................................................................... 42
5.5. Gap Analysis ................................................................................................................... 42
6.0 Power‐system restoration ................................................................................................... 44
6.1. State of the Art Review .................................................................................................. 44
6.2. Benefits ............................................................................................................................. 44
6.3. Implementation Considerations ................................................................................... 45
6.4. Previous Experience ....................................................................................................... 45
6.5. Gap Analysis ................................................................................................................... 46
7.0 Protection and Control Applications for Distributed Generation ................................ 48
7.1. State of the Art Review .................................................................................................. 48
7.2. Benefits ............................................................................................................................. 50
7.3. Implementation Considerations ................................................................................... 50
7.4. Previous Experience ....................................................................................................... 51
7.5. Gap Analysis ................................................................................................................... 51
8.0 Overload Monitoring and Dynamic Rating ..................................................................... 52
8.1. State of the Art Review .................................................................................................. 52

iv
8.2. Benefits ............................................................................................................................. 52
8.3. Implementation Considerations ................................................................................... 53
8.4. Previous Experience ....................................................................................................... 55
8.5. Gap Analysis ................................................................................................................... 55
9.0 Adaptive Protection ............................................................................................................ 58
9.1. State of the Art Review .................................................................................................. 58
9.2. Benefits ............................................................................................................................. 59
9.3. Out‐of‐step relays ........................................................................................................... 60
9.4. Adaptive line relays ....................................................................................................... 60
9.5. Adaptive security and dependability .......................................................................... 60
9.6. Adaptive reclosing ......................................................................................................... 61
9.7. Fault location .................................................................................................................. 61
9.8. Implementation Considerations ................................................................................... 62
9.9. Previous Experience ....................................................................................................... 62
9.10. Gap Analysis ................................................................................................................... 62
10.0 Planned Power System Separation ................................................................................... 65
10.1. State of the Art Review .................................................................................................. 66
10.2. Benefits ............................................................................................................................. 68
10.3. Implementation Considerations ................................................................................... 69
10.4. Previous Experience ....................................................................................................... 69
10.5. Gap Analysis ................................................................................................................... 70
10.6. PMU System Architecture – Status and Gaps ............................................................ 72
11.0 References ............................................................................................................................. 74
Appendix B‐1 ‐ EIPP perspective on PMU technology ................................................................ 87
Appendix B‐2 – Voltage Instability ................................................................................................. 91
1.0 Examples of Current Systems ............................................................................................ 92
2.0 Protection Against Voltage Collapse In The Hydro‐Quebec System ........................... 93
3.0 Blocking Of On‐Load Tap Changers (OLTCs) On Distribution Transformers (EDF
Experience) ........................................................................................................................... 93
4.0 Reduction of Set‐Point Voltages In An Area Depending On Voltage Criteria ........... 93
5.0 A Voltage‐Instability protection scheme based on PMUs ............................................. 94
Appendix C ‐ Business Case Evaluation Matrix ............................................................................ 97
Appendix D ‐ Anecdotal ................................................................................................................... 1
Appendix E – Business‐Case Study Examples ............................................................................... 3

v
1.0 Phase I – Identify Areas for Analysis. .............................................................................. 1
2.0 Phase II – Analyze Opportunities for Improvement ...................................................... 2
3.0 Phase III – Identify Stakeholders ....................................................................................... 3
4.0 Phase IV – Estimate Deployment Plan and Costs ........................................................... 4
5.0 Phase V – Perform Payback Analysis ............................................................................... 5
References ........................................................................................................................................... 13
Appendix F ‐ EIPP‐CIEE Survey – May 19, 2006 ........................................................................... 14
PMU Benefits and Justification ........................................................................................................ 1
An EIPP‐NERC‐CIEE Survey ........................................................................................................... 1

vi

vii
List of Figures
Table of Contents
List of Figures ..................................................................................................................................... xi
List of Tables ....................................................................................................................................... xi
1.0 Project Overview ................................................................................................................. B‐1
1.1. Background ..................................................................................................................... B‐1
1.2. Introduction .................................................................................................................... B‐2
1.3. Key Overall Benefits ...................................................................................................... B‐4
1.4. Western Interconnection Phasor‐Based Projects ........................................................ B‐7
2.0 Application Benefits ............................................................................................................ B‐9
2.1. Real time monitoring and control ................................................................................ B‐9
2.2. State of the Art Review .................................................................................................. B‐20
2.3. Benefits ............................................................................................................................. B‐20
2.4. Implementation Considerations ................................................................................... B‐21
2.5. Previous Experience ....................................................................................................... B‐24
2.6. Gap Analysis ................................................................................................................... B‐24
3.0 Real‐Time Congestion Management ................................................................................ B‐28
3.1. State of the Art Review .................................................................................................. B‐28
3.2. Benefits ............................................................................................................................. B‐29
3.3. Implementation Considerations ................................................................................... B‐30
3.4. Previous Experience ....................................................................................................... B‐31
3.5. Gap Analysis ................................................................................................................... B‐31
4.0 Benchmarking, validation and fine‐tuning of system models ...................................... B‐34
4.1. State of the Art Review .................................................................................................. B‐34
4.2. Benefits ............................................................................................................................. B‐36
4.3. Implementation Considerations ................................................................................... B‐37
4.4. Previous Experience ....................................................................................................... B‐37
4.5. Gap Analysis ................................................................................................................... B‐38
5.0 Post‐Disturbance Analysis ................................................................................................. B‐40
5.1. State of the Art Review .................................................................................................. B‐40
5.2. Benefits ............................................................................................................................. B‐41
5.3. Implementation Considerations ................................................................................... B‐41

viii
5.4. Previous Experience ....................................................................................................... B‐42
5.5. Gap Analysis ................................................................................................................... B‐42
6.0 Power‐system restoration ................................................................................................... B‐44
6.1. State of the Art Review .................................................................................................. B‐44
6.2. Benefits ............................................................................................................................. B‐44
6.3. Implementation Considerations ................................................................................... B‐45
6.4. Previous Experience ....................................................................................................... B‐45
6.5. Gap Analysis ................................................................................................................... B‐46
7.0 Protection and Control Applications for Distributed Generation ................................ B‐48
7.1. State of the Art Review .................................................................................................. B‐48
7.2. Benefits ............................................................................................................................. B‐50
7.3. Implementation Considerations ................................................................................... B‐50
7.4. Previous Experience ....................................................................................................... B‐51
7.5. Gap Analysis ................................................................................................................... B‐51
8.0 Overload Monitoring and Dynamic Rating ..................................................................... B‐52
8.1. State of the Art Review .................................................................................................. B‐52
8.2. Benefits ............................................................................................................................. B‐52
8.3. Implementation Considerations ................................................................................... B‐53
8.4. Previous Experience ....................................................................................................... B‐55
8.5. Gap Analysis ................................................................................................................... B‐55
9.0 Adaptive Protection ............................................................................................................ B‐58
9.1. State of the Art Review .................................................................................................. B‐58
9.2. Benefits ............................................................................................................................. B‐59
9.3. Out‐of‐step relays ........................................................................................................... B‐60
9.4. Adaptive line relays ....................................................................................................... B‐60
9.5. Adaptive security and dependability .......................................................................... B‐60
9.6. Adaptive reclosing ......................................................................................................... B‐61
9.7. Fault location .................................................................................................................. B‐61
9.8. Implementation Considerations ................................................................................... B‐62
9.9. Previous Experience ....................................................................................................... B‐62
9.10. Gap Analysis ................................................................................................................... B‐62
10.0 Planned Power System Separation ................................................................................... B‐65
10.1. State of the Art Review .................................................................................................. B‐66
10.2. Benefits ............................................................................................................................. B‐68

ix
10.3. Implementation Considerations ................................................................................... B‐69
10.4. Previous Experience ....................................................................................................... B‐69
10.5. Gap Analysis ................................................................................................................... B‐70
10.6. PMU System Architecture – Status and Gaps ............................................................ B‐72
11.0 References ............................................................................................................................. B‐74
Appendix B‐1 ‐ EIPP perspective on PMU technology
Appendix B‐2 – Voltage Instability

x

xi
List of Figures
Figure B‐1. Stock Movement after the August 14, 2003 Blackout. .................................................. B‐5
Figure B‐2. History of Widespread Blackouts: Customers Affected............................................... B‐6
Figure B‐3. Oscillations observed by two PMUs on the European grid ..…..…..…..... ..…..….. B‐13
Figure B‐4. Dashboard demonstrating visualization capability……………………….……..…. B‐19
Figure B‐5. A nondetection zone (NDZ) defined within the “power mismatch space” .......... B‐49
Figure B‐6. Comparison of different thermal measuring systems over five days . ................... B‐55
Figure B‐7. Out‐of‐step protection with PMUs ................................................................................ B‐70
Figure B2‐1.Coalescing of the stable and unstable power system equlibria.............................. B‐991
Figure B2‐2. Estimates of the time to voltage collapse .................................................................. B‐995
List of Tables
Table B‐2. Features of various technologies to measure sag. ......................................................... B‐54
Table B1‐1. Problem assessment and research needs, EIPP. .......................................................... B‐88
Table B1‐2. Research roadmap devised by EIPP. ............................................................................ B‐89

xii

B‐1
1.0 Project Overview
1.1. Background In order for public interest benefits from PIER research to be realized by California ratepayers,
energy consumers in general or the public at large, the private/regulated business sector often
must be the one to decide to deploy the research products or results in a commercial
framework. This tenet is especially true for the electric transmission sector, because as a rule the
ratepayers, the public and public institutions do not purchase and deploy grid technologies.
Only entities such as the IOUs and CAISO have the means to deploy these beneficial
technologies in the transmission system.
These transmission owners, operators and planners will usually deploy these technologies only
if a commercial business case can be made. In order to improve the chances that the end
products or results of PIER research will be commercially deployable, the successful selection of
technology research candidates for the TRP portfolio can be enhanced by conducting early‐on
business case studies for these technologies.
The results of such early studies, while quite approximate given the immaturity of the
technology and market, can provide useful insights to the expected commercial success and the
value of completed research efforts. Such studies can also identify economic and financial
barriers to commercial deployment. Should the TRP research product or result have such high
public value that policy decision makers decide to accelerate its adoption before full commercial
development, such business case studies can provide a better understanding of the underlying
business aspects and barriers to commercialization that should be considered in successful
legislation or regulation.
This project will conduct a business case study for transmission phasor‐measurement‐based
technologies.
CA ISO’s traditional security assessment approach – based on SCADA data and off‐line studies
conducted long in advance of real time operations – are becoming increasingly unreliable for
real time operations because they cannot fully anticipate all the conditions faced by operators.
New technologies, which rely on accurate, high‐resolution, real‐time monitoring of actual (not
hypothesized) system conditions using phasor measurement technologies, are needed to
support the CA ISO’s real‐time operations. The purpose of these tools and systems is to
monitor, assess, enable, and ultimately, automatically take the necessary control action to
prevent or mitigate problems in real time.
The proposed applications of phasor measurements will provide the real‐time operating staff
with previously unavailable yet greatly needed tools to avoid voltage and dynamic instability,
and monitor generator response to abnormal significant system frequency excursions. Perhaps
of equal or greater importance in the near term, the measurement infrastructure will provide
CAISO with an alternate, independent real‐time monitoring system that could act as an end‐of‐
line backup for failures affecting CA ISO’s current SCADA/EMS. In the long term, it would
become a key element of CA ISO’s next generation monitoring system necessary for advanced

B‐2
real time control. Phasor measurements will also have applications for other California grid
stakeholders, such as the IOUs.
The first research‐grade demonstration of phasor technologies was undertaken by DOE/ EPRI/
BPA/ WAPA in the early 1990s. The system was effectively used to investigate causes of the
major 1996 west coast blackouts. DOE has continued to support outreach for these
technologies, and has provided technical support to the WECC committees that rely on these
data for off‐line and model validation reliability studies. PIER supported research,
development, and prototype‐testing of a real‐time dynamic monitoring system (RTDMS)
workstation to support offline analysis by CA ISO staff in 2002. In 2003 through 2005, PIER
supported the deployment of a real‐time phasor data analysis, voltage and dynamic stability
assessment, and data visualization applications to monitor grid actual conditions, using wide
area phasor data from BPA, WAPA, SCE and PG&E.
The broader goal of this project is to collaborate with Policy Advisory Committee‐member
organizations and other stakeholders to expand the applications of phasor‐measurement and
related data analysis, operator diagnostic and actionable information visualization technologies
by transmission owners and independent system operators throughout the WECC, Canada and
Mexico to yield reliability, congestion management and other market related benefits for
California electric customers. Potential economic benefits could include reducing congestion
costs estimated to be approximately $250 million per year in California and avoiding major
system disturbances and blackouts, which can cost consumers several billion dollars per major
incident.
1.2. Introduction Congestion issues and worldwide disturbances have emphasized a need for a grid to be
enhanced with wide area monitoring, protection, and control (WAMPAC) systems as a cost‐
effective solution to improve system planning, operation, maintenance, and energy trading
0Error! Reference source not found. WAMPAC systems should take advantage of the latest
advances in sensing, communication, computing, visualization, and algorithmic techniques and
technologies. Synchronized Phasor Measurement technology and applications are an important
element and enabler of WAMPAC Error! Reference source not found. Technology components
and platforms (such as PMUs, Data Concentrators, Data Acquisition systems, Communication
Systems, EMS/SCADA, Market Operations Systems, etc.) required to implement and benefit
from the synchronized measurement applications are already available.
Time synchronization is not a new concept or a new application in power systems. As
technology advances, the time frame of synchronized information has been steadily reduced
from minutes, to seconds, milliseconds, and now microseconds. Industry observers foresee a
future where all metering devices will be time‐synchronized with high precision and time tags
will be a normal part of any measurement.
Phasor measurement technology (for applications in the power industry) was developed near
the end of 1980s and the first products appeared on the market in the early 1990s. Presently, a
number of vendors are either offering or developing products using this technology. Phasor

B‐3
Measurement Units (PMUs), together with Phasor Data Concentrators (PDCs), have already
been implemented at WECC. Recently, some large‐scale phasor measurement deployment
projects, such as the Eastern Interconnection Phasor Project (EIPP) supported by DOE, have also
been initiated.
At present Phasor Measurement Units (PMUs) are the most sophisticated time‐synchronized
tool available to power engineers and system operators for wide‐area applications. This tool has
been made possible by advancements in computer technology, and availability of GPS signals.
To achieve the benefits, advancements in time synchronization must be matched by
advancements in other areas. One area is in data communications, where communication
channels have become faster and more reliable in streaming PMU data from remote sites to a
central facility.
An area that needs improvement is instrument transformer, which affects the quality of the
signals supplied to the PMU. New transducers (such as optical) have offered some
improvements, but at a cost. More work is needed to reduce the error introduced by traditional
instrument transformers, such as: better testing and dynamic response information from
manufacturers; digital‐compatible secondary voltages and currents; software means that use
redundancy in measurements to correct errors introduced by existing instrument transformers
and other devices Error! Reference source not found.
The third area is in developing applications, i.e., software that operates on the data provided by
the PMUs. Although academia, vendors, utilities, and consultants have developed a large
number of methods and algorithms and performed system analysis and studies to apply the
technology, like any other advanced tool, PMUs are good only in the hands of trained users. For
example, one of the proposed applications of PMUs is their use on control for monitoring,
alarm, and control operations. The technology exists today to bring the PMU information into
the control centers and present it to the operators in a graphically processed form.
Skills in power system applications require a commitment to learn, true understanding,
training, and most of all experience. A PMU is a state of the art tool that has already proven that
when used correctly and within its known limitations, it can help solve some of the existing
problems and give us a better understanding of the overall behavior of power systems.
Implementation of phasor measurement technology requires investment and commitment by
utilities and system operators on an enterprise system level. The investments include: studies,
equipment purchase and upgrade, maintenance, resource allocation and training. For utilities
and system operators to make a step toward system‐wide implementation of phasor
measurement technology, it is desirable to identify and select key applications that would
benefit the individual systems and the interconnected grid overall.
In summary, there is a need for a concise roadmap to help utilities, system operators, and
regulators in California and WECC prioritize applications for deployment (short to long term),
based on their benefits to the users, addressing cost of deployment and technology
advancements. This roadmap should also address review and evaluation of existing
applications, potential improvements to existing applications, and new applications.

B‐4
1.3. Key Overall Benefits In the report, we have identified two key categories that could benefit from the synchronized
measurement technology:
A. Congestion Management for day‐to‐day operations
B. Emergency situations, with extreme manifestations in blackouts
For day‐to‐day congestion management, actual flow on a line is compared to a Nominal
Transfer Capability (NTC) based on thermal limitations, voltage limitations, or stability
limitations. The assumptions used in offline NTC calculations may lead to unused transfer
capability and lost opportunity costs in the dispatch process. In the case of CAISO, congestion
costs exceeded 250 MUSD in 2005, and the extent that excessive margins contributed to this
total is unknown Error! Reference source not found.
Recent wide‐area electrical blackouts have raised many questions about the specifics of such
events and the vulnerability of interconnected power systems. Exchange of information
stemming from the worldwide blackouts findings, examination of the root causes, and
implementation of both proven and new solutions to help prevent propagation of such large‐
scale events should help industry design, operate, and maintain reliable power delivery
infrastructures for the future.
Although large‐scale blackouts are still very low probability events, they carry immense costs
and consequences for customers and society in general as well as for power companies. It is
easy to misjudge the risk of such extreme cases. The high costs of extensive mitigation strategies
(e.g. building new transmission lines), combined with inaccurate probabilistic assessments
(“blackouts will not happen in my system”), have led to inadequate risk management not
focusing on cost‐effective prevention and mitigation initiatives providing expected value by
avoiding huge blackout costs.
Utility stock price is affected by a blackout. In general, stock price is based on three factors:
expected profits, expected profit growth, and perceived risk.
Utilities Involved in the Blackout
Utility Day
Before Day After Change
First Energy 29.35 28.84 ‐1.74%
AEP 29.35 28.84 ‐1.74%
Con Ed 23.49 23.27 ‐0.94%
Detroit Edison 32.15 31.99 ‐0.50%
National Grid 29.92 29.53 ‐1.30%
Average 1.24% Loss

B‐5
Utilities Not Involved in the Blackout
Utility Day
Before Day After Change
Pacific Gas & Electric 21.21 21.16 ‐0.24%
Edison International (SCE) 16.46 16.50 0.24%
Avista 14.44 14.52 0.55%
Xcel Energy 13.30 13.38 0.60%
Dominion 56.99 56.59 ‐0.70%
Progress Energy 36.89 36.85 ‐0.11%
TXU 20.29 20.46 0.84%
Duke 15.76 16.08 2.03%
Southern Company 26.32 26.24 ‐0.30%
Entergy 49.48 49.38 ‐0.20%
FPL 27.27 27.21 ‐0.22%
Scottish Power (PacifiCorp) 21.53 21.85 1.49%
Centerpoint 7.74 7.75 0.13%
Ameren 38.47 38.72 0.65%
Puget Energy 19.66 20.06 2.03%
Cinergy 31.65 31.94 0.92%
HECO 18.63 18.84 1.13%
Tampa Electric 10.82 10.84 0.18%
Average Performance 0.50% Gain
Figure B-1. Stock Movement after the August 14, 2003 Blackout.
With regard to risk for utilities, perhaps the most important aspect is regulatory risk since
regulators ultimately determine the maximum profit that a utility is allowed to make.
Blackouts, and a utility’s response to blackouts, can materially alter adverse perceptions of
regulatory risk, and can significantly affect share price. Figure B‐1 shows an example of stock
movement after the August 14, 2003 blackout, showing the loss for the utilities involved in the
blackout. A few days after the blackout, the stock price of First Energy slid further, by another
9.3%.

B‐6
Historically, after each widespread cascading failure in the past 40 years, the power industry
has focused attention on the need to understand the complex phenomena associated with
blackouts. For example, major reliability improvements have been made after major blackouts
events in the US in 1965, 1977, and 1996. Within the last two years, as the power systems are
again pushed closer to the limits, the number and size of wide‐area outages has increased,
affecting more than 150 million customers worldwide. Figure shows some of the major
widespread blackouts and their consequences.
Customers Affected
0
10,000,000
20,000,000
30,000,000
40,000,000
50,000,000
60,000,000
19
65
, NE
US
19
77
,N
ew
July
19
96
,
20
03
,U
S-
20
03
,S
we
de
n
20
04
Gre
ece
Figure B-2. History of Widespread Blackouts: Customers Affected
Power systems are designed to allow for reliable power delivery in the absence of one or more
major pieces of equipment (lines, transformers, generation). For example, North American
Electric Reliability Council (NERC) Planning Standard set forth the performance requirements a
system must meet for various contingencies. The complexity of the grid operation, however,
makes it difficult to study the permutation of contingency conditions that would lead to perfect
reliability at reasonable cost. Accurate sequence of events is difficult to predict, as there is
practically an infinite number of operating contingencies. Furthermore, as system changes (e.g.,
addition of IPPs selling power to remote customers, load growth, new equipment installations)
these contingencies may significantly differ from the expectations of the original system
designers.
The WECC power grid is spread across a large territory with significant power transfers over
long lines. The grid is facing congestion issues and is vulnerable to stability and inter‐area
oscillation problems, resulting in major blackouts in 1996. Those problems resulted in de‐rating
of the power lines with ensuing financial losses to the grid users. WECC has initiated extensive
measures to counteract those problems, such as extensively implementing automated Power
System Protection Schemes (PSPS) designed to act during major disturbances and reduce the
burden on the operators.
Deployment of PMU technology could provide cost‐effective solutions to solve or minimize
some of the problems faced by the WECC grid users by helping provide more accurate and
comprehensive planning and operations tools, better congestion tracking, visualization and

B‐7
advanced warning systems, information sharing over a wide region, improvements to special
protection schemes, etc.
1.4. Western Interconnection Phasor-Based Projects Table B‐1 summarizes the phasor‐technology projects/activities done by various organizations.
We continue to update the information. In the Final Report, more details will be given for each
activity.
Source: Yuri Makarov, PNNL

B‐8
Table B-1. Phasor-technology projects/activities done by various organizations.
YearsWAMS project/activity in
WECCPurpose Activity type Host(s) Participants Funding
agencyComments
*** PAST PROJECTS ***1995-2005 PMU Testing and Evaluation Certify PMU models for use in
the WECC WAMSPMU models BPA and
PNNLBPA, PNNL DOE, PNNL
1999 WAMS Information Manager Develop WAMS data management system. Implement and use PDCs. Develop methods for analyzing WAMS data and identifying dynamic events.
Data management, PDCs, Methods
BPA and EPRI
BPA, PNNL, EPRI, Montana Tech, University of Wyoming
EPRI, BPA
70's - 2002? Dynamic System Identification (DSI) Toolbox
Develop offline modal analysis tool based on Prony analysis
Software BPA BPA, PNNL BPA
2005 or 2006?
Performance Validation and Noise Injection Staged Tests
Comprehensive probing tests of WECC system dynamics under summer conditions
Field system test BPA BPA, Montana Tech
BPA
~ 2000-2002 (??)
Grid Dynamics Monitoring / Psymetrix
Detect system dynamic operating problems and to provide warning to the system operator to prevent wide-spread system outages and/or regional blackouts
Operational system CAISO/California Utilities
CAISO, California Utilities, Psymetrix
CEC Abandoned
*** CURRENT PROJECTS ***1990's - Now Offline Small Signal (Modal)
Analysis Tool DevelopmentDevelop off-line modal analysis algorithms and tools based on Prony’s methods, N4SID, Inverse FFT, and other algorithms. Software tools developed include DSI Toolbox (MATLAB-based), StreamReader (LabView-based), and Spectral Analysis Tool (LabView-based).
Methods, Software BPA BPA, PNNL, University of Wyoming, Montana Tech, Washington State University, WECC Disturbance Monitoring Work Group
BPA
2006 Real Time Small Signal (Modal) Analysis Tool Development
Move many of the functions from off-line use onto an on-line environment.
Methods, Software BPA, PNNL BPA, PNNL, Ciber Inc. , EPG
BPA
2005-2006 Fast Prony modal analysis (FPA)
Develop a FPA algorithm and improve Prony calculation speed by a factor of 100
Methods, Software PNNL PNNL PNNL
??? System Benchmarking Identify abnormal system status to prevent instability or system collapse.
Methods, Software WECC PNNL ???
1990s - ??? Disturbance Analysis and Monitoring and Early Warning Deterction
Identify system disturbances and approaching instability/system collapse using Furier Transform (Waterfall Diagrams) and modal analysis.
Methods WECC PNNL ???
Current Power System Identification Using Injected Probing Signals
Extending the application of advanced signal processing and system identification techniques to estimate power system characteristics from measured data
Power system modeling
BPA BPA, University of Wyoming
???
2005 - Now Frequency Data Collection Project
Collect subsecond frequency data to analyze frequency disturbances in the WECC system
Operational system CAISO CAISO, EPG CAISO, CEC/CERTS
2004 - Now Real-Time Dynamics Monitoring System (RTDMS)
Research and developmentactivities of real-time applications of phasors for monitoring, alarming, and control
System under development. partly operational
CAISO CAISO, EPG CEC/CERTS

B‐9
2.0 Application Benefits
2.1. Real time monitoring and control The main goal of real‐time monitoring is to provide the operator with on‐line knowledge of
system conditions. This knowledge increases the operational efficiency under normal system
conditions, and allows the operator to detect, anticipate, and correct problems during abnormal
system conditions.
At present, EMS security monitoring software depends on the results obtained from the State
Estimator software that uses system models and telemetry data from the Supervisory Control
and Data Acquisition (SCADA) system to determine the voltage magnitude and angles at all
buses in the system. This process is performed at intervals of several seconds long.
Time‐synchronized devices have introduced the possibility of directly measuring the system
state instead of estimating it. The full implementation of such a system may not be economical
at the present, but the benefits can be realized by a gradual implementation. Commercial
products exist, and are capable of supporting a limited number of time‐synchronized devices.
The ability of these products to handle large amount of data from a full‐scale deployment
(hundred of devices) is still untested.
The real‐time monitoring of angular difference across a key transmission corridor enables
operators to assess the stress on the grid. This application can be implemented with as little as a
pair of PMUs. Several utilities have been experimenting with this application, and some
vendors are offering it as a basic software product. Visualization of the phase angle separation
is considered to be a key feature of the software.
Another important implementation is in the monitoring of long‐term power oscillations, since
an accurate knowledge of which would allow operators to adopt a power‐transfer limit higher
than that being used at present. Some vendors are now offering software products for
calculating key attributes of a power oscillation (damping factor, frequency of oscillation), but
the use of such software is still experimental and is restricted to monitoring and alarming. A
gap exists between observing an oscillation (and alerting the operator) and translating it into a
to‐do‐list for the operator.
Real‐time Voltage Stability monitoring and control have been a traditional EMS offering. Time‐
synchronized devices offer solutions that can act as backup, or as “second opinion”. One vendor
has a software product that uses a pair of PMUs to estimate the transfer capability of a
transmission corridor that is limited by voltage instability. Practical experience with this
product is still lacking.
A very important aspect of PMU deployment in the control centers is proper training,
additional computational tools, and cultural change. In an industry where reliability of
operation is one of the most important criteria, skills and trust are developed through
experience. Implementation of PMUs for monitoring applications requires a training program
that includes clear explanations, real case studies, and carefully planned scenarios that will help
the engineers and operator not only understand the technology but to trust the information it

B‐10
provides. For example, information that a critical angle is changing fast may only help an
operator if clear procedures on actions required are provided.
2.1.1. State of the Art Review - Angular separation analysis & alarming
The analysis of the sequence of events leading to the 2003 Northeast US blackout points to the
need of a reliable wide area monitoring system. The blackout was a result of a sequence of
events that occurred over a period of several hours. A single operator monitoring the angle
differences in the northern Ohio region would have been able to determine, early in this
sequence of events, that the region was in serious trouble. For example, direct measurement of
phase‐angle separation could have alarmed the regional ISO and neighboring utilities.
2.1.2. Benefits
A “low‐hanging fruit” benefit of PMUs is the ability to inform not only operators that they face
problems in their control areas, but also neighboring operators of a stressed grid.
Another benefit of observing real‐time angular separations is to correct for the conservative
limits assumed in planning studies or off‐line operational studies. Real time monitoring and
analysis permits the continuous evaluation of operating conditions. The ability of PMUs to
directly obtain angle differences allows operators to reduce error margins an operate
transmission corridors closer to their real stability limits while maintaining a safe security level
Error! Reference source not found. The direct impact of confident operation of high‐density
transmission corridors closer to their security margins is to reduce the need for investment in
expensive upgrades to the existing transmission facilities Error! Reference source not found.
Another added benefit of the higher confidence on the stability limits is the ability to enhance
local and wide area protection systems by allowing the protection system to adapt to known
and trusted system conditions. This feature is discussed in more details in section Adaptive
Protection.
2.1.3. Implementation Considerations
The implementation of an enhanced time synchronized phase‐angle monitoring system requires
a PMU placement study that helps determine the minimum number and location of PMUs that
will result in an enhancement of the monitoring system. In the case of congested transmission
corridors a study may not be necessary to determine the importance of placing PMUs at the two
ends of a transmission corridor.
Once placed the PMUs must be provided with proper communication channels with minimum
latency on the communication to the control center. The requirement of added communication
channels can be eased if availability of communication channels is added to the optimal location
algorithms. Communications has always been the bottleneck for wide area applications but
steady improvements over the past decade have reduced the communication constraints for
wide area implementation.
The cost of a synchronized measurement system includes the cost of synchronized units, unit
installation, communication links, data concentrators, central data processing units, analysis
and display software, data storage facilities, training, and maintenance. This added cost is still

B‐11
low when compared with the cost of investing in an upgrade or construction of new
transmission facilities.
Computational tools are required to track and alarm when angle is changing faster or has
reached the value above the set value. Vendors should provide basic platform and tools to
implement this feature. However, implementation of this feature will need to be customized
based on user’s needs and procedures. As operators will need to react fast during fast
developing events, they will need to be trained to follow set procedures. For this approach to be
accepted, a cultural change is required as well. To fully utilize benefits of this feature, not only
operators in one control center need to start using it, but also operators in the regional ISO and
neighboring utilities.
2.1.4. Previous Experience
Several experimental implementations of wide area monitoring system, at different levels of
complexity, exist in the USA, Europe, China, Japan, Korea and Mexico. In addition many
conceptual applications have been proposed in the literature for the past 15 years.
In the United States several utilities have been using PMUs since the late 1980s. Some of the
known installations are (see section “Western Interconnection Phasor‐Based Projects” for
activities related to WECC):
New York Power Authority (NYPA) used experimental PMUs to monitor the phase angle
difference on some of their 750kV lines in the early 1990’s. They also develop procedures for
reducing effect of transformer errors but most of their development has been experimental
Error! Reference source not found.
Florida Power and Light used PMUs in the early 1990’s to monitor system oscillations. They
worked with Virginia Tech to implement an experimental adaptive out‐of‐step relay using
Phasor measurement. They abandoned their PMU work in 1994 when they retired from EPRI
and reduced their R&D budget Error! Reference source not found.
Georgia Power performed the first wide area measurement of a staged event in 1994 for model
validation Error! Reference source not found. The test consisted on closing and opening a
500kV line under light load. The effects of the switching operation were recorded by PMUs
located in Georgia, Florida and Tennessee. The comparison of the recordings of angle
differences with those obtained from simulations of the same event showed that the Southern
Company models were very accurate for the central Georgia region.
Eastern Interconnection Phasor Project (EIPP): This two‐year‐old initiative has an experimental
monitoring system developed by TVA. No application has been implemented yet but the
number of PMUs and participating utilities continuous to increase Error! Reference source not
found.
Outside the United States synchronized measurement has been used in several countries:
Electricity de France developed an ambitious project to monitor and control their power system.
Their effort was abandoned after a considerable investment in the mid 1990s. PMU have also

B‐12
been used at EDF to monitor the energy transfer to Spain Error! Reference source not found.
Through an initiative of ABB for testing their synchronized measurement devices experimental
measurements of system oscillations have been performed in other European countries like
Denmark, Norway, Iceland and England Error! Reference source not found.Error! Reference
source not found.
In Asia there has been a large development of synchronized measurement based project, which
includes the development of synchronized devices:
In China, several utilities have developed monitoring systems and protection schemes based on
PMU measurements. More than 100 PMUs have been installed in China but the system is not
fully developed and most applications are still in an experimental stage Error! Reference source
not found. In Korea, Korean Electric Power (KEPCO) has more than 20 PMUs installed
Monitoring and alarm has been implemented into an experimental system Error! Reference
source not found.
In Latin America, Mexico has more than ten years of experience with PMUs and more recently
Brazil has started and aggressive program:
In Mexico, Commision Federal de Electricidad (CFE) has performed extensive model validation
of their system using PMU recordings of angular differences from disturbances and staged
events Error! Reference source not found. CFE has also implemented and tested an
experimental directional protection scheme were PMU phase angles are used to determine the
direction of power flow Error! Reference source not found.
In Brazil, a Synchronized Phasor Measurement System (SPMS) simulator and prototype have
been implemented with three PMUs and one data concentrator. The system has been used for
dynamic disturbance recording and fault location Error! Reference source not found. The ISO
has performed studies for the implementation of a Wide Area Monitoring System and has plans
to begin installation in 2007 with participation of all major utilities Error! Reference source not
found.
2.1.5. State of the Art Review - Monitoring of long-duration low-frequency inter-area oscillations
Inter area‐oscillations are associated with groups of generators and have frequency modes that
range from 0.1 to 0.8 Hz. (See Figure B‐3 for a typical case.) The factors that
influence these oscillation modes are not fully understood and are difficult to monitor in
existing (steady state) Energy Management Systems Error! Reference source not found. Most
analyses of inter‐area oscillation are performed in dynamic system models that are limited to
individual utilities and do not include complete modeling of the entire interconnected system.
Time‐synchronized devices have introduced the possibility of monitoring dynamic behavior of
the system facilitating the detection, understanding and accurate identification of existing inter‐
area oscillations modes. The ability to detect and measure inter‐area oscillation modes have
prompted engineers and researchers to study the use of PSS, FACTS and energy storage devices
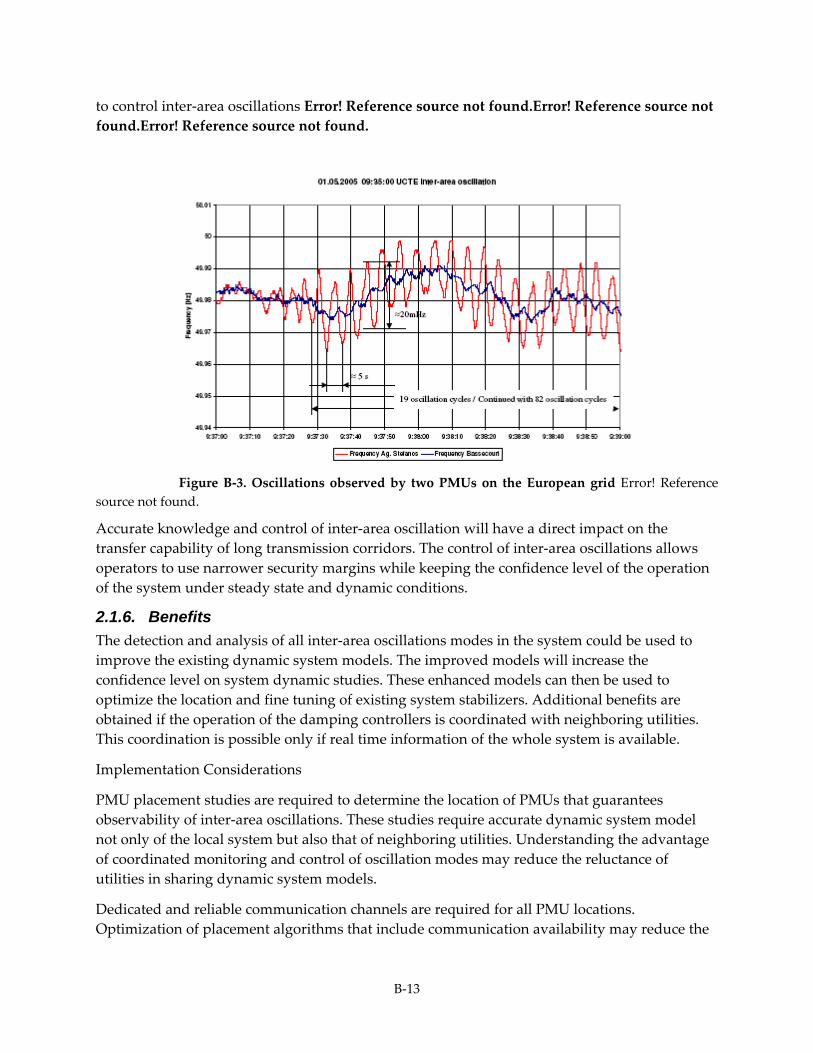
B‐13
to control inter‐area oscillations Error! Reference source not found.Error! Reference source not
found.Error! Reference source not found.
Figure B‐3. Oscillations observed by two PMUs on the European grid Error! Reference
source not found.
Accurate knowledge and control of inter‐area oscillation will have a direct impact on the
transfer capability of long transmission corridors. The control of inter‐area oscillations allows
operators to use narrower security margins while keeping the confidence level of the operation
of the system under steady state and dynamic conditions.
2.1.6. Benefits
The detection and analysis of all inter‐area oscillations modes in the system could be used to
improve the existing dynamic system models. The improved models will increase the
confidence level on system dynamic studies. These enhanced models can then be used to
optimize the location and fine tuning of existing system stabilizers. Additional benefits are
obtained if the operation of the damping controllers is coordinated with neighboring utilities.
This coordination is possible only if real time information of the whole system is available.
Implementation Considerations
PMU placement studies are required to determine the location of PMUs that guarantees
observability of inter‐area oscillations. These studies require accurate dynamic system model
not only of the local system but also that of neighboring utilities. Understanding the advantage
of coordinated monitoring and control of oscillation modes may reduce the reluctance of
utilities in sharing dynamic system models.
Dedicated and reliable communication channels are required for all PMU locations.
Optimization of placement algorithms that include communication availability may reduce the

B‐14
cost of new communication facilities. The existing system architectures of wide area
measurement system have evolved from experimental systems and have not been carefully
planned for specific implementations limiting the effectiveness of the existing system to provide
the expected information.
2.1.7. Previous Experience
Several algorithms have been proposed to detect inter‐area oscillations, e.g., Error! Reference
source not found.Error! Reference source not found. some have been applied to PMU data in
an off‐line mode, but the experience is still limited. Most inter‐area oscillation control studies
have been performed with simulators without considering the latency, format, and
communication problems of a real monitoring system. The proposed algorithms for on‐line
controlling of oscillations through HVDC, FACTS and ESS are not fully developed for this type
of applications and have also not been tested with real system data Error! Reference source not
found.Error! Reference source not found.Error! Reference source not found.
In the United States Southern California Edison, SCE, has developed software for the detection
of low frequency oscillations and has proposed the use of the WECC PMU system to monitor
system stress levels to determine when inter‐area oscillations may affect system stability Error!
Reference source not found. Error! Reference source not found. The Tennessee Valley
Authority, TVA, has performed studies on detection algorithms and optimal placement of
PMUs for detection of low frequency oscillations in the Nashville area. Research has been also
performed on the use of synchronized data to control with FACTS and ESS devices to damp
low frequency oscillations Error! Reference source not found.
In Iceland a study was performed on the use of PMU signals as additional inputs to the Power
System Stabilizers (PSS) Error! Reference source not found. The study showed that frequency
difference between large generators could be used as a wide area input to a PSS. Even though it
could not demonstrate that Wide‐Area PSS was superior to conventional PSS, it suggested that,
a combination of local and wide‐area signals for control of PSS could produce good results.
Independently, one vendor has a commercial platform that can support wide‐area PSS Error!
Reference source not found.
In Asia, China has several projects in wide area measurements. One of these projects in the
Jiang Su power grid is to develop an on‐line Transient Stability Control Pre‐decision (OTSCP)
program. This program currently under development will detect and control low frequency
oscillations Error! Reference source not found. In Korea, the WAMS project started in 2000
detected only one serious local plant oscillation mode but studies on the assumed system under
deregulation revealed possible future existence of multiple modes of inter area oscillations. The
location of the PMUs in the Korean WAMS system was optimized for the detection of these
inter‐area oscillations Error! Reference source not found. Little has been reported recently on
the operation of the Korean WAMS and its use for inter‐area oscillation detection and control.
In Japan a project was implemented to monitor a in the middle and western 60Hz area of Japan.
This experimental project successfully used four PMUs and developed software to perform
Fourier analysis for the detection of the inter area oscillations Error! Reference source not
found. The Electricity Generating Authority of Thailand (EGAT) installed ABB’s Wide‐Area

B‐15
Monitoring package to monitor the power oscillations on the Thailand‐Malaysia corridor Error!
Reference source not found. the experience is yet to be reported.
2.1.8. State of the Art Review - Monitoring and Control of Voltage Stability
Voltage Instability is a known problem for grids that have long transmission lines such as
WECC. Commercial solutions exist to address the problem, and they vary from under‐voltage
relays to EMS‐based applications. Existing solutions, however, have limitations, and some
utilities have experimented with their own approach Error! Reference source not found. The
experimented solutions enhance existing applications by incorporating extra information, or
even PMU signals. One vendor claims to have a PMU‐based monitoring solution for corridors
whose transfer is constrained by voltage instability. Experience with this offering as well with
pilot projects is still limited.
A networked set of PMUs can be used to estimate the grid’s voltage stability. The scheme has
two levels of information processing. One level estimates the closeness of each measured point
to voltage instability, as currently done by some electronic devices (“predictor” level). The other
level collects information from reactive‐power supports (how close they are from reaching a
limit), and distributes such information to the electronic devices. The reactive‐support
information helps correct the original estimates (“corrector” level). Control actions are activated
when the stability margin is small and the reactive power reserves are nearly exhausted.
Potential benefits could be great for the systems subject to occasional heavy loading and
unplanned (and potentially multiple) contingencies. The PMU‐based scheme can take several
forms of implementation, depending on the available communications network.
2.1.9. Benefits
Like many other applications covered in this report, financial benefits from Voltage Stability can
be addressed in two categories. One is connection with congestion management: with the
deployment of a system on a corridor constrained by voltage instability, the actual limits can be
used instead of conservative ones, leading to more MW transfer. The other is in blackout
prevention, which are low‐probability and high‐cost events; the exact benefit in this case
requires specific studies, which take into account grid‐specific features and the anticipated
reliability of the scheme.
Voltage instability is typically manifested by several distinguishing features: low system
voltage profiles, heavy reactive line flows, inadequate reactive support, heavily loaded power
systems. Voltage collapse typically occurs abruptly, after a symptomatic period that may last in
the time frames of a few seconds to several minutes, sometimes hours Error! Reference source
not found.Error! Reference source not found.Error! Reference source not found.Error!
Reference source not found. The onset of voltage collapse is often precipitated by low‐
probability single or multiple contingencies. Description of conventional voltage instability
techniques and protection applications are in Appendix B‐2.
Studying voltage collapse requires complementary use of dynamic and static analysis
techniques Error! Reference source not found.Error! Reference source not found.Error!

B‐16
Reference source not found.Error! Reference source not found.Error! Reference source not
found. This makes monitoring and controls (protection) of voltage stability particularly
suitable with PMUs, as currently available monitoring devices are often inadequately equipped
to track this type of system dynamics.
2.1.10. Implementation Considerations
Commercial solutions against voltage instability are available in the local form and control‐
center form. We anticipate that progress will continue for each. That is, the local form will be
expanded to take into account remote signals (Error! Reference source not found.Error!
Reference source not found.), whereas the control‐center form will improve in speed and
precision as better algorithms, models and sensors become available. A network of PMUs can
become an important source of data for these two solution forms. However, more research and
field tests are needed to turn this vision into reality.
Using Voltage Instability Predictors (VIPs) Error! Reference source not found.Error! Reference
source not found. which relies on local measurements of voltage and current only, it is possible
to calculate the approximate two‐bus equivalent networks. Based on the Thevenin equivalents
and maximum power transfer principle, it is possible to calculate the proximity of the critical
point. Such calculations can provide approximate measure of proximity to voltage instability
and they can be interpreted as adaptive undervoltage load shedding triggers. The simplicity of
this approach is that it requires local measurements only and no communication infrastructure.
Such a device has been implemented and tested in the field Error! Reference source not found.
Better versions have been proposed, Error! Reference source not found.Error! Reference source
not found.Error! Reference source not found. but industry adoption is still unknown.
A commercial PMU‐based software product exists for voltage‐stability monitoring of a
transmission corridor Error! Reference source not found. which intends to overcome the
shortcomings of the VIP. The application utilizes a pair of PMUs installed at the two ends of the
corridor to measure the voltage and current phasors. An aggregate model (a T‐equivalent) of
the corridor is then computed and combined with the source impedance (sending end of the
corridor). The combined impedance is the basis for the calculation of the power margin for the
corridor. Sudden changes on the corridor are reflected in the model, with a latency dictated by
the communications in use. Therefore, the application has the potential to capture the power‐
transfer margin of the corridor in real time.
The next stage would be to deploy a network Error! Reference source not found.Error!
Reference source not found. where limited data are communicated to the relays. The most
useful information to be shared this way are the reactive margins of the generating units, which
can be used to assess (in terms of time) the distance to PV‐PQ transitions, which are very often
the precursors of voltage collapse. SCADA could be used to provide information about reactive
output from generators; using simple forecasting algorithms at the SCADA center, it is possible
to estimate the time to the next PV‐to‐PQ transition, tg*. Subsequent to that, it would be possible

B‐17
to broadcast tg* to substations that have an intelligent electronic device (IED) that calculates the
local time to collapse t*. Decisions are made by the IED based on the two parameters tg* and t*.
(See next section for more details.) Delays associated with this architecture would be seconds,
and time stamps would be off by as much. In spite of this limitation (the scheme is unsuitable
for transient voltage control applications), this methodology would cover a large number of
voltage instability cases, and the supporting infrastructure is already in existence.
Finally, only a network of PMUs covering the entire system redundantly (and equipped with
high‐speed communications network) could provide a fast and accurate medium for
monitoring and transfer of information, which could be used to formulate the real‐time defense
strategies not only for quasi‐steady‐state types of voltage instability, but also be used for
mitigation of dynamic voltage dips using SVCs and other dynamic reactive support devices. In
addition, such a network would be fast enough to be used for other applications, such as
defense against transient and cascading instabilities in the transmission network, which require
fast response times not afforded by currently available alternatives to PMUs. PMUs would also
allow shortening the refresh times for various network optimization functions, such as active
and VAr loss minimization optimal power flows, which would help accomplish better tracking
of the optimal states and reduce the cost of system operation. Considered in conjunction with a
portfolio of complementary applications, PMUs offer speed and accuracy enhancement to
network functions, which make a proposal for their implementation much easier to justify.
A Voltage‐Instability protection scheme based on PMUs is described in Appendix B‐2.
2.1.11. Previous Experience
Even though a vendor has a PMU‐based voltage stability product Error! Reference source not
found. there is yet a report on the experience of its use on a real system.
Gap Analysis
The main barriers for implementation of angle‐ and oscillations‐monitoring systems have been
the lack of a mature standard for the synchronized devices, lack of commercial data
concentrator capable of handling synchronized on‐line data, availability of communication
channels, lack of intuitive display software and insufficient system architecture. Recently, the
IEEE 1394 Synchrophasor has been replaced by the IEEE C37.118 standard. Further standards
for PMU testing and calibration to assure desired performance are required to prevent PMU
incompatibility and assure interoperability. EIPP Performance Requirements Team is working
on creating guidelines for PMU testing and calibration.
The two large data concentrators being used at WECC and EIPP have been custom
developments from TVA in the EIPP and BPA in the WECC WAMS project. The few existing
commercial data concentrators are not capable of handling the required large number of PMUs.
Lack of a commercial option reduces reliability and increases maintenance cost. It is expected
that with greater demand commercial concentrators capable of handling large number of units
will become available.

B‐18
Existing communication links are adequate but are not available at all locations. Lack of proper
communication links increases the latency of the whole monitoring system and addition of new
communication channels increases the cost of the whole system. The exiting visualization
software is not intuitive to system operators. Figure B‐4 provides an example of current
visualization capability. Most of the available applications are experimental and the required
feedback and interaction with system operators in development process is required. Last but
not least, the existing system architectures have evolved from experimental systems and have
not been carefully planned and their location is mostly dictated by the intuition of the engineers
and the availability of communication links.
On the analytical front, many algorithms and methodologies have been proposed and studied.
Only a few have been tested with field data; the experience, however, is still limited. Realistic
conditions that include time latency, communication errors and missing data remain to be
tested.

B‐19
Situational Awareness Dashboard Summary
Monitor status of key EI metrics
Red indicator provides information on the location
Gauges to quantify worst performing metric (i.e., current value, mean, standard deviation, etc)
EI Partitioned RC Regions Angle Difference Paths Shown in Geographic Display
Visualization Tiers – Dashboard Summary, Eastern Interconnection, Reliability Coordinator, Local Area
Figure B‐4. Dashboard demonstrating visualization capability.

B‐20
Power System State Estimation
State Estimation is widely used in transmission control centers and ISO operations today to
supplement directly telemetered real time measurements in monitoring the grid; to provide a
means of monitoring network conditions which are not directly telemetered; and to provide a
valid best estimate of a consistent network model which can be used as a starting point for real
time applications such as contingency analysis, constrained re‐dispatch, volt VAR optimization,
and congestion management. State estimation has a number of ancillary applications with
varying degrees of successful utilization in the industry such as bad data detection, parameter
estimation, status estimation, and external model.
PMUs have been included in at least one successful SE deployment Error! Reference source not
found. and a number of pilot installations are in progress. The inclusion of PMUs in SE
algorithms is numerically/algorithmically not difficult except for the issue of dealing with the
reference bus. There is not a large set of practical experiences with PMU inclusion in SE and
related applications. A number of researchers have developed algorithmic refinements around
the bad data detection and parameter estimation application of PMUs. Intriguing possibility is
to use PMUs is for ISO/RTO state estimator applications to help represent “boundary
conditions” for the utility state estimators.
2.2. State of the Art Review
2.3. Benefits PMUs offer a number of possible benefits to the SE application. The benefits most frequently
claimed include: improved accuracy and robustness of bad data detection; availability of a
faster numerical solution to a linear problem; and availability of direct data on the external
network which can be used to better initialize the external model or to marry it to the internal
SE solution. However, the research on PMU inclusion in power system state estimation has not
been “main‐stream.” Of approximately 250 papers in the literature since 1995 on power system
state estimation, perhaps 20 are related to PMU in some way and less than 5 are directly
relevant and significant. Many of the relevant papers focus more on the problem of dynamic
state estimation (meaning use of a dynamic power system model) than on the static state
estimation problem that is solved today.
The incorporation of Wide Area PMU data in External Model applications is another potential
benefit. The PMU can be another measurement to the external model data set in a state
estimation algorithm. PMUs would support creating an equivalent model of the existing SE for
ISO/RTO SE applications.
Further benefit is the possibility of a separate SE solution using exclusively PMU data that takes
advantage of the higher data rates / shorter cycles available with widespread PMU deployment.
Several investigators have explored this possibility and argue that the SE solution would be
“linear” as the voltages and phase angles are directly measured. This is true provided that
redundancy exists to permit a SE solution in the first place – which then comes back to the
question of how real the redundancy is in reality given the use of common PT and CT devices
B‐21
and the impact of network movement. However, the inclusion of branch currents (also
available from PMUs) together with the phase angle of the current (or the phase angle relative
to the voltage phasor) will absolutely permit the creation of a PMU driven redundant
measurement set available to drive a PMU state estimator solution. Such an estimator would be
linear with benefits to be simpler to derive and faster to execute.
PMU could help with bad data detection. When a local (substation based) consistency check
algorithm is used for bad data and status error detection, a PMU has an inherent advantage
over an analog transducer/RTU. The PMU is based on a digital relay will allow a “self test”
diagnostic to be executed. So in the event that a PMU value disagrees with other telemetry, the
PMU can be immediately health tested – which the transducer cannot.
Another opportunity is to use PMU infrastructure (communications, master system) to also
access compatible digital protection relays. It may be that some additional data available from
digital relays could be incorporated in a PMU based high periodicity state estimator to add to
redundancy or to reduce PMU deployment costs, depending on the relays already installed.
Finally, a PMU derived SE opens the door to have a three phase or a three sequence state
estimator. This possibility has not been discussed in the literature. The potential benefits of
such an estimator could be to monitor phase unbalance – which could be symptomatic of
grounding or equipment degradation. It is worth including this possibility in the interview
discussions to see if there are any real perceived benefits worth exploring.
2.4. Implementation Considerations This report will make the case that claims for increased accuracy need validation in light of the
true sources of SE inaccuracies today; that improved bad data detection similarly needs
validation; that PMUs have benefits to offer in terms of new algorithms solving more efficiently
at higher periodicities; and that the external model and dynamic estimation problems need
further development.
State Estimation (SE) is a widely deployed real time network analysis tool in transmission
control centers and ISOs. The basic technology was developed in the 1970’s and early
installations at BPA and AEP proved out the concept. State Estimation applies a static (i.e. load
flow) balanced three phase model of the power system and finds the consistent solution to the
load flow equations that is “most likely” given the measurement set available. Thus the term
“max likelihood” is used to describe this class of state estimators. The SE application in power
systems is therefore a special case of the Kalman Filter with the following characteristics: there
are no a priori statistical models or stochastic process defined for the state variables (thus the
voltage magnitudes and phase angles are simply assumed as unknown); there are dynamics
assumed for the process so that the estimate at time T+t is not dependent upon the estimate at
time T in any way; and the relationship of the measurements to the state variables is nonlinear
(the load flow equations). Finally, the SE models and algorithms in use assume that the power
system being observed is static and that all measurements are available and utilized
simultaneously. The nonlinearity of the measurement equations has led to the development of
various iterative algorithms over the years.

B‐22
The Kalman filter has been widely applied to many industrial, military, and aerospace / space
problems where the opposite set of characteristics apply: some stochastic model is available for
the state variables; the process is dynamic with a known dynamic model structure; often the
process and measurement models are linear; and often the observations come in sequentially
while the process is moving. The most obvious example is one of tracking an object en route to
the moon or to Mars.
Power System state estimation development was initially constrained by the dimensionality of
the problem – a factor which remains an issue today as ISOs strive to use network models with
10,000 or more nodes and execution cycles of 1 minute or below. This led to rapid adoption of
some of the simplifying conventions noted above. Subsequent to the early successes with
smaller network models, development has focused on several directions: improving numerical
performance of iterative methods ‐‐‐ the two most importance of which are the Fast Decoupled
algorithm and the Givens rotation of the state vector and gain matrix. The Fast Decoupled
algorithm as with the load flow of the same name is now used in almost all applications and it
reliably eliminates the need to update Jacobian matrices at every iteration, thus saving
considerable computer time. The Givens algorithm “rotates” the state vectors to a set, which
maximizes the difference among the vectors and minimizes the overlap, using eigen analysis of
the gain matrix. This provides more robust iterative convergence, especially for ill‐conditioned
models. (The latter tend to occur when lower voltage levels are added to the problem as these
will have much smaller Per Unit admittances than higher voltage systems.)
Other problems have been the focus of state estimation development over the decades. Two in
particular are noteworthy: bad data detection and parameter estimation. Bad data detection
attempted to solve the problem of persistent and transitory bad data in the measurement set.
Persistent bad data is a result of errors in the model setup such as reversed MVAR readings,
erroneous scale factors entered, and so on. Transitory bad data can occur as instrument
transformers (PT and CT) fail, transducers fail, or other gross errors are suddenly entered into
the process. Valid bad data detection algorithms have to have their roots in the mathematics of
maximum likelihood estimation. The addition of any measurement point will necessarily
increase the expected residual norm of the difference between the estimated and measured
values and the deletion of any value will conversely always decrease that norm. Bad data
detection algorithms seek to most efficiently and reliably identify those measurements whose
removal from the problem decreases the norm to a level that is statistically consistent with the
occurrence of a gross error. Occasionally researchers and implementers forget this principle
and develop algorithms, which appear to perform well computationally but in fact are suspect.
While it is the case that the various software suppliers have more or less converged on the Fast
Decoupled and Givens algorithms for SE implementation, the bad data detection algorithms in
use vary from case to case. It is also the case that the quality of instrumentation and
communications has increased greatly in the past 30 years and bad data detection may not have
the same drivers as it did.
Parameter Estimation attempts to use the redundancy in the measurement set and the
availability of different measurement sets and state variables at different times (and therefore

B‐23
different network conditions) to selectively estimate a more accurate value for a suspect
network parameter. As with the bad data detection problem, the underlying mathematics has
to be respected. If a SE attempted to improve all the network parameters over time, the
dimensionality of the problem would guaranteed that a set of parameter estimates could be
found which would drive the residual norm to zero – but this is a theoretical error. Thus
parameter estimation has to focus on targeting small sets of parameters for estimation where
physically related measurement residuals exhibit an unexpected bias over time indicative of a
parameter error. While a number of interesting algorithms have been developed for this
problem it is not in widespread usage. Perhaps the most useful application has been to estimate
transformer taps where the tap position is not directly monitored or controlled.
A very important problem, which is a hybrid of bad data detection and parameter estimation,
has been to detect status errors – i.e. errors in circuit breaker or disconnect positions, which
change the electrical configuration of the network. These in recent years have been best
attacked by localized applications around a substation, which check for consistency between
status and analog information.
In the first decade of state estimation development, a number of researches investigated ways of
using more of the Kalman filter paradigm – using dynamic models of the power system (such as
occur during load ramps) or adapting to measurements that come in over a longer time spread.
While none of these were practically realized at the time, some may be relevant again when
widespread PMU data is considered available.
State estimation achieved control room acceptance and found its primary benefits as the means
of obtaining a valid network solution as the starting point for on line contingency analysis.
With the advent of optimal power flows used for solving redispatch problems or voltage/VAR
optimization, it also became the precursor to these applications. State estimation also provides
the means to implement real time congestion management in the ISO context. However, SE has
not eliminated the use of actual (raw) real time measurements as the primary means of
monitoring the network and of driving operator alarms. Consequently, operational limits are
typically set and observed based on raw measurements and telemetry without regard to any
additional capabilities available from state estimation. In general, operational limit setting and
observation does not consider the probability of loss of telemetery. There is no vehicle today for
reporting how frequent telemetry is lost and how useful state estimation is in operating the
system securely when critical equipment monitoring is lost.
A complementary application to State Estimation was developed in parallel – the External
Model. This solves a non‐redundant load flow model of the “external” power system so that
the subsequent applications such as contingency analysis can faithfully represent loop flows
and so on. Early external models were greatly reduced representations using network
reduction techniques. Over time, more detailed models have been utilized which incorporate
direct measurements available over ICCP links (Inter‐Control Center Communications Protocol)
to neighboring control centers. External models can be separate load flow solutions, which are
mated to the SE solution or can be directly incorporated in the SE model and solution. The
trend today is towards the latter. Some installations run an internal SE with a smaller model at
B‐24
high periodicities (10 seconds) and larger models with more internal detail and large external
models at slower rates (minutes). As the SE cycle approaches 10 seconds it can be used as the
primary monitoring and alarming vehicle.
2.5. Previous Experience PMUs have been included in at least one major SE implementation in Spain. There are pilots
on‐going with a number of US utilities (NYPA, TVA, Entergy, PG&E, Manitoba Hydro).
Some but not all of the SE suppliers have already made provisions to include PMU phase angle
measurements in their State Estimator. While the individual bus phase angle measurement has
a simple term (unity) in the Jacobian and therefore the gain matrix inverse as it is a direct
measurement of a state as with a voltage magnitude, the reference bus poses a problem. A
number of schemes have been proposed to deal with the reference bus (i.e. for N buses there are
only N‐1 independent phase angles) but there is not field experience to make a case for one in
particular. Overall, incorporating PMUs in state estimators would seem to pose no great
algorithmic difficulty.
Arguably, all the ancillary applications of bad data detection, parameter estimation, and status
estimation would function with PMUs in more or less as they do today. However, PMUs may
raise some interesting new possibilities and a number of researchers have investigated these;
Error! Reference source not found.Error! Reference source not found.Error! Reference source
not found.
2.6. Gap Analysis The effects of PMU inclusion on SE accuracy are reported in reference Error! Reference source
not found. and discussed in Error! Reference source not found. However, these are theoretical
results based on laboratory experiments. The true effect of PMUs on SE accuracy has to
consider that the PMU will be using the same Potential Transformer (PT) (and Current
Transformer if line currents/line flows are also used) as the measurements which the SE already
uses. The measurement “error” in the SE model is a result of a chain of physical and
measurement effects which are not adequately considered in any of the work to date.
First, the value being measured is the balanced three phase (voltage / current)/ MW/MVAR
flow. However, existing telemetry often uses one or two phases, not all three, as a proxy for
this. Presumably the value from a PMU will be the positive sequence (thus balanced) three‐
phase quantity which should be an improvement – but the amount of improvement is
unknown. Field research is required to analyze this.
Second, the amount of physical variation in the measured quantities, which can occur in the
time window for accumulating SE measurements, accounts for some of what is labeled error.
This is normally a 10 second window. While PMU data may be collected at a higher rate and
better synchronized, if it is included in a SE with 10‐second data the overall problem still exists
and the accuracy improvement is questionable. Also, the different filtering time constants of
PMU vs. analog transducers must be considered.

B‐25
Third, the PT and CT are presumably identical for the PMU and the SE measurement. So errors
introduced by the PT would appear in both the PMU value and the telemetry value. These
would affect, presumably, the voltage magnitude and not the phase angle although it is worth
asking what phase shift the transformers introduce. In some cases, the PT and CT will be
“protection” units while the telemetry, especially revenue quality MW and MVAR
instrumentation, will use “instrument” transformers. The former are scaled to cover 250 or
300% of nominal for protection purposes while the latter are typically scaled to much tighter
ranges and are inherently more accurate.
Fourth, the MW and MVAR values originate with transducers that use solid state electronics
(not digital techniques) to calculate the MW and MVAR from the CT and PT signals. These
have known error curves, which are more like nonlinear biases than random errors and could
be (but usually are not) compensated in the SE preprocessing if necessary. A modern PMU will
not have these biases.
So one gap analysis is to analyze quantitatively the sources of error in the overall chain and to
see how those errors vary from PMU to traditional telemetry. A second gap is to understand
when the measurement is truly redundant and independent and when in fact it is now. If the
PMU errors are largely from the same time window and PT sources as a telemetered value, then
adding the PMU without recognizing that the errors are correlated is a theoretical and practical
mistake. (It is important to note that none of the SE implementations today allow for
measurement error correlation as it is computationally too difficult.)
From one viewpoint, analyzing this is not that critical as SE accuracy may be sufficient today.
From another, however, it may be important. One claimed benefit is that congestion costs could
be lower if confidence in a more accurate SE solution allowed utilities / ISOs to operate closer to
limits, but if further R&D efforts conclude that PMU inclusion will not adequately improve the
accuracy of power flow estimates then this benefit cannot be realized. In addition, it may well
be that the real question is not “where are we with respect to the limit” as much as “what is the
limit at the moment given the system operating state, temperature, equipment condition, wind,
and recent maintenance history?”
A second gap is in the SE algorithm. Including the PMU as a direct measurement of phase
angle (or additional voltage magnitude) is easy. Dealing with the reference bus phase angle is
not and some additional algorithmic development is in order. One idea might be to add a
pseudo‐measurement, which is the sum, average, or other additive function of all phase angles
and then constrain it to zero or other arbitrary value. This has relationships to the use of PMU
in external model solutions.
A third gap is consideration of the “linear” SE as the voltages and phase angles are directly
measured. This application becomes available with widespread PMU deployment. More
research is required to fully develop this application as well.
A fourth gap is that the benefits of PMUs to bad data detection as identified in the literature are
all subject to the same questions about accuracy as noted above.

B‐26
The incorporation of a PMU derived SE solution in a larger (more detail/lower voltage level) SE
solution should be addressable by the same technology that is used today to integrate one SE
solution with another, larger one, or to integrate a SE solution into a larger External Model
solution. In effect the current PMU derived SE solution is taken as an additional measurement
set (not a constraint or determined value) in the larger solution. The gap, if any, in this case is
not a theoretical gap but an implementation gap in the particular state estimator solution at a
given control center.
The incorporation of Wide Area PMU data in External Model applications has not been
investigated adequately. When the external model is “driven” by ICCP links and the PMU can
be another measurement to the external model data set, the inclusion of the PMU can follow
similar lines to the state estimation discussion above. However, when the PMU measurement
in question is in a part of the network that is a simplified / reduced representation of a remote
interconnected network there presumably are not ICCP data available in the neighborhood.
Simply adding the PMU reading as a measurement without possibly adjusting the pseudo
measurements of injections in the neighborhood may result in undesirable external model
behavior. This question requires discussion with the organizations that support wide area
external model representations today – that is to say, the ISO / RTO organizations.

B‐27

B‐28
3.0 Real-Time Congestion Management Congestion Management is a critical function performed by power schedulers in the advance
market and by the grid operator in real time. It is an important function because it involves
generation dispatch (in day‐ahead markets) and re‐dispatch (in real‐time markets) to delicately
satisfy demand in an economic manner without violating transmission limits.
The goal of a real‐time Congestion Management application is to maintain real‐time flows
across transmission lines and paths within reliable transfer capabilities through dispatch
adjustments in a least‐cost manner.
The traditional approach to real‐time congestion management compares actual flow on a line or
path against a Nominal Transfer Capability (NTC) that is calculated in advance using an offline
methodology. Such off‐line calculations are based on thermal limitations, voltage limitations or
stability limitations; whichever is most restrictive in a given case. The assumptions used in
offline NTC calculations are often conservative and can result in excessive margins in the
congestion management process. This may lead to unused transfer capability and lost
opportunity costs in the dispatch process. In the case of CAISO, congestion costs exceeded 250
MUSD in 2005, and the extent that excessive margins contributed to this total is unknown Error!
Reference source not found.
Control‐center algorithms can incorporate PMU measurements into improved estimates of the
real‐time path ratings and real‐time flow levels used for congestion management. Since PMUs
provide additional, synchronized, highly accurate measurements, they may offer significant
benefits in Real‐Time Transmission Congestion Management by enabling improved calculation
of path limits and path flows. Pilot deployments of PMU‐based systems to explore congestion
management are still in an early stage, and experience with such systems remains limited.
Unlike real‐time congestion management, Hour Ahead (HA) and Day Ahead (DA) congestion
management must continue to use NTC’s based on off‐line calculations. However, PMU
technology may have an indirect benefit to HA and DA congestion management. Wherever
real‐time PMU based ratings consistently exceed NTC’s, schedulers may eventually be willing
to use less conservative estimates of NTC’s.
3.1. State of the Art Review Congestion Management is a critical function performed by the grid operator in real‐time and
by power schedulers in the advance market. It is an important function because it involves
generation dispatch (in day ahead markets) and re‐dispatch (in real‐time markets) to delicately
satisfy demand in an economic manner without violating transmission limits. However, the
presence of congestion always has a cost in terms of non‐economic generation dispatch. This is
true whether a congestion path is limited by thermal, stability, or voltage constraints since they
all require changes in dispatch. This re‐dispatch shows up as an increased cost in the overall
supply process and is deemed the “congestion cost”. Clearly, the larger the number of
congested paths and the more conservative the congestion limits, the higher the congestion

B‐29
costs. If any of these constraints can be relaxed there may be significant savings in terms of
reduced congestion costs.
The traditional approach to real‐time congestion management compares actual flow on a line or
path against a Nominal Transfer Capability (NTC) that is calculated in advance using an offline
methodology. Such off‐line calculations are based on thermal limitations, voltage limitations or
stability limitations; whichever is most restrictive in a given case. By necessity, off‐line NTC
calculations must be conservative due to unknowns about real‐time system operating
conditions and “to account for operator response times and uncertainties in the models…”
Error! Reference source not found.Error! Reference source not found. This is particularly true
in the case of voltage or stability constrained paths. The use of conservative NTC’s can result in
excessive margins in the congestion management process and lead to unused transfer capability
and lost opportunity costs in the dispatch process.
Since PMU’s provide additional, synchronized, highly accurate system meter data they may
offer significant benefits in the area of real‐time transmission congestion management by
enabling improved calculation of path limits and path flows. This can lead to significant savings
to utilities and ratepayers through reduced congestion and more optimum system dispatch.
PMU measurements may be used to calculate more accurate path limits in real‐time, thus
providing more “elbow room” to manage congested lines and paths. The higher scan rate and
precision of PMU data will enhance the speed and quality of real‐time algorithms and allow
rapid computation of Real‐time Transfer Capability (RTC) on critical stability limited and
voltage limited paths. On many paths such RTC’s will exceed their respective NTC’s thus
reducing the need for real‐time congestion curtailments.
Secondly, PMU technology can also improve real‐time congestion management through
providing a more accurate state‐estimator (SE) solution of the real‐time flow on a line or path. In
some instances this will reduce the level of unnecessary dispatch adjustments and lower system
operating costs. However, in other instances it will more accurately inform the real‐time
congestion management tool that additional dispatch adjustment is needed to maintain
reliability. While the latter example would result in an increase in the instantaneous cost of
system dispatch, it will help to avoid the risk and consequences of a costly system interruption
or load shedding event.
Unlike real‐time congestion management, Hour Ahead (HA) and Day Ahead (DA) congestion
management must continue to use NTC’s based on off‐line calculations. However, it is
conceivable that PMU technology may eventually have an indirect benefit to HA and DA
congestion management. In those cases where real‐time PMU based ratings consistently exceed
NTC’s, schedulers may eventually be willing to use less conservative estimates of NTC’s.
3.2. Benefits This application is extremely relevant to WECC and CAISO. Congestion costs in CAISO alone
exceeded $250 millions in 2005 Error! Reference source not found. Although aggregate data is
not available, annual WECC wide congestion costs could easily be double this level. CAISO
reports a goal (with CERTS funding) to implement voltage/stability nomogram validation

B‐30
utilizing phasor measurements in 2006, but does not specify which path(s) it intends to manage
utilizing this type of tool Error! Reference source not found.
In addition to the direct cost of congestion management, congested transmission paths limit the
amount of resources that can be imported and delivered to load. This can contribute to resource
shortfalls and load curtailments. If this shortfall occurs during a peak load condition, substantial
amounts of load may need to be curtailed to maintain the load resource balance. CAISO did not
experience any resource deficiencies due simply to peak demand in 2005, but did experience a
Pacific DC Intertie outage on August 25, 2005 that required curtailing 950MW of firm load for
40 minutes (633MWh) plus 806MW of non‐firm (interruptible) load for 77 minutes (1047MWh)
in order to mitigate congestion and balance loads to resources. The use of PMU based tools on
congested paths could reduce the need for such curtailments.
3.3. Implementation Considerations No commercial‐grade applications are in existence. Development and field‐testing of PMU‐
based real‐time rating applications have been conducted on a limited scale. One promising field
test has been conducted on a major voltage‐stability constrained corridor between southern
Norway and southern Sweden Error! Reference source not found.
There may be some competition in the area of methods to calculate voltage/stability limits in
real‐time, as indicated in the section on Real‐Time Monitoring and Control of Voltage Stability.
At least one other paper describes a “fast pattern matching technique using Artificial Neural
Networks that takes advantage of the off‐line studies to accurately estimate security limits on‐
line” for voltage constrained paths Error! Reference source not found. However, in our
opinion, the adaptability of such methods is limited as they rely on off‐line studies performed
for a given range of system conditions and therefore can never address the full range of field
conditions that could develop in actual operation. PMU methodologies on the other hand can
always adapt to the actual system operating state, regardless of whether that state has or has
not been envisioned and analyzed in off‐line studies. Therefore, in our opinion, it is unlikely
that a comparable level of real‐time rating performance can be achieved for voltage/stability
limited paths through other means than PMU based applications in the foreseeable future. In
regard to determining real‐time ratings of thermally‐limited paths there are numerous non‐PMU
technologies available for this purpose, and one vendor that offers a PMU‐based application for
determination of thermal ratings. (See Section on Overload Monitoring and Dynamic Rating.)
The implementation costs are expected to be relatively low (e.g., $100K’s per control center)
once the pre‐requisites are in place, since the rest of requirements are primarily software based.
The pre‐requisites consist of: Adequate system visibility via RTU and PMU hardware
placement (Error! Reference source not found.Error! Reference source not found.);
Incorporation of basic PMU measurements into the EMS/SE.
The Congestion Management application is closely coupled to State Estimator (SE) and real‐
time rating algorithms, and is indirectly coupled to HA and DA congestion management.

B‐31
In most cases the actuator would be automated; for example the PMU’s would be used to
enhance the quality of the SE solution or the calculation of the real‐time rating of a line or path,
and these results would flow directly into to real‐time congestion management algorithm on the
EMS. In some cases the actuator could be the system operator; for example if a real‐time phase
angle difference across a critical transfer path increased to a level that in the operators judgment
was unsafe, he or she could override the NTC and impose a real‐time reduction in path rating
for use by the real‐time congestion management algorithm.
3.4. Previous Experience A number of utilities have started to experiment with field deployment of PMU based real‐time
rating applications Error! Reference source not found.Error! Reference source not found.Error!
Reference source not found. Their experience to date is too limited to evaluate the
performance.
The CEC’s “Strategic Transmission Investment Plan” (CEC 100‐2005‐006‐CMF) describes
various PMU initiatives in California. The only item directly related to congestion management,
found at page 52 states that:
SDG&E is taking the lead in developing a PIER research project using Phasor
information to increase the accuracy of its State Estimator, which predicts the
state of the transmission grid by sampling key parameters and locations. Phasor
information will provide key instantaneous input to define the boundary of the
SDG&E grid. It is eventually expected that results of this research will contribute
to enhanced transfer capability at the Miguel Substation, helping to relieve a
significant congestion problem.
This project is still in a preliminary stage and SDG&E has yet to deploy the PMU’s. The main
goal of the project is to demonstrate an improvement in state estimation solution quality
through the addition of PMU inputs to the real‐time scan data utilized by the estimator. The
CEC report states that the phasor information will help “to define the boundary of the SDG&E
grid”, or more precisely to determine the real‐time voltage and flow conditions at the
boundaries of the SDG&E grid. SDG&E also hopes to show that congestion management can be
improved on the Miguel path, which contributed to the $250 million in statewide California ISO
congestion costs in 2005. Since the Miguel corridor is thermally limited, it is not SDG&E’s intent
to develop real‐time path ratings using the PMU data. Rather, they hope to improve Miguel
congestion management by developing more accurate real‐time flow estimates on the path.
3.5. Gap Analysis There are a number of barriers or challenges to the implementation of a PMU‐based Congestion
Management. One challenge is in the uncertainty regarding the required level of PMU
deployment/concentration to achieve desired improvement in SE solutions and on‐line rating
calculations. A major uncertainty is the length of time that will be needed for the power
industry to adopt PMU based real‐time calculations of transfer limits for voltage and stability
limited paths. WECC’s off‐line path rating rules and procedures may need to be modified in

B‐32
order to take full advantage of such on‐line applications. A potentially significant challenge is
overcoming reservations of operators toward such new tools by demonstrating their reliability,
accuracy and benefits; similar issues related to indirect impact of the technology on personnel
responsible for HA and DA congestion algorithms.
The California Energy Commission’s PIER TRP funded multi‐year project (2004‐2006) is
currently being conducted by CERTS in cooperation with CAISO aimed at research and
demonstration activities of Real‐Time Applications of Phasors for Monitoring, Alarming, and
Control Error! Reference source not found. (see also Section “Western Interconnection Phasor‐
Based Projects” in this report). One of the goals for this project is Stability Nomogram
Validation. This task addresses a wide‐area research need that extends beyond the CAISO,
which is the use of phasor measurements for real‐time wide‐area control. As a first step
towards achieving this goal, the objective is to research and develop methods for utilizing
phasor measurement to validate and possibly improve stability nomograms. A feasibility
assessment study proposing several approaches of using these time synchronized, high
resolution PMU measurements, and possibly other EMS/SCADA data, for better assessment of
the system operating conditions with respect to their stability limits has already been
conducted. The CEC should consider support of further stages of this effort including field‐
testing, implementation and real‐time performance assessment.
The CEC and WECC should seek additional targeted opportunities to improve congestion
management through PMU based applications, particularly on those paths where power
deliveries are limited by voltage or stability constraints. In such cases it may be possible to
improve the real‐time congestion management process by the two‐fold combination of (1)
improved path flow calculations, and (2) increases in path ratings through real‐time rating
algorithms utilizing PMU inputs.

B‐33

B‐34
4.0 Benchmarking, validation and fine-tuning of system models The goal of this application, model verification and Parameter Estimation (PE), is to identify
questionable power system modeling data parameters (network, generator, load models, etc.)
and calculate improved estimates for such quantities.
In general, automated means are not available to build the required models. Therefore, power
system model building tends to be labor intensive, subject to engineering judgment and human
error. Furthermore, once an error enters the modeling database it is difficult to identify and may
go undetected for years.
The implementation of phasor measurement based tools, methods and applications offer a
means of improving models. By providing precise, time synchronized measurements from
various nodes in a power system, PMU deployment provides new opportunities for identifying
errors in system modeling data and for fine‐tuning power system models utilized throughout
the industry for both on‐line and off‐line applications (power flow, stability, short circuit, OPF,
security assessment, congestion management, modal frequency response, etc.).
Concerning the steady‐state parameter models, EMS vendors have developed algorithms to
identify model errors and to calculate corrected values, a process commonly referred to as
Parameter Estimation (PE). The availability of precise phasor measurements can enhance the
performance of PE algorithms used to identify and correct steady‐state modeling errors (e.g.,
impedances, admittances and tap data). Synchronized measurements from PMUs are used to
compute transmission‐line impedance; this application is commercial and has been installed in
Europe Error! Reference source not found.
Benchmarking and tuning of dynamic and oscillatory modeling parameters is more complex,
and typically requires careful evaluation of actual system response to planned or unplanned
switching events or disturbances. The literature indicates that parameter estimation techniques
can be extended to tuning of dynamic model attributes Error! Reference source not
found.Error! Reference source not found. In addition, a variety of Wide Area Measurement
(WAM) system applications are under development utilizing phasor measurements that may
prove useful for disturbance evaluation, model benchmarking and tuning of dynamic models
Error! Reference source not found.Error! Reference source not found.Error! Reference source
not found.
4.1. State of the Art Review The complete suite of power system models used for planning, operations and protection needs
to account for steady state, dynamic and oscillatory behavior of the interconnected system. In
reality the power system is always undergoing changes in its operational state, but from
moment to moment these perturbations are generally so small that the system can be
considered to be in a “steady state” condition. At these times steady state system models, such
as power flow modeling, are adequate. At other times, perturbations on the system are so large
that dynamic system variables must be taken into account in the modeling. This occurs during

B‐35
faults on the system, tripping of system components, loss of generation or loss of load. Finally,
there are instances when a longer‐term oscillatory condition or slow voltage decay may develop
on a system. The modeling of such pseudo‐steady state phenomenon is more complex and
involves factors such as dynamic load behavior, frequency response and system damping
characteristics.
The implementation of PMU‐based tools, methods and applications offers a means of
improving all of these categories of models. By providing precise, time synchronized
measurements from various nodes in a power system, PMU deployment provides new
opportunities for identifying errors in system modeling data and for fine‐tuning power system
models utilized throughout the industry for both on‐line and off‐line applications (power flow,
stability, short circuit, OPF, security assessment, congestion management, modal frequency
response, etc.).
Every interconnected power system is a complex network of lines, generators, loads,
transformers and other equipment. Modern power system software allows the simulation of
such networks for use by engineers, schedulers, operators and market settlement processes.
However, the accuracy of these tools depends on the accuracy of the models. The basic power
system model includes factors such as:
complex electrical impedances for generators, lines, transformers and shunt devices
tap positions for transformers, phase‐angle regulators and voltage regulators
details of the system’s electrical connectivity or topology
control system parameters (logic) for generators, voltage control equipment, protective
systems and solid‐state devices (e.g., DC terminal equipment, FACTS, etc.)
dynamic response characteristics of loads, generators and other components
In general, automated means are not available to build the required models. Therefore, power
system model building tends to be labor intensive, subject to engineering judgment and human
error. Furthermore, once an error enters the modeling database it is difficult to identify and may
go undetected for years. Sources of data error can include:
Errors in manufacturer test reports for power system hardware
Errors in conversion from test report data to model data format (e.g., change in MVA
base)
Faulty assumptions or data on conductor type, size, spacing, bundling, mileage, etc.
Transcription errors, truncation errors and slipping of decimal points
Failure to update the model for field changes (e.g., reconductoring, undergrounding, tap
changes, etc.)
Errors in representing the connectivity of field apparatus (topology)
Erroneous engineering assumptions on dynamic behavior of loads and generators,
including damping characteristics

B‐36
4.2. Benefits The presence of modeling errors can be extremely difficult to detect even for trained operators
and engineers. State Estimator (SE) solutions are designed to flag steady‐state measurement
results that are suspicious and “diligent study of the State Estimator’s results may lead to the
identification of parameter errors” Error! Reference source not found. However, this is not the
primary intent of SE algorithms, which typically assume that the model data is correct and seek
to identify suspected errors in metered data. What the SE reports as bad real‐time metering data
can actually be good metering that only appears to be incorrect due to erroneous network
modeling Error! Reference source not found. The power industry has made some progress in
developing algorithms designed to identify such model errors and to calculate corrected values,
a process commonly referred to as Parameter Estimation (PE). The availability of precise phasor
measurements can significantly enhance the performance of PE algorithms used to identify and
correct steady‐state modeling errors (e.g., impedances, admittances and tap data). This
performance benefit results from the ability to replace simulated nodal phasor values with
actual measured nodal phasor values Error! Reference source not found.
Benchmarking and tuning of dynamic and oscillatory models is more complex, and typically
requires careful evaluation of actual system response to planned or unplanned switching events
or disturbances. The literature indicates that parameter estimation techniques can be extended
to tuning of dynamic model attributes Error! Reference source not found.Error! Reference
source not found. In addition, a variety of Wide Area Measurement (WAM) system
applications are under development utilizing phasor measurements that may prove useful for
disturbance evaluation, model benchmarking and tuning of dynamic models Error! Reference
source not found.Error! Reference source not found.Error! Reference source not found.
Determination of the stability limits requires the use of dynamic system models that have been
properly validated. The best validation procedure for dynamic system models is through the
recording of dynamic events by PMUs. These recorded events are compared to the response of
the system model for similar signatures. When differences are encountered the model
parameters are changed until a similar response is obtained. If possible the change in parameter
is confirmed independently and the model is then updated with the parameters that produce a
similar response to the synchronized measurements. Synchronized measurements of normal
and abnormal system conditions and accurate system models are used to develop and/or test
the algorithms use to determine the stability limits of the different transmission corridors.
Another benefit of using PMUs is for the Fault‐Locating application where the line impedance is
a key input; a wrong value in the line impedance can lengthen the diagnosis and restoration
process.
Parameter Estimation is very relevant to WECC. The actual users of the Parameter Estimation
are power system engineers responsible for maintaining the model database. Power system
operators could also act independently as “screeners” if they observe suspicious real‐time
system conditions that may deserve follow‐up engineering investigation. In addition to

B‐37
detecting errors in steady‐state modeling parameters, there are unlimited opportunities to
benchmark, validate and fine tune modeling of dynamic behavior for the interconnected WECC
system, including oscillatory modes of system response. Continued deployment of commercial
and customized parameter estimation algorithms and methodologies that incorporate PMU
data should lead to improvements in modeling accuracy throughout WECC. This should
enhance system reliability and improve the performance of the entire suite of software
applications used in the industry for planning, operations, protection and settlements.
However, the degree of improvement remains to be determined through further field
investigation.
4.3. Implementation Considerations Methodologies for Parameter Estimation are post‐event processes that utilize “snapshots” of
real‐time power system measurements taken from real‐time conditions. In general they do not
employ real‐time solution algorithms, however, some of the literature also discusses real‐time,
on‐line PE options Error! Reference source not found.Error! Reference source not found. On
the other hand, post‐event methods that utilize multiple snapshots of the same portion of the
system under different conditions improve the quality of parameter estimation.
Model improvements that result from these methodologies could potentially impact every
power system model‐based application in the industry. One example is in the State Estimation
application. The power system model may have substantially incorrect modeling parameters for
branch reactance, resistance, and line‐charging susceptance that adversely impact the state
estimator’s ability to determine an accurate state estimate.
For application to steady‐state models, minimal incremental costs are anticipated (e.g., $100K’s
per control area) once PMU’s have been deployed, assuming the PE application is supported by
a control area’s current EMS. If not currently supported, some costs ($100K’s to $1 millions)
would be incurred to upgrade EMS. However, continued investigation of optional
benchmarking methodologies for dynamic and oscillatory modes of system response could take
years and millions of dollars in R&D. Potential operational savings are unknown, but may be in
the $ millions/yr to the WECC region. Furthermore, if such model improvements actually help
to avert a major forced outage the savings to customers in California and the WECC could run
into the billions of dollars per event.
4.4. Previous Experience Concerning steady‐state parameters, some commercial state estimators today are capable of
parameter estimation, where questionable model parameters are treated as augmentations of
the state vector so that they may be estimated Error! Reference source not found. PMU
measurements will clearly benefit such algorithms, but it is unlikely that PMU‐based Parameter
Estimation will be developed on a stand‐alone basis. Rather, we expect that with PMUs
deployed for other uses, PMU‐based Parameter Estimation for key equipment such as tie lines
will be included as an add‐on Error! Reference source not found.

B‐38
Concerning dynamic parameters, utility experience to date with such applications is still
limited, especially as regards the integration of PMU measurement data. PE methodologies for
estimating dynamic modeling parameters are still in the development stage. Various
customized benchmarking and tuning methodologies utilizing PMU data are also being
deployed in the WECC, particularly the Pacific Northwest Error! Reference source not
found.Error! Reference source not found.Error! Reference source not found.
The CEC’s “Strategic Transmission Investment Plan” CEC 100‐2005‐006‐CMF describes various
PMU initiatives in California as follows:
SCE is taking the lead in developing a PIER research project using Phasor information to
inform a remedial action scheme near one of its hydro power plants. With Phasor
technology, SCE hopes to eliminate several unnecessary transmission circuit trips per year
while improving the accuracy and reliability of the control system. This will be the first
demonstration of real‐time control using Phasor data. Up until now, demonstrations have
been limited to BPA control simulations. If this control project is successful it will provide
a roadmap for others in using Phasor control on a larger scale to make the grid more
responsive and reliable.
SDG&E is taking the lead in developing a PIER research project using Phasor information
to increase the accuracy of its State Estimator, which predicts the state of the transmission
grid by sampling key parameters and locations. Phasor information will provide key
instantaneous input to define the boundary of the SDG&E grid. It is eventually expected
that results of this research will contribute to enhanced transfer capability at the Miguel
Substation, helping to relieve a significant congestion problem.
The CEC should consider expanding the scope of these PIER projects to include field research
on “parameter estimation” utilizing phasor measurements. This could be particularly valuable
on the 500kV system and in the vicinity of major congestion bottlenecks. The CEC should also
consider ways to continue support of joint work between the CAISO and the Pacific Northwest
to explore all available avenues for benchmarking, validation and tuning of interconnected
system dynamic, oscillatory behavior and model development.
4.5. Gap Analysis The implementation of PMU‐based Parameter Estimation is expected to face several hurdles:
Lack of a systematic approach: The industry clearly needs to develop a more
systematized approach for employing PMU’s in power system model validation and
parameter estimation. Successful efforts have been made in various systems (e.g.,
Comisión Federal de Electricidad de Mexico) to utilize PMU’s in portions of the system
with suspect model parameters in order to tune model data, however, such efforts have
not been well documented to date. More effort should be allocated to developing and
publishing systematized approaches for benchmarking, validation and tuning of system
models using PMU’s, which will be of benefit industry wide.

B‐39
Need for commercial applications: Generic parameter estimation techniques are well
established for linear models, however, parameter estimation for nonlinear systems is a
relatively open field Error! Reference source not found. Power system models include
both linear and non‐linear components. Efforts to extend parameter estimation to non‐
linear, dynamic model parameters (e.g., generator inertia and damping constants,
generator AVR set points, real and reactive load indices, etc.) have been addressed by a
number of researchers Error! Reference source not found.Error! Reference source not
found. However, algorithms and methods that integrate PMU measurements into
power system parameter estimation applications are not commercially available or
widely deployed at this time.
Lack of field experience: Insufficient field experience makes it difficult to do cost benefit
analysis on the use of PMU measurements for parameter estimation and model
development.
Organizational issues: In the absence of PMU data there is a greater likelihood of
questionable SE results caused by modeling errors. This can undermine confidence in
the SE software on the part of system operators. To the extent that PMU applications can
identify such data errors and restore operator confidence, it will benefit organizational
acceptance of SE applications. As regards the rate of deployment, control areas using
older Energy Management Systems that do not support such algorithms may find it
more difficult to justify such applications until the control area has sufficient justification
to install a newer generation of EMS. This will slow the rate of deployment of such
applications in the industry.
B‐40
5.0 Post-Disturbance Analysis The goal of a post‐mortem or post‐disturbance analysis is to reconstruct the sequence of events
after a power‐system disturbance has occurred. To do this, a team of engineers assembles and
studies the recordings from various data recorders that are dispersed throughout the grid. Such
data recorders, or loggers, have been used by the industry for many years. However, they are
not time‐synchronized, making the job of understanding and reconstructing a timeline of what
happened a very difficult and time‐consuming job.
GPS has recently been used as a universal time source for a new breed of data loggers, which
include the PMU. The deployment of such devices has been strongly recommended by
authorities after the Northeast US and Italian blackouts in 2003.
Building a WAMS for the purpose of post‐disturbance analysis does not have to meet stringent
requirements of a data network like that for real‐time applications. Rather, since delays can be
tolerated, data can be stored at the substations, and retrieved from a central facility on a regular
schedule or when needed. To support the analysis, the industry needs to develop smart
software that helps a human being to sift through the vast amount of data for key information.
Some utility companies in the US have deployed GPS‐synced devices to correct the time‐error
problem in their recorders. One goal is to help the staff perform better fault or disturbance
diagnosis. Experience shows that the precise time sync provided by GPS can cut the
troubleshooting time from a few hours to a few seconds.
In Europe, the Italian blackout in 2003 resulted in a number of PMUs deployed throughout the
continent. Even though the primary purpose was to time‐sync the data logging, additional
benefits have been realized since the 2004 reconnection of the Western and Southeastern grids.
During the reconnection, the monitoring of the phase‐angle difference between the two UCTE
zones was done in real time. Also, thanks to a handful of PMUs and dedicated communications
links, UCTE personnel can now observe frequency oscillations on‐line.
5.1. State of the Art Review After a power‐system incident, disturbance recorders are accessed; their records, or data, are
analyzed to produce disturbance reports. The data are typically time‐tagged by the device’s
internal clock. If the time stamps are within sufficient accuracy, the analysis tools can generate
the sequence of events for the incident. The time synchronization, i.e., the ability to keep the
clocks of all data loggers in sync with each other, therefore, becomes a central requirement for
post‐disturbance analysis.
The time synchronization of data recording has been considered important by the power
industry, but it has not followed any standard. The impact became clear in the aftermath of the
August 14, 2003 blackout in the US 0
A valuable lesson from the August 14 blackout is the importance of having time‐
synchronized system data recorders. The Task Force’s investigators labored over
thousands of data items to determine the sequence of events, much like putting

B‐41
together small pieces of a very large puzzle. That process would have been
significantly faster and easier if there had been wider use of synchronized data
recording devices…
More than 800 events occurred during the blackout of August 14, 2003... Most of
these events occurred in the few minutes of the blackout cascade between 16:06
and 16:12 EDT. To properly analyze a blackout of this magnitude, an accurate
knowledge of the sequence of events must be obtained before any analysis of the
blackout can be performed. Establishing a precise and accurate sequence of outage‐
related events was a critical building block for the other parts of the investigation.
One of the key problems in developing this sequence was that although much of
the data pertinent to an event was time‐stamped, there was variation from source
to source in how the time‐stamping was done, and not all of the time‐stamps were
synchronized to the National Institute of Standards and Technology (NIST)
standard clock in Boulder, CO. Validating the timing of specific events became a
large, important, and sometimes difficult task.
5.2. Benefits Based on the lessons learned from major blackouts, the primary benefit from having a GPS‐
synced data recording system is clear: to reduce the time spent on analyzing the vast amount of
data, from months to days or even hours. For disturbances that occur more frequently than a
grid blackout, such as transmission faults, some utilities have reported that investing in a GPS‐
synced data‐recording system is worthwhile:
“Before the [time synchronization system], we spent one to two hours every day
rearranging the sequence of events. We can now perform disturbance diagnosis without
spending any time on sorting through the events.”
“If we save two hours on fault diagnosis time, that’s two hours less time our customers
have to go without power.”
When equipped with sufficient communications, the user can observe certain power‐system
phenomena in real time before they develop into real disturbances. The UCTE has been using
PMUs deployed for data recordings to monitor the inter‐area oscillations between Southeastern
and Western Europe. The communications link between a central facility in Switzerland allows
on‐line tracking of oscillations by comparing a measuring point in Greece against those in
Switzerland Error! Reference source not found. The ability to observe such oscillations with
high resolution is unprecedented. In fact, it provides two additional benefits. One, the operator
has early warnings and may be able to take control actions. Two, even if the event develops into
a real disturbance, pre‐disturbance observations can provide helpful clues into a post‐
disturbance analysis report.
5.3. Implementation Considerations Compared to other PMU‐based applications, the cost of implementing a GPS‐synced system for
post‐disturbance analysis is considered to be low. This is because a key requirement, namely

B‐42
data streaming in real time, is not required by post‐disturbance analysis. Rather, recordings can
be stored in the substation computer for retrieval at a later time. In that respect, the
infrastructure is already in existence; the only extra investment is in installing more data loggers
with GPS‐sync capability.
The key to post‐mortem analysis is to have accurate time tags for the data. For that reason, it is
not always necessary to use a PMU, as many other types of recorders exist and depending on
the specific situations, they can do a better job Error! Reference source not found.
Digital Fault Recorder (DFR) ‐ records points‐on‐wave for currents and voltages, for
time periods of several seconds; it is developed for the purpose of analyzing system
protection operations and circuit breaker performance.
Dynamic Swing Recorder (DSR) – records frequency, phase angle, and rms values of
voltage, current, MW, MVAR, etc. Record duration is several minutes. It is developed
for the purpose of analyzing complex power system events and for recording the
dynamic response of power systems to disturbances.
Sequence‐of‐Events Recorder (SER) ‐ records sequence and time‐of‐day of digital events,
such as contact operations. It is developed for the purpose of analyzing operations of
control and protection systems.
The advantage of the PMU is that it compresses data (i.e. phasor format), thus making data
storage and transmission more efficient than points‐on‐wave recording. Furthermore, as the
focus is not on short‐term fault recording, the PMU functionality is suitable for long‐term trends
thanks to its continuous recording capability. The PMU can capture cascading or trending
events that evolve over seconds or hours; the competing devices, which are set to record on
triggers, would miss the data that occur prior to the moment of the fault or event.
In some situations, other types of data recorders may be more suitable than the PMU. Certain
details in the electrical waveforms (such as transients, per‐phase data, etc.) as well as discrete
quantities (contact operations) are not captured by existing PMUs; so dedicated data loggers are
needed for those purposes.
5.4. Previous Experience In Europe since 1998, UCTE members have operated a “Wide Area Measurement System”
(WAMS), which consists of logging devices at certain places in the grid. These devices are time‐
synchronized by GPS Error! Reference source not found. Recordings are triggered by under‐
frequency, over‐frequency, frequency transients or undervoltage. The results are accessed by
remote reading. Data from its WAMS were considered crucial in helping the UCTE to draw
conclusions about how the Italian blackout of 2003 evolved.
5.5. Gap Analysis Thanks to advances in electronics, data loggers have improved in physical size, cost, resolution
and storage. Their deployment in many substations and equipment can now become
economically justifiable. Accurate time‐tagging can now be easily achieved by the use of GPS.
In fact, a number substations are now equipped with a GPS clock as a timing source for all IEDs

B‐43
in the substation. The accuracy is +/‐1 millisecond, and though not as accurate as that of a PMU
(1 microsecond), the consensus is that such accuracy is sufficient for post‐disturbance analysis.
More recorders will produce more data, which will make it possible to analyze what happened
during a disturbance. However, too much data raises the concern that the analyst will be tasked
with “finding the needle in a haystack”.
The main barrier to a wide acceptance of this application is not in hardware technology, though
some improvements with measurements are still foreseen Error! Reference source not found.
Rather, a “Smart Analyzer”, or a special software program, is needed to provide certain degree
of automation and guidance for the user. For example, some events can be automatically
analyzed with little or no intervention from the user. This requires that the software developer
build a library of “key signatures”. During the use of the software, if data are missing, or the
signature of the fault/event is inconclusive, then the user is required to collect and analyze the
remaining data, and possibly, to construct missing data. Besides being “analytically smart”, the
software needs to be versatile enough to accept inputs not only from PMUs but also from other
GPS‐synced data loggers. As an example, PMU data could be used to establish a number of
hypotheses, and data from other loggers (which provide points‐on‐wave, per‐phase or contact
info) are subsequently used to confirm or reject a hypothesis.
The need for long‐term recordings continues to pose challenge to vendors and practitioners.
Long records require longer transmission times, more storage, more efficient and standardized
ways of organize data, and better reporting. At present, these challenges are only partially
addressed, and are expected to grow as more GPS‐synced recorders are used.

B‐44
6.0 Power-system restoration During power restoration, system operators often encounter an excessive standing phase angle
(SPA) difference across a breaker, which connects two adjacent stations. Closing a circuit
breaker on a large difference can shock the power system, cause severe equipment damage, and
possibly a recurrence of the system outage. The PMUs are well‐suited for on‐line monitoring of
angles, and thus can be helpful as “eyes and ears” for the operator during a power restoration.
The role of phase‐angle monitoring, or the lack thereof, has been demonstrated in real‐world
experience. For an operator who works under stress to re‐energize the grid, the PMU‐based
phase‐angle monitoring can be a valuable tool. The PMUs can help reduce the time needed
during a restoration process.
6.1. State of the Art Review Most utilities, ISO’s and generation plants maintain restoration procedures based on certain
operating philosophies and practices, and familiarity with characteristics of their power plant
restart capabilities and their power system reintegration peculiarities. The resulting procedures
are made available in the form of written manuals that prescribe steps or “rules” to be followed
during restoration, along with appropriate checkpoints along the way in order to verify that
everything goes according to the plan Error! Reference source not found.Error! Reference
source not found. However, these guidelines are based on assumed system conditions, which
may not be the same as those encountered at the present moment. For operators who work
under stress, it is necessary to have a tool that can directly measure the system conditions so
that informed decision can be made in a timely manner. The PMUs therefore can provide a
valuable service, as they can measure the angles directly. Based on PMU measured quantities,
the operator knows if it is feasible to close a circuit breaker, to rely on tie line (thermal
monitoring), or to split the system.
6.2. Benefits The main value of the PMUs in a power‐restoration process is to provide the operators with
real‐time information about the phase angles in relevant parts of the grid. That information will
help the operator to know whether a course of actions is relevant (such as bringing a substation
on‐line in Manhattan, which provides the benefit of time savings), or whether an action would
be futile (such as the attempt to reclose the Lukmanier line in the Italian blackout example,
which provides the benefit of blackout prevention).
A pair of PMUs across a tie‐line can provide thermal monitoring of the line. During emergency,
how long a tie‐line can be relied upon before damage can be a success factor as it allows the
operator a time window to take appropriate actions such as to re‐dispatch generation, or to cut
load.

B‐45
A related topic is Distributed Generation. Interconnecting a DG unit to the grid is akin to power
restoration, though on a smaller scale. PMUs can help in establishing when a DG unit can be
safely brought online.
6.3. Implementation Considerations The cost of implementation is modest as the phase‐angle information is a monitoring
application. The upfront cost is in buying and installing the PMUs, and in providing data
communications to and display on the operator console. In other words, this is an application of
Phase Angle Monitoring, which is already available commercially. The Phase Angle Monitoring
will become an input to the human operator, who is to make all necessary control decisions.
The synchro‐check relay is seen as a competing technology. Synchro‐check relays can monitor
the differences in phase angles, frequency and voltage magnitudes on the two sides of an open
circuit breaker. If these quantities fall within pre‐set thresholds, the circuit breaker will respond
to a reclose command. Conceivably, vendors can provide modifications or upgrades so that the
human operator can observe those quantities on‐line. However, this relay is designed to be a
local and single‐purpose device, and is thus limited in its scope and usage when compared to
the PMU.
The phase‐angle differences can come from the traditional EMS environment via the State
Estimator. In the restorative state, however, system operators are faced with a state that is quite
different from what they are accustomed to during day‐to‐day operation, and for which the
EMS application programs are not designed or not well‐adapted. A PMU‐based Phase Angle
Monitoring can be a valuable complement during the power restoration.
6.4. Previous Experience We cite two examples of using synchronized measurements, or the impact of the lack thereof, in
restoration.
In the first example Error! Reference source not found. Consolidate Edison of New York
brought a new substation on‐line in Manhattan in 2002. To avoid problems during the process
(such as large current flow that could trip circuit breakers and interrupt service), it was
necessary to maintain the phase‐angle difference between the new substation and an existing
one within a narrow range. Traditionally, the copper wires or phone lines had been used to
measure the phase displacement between the substations. However, the copper‐wires method
was difficult to calibrate as the signal latency depended on the length of the wires; furthermore,
the engineers who used this method had retired and copper wires had been replaced by optical
fibers by the phone companies. The utility company decided to install two GPS‐synced devices
that were essentially two PMUs to assist the operator during the substation reconnection
process. It was observed that the process took only four hours with the PMUs, as opposed to 72
hours with the traditional copper‐wires method.

B‐46
The second example Error! Reference source not found.involves the blackout in Italy in 2003.
The sequence of events was triggered by:
At 03:01 the trip of the Swiss 380 kV line Mettlen‐Lavorgo (also called the “Lukmanier”
line) was caused by a tree flashover.
Several attempts to re‐close the line were unsuccessful because the phase angle exceeded
the setting of the synchro‐check relay.
The other Swiss 380 kV line Sils‐Soazza (also called the “San Bernardino” line) was
overloaded. The allowable time period for this overload was approximately 15 minutes.
At 03:11, the Swiss operator ETRAN asked the Italian control centre in Rome to reduce
Italian imports to the scheduled amount.
At 03:21, the import reduction took effect, but was insufficient to relieve the overloads.
At 03:25, the line Sils‐Soazza tripped after a tree flashover, which was caused by the sag.
The Italian system was isolated from the European network about 12 seconds after the
loss of the line Sils‐Soazza.
A review of the sequence of events revealed that valuable time (10 minutes or more) was lost
due to attempts to reconnect the first line. This was because information about the phase angle
was not known at the time. If that information about had been available in real time, the
operators would have known that any attempt to restore the line would be futile and that time
should be used to take other actions.
Following the blackout in 2003, PMUs were installed across one of the lines that were involved
in the initial tripping Error! Reference source not found.
6.5. Gap Analysis Precise measurements provided by the PMUs help reduce the restoration time by supplying the
operator with direct measurements of phase angle. We do not, however, promote a PMU
system to be a replacement for traditional techniques or methods of power system restoration.
The main challenge is in operator training. Since major disturbances occur infrequently,
operators receive little experience in restoration. Simulated training, which can range from
simple instruction manuals, to audio‐visual tapes, to highly interactive simulation, continues to
be needed. For a simulator to be an effective training tool, it must be highly interactive and
provide responses to the operator commands similar to those that the actual power system
does. Under large, long‐duration disturbances, the models and simulations that have been
developed for small and transient perturbations will not be accurate for the behavior of the
power system and its components. There is a need for simulator models that can represent
power system characteristics relevant to restoration. Also, the simulator will need to provide
the operator/trainee with feedback signals that simulate PMU’s direct measurements.

B‐47

B‐48
7.0 Protection and Control Applications for Distributed Generation At least some of the projected yearly generation capacity growth of 15 GW/year in the US will
be coming from distributed generation Error! Reference source not found. The pricing trends,
opening of the competition in the electricity retail business and convenience of having the
generation resources close to the load centers will be driving further proliferation of distributed
generation (DG) technologies. EPRIʹs recent studies Error! Reference source not found. estimate
that, by 2010, 25 percent of the new generation may be DG, with a potential of ultimately
representing up to 20 percent of the $360 billion US electric utility market.
PMU technology seems very promising in monitoring and islanding DG and microgrids.
However, low‐cost design may need to be developed for wider penetration.
7.1. State of the Art Review While providing many benefits in enabling local access to generation, improving (potentially)
the reliability and providing some of the ancillary services (such as frequency responsive
spinning reserve, local voltage regulation, sag support with energy storage, power leveling and
peak shaving, congestion management, power flow control, etc.), distributed generation has not
yet evolved to the point where transmission networks are with respect to large scale utility
generation. Among the potential problems are various interconnection issues Error! Reference
source not found.Error! Reference source not found.Error! Reference source not found.Error!
Reference source not found.involving, among other things, forced islanding of the DG in case
of disconnection from the main source of supply, coordination of protection, etc. Development
of the standards for interconnection has been slowed down because of the scale of potentially
interrelated problems – only one Error! Reference source not found.of the expected series of
standards has so far been approved. Hundreds of interested parties are finding it very
important to participate in and scrutinize the development of the guides and standards related
to implementation of DG.
Among the interconnection issues slowing down the standardization of DG are many design‐
specific, or application‐specific requirements due to a wide variety of DG designs and
technologies. Issues include (but are not limited to) system impacts and analysis, DG
penetration levels, safety, operation, reliability, various liabilities, allowing fully autonomous
remote operation, integration of control and protective relaying functions, etc. The strongest
support PMUs could provide in such an environment would be in control and protection. The
following example of islanding provides an illustration of the problems.
Islanding of a DG system occurs when a section of the utility system is isolated from the main
utility voltage source, but the DG continues to energize that section. Islanding is undesirable
for several reasons Error! Reference source not found. Utility personnel may be unaware that
the portion of the utility system is still being energized. They are therefore unknowingly
exposed to an electric shock hazard. If the DG system drifts slightly out of phase with the
utility voltage source during islanding, large surge currents can flow upon reconnection. These
can damage the DG, customer loads, or utility equipment. In spite of the fact that the likelihood

B‐49
of islanding is very small, due to the seriousness of these risks, utilities and standards‐making
bodies require that power conditioning systems be equipped with specific islanding detection
and prevention schemes that disconnect the DG when islanding is detected. Over the years,
several control schemes have been devised to reliably detect islanding Error! Reference source
not found.Error! Reference source not found. Examples include passive schemes (standard
over/undervoltage and over/underfrequency relaying, phase‐jump detection, voltage harmonic
monitoring) or active ones (slide‐mode frequency shift, active frequency drift, or frequency
bias).
Utilities, standards‐making bodies, and power conditioning system manufacturers have a
common interest in determining which of these methods is “best”; that is, which one detects
islanding most reliably. Such a determination may be made through the use of nondetection
zones (NDZs). NDZs are regions where an islanding detection scheme fails to detect islanding.
Several definitions of NDZ are possible. NDZs have usually been defined in a “power
mismatch space” like that shown in Figure B‐5, in which the dimensions are in terms of P and Q (power mismatch between local generation and load required to be supplied from the utility
source).
For P and Qin this region,islanding is notdetected
Q
PUV
OF
OV
UF
Figure B-5. A nondetection zone (NDZ) defined within the “power mismatch space” Error! Reference source not found.Error! Reference source not found.
As all of the known anti‐islanding methods possess non‐zero NDZs, it is impossible to
guarantee a successful anti‐islanding action unless there is a direct detection of islanding and
transfer trip to DG, which is, in most cases, considered to be a costly solution to the problem.
On the other hand, evolution of DG and increased proliferation is likely to enhance a
desirability for allowing the islanded operation, which would promote a single DG or a group of
DGs to operate in a multibus microgrid structure, where many of the functions and
requirements of the transmission networks, mentioned earlier in the text, would also be needed,
and where PMU monitoring and information infrastructure may be beneficial.
Proper operation of a microgrid requires, among other things, high performance power flow
and voltage regulation algorithms both in grid‐connected and in islanded modes. The structure
of the implementation of a PMU network could be based on a network structure with fiber
optic, or wireless communication network, and a data concentrator linking them into a star‐like
configuration. The function of the data concentrator would be to play a role of the control center

B‐50
for the microgrid. Given the typical sizes of the distribution feeders, typical microgrids would
be sufficiently smaller than large scale networks to not require central CPU power larger than a
personal computer or a workstation.
While modern research trends are toward design of local controllers and operation of the DG
within microgrids without a large overhead of a complicated monitoring and control
infrastructure, it is clear that, cost permitting, such a structure would provide a potential for
integration of several functions at the very highest level of performance. Major technical issues
related to controlling individual generators and operating a microgrid are far from being
definitively resolved. They include frequency and voltage regulation; load tracking and
dispatch; protection and safety; and metering and account settlement to match with actual
energy flows. In order to keep its operation completely independent from the system
conditions, it would be necessary to maintain a separate power supply for the monitoring and
communication network (perhaps a storage‐based, stand‐alone PV supply, or some other
inexpensive and reliable, low maintenance source of power).
7.2. Benefits Control: PMU structure of monitoring can solve the technical difficulties related to control of a
significant number of microsources. Californiaʹs goal to meet its DG objective may result in
120,000 of 0.1 MW generators. DG needs to possess at least limited ability to respond to events
using only local information. For voltage drops, faults, blackouts etc. the generation may switch
to island operation using shared system information from PMUs.
Operation and investment: The microgrid concept allows placement of many microsources behind
a single interface to the utility. Using the PMU structure, their operation could be optimally
coordinated using the complete state information in real‐time. Potential benefits include
improvement in reactive support and enhancement to the voltage profile, removal of
distribution and transmission bottlenecks, loss reduction, etc.
Power quality/ Reliability: DG has the potential to increase system reliability and power quality.
Diversification of supply portfolio enhances the system reliability. Increase in reliability levels
can be achieved if DG is allowed to operate autonomously in transient conditions, especially
when the source of disturbances is upstream in the grid. Black start functions can minimize
down times. If a transmission network goes out, the microgrid can continue to operate in island
mode. Sensitive, mission‐critical monitoring and control infrastructure must be safeguarded
from interruption. Having multiple DGs on a microgrid makes the odds of a complete blackout
much less likely, particularly if extra generation is available.
7.3. Implementation Considerations It will be a major issue in providing the opportunity for a proper system monitoring and
control. It is likely that current PMU designs, optimized for transmission network operation,
will prove not adequate for implementation in microgrids, and that custom models will need to
be developed for large‐scale, low cost implementation should such potential be warranted by
the growth trends.

B‐51
Current trends favor stand‐alone solutions based on local measurements and with little or no
coordinated control over the system. As the research and development are still far from having
answered most of the operational problems, a competition of a well designed and integrated,
low cost PMU implementation would be strong, providing that the overall cost is scaled down
with integration of multiple functions and use of the economy of scales in proliferation of the
equipment which would potentially have a much larger market than the systems used for
transmission network monitoring and control.
7.4. Previous Experience There are a number of Islanding Detection methods for DGs, Error! Reference source not
found. The use of PMUs to detect islanding is described by Error! Reference source not found.
The system consists of two types of equipment to measure the angles at a utility‐side location
and at a DG‐side location. The two pieces of equipment are connected by WAN and
communicate over TCP/IP. A prototype system was shown to be capable of detecting islanding
conditions as small as 1% power imbalance, as opposed to a conventional frequency‐based
system that can only detect islanding conditions with more than 4% power imbalance.
7.5. Gap Analysis The fundamental problem with a complex control system is that a failure of a control
component or a software error will bring the system down. The traditional power system
provides important insights for potential implementation strategies. Key power system
concepts can be applied well to DG operation, but the cost of their implementation must be in
line with the reality of small capacity operation. Current cost trends favor larger generation
units over smaller DGs. For a small capacity DG, the cost of the interconnection protection can
add as much as 50% to the cost of the system. Only if the cost of provided solutions is made
competitive at that level will it be possible for the PMU based system to penetrate such a highly
competitive and cost‐sensitive markets.

B‐52
8.0 Overload Monitoring and Dynamic Rating There are a variety of sensors/devices and companion software systems that allow the utility to
monitor power equipment. The use of PMUs can offer some degree of monitoring at a high time
resolution. Although PMU‐based systems for overload monitoring and dynamic rating cannot
match the features offered by existing equipment monitoring systems, an advantage is in that
the same PMUs can be used for other purposes.
The only commercially available application based on PMUs is the monitoring of overhead
lines. With PMUs at both ends of a line, the resulting measurements allow calculating the
impedance of the line in real time. The direct use of this is to estimate the average temperature
over the length of the conductor. This method, however, does not provide information about
hotspots, conductor sags or critical spans.
8.1. State of the Art Review Many overhead transmission lines in the US are believed to have been designed using
conservative criteria and therefore have excess capacity. However, at present, there is lack of
practical, easy‐to‐use technology to enable real‐time monitoring and dynamic rating of
transmission lines. Line capacity is limited by performance of the conductor at high
temperature and by safety standards that specify the minimum ground clearances.
There are many competing methods for transmission‐line monitoring. Most recently, a PIER‐
sponsored project Error! Reference source not found.Error! Reference source not
found.developed sensor systems and software for real‐time measurement of ground clearances
along the length of lines. The Sagometer™ provides the information needed to (a) Study
conductor behavior for the purpose of validating and/or enhancing static rating, (b) Establish
the dynamic rating for a monitored line, and (c) Collect data on high‐temperature conductor
operation.
The use of PMUs is well‐suited for measuring the impedance of a transmission line Error!
Reference source not found.
One vendor takes this concept one step further by observing the resistance of the line
connecting the substations in real time. The line resistance can change due to ambient and
loading conditions. Knowing the characteristics of the conductor, an estimate of the conductor
temperature can be made from the line resistance. The line being monitored by the pair of
PMUs must have no line taps or substations in between. Another limitation is that the output of
the method represents the average temperature along the conductor length. The advantage with
the PMU‐based method for monitoring a line is its low cost, relative ease of installation and use
for other purposes. For example, the line impedance generated as a by‐product can improve the
accuracy of fault‐locating algorithms.
8.2. Benefits Line impedances are usually estimated based on line length, tower height, conductor size and
spacing. Their Ohmic values are rarely verified. The PMU technology allows tracking the line

B‐53
impedance in real time, and thus helps improve any application (traditional as well as new) that
makes use of line‐impedance data.
For California, the benefits from overload monitoring and dynamic ratings of overhead
transmission lines have been analyzed in Error! Reference source not found. We recite some
key figures here:
A 2‐5% increase in the power transfer capabilities of the existing grid.
A 20‐30% improvement in the transmission efficiency of existing lines that are limited by
ground clearances.
A 15‐25% reduction in the need for acquisition and construction of additional ROW’s
and the associated environmental impacts.
Deferral of capital expenditures of $150‐200 million for the construction of new
transmission lines in the next 10 years.
Long‐term or permanent deferral of capital expenditures of $70‐90 million per year for
reconductoring projects.
Short‐term deferral of capital expenditures of $8‐12 million per year for reconductoring
projects.
While we do not expect a PMU‐based system for overhead line monitoring to deliver all the
quantified benefits listed above, we believe that the PMU technology can provide additional
inputs to the decision process related to transmission lines. For example, the transmission
owner installs specific devices such as Sagometer to monitor critical spans (details) and PMUs at
the two ends of the line to monitor the whole length (averages).
8.3. Implementation Considerations The cost of implementation is very modest as only a pair of PMUs is needed for each line. The
installation is akin to that for a relay at a substation, and does not involve clamping or attaching
devices on overhead spans or transmission tower.
There are several existing methods for rating lines, as reviewed by Error! Reference source not
found.
Using Ambient Conditions:
Static Rating – Ambient conditions are assumed, and conductor temperature is
calculated. From conductor temperature, the conductor sag is calculated, which is then
translated to line rating.
Semi‐Dynamic Rating – Ambient conditions are measured in real‐time, and conductor
temperature and subsequently the conductor sag are calculated.
Direct measurements of conductor temperature: The temperature of a conductor is
measured by a device such as a power donut. The conductor sag is calculated from the
conductor temperature. One drawback is that the temperature is measured only at one
point, although this can be placed at the location of the expected “hot spot” in the line.

B‐54
Tension system: One system consists of a load cell placed in series with a conductor at a
dead‐end structure to measure tension. The tension is used to calculate the ground
clearance down line of the dead‐end and is not a direct measurement of ground
clearance. Also, because the load cell is placed in series with the conductor, the line must
be taken out of service for installation, or live‐line installation techniques must be used.
Acoustic system: and the other consists of a ground based unit which transmits an
acoustic signal up to the conductor, and measures the time for its echo to arrive back to a
receiver and calculates the distance based upon the speed of sound. The system based
on acoustics requires the use of a relatively large ground‐based unit.
Imaging Technology: The Sagometer™ Error! Reference source not found.consists of an
image capture/processing unit mounted on the pole or tower on one end of the span and
monitors the position of the conductor or a target attached to the conductor a fixed
distance away.
Laser Technology: One approach is to mount a device in the midspan of an overhead
line Error! Reference source not found. This device emits a laser beam toward the
ground; by analyzing the returning laser beam, the device can estimate its distance from
the ground, and thus the conductor sag.
GPS Technology: A prototype presented in Error! Reference source not found.uses a
GPS receiver mounted on the overhead wire to obtain direct measurement of the sag.
Table B‐2 compares some features of various technologies Error! Reference source not
found.Error! Reference source not found.
Table B-2. Features of various technologies to measure sag.
Line Thermal Monitoring
Sagometer Acoustical Mechanical
Inputs Phasor
Measurement in
substation
Video camera Acoustic waves over
conductor
Mechanical quantities at
tower
Time resolution Measurement
every second
Not known -not known - Measurement every ten
minutes
Outputs Average
temperature of
conductor
Conductor Sag
Temperature of conductor
at dedicated towers
Temperature of conductor at
dedicated towers
Installation Begin and end of
lines
On tower (but
not on live wire)
At selected towers. On
wire?
At tower (every 10 miles). On
wire?
Communication
Monitoring center
in control room
Via Scada to
control center
Via antenna or cable from
tower to Ground Station,
via RTU-comm. to
EMS/SCADA
Via antenna or cable from
tower to Ground Station No
communication to
EMS/SCADA defined
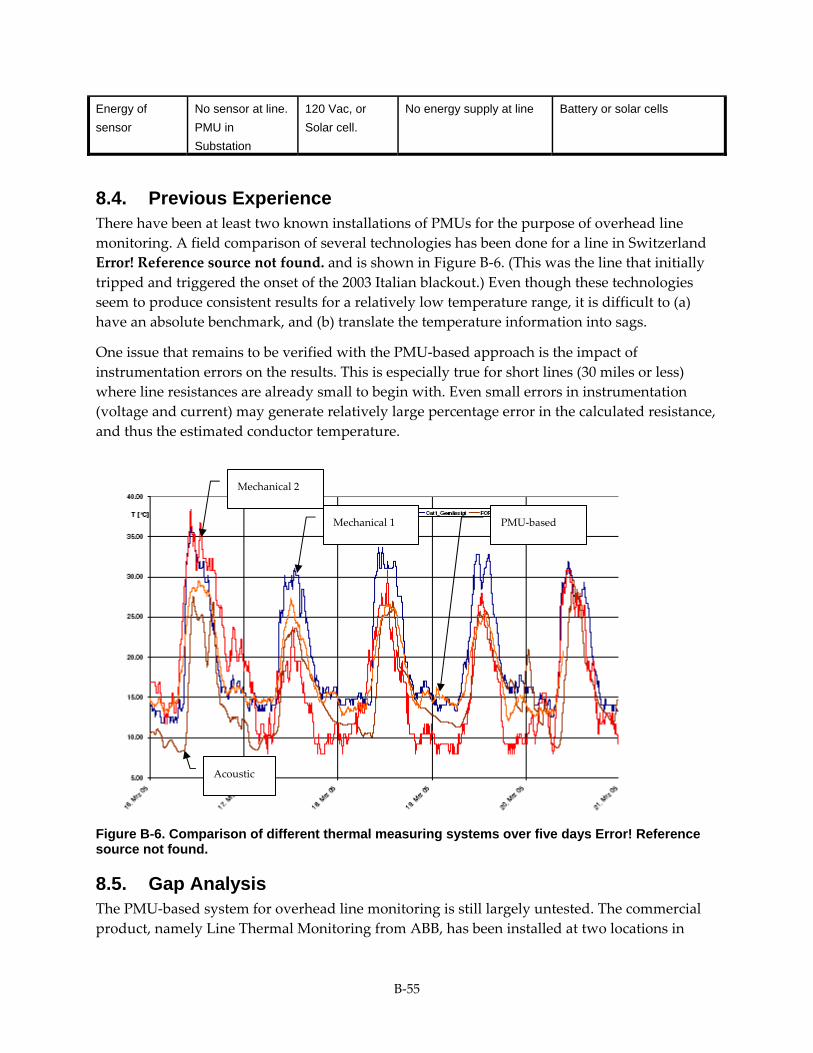
B‐55
Energy of
sensor
No sensor at line.
PMU in
Substation
120 Vac, or
Solar cell.
No energy supply at line Battery or solar cells
8.4. Previous Experience There have been at least two known installations of PMUs for the purpose of overhead line
monitoring. A field comparison of several technologies has been done for a line in Switzerland
Error! Reference source not found. and is shown in Figure B‐6. (This was the line that initially
tripped and triggered the onset of the 2003 Italian blackout.) Even though these technologies
seem to produce consistent results for a relatively low temperature range, it is difficult to (a)
have an absolute benchmark, and (b) translate the temperature information into sags.
One issue that remains to be verified with the PMU‐based approach is the impact of
instrumentation errors on the results. This is especially true for short lines (30 miles or less)
where line resistances are already small to begin with. Even small errors in instrumentation
(voltage and current) may generate relatively large percentage error in the calculated resistance,
and thus the estimated conductor temperature.
Figure B-6. Comparison of different thermal measuring systems over five days Error! Reference source not found.
8.5. Gap Analysis The PMU‐based system for overhead line monitoring is still largely untested. The commercial
product, namely Line Thermal Monitoring from ABB, has been installed at two locations in
Mechanical 1
Acoustic
Mechanical 2
PMU‐based

B‐56
Europe. However, the output (which is merely conductor temperature) has not been used in
any decision‐making process.
The following supporting tools are needed, not only for PMU‐based system but also for other
systems that aim at overhead line monitoring:
A line‐rating toolkit that incorporates a complete set of tools (multiple sensors, analytical
procedures, and software) for studying the behavior of transmission lines under “real
world” operating conditions for a relatively short period thereby enabling optimization
of static ratings. This tool could be used as a study tool and be moved from one line to
another with relative ease.
Procedures/guidelines for deploying sensor technology to optimize ratings for
individual lines, paths, groups of lines, systems. Understanding the behavior of lines,
paths and systems will help identify the critical lines that need to be monitored in order
to obtain optimized ratings for the entire system.
Procedures and guidelines for real‐time rating data integration into control room. For
rating data to be used in real‐time it needs to be integrated into the utilities control room
and ISO control room.

B‐57

B‐58
9.0 Adaptive Protection Using synchronized phasor measurement, certain relays and protection schemes could be made
to adapt to the prevailing system conditions, thereby enhance their performance.
Conventional protective systems respond to faults or abnormal events in a fixed, predetermined
manner. This predetermined manner, embodied in the characteristics of the relays, is based
upon certain assumptions made about the power system. “Adaptive Relaying” accepts that
relays may need to change their characteristics to suit prevailing power system conditions.
With the advent of digital relays the concept of responding to system changes has taken on a
new dimension. Digital relays have two important characteristics that make them vital to the
adaptive relaying concept. Their functions are determined through software and they have a
communication capability, which can be used to alter the software in response to higher‐level
supervisory software, under commands from a remote control center or in response to remote
measurements.
Adaptive relaying with digital relays was introduced on a major scale in 1987 Error! Reference
source not found.Error! Reference source not found. One of the driving forces that led to the
introduction of adaptive relaying was the change in the power industry wherein the margins of
operation were being reduced due to environmental and economic restraints and the emphasis
on operation for economic advantage. Consequently, the philosophy governing traditional
protection and control performance and design have been challenged.
Though exact financial impact of adaptive protection using PMU measurement versus
traditional protection schemes is difficult to quantify and varies from scheme to scheme, some
of the benefits of adaptive protection using PMU measurement may include improved
reliability balance between security and dependability of a protection scheme, better utilization
of power generation, transmission and distribution equipment capabilities, and so on.
The application of PMU measurements for adaptive protection has been researched and
investigated, such as out‐of‐step relays, line relays, better balance between security and
dependability depending on system conditions, and reclosing. Several research ideas have been
discussed in the literature, and the following detailed discussion will provide directions in
which research needs to be carried out in order to identify and implement new adaptive
protection schemes that are suitable for WECC network conditions with real‐time PMU
measurements.
Promising application of using PMUs is in accurate measurement of line impedance for the
Fault‐Locating applications. The line impedance is a key input for accurate fault location. PMUs
could also be used for direct fault calculation using data from both ends of the transmission
line. Inaccurate fault location can lengthen the diagnosis and restoration process.
9.1. State of the Art Review Conventional protective systems respond to faults or abnormal events in a fixed, predetermined
manner. This predetermined manner, embodied in the characteristics of the relays, is based
upon certain assumptions made about the power system. “Adaptive Relaying” accepts that

B‐59
relays may need to change their characteristics to suit prevailing power system conditions.
With the advent of digital relays the concept of responding to system changes has taken on a
new dimension. Digital relays have two important characteristics that make them vital to the
adaptive relaying concept. Their functions are determined through software and they have a
communication capability, which can be used to alter the software in response to higher‐level
supervisory software, under commands from a remote control center or in response to remote
measurements.
Adaptive relaying with digital relays was introduced on a major scale in 1987 Error! Reference
source not found.Error! Reference source not found. One of the driving forces that led to the
introduction of adaptive relaying was the change in the power industry wherein the margins of
operation were being reduced due to environmental and economic restraints and the emphasis
on operation for economic advantage. Consequently, the philosophy governing traditional
protection and control performance and design have been challenged.
Adaptive protection is a protection philosophy, which permits and seeks to make adjustments
automatically in various protection functions in order to make them more attuned to prevailing
system conditions. In 1993 a Working Group of the IEEE Power System Relaying Committee
issued a report Error! Reference source not found.with the results of a survey of relay
engineers in North America questioning their acceptance of 16 specific adaptive functions and
soliciting their suggestions for additional adaptive ideas. A search of IEEE Xplore for “Adaptive
Protection” yields more than the allowed maximum of 100 references. Many of the adaptive
protection ideas in Error! Reference source not found.Error! Reference source not found.Error!
Reference source not found.and the Xplore list involve local information and have been
incorporated in commercially available relays. Examples include adapting transformer
protection to the tap changer position, adaptive reclosing, and adapting relay characteristics to
changes in load. It can be argued that adaptive relaying schemes address existing relaying
deficiencies, making false trips less likely and improving the speed and dependability of the
protection system. The result is an improvement in the reliability of the bulk power system and
in some cases an increase in allowable power transfer limits.
9.2. Benefits The adaptive relaying applications of interest in this document are those that could utilize the
synchronized phasor measurements (phasor measurements for short) to improve their
performance.
Though exact financial impact of adaptive protection using PMU measurement versus
traditional protection schemes is difficult to quantify and varies from scheme to scheme, some
of the benefits of adaptive protection using PMU measurement may include improved
reliability balance between security and dependability of a protection scheme, better utilization
of power generation, transmission and distribution equipment capabilities, and so on.

B‐60
9.3. Out-of-step relays Out‐of‐step relays are a second arena of phasor measurement application Error! Reference
source not found.Error! Reference source not found.Error! Reference source not found.Error!
Reference source not found.Error! Reference source not found.Error! Reference source not
found.Error! Reference source not found.Error! Reference source not found.Error! Reference
source not found.Error! Reference source not found. Knowing the actual angles involved in a
transient swing is of great value if we are attempting to block breaker opening for stable swings
and trip appropriately for an unstable swing. Setting out‐of‐step relays before phasor
measurements as inputs required large numbers of off‐line simulations and frequently resulted
in settings that proved inappropriate for the prevailing system conditions in most cases.
9.4. Adaptive line relays These include attempts to solve vexing line protection problems such as multi‐terminal lines
Error! Reference source not found.Error! Reference source not found. series compensated lines
Error! Reference source not found. more precise end‐of‐line protection Error! Reference source
not found. and protection of parallel transmission lines Error! Reference source not
found.Error! Reference source not found. All of these are primary protection issues. Reference
Error! Reference source not found. introduces adaptive PMU based second and third zone
protection schemes. In some of these cases existing relaying solutions can be improved upon
with the addition of phasor measurements from the remote end of the line(s). There are
adaptive solutions to a number of these problems that use breaker status rather than actual
phasor quantities. If PMUs are installed for other reasons a side benefit would be to use them to
improve the performance of such relays.
9.5. Adaptive security and dependability An additional protection area where phasor measurements can play a role is that of adaptive
security and dependability. The existing protection system has redundant primary protection
coupled with multiple backup schemes. The resulting system is highly dependable in that
virtually every fault is ultimately cleared. The trade‐off is that false trips are tolerated. As the
system has evolved, however, the fact that false trips during large disturbances exacerbate the
disturbance and allow it to cascade has been recognized Error! Reference source not
found.Error! Reference source not found.Error! Reference source not found.Error! Reference
source not found.Error! Reference source not found. The solution is to adaptively alter the
security‐dependability balance during times of stress. Remote phasor measurements can be
used to determine when this should happen. The mechanism is to alter the relaying logic,
which normally lets any relay that “sees” a fault to trip the breaker to logic that demands a vote
such as two out of three. An extreme in security would be to demand that all three primary
relays see the fault.
The benefit is in avoiding cascading and creating a more reliable system. The price paid for this
increased security under “stressed” system conditions is that there is a somewhat reduced
dependability, which is acceptable. The advantage of the adaptive voting scheme is that the
actual relays are not modified but only the tripping logic responds to system conditions. A

B‐61
scheme which always uses 2 out of 3 logic has been implemented by GE in New Mexico. The
scheme is not adaptive so no external inputs are required.
9.6. Adaptive reclosing Automatic reclosing of circuit breakers is widespread since 80% of all faults are temporary. Each
application, however, may entail compromises based on the type of reclosing involved. Issues
include the adverse effect on stability of an unsuccessful reclose, the possible stresses on
generator shafts Error! Reference source not found. the possibilities of reclosing into an internal
transformer, and the secondary arc produced by single pole switching. Some adaptive reclosing
is possible using digital relays without phasor measurements. The type and severity of the fault
can be used in the reclose logic. Precisely controlling the closing and tripping of the breaker
offers the opportunity to reduce the exposure of the breaker to transients and reduce breaker
maintenance.
With phasor measurements it is possible to guarantee that the breaker only recloses into
phase/ground or phase‐phase faults. That is, reclosing into multi‐phase faults is avoided. When
the first phase is energized after breaker opening measurement of the three phase voltages can
be used to differentiate between an unfaulted line, a line‐ground fault on either of the
deenergized phases, a phase to phase fault involving the energized phase, or a phase to phase
fault on the two deenergized phases Error! Reference source not found.
9.7. Fault location Fault location is not protection per se but is closely related to line protection sharing algorithm
structure and input signals. There is a longer time allowed to determine fault location than the
short time interval needed in relaying. Accurate fault location is important in terms of line
inspection and maintenance. Both one and two ended methods have been developed using
conventional voltage and current measurements. PMU based fault location techniques have
been proposed which adapt to fault resistance, fault incidence angle, series compensated lines,
double circuit lines, and multi‐terminal lines Error! Reference source not found.Error!
Reference source not found.Error! Reference source not found.Error! Reference source not
found.Error! Reference source not found.Error! Reference source not found.Error! Reference
source not found. The system in Error! Reference source not found.was field tested at 161 kV
substations of the Taipower System.
The above described adaptive protection applications using synchronized phasor
measurements would allow the operation of these protection schemes more adapt to the
prevailing system conditions, thereby improve their performances. Most of them are still in the
early research and development stage. As synchronized phasor measurement becomes more
readily accessible, adaptive protection applications using phasor measurement could be
implemented much easily.
Although accurate fault location techniques may not require synchronized phasor
measurements, the accuracy of line impedance is a key to accurate fault location. The PMU

B‐62
technology allows tracking the line impedance in real time, and thus helps improve any
protection and fault location application that makes use of line‐impedance data.
9.8. Implementation Considerations
9.8.1. Out-of-step relays
The communication needs for using phasor measurements in Out‐Of‐Step relaying are system
and situation dependent. If the possible instability is to break up into two systems such as
Florida‐Georgia then the number of measurements is small. An arbitrary break up into N
unknown islands could require a system‐wide approach where large numbers of phasor
measurements were processed at some central location. The latter is the subject of another
section (“Planned power system separation”) and will not be discussed in detail here.
9.8.2. Adaptive line relays
The implementation of each of these would require the addition of these phasor measurements
into an existing digital line relay. The communication requirements are modest since the
desired measurements are at the remote end of the protected line.
9.8.3. Adaptive security and dependability
As opposed to the adaptive line relays which only require phasor measurements from the ends
of the protected line, remote phasor measurements would undoubtedly be required to
determine when to alter the tripping logic. If PMU measurements are used to control the
transition from one‐out‐of‐three to two‐out‐of‐three then the PMU measurements must give an
indication of system stress. It is likely that the size of angle differences is sufficient but
simulation can be used to test and perfect the logic. For example a large number of scenarios
can be used to train a decision tree or a neural network to make the decision and choose
appropriate variables.
9.8.4. Adaptive reclosing
The same as with line relays.
9.8.5. Fault location
The implementation would require phasor measurements from both ends of the line. As this is
the off‐line application, low‐speed communication is required.
9.9. Previous Experience There are only two known PMU applications of Adaptive Protection that have been tested on
real systems: Out‐of‐step relaying (Georgia‐Florida connection), and Fault Location (Taipower).
9.10. Gap Analysis The adaptive protection using real‐time PMU measurement has shown that it could further
enhance the performance of protection schemes over traditional protection schemes. However,
its implementation must overcome several hurdles.

B‐63
PMUs: There is one special demand on PMUs for this application. Application of PMU
in some adaptive protection applications, such as Out‐Of‐Step relaying, would require
consistent dynamic performance of all PMUs. The new IEEE C37.118 standard has
recommended but has not specified the required dynamic performance tests for PMUs.
This should be resolved for this application.
Communication network support: The survey Error! Reference source not found.is
dated in terms of communication technology but its conclusion that relay engineers
were reluctant to depend too heavily on communication is probably still true to some
degree. Surely any of the adaptive line protection schemes must have a back‐up mode
that does not depend on communication in order to be accepted by relay engineers. The
communication needs of the adaptive line relays and fault location are only a little more
demanding than existing pilot relaying schemes when information from the remote end
of the line is used. Phase comparison and directional comparison schemes are examples.
The out‐of‐step and adaptive security dependability applications require more and
conceivably, more long distant communication and must be carefully designed to deal
with possible missing or bad data. Protocols for digital communication schemes that
have relaying signals coexisting with other data must insure “quality of service” for the
relaying signals. Otherwise protection will require dedicated channels.
Adaptive security dependability may require that measurements are collected centrally and an
assessment of system state be made before a signal is sent to the terminal in question to alter
dependability. The communication requirements could increase with such a scheme. Adaptive
reclosing requires no communication.
Algorithm and field experience: Most of the adaptive line protection schemes are at the
conception stage with references from the academic community. The systems used to
demonstrate the feasibility of the approach are usually small and the numerical details
of implementation are relatively unimportant. Real world application of theses ideas
will require field tests and modifications of the design. The out‐of‐step protection has
been field tested Error! Reference source not found. for one specific application and a
non‐adaptive voting scheme has actually been put in service. The fault location system
in Error! Reference source not found. was field tested in the Taipower System.
Acceptance: Another possible issue with acceptance of adaptive protection is the
concern that the actual process of changing relay settings or function may lead to errors
in protection. One concern is that adaptive relays might be out of service while they are
changing settings. Other issues are: a concern that an adaptive relay could respond to
bad data and produce a worse situation than before the adaptive change, concerns that
adaptive relays need fall back positions when communications fail, and the perceived
problem of coordination of non‐adaptive relays with adaptive relays. Many of these
issues can be addressed in programming and manufacture but must be demonstrated to
users to overcome reluctance to use new adaptive packages.
Cost: If communication support is already available and the protection device itself has
built‐in PMU measurement capability, then there is no cost associated with
implementing the adaptive schemes described above. If PMU is installed as separate

B‐64
dedicated devices, then there is a technical and cost issue for protection devices to
communicate with and utilize the PMU measurement. In practical applications,
protection devices and other applications share the PMU measurement may be a cost‐
effective solution to this issue.

B‐65
10.0 Planned Power System Separation Direct utilization of PMU data may achieve vastly improved system performance over current
methods for planned system separation.
The planned separation of a power system into different segments – islands – is the action of
last resort when the power system is undergoing an unstable electromechanical oscillation, and
a separation is unavoidable. Under these circumstances it is desirable to create electrical islands
and separate them from the grid on a planned basis rather than an unplanned basis, and then
reconnect them with the grid later when conditions for such action are favorable. Ideally, each
island should have an approximately balanced generation and load, though in practice this may
not always be the case. Some additional control operations, such as generator tripping and load
shedding, may be required to achieve the balance of the generation and load in an island.
There are two traditional techniques in use at present to accomplish system separation under
these conditions: out‐of‐step relaying, and remedial action schemes. Both of these techniques
are classified as relaying applications, although the remedial action scheme is sometimes
considered to be a control function.
It is important to note that both of these schemes depend upon pre‐calculated system behavior
based upon assumed state of the system: loading levels, topology, planned and unplanned
outages, etc. It is well known that in many practical situations the prevailing system conditions
are quite different from those upon which the protection scheme settings are based.
Consequently, often the performance of these protection systems is not optimal, and in some
cases is inappropriate, for the existing system state – which could make a bad situation worse.
The use of PMU measurements instead of pre‐calculated scenarios would improve a planned
system separation in two key areas: (1) whether a power system is heading to an unstable state
and among which groups of generators the loss of stability is imminent will be determined
more accurately with real‐time measurement, and (2) islanding boundaries could be determined
dynamically according to the prevailing system conditions.
Though exact financial impact of a successful planned system separation versus an
uncontrollable system disintegration (or a planned system separation with existing control and
protection schemes) after a large system disturbance is difficult to quantify and the results vary
from case to case, the major benefits of planned system separations using PMU measurement
are clear. These include minimizing lost revenues and reducing generator restarting cost for
utilities, and limiting the direct impact to customers.
The application of PMU measurements to perform planned system separation on systems
which are peninsular (such as Florida‐Georgia, or remote generators feeding a large power
system) has been shown to work quite well. However, when the power system is tightly
meshed – as is the case of the WECC network, no such real‐time applications have been
implemented. However, several research ideas have been discussed in the literature, and the
following detailed discussion will provide directions in which research needs to be carried out

B‐66
in order to achieve planned separation of a tightly interconnected network with real‐time PMU
measurements.
10.1. State of the Art Review The task of carrying out planned separation of power systems during a severe transient
disturbance is assigned to dedicated protection systems such as out‐of‐step relaying and
remedial action schemes. When the severity of a transient initiated by a fault or other
disturbance is such that it is inevitable that generators in some parts of the power system will
lose synchronism with other generators, it is a foregone conclusion that the power system will
split in parts. In such cases it is important to perform a separation among parts of the system in
such a way that the individual parts will have an approximate balance between the generation
and load in each part. It is of course not possible to achieve this balance instantaneously, but it
is expected that by some relatively minor control actions within each island such a balance
could be achieved, and each part stabilized as a synchronous island at some frequency close to
the nominal frequency. Such planned separations will allow the individual parts to be reunited
in a synchronous system with relative ease.
There are two traditional techniques in use at present to accomplish system separation under
these conditions: out‐of‐step relaying, and remedial action schemes. Both of these techniques
are classified as relaying applications, although the remedial action scheme is sometimes
considered to be a control function.
It is important to note that both of these schemes depend upon pre‐calculated system behavior
based upon assumed state of the system: loading levels, topology, planned and unplanned
outages, etc. It is well known that in many practical situations the prevailing system conditions
are quite different from those upon which the protection scheme settings are based.
Consequently, often the performance of these protection systems is not optimal, and in some
cases is inappropriate, for the existing system state – which could make a bad situation worse.
For planned system separation, direct utilization of PMU data is to achieve a vastly improved
performance by changing the way that system separation was done presently. The use of PMU
measurements instead of pre‐calculated scenarios aims to improve a planned system separation
in two key areas: (1) whether a power system is heading to an instable state and among which
groups of generators the loss of stability is imminent will be determined more accurately with
real‐time measurement, and (2) islanding boundaries could be determined dynamically
according to the prevailing system conditions.
At present the planned separation task is performed by a variety of protection systems
depending upon the specific type of a power system to be protected, the philosophy of the
operating personnel, legacy systems, and ad hoc designs designed to handle each specific need
as it arises. For example, there is a school of thought that allows the separation to take place
naturally, i.e. the natural flows resulting from the disturbance are expected to trip protective
relays at the electrical center of each disturbance. Thus no additional control and protection
need be provided. The separations which result from such schemes can hardly be called
‘planned’. Clearly there is no assurance that such separation would lead to survivable islands,

B‐67
and system restoration may well be a protracted time‐consuming task. In some cases, this let‐
system‐to‐handle‐it‐by‐itself could lead to large scale system blackouts as having been
witnessed in the eastern and western part of US grid.
Where the power system is of a peninsular nature, i.e. a group of generation centers connected
to load centers through relatively long lines on a single corridor, it is possible to apply out‐of‐
step relaying with some confidence. These relays detect the onset of a disturbance, determine if
the disturbance is going to lead to instability and break‐up, and then provide selective blocking
and tripping signals to bring about separation in islands in a planned manner. The relays,
which perform these tasks, are autonomous, and their settings are based upon simulations
carried out for assumed system and contingency conditions. Needless to say, as the power
system changes over time, the settings of these relays are often not optimized for the prevailing
system conditions at the time when a disturbance occurs.
When a power system is tightly interconnected as in WECC or in the Eastern North American
Interconnection, applying out‐of‐step relays on the network becomes impractical because it is
not possible to determine the outcome of an event from strictly local measurements. In recent
years attempts have been made to bring remote measurements to a decision making center and
then direct controlled separation signals when appropriate. These are the remedial action
schemes (RAS), more recently labeled the system integrity protection schemes (SIPS). The
remote inputs upon which such systems base their decision are detected disturbance, topology
information, power flows in selected lines and generators, planned and unplanned outages,
load levels, etc. Each SIPS system is designed to meet the specific need at a specific point in the
system, and it is stated in literature that on the WECC system the number of such SIPS schemes
is approaching 100. As with the settings of the out‐of‐step relays, the conditions which triggers
action(s) by the SIPS are pre‐calculated and based upon assumed system and contingency
conditions. In that sense, none of the schemes used in the current state‐of‐the‐art make use of
real‐time wide area measurements such as those provided by the PMUs. Their performances are
often not optimal for the prevailing system conditions at the time of a system disturbance.
The key factors for a successful planned system separation are: (1) to be able to decide more
accurately in real‐time whether a power system is heading to an unstable state and among
which groups of generators the loss of stability is imminent, and (2) to be able to dynamically
determine the proper separation boundaries of a power system for the prevailing system
conditions. Both could be accomplished by utilizing the synchronized real‐time positive
sequence voltage and current measurements provided by PMUs.
The use of real‐time positive sequence voltage and current measurements provided by PMUs
offers for the first time the ability to take note of what is happening on the power system at any
moment, and by tracking the actual system behavior determine if a planned separation of the
network is necessary to avoid a catastrophic failure. This is the idea behind the new SIPS
function, one which has been discussed in the literature and is a subject of active development
by researchers.

B‐68
The research effort on this function can be divided in two major steps. In the first step it is
necessary to observe the rotor angles of the generators for a period of the order of 250
milliseconds, and through a polynomial curve fit and prediction step, determine whether or not
the evolving transient is going to lead to instability. When instability is predicted, the observed
rotor angles are classified as belonging to two or more coherent groups. It should be noted that
machine rotor angles are obtained from the positive sequence voltage and current
measurements on the high voltage side of the generator step‐up transformer where PMUs must
be placed. Machine equivalent circuits are used to determine rotor angles for all the principal
machines on a common GPS reference frame.
The second step is to determine boundaries of islands which are to be formed in case of
evolving instability, and which preferably should have an approximate balance between load
and generation so that they can survive as an island. The island boundaries will determine
which lines must be tripped to initiate planned separation through transfer trip commands. It
may also be necessary to block certain distance relays near the electrical center of the swings,
which may be in danger of tripping because of excursion of impedance loci into the tripping
zones of some relays. In the case that generation and load are unbalanced in some islands, it
may also be necessary to send control signals to trip some selected generators or shed part of
the load in the island.
10.2. Benefits Though exact financial impact of a successful planned system separation versus an
uncontrollable system disruption (or a planned system separation with existing control and
protection schemes) after a large system disturbance is difficult to quantify and varies from case
to case, the major benefits of planned system separations are clear, which include minimizing
lost revenues and reducing generator restarting cost for utilities, and limiting the direct impact
to customers to the minimal.
It should be clear that if a power system is going to separate into islands due to coherent groups
of generators going out‐of‐step with other generator groups, it is preferable to form islands
which have been planned before hand to approximately match generation and load in each
island. The objective is to be able to restore the interconnections as soon as possible, and this
can only be accomplished if each formed island continues to operate stably, possibly at slightly
different operating frequencies. On the other hand, if the islands are allowed to form as they
will due to relay operations during system swings, it is likely that some islands will not be able
to recover, and will be blacked out. Apart from the loss of load and the accompanying loss to
economy and social order, there is the added expense of restarting generators from a black start.
For thermal units these costs could be substantial.
It is inevitable that due to the act of separation into islands some loads get disconnected leading
to civil and economic impact on society. The sooner the service can be restored to the lost load,
the less will be the cost to society. The protection function which avoids unnecessary system
separations, and which creates planned islands when separation is unavoidable will provide the
best outcome of a serious disturbance with minimum impact on the network.

B‐69
Since a SIPS system using PMU measurement does not require extensive system studies to
determine upon which assumed system conditions that the system should initiate a system
separation, an added benefit is the saved manpower and time involved in such studies.
10.3. Implementation Considerations The proposed planned separation system will have these main elements:
PMUs on the high side of the step‐up transformers of principal generators
Communication system to bring the PMU data to a central processor
Rotor angle calculator on GPS reference
Time series formulation and swing predictor
Coherency detector
Instability detection and island boundary determination
Transfer trip and blocking signal generation for planned system separation
Post separation monitoring of the planned separated islands
Although much of the analytical work is in the nature of research topic, it is clear that the
phasor measurement units provide the most significant new element with which real‐time
information about the dynamic state of the power system can be estimated and meaningful
decision about the nature of the evolving transient made.
The choice of locations where PMUs must be placed is relatively simple for this task. One must
put them at the high voltage substations at generating stations with significant generation
capacity. From these measurements, it is a simple matter to determine the rotor angle of each
equivalent generator on a common reference (GPS). The data must be communicated to a
central location, where a data concentrator and application processor must be located. In all
likelihood the communication must be handled by dedicated fiber optic channels so that data
latency can be limited to about 20‐50 milliseconds. All of these steps are well within the scope
of present technological development.
The coherency determination and instability prediction tasks will need research and
development, although there are some papers in the listed references where approaches to this
problem have been suggested. Beyond this stage is the problem of determining a cut‐set of the
network to formulate islands with coherent generator groups and approximately matching
load. This is primarily a topological problem, and should be amenable to a rapidly converging
solution. The transfer trip and block facilities already exist in the established protective devices.
To a certain extent, this work is an extension of the work done on PMU based out‐of‐step relay
development which is reviewed next.
10.4. Previous Experience An adaptive out‐of‐step relay was developed for the transmission corridor between Florida and
Georgia, and has been reported in the literature Error! Reference source not found.(Figure B‐7).

B‐70
S-PMU
Relay
S-PMU
Relay
Figure B-7. Out-of-step protection with PMUs.
Two synchronized PMUs were installed in key substations in Florida and Georgia. Based upon
the real time measurements and the equivalent generator data at each end the rotor angles were
calculated at each site, and communicated with the other site. The angle difference was tracked
in real time. With known system impedance data, an equal angle criterion could be applied to
the problem of instability detection.
As the swing of the angle was observed for a period of about 250 milliseconds, confidence was
gained in the movement of the angle along the projected post‐fault curve in the power‐angle
plane, and after this period a prediction of the outcome could be made with confidence.
The experiment was run for about one year with a field installation, during which no unstable
events occurred. However, a number of stable events were observed, and the system predicted
stability in each of these cases. The equipment was dismantled after the completion of the one‐
year trial period.
10.5. Gap Analysis The planned system separation using real‐time PMU measurements holds the promise of
greatly improved performance of such a scheme. However, its implementation must overcome
several hurdles before it can be realized.
PMUs: There is one special demand on PMUs for this application. Application of PMU
in planned system separation requires consistent dynamic performance of all PMUs. The
new IEEE C37.118 standard has recommended but has not specified the required
dynamic performance tests for PMUs. This should be resolved for this application.

B‐71
Communication network support: The implementation of this system would call for
hundreds of PMUs to be installed with a need of a communication infrastructure to
support the large amount of real‐time PMU data transfer. Communication needs are
such that leased circuits, microwave, etc. are likely not to be suitable to meet the real‐
time latency requirement, and dedicated fiber optic channels will be required in order to
keep the data latency to within acceptable limits. Where such facilities do not exist at
target substations, new facilities must be installed.
Central control system: The implementation would need a new type of central control
system to support the system. The system should be able to process data from hundreds,
and possibly thousands in the future, PMUs in real‐time and issue control commands
based on the real‐time detection/prediction of system instability. Such central control
system needs to be developed as currently there is no such system exists.
Overall system architecture: The system must be designed with sufficient redundancy in
hardware and communication paths so that there is no single point of failure in the
entire scheme. In all cases, it is possible to design the system so that in case of failures
one reverts to the existing mode of operation – which is without the planned power
system separation scheme based upon PMU data. This is standard practice in all
protection applications where communication channels are involved.
Detection and control algorithms: As has been mentioned, the analytical development of
the needed coherency detection algorithms and self‐sufficient island identification
algorithms needs to be done. There are some research studies which have reported on
methods of achieving this objective, but they must be suitable for applying to the WECC
system in particular. One redeeming feature is that the interfaces where instabilities
could develop may be known by past experience, and the boundaries of islands which
would survive after the split may also be known from past experience. Thus, in
practical terms, the research and development of algorithms needed has a very good
chance of success.
Cost: The cost of the project would be substantial – involving PMUs, some new
communication facilities, interfaces to trip and block logic in existing relaying schemes,
and on research on the new methods of detecting instability. However, the pay‐off of a
completed and successfully implemented scheme in terms of fewer service
interruptions, and higher power transfer limits (where those were limited due to pre‐
calculated stability imposed conditions) would be substantially greater making the
application well worth pursuing.
Remedial Action Schemes are well entrenched in the WECC system, and have been accepted by
the system operators. The proposed system falls in that general category, but trusting fully
automated real‐time logic to determine the boundaries for electrical islanding without operator
review may require extensive demonstration before it is accepted by system operators and
management.

B‐72
10.6. PMU System Architecture – Status and Gaps As seen from the previous sections, many of software applications will benefit from time‐
synchronized data. These applications have different requirements on the number of PMUs,
data‐reporting rate, etc. For example, an out‐of‐step relay using PMU data may need only two
PMUs with very high data‐reporting rate and communications reliability. A State‐Estimator
using PMU data may need hundreds of PMUs in order to achieve a desired performance
improvement, but need a much slower data rate.
Today, one of the main hurdles for applying PMU technology is the cost of PMU device
procurement, installation, operation, and maintenance cost. Fortunately, for many existing
IEDs, it is possible to achieve accurate time stamping by adding some hardware, such as a GPS
receiver, and in some cases, proper communication interface. This retrofit/upgrade approach
represents a much lower cost than installing a brand‐new PMU. As a result, one can expect that
in a near future there will be thousands of IEDs in operation with built‐in PMU functions.
When such IEDs reach a critical mass, there will be a fundamental paradigm shift in applying
synchronized phasor technology in power systems. The challenge will be in how to use those
IEDs and their associated software applications more effectively to improve the system
operation, and to achieve desired financial benefits. The main cost will be with the system
components, such as data concentrators, the software applications, and the supporting
communications system. This trend requires that special attention be paid to the PMU system
architecture.
An ideal PMU system architecture should properly address the following issues:
Scalability: As the number of installed PMUs and IEDs with integrated PMU functions
increase gradually, the system architecture must be designed so that it can keep up with
this trend.
Flexibility: As many of the system components will be acquired, installed, operated and
maintained by different entities, the system architecture should very flexible in order to
accommodate the diverse requirements of these entities.
Communications bandwidth and latency: In the new paradigm, on‐going
communications cost (if lease from communications service providers) could become the
main cost item of a PMU system. Reducing the bandwidth requirement will help to
reduce the on‐going cost of PMU applications. Minimizing the communication
bandwidth requirement will also help to reduce the latency of the PMU data
transferring. For real‐time applications, reducing the communication latency is a must.
Ease with adding/removing PMUs/IEDs and enabling/disabling PMU applications: To
accommodate the growth of IEDs with PMU functionality, the architecture must be so
that it is easy to add a new device to the PMU system. Occasionally, devices need to be
taken off‐line, such as for routine maintenance; their temporary removal should be
accomplished easily and should not hamper related applications. Similarly for the
software side, the design should also allow easy enabling or disabling applications when
needed.

B‐73
Existing RD&D projects are striving to achieve the above‐mentioned features, such as the
GridStat initiative to design the next‐generation communications system for the power grid
Error! Reference source not found.. However, in practice, there is still a large gap to overcome
as PMU systems today are designed to accommodate near‐term needs. They are small systems
consisting of one data concentrator and a few PMUs.
Currently, there are some efforts, notably the WECC and EIPP projects in the US, to connect
small PMU systems implemented by individual utilities together to form a larger system. Yet,
the total number of installed PMUs is still well below 100 for each system. The number of
installed PMUs is projected to increase to a few hundreds in next few years for these two
systems. The two systems currently have a similar system architecture using a master data
concentrator to aggregate the PMU data either from PMUs directly or indirectly from connected
utilities’ data concentrators, and then re‐transmit aggregated PMU data back to utilities’ data
concentrators. Both systems use their master data concentrators developed in‐house by BPA
and TVA respectively, due to lack of commercial products at the time these systems were
started and developed.
The system architecture of these two systems will not meet the requirements of the ideal system
mentioned above. As the number of installed PMUs grows, the two systems will have
difficulties to keep up with the demand. Relying on utilities’ data concentrator to relay PMU
data not only add time delays, but also make it difficult for the system to accommodate the
growing number of applications. It is likely that the number of installed PMUs and IEDs will
quickly out‐grow the capacity of the master data concentrators. Lack of vendor support will be
a major concern.
Today, vendors are reluctant to develop system components, such as data concentrators for
substations and control centers, as there is no clear specification for an accepted system
architecture and the related system components. The market demand for such system
components is not clear to vendors.
To facilitate a large‐scale deployment of PMUs in WECC and to meet the diverse requirements
of different applications, there is a need to develop an optimal architecture. An optimal system
architecture would provide a solid foundation for implementing WECC PMU system that is
highly scalable, flexible, easy to operate and maintain, and requires minimal communication
bandwidth and low latency. The chosen architecture should generate clear specifications of
various system components. The specifications will help vendors to develop products to allow
shared use of PMU data among various applications, and to meet the performance requirement
of each application.

B‐74
11.0 References Abdelaziz, AY, Irving, MR, Mansour, MM, El‐Arabaty, AM, Nosseir, AI. “Adaptive
detection of generator out‐of‐step conditions in power systems using an artificial neural
network.” Control ʹ96. UKACC International Conference on (Conf. Publ. No. 427), Volume
1, 2‐5 Sept. 1996 Page(s): 166 ‐ 171 vol.1.
Abdelaziz, AY, Irving, MR, Mansour, MM, El‐Arabaty, AM, Nosseir, AI. “Adaptive
protection strategies for detecting power system out‐of‐step conditions using neural
networks.” Generation, Transmission and Distribution, IEE Proceedings ‐ Volume 145, Issue
4, July 1998 Page(s): 387 – 394.
Adibi, MM. (2000). “Power System Restoration: Methodologies And Implementation
Strategies.” Ed., Published in Jun 2000 by Wiley US.
Akke, M, Karlsson, D. (2002). “Phasor measurement applications in Scandinavia.”
Transmission and Distribution Conference and Exhibition: Asia Pacific. IEEE/PES Volume 1,
6‐10 Oct. 2002 Page(s): 480 ‐ 484 vol.1.
Allemong, J. (2005). “State estimation fundamentals for successful deployment.” Power
Engineering Society General Meeting. IEEE June 12‐16, 2005 Page(s): 2203 – 2204.
Alvarado, F, Dobson, I, Hu, Y. “Computation of Closest Bifurcation’s in Power Systems.”
IEEE Transaction on Power Systems, Vol. 9, No. 2, May 1994.
Anjia Mao, Jiaxi Yu, Zhizhong Guo. (2005). “PMU Placement and Data Processing in WAMS
that Complements SCADA.” Power Engineering Society General Meeting, 2005. IEEE June
12‐16, 2005 Page(s): 690 – 693.
Baldwin, T, Mili, L, Boisen, M, Adapa, R. “Power System Observability with Minimal
Phasor Measurement Placement.” IEEE PES May 1993, 0885‐8950/93.
Ballance, JW, Bhargava,B, Rodriguez, GD. (2004). “Use of Synchronized Phasor
measurement System for Enhancing AC‐DC Power System Transmission Reliability and
Capability.” CIGRE C1‐210 Session, 2004.
Bao, L, Huang, Z, Xu, L. (2003). “Online Voltage Stability monitoring Using VAr Reserves.”
IEEE Transactions on Power Systems, Volume 18, No. 4, Nov. 2003, Page(s): 1461‐1469.
Begovic, M, Mills, RQ III. “Load Identification and Voltage Stability Monitoring.” IEEE
Transactions on Power Systems, Volume 10, No. 1, Feb. 1995, Page(s): 109‐116.
Begovic, M, Mills, RQ III. “Load representation in Power System Stability Studies,” “Load
Identification and Voltage Stability Monitoring.” IEEE Transactions on Power Systems,
Volume 10, No. 1, Feb. 1995, Page(s): 109‐116 C. Concordia and S. Ihar, IEEE Transactions on
Power Systems“, PAS 101, No. 4, pp. 969‐976, 1982.

B‐75
Begovic, M, Milosevic, B. (2003) “Voltage Stability Monitoring and Protection Using a Wide
Area Network of Phasor Measurements.” IEEE Transactions on Power Systems, Volume 18,
No. 1, Feb. 2003, Page(s): 121‐127.
Begovic, M, Phadke, A. “Control of Voltage Stability Using Sensitivity Analysis” IEEE
Transactions on Power Systems, Vol. 7, No. 1, pp. 114‐123, February 1992.
Begovic, M, Phadke, A. “Dynamic Simulation of Voltage Collapse.” IEEE Transactions on
Power Systems, Vol. 5, No. 4, pp. 1529‐1534, Nov. 1990.
Begovic, M, Phadke, A. “Voltage Stability Assessment through Monitoring of a Reduced
State Vector.” IEEE Transactions on Power Systems, Vol. 5, No. 1, pp. 208‐213, February
1990.
Begovic, M. (2000). “System Protection in The Electric Power Engineering Handbook.”
edited by Leo L. Grigsby, CRC Press LLC, Boca Raton, FL, 2000.
Begovic, M. “Wide Area Protection and Emergency Control.” Working Group C‐6 of the
IEEE PSRC, approved as Special Publication of IEEE PES at a IEEE PSRC meeting on May
23, 2002, published electronically at http://www.pes‐psrc.org/.
Bertsch, J, Zima, M, Suranyi, A, Carnal, C, Rehtanz, C. (2003). “Experiences with and
perspectives of the system for wide area monitoring of power systems.” CIGRE/PES Quality
and Security of Electric Power Delivery Systems, CIGRE/IEEE PES International Symposium
8‐10 Oct. 2003 Page(s): 5 – 9.
Bertsch, J. (2005). “Powerful and stable.” pp. 33‐35, ABB Review 4/2005. (Available on
www.abb.com).
Bhargava, B, Rodriguez, G. “Synchronized Phasor Measurement System for Monitoring and
Enhancing Power System Transmission Reliability at Southern California Edison Co.”
Presentation at RD&D Symposium, 0‐7803‐5569‐5/99/1999 IEEE.
Bhargava, B. (1999). “Synchronized Phasor Measurement System project at Southern
California Edison Co.” IEEE Power Engineering Society Summer Meeting, 1999; Volume 1,
18‐22 July 1999; Page(s): 16 – 22.
Breidablik, O, Giaver, F, Glende, I. (2003). “Innovative measures to increase the utilization of
Norwegian transmission.” Power Tech Conference Proceedings, 2003 IEEE Bologna,
Volume 1, 23‐26 June 2003 Page(s): 8 pp. Vol.1.
Bretas, A. (2001). “Robust Electric Power Infrastructures. Response and Recovery during
Catastrophic Failures.” Ph.D. dissertation, Virginia Tech, 2001.
Burnett, RO Jr, Butts, MM, Cease, TW, Centeno, V, Michel, G, Murphy, RJ, Phadke, AG.
(1994). “Synchronized phasor measurements of a power system event.” IEEE Transactions
on Power Systems. Volume 9, Issue 3, Aug. 1994 Page(s): 1643 – 1650.

B‐76
Cai, JY, Huang Z, Hauer, J, Martin, K. (2005). “Current Status and Experience of WAMS
Implementation in North America.” IEEE/PES Transmission and Distribution Conference
and Exhibition: Asia and Pacific, 15‐18 Aug. 2005 Page(s): 1 – 7.
Casey, K. (2006). “Memorandum from Keith Casey, Director, Market Monitoring to
California ISO Operations Committee,” March 2, 2006 Page(s) 2‐3.
Centeno, V, Castro, N, Benton, J, Edris, A, Michel, G, Murphy, RJ, Phadke, AG. “Adaptive
Out‐of‐Step Relaying Implementation and Field Tests.” Proceedings of the FACTS
Conference, October 5‐7, 1994, Baltimore, MD.
Centeno, V, de la Ree, J, Phadke, AG, Michel, G, Murphy, RJ, Burnett, RO Jr. “Adaptive out‐
of‐step relaying using phasor measurement techniques.” Computer Applications in Power,
IEEE Volume 6, Issue 4, Oct. 1993 Page(s): 12 – 17.
Centeno, V, Phadke, AG, Edris, A, Benton, J, Gaudi, M, Michel, G. “An adaptive out‐of‐step
relay [for power system protection].” Power Delivery, IEEE Transactions on Volume 12,
Issue 1, Jan. 1997 Page(s): 61 – 71.
Centeno, V, Phadke, AG, Edris, A, Benton, J, Michel, G. “An Adaptive Out‐of‐Step Relay.”
Power Engineering Review, IEEE Volume 17, Issue 1, January 1997 Page(s): 39 – 40.
Centeno, V, Phadke, AG, Edris, A. (1997). “Adaptive out‐of‐step relay with phasor
measurement.” Sixth International Conference on Developments in Power System
Protection, (Conf. Publ. No. 434); 25‐27 March 1997 Page(s): 210 – 213.
Centeno, V. (2005). “Notes from CFE Presentation at CRIS Annual Board Meeting, Merida,
Mexico.” February 2005.
Chen C‐S, Liu Chih‐Wen, Jiang Joe‐Air. “A new adaptive PMU based protection scheme for
transposed/ untransposed parallel transmission lines.” Power Delivery, IEEE Transactions
on, Volume 17, Issue 2, April 2002 Page(s): 395 – 404.
Chen, S‐D, Chen, J‐F. “A Novel Approach Based on Global Positioning System for Parallel
Load Flow Analysis.” Electrical Power and Energy Systems 27 (2005) 53‐59, Elsevier.
Chow, JH, Bowler, BC, Avramovic, B, Kokotovic, PV, Winkelman, JR. “An Analysis of
Interarea Dynamics of Multi‐machine Systems.” IEEE Transactions on Power Apparatus
and Systems, Vol. PAS‐100, No. 2, February 1981.
Chow, JH. “New Algorithms for Slow Coherency Aggregation of Large Power Systems.”
System and Control Theory for Power Systems, IMA Volumes in Mathematics and its
Applications, Vol 64, pp. 95‐115, Springer‐Verlag, 1995.
Chow, JH. “Time‐Scale Modeling of Dynamic Networks with Applications to Power
Systems.” Lectures notes in Control and Information Sciences. 46. Springer‐Verlag
Berlin.Heidelberg, New York, 1982.

B‐77
Chun, L, Yokoyama, R, Silva, VR. “Optimal Allocation and Design of PSSs for Damping of
Low‐Frequency Oscillations in Multi‐Regional Interconnected Power System.” Transmission
and Distribution Conference and Exhibition: Asia and Pacific, 2005 IEEE/PES; 15‐18 Aug.
2005 Page(s): 1‐ 5.
CIGRE TF. (2001). “System Protection Schemes in Power Networks” , Cigré Task Force
38.02.19 (Convenor: D. Karlsson), CIGRE Technical Brochure no. 187, June 2001.
Cutsem, TV, Vournas, C. (1998). “Voltage stability of electric power systems.” Kluwer
Academic Publishers, Boston.
De La Ree, J, Elizondo, DC. “A methodology to assess the impact of hidden failures in
protection schemes.” Power Systems Conference and Exposition, 2004. IEEE PES. 10‐13 Oct.
2004 Page(s): 1782 ‐ 1783 vol.3.
de Souza, J, et al. (2005). “Optimal Metering Systems for Monitoring Power Networks Under
Multiple Topological Scenarios.” IEEE PES Nov 2005, 10.1109/TPWRS.2005.857941.
Decker, IC, de Silva, AS, Dotta1, D, Bettiol, AL, Agostini, MN, Marini, RLV, Zimath, SL,
Liral, R. (2005). “Phasor Measurement Development and Applications in Brazil.” CEE‐2005‐
1st International Conference on Electrical Engineering, Coimbra, Portugal, Outubro, 2005.
Denys, P, Counan, C, Hossenlop, L, Holweck, C. “Measurement of voltage phase for the
French Future Defence Plan against losses of synchronization.” IEEE Trans. on Power
Delivery, January 1992, Vol. 7, No. 1, pp. 62‐69.
Depablos, J, Centeno, V, Phadke, A. “Comparative Testing of Synchronized Phasor
Measurement Units.” IEEE‐Power Engineering Society General Meeting, Denver, CO, June
6‐10th, 2004.
Dobson, I, Chiang, HD. “Towards a Theory of Voltage Collapse in Electric Power Systems.”
Systems & Control Letters 13 (1989) 253‐262.
Dobson, I, Lu, L. “Computing an Optimal Direction in Control Space to Avoid Stable Node
Bifurcation and Voltage Collapse in Electric Power Systems.” IEEE Transactions on
Automatic Control, Vol. 37, No. 10, p.1616‐20, October 1992.
EDM. (2003). “Sagometer.” http://www.edmlink.com/sagometer.html
EIPP. (2006). “Metrics for Determining the Impact of Phasor Measurements on Power
System State Estimation.” Eastern Interconnection Phasor Project Report, March 2006.
EIPP. (2006). “Synchrophasor Measurement Accuracy Characterization.” Eastern
Interconnection Phasor Project, Work in Process.
Elizondo, DC, de La Ree, J, Phadke, AG, Horowitz, S. “Hidden failures in protection
systems and their impact on wide‐area disturbances.” Power Engineering Society Winter
Meeting, 2001. IEEE Volume 2, 28 Jan.‐1 Feb. 2001 Page(s): 710 ‐ 714 vol.2.

B‐78
Elizondo, DC, De La Ree, J. “Analysis of hidden failures of protection schemes in large
interconnected power systems.” Power Engineering Society General Meeting, 2004. IEEE. 6‐
10 June 2004 Page(s): 107 ‐ 114 Vol.1.
El‐Serafi, AM, Faried, SO. “Effect of adaptive reclosing on turbine‐generator shaft torsional
torques.” Power Systems, IEEE Transactions on. Volume 9, Issue 4, Nov. 1994 Page(s): 1730
– 1736.
EPRI. (2006). “P166.004 Effective Use of Distributed PMUs and Disturbance Monitoring
Devices for Wide‐Area Monitoring, Load Modeling and Voltage Instability Load Shedding.”
EPRI Research Program, http://www.epri.com/portfolio/product.aspx?id=1660.
Fan C‐J, Li Shengfang, Yu Weiyong, Li, KK. “Study on adaptive relay protection scheme
based on phase measurement unit (PMU).” Developments in Power System Protection,
2004. Eighth IEE International Conference on, Volume 1, 5‐8 April 2004 Page(s): 36 ‐ 39
Vol.1.
Fardanesh, B, Zelingher, S, Meliopoulos, AP, Cokkinides, GJ. (1998). “Harmonic monitoring
system via synchronized measurements.” Proceedings 8th International Conference on
Harmonics And Quality of Power; Oct. 14‐18, 1998, Volume: 1, Page(s): 482‐488.
Fardanesh, B, Zelingher, S, Sakis Meliopoulos, AP, Cokkinides, G, Ingleson, J. (1998).
“Multifunctional synchronized measurement network.” IEEE Computer Applications in
Power, Volume 11, Issue 1, Jan. 1998 Page(s): 26 – 30.
Faucon O, Dousset L. (1997). “Coordinate Defense Plan Protects Against Transient
Instabilities.” IEEE Computer Applications in Power, v.10, n.3, 1997, pp. 22‐26.
Federal Energy Regulatory Commission (2006). “Steps To Establish a Real‐Time
Transmission Monitoring System For Transmission Owners and Operators Within the
Eastern and Western Interconnections.” Prepared by United States Department of Energy.
Funabashi, T, Koyanagi, K, Yokoyama, R. “A review of islanding detection methods for
distributed resources.” Power Tech Conference Proceedings, 2003 IEEE Bologna Volume 2,
23‐26 June 2003 Page(s): 6 pp. Vol.2.
Gou, B, Zhao, Q, Zheng, H. “Signal waveform monitoring for power systems.” IEEE
International Symposium on Circuits and Systems, 2005. ISCAS 2005. 23‐26 May 2005
Page(s): 3902 ‐ 3905 Vol. 4.
GridStat. (2004). “GridStat,” information available on‐line: http://www.gridstat.net.
Haque, MH, Rahim, AHMA. “An efficient method of identifying coherent generators using
Taylor series expansion.” IEEE Transactions on Power Systems, Vol. 3, August 1988, pp
1112‐1118.
Haque, MH, Rahim, AHMA. “Determination of first swing stability limits of multimachine
power systems through Taylor series expansions.” IEE Proceedings, Vol. 136, Pt. C, No. 6,
November 1989

B‐79
Haque, MH. “Novel method of finding the first swing stability margin of a power system
from time domain simulation.” IEEE Proc. Generation, Transmission and Distribution, Vol.
143, No. 5, September 1996.
Hauer, JF, Mittelstadt, WA, Martin, KE, Burns, JW, Lee, H. “Best Practices to Improve Power
System Dynamic Performance and Reduce Risk of Cascading Blackouts: Monitoring of
System Dynamic Performance.” Performance Monitoring Task Team, manuscript, January
2006.
Hawkins, D. (2004). “California ISO Phasor Measuring System.” Presentation at the Eastern
Interconnect Phasor Project Meeting. Portland, Oregon. December 6‐7, 2004.
Hiskins, I. (2001). “Nonlinear Dynamic Model Evaluation From Disturbance
Measurements.” IEEE Transactions on Power Systems, Vol. 16, No. 4, November 2001
Page(s) 702‐710.
Horowitz, SH, Phadke, A. (1995), “Power System Relaying.” Second Edition, Research
Studies Press Ltd., England, and John Wiley and Sons Inc. New York.
Horowitz, SH, Phadke, AG, Thorp, JS. “Adaptive Transmission System Relaying.” Power
Delivery, IEEE Transactions on, Volume 3, Issue 4, Oct. 1988 Page(s): 1436‐1445.
http://phasors.pnl.gov/resources_performance/eipp_pmu_se_metrics_20060307.pdf.
Huang, H. (2006). “WAMS Studies at Pacific Northwest National Laboratory.” Presentation.
April 4, 2006.
IEEE PSRC. (1993). “System Protection and Voltage Stability.” IEEE Power System Relaying
Committee, IEEE Publication, 93THO596‐7 PWR, 1993.
IEEE PSRC. (2005). “Deployment and Use of Disturbance Recorders.” IEEE PSRC WG C5,
Draft 10, April 15, 2005. Can be downloaded from: http://www.pes‐psrc.org/c/CWG5.html.
IEEE Publication. (1990) “Voltage Stability of Power Systems: Concepts, Analytical Tools,
and Industry Experience.” 90TH0358‐2‐PWR.
IEEE TF. (1995). “Standard Load Models for Power Flow and Dynamic Performance
Simulation.” IEEE Task Force Paper, IEEE Transactions on Power Systems, Vol. 10, No. 3,
pp. 1302‐1313, Avg. 1995.
IEEE. (1988). “IEEE Guide for Interfacing Dispersed Storage and Generation Facilities with
Electric Utility Systems.” ANSI/IEEE Std. 1001‐1988, 1988.
IEEE. (2000). “IEEE Recommended Practice for Utility Interface of Photovoltaic (PV)
Systems.” IEEE Std. 929‐2000, 2000.
IEEE. (2002) “Voltage Stability Assessment: Concepts, Practices and Tools.” IEEE/PES
Power System Stability Subcommittee Special Report, IEEE Power Engineering Society,
Avg. 2002.

B‐80
IEEE. (2003). “IEEE Standard for Interconnecting Distributed Resources With Electric Power
Systems.” IEEE Std. 1547‐2003, 2003.
Ilic, MD. Xiaojun Liu, Chapman, JW. (1993). “Control of the inter‐area dynamics using
FACTS technologies in large electric power systems.” Proceedings of the 32nd IEEE
Conference on Decision and Control, 1993, 15‐17 Dec 1993 Page(s): 2370‐2376 vol.3.
Ishibashi, A, Imai, M, Omata, K, Sato, S, Takagi, T, Nakachi, Y, Ogawa, S. “New type of
islanding detection system for distributed generation based on voltage angle difference
between utility network and distributed generation site.” Eighth IEE International
Conference on Developments in Power System Protection, 2004. Volume 2, 5‐8 April 2004
Page(s): 542‐545 Vol.2.
Jiang J‐A, Lin Ying‐Hong, Yang Jun‐Zhe, Too Tong‐Ming, Liu Chih‐Wen. “An adaptive
PMU based fault detection/location technique for transmission lines. II. PMU
implementation and performance evaluation.” Power Delivery, IEEE Transactions on.
Volume 15, Issue 4, Oct. 2000 Page(s): 1136 – 1146.
Jiang J‐A, Yang Jun‐Zhe, Lin Ying‐Hong, Liu Chih‐Wen, Ma Jih‐Chen. “An adaptive PMU
based fault detection/location technique for transmission lines. I. Theory and algorithms.”
Power Delivery, IEEE Transactions on. Volume 15, Issue 2, April 2000 Page(s): 486 – 493.
Jiang, J‐A, Liu Chih‐Wen, Chen Ching‐Shan, “A novel adaptive PMU‐based transmission‐
line relay‐design and EMTP simulation results.” Power Delivery, IEEE Transactions on,
Volume 17, Issue 4, Oct. 2002 Page(s): 930 – 937.
Kakimoto, N, Sugumi, M, Makino, T, Tomiyama. K. (2006). “Monitoring of Interarea
Oscillation Mode by Synchronized Phasor Measurement.” IEEE Transactions on Power
Systems, Vol. 21, No. 1, February 2006, Page(s): 260‐268.
Kamwa, et.al. “PMU Configuration for System Dynamic Performance Measurement in
Large Multiarea Power Systems.” IEEE Trans. On Power Systems, Vol. 17, No. 2, pp. 385‐
394, May 2002.
Kamwa, I, Grondin, R, Trudel, G. “IEEE PSS2B versus PSS4B: the limits of performance of
modern power system stabilizers.” IEEE Transactions on Power Systems; Volume: 20 Issue:
2 May 2005 Page(s): 903‐ 915.
Karlsson, D, Hemmingsson, M, Lindahl, S. “Wide area system monitoring and control ‐
terminology, phenomena, and solution implementation strategies.” IEEE Power and Energy
Magazine, Volume: 2 Issue: 5 Sept.‐Oct. 2004 Page(s): 68‐76.
Kitauchi, Y, Shirasaki, T, Kunitaka Hayashi, Minory, Banjo, Kitamura, S, “Recent
Developments on Generator Excitation Control System.” Hitachi Review, August 2000.
Klein, M, Rogers, GJ, Kundur, P, (1991). “A fundamental study of inter‐area oscillations in
power systems.” Power Systems, IEEE Transactions on Volume: 6 Issue: 3 Aug 1991;
Page(s): 914‐921.

B‐81
Kokotovic, PV, Allemong, JJ, Winkelman, JR, Chow, JH. “Singular Perturbations and
Iterative Separation of Time Scales.” Automatica, 16, 1980.
Korba, P. (2006). “Real‐Time Monitoring of Electromechanical Oscillations in Power
Systems.” IEE Proceedings on Generation, Transmission and Distribution.
Kundur, P. (1994). “Power System Stability and Control.” EPRI Power System Engineering
Series, McGraw‐Hill, Inc.
Kurita, A, Sakurai, T. (1988). “The power system failure on July 1987 in Tokyo.” Proceedings
of the 27th Conference on Decision and Control, Austin, Texas, pp. 2093‐2097, Dec. 1988.
Kussner, K, Erlich, I, Wilfert, H‐H. “Design of inter‐area oscillation damping controllers
using global measurements.” Power Tech Proceedings, 2001 IEEE Porto Volume: 2 2001
Page(s): 6 pp.
Larsson, M, Rehtanz, C, Bertsch, J. (2003). “Monitoring and operation of transmission
corridors.” Power Tech Conference Proceedings, 2003 IEEE Bologna, Volume 3, 23‐26 June
2003 Page(s): 8 pp. Vol.3.
Leirbukt, A, Uhlen, K, Palsson, MT, Gjerde, JO, Vu, K, Kirkeluten, O. (2004). “Voltage
monitoring and control for enhanced utilization of power grids” Power Systems
Conference and Exposition, 2004. IEEE PES 10‐13 Oct. 2004 Page(s): 342 ‐ 347 vol.1.
Li HongJun, XiaoRong Xie, LuYuan Tong, JingTao Wu, Jianyu Luo. (2005). “Implement of
On‐line Transient Stability Control Pre‐decision in Wide‐Area Measurement System in
Jiangsu Power Network.” IEEE/PES Transmission and Distribution Conference and
Exhibition: Asia and Pacific, 2005; 15‐18 Aug. 2005 Page(s): 1‐ 4.
Li S‐F, Fan Chunju, Yu Weiyong, Cai Huarong, Li, KK. “A new phase measurement unit
(PMU) based fault location algorithm for double circuit lines.” Developments in Power
System Protection, 2004. Eighth IEE International Conference on, Volume 1, 5‐8 April 2004
Page(s): 188 ‐ 191 Vol.1.
Lien K‐P, Liu Chih‐Wen, Jiang, J‐A, Chen Ching‐Shan, Yu Chi‐Shan. “A novel fault location
algorithm for multi‐terminal lines using phasor measurement units.” Power Symposium,
2005. Proceedings of the 37th Annual North American. 23‐25 Oct. 2005 Page(s): 576 – 581.
Lin Y‐H, Liu Chih‐Wen, Chen Ching‐Shan. “A new PMU‐based fault detection/location
technique for transmission lines with consideration of arcing fault discrimination‐part I:
theory and algorithms.” Power Delivery, IEEE Transactions on. Volume 19, Issue 4, Oct.
2004 Page(s): 1587 – 1593.
Lin Y‐H, Liu Chih‐Wen, Jiang Joe‐Air. “An adaptive fault locator for transmission lines
tapped with a source of generation‐using synchronized voltage and current phasors.”
Power Engineering Society Summer Meeting, 2000. IEEE Volume 3, 16‐20 July 2000 Page(s):
1379 ‐ 1383 vol. 3.

B‐82
Liu, C, Ishimaru, M, Yokoyama, R, Koyanagi, K. “Optimal allocation and design of power
system stabilizers for enhancing the damping of inter‐area oscillations in Japanese eastern
interconnected power system.” 39th International Universities Power Engineering
Conference, 2004. UPEC 2004. Volume: 2, 6‐8 Sept. 2004 Page(s): 912‐ 916 vol. 1.
Makarov, Y. (2006). “Western Interconnection Phasor‐Based Projects—Overview.” PNNL,
Working Document version 1.0. April 10, 2006.
Mao, X‐M, Zhang, Y, Guan, L, Wu, X. “Researches on Coordinated Control Strategy for
Inter‐area Oscillations in AC/DC Hybrid Grid With Multi‐infeed HVDC.” Transmission and
Distribution Conference and Exhibition: Asia and Pacific, 2005 IEEE/PES 15‐18 Aug. 2005
Page(s): 1‐ 6.
Martínez‐ Martínez, E, López‐Márquez, JJ. (2002). “Application of Phasor Measurement
Units in the Adaptive Protection of Interconnected Systems.” CRIS 2002 Conference, Beijing
China, September 23‐27, 2002.
Mensah‐Bonsu, C, Fernández, U, Heydt, GT, Hoverson, Y, Schilleci, J, Agrawal, B.
“Application of the Global Positioning System to the Measurement of Overhead Power
Transmission Conductor Sag.” IEEE Transactions on Power Delivery, vol. 17, No. 1, pp.
273‐278, January 2002.
Mittelstadt, W, Hauer, J, Martin, K, Lee, H. (2005). “Evaluating the Dynamic Performance of
Phasor Measurement Units: Experience in the Western Power System” WECC Disturbance
Monitoring Work Group, Interim Report. August 5, 2005.
Mittelstadt, W, Martin, K, Taylor, C. (2005). “Development of State‐of‐the‐Art Algorithms
and Prototypes for Real‐Time and Post Processing of Wide‐Area PMU Measurements.” BPA
Working Document. December 2005.
Nuqui, RF, Phadke, AG. (2005). “Phasor measurement unit placement techniques for
complete and incomplete observability.” Power Delivery, IEEE Transactions on Volume 20,
Issue 4, Oct. 2005 Page(s): 2381 – 2388.
Nuqui, RF, Phadke, AG. “Phasor Measurement Unit Placement Based on Incomplete
Observability.” IEEE PES Summer Power Meeting, Chicago, IL, July 2002.
ONS. (2005). “Term of Reference: Consultancy Technical Services for Preparing the
Specifications for a Phasor Measurement System, as Part of Project 6.2 of ONS Action Plan:
Implementation of Long Duration Oscilographic System.” Ref: Edict nr DPP‐001/2005,
published in Oct 14th 2005.
Padiyar, KR, Krishna, S. “On‐line Detection of loss of synchronism using locally measurable
quantities.” Transmission and Distribution Conference and Exposition, 2001 IEEE/PES,
Volume: 1, 28 Oct.‐2 Nov. 2001, Page(s): 537 ‐542 vol.1.
Pal, MK. “Voltage Stability Conditions Considering Load Characteristics.” IEEE
Transactions on Power Systems, Vol. 1, No. 1, pp. 243‐249, Feb. 1992.

B‐83
Peng, FZ. Guest Editorial. “Special Issue on Distributed Power Generation.” IEEE
Transactions on Power Electronics Vol. 19, No. 5, Sep. 2004, pp. 1157‐1158.
Phadke, AG, Thorp, JS, “Expose hidden failures to prevent cascading outages [in power
systems].” Computer Applications in Power, IEEE Volume 9, Issue 3, July 1996 Page(s): 20 –
23.
Phadke, AG. “Synchronized Phasor Measurements for Protection and Local Control.”
CIGRE General Assembly, August 1998, Paris.
Phadke, AG. “Synchronized Phasor Measurements in Power Systems.” IEEE Computer
Applications in Power, Volume 6, No. 2, April 1993, pp 10‐15.
PIER. (2005) “Development of a Real‐Time Monitoring / Dynamic Rating System for
Overhead Lines.” WWW.ENERGY.CA.GOV / PIER / FINAL PROJECT REPORTS / 500‐04‐
003.
Rasmussen, J, Jorgensen, P. (2003). “Synchronized phasor measurements of a power system
event in Eastern Denmark.” IEEE Power Tech Conference Proceedings, 2003 Bologna;
Volume 3, 23‐26 June 2003 Page(s): 5 pp. Vol.3.
Rebizant, W, Feser, K. “Fuzzy logic application to out‐of‐step protection of generators.”
Power Engineering Society Summer Meeting, 2001. IEEE Volume 2, 15‐19 July 2001 Page(s):
927 ‐ 932 vol.2.
Ropp, M, Begovic, M, Rohatgi, A, Kern, G, Bonn, R, Gonzales, S. “Determining the Relative
Effectiveness of Islanding Detection Methods Using Phase Criteria and Nondetection
Zones.” IEEE Transactions on Energy Conversion, Vol. 15, No. 3, Sep. 2000, pp. 290‐296.
Ropp, M, Begovic, M, Rohatgi, A. “Analysis and Performance Assessment of the Active
Frequency Drift Method of Islanding Prevention.” IEEE Transactions on Energy
Conversion, Vol. 14, No. 3, Sep. 1999, pp.810‐816.
Rovnyak, S, Sheng, Y. “Using measurements and decision tree processing for response‐
based discrete‐event control.” Power Engineering Society Summer Meeting, 1999. IEEE
Volume 1, 18‐22 July 1999 Page(s): 10 ‐ 15 vol.1.
Rovnyak, S, Sheng, Y. “Using measurements and decision tree processing for response‐
based discrete‐event control.” Power Engineering Society Summer Meeting, 1999. IEEE
Volume 1, 18‐22 July 1999 Page(s): 10 ‐ 15 vol.1.
Samuelsson, O, Johannsdottur, H, Karlsson, D, Gustavsson, D, Novosel, D, Hranfnsson, T,
Salj, J, Sollie, A. (2002). “Power System Dynamic Damping in Iceland Based on Phasor
Measurements.” CRIS First International Conference on Critical Infrastructures, Beijing
China, September 22nd – 27th, 2002.
Sattinger, W. (2005). “Developments in UCTE and Switzerland.” WAMC course at ETH
Zürich, 30 August – 1 September 2005.

B‐84
Sen, I, Majumder, R. (2004). “Fuzzy logic based TCSC supplementary controller for
damping of inter area oscillations in power system.” 2004 IEEE Region 10 Conference
TENCON 2004; Volume: C 21‐24 Nov. 2004 Page(s): 363‐366 Vol. 3.
Slutsker, I, Clements, K. (1996). “Real time recursive parameter estimation in energy
management systems.” IEEE Transactions on Power Systems, vol. 11, no. 3. August 1996.
Page(s): 1393 – 1399.
Slutsker, I, Gonzalez, J, Benaventa, J, Mokhtari, S, Jaques, L. (1995). “Implementation of
Phasor Measurements in State Estimator at Sevillana de Electricidad;” IEEE PES 0‐7803‐
2663‐6/95.
Slutsker, I, Mokhtari, S, Clements, K. (1995). “On‐line parameter estimation in energy
management systems.” American Power Conference, Chicago, IL. April 1995. Paper 169.
Stergiou, P, Kalokitis, D. “Keeping the Lights On—GPS and Power‐grid Intermesh.” GPS
World, November 2003.
Sterpu, S, Besanger, Y, HadjSaid, N. (2005). “Ancillary services performance control in
deregulated power systems.” Power Engineering Society General Meeting, 2005. IEEE June
12‐16, 2005 Page(s): 722 – 728.
Stråth, N. “Islanding Detection in Power Systems.” Lund University, Licentiate Thesis, 2005.
Tamronglak, S, Horowitz, SH, Phadke, AG, Thorp, JS. “Anatomy of power system
blackouts: preventive relaying strategies.” Power Delivery, IEEE Transactions on Volume
11, Issue 2, April 1996 Page(s): 708 – 715.
Tamura, Y, Sakamoto, K, Tayama, Y. (1998). “Voltage Instability Proximity Index Based on
Multiple Load Flow Solutions in Ill‐Conditioned Power Systems.” Proceedings of the IEEE
1988 Conference on Decision and Control (CDC), Austin, Texas, December 1988, Page(s):
2114 – 2119.
Taylor, CW. (1994). “Power system voltage stability.” McGraw‐Hill.
TDW. (2006). “Southwest Transmission Power Implements GPS Time Source to Synchronize
Substations.” T&D World, January 2006.
Thorp, J, Phadke, A, Horowitz, S, Begovic, M. “Some Applications of Phasor Measurements
to Adaptive Protection.” IEEE Transactions on Power Systems, Vol. 3, No. 2, pp. 791‐798,
May 1988.
Thorp, JS, et al. “Feasibility of Adaptive Protection and Control.” Power Delivery, IEEE
Transactions on, Volume 8, Issue 3, July. 1993 Page(s): 975‐983.
Tomsovic, K, Sittithumwat, A, Tong, J. (2001). “On‐line estimation of power system security
limits.” Bulk Power System Dynamics and Control V. Onomichi, Japan. August 2001.

B‐85
Tsang, MW, Sutanto, D, (1998). “Control strategies to damp inter‐area oscillations using a
battery energy storage system.” Proceedings of EMPD ʹ98. International Conference on
Energy Management and Power Delivery.; Volume: 1 3‐5 Mar 1998; Page(s): 241‐246 vol.1.
U.S.‐Canada Power System Outage Task Force (2004). “Final Report on the August 14, 2003
Blackout in the United States and Canada: Causes and Recommendations.”
UCTE (2004). “Final Report of the Investigation Committee on the 28 September 2003
Blackout in Italy.”
UL. (2004). “Inverters, Converters and Controllers for Use in Independent Power Systems.”
UL Std. UL 1741, 2004.
Van Cutsem. T. (2000). “Voltage Instability: Phenomena, Countermeasures, and Analysis
Methods.” IEEE Proceedings Volume 88, No. 2, February 2000, Page(s): 208‐227.
Verbic, G, Gubina, F. (2002). “Fast algorithm for voltage collapse protection based on local
phasors,” Power Engineering Society Summer Meeting, 2002 IEEE Volume 3, 2002 Page(s):
1650 ‐ 1655 vol.3.
Vu, K, Begovic, M, Novosel, D, Saha, MM. (1999). “Use of Local Measurements to Estimate
Voltage Stability Margin.” IEEE Transactions on Power Systems, Vol.14, No. 3, pp.1029‐
1035, August 1999.
Vu, K, Begovic, MM, Novosel, D. (1997). “Grids Get Smart Protection and Control.” IEEE
Computer Applications in Power, Vol. 10, No. 4, pp. 40‐44, October 1997.
Wagner, CL, Linders, JR, Hicks, KL, Rizy, DT. “Adaptive Transmission Relaying Concepts
for Improved Performance.” G. D. Rockefeller, IEEE Transactions on Power Delivery,
Volume 3, Issue 4, Oct. 1988 Page(s): 1446‐1458
Walling, RA, Miller, NW. “Distributed generation islanding‐‐Implications on power system
dynamic performance.” Power Engineering Society Summer Meeting, 2002 IEEE Volume 1,
2002 Page(s): 92‐96 vol.1.
Warland, L, Holen, A. (2002). “Estimation of Distance to Voltage Collapse: Testing an
Algorithm Based on Local Measurements.” 14th PSCC, Sevilla, 24‐28 June 2002 Session 38.
Wilson, R E, Zevenbergen, GA, Mah, EL. (1999). “Calculation of Transmission Line
Parameters From Synchronized Measurements.” Electric Machines and Power Systems, Nr
27, 1999, pp 1269‐1278.
Xie X, Jian Li, Jinyu Xiao, Yingduo Han. (2004). “Inter‐area damping control of STATCOM
using wide‐area measurements.” ; Proceedings of the 2004 IEEE International Conference on
Electric Utility Deregulation, Restructuring and Power Technologies, 2004 (DRPT 2004);
Volume: 1 5‐8 April 2004 Page(s): 222‐ 227 Vol.1.
Xie X, Xin Y, Xiao J, Wu J, Han Y. (2006). “WAMS applications in Chinese power systems.”
IEEE Power and Energy Magazine; Volume 4, Issue 1, Jan.‐Feb. 2006 Page(s): 54 – 63.

B‐86
Yi, K.K, Choo, J.B, Yoon, S.H, Lee, T.S, Park, B.C, Nam, H.K, Song, S.G, Shim, K.S. (2001).
“Development of wide area measurement and dynamic security assessment systems in
Korea.” IEEE Power Engineering Society Summer Meeting, 2001. Volume: 3 Page(s): 1495‐
1499 vol.3.
You, H, Vittal, V, Wang, X. “Slow Coherency Based Islanding.” IEEE Trans. On Power
Systems, Vol. 19, Issue 1, Feb. 2004, pp 483‐491.
You, H, Vittal, V, Yang, Z. “Self‐healing in power systems: an approach using islanding and
rate of frequency decline based load shedding.” IEEE Trans. Power Systems, Vol. 18, no. 1,
pp.174‐181, February 2003.
Yu C‐S, Liu Chih‐Wen, Yu Sun‐Li, Jiang Joe‐Air. “A new PMU‐based fault location
algorithm for series compensated lines.” Power Delivery, IEEE Transactions on. Volume 17,
Issue 1, Jan. 2002 Page(s): 33 – 46.
Yu, C‐S, Liu, Chih‐Wen, Lin, Ying‐Hong. “A fault location algorithm for transmission lines
with tapped leg‐PMU based approach.” Power Engineering Society Summer Meeting, 2001.
IEEE. Volume 2, 15‐19 July 2001 Page(s): 915 ‐ 920 vol.2.
Zarco, J, Exposito, A. (2000). “Power System Parameter Estimation: A Survey.” IEEE
Transactions on Power Systems, Vol. 15. No. 1, February 2000 Page(s): 216 – 222.
Zhang L, Y Liu. (2004). “Bulk power system low frequency oscillation suppression by
FACTS/ESSTVA.” IEEE/PES Power Systems Conference and Exposition, 2004. Vol. 1, 10‐13
Oct. 2004, page(s): 219‐ 226.
Zhang, N, Song, H‐B, Kezunovic, M. “New Monitoring and Control Scheme for Preventing
Cascading Outages.” Proceedings of the 37th Annual North American Power Symposium,
2005; 23‐25 Oct. 2005 Page(s): 37 – 42.
Zhao, L, Abur, A. “Multiarea State Estimation Using Synchronized Phasor Measurements.”
IEEE PES May 2005 # 10.1109/TPWRS.200.846209.
Zhu, J, Hwang, D, Sadjadpour, A. (2005). “Real Time Congestion Monitoring and
Management of Power Systems.” IEEE/PES Transmission and Distribution Conference and
Exhibition: Asia and Pacific, 2005; 15‐18 Aug. 2005 Page(s): 1 –5.
Zivanovic, R, Cairns, C. (2006). “Implementation of PMU Technology in State Estimation:
An Overview;” IEEE PES 0‐7803‐3019‐6/96.

B‐87
Appendix B-1 - EIPP perspective on PMU technology
Source: “Phasor Technology Research Roadmap for the Grid of The Future”, EIPP, October
2005.
Near‐Term (1‐2 years)
Eastern Interconnection
Wide area visibility across key EI corridors with a common specification for situational
awareness screens used by multiple vendor platforms
Develop baseline of normal operating angles, operating limits and alarms for operators
in the EI
Scope the process for defining EI system modes and damping mechanisms.
Deployment of real‐time tools in operations environment
Quantify the benefit to state estimation with phasor measurements
Better system understanding via EI system model validation using phasor data
North American WAMs Agenda
Define a research agenda for human factors and visualization needs of operations tools
based on phasor data
Define a research and demonstration roadmap for real‐time control
Define procedures and research roadmap for enhanced grid “forensics” based upon
phasor data availability in the Eastern and Western interconnections
Scope and design the next generation of data and communications infrastructure to
facilitate secure operation of interconnection‐wide phasor networks
Mid‐Term (2‐5 years)
Wide area visibility with full coverage of Eastern and Western Interconnections
Improved system models, approaching real‐time state measurement for operators
Dynamic system security assessment tools
Common operator tools defined and deployed (e.g. angle baselines, rate of angle change,
etc.)
Longer Term (5 – 10 years)
Real‐time protection and control
Smart, switchable networks

B‐88
Table B1-1. Problem assessment and research needs, EIPP.

B‐89
Table B1-2. Research roadmap devised by EIPP.

B‐90

B‐91
Appendix B-2 – Voltage Instability
Voltage instability analysis and implementation examples are described below.
Dynamic analysis of the system provides an insight into the time responses of the system,
such as determination of the time sequence of the different events leading to system
voltage instability, especially following fast disturbances of the system structure, which
may involve in equipment outages, or faults followed by equipment outages. Static
(steady‐state) analysis of the system is quite appropriate. Static analysis may include
power flow methods, sensitivity analysis, as well as traditional local analysis (e.g., P‐V
and Q‐V curves). Static analysis of voltage collapse is mainly based on bifurcation
theory, which is demonstrated by the following simplified example based on a supply to
a radial (2 bus) system model.
Figure B2.1 below shows a trajectory of the load voltage V when active (P) and reactive
(Q) power of the load in a radial link change slowly and independently. The Figure also
shows the active and reactive power margins as projections of the distances. The
voltage stability boundary is represented by a projection onto the PQ plane (a bold
curve). It can be observed that: i) there may be many possible trajectories to (and points
of) voltage collapse; ii) active and reactive power margins depend on the initial
operating point and the trajectory to collapse Error! Reference source not found.Error!
Reference source not found.Error! Reference source not found.Error! Reference source
not found.Error! Reference source not found.Error! Reference source not found.Error!
Reference source not found.Error! Reference source not found.Error! Reference source
not found.
P
Q
V trajectory (P,Q,V)
point of voltage collapse
an operating point
active powermargin
reactive power margin
Figure B2-1. Depiction of the process of coalescing of the stable and unstable power system equlibria through slow load variations leading to a voltage collapse. VPQ curve representing the trajectory of the load voltage V of a 2-bus system model when active (P) and reactive (Q) power of the load change arbitrarily
The Jacobian matrix of the system model evaluated at the critical operating point,
consistent with the critical (load) parameter value(s), is singular and has one zero
eigenvalue and n‐1 eigenvalues with negative real parts (stable). The system state then
has a one‐dimensional center manifold through which the system state may escape the
stable operating region, and n‐1 dimensional stable manifold. If load increases beyond

B‐92
some critical value, then the stable operating point disappears and there are no other
equilibrium points nearby to which the system state may transition. There are three
different methods for computing a voltage stability margin (VS). These are: i) Direct
methods; ii) Iterative methods and iii) Continuation methods. All three methods are
applicable to any static power system model Error! Reference source not found.Error!
Reference source not found.Error! Reference source not found.
Utilities estimate voltage security of the power system based on the voltage security
criteria accepted by the utility, such as:
Voltage stability margin criteria (e.g., the system VS margin must be larger than x%
of the total system loading under all or credible contingencies).
Voltage decline/rise criteria (e.g., the post‐contingency bus voltages must remain
within x% of the nominal/pre‐contingency voltages following all or credible
contingencies).
Reactive reserve criteria (i.e., the reactive power reserves of individual or groups of
VAR sources must be above x% of their normal (no contingencies) reactive
output under all or credible contingencies).
Maximum post‐fault voltage dip criteria (i.e., the post‐fault bus voltage dips must be
less than x% of their nominal/pre‐contingency voltages).
Maximum transient dip duration criteria (e.g., following a fault, the bus voltages
must recover above x% of their nominal/pre‐contingency values for less than N
cycles).
The system is considered voltage secure if the utility VS stability criteria are met for all
contingencies.
1.0 Examples of Current Systems The most conventional approach to defense against voltage collapse is under‐voltage
(UV) load shedding. UV relays are commercially available, and such relaying function is
relatively well known and has been implemented in transmission networks (such as the
Pacific Northwest). The obvious advantage is simplicity and robustness of the scheme,
which relies on local voltage measurements only. The disadvantage is also in the
schemeʹs simplicity – the relay settings are fixed and not adapted to ever‐changing
network conditions, which, depending on the loading levels and the level of reactive
support, may vary within a wide range. That, at best, may render the scheme useless,
and at worst, may trigger it against normal and secure operating regimes with
depressed voltages.
The accurate model of voltage collapse requires the complete state vector. Such a
function can naturally be accomplished within the control center, using snapshots of
system state whenever state estimator makes them available. Under such circumstances,
deployment on any of the number of methodologies presented earlier in the text (direct,
iterative, or continuation methods) could be used to assess the margin of the system to

B‐93
voltage collapse, identify the critical contingencies and formulate the optimal remedial
actions. EMS vendors now offer software products that can accomplish some, or all of
those functions. The limitation of this approach is that the evaluation is tied to a latency
time of the underlying monitoring system, which may mean that the mitigation is
applied to a system which has changed by the time of actuation) and that the assessment
cannot be done fast enough to deal with fast transient aspects of voltage dynamics.
Below are listed several examples of current installations Error! Reference source not
found.designed to deal with voltage stability in transmission networks. They mostly do
not possess PMUs nor do they rely critically on them.
2.0 Protection Against Voltage Collapse In The Hydro-Quebec System The Hydro‐Québec system is characterized by long distances (up to 1000 km) between
the northern main generation centers and the southern main load area. The peak load is
around 35,000 MW. The long EHV transmission lines have high series reactances and
shunt susceptances. At low power transfers, the reactive power generation of EHV lines
is compensated by connecting 330 Mvar shunt reactors at the 735 kV substations. At
peak load, most of the shunt reactors are disconnected while voltage control on the
lower side of transformers implies connection of shunt capacitors. Both effects
contribute to a very capacitive characteristic of the system.
Automatic shunt reactor tripping was implemented in 1990, providing an additional
2300 Mvar support near the load centres. This amount was likely to triple in 1996 after
an upgrade of the present devices. The switching is triggered by low 735 kV bus
voltages or high compensator reactive power productions. Another emergency control
used is the automatic increase in voltage set‐points of SCs.
3.0 Blocking Of On-Load Tap Changers (OLTCs) On Distribution Transformers (EDF Experience) The effect of tap‐changer blocking depends highly on the load characteristic, if all the
taps all the way down to the customer level can be blocked. It is also important to keep a
high voltage in systems with a large amount of shunt capacitors and cables. The
automatic blocking of EHV/HV OLTCs was implemented in France after the voltage
collapse of January 1987. The choice of blocking EHV/HV OLTCs was taken among
different strategies which were simulated from the reconstruction of the incident, with a
long term dynamic program. The decision to implement automatic blocking of EHV/MV
and HV/MV OLTCs has been taken.

B‐94
4.0 Reduction of Set-Point Voltages In An Area Depending On Voltage Criteria The set‐point value in France may be reduced by 5% at the MV voltage level of the
HV/MV or EHV/MV OLTCs. This reduction may be ordered manually from the special
emergency system situated in each regional control centre. Different field tests and
analysis of operation within EDF have shown that this 5% MV voltage reduction leads in
fact to an effective load reduction by 2 to 3%; the effect of the reduction is exhausted
after a delay of about 2 hours because of the action of the regulators, at load level, and
also because of the manual actions of the consumers who try to find means to restore
their needs of consumption.
5.0 A Voltage-Instability protection scheme based on PMUs We present a scheme that has been studied Error! Reference source not found. its
implementation can take several forms as outlined in the preceding section. The PMUs
are placed at all load buses (denoted PMUL) and generator buses (denoted PMUG) buses.
A PMU measures voltage and all incident current phasors, in discrete time intervals tk, at the bus where it is installed, which allow: i) monitoring of the power injection at the
bus and ii) tracking of the parameters of the voltage source and the line modeling the
rest of the system as seen from the bus, at every time instant tk.
Parameters of each two‐bus equivalent iE and iZ , which model the rest of the system as
“seen” from load bus i, are continuously updated from a sliding window of voltage and
current phasor measurements Error! Reference source not found.Error! Reference
source not found.Error! Reference source not found. The process of determining the
voltage stability margin at load bus i, and the appropriate control actions can be
summarized in the following steps:
Step 1: Perform local phasor voltage and current measurements at tk.
Step 2: Calculate parameters of a two‐bus equivalent ,i kE and ,i kZ .
Step 3: Determine the proximity index, and translate it into a time estimate ti,k*.
Step 4: From the received information on reactive power reserve of every
generator, estimate time to the next occurrence of a PV‐PQ transition *gt .
Step 5: If the time left to voltage collapse is less than a certain threshold and the
PV‐PQ transitions are expected, deploy the corrective control measures, such as
activation of available reactive power reserves, freezing of tap changers, etc. If
these measures are not effective, deploy emergency control actions, such as load
shedding at the particular load bus and the buses in its vicinity. Otherwise,
return to Step 1.
Figure below shows the estimate of the time margin to voltage collapse t* for an
example bus from its time‐varying two‐bus equivalent, and the estimate of the

B‐95
minimum margin to the next PV‐PQ transition tg*, which is calculated in Step 4. Note
that both variables are calculated with respect to the time instant t= 0. The PV‐PQ
transitions occur every time when there is a step‐up change in tg*, and a step‐down
change in t*. Two curves approach one another, and become dangerously close if the
next estimated PV‐PQ transition is a critical one. The dark circle illustrates a “zone” in
which the protective and the control actions must be deployed to avoid voltage collapse.
0
120
240
360
480
600
720
840
0 30 60 90 120 150t (min)
(min
)
t23*
tg*
Figure B2-2. Estimates of the time to voltage collapse for #23 and the next PV-PQ transition with respect to t= 0 in the IEEE 39-bus system with 75% PQ and 25% Z load.
The control actions in the vicinity of the critical bus may be: i) activation of the available
reactive power reserves, ii) blocking of the tap changers, iii) voltage reduction at the
feeders connected to the corresponding and the neighboring buses, or iv) load shedding
of the nearest consumers if the above measures do not prove to be effective.

B‐96

Appendix C - Business Case Evaluation Matrix


C‐1
APPENDIX C. Business Case Evaluation Matrix
Table C-1: Blank template that was sent out as part of the survey.
Application name Comments
Must have
Nice to have
Don't need
More investiga-
tion required
Must have
Nice to have
Don't need
More investiga-
tion required Significant Moderate Low
Prototype Installed in
fieldVendor's offering
Described on
papersNew idea Yes No
No, but I have a hunch
RT Stability Monitoring,...--Angle/Freq.
RT Stability Monitoring,...--Voltage
RT Thermal Monitoring,...--Overload
State Estimation (Improvement)
State Estimation (Equivalence)Wide-Area stabilization (WA- Power System Stabilizer)
Adaptive Protection- Line Protection
Adaptive Protection-Security & Dependability (2 out of 3,...)
Adaptive Protection- Reclosing
Adaptive Protection- Fault Locating
Congestion Management
Power-system Restoration
Post-mortem Analysis
Model Benchmarking; Parameter Estimation (Steady-State parameters)
Model Benchmarking; Parameter Estimation (Dynamic parameters)
Planned Power-System Separation
Monitoring/Control/Protection for DG/IPP (Others.. Please write in)
Have you found a quantitative business
case for PMU? PLEASE CHOOSE ONE
Business benefits (regardless of technology) - PLEASE CHOOSE
ONERole of PMU
PLEASE CHOOSE ONE
Investment Required (SW+HW+ training)
PLEASE CHOOSE ONECurrent Status
PLEASE CHOOSE ONE
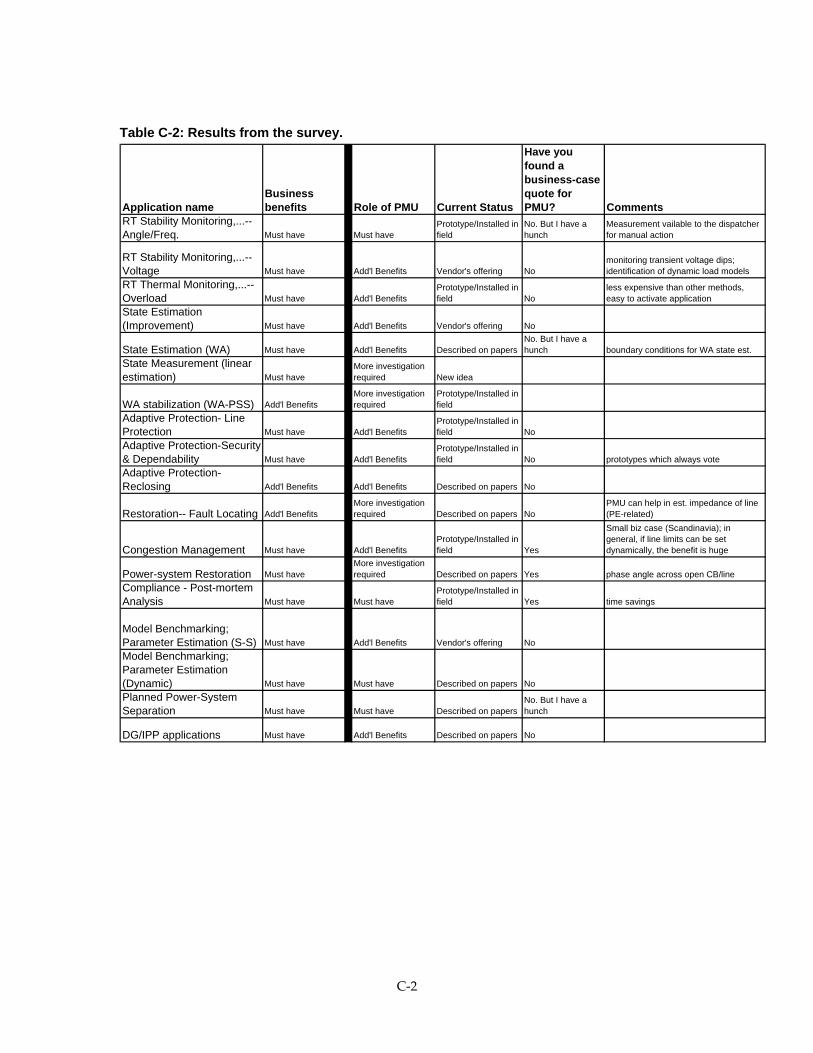
C‐2
Table C-2: Results from the survey.
Application nameBusiness benefits Role of PMU Current Status
Have you found a business-case quote for PMU? Comments
RT Stability Monitoring,...--Angle/Freq. Must have Must have
Prototype/Installed in field
No. But I have a hunch
Measurement vailable to the dispatcher for manual action
RT Stability Monitoring,...--Voltage Must have Add'l Benefits Vendor's offering No
monitoring transient voltage dips; identification of dynamic load models
RT Thermal Monitoring,...--Overload Must have Add'l Benefits
Prototype/Installed in field No
less expensive than other methods, easy to activate application
State Estimation (Improvement) Must have Add'l Benefits Vendor's offering No
State Estimation (WA) Must have Add'l Benefits Described on papersNo. But I have a hunch boundary conditions for WA state est.
State Measurement (linear estimation) Must have
More investigation required New idea
WA stabilization (WA-PSS) Add'l BenefitsMore investigation required
Prototype/Installed in field
Adaptive Protection- Line Protection Must have Add'l Benefits
Prototype/Installed in field No
Adaptive Protection-Security & Dependability Must have Add'l Benefits
Prototype/Installed in field No prototypes which always vote
Adaptive Protection- Reclosing Add'l Benefits Add'l Benefits Described on papers No
Restoration-- Fault Locating Add'l BenefitsMore investigation required Described on papers No
PMU can help in est. impedance of line (PE-related)
Congestion Management Must have Add'l BenefitsPrototype/Installed in field Yes
Small biz case (Scandinavia); in general, if line limits can be set dynamically, the benefit is huge
Power-system Restoration Must haveMore investigation required Described on papers Yes phase angle across open CB/line
Compliance - Post-mortem Analysis Must have Must have
Prototype/Installed in field Yes time savings
Model Benchmarking; Parameter Estimation (S-S) Must have Add'l Benefits Vendor's offering No
Model Benchmarking; Parameter Estimation (Dynamic) Must have Must have Described on papers No
Planned Power-System Separation Must have Must have Described on papers
No. But I have a hunch
DG/IPP applications Must have Add'l Benefits Described on papers No

Appendix D - Anecdotal


D‐1
Application Utility Source Quote
Post-mortem Analysis Entergy Floyd Galvin
System paid for itself after one disturbance
event
Phase angle monitoring TVA Lisa Beard
Trending display of frequency TVA Lisa Beard
Black start (restoration) PG&E Vahid Madani
Standing phase angle monitoring; wa
synch check (Restoration) PG&E Vahid Madani
Analysis of system performance
(post-D) BPA Dimitri Kosterev
Gen performance and Model
validation BPA Dimitri Kosterev
HVDC model validation BPA Dimitri Kosterev
Phase-angle alarm BPA Dimitri Kosterev
Operator uses this info routinely. (There is a box
problem, which occasionally gives false alarm)
Situational Awareness for Reducing
blackouts SCE Bharat Bhargava
Relative Phase Angle changes from 50 deg to
90-100 deg
Increasing Power Transfer SCE Bharat Bhargava SCIT Nomogram
Power system oscillation monitoring SCE Bharat Bhargava
Quicker situation assessment SCE Bharat Bhargava
Identifying generation / load loss (Delta P
versus delta f)
intelligent RAS applications SCE Bharat Bhargava Can reduce generation tripping due to RAS

D‐2

Appendix E – Business-Case Study Examples


E‐1
Business Case-Study Examples
This appendix is intended to illustrate the steps outlined in the Business Case Analysis
Guidebook. The numbers associated with benefits and costs, though from a utility
company whose size is equivalent to 1/3 of California power demand, are not necessary
representative of the utility industry.
Several remarks are in order:
A full deployment is the means to reap major benefits from the PMU technology.
This is because the same capital investment can be used by different subject
areas, stacking up the benefits. A full deployment, however, requires a careful
analysis and planning as the capital investment is high.
1. A partial deployment (or ad hoc) that targets a limited objective is suitable for
R&D. Lacking a careful plan for integrated use of the infrastructure, partial
deployments even when combined at a later time can be costlier than a full
deployment.
2. Partial deployments, when evaluated individually in the proposal phase, are
likely to show poor or unacceptable payback. However, if a partial deployment is
an initial phase for a full‐deployment scheme, Real Options is a recommended
method for project valuation. This technique takes into account two elements
that the traditional NPV does not: (a) the uncertainty in the projected benefits,
and (b) the management flexibility to stop the project or to expand it into next
phases.
1.0 Phase I – Identify Areas for Analysis. An interview with a utility company results in the following areas that the PMU
technology can potentially enhance:
Reduced probability of blackouts
Improved power supply performance
Better voltage profiles
Accurate margin assessment
Less generation dropping with Intelligent RAS
Quicker system restoration
Quicker system status evaluation and situational awareness
Active, faster and automatic controls

E‐2
Improved SCADA / EMS performance
An item not included in this example is the improvement of LMP calculations when a
sufficient number of PMUs exist on the grid. The quantification of this kind of benefit
has not been done before; in Appendix B we provide a simple example to illustrate the
benefits that a system of PMUs can bring.
2.0 Phase II – Analyze Opportunities for Improvement The sample results are shown in Table E‐1. This phase starts with the original list of
benefit areas (Phase I) and attempted to quantify those benefits as follows:
If a benefit is too broad, it may need to be broken down into more concrete items
that can be quantified individually.
If a benefit is too difficult to quantify, it may be removed from the list. For
example “Improved SCADA/EMS performance” is not easy to quantify given the
limited experience and information, and is therefore removed from the list.
An important step in this phase is to quantify the changes in operations due to
PMU (“Pre‐PMU” and “Post‐PMU” columns). Note that this step is system‐
dependent, and the numbers shown here are just for example purposes.
In order to realize the intended benefits, investment is needed. The investment
includes: (a) setting up the infrastructure, and (b) annual cost for upkeeping the
system. These costs are tabulated in the last two columns of the table.
In this example, the item “Migration from RD&D to Commercial Operations” is
to describe the situation where the company already invested in the technology
as an RD&D project. This item refers to the additional instrumentation and IT
components to enlarge the PMU system so that it can be used in commercial
operations.

E‐3
Table E-1. Example of PMU benefit calculations. Numbers are based on an interview with a utility company.
Potential areas for
enhancement
Pre-PMU
(NOW) Post-PMU
Needed
investment
Incremental cost
(CAPITAL)
Variable cost
(annual) 1: Migration from RD&D to
Commercial Operations $ 2,000,000
2: Wide-area situational
awareness & system
integration super-PDC $1,000,000
3: Quicker system status
evaluation (post mortem)
3 weeks to
get data (per
event) ;
analysis time
= 4 months 1/2*time
-
4: Reduce probability of
black outs (catastrophic)
1 event in 5
years 1 in 10 years
Communica-
tions links;
apps $200,000
5: Less disturbances due to
fewer voltage excursions
3 events per
year 1 per year
shared with
#1-2 $400,000 $40,000
6: Accurate margin
assessment $2,400,000 $3,500,000 $300,000
7: Less generation dropping
with Phasor-enhanced RAS
arming study
6 events per
year
2 events per
year
upgrade
components
of RAS $30,000
3.0 Phase III – Identify Stakeholders This is an optional phase. If different stakeholders have different perceptions on a
particular benefit then analyses have to be done separately.
Most benefits have only one stakeholder, namely the utility company and related
organizations; Phase III can be omitted for such cases.
In the example here, Outage Prevention is listed as a benefit. There are two stakeholders:
One is the utility company, whose benefits arise from avoiding cost of litigation,
cost of service restoration, undelivered energy, and the negative impact on stock
price and on valuable management time.
The other stakeholder is the society, whose benefits can be quantified using
methods that estimate the cost of blackout on the society and the economy.19
19 LBNL 2004 Report, Understanding the Cost of Power Interruptions to U.S. Electricity
Consumers.

E‐4
In Phase V (Payback Analysis), the stakeholders’ benefits relative to blackout prevention
are combined. One rationale is that different stakeholders can benefit from the same
investment, albeit the magnitude of the benefits might be different from one stakeholder
to another, and therefore, the cost of the investment should be shared.
Another area where stakeholders need to be identified clearly is in the improvement of
LMP calculations. The quantification of this kind of benefit has not been done before, but
evidence suggests that there are a number of winners and losers from incorrect LMP
calculations that arise from incorrect network parameters. In such a case, it is preferable
to perform different payback analyses for different stakeholders.
4.0 Phase IV – Estimate Deployment Plan and Costs PMU deployment involves three types of cost: component costs (per box), system costs
(per Data Concentrator), and the software applications (Table E‐2). The following
estimates have been suggested20, which can be used as a guide if no other knowledge
sources exist.
Table E-2. Typical costs for PMU deployment.
PMU costs
High-end hardware $47,000
Engineering costs $30,000
Training & Installation $25,000
PDC costs
Hardware $40,000
Engineering $20,000
Training & Installation $35,000
Applications
Real-time monitoring app. $20,000 - $35,000
State Estimation improvement $80,000 - $200,000
In this example, the various costs have been analyzed and the subtotals are reported in
the last two columns of Table E‐1.
Items listed in Table E‐1 can be grouped into common subject areas:
Base deployment: Items #1 and 2. The base deployment is to acquire sufficient
real‐time measurements for several applications. This is related to PMUs and
20 “Phasor Measurement Unit (PMU) Installation Process and Cost Estimates,” Consortium for
Electric Reliability Technology Solutions, May 2005.

E‐5
PDC, and are covered by Item #1 and Item #2 of Table E‐1. The total hardware
cost, according to Table E‐1 is $3,000,000.
Outage Prevention: Items #4, 5 and 7.
Post‐mortem Analysis: Item #3, which can be deployed with or without Outage
Prevention.
Congestion Management: Item #6.
Table E-3. Deployment plan for the example.
Subject area Deployment plan Comments
Base deployment Year 1 – Year 3 Provides base equipment for all
applications
Outage Prevention Year 4 In use starting from Year 5.
Post-mortem Analysis (part of Base deployment) Partial use during Years 1-3; full use
after Year 3.
Congestion Management Year 4 Year 4 is used for software
installation and testing.
Based on the above table and budgets, several deployment plans are possible, such as
(Table E‐3):
Full deployment.
Partial deployment with Post‐mortem Analysis only. The cost is the base
deployment.
Partial deployment with Outage Prevention and Post‐mortem analysis. The cost
is base deployment, equipment upgrade for Item 5, and annual costs.
Partial deployment with Congestion Management only. The cost is base
deployment, software applications, and annual costs.
5.0 Phase V – Perform Payback Analysis We review three techniques that can be used to perform a payback analysis, whose
outcome is to decide whether the project should proceed.
NPV (Net Present Value). In this traditional approach, one projects all future benefits,
expenses and needed investment for a number of years. The numbers are discounted to
present time and are summed to produce the Net Present Value. The project gets a Go
only when NPV is positive.
To review at the mechanics of this technique, consider the numbers tabulated in
Figure E‐7, which shows a partial deployment of Congestion Management. As
discussed in Phase IV, the deployment plan requires a total of 4 years (Years 1‐3
for hardware and Year 4 for software). The capital investment is phased over

E‐6
four years as shown on row “PV (investment, each year)”: $1000K, $1000K,
$1000K and $3500K. The benefits are projected to begin in Year 5, with a starting
value of $2,400K (Phase II, Table E‐1), and will grow at a certain rate (due to
factors such as annual load growth); these are shown on row “benefits”. The
annual expenses are estimated at $300K (Table E‐1) and have its own growth
rate; these are shown on row “annual expense”. When discounted to present
time, the NPV is ‐$173K. In this case, the benefits from the deployment are not
sufficient to justify the investment.
Modified NPV. Simple probabilistic elements are sometimes used in conjunction with
the traditional NPV. One might consider three scenarios: optimistic, pessimistic, and
average.
The “average” scenario is what the traditional NPV uses, i.e., the benefits are
expected to start in Year 4 at $2400K.
The optimistic scenario might be twice that amount, i.e., $4,800K in Year 4; this is
to reflect that the likelihood of high load growth (e.g., due to economic growth in
the region), which means that technology solutions to address congestion
problems have high values. In this example, the optimistic scenario would result
in a positive NPV.
The pessimistic scenario can be half of the average value, to reflect the likelihood
that the load growth is low and/or the installed software (which costs $3,500K in
year 4) is buggy or fails to deliver the functionalities. In this example, when
compared to the average scenario, the pessimistic scenario would result in a
more negative NPV.
Real Options Analysis. (ROA) This method takes the modified NPV one step further by
taking into account the probabilities of the projected benefits. ROA is suitable for phased
investments, and is particularly suitable for PMU projects as they are deployed over
several years. In the example, it takes 4 years to build up the project. For each year, as
the knowledge about the perceived benefits becomes clearer, the management has the
option of stopping the project, postponing or expanding it. ROA is used when NPV
results are negative, yet the project is deemed strategic enough that the management
finds it necessary to conduct a phased approach; they will capture the upside should
favorable scenarios develop over the course of time.
Case 1 – Full Deployment
In this case, we consider a deployment that would bring about the benefits identified in
Table E‐1. There are two valuations of the same project; they differ in how the cost of
blackouts is estimated:
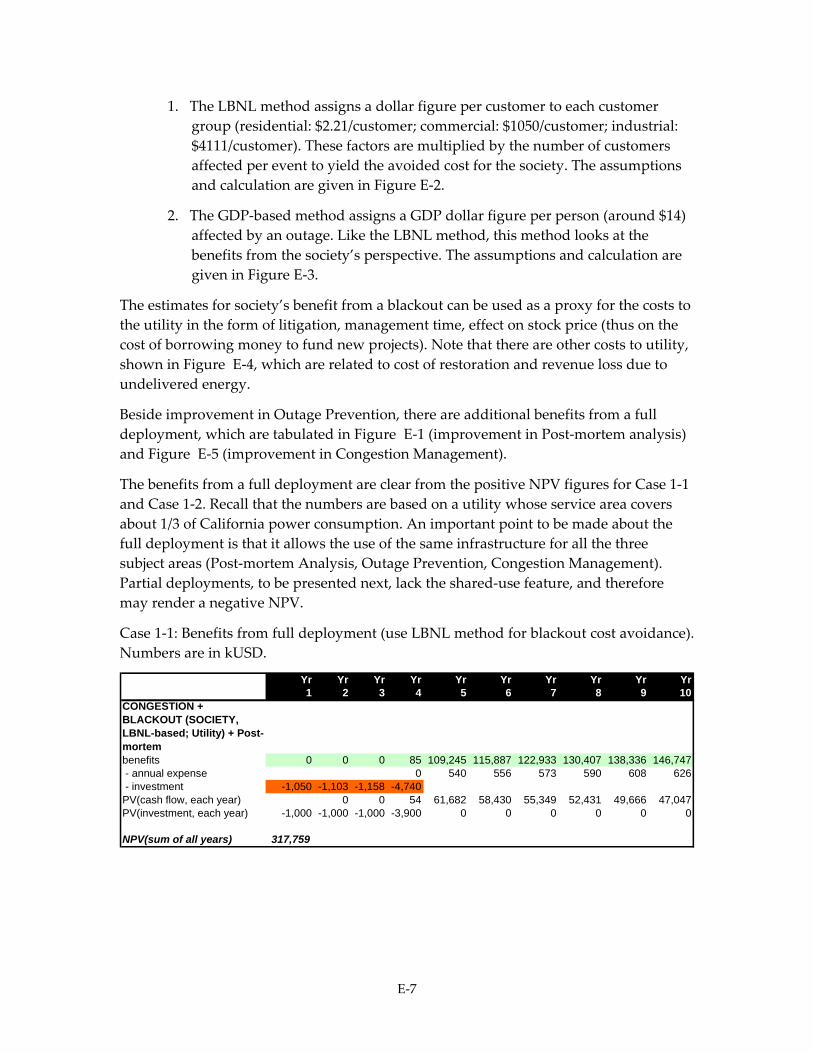
E‐7
1. The LBNL method assigns a dollar figure per customer to each customer
group (residential: $2.21/customer; commercial: $1050/customer; industrial:
$4111/customer). These factors are multiplied by the number of customers
affected per event to yield the avoided cost for the society. The assumptions
and calculation are given in Figure E‐2.
2. The GDP‐based method assigns a GDP dollar figure per person (around $14)
affected by an outage. Like the LBNL method, this method looks at the
benefits from the society’s perspective. The assumptions and calculation are
given in Figure E‐3.
The estimates for society’s benefit from a blackout can be used as a proxy for the costs to
the utility in the form of litigation, management time, effect on stock price (thus on the
cost of borrowing money to fund new projects). Note that there are other costs to utility,
shown in Figure E‐4, which are related to cost of restoration and revenue loss due to
undelivered energy.
Beside improvement in Outage Prevention, there are additional benefits from a full
deployment, which are tabulated in Figure E‐1 (improvement in Post‐mortem analysis)
and Figure E‐5 (improvement in Congestion Management).
The benefits from a full deployment are clear from the positive NPV figures for Case 1‐1
and Case 1‐2. Recall that the numbers are based on a utility whose service area covers
about 1/3 of California power consumption. An important point to be made about the
full deployment is that it allows the use of the same infrastructure for all the three
subject areas (Post‐mortem Analysis, Outage Prevention, Congestion Management).
Partial deployments, to be presented next, lack the shared‐use feature, and therefore
may render a negative NPV.
Case 1‐1: Benefits from full deployment (use LBNL method for blackout cost avoidance).
Numbers are in kUSD.
Yr Yr Yr Yr Yr Yr Yr Yr Yr Yr1 2 3 4 5 6 7 8 9 10
CONGESTION + BLACKOUT (SOCIETY, LBNL-based; Utility) + Post-mortembenefits 0 0 0 85 109,245 115,887 122,933 130,407 138,336 146,747 - annual expense 0 540 556 573 590 608 626 - investment -1,050 -1,103 -1,158 -4,740PV(cash flow, each year) 0 0 54 61,682 58,430 55,349 52,431 49,666 47,047PV(investment, each year) -1,000 -1,000 -1,000 -3,900 0 0 0 0 0 0
NPV(sum of all years) 317,759

E‐8
Case 1‐2: Benefits from full deployment (use GDP method for blackout cost avoidance).
Numbers are in kUSD.
Yr Yr Yr Yr Yr Yr Yr Yr Yr Yr1 2 3 4 5 6 7 8 9 10
CONGESTION + BLACKOUT (SOCIETY, GDP-based; Utility) + Post-mortembenefits 0 0 0 85 17,426 18,485 19,609 20,802 22,066 23,408 - annual expense 0 540 556 573 590 608 626 - investment -1,050 -1,103 -1,158 -4,740PV(cash flow, each year) 0 0 54 9,582 9,084 8,611 8,163 7,738 7,335PV(investment, each year) -1,000 -1,000 -1,000 -3,900 0 0 0 0 0 0
NPV(sum of all years) 43,667
Detailed Assumptions
Area
Pre-PMU (months spent per event)
Pre-PMU, number of events per year
Post-PMU (months spent per event)
Post-PMU, Number of events per year Labor cost $/hr Benefits
Incremental investment
Annual expense
Quicker system status evaluation (post event) 4 3.2 2 1.1 50.00$ 84,800.00$ -$ -$
Figure E-1. Assumed benefits from improvement in Post-mortem Analysis. Used by both Cases 1-1 and 1-2.
AreaPre-PMU (events per year)
Post-PMU (events per year)
% of customer affected
Number of residential customers
Number of Commercial Customers
Number of Industrial Customers Benefits
Incremental investment
Annual expense
Catastrophic blackout 0.2 0.1 50% 3,670,754 483,370 47,820 35,611,944$ 200,000.00$
Disturbances due to voltage excursions 3 1 5% 3,670,754 483,370 47,820 71,223,889$ 400,000.00$ 40,000.00$ (LBNL factors) --> 2.21$ 1,050$ 4,111$
SummaryCAPITAL INVESTMENT (incremental) 400,000.00$ Annual benefits (net) 106,595,832.95$
Figure E-2. Assumed societal benefits from improvement in Outage Prevention. (LBNL method). Used by Case 1-1.

E‐9
AreaPre-PMU (events per year)
Post-PMU (events per year)
% of customer affected
Number of residential customers
Number of Commercial Customers
Number of Industrial Customers Benefits
Incremental investment
Annual expense
Catastrophic blackout 0.2 0.1 50% 3,670,754 483,370 47,820 2,569,528$ 200,000.00$
Disturbances due to voltage excursions 3 1 5% 3,670,754 483,370 47,820 5,139,056$ 400,000.00$ 40,000.00$ (GDP factors) --> 14.00$ -$ -$
SummaryCAPITAL INVESTMENT (incremental) 400,000.00$ Annual benefits (net) 7,468,583.40$
Figure E-3. Assumed societal benefits from improvement in Outage Prevention. (GDP method). Used by Case 1-2.
Area
Pre-PMU (events per year)
Post-PMU (events per year)
average MWh per event Benefits/MWh Benefits
Restoration-cost per event
Restoration-Cost Avoidance
Incremental investment
Annual expense
Catastrophic blackout 0.2 0.1 7500 20.00$ 15,000.00$ 100,000.00$ 10,000.00$ 200,000.00$
Disturbances due to voltage excursions 3 1 750 20.00$ 30,000.00$ 20,000.00$ 40,000.00$ 400,000.00$ 40,000.00$ Less generation dropping w/ Phasor-enhanced RAS arming study 6 2 160 70.00$ 44,800.00$ 5,000.00$ 20,000.00$ 30,000.00$
SummaryCAPITAL INVESTMENT (incremental) 400,000.00$ Annual benefits 159,800.00$ Annual costs 270,000.00$
Figure E-4. Benefits (partial) to the utility from improvements in Outage Prevention. Used by both Cases 1-1 and 1-2.
Area Pre-PMU Post-PMU (hours/yr) MWh benefited Benefits/MWh Benefits Incremental investment
Annual expense
Accurate margin assessment 0 1,000 240 10.00$ 2,400,000.00$ 3,500,000.00$ 300,000.00$
SummaryCAPITAL INVESTMENT (incremental) 3,500,000.00$ Annual benefits 2,400,000.00$ Annual costs 300,000.00$
Figure E-5. Benefits from improvement in Congestion Management. Used by both Cases 1-1 and 1-2.
Case 2 – Partial deployment for Post‐mortem Analysis
The ability to document and analyze disturbances and respond quickly to public
inquiries has both tangible and intangible benefits. One tangible benefit is in reducing
engineers’ hours needed to analyze the waveforms, and this is an item that can be
quantified, shown in Row 4 of Table E‐1, and is the only item included in the example
calculation.
In a more comprehensive analysis, one needs to account for other tangible benefits such
as less management time devoted to public meetings and scrutiny (the longer the causes
of a blackout remains undetermined, the more is the public scrutiny). A fast post‐
mortem analysis also allows the utility personnel to understand the causes and to be
better prepared for the next one; this is also an important benefit, but is difficult to
quantify.

E‐10
In this deployment scenario, it is assumed that small‐scale disturbances occur on a
rather common basis. Post‐mortem analysis for the underlying problem does not require
a large deployment of PMUs, as reflected by a modest amount in the Cash flow table of
Figure E‐6 (row “PV investment each year”). The capital investment is modest
($100k+$100k+$200k) as it is assumed that only a small number of PMUs installed at key
substations are sufficient for waveform capturing. The benefit, counted as hour savings,
see Figure D‐1, is plugged into the Cash Flow table and compared against the PMU
investment. This yields a negative NPV as shown in Figure E‐6.
(For a large disturbance the size of 2003 Northeast blackout, NERC allocated 2‐3 people
on a 75% time working over 9‐10 months. It is expected that with PMUs, this resource
requirement would be 1‐2 months with 2‐3 people full time. One can expect that affected
utilities devoted much more person‐hours to the effort. The collective savings with
PMUs might justify the cost of investing in a large number of PMUs. Such a detailed
benefit analysis, however, is beyond the scope of this project.)
Yr Yr Yr Yr Yr Yr Yr Yr Yr Yr1 2 3 4 5 6 7 8 9 10
Post-mortem analysisbenefits 0 0 0 85 90 95 101 107 114 121 - annual expense 0 0 0 0 0 0 - investment -105 -110 -232PV(cash flow, each year) 0 0 54 51 48 46 43 41 39PV(investment, each year) -100 -100 -200 0 0 0 0 0 0 0
NPV(sum of all years) -78
Figure E-6. Cash Flow table for the example Post-Mortem Analysis. Numbers are in kUSD.
Case 3– Partial Deployment for Congestion Management
The assumption and calculation of annual benefit are given in Figure E‐5. The NPV for
this project is negative, as seen in Figure E‐7.

E‐11
Yr Yr Yr Yr Yr Yr Yr Yr Yr Yr1 2 3 4 5 6 7 8 9 10
Congestion Managementbenefits 0 0 0 0 2,400 2,546 2,701 2,865 3,039 3,224 - annual expense 300 309 318 328 338 348 - investment -1,050 -1,103 -1,158 -4,254PV(cash flow, each year) 0 0 0 1,192 1,133 1,078 1,025 974 926PV(investment, each year) -1,000 -1,000 -1,000 -3,500 0 0 0 0 0 0
NPV(sum of all years) -173
Figure E-7. Cash Flow table for the example Congestion Management. Numbers are in kUSD.
Case 3 revisited. Analysis with Real Options
As the projected benefits are forecast of events into the future, there are uncertainties
about the value used in the cash flow table. The projected benefit is $2400K in Year 5;
this is usually an average or expected value of the benefit that will happen 5 years in the
future. As seen from Figure E‐5, the benefit is affected by several parameters (number of
hours, MWh, and savings per MWh), all of which should be modeled as random
variables whose probability distributions reflect historical record of the congestion on
the utility grid and the cost of energy. For illustration, the probability distribution of the
benefit in Year 5 is given in Figure E‐8. There is a considerable spread around the mean
($2400K), ranging from $1000K to $5600K. One standard way to incorporate such
uncertainty to the project valuation is to use Real Options.
Figure E‐9 shows the binomial‐tree solution to the Real Options analysis for the
Congestion Management (partial deployment). The row at the bottom of the tree‐‐
1050K, 1103K, 1158K, 4254K‐‐ are the investment needed each year to keep the project
going forward; these numbers come from the “investment” row of the cash flow table of
Figure E‐7. Each branch in the tree represents a possible outcome (up or down) as time
progresses. The up/down amount approximates the spread of the distribution in Figure
E‐9. The root of the tree indicates that the payoff is $1258K, suggesting that the phased
investment is worth considered.
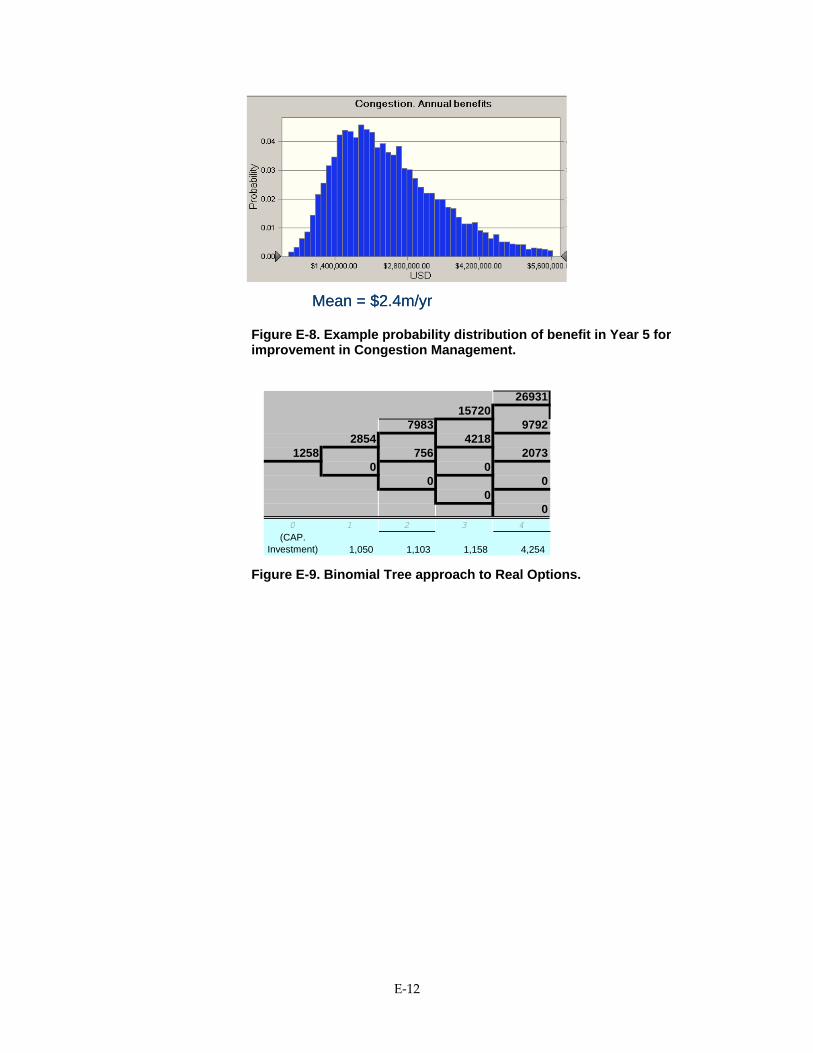
E‐12
Mean = $2.4m/yrMean = $2.4m/yr
Figure E-8. Example probability distribution of benefit in Year 5 for improvement in Congestion Management.
2693115720
7983 97922854 4218
1258 756 20730 0
0 00
00 1 2 3 4
(CAP. Investment) 1,050 1,103 1,158 4,254
Figure E-9. Binomial Tree approach to Real Options.

E‐13
References
“Investment Opportunities as Real Options: Getting Started on the Numbers”, T.
Luehrman, Harvard Business Review, 1998.
“A Real‐World Way to Manage Real Options”, T. Copeland and P. Tufano, Harvard
Business Review, 2004.
“Real Options Analysis Course” J. Mun, John Wiley & Sons, Inc., 2003.

Appendix F - EIPP-CIEE Survey – May 19, 2006


F‐1
PMU Benefits and Justification
An EIPP-NERC-CIEE Survey
About the Survey
The Eastern Interconnection Phasor Project (EIPP), NERC, and CIEE are soliciting
information from EIPP members and WECC companies regarding the experience and
understanding within each company on the business potential and use of phasor‐
measurement technology.
The survey is part of EIPP’s goal to help the industry take the deployment and usage of
phasor‐measurement technology beyond the R&D stage. At present, technical benefits
from phasor technology seem clear to engineers and technology managers. However,
translation of benefits to be gained from PMU deployment into financial measures is less
advanced. Information of this type must be developed to effectively communicate the
technology benefits to utility, ISO, and regulatory decision makers.
We will use the survey results as an input to craft guidelines for engineers and
technology managers to justify the technology and its solutions to relevant executives.
Once benefits of the new technology are properly communicated, the demand will
attract vendors to produce hardware and software solutions.
Your assistance with this effort is needed and your attention to this survey by June 7 is
greatly appreciated.
Floyd Galvan, Entergy
EIPP Business Management Task Team
Stan Johnson, NERC
Manager of Situation Awareness and Infrastructure Security
Damir Novosel, KEMA
EIPP Performance Requirements Task Team and CIEE “PMU Business case”
principal investigator
Technical Experience with PMU devices
Does your company have PMUs in use? Yes_____ No_____

F‐2
When did you install the first commercial‐grade PMU? _____________________
Please indicate the number of PMUs in the categories below:
Installed &
Networked
Installed, but not
networked yet
Plan to install in next:
1 Yr 2 Yr 3 Yr
Number of PMUs
Type of organization:
ISO _____ Muni _____
TSO _____ Co‐op ____
IOU _____ Government agency
(State or Federal) ______
Organizational Ownership
Please provide the name of the department(s) involved in performing the following
functions related to PMU use (if there are more than one, please indicate the lead):
(a) Purchasing PMUs _______________________________
(b) Installing PMUs _______________________________
(c) Analyzing PMU data _______________________________
(c) Maintenance/Calibration of PMU _______________________________
(e) Functional owner of PMUs _______________________________
Is there a champion for the PMU technology in your organization? Yes____ No____
What is the position of this person? _________________________________________
Applications

F‐3
(Please respond to the following questions for 1‐PMUs in use currently, and 2‐uses or
applications of PMUs planned or anticipated.)
For existing installations, please provide the following information on applications:
Type of application (e.g.
Phase angle monitoring,
Post event analysis).
Purpose
Number
of PMUs
installed
Application
developed
“in‐house”
or
purchased
All Costs
(PMUs, apps,
installation)
For planned or anticipated installation and applications, please provide the following:
Type of application (e.g.
Congestion management,
Post event analysis).
Purpose
Number
of PMUs
planned
Application
developed
“in‐house”
or
purchased
Budget

F‐4
Have you shown or demonstrated PMU applications in your company?
Yes____ No____.
If yes, which ones? ________________________
To whom (positions or functions)? ______________________
What feedback was received?
Business Justification
How were existing PMU installations in your company justified and funded? (check all
that apply)
_____Cost/benefit justification
_____R&D project funding
_____Discretionary operating funds

F‐5
_____Funded, all or in part, by others (vendor, ISO/RTO, Gov’t.). Please indicate funding
source(s) or project participation partner(s):
For projects that included a business justification of any type, please provide the
following:
Benefits identified
How are benefits
measured & quantified
Forecasted benefit ($/year)
Realized benefits
What is return on the
investment
Example‐
Improved event
analysis
Reduced man hours,
Cost reduction
15% reduction in man‐
hour per event to
result in $1M/year
savings
One event
resulted in
$500k savings
Less than a year
If needed, please describe realization of the above benefits in more detail.
For business justified applications:
Are other, unplanned or unexpected, benefits being discovered?
If so, what are they?
Do you anticipate further benefits from application through broader use?

F‐6
Are PMU installations meeting expectations of others in your company (management,
stakeholders, etc.)? Describe.
Have the benefit expectations changed from project inception to present time? If yes,
please explain.
Please describe the approach you would use in developing a business case justification
for a PMU installation.
What are the barrier(s) to PMU adoption?
Please group your answers into the following categories:
Technology
Organizational
Industry
Government
Vendor
Please complete the attached matrix (filename = “PMU worksheet.xls”) regarding the
potential uses for PMUs in your organization.