Final project – Computational Biology Identifying transcription factories not involved in pre-mRNA...
27
Final project – Final project – Computational Computational Biology Biology Identifying Identifying transcription transcription factories not factories not involved in pre- involved in pre- mRNA splicing mRNA splicing םםםםםם: םםםםם םםםם םםם םםםםם םםםםםםם: םם םםםםם םםםםם ם"םםם- םםםם םם
-
Upload
mitchell-lindsey -
Category
Documents
-
view
216 -
download
2
Transcript of Final project – Computational Biology Identifying transcription factories not involved in pre-mRNA...

Final project –Final project – Computational Computational
BiologyBiologyIdentifying Identifying
transcription transcription factories not factories not
involved in pre-involved in pre-mRNA splicingmRNA splicing
ניסים נעיםמגישים: עדי פוטוק
מר יהודה בהנחיית:ברודי
ד"ר ירון שב-טל

IntroductionIntroductionThere is evidence of transcription factoriesThere is evidence of transcription factorieswhich contain accumulations of RNA polymerase II.which contain accumulations of RNA polymerase II.Genes are moving towards the factories in order to beGenes are moving towards the factories in order to betranscribed.transcribed.

Splicing is a co-transcriptional modification of an mRNA,Splicing is a co-transcriptional modification of an mRNA,in which introns are removed and exons are joined.in which introns are removed and exons are joined.
U1 and U2 are parts of the spliceosome machinery.U1 and U2 are parts of the spliceosome machinery.
IntroductionIntroduction
http://www.mpibpc.mpg.de/groups/pr/PR/2008/08_10_eng_RN/

Identification and classification of transcription factories, and categorizing the factories by their probability to undergo splicing.
Project goalProject goal

RNA FISHRNA FISH
ImmunofluorescenceImmunofluorescence
Using a labeled oligonucleotide Using a labeled oligonucleotide probe to detect a specificprobe to detect a specificmRNA of interest.mRNA of interest.
Using a fluorescent labeledUsing a fluorescent labeledantibody to detect U1snRNA,antibody to detect U1snRNA,U1snRNA and RNA polymerase II.U1snRNA and RNA polymerase II.
Fluorescence In-Situ HybridizationFluorescence In-Situ Hybridization
mRNA

The cells are illuminated with lightThe cells are illuminated with light
of a certain wavelength and emitof a certain wavelength and emit
light of a different wavelengthlight of a different wavelength..
This technique is used to acquire 3DThis technique is used to acquire 3D
images of a specimen. Each imageimages of a specimen. Each image
is composed of several 2D layers.is composed of several 2D layers.
Wide-Field MicroscopyWide-Field Microscopy
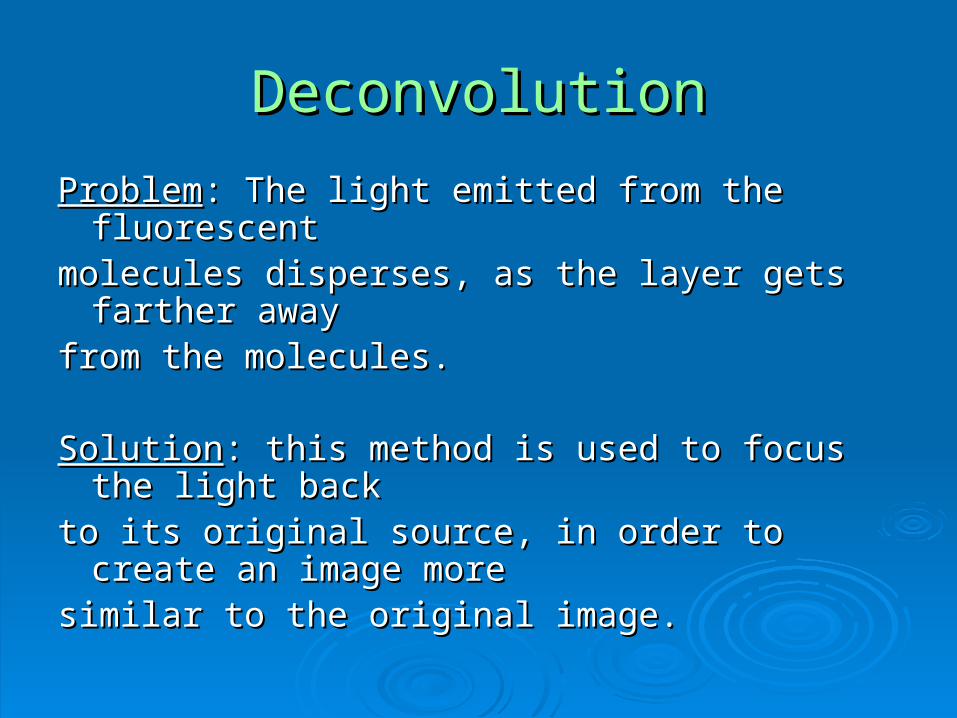
ProblemProblem: The light emitted from the fluorescent: The light emitted from the fluorescentmolecules disperses, as the layer gets farther awaymolecules disperses, as the layer gets farther awayfrom the molecules.from the molecules.
SolutionSolution: this method is used to focus the light back: this method is used to focus the light backto its original source, in order to create an image moreto its original source, in order to create an image moresimilar to the original image.similar to the original image.
DeconvolutionDeconvolution

DeconvolutionDeconvolution
Before After

Image analysisImage analysis
IMARISIMARIS – – Tool for analyzing images Tool for analyzing images Wide graphical abilities.Wide graphical abilities. Embedded link to MATLAB programs.Embedded link to MATLAB programs.
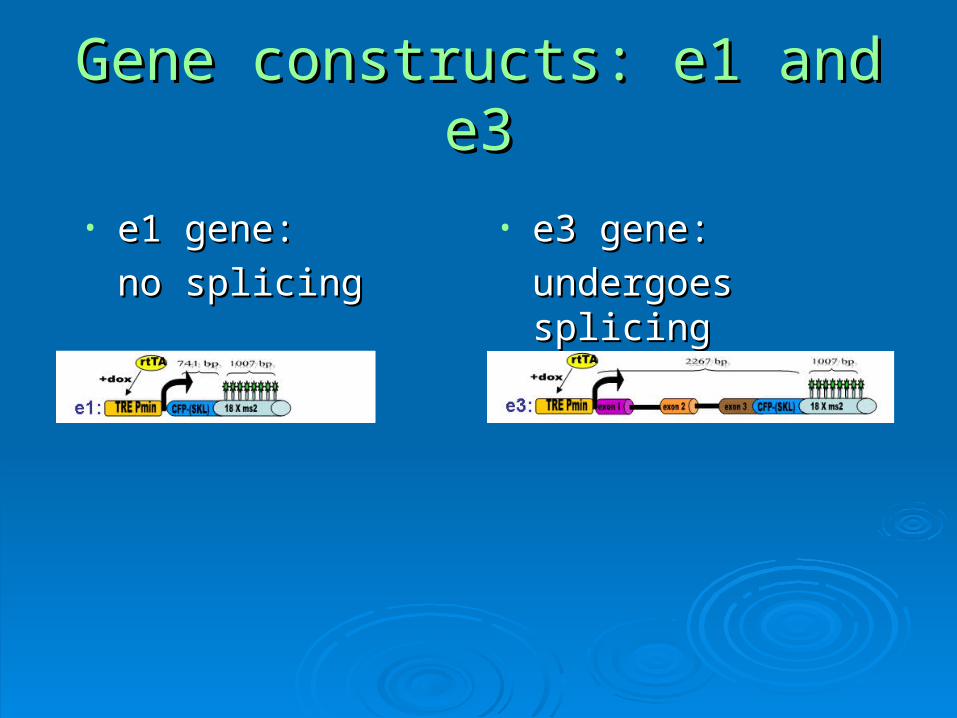
Gene constructs: e1 and e3Gene constructs: e1 and e3
• e1 gene:e1 gene:
no splicingno splicing
• e3 gene:e3 gene:
undergoes splicingundergoes splicing
Splicing is co-transcriptional
sn
RN
AU
1
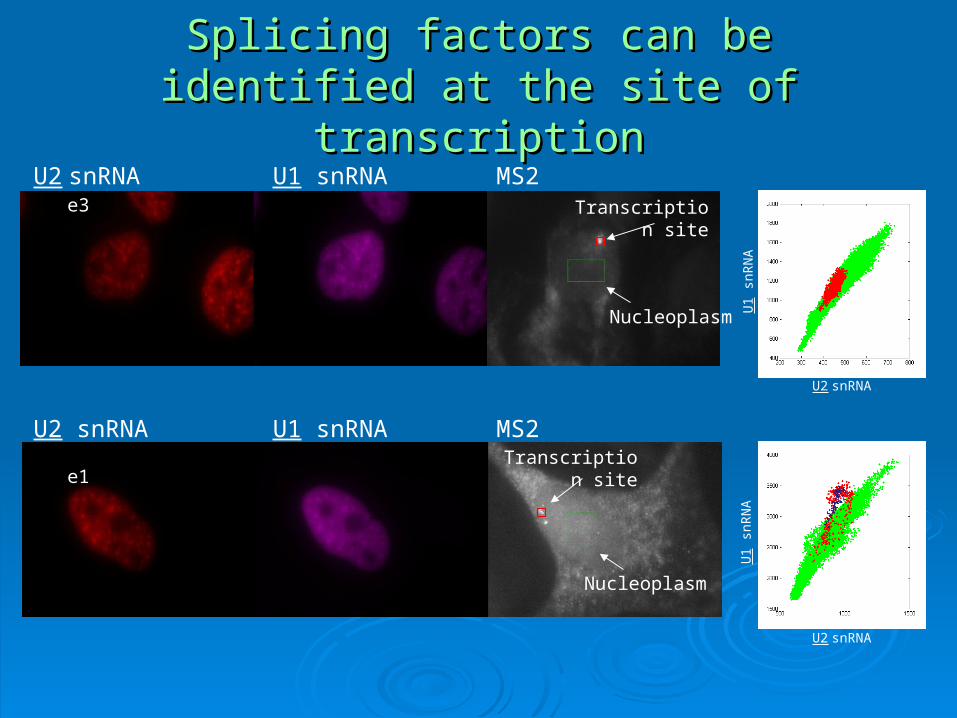
snRNAU2 snRNAU1
snRNAU2
MS2
e3
e1
MS2U1 snRNAU2 snRNA
Splicing factors can be identified at the site Splicing factors can be identified at the site of transcriptionof transcription
MS2U1 snRNAU2 snRNA
Transcription site
Nucleoplasm
Transcription site
Nucleoplasm
U1
snR
NA
U1
snR
NA
U2 snRNA
U2 snRNA

Splicing is co-transcriptional
sn
RN
AU
1
Splicing factors can be identified at the site Splicing factors can be identified at the site of transcriptionof transcription

RNA pol II ImmunofluorescenceRNA pol II Immunofluorescence
Nucleoplasm
Nucleolus
Transcription factory
Cytoplasm

Step I – Identify FactoriesStep I – Identify Factories
• Use “dynamic threshold” to intensify the areas with Use “dynamic threshold” to intensify the areas with high values, compared with their surroundings.high values, compared with their surroundings.
Intensity of pixels in the image
Dynamic threshold

Step I – Identify FactoriesStep I – Identify Factories
Locate the centers of these areasLocate the centers of these areas

Step I – Identify FactoriesStep I – Identify Factories
Expand each center to the whole factory areaExpand each center to the whole factory area

Step I – Identify FactoriesStep I – Identify FactoriesUse the “find connected components” functionUse the “find connected components” function to differentiate between factories. to differentiate between factories.
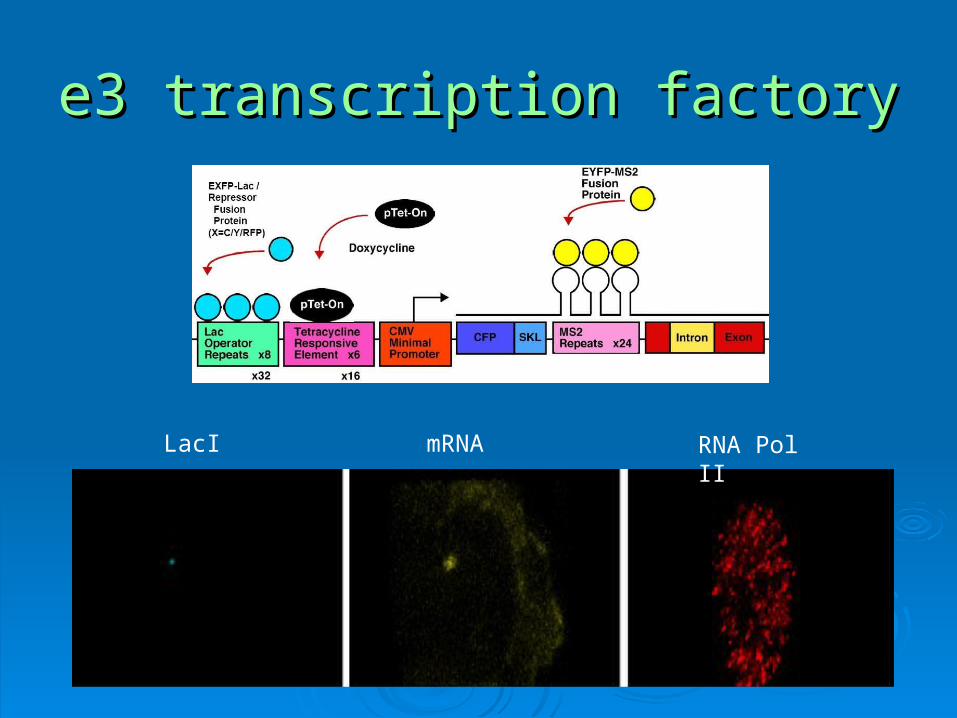
e3 transcription factorye3 transcription factory
RNA Pol IImRNALacI

e3 transcription factorye3 transcription factorymRNA molecules surrounding the gene
RNA pol II and mRNA molecules surrounding the gene

Step II – Calculate CorrelationStep II – Calculate Correlation
• Normalization of the U1 and U2 images.Normalization of the U1 and U2 images.
• Correction of pixel shift.Correction of pixel shift.

Step II – Calculate CorrelationStep II – Calculate Correlation
• We tried several methods to calculate correlation:We tried several methods to calculate correlation:
Pearson coefficientPearson coefficient
average of U1 / average of U2average of U1 / average of U2
curve fit (aX + b)curve fit (aX + b)

Current resultsCurrent results
U1 / U2
Nor
mal
ized
cou
nt
Nor
mal
ized
cou
nt
U1 / U2

Step III – classifying factoriesStep III – classifying factories
• The best method to divide the factories into twoThe best method to divide the factories into two
distinct groups, is ….distinct groups, is ….
• Consensus correlation similar to that of e3 gene Consensus correlation similar to that of e3 gene
high probability of undergoing splicing.high probability of undergoing splicing.
• Different / No consensus correlation Different / No consensus correlation
low probability of undergoing splicing.low probability of undergoing splicing.

The final outputThe final output
• Using color gradient to color factories according to Using color gradient to color factories according to the probability of undergoing splicing.the probability of undergoing splicing.

Biological conclusionsBiological conclusions• A few hundreds of transcription factories in each A few hundreds of transcription factories in each
nucleus, as mentioned in articles from recent years.nucleus, as mentioned in articles from recent years.
? Do factories tend to gather, or do they operate? Do factories tend to gather, or do they operate
throughout the nucleus.throughout the nucleus.
? Do active factories concentrate in the center? Do active factories concentrate in the center
of the nucleus.of the nucleus.

What’s nextWhat’s next??
• Improve factory identification (more automatically).Improve factory identification (more automatically).
• Displaying each factory as an individual objectDisplaying each factory as an individual object
in IMARIS.in IMARIS.
• Analyze more images of e1 and e3 genes, to findAnalyze more images of e1 and e3 genes, to find
the differences between their factories.the differences between their factories.
• Check the correlation of U1 and U4 factors.Check the correlation of U1 and U4 factors.

ThanksThanks
Dr. Yaron Shav-TalDr. Yaron Shav-Tal Mr. Yehuda BrodyMr. Yehuda Brody
http://io9.com/photogallery/scienceart2009/1008301614