Chapter 5: Transportation, Assignment and Network Models © 2007 Pearson Education.
Final Project Assignment17.871Spring 2007
Assignment summaryYou will make two oral presentations, of 15 minutes in length, and turn in a final research paper,15–20 pages long.
Presentations
General considerations. Both presentations will be limited to fifteen minutes, followed by fiveminutes of response from me and others in the class. We will therefore start on time (at 5minutes past the hour) and I will cut you off when 15 minutes have elapsed, precisely. Fifteenminutes go faster than you imagine. The best presentations will be those that have beenpracticed beforehand. Remember: you will be graded on the quality of your presentations. (Indeed, you will be graded more on the presentation itself than on whether you actually foundanything interesting in your research.) To improve presentation quality and to save time, youshould have handouts ready to distribute and/or have overheads ready to project. Make sure youhave taken care of the technical aspects of the presentation before the class time begins.
When you are not presenting, you are participating by listening and giving feedback. You mustbe present for all the presentation sessions.
First presentation. The first presentation should inform us of your subject, how you intend topursue it, the data you plan to use, and any special problems you think you will encounter.
Inform us of your subject: What is the substantive issue you intend to pursue? What is the keypuzzle or question you wish to address. To whom would the issue be of interest? Have othersresearched this area before? If so, what have they found?
How do you intend to pursue the subject: What are your major dependent variables (focus on oneor two). What are your major independent variables? What “unit of analysis” will you bestudying? (That is, will you be studying individuals, counties, countries, etc.?) Will this be atime series analysis? Cross-sectional? A combination?
Your data: What would the ideal data be to do this project? If you can’t get your ideal data,what data can you get your hands on? Tell us actual sources. It would also be good at this pointto report descriptive statistics of your data set, graphs that show simple, basic relationships, etc.
Special problems. Perhaps there’s a crucial variable that will be difficult or impossible tomeasure directly, or some regression assumption will be violated. Quantitative analysis is rarelystraightforward, so tell us any wrinkles you’ve encountered thus far, or anticipate encounteringover the next month.

2
Second presentation. The second presentation should summarize the basics of your firstpresentation and then report your findings. The summary of the first presentation should be verybrief, focusing on reminding us of the subject you are pursuing, your basic approach, and thesource(s) of your data. Your findings should be reported in much the way we learned dataanalysis in this subject. First, present your data. Identify the variables in your analysis: how arethey measured, what are their means and variances? Second, present the most importantbivariate relationships. This should be done with a series of well thought-out graphs. Third, present your multivariate analysis. Draw to our attention the core results and whether they confirm or disconfirm your orginal conjectures. Discuss any cases thatappear to be poorly described by your analysis and what might be done to correct this. Fourth,tell us what you conclude about your subject from the analysis you’ve done, how certain weshould be about those conclusions, and what alternative explanations or problems remain.
Research paper
The logic of exposition in your research paper should roughly parallel the second presentation. The one section you should add at the beginning of the paper that you won’t want to talk toomuch about in the second presentation is a discussion of previous research. While you don’thave to do a comprehensive search of the literature, you need to do library work to see ifanyone has written about your topic before and (if they did) what they found. Don’t worry ifyou’ve found that someone has previously done something identical to your project. Replicationof others’ results is an important part of normal science.
Journal articles in political science (which is the model your write-up should follow) oftenfollow this outline:
I. IntroductionII. Literature reviewIII. DataIV. Model specification (i.e., what are the variables and how are they measured?)V. Results
A. Preliminary results (simple relationships and a first cut at multivariateanalysis)
B. Sensitivity analysis and other searches for anomaliesC. Re-estimation; further analysis
VI. Discussion of results from a substantive perspectiveVII. Conclusion
The first page (after the title page) must have an abstract of no more than 250 words thatsummarizes your project and findings. The abstract page must contain your name and the title ofyour paper.
The paper should be 15-20 pages long, including text, graphs, figures, appendices, andbibliography. There is no hard and fast page limit for the final page. Write succinctly. Edit.

3
Hone. Eschew verbiage. Make the text flow. If there’s a particularly long, involvedmethodological problem that you attend to, consider moving it to an appendix and only makereference to it in the body of the paper.
Read Kate Turabian’s style book (A Manual for Writers of Term Papers, Theses, andDissertations) before you write your final draft. Follow this style book for most things. Inaddition, the American Political Science Review’s style sheet is the authority for special casesthat pertain to political science. The following URL contains information concerningcitations: http://depts.washington.edu/pswrite/cite.html. Look at recent editions of the AmericanPolitical Science Review or American Journal of Political Science to see how tables and figuresshould appear.
Finally, there are some mechanical issues that you must attend to in writing ths paper. (Indeed,you should always attend to these issues when writing for the social sciences.) If you do notfollow these strictures, your paper will be returned to you for rewriting, possibly resulting inyour receiving an I for the subject. When you turn in your final paper, you will need to include acheck-list indicating that you have made sure it meets these criteria.
Double-space everything, except footnotes and tables.
Use footnotes, not endnotes.
Use the author-date form of citation.
Properly number the pages (page 1 is the first text page).
Don’t use fancy fonts.. Make sure the font size is no smaller than 10pt and no larger than12pt. Never use bold face. Use underscoring or italics for emphasis, book titles, etc.
Use a constant 1" margin on each page.
Tables and figures should be self-explanatory.
Staple the paper in the upper left-hand corner. Don’t use a report cover. (Electronicversions of papers are now preferred.)
4
What you will hand in
According to the regulations of the faculty, all final papers are due on the last day of this class. That means by 5pm. Any extensions must be approved beforehand.
To receive a grade in this class you must produce the following:
Two copies of your paper, handed in at my office by 5pm on the last day of this class. I will keep the second copy, as an example to people who take the class in the future. You may e-mail the papers to me.
If you want to see your paper again, include a self-addressed envelope capableof holding your paper. (If the envelope is addressed to go off campus, I will happilysupply the postage.) I will discard all graded papers that are not accompanied by a self-addressed envelope.
An extra copy of your abstract, which I will keep. [Again, this doesn’t apply if yousubmit electronically. However, do send a separate file with only your abstract.]
Your data and the STATA code capable of reproducing the results you report. See belowfor further instructions about this.
If any of these elements is missing, you will receive an I.
How to turn in your data
For the benefit of future students in 17.871, to assist me in giving you feedback, and in theinterest of scientific replication, you are required to turn in the data you use to produce theresults in your paper, plus the computer code used to generate the results. Here’s what you haveto produce.
Data. If you gather the data yourself, you must make available to me the computer file of thatdata. You must also make available a “codebook” that identifies the variables: (1) variablename, (2) data source, (3) column location of the variable in the file, and (4) any coding rules

5
you used to create the variable. If you used a data set produced by someone else, such as anICPSR data set, you must tell me the full citation of the data set. If it is not an ICPSR data set,and it is not available through the MIT-Harvard Data Center, we will treat it like you gatheredthe data yourself.
STATA code. You must save the STATA code from the “.do file” that produced the resultsyou report in your paper. Annotate the code so that corresponds with the results reported inyour paper (e.g., *table1, *figure2).
You will then e-mail the data to me, as an attachment. If the data is too large to e-mail, let usknow and we’ll work out something.

6
17.871 Final Paper Checklist
9 Double-spaced, except footnotes and tables.
9 Footnotes used, not endnotes
9 Author-date citation form used
9 Page numbers properly used
9 Proper font. 9 Either 10pt or 12pt. 9 Italics or underscore used for emphasis. 9 Bold is never used. 9 Courier or Times/Times New Roman typeface.
9 Constant 1" margin on each page
9 Paper stapled in the upper left-hand corner. No report covers.
9 Coefficients and other statistics in tables (like regression coefficients and standard errors)have no more than 3 significant digits.9 No STATA output dumped into the text of the paper.

Article: “Publication, Publication” Author: Gary King Issue: January 2006 Journal: PS: Political Science and Politics This journal is published by the American Political Science Association. All rights reserved. APSA is posting this article for public view on its website. APSA journals are fully accessible to APSA members and institutional subscribers. To view the table of contents or abstracts from this or any of APSA’s journals, please go to the website of our publisher Cambridge University Press (http://journals.cambridge.org). This article may only be used for personal, non-commercial, or limited classroom use. For permissions for all other uses of this article should be directed to Cambridge University Press at [email protected] .
Publication, Publication
Gary King, Harvard University
IntroductionI show herein how to write a publish-
able paper by beginning with the replica-tion of a published article. This strategyseems to work well for class projects inproducing papers that ultimately get pub-lished, helping to professionalize studentsinto the discipline, and teaching the sci-entific norms of the free exchange ofacademic information. I begin by brieflyrevisiting the prominent debate on repli-cation our discipline had a decade agoand some of the progress made in datasharing since.
A decade ago this journal published asymposium on replication policies in po-litical science. The symposium beganwith an article I wrote entitled “Replica-tion, Replication,” and was followed byopposing and supporting comments by19 others ~King, 1995!. The debate overproper policies continued for a few yearsin subsequent issues of the journal and avariety of other public fora. Since then,many journals in political science haveadopted some form of a data sharing orreplication policy. Some strongly recom-mend or expect data sharing and somerequire it as a condition of publication.The editors of the major internationalrelations journals have collectively writ-ten and committed themselves to astrong standard minimum replication pol-icy ~Gleditsch et al. 2003!. Most impor-tant, numerous individual scholars nowregularly share their data, produce repli-cation data sets, put these data sets ontheir web sites, send them to the ICPSRand other archives, or distribute them onrequest to other scholars. Scholars some-times worry about being “scooped,”about maintaining the confidentiality oftheir respondents, or about being provenwrong, but since authors who make theirdata available are more than twice ascited and influential as those who do not~Gleditsch, Metelits, and Strand 2003!,the strong trend toward data sharing inthe discipline should not come as asurprise.
The broader scientific communityboth collectively and in many other in-dividual fields is also moving stronglyin the direction of participating in orrequiring some form of data sharing.Recipients of grants from the NationalScience Foundation and the NationalInstitutes of Health now are required tomake data available to other scholarsupon publication or within a year of thetermination of their grant. Replicating,and thus collectively and publicly vali-dating, the integrity of our publishedwork is often still more difficult than itshould be, and some still oppose thewhole idea, but our discipline has madesubstantial progress.1
The original replication debate in PSincluded discussions about student in-volvement, and indeed some departmentsnow require students writing disserta-tions and senior theses to submit a repli-cation data set that, after an optionalembargo period, gets made public andis permanently archived. In the decadesince “Replication, Replication,” andalso in the decade leading up to it, Ihave tried other ways to help studentsbenefit from this trend. Chief amongthese has been an effort to professional-ize my students by, among other things,giving them first-hand experience repli-cating published work and publishingtheir own. In particular, I require mystudents to write a “publishable” empiri-cal paper for their class project based ontheir replication of an existing publishedarticle. Indeed, most of this paper istaken from a handout I have edited andre-edited over 20 years to maximize thechance that students are able to publishthe paper they write for a methods classI teach.2 Students are told that successfulprojects need not actually be publishedor even submitted for publication. How-ever, although writing a publishablepaper may sound hard at first, revisedversions of a large proportion of studentpapers every year eventually result inpublished journal articles, and manyhave also appeared as convention papers,dissertations, or senior theses, and theyhave won many awards. Almost all ofthose who closely follow the suggestionsbelow wind up with published articles.The advice offered here is not the onlyway to conduct high quality research, butit is one relatively high probability pathto success.
Some students ask: “Why begin anoriginal research paper by replicatingsome old work?” A paper that is publish-able is one that by definition advancesknowledge. If you start by replicating anexisting work, then you are right at thecutting edge of the field. If you can thenimprove any one aspect of the researchthat makes a substantive difference andis defensible, you have a publishablepaper. If instead you begin a projectfrom scratch without replication, youneed to defend every coding decision,every hypothesis, every data source,every method—everything. In contrast, ifyou start with replication, you only needto defend the one area you are improv-ing, and you can stipulate to the rest. If acritic doesn’t like something else in theoriginal article other than that which youare improving, you need not defend thatpoint since it is already part of the pub-lished record and is the recognized stateof the art. After all, this strategy was notoriginally designed for students; it is ex-actly the procedure followed by manyfaculty in political science and mostother scientific fields. It is one of thereasons that the process of providing ac-cess to the raw materials of research withsufficient precision necessary to repli-cate, and of accessing that from otherscholars, has become a deeply estab-lished part of the scientific process.3
What follows is some of the advice Igive my students.
Elements of the Paper1. Your paper should address a sub-
stantive problem in your field of interestand contain one or a few clear points;one point with several supporting pointsis better than a lot of unrelated points.Your point should unambiguously answerthe question: Whose mind are you goingto change about what? If that questionisn’t answered, then you’re not making acontribution and there’s little reason forthe paper to be published.
2. Begin by locating an article in yourfield, acquiring the data used in the arti-cle, and replicating the specific numeri-cal results in the tables and0or figures inthat analysis. ~You may start with theoriginal article and find the data used,or work backwards from the data, suchas stored in the ICPSR’s PublicationRelated Archive, or one of the other
Gary King is the David Florence Profes-sor of Government at Harvard University,where he also serves as director of theInstitute for Quantitative Social Science.His homepage can be found at http://gking.harvard.edu.
PSOnline www.apsanet.org 119

archives of datasets constructed for thepurpose of facilitating replication, andfind the scholarly article.! This articleshould have been published in a peer-reviewed scholarly journal, preferablywithin the last 4–5 years, the more re-cent and prominent the better. The betterthe article, journal, and author youchoose, and the more often the articlehas been cited, the more likely yourpaper will be publishable. Checking cita-tion indices ~ISI or Google Scholar, forexample! is often a good idea, but bemindful of the selection problem thatoccurs because more recent articles willhave had less time to be cited.
Please beware: replicating an article,even if you secure access to the originaldata, is normally a highly uncertain anddifficult process. Analyses that look neatand clean in published articles oftenprove to be far from that in reality. Moststudents find that prominent articles byleading scholars in the field contain er-rors, confusions, lack of essential infor-mation about how the analysis wasconducted, and other problems. Some ofthese issues do not matter to substantiveconclusions, and some do, but all makereplication more difficult. As such, com-pleting the replication will likely bemore troublesome and time consumingthan you anticipate ~even after you adjustfor the information in this sentence!!.After you have done everything you cando on your own, you may need to con-tact the author of the article ~please doso respectfully and diplomatically!.~The remarkable difficulties students
have in replicating published articlesteaches more about the state of the litera-ture, and conveys more about the some-times shaky foundations of academicknowledge, than reading all the pub-lished literature one person could possi-bly consume on his or her own. Everyyear some students are incredulous orstunned by what they find; the experi-ence is in part disheartening, but it alsoseems to empower students who ~cor-rectly! conclude that they can do better. Itypically devote some time during classto share these experiences.!
3. Please bring me a copy of the arti-cle you choose and ask for my viewsbefore proceeding. This will generateadvice on what is unlikely to work, andmight be useful for other reasons, but tobe clear it is no guarantee that you willbe able to replicate the work chosen andsuccessfully complete the assignment.Your assignment is to pick an article ac-cording to the criteria above and to repli-cate it. The choice of the article is partof the assignment and so, just as happensto faculty researchers, you may need tochange your choice of topic along the
way depending on what you find or diffi-culties in replication and do it all again.Perhaps this is why they call it research,rather than merely search! ~If you changearticles, please bring the new article tome as well.! You may wish to follow theprocedure that many of us follow bystarting several projects at once and thenfollowing up those that seem mostproductive.
4. If you decide that the conclusionsof the original article are incorrect, thenshow why you think that but also whatled the authors of the original article tothink otherwise. You should never dis-cuss it in the paper—directly or indi-rectly—but you should assume, unlessyou have overwhelming evidence to thecontrary and maybe even then, that theauthors were well-intentioned, smart,honest, and hard-working. Your article isabout the author’s findings, not about theauthor.
5. Clarify with precision the extent towhich you were able to replicate theauthor’s results. If you can’t replicate theauthor’s results even with the help of theauthor that is important information thatneeds to be on the public record, but italso means you can’t build on this workto make further progress. And if youcan’t find out what the problem is, itmight mean that you do not have a pub-lishable paper and so might need to startwith a different article. So try hard, andyou may have to try very hard, toreplicate.
6. Unlike almost all previous papersyou may have written, do not allocatespace in your paper in proportion to howmuch work you put in accomplishingeach task. The point of this paper is tomake your scholarly point, not to showhow smart you are. This paper shouldnot be about you or a report of what youdid; it should be about what you contrib-ute to our collective knowledge about theworld. For example, a large fraction ofyour effort will probably go into replicat-ing a prior result ~and thus getting up tothe cutting edge of the field!, but only inrare cases will that take more than apage or two of your paper. Space in yourpaper should be allocated in proportionto how much of a contribution it makesto changing the minds of someone in theliterature about something important.Thus, for example, if at the end of weekof data analysis you make one importantfinding on last day that would add to orchange the conventional wisdom about asubject, then you should change the title,subject, abstract, introduction, and orga-nization of your paper to focus on thisfinding. All your other efforts that, de-spite your best efforts, led to dead endsshould be excluded from your paper un-
less they help you demonstrate this onekey point. Resist the temptation to in-clude all this just to demonstrate howmuch work you did; that’s not the crite-rion on which you will be judged in thisclass ~or afterwards!. This task is a cru-cial aspect of your socialization into theprofession, and your success requires thatyou learn it at some point. It might aswell be now.
7. After replicating the article, followthe logic of King, Tomz, and Wittenberg~2000! and try to improve the presenta-tion of the original results. See whetheryou can find useful, additional, or evencontradictory information not discussedin the article without changing any as-sumptions in the original paper. If youare able to do this, then you need notdefend anything other than your methodof presentation, which would put you onvery strong grounds in your claim forjournal space. You may find Zelig ~Imai,King, and Lau 2004! or Clarify ~Tomz,Wittenberg, and King 2003! softwarehelpful in calculating new quantities ofinterest from the same model.
8. Next, you should run some con-trolled methodological experiments de-signed to advance the state of knowledgeabout the substantive project. That is,make one improvement, or the smallestnumber of improvements possible to pro-duce new results, and show the results sothat we can attribute specific changes insubstantive conclusions to particularmethodological changes. ~Improvementscan include changing the way the authordealt with missing data, selection bias,omitted variable bias, the model specifi-cation, differential item functioning, thefunctional form, etc., adding control vari-ables or better measures, extending thetime series and conducting out-of-sampletests, applying a better statistical model,etc.! If you are able to produce an inter-esting substantive result that is differentfrom the original article, with only onecompletely justifiable methodologicalchange, then you only need to defendthis change fully and carefully.
9. If you are able to improve orchange the author’s results in some im-portant way with the minimal changenecessary ~and that is maximally justifi-able!, write that up separately. Then, in aseparate section, go ahead and make allthe changes you think are desirable andsee what difference that makes to yourresults. But make sure the minimalchanges necessary to produce the newconclusions are described and justifiedfirst with results fully presented. Onceyou’ve done that, then you’re home freein your quest for journal space. The restare further improvements that you willhave much more free reign to explore as
120 PS January 2006
you see fit. But if it turns out that allthese other changes don’t change anysubstantive conclusions, then leave themout or report on them very briefly.
10. Provide evidence that your modelfits the data in and out of sample ~orperhaps that it fits better than the modelin the original article!. For example, arethe probabilistic assumptions implied byyour model correct? Do 95% of the datapoints fall within the 95% confidenceintervals? Are you able to predict a set-aside test set from the rest of the datawith the predicted level of uncertainty?You can test this for regression models,logistic models, and all other models.The basic idea is the same as any scien-tific analysis: look for as many observ-able implications of your theory aspossible and to check those ~King, Keo-hane, and Verba 1994!.
11. Understand your raw data prior tostatistical modeling, and help your read-ers do so. Include graphics or descriptivestatistics to help in this goal. Givingsome concise sense of the data while youare describing the variables is a usefulspace saving device.
Ground Rules1. The paper must be coauthored with
another member of this class.
~a! Why? Although papers are rarelycoauthored in school, almost half of allpolitical science articles are, which is aseven-fold increase since the 1950s~Fisher et al. 1998!. This class is aboutresearch as it is actually practiced in thefield.
~b! What if your coauthor doesn’t carryhis or her weight? Deal with it some-how, and make your best individual ef-fort even if it is asymmetric. You willhave to deal with this when you gradu-ate too. Your goal ~and given task! is tomake your paper as good as possible,and you have at your disposal your ef-fort and whatever effort you can marshalfrom your coauthor. In most of the so-cial sciences, credit is not dividedamong the coauthors: each coauthor getsalmost full credit for the entire paper.4
As long as you’re getting credit for whatyou’re doing, it doesn’t hurt you forsomeone else to have more credit thanhe or she deserves.
~c! But, some might scream, “it’s notfair to share credit equally!” With all thetime and mental energy you could de-vote to developing normative standardsto apply to your collaborators, you couldwrite another article. That would be a lotbetter for you and your career, and it
will have the side benefit for the rest ofus of making you a lot more fun to hangout with. It’s also not fair that somecame to this class with better mathskills, or get to ski more often than I do,but such is life. A normative standardthat is much more in your career interestis to ask yourself instead only: Is yourcoauthor making a positive contributionto your paper? If it’s a positive contribu-tion, then you’re getting something outof your collaboration. Be thankful.
2. The authors on your paper shouldbe listed alphabetically, which ~in mostsocial sciences! conveys equal contribu-tions, or that everyone was a full-fledgedmember of the research team. Customsin public health and medicine, and insome other areas, usually give mostcredit to the first-named author, but it ispossible even in those fields to convey toreaders that contributions were equal,such as via explanatory footnotes ~e.g.,“authors were listed alphabetically”!. Getthese issues out of the way quickly sothey don’t affect your work.
3. Papers should be no longer thanabout 20 pages ~double-spaced, one-inchmargins, 12pt, including figures, tables,and references!. Think in terms of ashort research note, not a full-length arti-cle. Journal space is scarce and so thelonger the paper you write, the harder itwill be to publish. If you can do it in 10pages, so much the better.
4. In addition to coauthoring yourpaper, get others to give you writtencomments on a draft version. Why? Thereason academics hang out together inuniversities is not ~necessarily! becausewe like each other; it’s because our workgets better in the process of interacting.When you graduate, you will need tobuild a network of people who will care-fully read your work before you distrib-ute it widely; students in this class oftenform the start of that network for eachother. But it is an implicit quid pro quo:If you want others to read your work,make sure to give them detailed com-ments too.
5. We provide a formal way to provideyou some advice along the way: In class,you will turn in a very early draft of yourpaper with the tables and figures in nearfinal form but relatively little text. You’llalso turn in a replication data set, just asfaculty routinely do. We will then givethis to another student, who will try toreplicate your results ~without talkingwith you!. That student will then write amemo to you about your paper, withcopy to me. In science, we compete toadvance knowledge about the world, notto tear each other down. Thus, the pur-
pose of that memo is not to destroyanyone’s work, but to improve it.
6. Do not ask the author of the pub-lished article whose work you are repli-cating for comments on your paper, anddo not share it with him or her, or any-one outside of this class, until I haveread it and you have revised it accord-ingly. Why? In all likelihood this experi-ence will be your first interaction withthe outside world as a professional aca-demic and, like all academics, as a cer-tain kind of public figure. The academicworld has highly specific, and often un-stated, expectations about a whole hostof matters you may not now perceive,and authors tend to be very sensitiveabout what you write and how you writeit, especially if you find something evenslightly wrong with what they did. Youcan avoid a lot of trouble with a quickreality check. So please come by first.
7. After the paper is revised ~for sub-stance and style! to my satisfaction andyours, it will be much safer for you togo public, and going public then is es-sential. The procedure is, before youshow it to anyone else outside this class,send a copy to the author of the workyou’re replicating or critiquing and re-spectively request comments. When youreceive a response, you should revise,being as generous as possible, but onlyas you think is appropriate. Only at thatpoint should you post the paper on yourweb site and make it fully public, whichyou certainly should do. If your contri-bution still stands, in your view, afterreceiving comments from a wider audi-ence, you should then consider submit-ting the paper to a scholarly journal orpresenting it at a conference. For infor-mation about where to submit your paperand how to do it, come by and we’ll talkabout it.
Style1. Your paper should be rigorously
structured and organized into sectionsand subsections. ~Heading titles shouldbe clear, contain no acronyms, andshould summarize the key point you aremaking in the section. They may benumbered, but the numbers should be inaddition to a substantive title.! The bestway to understand how to organize apaper is to imagine that your readers willrandomly fall asleep at any time for fiveminutes and yet keep turning pages;when they wake up, they should knowexactly where they are from your sub-headings alone. Something like this willsurely happen: Think about what you dowhen you read long, boring textbooks.
You are writing for anonymous refer-ees. Referees are busy people looking
PSOnline www.apsanet.org 121
for a way to finish the thankless ~anony-mous!! task of reviewing your paper asquickly as possible. Since you’re notlikely to have as much time from themas you think, you need to make readingyour paper as easy as possible. And inthis game a tie doesn’t go to the runner:If a referee didn’t read carefully, payattention, or understand you, or missedor misunderstood something importantin your paper, it is your fault. And sinceit is your paper and not you that mat-ters, anonymous referees will not ~andfor the sake of the literature normallyshould not! give an anonymous paperwriter the benefit of the doubt. Anony-mous referees are not normally prone tospontaneous generosity and do not gen-erally impute favorable motives to au-thors who are not clear or imputeappropriate assumptions when you leavethem unstated. ~And this business is noworse than any other: Human beingsacting anonymously in other circum-stances tend not to be especially niceeither. You may have noticed that cars,which have drivers’ identities mostlyobscured, cut each other off all the time,but this almost never happens walkingdown the same streets.!
2. The overall structure of the paper,and all the key points you want to make,should make sense in terms of accom-plishing your goal. If you include manysection breaks it is easier for your read-ers to skip over things they are not inter-ested in while still getting your point; ifyou include too few, they will get lost,and so will your chances at publication.
3. While writing, keep revising the listof section headings until it looks like atable of contents that conveys your keypoint well even if one does not read thepaper.
4. Do not try to hide weaknesses inyour paper. If you know of a problemwith your analysis that you have notsolved, clearly delineate the problem. Ifyou think the problem is not that bad,explain why, but do so honestly. If youhave an idea of how to solve it, buthaven’t done so, offer it as a suggestionfor future researchers. If you don’t knowhow to solve it, suggest that future re-searchers try to tackle it.
Why do you need to be so forthrightwith potential problems? If a reader seesa problem you didn’t mention, you’remaking it possible for them to say “notonly didn’t the author correct this prob-lem, but he or she didn’t even realize itwas a problem!” If all you do is to notethe problem, you can take the edge offthe criticism. This is of course as itshould be, since your paper will also bea more appropriate scientific statement ofthe problem.
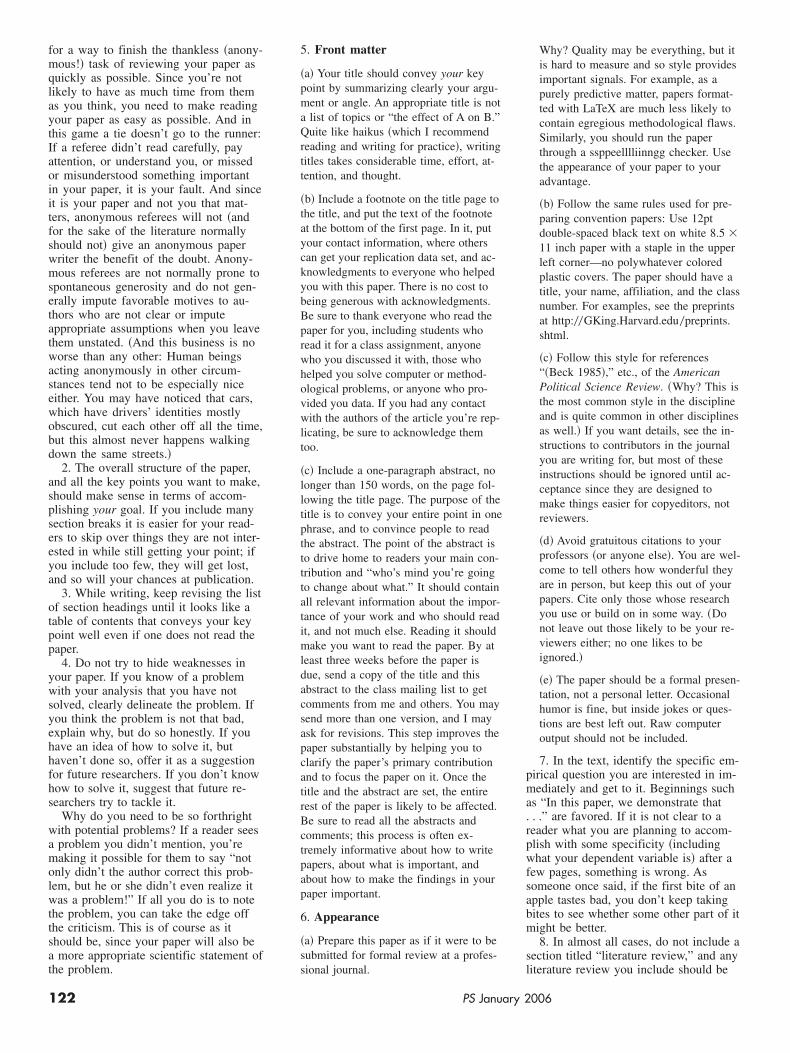
5. Front matter
~a! Your title should convey your keypoint by summarizing clearly your argu-ment or angle. An appropriate title is nota list of topics or “the effect of A on B.”Quite like haikus ~which I recommendreading and writing for practice!, writingtitles takes considerable time, effort, at-tention, and thought.
~b! Include a footnote on the title page tothe title, and put the text of the footnoteat the bottom of the first page. In it, putyour contact information, where otherscan get your replication data set, and ac-knowledgments to everyone who helpedyou with this paper. There is no cost tobeing generous with acknowledgments.Be sure to thank everyone who read thepaper for you, including students whoread it for a class assignment, anyonewho you discussed it with, those whohelped you solve computer or method-ological problems, or anyone who pro-vided you data. If you had any contactwith the authors of the article you’re rep-licating, be sure to acknowledge themtoo.
~c! Include a one-paragraph abstract, nolonger than 150 words, on the page fol-lowing the title page. The purpose of thetitle is to convey your entire point in onephrase, and to convince people to readthe abstract. The point of the abstract isto drive home to readers your main con-tribution and “who’s mind you’re goingto change about what.” It should containall relevant information about the impor-tance of your work and who should readit, and not much else. Reading it shouldmake you want to read the paper. By atleast three weeks before the paper isdue, send a copy of the title and thisabstract to the class mailing list to getcomments from me and others. You maysend more than one version, and I mayask for revisions. This step improves thepaper substantially by helping you toclarify the paper’s primary contributionand to focus the paper on it. Once thetitle and the abstract are set, the entirerest of the paper is likely to be affected.Be sure to read all the abstracts andcomments; this process is often ex-tremely informative about how to writepapers, about what is important, andabout how to make the findings in yourpaper important.
6. Appearance
~a! Prepare this paper as if it were to besubmitted for formal review at a profes-sional journal.
Why? Quality may be everything, but itis hard to measure and so style providesimportant signals. For example, as apurely predictive matter, papers format-ted with LaTeX are much less likely tocontain egregious methodological flaws.Similarly, you should run the paperthrough a ssppeelllliinngg checker. Usethe appearance of your paper to youradvantage.
~b! Follow the same rules used for pre-paring convention papers: Use 12ptdouble-spaced black text on white 8.5 �11 inch paper with a staple in the upperleft corner—no polywhatever coloredplastic covers. The paper should have atitle, your name, affiliation, and the classnumber. For examples, see the preprintsat http:00GKing.Harvard.edu0preprints.shtml.
~c! Follow this style for references“~Beck 1985!,” etc., of the AmericanPolitical Science Review. ~Why? This isthe most common style in the disciplineand is quite common in other disciplinesas well.! If you want details, see the in-structions to contributors in the journalyou are writing for, but most of theseinstructions should be ignored until ac-ceptance since they are designed tomake things easier for copyeditors, notreviewers.
~d! Avoid gratuitous citations to yourprofessors ~or anyone else!. You are wel-come to tell others how wonderful theyare in person, but keep this out of yourpapers. Cite only those whose researchyou use or build on in some way. ~Donot leave out those likely to be your re-viewers either; no one likes to beignored.!
~e! The paper should be a formal presen-tation, not a personal letter. Occasionalhumor is fine, but inside jokes or ques-tions are best left out. Raw computeroutput should not be included.
7. In the text, identify the specific em-pirical question you are interested in im-mediately and get to it. Beginnings suchas “In this paper, we demonstrate that. . .” are favored. If it is not clear to areader what you are planning to accom-plish with some specificity ~includingwhat your dependent variable is! after afew pages, something is wrong. Assomeone once said, if the first bite of anapple tastes bad, you don’t keep takingbites to see whether some other part of itmight be better.
8. In almost all cases, do not include asection titled “literature review,” and anyliterature review you include should be
122 PS January 2006
short and directed toward your pointonly. Other people don’t deserve to becited in your paper unless they help youmake your point; they already have theirown papers. If prior literature doesn’thelp you make your key point, omit it.
9. If you have long technical lists ofcoding rules, or anything else that seemsessential but distracts from your point,put it in an appendix.
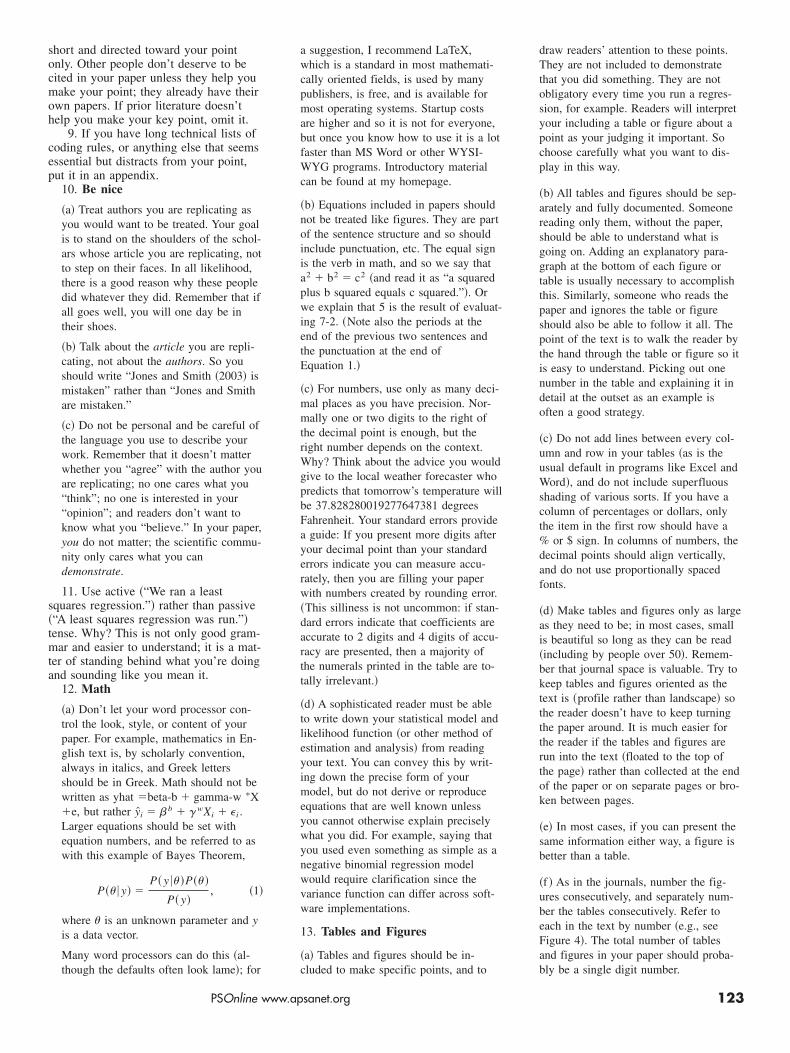
10. Be nice
~a! Treat authors you are replicating asyou would want to be treated. Your goalis to stand on the shoulders of the schol-ars whose article you are replicating, notto step on their faces. In all likelihood,there is a good reason why these peopledid whatever they did. Remember that ifall goes well, you will one day be intheir shoes.
~b! Talk about the article you are repli-cating, not about the authors. So youshould write “Jones and Smith ~2003! ismistaken” rather than “Jones and Smithare mistaken.”
~c! Do not be personal and be careful ofthe language you use to describe yourwork. Remember that it doesn’t matterwhether you “agree” with the author youare replicating; no one cares what you“think”; no one is interested in your“opinion”; and readers don’t want toknow what you “believe.” In your paper,you do not matter; the scientific commu-nity only cares what you candemonstrate.
11. Use active ~“We ran a leastsquares regression.”! rather than passive~“A least squares regression was run.”!tense. Why? This is not only good gram-mar and easier to understand; it is a mat-ter of standing behind what you’re doingand sounding like you mean it.
12. Math
~a! Don’t let your word processor con-trol the look, style, or content of yourpaper. For example, mathematics in En-glish text is, by scholarly convention,always in italics, and Greek lettersshould be in Greek. Math should not bewritten as yhat �beta-b � gamma-w *X�e, but rather [yi � bb � gwXi � ei .Larger equations should be set withequation numbers, and be referred to aswith this example of Bayes Theorem,
P~u6y! �P~ y 6u!P~u!
P~ y!, ~1!
where u is an unknown parameter and yis a data vector.
Many word processors can do this ~al-though the defaults often look lame!; for
a suggestion, I recommend LaTeX,which is a standard in most mathemati-cally oriented fields, is used by manypublishers, is free, and is available formost operating systems. Startup costsare higher and so it is not for everyone,but once you know how to use it is a lotfaster than MS Word or other WYSI-WYG programs. Introductory materialcan be found at my homepage.
~b! Equations included in papers shouldnot be treated like figures. They are partof the sentence structure and so shouldinclude punctuation, etc. The equal signis the verb in math, and so we say thata2 � b2 � c2 ~and read it as “a squaredplus b squared equals c squared.”!. Orwe explain that 5 is the result of evaluat-ing 7-2. ~Note also the periods at theend of the previous two sentences andthe punctuation at the end ofEquation 1.!
~c! For numbers, use only as many deci-mal places as you have precision. Nor-mally one or two digits to the right ofthe decimal point is enough, but theright number depends on the context.Why? Think about the advice you wouldgive to the local weather forecaster whopredicts that tomorrow’s temperature willbe 37.828280019277647381 degreesFahrenheit. Your standard errors providea guide: If you present more digits afteryour decimal point than your standarderrors indicate you can measure accu-rately, then you are filling your paperwith numbers created by rounding error.~This silliness is not uncommon: if stan-dard errors indicate that coefficients areaccurate to 2 digits and 4 digits of accu-racy are presented, then a majority ofthe numerals printed in the table are to-tally irrelevant.!
~d! A sophisticated reader must be ableto write down your statistical model andlikelihood function ~or other method ofestimation and analysis! from readingyour text. You can convey this by writ-ing down the precise form of yourmodel, but do not derive or reproduceequations that are well known unlessyou cannot otherwise explain preciselywhat you did. For example, saying thatyou used even something as simple as anegative binomial regression modelwould require clarification since thevariance function can differ across soft-ware implementations.
13. Tables and Figures
~a! Tables and figures should be in-cluded to make specific points, and to
draw readers’ attention to these points.They are not included to demonstratethat you did something. They are notobligatory every time you run a regres-sion, for example. Readers will interpretyour including a table or figure about apoint as your judging it important. Sochoose carefully what you want to dis-play in this way.
~b! All tables and figures should be sep-arately and fully documented. Someonereading only them, without the paper,should be able to understand what isgoing on. Adding an explanatory para-graph at the bottom of each figure ortable is usually necessary to accomplishthis. Similarly, someone who reads thepaper and ignores the table or figureshould also be able to follow it all. Thepoint of the text is to walk the reader bythe hand through the table or figure so itis easy to understand. Picking out onenumber in the table and explaining it indetail at the outset as an example isoften a good strategy.
~c! Do not add lines between every col-umn and row in your tables ~as is theusual default in programs like Excel andWord!, and do not include superfluousshading of various sorts. If you have acolumn of percentages or dollars, onlythe item in the first row should have a% or $ sign. In columns of numbers, thedecimal points should align vertically,and do not use proportionally spacedfonts.
~d! Make tables and figures only as largeas they need to be; in most cases, smallis beautiful so long as they can be read~including by people over 50!. Remem-ber that journal space is valuable. Try tokeep tables and figures oriented as thetext is ~profile rather than landscape! sothe reader doesn’t have to keep turningthe paper around. It is much easier forthe reader if the tables and figures arerun into the text ~floated to the top ofthe page! rather than collected at the endof the paper or on separate pages or bro-ken between pages.
~e! In most cases, if you can present thesame information either way, a figure isbetter than a table.
~f ! As in the journals, number the fig-ures consecutively, and separately num-ber the tables consecutively. Refer toeach in the text by number ~e.g., seeFigure 4!. The total number of tablesand figures in your paper should proba-bly be a single digit number.
PSOnline www.apsanet.org 123
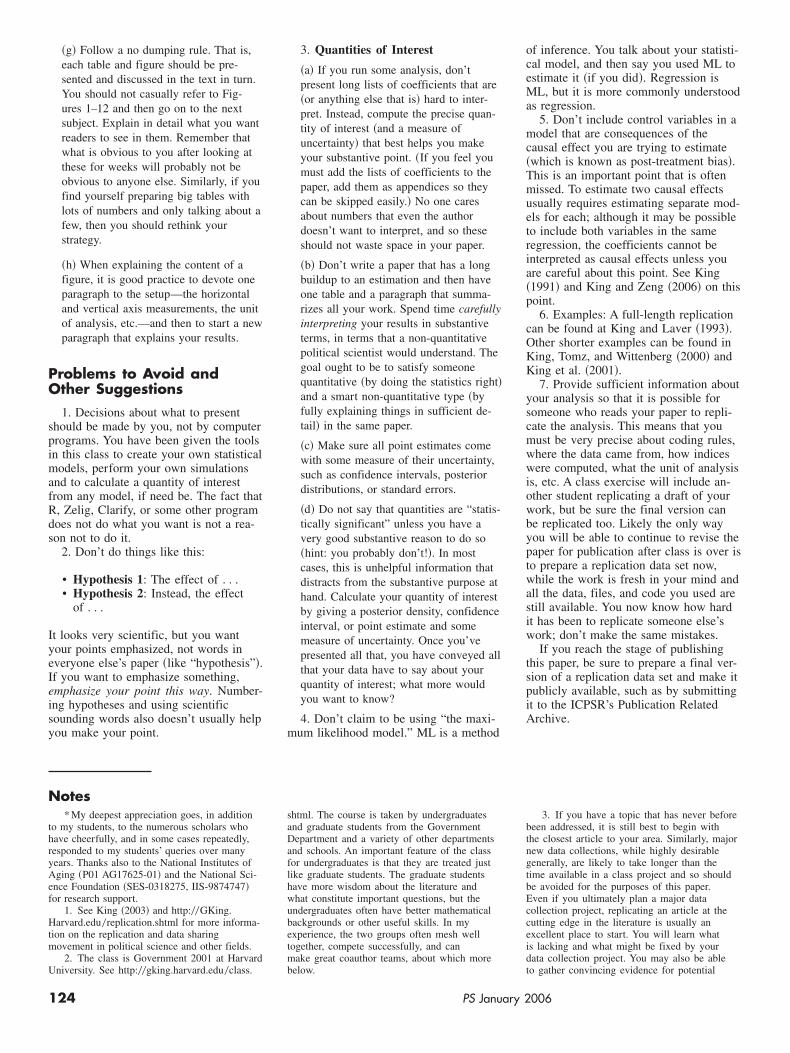
~g! Follow a no dumping rule. That is,each table and figure should be pre-sented and discussed in the text in turn.You should not casually refer to Fig-ures 1–12 and then go on to the nextsubject. Explain in detail what you wantreaders to see in them. Remember thatwhat is obvious to you after looking atthese for weeks will probably not beobvious to anyone else. Similarly, if youfind yourself preparing big tables withlots of numbers and only talking about afew, then you should rethink yourstrategy.
~h! When explaining the content of afigure, it is good practice to devote oneparagraph to the setup—the horizontaland vertical axis measurements, the unitof analysis, etc.—and then to start a newparagraph that explains your results.
Problems to Avoid andOther Suggestions
1. Decisions about what to presentshould be made by you, not by computerprograms. You have been given the toolsin this class to create your own statisticalmodels, perform your own simulationsand to calculate a quantity of interestfrom any model, if need be. The fact thatR, Zelig, Clarify, or some other programdoes not do what you want is not a rea-son not to do it.
2. Don’t do things like this:
• Hypothesis 1: The effect of . . .• Hypothesis 2: Instead, the effect
of . . .
It looks very scientific, but you wantyour points emphasized, not words ineveryone else’s paper ~like “hypothesis”!.If you want to emphasize something,emphasize your point this way. Number-ing hypotheses and using scientificsounding words also doesn’t usually helpyou make your point.
3. Quantities of Interest
~a! If you run some analysis, don’tpresent long lists of coefficients that are~or anything else that is! hard to inter-pret. Instead, compute the precise quan-tity of interest ~and a measure ofuncertainty! that best helps you makeyour substantive point. ~If you feel youmust add the lists of coefficients to thepaper, add them as appendices so theycan be skipped easily.! No one caresabout numbers that even the authordoesn’t want to interpret, and so theseshould not waste space in your paper.
~b! Don’t write a paper that has a longbuildup to an estimation and then haveone table and a paragraph that summa-rizes all your work. Spend time carefullyinterpreting your results in substantiveterms, in terms that a non-quantitativepolitical scientist would understand. Thegoal ought to be to satisfy someonequantitative ~by doing the statistics right!and a smart non-quantitative type ~byfully explaining things in sufficient de-tail! in the same paper.
~c! Make sure all point estimates comewith some measure of their uncertainty,such as confidence intervals, posteriordistributions, or standard errors.
~d! Do not say that quantities are “statis-tically significant” unless you have avery good substantive reason to do so~hint: you probably don’t!!. In mostcases, this is unhelpful information thatdistracts from the substantive purpose athand. Calculate your quantity of interestby giving a posterior density, confidenceinterval, or point estimate and somemeasure of uncertainty. Once you’vepresented all that, you have conveyed allthat your data have to say about yourquantity of interest; what more wouldyou want to know?
4. Don’t claim to be using “the maxi-mum likelihood model.” ML is a method
of inference. You talk about your statisti-cal model, and then say you used ML toestimate it ~if you did!. Regression isML, but it is more commonly understoodas regression.
5. Don’t include control variables in amodel that are consequences of thecausal effect you are trying to estimate~which is known as post-treatment bias!.This is an important point that is oftenmissed. To estimate two causal effectsusually requires estimating separate mod-els for each; although it may be possibleto include both variables in the sameregression, the coefficients cannot beinterpreted as causal effects unless youare careful about this point. See King~1991! and King and Zeng ~2006! on thispoint.
6. Examples: A full-length replicationcan be found at King and Laver ~1993!.Other shorter examples can be found inKing, Tomz, and Wittenberg ~2000! andKing et al. ~2001!.
7. Provide sufficient information aboutyour analysis so that it is possible forsomeone who reads your paper to repli-cate the analysis. This means that youmust be very precise about coding rules,where the data came from, how indiceswere computed, what the unit of analysisis, etc. A class exercise will include an-other student replicating a draft of yourwork, but be sure the final version canbe replicated too. Likely the only wayyou will be able to continue to revise thepaper for publication after class is over isto prepare a replication data set now,while the work is fresh in your mind andall the data, files, and code you used arestill available. You now know how hardit has been to replicate someone else’swork; don’t make the same mistakes.
If you reach the stage of publishingthis paper, be sure to prepare a final ver-sion of a replication data set and make itpublicly available, such as by submittingit to the ICPSR’s Publication RelatedArchive.
Notes* My deepest appreciation goes, in addition
to my students, to the numerous scholars whohave cheerfully, and in some cases repeatedly,responded to my students’ queries over manyyears. Thanks also to the National Institutes ofAging ~P01 AG17625-01! and the National Sci-ence Foundation ~SES-0318275, IIS-9874747!for research support.
1. See King ~2003! and http:00GKing.Harvard.edu0replication.shtml for more informa-tion on the replication and data sharingmovement in political science and other fields.
2. The class is Government 2001 at HarvardUniversity. See http:00gking.harvard.edu0class.
shtml. The course is taken by undergraduatesand graduate students from the GovernmentDepartment and a variety of other departmentsand schools. An important feature of the classfor undergraduates is that they are treated justlike graduate students. The graduate studentshave more wisdom about the literature andwhat constitute important questions, but theundergraduates often have better mathematicalbackgrounds or other useful skills. In myexperience, the two groups often mesh welltogether, compete successfully, and canmake great coauthor teams, about which morebelow.
3. If you have a topic that has never beforebeen addressed, it is still best to begin withthe closest article to your area. Similarly, majornew data collections, while highly desirablegenerally, are likely to take longer than thetime available in a class project and so shouldbe avoided for the purposes of this paper.Even if you ultimately plan a major datacollection project, replicating an article at thecutting edge in the literature is usually anexcellent place to start. You will learn whatis lacking and what might be fixed by yourdata collection project. You may also be ableto gather convincing evidence for potential
124 PS January 2006

funding agencies before you invest a great dealof time.
4. Some partial qualifications: Across all thearticles you write after this class and before you
come up for tenure, try to coauthor with differ-ent people. That way, if there is any question asto your contribution, it will be easy to control
appropriately without collinearity. You shouldprobably limit the total number of coauthors oneach paper to three or four when possible.
ReferencesFisher, Bonnie S., Craig T. Cobane, Thomas M.
Vander Ven, and Francis T. Cullen. 1998.“How Many Authors Does It Take to Publishan Article? Trends and Patterns in PoliticalScience.” PS: Political Science and Politics31~4!: 847–856.
Gleditsch, Nils Petter, Claire Metelits, and Ha-vard Strand. 2003. “Posting Your Data: WillYou be Scooped or Will You be Famous?”International Studies Perspectives 4: 89–97.
Gleditsch, Nils Petter, Patrick James, James LeeRay, and Bruce Russett. 2003. “Editors’ JointStatement: Minimum Replication Standardsfor International Relations Journals.” Inter-national Studies Perspectives 4: 105.
Imai, Kosuke, Gary King, and Olivia Lau. 2004.“Zelig: Everyone’s Statistical Software.”http:00gking.harvard.edu0zelig.
King, Gary. 1991. “ ‘Truth’ is Stranger than Pre-diction, More Questionable Than Causal In-ference.” American Journal of PoliticalScience 35~November!: 1047–1053. http:00
gking.harvard.edu0files0abs0truth-abs.shtml.
_. 1995. “Replication, Replication.” PS:Political Science and Politics 28~Septem-ber!: 443–499. http:00gking.harvard.edu0files0abs0replication-abs.shtml._. 2003. “The Future of Replication.” In-
ternational Studies Perspectives 4~February!:443–499. http:00gking.harvard.edu0files0abs0replvdc-abs.shtml.
King, Gary, James Honaker, Anne Joseph, andKenneth Scheve. 2001. “Analyzing Incom-plete Political Science Data: An AlternativeAlgorithm for Multiple Imputation.” Ameri-can Political Science Review 95~March!:49–69. http:00gking.harvard.edu0files0abs0evil-abs.shtml.
King, Gary, and Langche Zeng. 2006. “WhenCan History Be Our Guide? The Pitfalls ofCounterfactual Inference.” InternationalStudies Quarterly. http:00gking.harvard.edu0files0counterf.pdf.
King, Gary, and Michael Laver. 1993. “OnParty Platforms, Mandates, and GovernmentSpending.” American Political ScienceReview 87~September!: 744–750. http:00gking.harvard.edu0files0abs0hoff-abs.shtml.
King, Gary, Michael Tomz, and Jason Witten-berg. 2000. “Making the Most of StatisticalAnalyses: Improving Interpretation and Pre-sentation.” American Journal of PoliticalScience 44~April!: 341–355. http:00gking.harvard.edu0files0abs0making-abs.shtml.
King, Gary, Robert O. Keohane, and SidneyVerba. 1994. Designing Social Inquiry: Sci-entific Inference in Qualitative Research.Princeton: Princeton University Press.
Tomz, Michael, Jason Wittenberg, and GaryKing. 2003. “CLARIFY: Software for Inter-preting and Presenting Statistical Results.”Journal of Statistical Software 8~1!. http:00gking.harvard.edu0stats.shtml.
PSOnline www.apsanet.org 125