Final Pike soil condition report - pir.sa.gov.au
29
Relationship between floodplain black box (Eucalyptus largiflorens) woodlands and soil condition on the Pike River Floodplain. Susan Gehrig and Jason Nicol 29 July 2010 SARDI Publication Number F2010/000634-1 SARDI Research Report Series No. 479
Transcript of Final Pike soil condition report - pir.sa.gov.au

Relationship between floodplain black box
(Eucalyptus largiflorens) woodlands and soil
condition on the Pike River Floodplain.
Susan Gehrig and Jason Nicol
29 July 2010
SARDI Publication Number F2010/000634-1
SARDI Research Report Series No. 479

This Publication may be cited as:
Gehrig, S. L. and Nicol, J.M. (2010). Relationship between floodplain black box (Eucalyptus largiflorens)
woodlands and soil condition on the Pike River Floodplain. South Australian Research and Development
Institute (Aquatic Sciences), Adelaide, 23pp. SARDI Publication Number F2010/000634-1. SARDI
Research Report Series No. 479.
South Australian Research and Development Institute SARDI Aquatic Sciences 2 Hamra Avenue West Beach SA 5024 Telephone: (08) 8207 2400 Facsimile: (08) 8207 5481 http://www.sardi.sa.gov.au Disclaimer. The authors warrant that they have taken all reasonable care in producing this report. The report has been through the SARDI Aquatic Sciences internal review process, and has been formally approved for release by the Chief, Aquatic Sciences. Although all reasonable efforts have been made to ensure quality, SARDI Aquatic Sciences does not warrant that the information in this report is free from errors or omissions. SARDI Aquatic Sciences does not accept any liability for the contents of this report or for any consequences arising from its use or any reliance placed upon it. © 2010 SARDI Aquatic Sciences This work is copyright. Apart from any use as permitted under the Copyright Act 1968 (Cth), no part may be reproduced by any process without prior written permission from the author. Printed in Adelaide July 2010 SARDI Aquatic Sciences Publication Number F2010/000634-1 SARDI Research Report Series Number 479 Authors: Susan Gehrig and Jason Nicol
Reviewers: Kathleen Beyer and Rod Ward
Approved by: Qifeng Ye, Program Leader – Inland Waters & Catchment Ecology
Signed:
Date: 29 July 2010
Distribution: SAMDBNRM Board, MDBA, DENR, DFW and SARDI Aquatic Sciences Library
Circulation: Public Domain
Gehrig and Nicol (2010) Pike River Floodplain soil condition i
Table of Contents
Table of Contents.............................................................................................................................................. i List of Figures ................................................................................................................................................... ii List of Tables.................................................................................................................................................... iii List of Appendices .......................................................................................................................................... iv Acknowledgements .......................................................................................................................................... v Executive Summary ......................................................................................................................................... 1 1 Introduction .............................................................................................................................................. 3 2 Methods ..................................................................................................................................................... 5
2.1 Site selection................................................................................................................................... 5 2.2 Understorey vegetation surveying protocol .............................................................................. 5 2.3 Plant identification and nomenclature ....................................................................................... 5 2.4 Soil analyses .................................................................................................................................... 6 2.5 Data analysis ................................................................................................................................... 6
3 Results ........................................................................................................................................................ 8 3.1 Understorey vegetation................................................................................................................. 8 3.2 Soils.................................................................................................................................................. 8
4 Discussion ...............................................................................................................................................15 4.1 Management implications .......................................................................................................... 16
References........................................................................................................................................................17

Gehrig and Nicol (2010) Pike River Floodplain soil condition ii
List of Figures
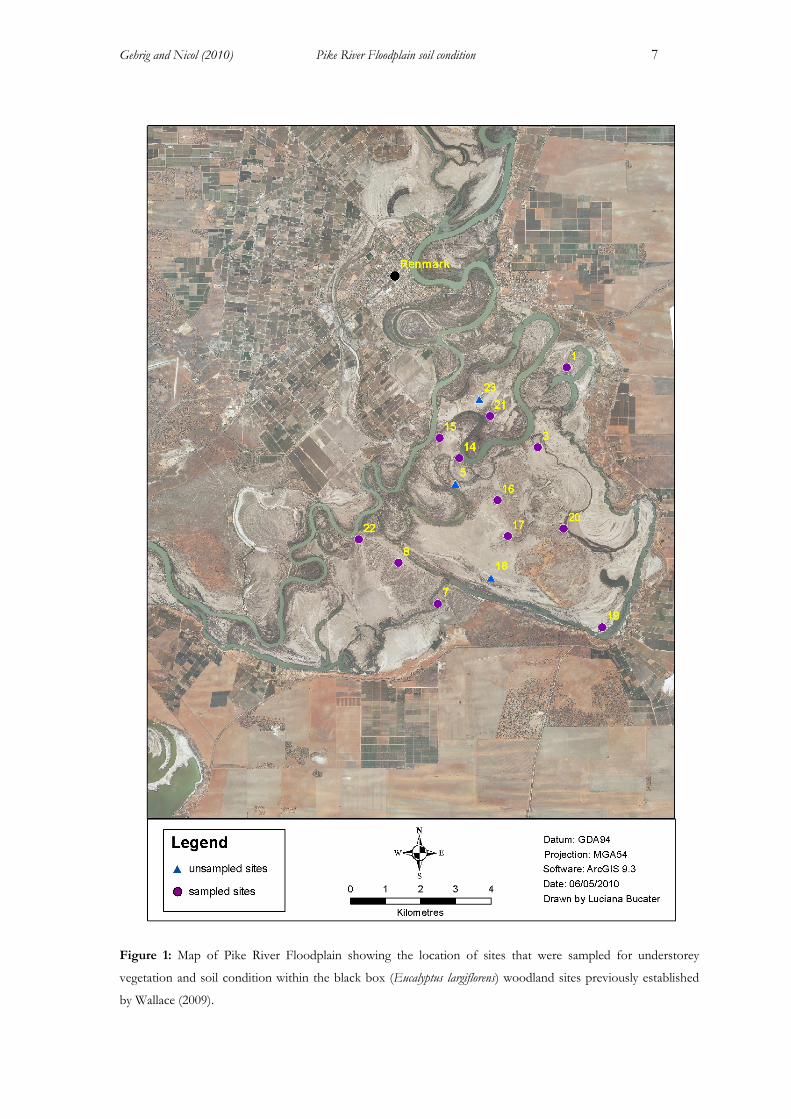
Figure 1: Map of Pike River Floodplain showing the location of sites that were sampled for
understorey vegetation and soil condition within the black box (Eucalyptus largiflorens)
woodland sites previously established by Wallace (2009). ......................................................................7 Figure 2: Group average cluster of black box woodland sites based on soil properties and
percentage ground cover (bare soil, leaf litter and understorey vegetation) on the Pike River
floodplain in 2010..........................................................................................................................................9 Figure 3: NMS ordination comparing percent ground cover (bare soil, leaf litter and
understorey plant species) with soil factors overlayed using Spearman correlation coefficients
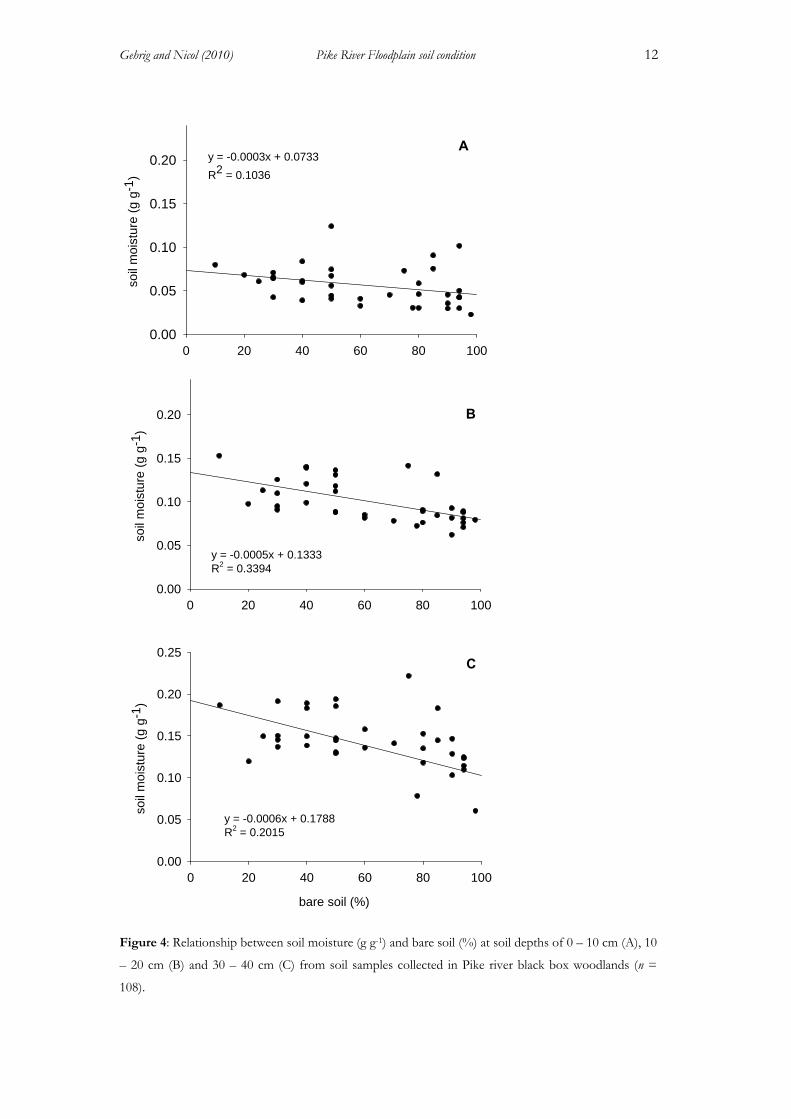
for black box woodland sites on the Pike River Floodplain (stress=0.09). .......................................10 Figure 4: Relationship between soil moisture (g g-1) and bare soil (%) at soil depths of 0 – 10
cm (A), 10 – 20 cm (B) and 30 – 40 cm (C) from soil samples collected in Pike river black box
woodlands (n = 108). ..................................................................................................................................12 Figure 5: Relationship between soil moisture (g g-1) and leaf litter cover (%) at soil depths of 0
– 10 cm (A), 10 – 20 cm (B) and 30 – 40 cm (C) from soil samples collected in Pike river black
box woodlands (n = 108). ..........................................................................................................................13 Figure 6: Relationship between soil moisture (g g-1) and vegetation cover (%) at soil depths of
0 – 10 cm (A), 10 – 20 cm (B) and 30 – 40 cm (C) from soil samples collected in Pike river
black box woodlands (n = 108). ................................................................................................................14

Gehrig and Nicol (2010) Pike River Floodplain soil condition iii
List of Tables
Table 1: Summary of function and benefits of natural organic matter in soil (summarised
from Black 1968). ..........................................................................................................................................5 Table 2: Modified (Braun-Blanquet 1932) scale estimating cover/abundance as per Heard and
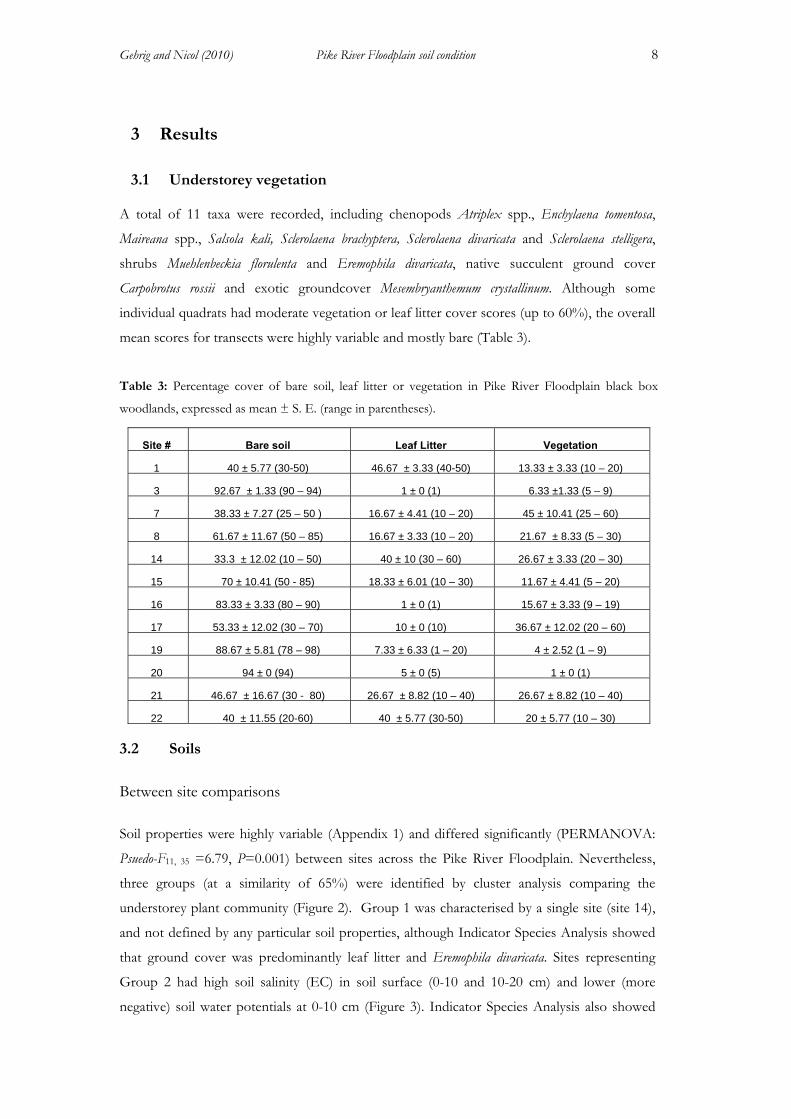
Channon (1997). ............................................................................................................................................5 Table 3: Percentage cover of bare soil, leaf litter or vegetation in Pike River Floodplain black
box woodlands, expressed as mean ± S. E. (range in parentheses). .....................................................8 Table 4: Regression F-statistic results comparing ground cover and soil moisture for each
depth..............................................................................................................................................................11

Gehrig and Nicol (2010) Pike River Floodplain soil condition iv
List of Appendices
Appendix 1: Soil parameter values (mean ± S. E.) for each black box woodland site and soil
depth (cm).....................................................................................................................................................22

Gehrig and Nicol (2010) Pike River Floodplain soil condition v
Acknowledgements
The authors would like to thank Kelly Marsland and Arron Strawbridge for assistance in the
field, Rod Ward for laboratory analysis, Kathleen Beyer, Rod Ward, Brad Hollis and Kelly
Marsland for comments on early drafts of this report and Cheryl and Iain Coombes and Ivan
Marschall for access to their properties. This project was funded by the South Australian
Murray Darling Basin Natural Resources Management Board.

Gehrig and Nicol (2010) Pike River Floodplain soil condition 1
Executive Summary
The Pike River Floodplain is a complex, anabranch system off the main channel of the River
Murray (South Australia) between the townships of Paringa and Lyrup. The system supports a
diversity of aquatic and floodplain habitats. Whilst it is one of the three largest, remaining
floodplain systems on the lower River Murray, its overall condition is at risk due to altered
flow regimes, elevated highly saline groundwater, obstructions to fish passage, grazing and
pest plants and animals. In particular, river red gum (Eucalyptus camaldulensis) and black box (E.
largiflorens) woodlands are in a ‘stressed’ to ‘very poor’ condition (Wallace 2009).
The decline of floodplain eucalypts across the Murray-Darling Basin is not uncommon and is
primarily related to pressures such as desiccation and salinisation of floodplain soils and
secondary pressures such as grazing, climate change, topography, soil type and the presence
and condition of understorey vegetation (MDBC 2003; Overton and Jolly 2004; MDBC 2005).
Therefore, management actions that involve watering (filling temporary wetlands by pumping
or weir pool manipulations) have been found to be an effective intervention tool to arrest the
decline (or improve) floodplain eucalypt condition during periods of low flow (Holland et al.
2009), but these actions are unlikely to be available for the Pike River Floodplain in the short
to medium term. Hence it has been suggested that rain derived soil moisture may be capable
of sustaining floodplain areas in the interim (in particular high elevation black box woodlands),
but very little was known about the relationship between soil condition and black box
woodland condition.
This study investigated soil properties (soil moisture, electrical conductivity, pH and carbon
content) and understorey vegetation condition in black box woodland sites on the Pike River
Floodplain where black box condition was assessed (Wallace 2009). Results showed that soil
condition was highly variable and significantly different between black box woodland sites.
However, a comparison of understorey plant communities by cluster analysis identified three
distinct groups based on cover of plants species and gross organic matter. Group 1 (a single
site) was characterised as having a significantly greater abundance of leaf litter cover compared
to percentage cover of vegetation and/or bare soil. Group 2 sites had high soil salinity (EC) at
the soil surface (<20 cm), lower (more negative) soil water potentials (<10 cm) and a
significantly greater abundance of bare soil. Group 3 sites generally had higher soil moisture,
carbon content and (less negative) water potentials at all depths (compared with sites in Group
2) and significantly higher abundances of the chenopod species Atriplex spp., Enchylaena
tomentosa, Maireana spp. and Sclerolaena stelligera. Hence, soil moisture was significantly and
negatively correlated to bare soil (%), significantly and positively correlated to leaf litter cover,
but no significant relationship was found between soil moisture and understorey vegetation
cover. These results were related to tree health assessments (Wallace 2009) and whilst trees

Gehrig and Nicol (2010) Pike River Floodplain soil condition 2
were generally in stressed, poor or very poor condition the trees at the site in Group 1 were in
better condition than other groups (probably due to high soil moisture and the least negative
water potential). Trees at sites in Group 2 were in the poorest condition probably due to low
soil moisture, high soil salinity and low (most negative) water potentials.
Results show that high leaf litter cover can act as mulch and reduce evaporation from the soil.
Furthermore, the increased soil moisture (compared to bare and vegetated sites) was not
restricted to the top 10 cm of soil. Mulching may prove an effective management technique to
improve (or arrest the decline in) black box condition by reducing evaporation and increasing
water availability. The large areas of eucalypt woodlands, however, make this action
impractical. Therefore, large floods are required to improve floodplain soil moisture, reduce
soil salinity and improve the condition of floodplain eucalypts, especially high elevation black
box woodlands.
Gehrig and Nicol (2010) Pike River Floodplain soil condition 3
1 Introduction
The Pike River floodplain system, situated between the townships of Paringa and Lyrup, is
one of the three largest areas of undeveloped floodplain (~ 67 km-2) in the lower River Murray
(Nicholls 2009; Marsland 2010). Considered a high conservation value aquatic ecosystem
(Commonwealth of Australia 2010), it comprises of numerous ecological assets including a
range of aquatic (permanent fast flowing anabranches, slow flowing anabranches, backwaters
and temporary billabongs) (Ecological Associates 2008; Beyer et al. 2010) and floodplain
habitats including river red gum (Eucalyptus camaldulensis) and black box (E. largiflorens)
woodlands, lignum (Muehlenbeckia florulenta) shrublands, chenopod (Atriplex spp.) shrublands,
herblands and dunes (Ecological Associates 2008; Commonwealth of Australia 2010).
Water continuously flows through two inlets above Lock and Weir number 5, filling Mundic
Creek, the Upper Pike River, associated billabongs and minor creeks, as well as inundating
low-lying woodlands and wetlands (at high water levels), before rejoining the River Murray via
the Lower Pike River (Ecological Associates 2008; Commonwealth of Australia 2010).
Floodplain woodlands are an important component of the Pike River system. Red gum
woodlands are generally located in close proximity to permanent surface or groundwater
sources (e.g. the edges of the main river channel and permanent waterbodies) (Bacon et al.
1993; Cunningham et al. 2009) whilst black box trees are distributed across the floodplain
often forming open woodlands at higher elevations (relative to river red gums) and fringing
ephemeral wetlands and watercourses (Slavich et al. 1999; Overton and Jolly 2004).
Wallace (2009) assessed river red gum and black box condition on the Pike River Floodplain
and whilst some individual trees recorded a “good’ condition score overall tree condition
across the floodplain was either “very poor”, “poor” or “stressed”. These results are not
unusual, since dieback of floodplain eucalypts is currently widespread across the Murray
Darling Basin (MDB) (MDBC 2003; MDBC 2005). Some of the primary drivers affecting tree
condition are related to the desiccation of floodplain soils as a result of the current
hydrological regime imposed by river regulation and abstraction (Thoms and Walker 1993).
Floodplain eucalypts are facultative water users; capable of interchangeably (or simultaneously)
using deep, saline groundwater sources or fresher soil water and/or surface water sources
following flooding and bank recharge (Jolly and Walker 1996; Holland et al. 2006) and high
rainfall and heavy dew episodes (Mensforth et al. 1994; Gehrig 2010). Despite this plasticity in
water use, long-term water deficits (from lack of flooding and/or drought) increase reliance on
groundwater sources, consequently if groundwater sources are unavailable (or saline),
eucalypts may shows signs of dieback as a result of shedding leaves and/or branches to reduce
Gehrig and Nicol (2010) Pike River Floodplain soil condition 4
transpiration (MDBC 2003). In addition to rising saline groundwater, other factors affecting
tree condition include increased salt accumulation in floodplain soils and the prevention of salt
leaching from plant root zones (Jolly et al. 2002). Further compounding pressures include
grazing, drought, topography (high versus low elevation), soil type and the presence and
condition of understorey vegetation (Lane and Associates 2005).
To improve (or arrest the decline of) floodplain eucalypt condition during periods of low flow,
regular watering (filling temporary wetlands by pumping, weir pool manipulations or, where
possible, gravity feeding) is an effective management intervention tool (Holland et al. 2009). In
particular, river management strategies that frequently replenish low-salinity soil-water
sources beyond the immediate zone of river margins are likely to improve the persistence
and regeneration of both native riparian and floodplain communities (George et al. 2005;
Jensen et al. 2008). Unfortunately these actions are not likely to be available for the Pike River
floodplain in the short to medium term (Brad Hollis, pers. comm.). However, there may be
potential to improve tree condition, in the short term, without watering interventions. During
the tree condition survey, Wallace (2009) found that many of the trees physiologically
responded to increased water availability (epicormic growth) as a result of rainfall runoff and
subsequent localised groundwater recharge, despite the lack of recent flooding. This was
observed especially in black box trees growing at higher elevations on the edges of the
floodplain.
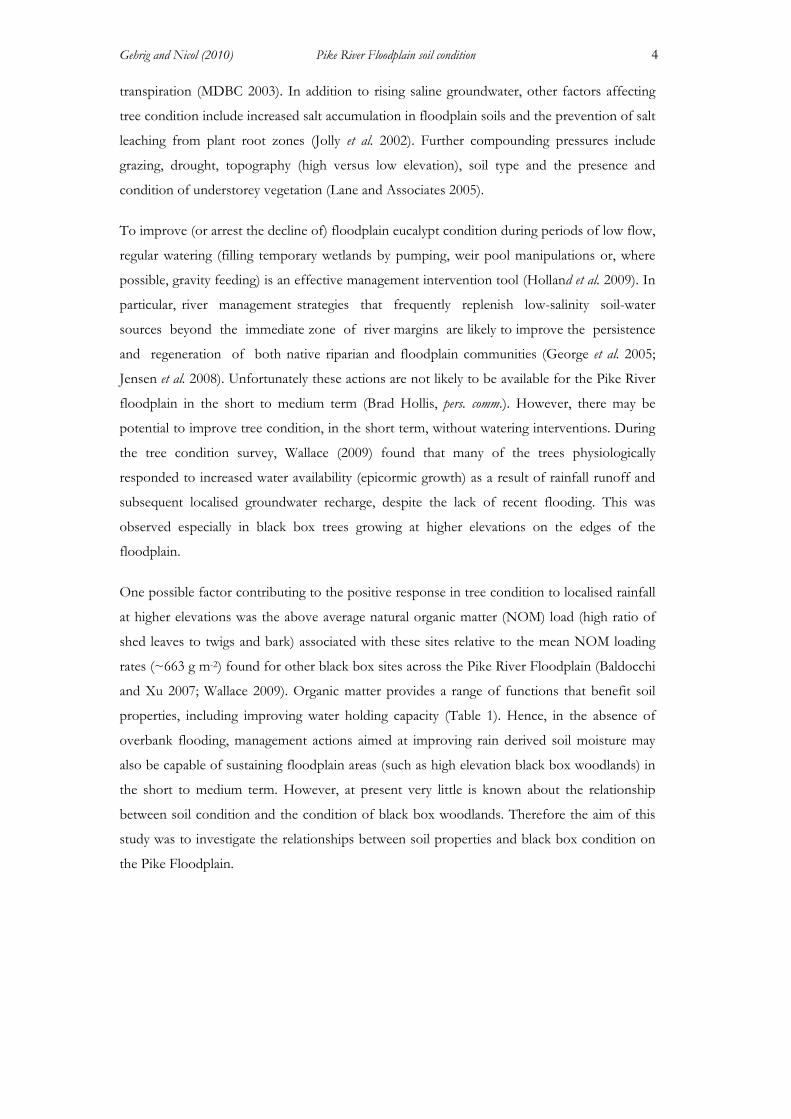
One possible factor contributing to the positive response in tree condition to localised rainfall
at higher elevations was the above average natural organic matter (NOM) load (high ratio of
shed leaves to twigs and bark) associated with these sites relative to the mean NOM loading
rates (~663 g m-2) found for other black box sites across the Pike River Floodplain (Baldocchi
and Xu 2007; Wallace 2009). Organic matter provides a range of functions that benefit soil
properties, including improving water holding capacity (Table 1). Hence, in the absence of
overbank flooding, management actions aimed at improving rain derived soil moisture may
also be capable of sustaining floodplain areas (such as high elevation black box woodlands) in
the short to medium term. However, at present very little is known about the relationship
between soil condition and the condition of black box woodlands. Therefore the aim of this
study was to investigate the relationships between soil properties and black box condition on
the Pike Floodplain.

Gehrig and Nicol (2010) Pike River Floodplain soil condition 5
Table 1: Summary of function and benefits of natural organic matter in soil (summarised from Black 1968).
Function Benefit Physical Binds soil particles in stable aggregates Influences water holding capacity and aeration Minimises soil temperature fluctuations Chemical Allows cation exchange Buffers pH Binds heavy metals and pesticides Biological food source for microbes and small animals major reservoir of plant nutrients
2 Methods
2.1 Site selection
Sites were selected from black box woodland sites assessed by Wallace (2009) (Figure 1), in
areas with silty loam/clay soils that are common throughout the Pike River Floodplain. Sites
in areas with sandy soils were excluded to avoid confounding effects of soil texture.
2.2 Understorey vegetation surveying protocol
Three 2 x 5 m quadrats (separated by 1 m) were established at the centre of each site. Cover
and abundance of each species present, leaf litter and bare soil within each quadrat were
estimated using the method outlined in Heard and Channon (1997), except that the scores N
and T were replaced by 0.1 and 0.5 to enable statistical analyses (Table 2).
Table 2: Modified (Braun-Blanquet 1932) scale estimating cover/abundance as per Heard and Channon
(1997).
Score Modified Score Description
N 0.1 Not many, 1-10 individuals
T 0.5 Sparsely or very sparsely present; cover very small (less than 5%)
1 1 Plentiful but of small cover (less than 5%)
2 2 Any number of individuals covering 5-25% of the area
3 3 Any number of individuals covering 25-50% of the area
4 4 Any number of individuals covering 50-75% of the area
5 5 Covering more than 75% of the area
2.3 Plant identification and nomenclature
Plants were identified using keys in Cunningham et al. (1981), Jessop et al. (2006) and Jessop
and Tolken (1986). In some cases plants were identified to genus only due to immature
individuals or lack of floral structures. Nomenclature follows Barker et al. (2005).
Gehrig and Nicol (2010) Pike River Floodplain soil condition 6
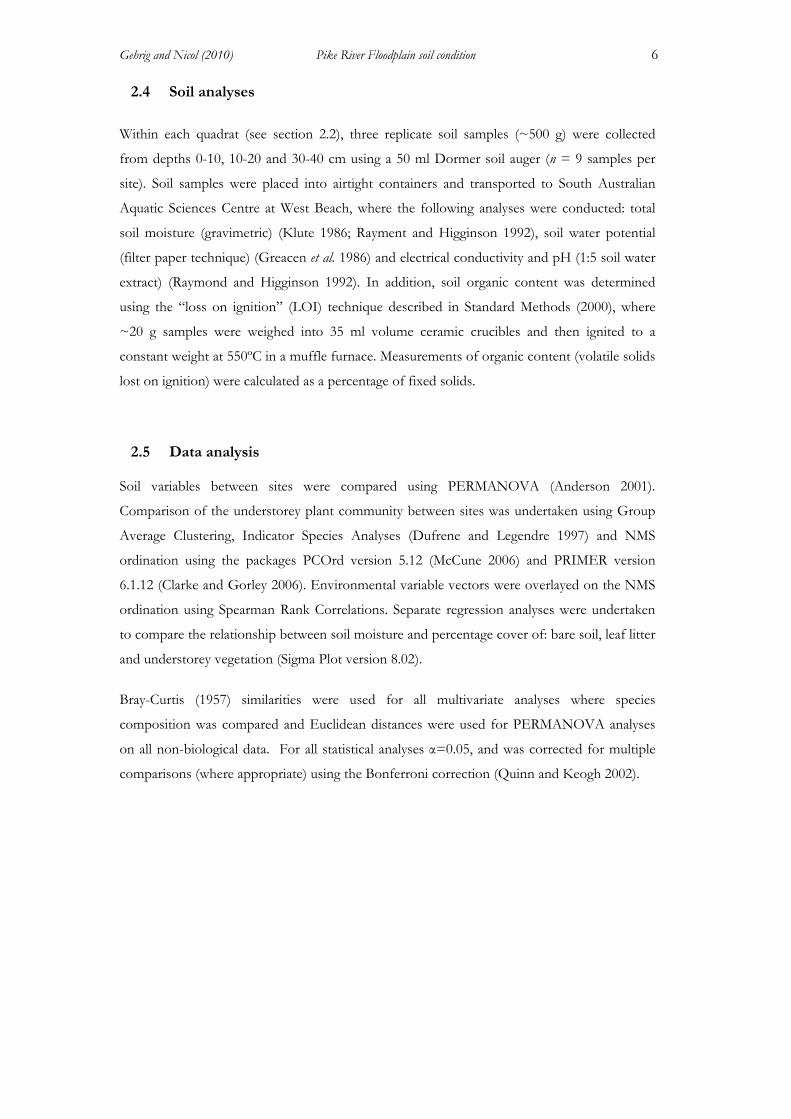
2.4 Soil analyses
Within each quadrat (see section 2.2), three replicate soil samples (~500 g) were collected
from depths 0-10, 10-20 and 30-40 cm using a 50 ml Dormer soil auger (n = 9 samples per
site). Soil samples were placed into airtight containers and transported to South Australian
Aquatic Sciences Centre at West Beach, where the following analyses were conducted: total
soil moisture (gravimetric) (Klute 1986; Rayment and Higginson 1992), soil water potential
(filter paper technique) (Greacen et al. 1986) and electrical conductivity and pH (1:5 soil water
extract) (Raymond and Higginson 1992). In addition, soil organic content was determined
using the “loss on ignition” (LOI) technique described in Standard Methods (2000), where
~20 g samples were weighed into 35 ml volume ceramic crucibles and then ignited to a
constant weight at 550ºC in a muffle furnace. Measurements of organic content (volatile solids
lost on ignition) were calculated as a percentage of fixed solids.
2.5 Data analysis
Soil variables between sites were compared using PERMANOVA (Anderson 2001).
Comparison of the understorey plant community between sites was undertaken using Group
Average Clustering, Indicator Species Analyses (Dufrene and Legendre 1997) and NMS
ordination using the packages PCOrd version 5.12 (McCune 2006) and PRIMER version
6.1.12 (Clarke and Gorley 2006). Environmental variable vectors were overlayed on the NMS
ordination using Spearman Rank Correlations. Separate regression analyses were undertaken
to compare the relationship between soil moisture and percentage cover of: bare soil, leaf litter
and understorey vegetation (Sigma Plot version 8.02).
Bray-Curtis (1957) similarities were used for all multivariate analyses where species
composition was compared and Euclidean distances were used for PERMANOVA analyses
on all non-biological data. For all statistical analyses α=0.05, and was corrected for multiple
comparisons (where appropriate) using the Bonferroni correction (Quinn and Keogh 2002).
Gehrig and Nicol (2010) Pike River Floodplain soil condition 7
Figure 1: Map of Pike River Floodplain showing the location of sites that were sampled for understorey
vegetation and soil condition within the black box (Eucalyptus largiflorens) woodland sites previously established
by Wallace (2009).
Gehrig and Nicol (2010) Pike River Floodplain soil condition 8
3 Results
3.1 Understorey vegetation
A total of 11 taxa were recorded, including chenopods Atriplex spp., Enchylaena tomentosa,
Maireana spp., Salsola kali, Sclerolaena brachyptera, Sclerolaena divaricata and Sclerolaena stelligera,
shrubs Muehlenbeckia florulenta and Eremophila divaricata, native succulent ground cover
Carpobrotus rossii and exotic groundcover Mesembryanthemum crystallinum. Although some
individual quadrats had moderate vegetation or leaf litter cover scores (up to 60%), the overall
mean scores for transects were highly variable and mostly bare (Table 3).
Table 3: Percentage cover of bare soil, leaf litter or vegetation in Pike River Floodplain black box
woodlands, expressed as mean ± S. E. (range in parentheses).
Site # Bare soil Leaf Litter Vegetation
1 40 ± 5.77 (30-50) 46.67 ± 3.33 (40-50) 13.33 ± 3.33 (10 – 20)
3 92.67 ± 1.33 (90 – 94) 1 ± 0 (1) 6.33 ±1.33 (5 – 9)
7 38.33 ± 7.27 (25 – 50 ) 16.67 ± 4.41 (10 – 20) 45 ± 10.41 (25 – 60)
8 61.67 ± 11.67 (50 – 85) 16.67 ± 3.33 (10 – 20) 21.67 ± 8.33 (5 – 30)
14 33.3 ± 12.02 (10 – 50) 40 ± 10 (30 – 60) 26.67 ± 3.33 (20 – 30)
15 70 ± 10.41 (50 - 85) 18.33 ± 6.01 (10 – 30) 11.67 ± 4.41 (5 – 20)
16 83.33 ± 3.33 (80 – 90) 1 ± 0 (1) 15.67 ± 3.33 (9 – 19)
17 53.33 ± 12.02 (30 – 70) 10 ± 0 (10) 36.67 ± 12.02 (20 – 60)
19 88.67 ± 5.81 (78 – 98) 7.33 ± 6.33 (1 – 20) 4 ± 2.52 (1 – 9)
20 94 ± 0 (94) 5 ± 0 (5) 1 ± 0 (1)
21 46.67 ± 16.67 (30 - 80) 26.67 ± 8.82 (10 – 40) 26.67 ± 8.82 (10 – 40)
22 40 ± 11.55 (20-60) 40 ± 5.77 (30-50) 20 ± 5.77 (10 – 30)
3.2 Soils
Between site comparisons
Soil properties were highly variable (Appendix 1) and differed significantly (PERMANOVA:
Psuedo-F11, 35 =6.79, P=0.001) between sites across the Pike River Floodplain. Nevertheless,
three groups (at a similarity of 65%) were identified by cluster analysis comparing the
understorey plant community (Figure 2). Group 1 was characterised by a single site (site 14),
and not defined by any particular soil properties, although Indicator Species Analysis showed
that ground cover was predominantly leaf litter and Eremophila divaricata. Sites representing
Group 2 had high soil salinity (EC) in soil surface (0-10 and 10-20 cm) and lower (more
negative) soil water potentials at 0-10 cm (Figure 3). Indicator Species Analysis also showed

Gehrig and Nicol (2010) Pike River Floodplain soil condition 9
that sites in Group 2 had a significantly higher abundance of bare soil. NMS ordination
showed that Group 3 sites generally had higher soil moisture, carbon content and water
potentials at all depths (Figure 3). Indicator Species Analysis showed that Group 3 sites had
significantly high abundances of the chenopod species Atriplex spp., Enchylaena tomentosa,
Maireana spp. and Sclerolaena stelligera.
Figure 2: Group average cluster of black box woodland sites based on soil properties and percentage
ground cover (bare soil, leaf litter and understorey vegetation) on the Pike River floodplain in 2010.

Gehrig and Nicol (2010) Pike River Floodplain soil condition 10
Figure 3: NMS ordination comparing percent ground cover (bare soil, leaf litter and understorey plant species) with soil factors overlayed using Spearman correlation coefficients for
black box woodland sites on the Pike River Floodplain (stress=0.09).
Dendrogram GroupGroup 3Group 2Group 1
1
3
7
8
14
1516
17
1920
21
22
Soil Moisture 0-10
Soil Moisture 10-20
Soil Moisture 30-40
Water Potential 0-10
Water Potential 10-20
Water Potential 30-40
Conductivity 0-10
Conductivity 10-20
pH 0-10
pH 30-40Carbon 0-10Carbon 10-20
Carbon 30-40

Gehrig and Nicol (2010) Pike River Floodplain soil condition 11
Within site comparisons
Within sites, soil moisture ranged from 0.028 to 0.096 g g-1 at the surface (0 – 10 cm) and
increased with depth (10 – 20cm: 0.076 to 0.141 g g-1 and 30-40 cm: 0.095 - 0.192 g g-1)
(Appendix 1). Conductivity was also higher at the surface (0 – 10 cm: 850 - 7678 μS.cm-1) and
decreased with depth (10 – 20 cm: 1175 - 6610 μS.cm-1; 30 – 40 cm: 1147 – 5948 μS.cm-1).
Similarly, carbon content tended to be higher in the surface layer (range 0-10 cm: 3.57-
11.46%) than in the deeper layers (10-20 cm: 3.2 -7.24% and 30-40 cm: 2.92 - 4.95%).
Alternatively, soil water potentials were lower (more negative) at the soil surface (range 0-10
cm: -99.23 to -207.74 MPa) compared to the deeper layers (10 – 20 cm: -63.13 to -5.69 MPa
and 30 – 40 cm: -1.20 to -15.60 MPa). There were no general trends between pH and soil
depth within sites. At sites 8 and 17, pH decreased with increasing depth, whereas pH
increased with increasing depth for the remaining sites (Appendix 1).
Soil moisture and ground cover relationships
There was a significant negative (r2 = 0.1 to 0.34) relationship between soil moisture and bare
soil (%) for all depths (Table 4; Figure 4). In contrast there was a significant positive, (r2 = 0.2
to 0.42) relationship between soil moisture and leaf litter cover (%) for all depths (Table 4;
Figure 5). However, there was no significant relationship between vegetation cover and soil
moisture at any depth (Table 4; Figure 1).
Table 4: Regression F-statistic results comparing ground cover and soil moisture for each depth.
Ground cover Soil Depth df F P
0‐10 cm 1, 35 3.9 0.50
10 ‐20 cm 1, 35 17.47 0.0002
Bare Soil
30 – 40 cm 1, 35 8.58 0.006
0‐10 cm 1, 35 8.73 0.006
10 ‐20 cm 1, 35 24.85 <0.001
Leaf Litter
30 – 40 cm 1, 35 9.01 0.005
0‐10 cm 1, 35 0.063 0.810
10 ‐20 cm 1, 35 2.47 0.125
Vegetation
30 – 40 cm 1, 35 2.12 0.145
Gehrig and Nicol (2010) Pike River Floodplain soil condition 12
0 20 40 60 80 100
soil
moi
stur
e (g
g-1
)
0.00
0.05
0.10
0.15
0.20
bare soil (%)
0 20 40 60 80 100
soil
moi
stur
e (g
g-1
)
0.00
0.05
0.10
0.15
0.20
0.25
0 20 40 60 80 100
soil
moi
stur
e (g
g-1
)
0.00
0.05
0.10
0.15
0.20
A
B
C
y = -0.0003x + 0.0733R2 = 0.1036
y = -0.0005x + 0.1333R2 = 0.3394
y = -0.0006x + 0.1788R2 = 0.2015
Figure 4: Relationship between soil moisture (g g-1) and bare soil (%) at soil depths of 0 – 10 cm (A), 10
– 20 cm (B) and 30 – 40 cm (C) from soil samples collected in Pike river black box woodlands (n =
108).

Gehrig and Nicol (2010) Pike River Floodplain soil condition 13
0 20 40 60 80 100
soil
moi
stur
e (g
g-1
)
0.00
0.05
0.10
0.15
0.20
0 20 40 60 80 100
soil
moi
stur
e (g
g-1
)
0.00
0.05
0.10
0.15
0.20
leaf litter cover (%)
0 20 40 60 80 100
soil
moi
stur
e (g
g-1
)
0.00
0.05
0.10
0.15
0.20
0.25
A
B
C
y = 0.0006x + 0.0451R2 = 0.2043
y = 0.0009x + 0.0828R2 = 0.4222
y = 0.0009x + 0.127R2 = 0.2095
Figure 5: Relationship between soil moisture (g g-1) and leaf litter cover (%) at soil depths of 0 – 10 cm
(A), 10 – 20 cm (B) and 30 – 40 cm (C) from soil samples collected in Pike river black box woodlands (n
= 108).

Gehrig and Nicol (2010) Pike River Floodplain soil condition 14
0 20 40 60 80 100
soil
moi
stur
e (g
g-1
)
0.00
0.05
0.10
0.15
0.20
0.25
0 20 40 60 80 100
soil
moi
stur
e (g
g-1
)
0.00
0.05
0.10
0.15
0.20
0.25
vegetation cover (%)
0 20 40 60 80 100
soil
moi
stur
e (g
g-1
)
0.00
0.05
0.10
0.15
0.20
0.25
A
B
C
y = 6E-05x + 0.0552R2 = 0.0018
y = 0.0004x + 0.0926R2 = 0.0679
y = 0.0005x + 0.134R2 = 0.0612
Figure 6: Relationship between soil moisture (g g-1) and vegetation cover (%) at soil depths of 0 – 10
cm (A), 10 – 20 cm (B) and 30 – 40 cm (C) from soil samples collected in Pike river black box
woodlands (n = 108).
Gehrig and Nicol (2010) Pike River Floodplain soil condition 15
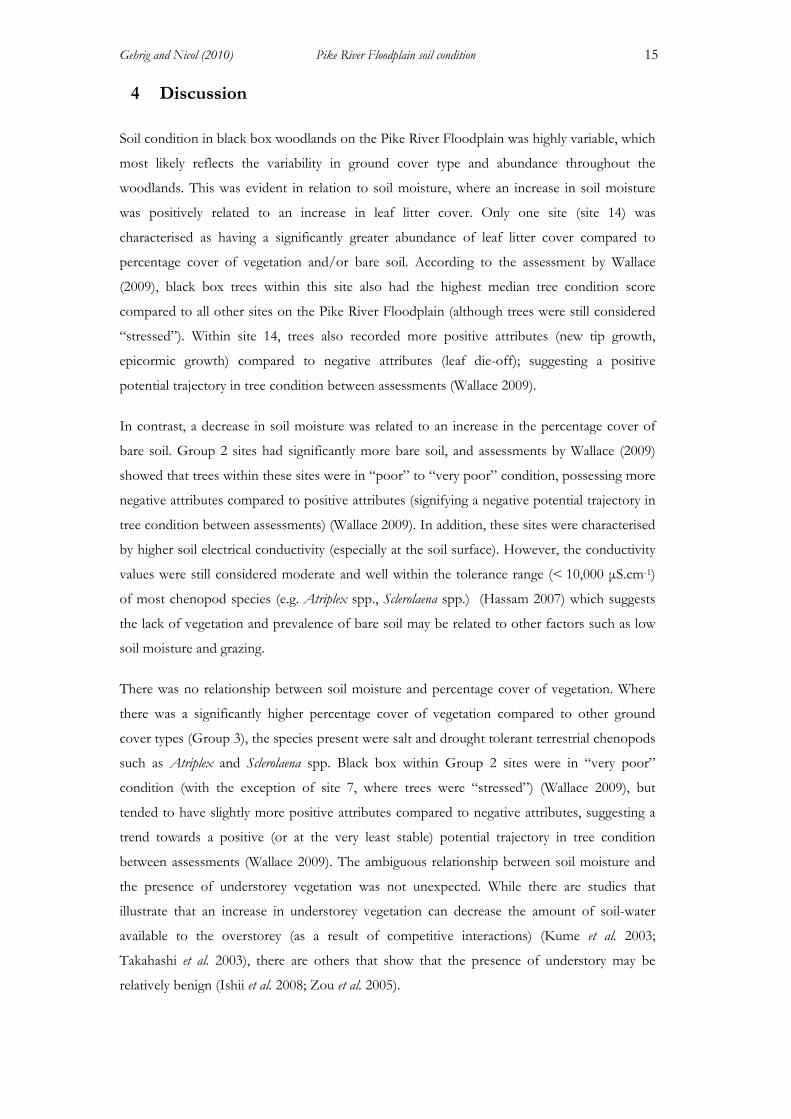
4 Discussion
Soil condition in black box woodlands on the Pike River Floodplain was highly variable, which
most likely reflects the variability in ground cover type and abundance throughout the
woodlands. This was evident in relation to soil moisture, where an increase in soil moisture
was positively related to an increase in leaf litter cover. Only one site (site 14) was
characterised as having a significantly greater abundance of leaf litter cover compared to
percentage cover of vegetation and/or bare soil. According to the assessment by Wallace
(2009), black box trees within this site also had the highest median tree condition score
compared to all other sites on the Pike River Floodplain (although trees were still considered
“stressed”). Within site 14, trees also recorded more positive attributes (new tip growth,
epicormic growth) compared to negative attributes (leaf die-off); suggesting a positive
potential trajectory in tree condition between assessments (Wallace 2009).
In contrast, a decrease in soil moisture was related to an increase in the percentage cover of
bare soil. Group 2 sites had significantly more bare soil, and assessments by Wallace (2009)
showed that trees within these sites were in “poor” to “very poor” condition, possessing more
negative attributes compared to positive attributes (signifying a negative potential trajectory in
tree condition between assessments) (Wallace 2009). In addition, these sites were characterised
by higher soil electrical conductivity (especially at the soil surface). However, the conductivity
values were still considered moderate and well within the tolerance range (< 10,000 μS.cm-1)
of most chenopod species (e.g. Atriplex spp., Sclerolaena spp.) (Hassam 2007) which suggests
the lack of vegetation and prevalence of bare soil may be related to other factors such as low
soil moisture and grazing.
There was no relationship between soil moisture and percentage cover of vegetation. Where
there was a significantly higher percentage cover of vegetation compared to other ground
cover types (Group 3), the species present were salt and drought tolerant terrestrial chenopods
such as Atriplex and Sclerolaena spp. Black box within Group 2 sites were in “very poor”
condition (with the exception of site 7, where trees were “stressed”) (Wallace 2009), but
tended to have slightly more positive attributes compared to negative attributes, suggesting a
trend towards a positive (or at the very least stable) potential trajectory in tree condition
between assessments (Wallace 2009). The ambiguous relationship between soil moisture and
the presence of understorey vegetation was not unexpected. While there are studies that
illustrate that an increase in understorey vegetation can decrease the amount of soil-water
available to the overstorey (as a result of competitive interactions) (Kume et al. 2003;
Takahashi et al. 2003), there are others that show that the presence of understory may be
relatively benign (Ishii et al. 2008; Zou et al. 2005).
Gehrig and Nicol (2010) Pike River Floodplain soil condition 16
Electrical conductivity measurements were generally higher in the upper surfaces compared to
deeper depths, and especially in sites where the abundance of vegetation and leaf litter cover
was minimal and/or absent (Group 2). This most likely reflects a higher rate of evaporation
and concentration of solutes at the surface of bare soil patches. A lack of overbank flooding
and extended drought conditions across the Murray-Darling Basin are also likely to have
contributed to low soil moisture conditions and an associated accumulation of salts in the root
zone of many areas of the Pike River Floodplain (sensu Overton and Doody 2010). Other soil
properties such as pH and total carbon did not appear to influence tree condition.
4.1 Management implications
Wallace (2009) proposed that the black box woodlands within the Pike River Floodplain are
likely to deteriorate without above average rainfall and/or flooding in the next three years and
therefore require direct management intervention. At present, the management action of
watering temporary wetlands is not available for the Pike River Floodplain (especially in the
short to medium-term). However, other management actions, such as stock exclusion and
mulching may maintain or increase soil moisture in the upper surface (>40 cm) and benefit
tree condition.
Rosicky et al.(2006) investigated the effectiveness of stock exclusion and mulching in
facilitating revegetation of degraded floodplain systems (affected by acid sulphate soils) in
New South Wales. In this instance, mulching was found to be the single most important
treatment, significantly increasing understorey vegetation biomass within the first year after
implementation. Mulching treatment also improved soil moisture and salinity, especially in the
upper soil layers (<10 cm). Stock exclusion as a stand alone treatment was found to be the
least effective technique, but revegetation was significantly enhanced when used in
combination with mulching. However, mulching a large area such as the Pike River
Floodplain may only be feasible for small areas. Similarly, revegetation is also not likely to be a
feasible option for the Pike River Floodplain given the low soil moisture. Nevertheless, results
from this study suggest that soil condition has not deteriorated to a point where re-
establishment of floodplain/amphibious species could be achieved by watering or natural
flooding (e.g. salinity values do not exceed tolerance levels of common vegetation species)
(Nicol et al. 2010). Therefore, improvements in black box woodland and understorey
condition are currently dependent on overbank flooding.

Gehrig and Nicol (2010) Pike River Floodplain soil condition 17
References
Anderson MJ (2001) A new method for non-parametric analysis of variance. Austral Ecology 26,
32-46.
Baldocchi DD, Xu L (2007) What limits evaporation from Mediterranean oak woodlands - the
supply of moisture to the soil, physiological control by plants or the demand by the
atmosphere? . Advances in Water Resources 30, 2113-2122.
Barker WR, Barker RM, Jessop JP, Vonow HP (Eds) (2005) 'Census of South Australian
Vascular Plants (5.00 edn).' (Botanic Gardens of Adelaide & State Herbarium: Adelaide)
Beyer K, Marsland K, Sharpe C, Wallace T, Zampatti B, Nicol N (2010) Fish and Fish
Habitats of the Pike River Anabranch and Floodplain Complex. . South Australian Research
and Development Institute (Aquatic Sciences). Adelaide
Black JA (1968). 'Soil-Plant Relationships.' (John Wiley and Sons, Inc.: New York).
Braun-Blanquet J (1932) 'Plant Sociology.' (McGraw-Hill: New York)
Bray JR, Curtis JT (1957) An ordination of the upland forest communities of southern
Wisconsin. Ecological Monographs 27, 325-349.
Clarke KR, Gorley RN (2006) PRIMER version 6.1.12. In. ' 6.1.12 edn. (PRIMER-E Ltd:
Plymouth)
Commonwealth of Australia (2010) Caring for our Country, Business Plan 2010 -11:
Protecting critical aquatic ecosystems: Site 9 -Pike-Mundic wetland complex. Canberra, ACT.
Cunningham GM, Mulham WE, Milthorpe PL, Leigh JH (1981) 'Plants of Western New
South Wales.' 1 edn. (New South Wales Government Printing Office: Sydney) 766
Dufrene M, Legendre P (1997) Species assemblages and indicator species: the need for a
flexible asymmetrical approach. Ecological Monographs 67(3), 345-366.
Ecological Associates (2008) Pike River Floodplain Management Plan. Report for the South
Australian Murray-Darling Basin Natural Resources Management Board Berri, SA.
Gehrig and Nicol (2010) Pike River Floodplain soil condition 18
Ecological Associates (2008 ) Pike River Floodplain Management Plan. Report for the South
Australian Murray-Darling Basin Natural Resources Management Board. Berri, SA.
Gehrig SL (2010) The role of hydrology in determining the distribution patterns of invasive
willows (Salix) and dominant native trees in the Lower River Murray (South Australia). Ph.D.
Thesis, The University of Aadelaide, Australia.
George AK, Walker KF, Lewis MM (2005) Population status of eucalypt trees on the River
Murray floodplain, South Australia. River Research and Applications 21, 271-282.
Greacen EL, Walker GR, Cook PG (1986) Procedure for the filter paper method of
measuring soil water suction. CSIRO Division of Soils, No. 108.
Hassam MG (2007) Understorey vegetation response to artificial flooding frequencies with
reference to environmental factors at temporary wetlands found in the Chowilla Floodplain.
Honours Thesis Thesis, Flinders University of South Australia, Adelaide
Heard L, Channon B (1997) Guide to a native vegetation survey using the biological survey of
South Australia. South Australian Department of Environment and Natural Resources,
Adelaide.
Holland KL, Charles AH, Jolly ID, Overton IC, Gehrig S, Simmons CT (2009) Effectiveness
of artificial watering of a semi-arid saline wetland for managing riparian vegetation health.
Hydrological Processes 23(3474-3484).
Holland KL, Tyerman SD, Mensforth LJ, Walker GR (2006) Tree water sources over
shallow, saline groundwater in the lower River Murray, south-eastern Australia:
implications for groundwater recharge mechanisms Australian Journal of Botany 54, 193-205.
Ishii HT, Kobayashi T, Uemura S, Takahashi K, Hanba YT, Sumida A, Hara T (2008)
Removal of understory dwarf bamboo (Sasa kurilensis) induces changes in water relations
characteristics of overstory Betula ermanii trees. Journal of Forest Research 13, 101-109.
Jensen AE, Walker KF, Paton DC (2008) The role of seedbanks in restoration of floodplain
woodlands. River Research and Applications 24(5), 632-649.
Jessop J, Dashorst GRM, James FR (2006) 'Grasses of South Australia. An illustrated guide to
the native and naturalised species.' (Wakefield Press: Adelaide) 554
Gehrig and Nicol (2010) Pike River Floodplain soil condition 19
Jessop JP, Tolken HR (1986) 'The Flora of South Australia.' 4 edn. (Government of South
Australia Printer: Adelaide) 2248
Jolly I, McEwan J, Walker G, Holland K (2002) Managing groundwater and surface water for
native terrestrial vegetation health in saline areas. CSIRO Land and Water, No. 23/02,
Adelaide.
Jolly ID, Walker GR (1996) Is the field water use of Eucalyptus largiflorens F. Muell. affected by
short-term flooding? Australian Journal of Ecology 21, 173 - 183.
Klute A (1986) Methods of Soil Analysis: Part 1 Physical and Mineralogical Methods. . In 'Soil
Science Society of America.' Madison, WI, USA )
Kume A, Satomura T, Tsuboi N, Chiwa M, Hanba YT, Nakane K, Horikoshi T, Sakugawa H
(2003) Effects of understory vegetation on the ecophysiological characteristics of an overstory
pine, Pinus densiflora. Forest Ecology and Management 176, 195-203.
Lane and Associates (2005) Survey of River Red Gum and Black Box Health Along the River
Murray in New South Wales, Victoria and South Australia - 2004. Report to Murray-Darling
Basin Commission and Department of Land, Water and Biodiversity Conservation (SA):
North Carlton, Victoria
Marsland KB (2010) Pike Floodplain Understorey Vegetation Condition Monitoring 2010
Preliminary Report. South Australian Murray Darling Basin Natural Resource Management
Board. Berri, SA. .
McCune B (2006) Non-parametric habitat models with automatic interactions. Journal of
Vegetation Science 17(6), 819-830.
MDBC (2003) Preliminary Investigations into Observed River Red Gum Decline along the
River Murray below Euston-Technical Report 03/2003. Murray-Darling Basin
Commission: Canberra.
MDBC (2005) Survey of River Red Gum and Black Box Health Along the River Murray in
New South Wales, Victoria and South Australia - 2004. Murray-Darling Basin Commission:
Canberra
Gehrig and Nicol (2010) Pike River Floodplain soil condition 20
Mensforth LJ, Thorburn PJ, Tyerman SD, Walker GR (1994) Sources of water used by
riparian Eucalyputus camaldulensis overlying highly saline groundwater. Oecologia 100, 21-28.
Nicholls E (2009) 'Pike River Reflections: from Dreamtime to 2009.' (Department of Land,
Water and Biodiversity Conservation: Adelaide, South Australia).
Nicol J, Doody T, Overton I (2010). An evaluation of the Chowilla Creek environmental
regulator on floodplain understorey vegetation. South Australian Research and Development
Institute (Aquatic Sciences), Adelaide.
Overton I, Jolly I (2004) Integrated studies of floodplain vegetation health, saline groundwater
and flooding on the Chowilla Floodplain, South Australia. CSIRO Land and Water, No.
20/04, Adelaide.
Overton I, Doody, T (2010) Ecosystem response modelling in the Chowilla Floodplain,
Lindsay and Wallpolla Islands icon site. In 'Ecosystem Response Modelling in the Murray
Darling Basin'. (Eds Saintilan, N. and Overton, I.) pp. 357-372. (CSIRO Publishing:
Collingwood, Victoria).
Quinn GP, Keogh MJ (2002) 'Experimental design and data analysis for biologists.'
(Cambridge University Press: Cambridge) 537
Rayment GE, Higginson FR (1992) 'Australian Laboratory Handbook of Soil and Water
Chemical Methods.' (Inkata Press: Melbourne) 330
Rosicky MA, Slavich PG, Sullivan LA, Hughes M (2006) Techniques for revegetation of acid
sulfate soil scalds in the coastal floodplains of New South Wales,Australia: ridging, mulching
and liming in the absence of stock grazing. Australian Journal of Experimental Agriculture 46,
1589-1600.
Slavich PG, Walker GR, Jolly ID, Hatton TJ, Dawes WR (1999) Dynamics of Eucalyptus
largiflorens growth and water use in response to modified watertable and flooding regimes on
a saline floodplain. Agricultural Water Management 39, 245 - 264.
Standard Methods (2000) Standard Methods for the examination of water and waterwater:
2540 Solids In. Vol. 2010'. (http://standardmethods.org)
Gehrig and Nicol (2010) Pike River Floodplain soil condition 21
Takahashi K, Uemura S, I. SJ, Hara T (2003) Effects of understory dwarf bamboo on soil
water and the growth of overstory trees in a dense secondary Betula ermanii forest, northern
Japan. Ecological Research 18, 767-774.
Thoms MC, Walker KF (1993) Channel changes associated with two adjacent weirs on a
regulated lowland alluvial river. Regulated Rivers: Research and Management 8, 271-284.
Wallace TA (2009) An assessment of tree condition at the Pike Floodplain (South Australia).
A Murray-Darling Freshwater Research Centre report prepared for the SA Murray-Darling
Basin Natural Resources Board. Mildura, Vic.
Zou CB, Barnes PW, Archer S, McMurtry CR (2005) Soil moisture redistribution as a
mechanism of facilitation in savanna tree-shrub clusters. Oecologia 145, 32-40.

Gehrig and Nicol (2010) Pike River Floodplain soil condition 22
Appendix 1: Soil parameter values (mean ± S. E.) for each black box woodland site and soil depth (cm).
Site # Soil depth (cm) Soil Moisture (g g-1) Soil water potential (MPa) Conductivity (μS.cm-1) pH Carbon content (%)
0-10 0.067 ± 0.003 174.70 ± 19.28 7140 ± 341.52 5.67 ± 0.03 6.51 ± 0.28 10-20 0.134 ± 0.004 5.69 ± 0.68 5466.67 ± 419.12 5.89 ± 0.03 5.68 ± 0.49
1
30-40 0.192 ± 0.001 1.20 ± 0.07 4948.33 ± 239.07 6.90 ± 0.03 4.37 ± 0.40 0-10 0.043 ± 0.004 139.11 ± 7.53 7678.33 ± 905.40 6.41 ± 0.09 3.79 ± 0.27
10-20 0.076 ± 0.008 47.86 ± 20.91 6610 ± 299.39 6.21 ± 0.05 3.63 ± 0.12 3
30-40 0.115 ± 0.007 3.67 ± 1.17 5948.33 ± 273.64 5.46 ± 0.11 2.92 ± 0.07 0-10 0.047 ± 0.007 110.56 ± 12.58 1590 ± 101.28 6.54 ± 0.16 6.31 ± 0.05
10-20 0.115 ± 0.003 19.84 ± 2.83 2768.33 ± 408.79 7.38 ± 0.42 4.77 ± 0.08 7
30-40 0.143 ± 0.007 5.42 ± 1.02 3675 ±221.41 8.14 ± 0.46 3.20 ± 0.25 0-10 0.059 ± 0.009 113.12 ± 8.18 2233.33 ± 66.75 5.96 ± 0.12 4.83 ± 0.24
10-20 0.087 ± 0.001 34.50 ± 7.55 2006.67 ± 181.88 5.18 ± 0.14 4.98 ± 0.46 8
30-40 0.141 ± 0.005 2.99 ± 0.19 2023.33 ± 178.78 4.65 ± 0.02 4.33 ± 0.44 0-10 0.096 ± 0.014 99.23 ± 33.96 1858.33 ± 583.14 5.54 ± 0.06 11.46 ± 1.06
10-20 0.141 ± 0.006 9.09 ± 0.76 1496.67 ± 267.12 5.83 ± 0.09 7.24 ± 0.22 14
30-40 0.185 ± 0.001 3.22 ± 0.73 1921.67 ± 133.87 7.51 ± 0.24 4.22 ± 0.02 0-10 0.079 ± 0.006 119.08 ± 22.27 4540 ± 495.13 5.51 ± 0.10 8.32 ± 0.54
10-20 0.130 ± 0.007 6.82 ± 1.95 2778.33 ± 284.49 5.63 ± 0.09 6.16 ± 1.29 15
30-40 0.183 ± 0.022 2.09 ± 0.80 3388.33 ± 292.18 6.41 ± 0.41 4.95 ± 1.24 0-10 0.041 ± 0.005 192.42 ± 10.41 2538.33 ± 227.84 5.73 ± 0.03 4.57 ± 0.16
10-20 0.087 ± 0.005 30.98 ± 7.38 2541.67 ± 282.56 5.48 ± 0.11 4.08 ± 0.16 16
30-40 0.139 ± 0.007 7.09 ± 1.46 2771.67 ± 347.19 4.91 ± 0.18 3.91 ± 0.12 0-10 0.040 ± 0.004 124.58 ± 6.61 2981.67 ± 1145.76 5.63 ± 0.21 4.27 ± 0.16
10-20 0.083 ± 0.004 37.49 ± 5.11 2601.67 ± 849.17 4.94 ± 0.08 4.01 ± 0.19 17
30-40 0.150 ±0.005 4.65 ± 0.90 2788.33 ± 504.46 4.76 ± 0.09 3.98 ± 0.28 0-10 0.028 ± 0.002 207.74 ± 5.47 3246.67 ± 589.60 5.59 ± 0.10 3.57 ± 0.25
10-20 0.078 ± 0.003 20.84 ± 3.49 3978.33 ± 236.22 5.85 ± 0.10 3.20 ± 0.13 19
30-40 0.095 ± 0.026 3.78 ± 1.57 3681.67 ± 847.38 6.56 ± 0.45 2.66 ± 0.23 0-10 0.058 ± 0.022 146.50 ± 14.67 1086.67 ± 174.52 6.32 ± 0.43 4.01 ± 0.17
10-20 0.080 ± 0.005 63.13 ± 18.66 1628.33 ± 214.74 6.17 ± 0.82 4.04 ± 0.22 20
30-40 0.119 ± 0.005 15.60 ± 2.98 2001.67± 217.75 5.44 ± 1.08 4.03 ± 0.13 0-10 0.063 ± 0.002 141.03 ± 24.28 3721.67 ± 1510.74 5.94 ± 0.01 4.08 ± 0.58
10-20 0.098 ± 0.006 40.02 ± 12.67 2283.33 ± 912.65 6.02 ± 0.09 6.33 ± 1.53 21
30-40 0.133 ± 0.008 8.72 ± 3.46 2861.67 ± 339.34 7.29 ± 0.16 3.90 ± 0.53 0-10 0.056 ± 0.008 102.88 ± 24.28 850 ± 184 6.05 ± 0.30 7.46 ± 2.43
10-20 0.094 ± 0.004 34.99 ± 7.93 1175 ± 184 5.64 ± 0.28 5.46 ± 0.75 22
30-40 0.131 ± 0.006 10.55 ± 1.88 1146.67 ±28.51 5.57 ± 0.57 4.22 ± 0.34