Final Mohit Project
46
MALWA COTTON SPINNING MILLS LIMITED Working Capital Management Page 1 PROJECT REPORT ON WORKING CAPITAL MANAGEMENT OF MALWA COTTON SPINNING MILLS LTD IN PARTIAL FULFILMENT OF THE REQUIREMENTS FOR THE AWARD OF DEGREE OF MASTER OF BUSINESS ADMINISTRATION Submitted To Submitted By Mr.V.J. Mahajan Mohit Bembi MBA Roll No. 2312
-
Upload
sonabeta07 -
Category
Documents
-
view
222 -
download
0
Transcript of Final Mohit Project

7/27/2019 Final Mohit Project
http://slidepdf.com/reader/full/final-mohit-project 1/55
MALWA COTTON SPINNING MILLS LIMITED
Working Capital Management Page 1
PROJECT REPORT
ON
WORKING CAPITAL MANAGEMENT OF
MALWA COTTON SPINNING MILLS LTD
IN PARTIAL FULFILMENT OF THE REQUIREMENTS
FOR THE AWARD OF DEGREE OF
MASTER OF BUSINESS ADMINISTRATION
Submitted To Submitted By
Mr.V.J. Mahajan Mohit Bembi
MBA
Roll No. 2312

7/27/2019 Final Mohit Project
http://slidepdf.com/reader/full/final-mohit-project 2/55
MALWA COTTON SPINNING MILLS LIMITED
Working Capital Management Page 2
PREFACE
This project report entitled as WORKING CAPITAL MANAGEMENT in MALWA
COTTON SPINNING MILLS LTD., LUDHIANA that is well known in hosiery
industry was undertaken by me in partial fulfilment of Master of Business
Administration.
The main purpose of this report is to analyse working capital management in Malwa
Cotton Spinning Mills Ltd.I hope this study will prove useful for both academic as
well as practiacal purpose.

7/27/2019 Final Mohit Project
http://slidepdf.com/reader/full/final-mohit-project 3/55
MALWA COTTON SPINNING MILLS LIMITED
Working Capital Management Page 3
ACKNOWLEDGEMENT
Acknowledgement is an endless ocean and one requires to be supported,
guided, inspired and criticized by several specialists in order to drive-out a handful
pearls from its depth. As it comes wordlessly, it cannot be acknowledged in words.At the very outset, I hereby express my gratitude to the management of Malwa
Cotton Spinning Mills Ltd., for granting me permission to undertake my project work
in the organisation and providing me a rich intellectual environment and adequate
facilities which are so essential for writing a project of this kind and also enlighten me
with real working of the company.
I also owe my sincere thanks to Mr.V.J. Mahajan (Asst. Vice President
Finance) for providing me the capable guidance and willing help to undertake my project work.
I am very greatful to finance department for their valuable co-operation, all
employees were friendly towards me and helped me in completing my project report.
At last but not the least I am thankful to my parents and friends who provided
moral support and contributed in completion of my project.
Mohit Bembi

7/27/2019 Final Mohit Project
http://slidepdf.com/reader/full/final-mohit-project 4/55
MALWA COTTON SPINNING MILLS LIMITED
Working Capital Management Page 4
MALWA GROUP
The foundation of Malwa Group (formerly called the VSO Group) was laid by Late
Lala Vidya Sagar Oswal - a visionary known as much for his perspicacity and sharp
business acumen as for his philanthropic pursuits. Driven by a strong desire to achieve
what few in his day & time could have dreamt of, he sowed the seeds of the textile
powerhouse that Malwa has come to be today, built around the cornerstones of
Dedication to Work, Excellence in Product quality & Work Practices, Commitment to
its Customers and Daring to think beyond the ordinary. Today, after having been in
existence for seven decades, Malwa Group has become an over 10,000-member
strong Institution.
The Group is fully integrated in Textiles with interests in Ginning, Spinning,
Weaving, Processing and Garmenting, and is one of the biggest Textile
Conglomerates in the Country. The significant business diversification and the major
international forays towards expansion are proof of the growing international presence
of the Malwa Group.
Further, in line with the vision of its founder, Malwa Group also runs India's secondlargest charitable Cancer Hospital.
GROUP COMPANIES
MALWA INDUSTRIES LIMITED (MIL)
MALWA INDUSTRIES LIMITED (MIL) - Denim arm of the Malwa Group.
In 1997, Mr. Rishi Oswal, the scion of the Oswal family and the Managing Director
of Malwa Industries Limited started the denim manufacturing facility in response tothe increased market demand for Jeans in the 1990's. Commercial operations started

7/27/2019 Final Mohit Project
http://slidepdf.com/reader/full/final-mohit-project 5/55
MALWA COTTON SPINNING MILLS LIMITED
Working Capital Management Page 5
in FY97-98 and since then the company has been growing at a fast pace. Malwa's
premier denim manufacturing plant is located at Ludhiana in the Punjab region, the
heart of the Indian cotton producing belt. Its operations span India (where it is
headquartered), Jordan & Italy. Through these operations, its products are exported to
over 40countries worldwide where these are sold under some of the biggest denim
brands & designer labels that come to mind. With Quality certifications such as the
ISO9001, ISO14001, Oekotex & Woolmark, the name Malwa has, today, become
synonymous with superlative quality & product excellence. In recognition of its
excellent track record in Exports, it has been honoured with Export Performance
Awards by the Govt. of India in recent years.
Equipped with the latest machines imported from Switzerland , Germany , Belgium ,
Italy , Japan & the US , the facility boasts of some of the best equipment the industry
has to offer. With this state-of-the-art technology, MIL achieves a current production
capacity of 20 million meters of denim fabrics & 4.50 million pairs of Jeans annually.
The Jeans manufacturing facility at Jordan (Third Dimension Apparel LLC or more
popularly Petra) boasts of an annual capacity of 4.0million pieces. It has the most
advanced CAD system which helps in optimizing fabric consumption that minimizes
cost, making the product affordable.
The Italian venture (Emmetre) is a fully automated state-of-the-art facility for
Garment Dyeing & Finishing. It caters to the top end of the market and has a client
base comprising of leading designer labels & fashion brands. The facility brings to
Malwa's fold, prized knowledge of emerging fashion trends in denim making MIL a
trendsetter by virtue of this knowledge. This facility also adds 2.5million pieces
annually in capacities to Malwa's denim stable.
Malwa today stands tall & proud of its stature as one amongst a handful of denim
suppliers, globally, to possess capabilities in offering Total Solutions in Denims and
that too from a single point interface.
Oswal Knit India Ltd
Established in 1992, Oswal Knit is the market leader for winter wear in the premiumsegment. Sole Licensee for 'Pringle of Scotland' in India, since 1994, the company

7/27/2019 Final Mohit Project
http://slidepdf.com/reader/full/final-mohit-project 6/55

7/27/2019 Final Mohit Project
http://slidepdf.com/reader/full/final-mohit-project 7/55
MALWA COTTON SPINNING MILLS LIMITED
Working Capital Management Page 7
Malwa Cotton Spinning Mills Ltd. (MCSM)
Malwa Cotton Spinning Mills Ltd or MCSM is among the top ten textile mills in the
Indian sub-continent. The Mills are situated amidst the rich cotton growing belts of
India namely Punjab and Himachal Pradesh in Northern India. The total spindleage of
both the units is around 140000.
The mills are equipped with hi-tech state-of-the-art machineries from world-renowned
textile machinery manufacturers like Rieter, Trutszler, Crossrol, Schlafhorst and
Savio.
All the above process machines are also equipped with latest on-line quality control
equipments combined with computerized information system. World wide recognized
& accepted high-reliability Uster quality control equipments form the core of our
R&D and constant monitoring quality control department.
A strong, skilled workforce of 5000 persons including highly experienced textile
professionals under the dynamic & able leadership of Mr. Jangi Lal Oswal, the Group
Chairman, is committed to meeting the challenges of exacting Global textile
standards. Malwa yarn is well sought after by domestic & international markets. An
ever-growing demand for our products in the global markets is evident from our
expanding export base. Malwa yarn conforms to the most stringent International
Quality standards in production. Thus knotless, flawless & high quality yarn
confirming to uster standards is produced.
We procure the best quality acrylic fiber from world-renowned manufacturers and
produce Acrylic cotton yarn & high bulk Acrylic yarn. Dye house facility at our
Works enables us to produce dyed yarn of exact shades. We also produce polyester

7/27/2019 Final Mohit Project
http://slidepdf.com/reader/full/final-mohit-project 8/55
MALWA COTTON SPINNING MILLS LIMITED
Working Capital Management Page 8
yarn, polyester cotton yarn, viscose yarn, dyed viscose yarn and viscose cotton yarn.
Raw materials like polyester& viscose too are procured only from reputed
manufacturers.

7/27/2019 Final Mohit Project
http://slidepdf.com/reader/full/final-mohit-project 9/55

7/27/2019 Final Mohit Project
http://slidepdf.com/reader/full/final-mohit-project 10/55
MALWA COTTON SPINNING MILLS LIMITED
Working Capital Management Page 10
HISTORY & BRIEF INTRODUCTION OF THE COMPANY
Malwa cotton spinning mills ltd was incorporated in 1976 by Punjab state
development corporation limited and came under joint sector with own group in 1980.
The company has ceased to be in joint sector with this investment by PSIDC of its
shareholding since 1987.
At present the company has spinning unit at Barnala dist. Sangrur. two Unit worsted
spinning and threads unit at Machhiwara, dist. Ludhiana, Punjab and one spinning
unit at Paonta Sahib, Himachal Pradesh.
In 1980 the implementation of spinning unit with a complement of 25000 spindles for
manufacturing of synthetic yarns was taken in hand and completed in March 1983.
After gradual expansion over a period, the capacity of Barnala unit was raised to
49696 spindles in 1990. Looking into good response in the domestic and international
market, in may 1995, the management decided to expand with 25200 spindles at
Barnala under 100% export oriented unit is now deboned.
1 April 1988 the company started implementation of new spinning project with 12480
spindles at Ponta Sahib and with various expansion up to 1995 the capacity of the unit
increased to 63920 spindles.
To give further inputs to profitability & strengthen the bottom lines the management
decided to go for value addition of yarn the company took in hand implementation of
dyeing & processing unit for dyeing of fabric yarns & fiber with a capacity of tonnes
per day at village Harridan, Machhiwara and distt. Ludhiana(Punjab) in april 1998.
The project was completed in 2000 also to harmonize and optimise the operation ; the
hank dyeing unit at Paonta Sahib is also shifted to Machhiwara. The company took up
diversification by setting up of threads capacity in 2001-2002 with 3 tonnes per day
which is increased to 9 tonnes peer day in 2004-2005 for polyester,cotton & other
high value threads. The threads division is set up to consolidate its existing operation
and manufacturing of high value added products.
The company is equipped with most modern plant & machinery like blow roomfrmTRUTZCHLER of Germany, cards froms CROSSROLL of united kingdom, reiter of

7/27/2019 Final Mohit Project
http://slidepdf.com/reader/full/final-mohit-project 11/55
MALWA COTTON SPINNING MILLS LIMITED
Working Capital Management Page 11
Switzerland & Indigenous cards from lakshmi machine works limited, comibatore,
india, autoconers from savio of Italy, draw frames from cherry hara of Japan
indigenous speed frames ang ring frames from lakshmi machine work ltd.
Coimbatore,India and other quality testing facilities like uster tester3 evenness tester,
teno rapid, spinlab, compusoter & classimate 2 from zwelleger uster of Switzerland.
Mcsml is manufacturing a wide range of yarn made from cotton, acrylic, plyster,
viscose woos and other synthetic fibers, the company is manufacturing cotton yarn
bothcarded and combed, acrylic yarn viscose yarn and other blended in dyed and
grey. The production capacity of Barnala unit is 38 tonnes per day and Paonta Sahib
unit 30 tonnes per day. The capacity of dyeing unit at Machhiwara is 12 tpd for cone
dyeing , hank dyeing and fabric dyeing. The sewing threads unit capacity is 9 tonnes
per day. At present the capacity of worsted is 4 tpd.
SOCIAL RESPONSIBILITY
CPP
In 2006 Malwa Commissioned its very own Captive Power
Plant with a capacity of 6 MW. It uses renewable and non
polluting rice husk as fuel. The Plant provides uninterrupted
power supply to Malwa Industries Limited thereby reducing the
high cost of power. Electrostatic Precipitator is installed in
Captive Power Plant for reduction of particulate matter. Air
Pollution Control Devices are also installed in Boiler &
Electrostatic Precipitator (ESP) in order to curb & prevent air
pollution. Green Fuel usage reflects Malwa's dedication towards
cleaner & pollution free environment, while making us more
competitive.
ETP
State of the art Effluent Treatment Plants helps us in using the
effluent treated waters which confirms to the WHO portable
standards. Treated water is used for Horticulture within the acres
of premises thereby maintaining the sprawling green belt in and
around the factory. Malwa in a first of its kind initiative in this
part of the country has partnered with the state government and

7/27/2019 Final Mohit Project
http://slidepdf.com/reader/full/final-mohit-project 12/55
MALWA COTTON SPINNING MILLS LIMITED
Working Capital Management Page 12
local village community wherein treated water from our ETP
shall irrigate about 600 Acres of land in nearby agricultural
fields, leading to conservation of both Water & Electricity.
Cotton Waste generated during manufacturing is diverted tohand Carpet Industry for making World Class Carpets. This
helps in the optimum utilization of resources.
Rain Water Harvesting – Rain water harvesting Plant is installed
within factory premises at Machhiwara near Ludhiana. It stocks
rain water which is provided for irrigation in the near by
agricultural fields, free of cost. Rain water harvesting is believed
to be one of the best methods of replenishing the water table
there by giving back to nature what we take from it. It is yet
another contribution of Malwa towards balancing the ecological
system.
Malwa in a first of its kind initiative in this part of the country
has partnered with the state government and local village
community wherein treated water from our ETP shall irrigate
about 600 Acres of land in nearby agricultural fields, thereby
supporting the local farming community to over come irrigation
problem.
Malwa Group runs a 300 bed Charitable Cancer Hospital at
Ludhiana (Mohan Dai Cancer Hospital ) which has State of Art
facilities. This is second largest Cancer Hospital in the country.
Malwa is also running a School to provide subsidized education
for the children of its employees & workers
Malwa Management organizes Yearly Health Camps for
Community Welfare, attended in large numbers .

7/27/2019 Final Mohit Project
http://slidepdf.com/reader/full/final-mohit-project 13/55
MALWA COTTON SPINNING MILLS LIMITED
Working Capital Management Page 13
Malwa is committed to community development. It actively
participated in the construction of the village Community Hall,
apart from organizing regular sport events for the local village
community.
Women Empowerment : Malwa has employed around 800
women workers from near by villages. These Dependent Girls
who have come from a conservative background from families of
Land Lords & Farmers are now very happy with the step they
have taken to come out and work for Malwa. These girls in their
young age have now transformed themselves into a Confident,
Motivated, Self Independent and Outshining Personalities, apartfrom financially contributing towards their families. Malwa
pursues the policy of No Discrimination on the basis of physical
disability which has resulted in the upliftment of the needy & the
oppressed.
HOSPITAL
MOHAN DAI OSWAL CHARITABLE CANCER HOSPITAL
As part of its philanthropic activities, Malwa also runs a fully equipped
charitable Cancer Hospital atLudhiana (Mohan Dai Oswal Charitable Cancer Hospital
), which is the country's second largest CancerResearch& Care Hospital.
Health Awareness
Mohan Dai Oswal Cancer Treatment & Research Foundation, Ludhiana
· A Charitable Organization· At present it is the biggest cancer center of the northern India equipped with latest state
of art diagnostic & therapeutic equipment
· Marches Ahead by Approaching the Unapproachable by announcing the opening up of
the new City Center – Purana Bazar, Ludhiana
· A Charitable free dispensary at Inder Nagar - Ludhiana
· A Comprehensive Cancer Care Centre &Multispeciality Hospital With continuous
dedication and Commitment for the suffering humanity

7/27/2019 Final Mohit Project
http://slidepdf.com/reader/full/final-mohit-project 14/55
MALWA COTTON SPINNING MILLS LIMITED
Working Capital Management Page 14
Mohan Dai Oswal Cancer Treatment & Research Foundation was established in 1984
as a charitable institution to extend comprehensive quality treatment for cancer to the
masses at an affordable price. It is a 300 bedded hospital located on the Amritsar -
New Delhi G.T. Road near Sherpur bye pass,Ludhiana. It is housed in a multistoried
building. Patient care area is approx. 16,000 sq. Yards spread over 4 floors. In
addition there is a
mechanical laundry, a workshop, shopping areas, residential accommodation for
medical, nursing & paramedical staff and a sarai for poor patients (Free of cost stay).
All these are located at convenient distances from each other. The hospital is located
in an 8-acre plot & has adequate space for future expansion. Over the period the
hospital has developed into a modern, well-equipped comprehensive cancer treatment
center and multispeciality hospital. Clinical services are adequately backed by
investigative and diagnostic divisions.
The hospital registers nearly one-lakh patients in different OPD services every year
and nearly over 8000 annual admission in different specialties yearly.
Being by the specialized comprehensive care center:-
On an average 3, 000 to 3,500 new cancer patients are registered in the hospital
besides regular follow up patients. This number increases by 10% every year. Daily
OPD attendance ranges from 350 to 400 patients (Old and New) These patients
include people from all walks of life not only from Punjab but adjacent northern states
of India including J&K, HP, UP and Haryana.
The hospital has made special endeavors to have outreach programme in the rural as
well as urban areas by opening up free urban dispensary at InderNagar , Ludhiana,
and Charitable City Center at Purana bazaar Ludhiana .The hospital is also having
Collaboration with different charitable hospitals and rural centers, where
postgraduates participate independently for the diagnosis and treatment of the
patient.The post-graduate also take active part in the free medical checkup camps
organized in the rural and urban areas from time to time and they also participate in
the health awareness activities.
It may be of interest to note that we provide the cheapest cancer treatment facilities in
the region. Today the hospital is recognized as a centre of excellence and this
encourages us to make better efforts to reach greater heights in all fields of patientcare. We are thankful to the medical fraternity and people at large without whose faith

7/27/2019 Final Mohit Project
http://slidepdf.com/reader/full/final-mohit-project 15/55
MALWA COTTON SPINNING MILLS LIMITED
Working Capital Management Page 15
and support it would never have been possible, for us to achieve and maintain our
objective of “Maximum Benefits, to largest number at minimum cost ".
Mohan Dai Oswal Cancer Institution is doing a great service to the patients suffering
from dreaded disease of cancer. Besides this it has acquired the status of the
postgraduate institute for having been affiliated by the Diplomat National Board in
various specialties for the post graduate courses.
Karam Yogi Lala Vidya Sagar Oswal
The great warrior, the centurion man Lala vidya Sagar Oswal was born at village
Jodhan, Ludhiana in 1908. Lalaji had a long stressfull journey from a simple layman
to a successful business Tycoon. He started his life as a simpleemployee in a shope.
With his hardwork, patince and intelligence he reached to the higest level of being
cosidered as a doyen of industrial revolution in hosiery in Ludhiana and was
instrumental in bringing Ludhiana on the Industrial manpof the world, known as
Manchester of India.
VSO Group has opened a Institute of information Technology a charitable (No Fee)
Institution in the Memory of Lala Vidya Sagar Oswal.
Opp. Fire Brigade, G.T. Road, Miller Ganj, Ludhiana
7/27/2019 Final Mohit Project
http://slidepdf.com/reader/full/final-mohit-project 16/55
MALWA COTTON SPINNING MILLS LIMITED
Working Capital Management Page 16
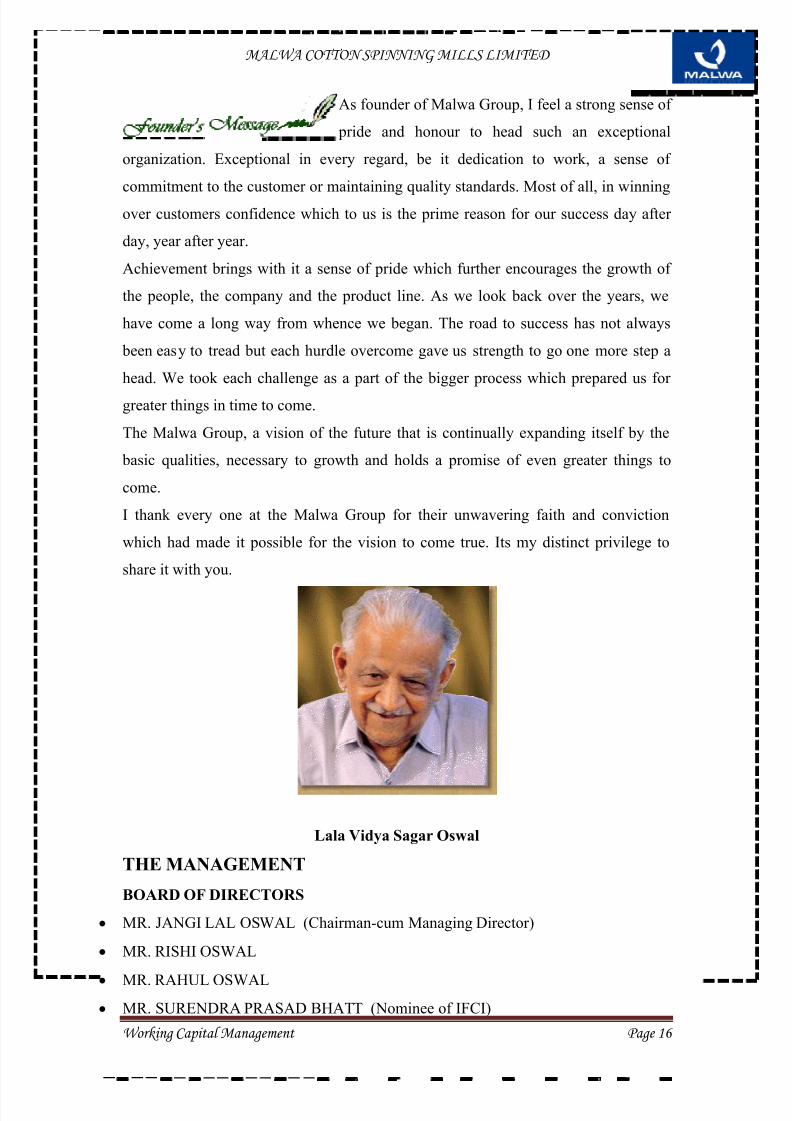
As founder of Malwa Group, I feel a strong sense of
pride and honour to head such an exceptional
organization. Exceptional in every regard, be it dedication to work, a sense of
commitment to the customer or maintaining quality standards. Most of all, in winning
over customers confidence which to us is the prime reason for our success day after
day, year after year.
Achievement brings with it a sense of pride which further encourages the growth of
the people, the company and the product line. As we look back over the years, we
have come a long way from whence we began. The road to success has not always
been easy to tread but each hurdle overcome gave us strength to go one more step a
head. We took each challenge as a part of the bigger process which prepared us for
greater things in time to come.
The Malwa Group, a vision of the future that is continually expanding itself by the
basic qualities, necessary to growth and holds a promise of even greater things to
come.
I thank every one at the Malwa Group for their unwavering faith and conviction
which had made it possible for the vision to come true. Its my distinct privilege to
share it with you.
Lala Vidya Sagar Oswal
THE MANAGEMENT
BOARD OF DIRECTORS
MR. JANGI LAL OSWAL (Chairman-cum Managing Director)
MR. RISHI OSWAL
MR. RAHUL OSWAL MR. SURENDRA PRASAD BHATT (Nominee of IFCI)

7/27/2019 Final Mohit Project
http://slidepdf.com/reader/full/final-mohit-project 17/55
MALWA COTTON SPINNING MILLS LIMITED
Working Capital Management Page 17
MR.YASHPAL BARAR (Nominee od PNB)
MR.SANJAY KUMAR SUROYA (Nominee of IDBI)
MR.G.BANSAL
MR.SURINDER KUMAR VIGAUDITORS
S.C. VASUDEVA & CO., NEW DELHI
BANKERS
Punjab National Bank
State Bank of India
Vijaya Bank
The Jammu & Kashmir Bank Ltd.
IDBI Bank LTd.
IFCI Ltd.
REGISTERED OFFICE
Industrial Area –“A”,
Ludhiana-141003
Punjab
WORKS
1) Village Harigarh,
Raikot Road, Barnala (Punjab)
2) Village Patlian,
Paonta Sahib (Himachal Pradesh)
3) Village Harian, Kohara-Machhiwara Road,
Distt. Ludhiana (Punjab)
AWARDS & RECOGNITION
YEAR AWARDS & RECOGNITION
March 2001 Obtained ISO 9002 certification from BVQI, London
April 2001 Achieved Export-House Status under Government of India
Guidelines

7/27/2019 Final Mohit Project
http://slidepdf.com/reader/full/final-mohit-project 18/55

7/27/2019 Final Mohit Project
http://slidepdf.com/reader/full/final-mohit-project 19/55
MALWA COTTON SPINNING MILLS LIMITED
Working Capital Management Page 19
the Paonta Sahib unit spins out 38 tonnes per day. The product is versatile and finds
use in many different ways in the textile and clothing industry of which it forms the
essential ingredient.
The high quality of the product has carved for itself an export market where all kinds
of cotton yarns, synthetic yarns and their blends are exported. Export growths have
been phenomenal and predict the future trends. Malwa Cotton Spinning Mills Ltd.
have been marked from the beginning to spin a success story of their own.
Our experienced cotton selectors are spread over the cotton belt of Punjab. Control on
quality of cotton is exercised right to keep it contamination free from picking stage.
Cotton is ginned in our modern Ginning Unit comprising of both Saw and Roller Gin.
Each bale passes o ut of Ginning Factory after it meets Malwa s Quality Standards. All
thecontamination free bales produced in our Ginning Factory meet Uster HV1900
Grade.
Cotton is produced in our mills under controlled conditions created by sophisticated
State of Art, Humidity and Textile Air Engineering system produced by Luwa
Humidification System. Each process conforms to stringent quality norms specified
by Textile Research Associations of India.
Our quality assurance department (QAD) has latest equipment like:
Uster HVI-900
Uster Tester-111 with Hairiness Tester
Uster Auto sorter
Uster Tensorapid uster Classimat
Mini Uster
We constantly monitor the quality of the product at various stages of yarn
manufacturing. Our Savio winders are equipped with third generation contamination
control Uster cleaners & coupled with Air spliceIn Lacs.
The Knotless, Flawless & High Quality yarn confirming to Uster Standards is
produced. We procure Acrylic Fiber from world renowned manufactures and we
produce Acrylic Yarn, Acrylic Cotton Yarn & High Bulk Acrylic Yarn.
Dye House Facility at our works enables us to produce dyed yarn of Exact Shades.
We also produce Polyester Cotton Yarn, Viscose Yarn and Viscose Cotton Yarn,
Dyed Viscose Yarn. Raw materials like Polyester, Viscose are produced from reputed
manufactureIn Lacs.

7/27/2019 Final Mohit Project
http://slidepdf.com/reader/full/final-mohit-project 20/55
MALWA COTTON SPINNING MILLS LIMITED
Working Capital Management Page 20
MIL Technology
Malwa's premier denim plant in India and itsfacilities across Jordan & Italy are state-of-the-art
units equipped with the latest machines from
Switzerland, Germany, Belgium, Italy, Japan & the
US. These include:
Morrisons of USA for Rope-Dyeing & Finishing,
Zinser Ring-frames from Germany for Spinning,Picanols (from Belgium) and Sulzers (from Switzerland) for Weaving
VI Be Mac, Juki, Pegasus & Brother for Garment manufacturing and the world
famous Tonellos from Italy for Garment Washing
(which also make Malwa the finest denim washing facility in India)
The most advanced CAD system from Gerber & Lectra, that helps keep
production costs low that eventually gets passed down to its customers.
With state-of-the-art technology such as this, Malwa is able to consistently maintain
high productivity and quality levels Malwa continuously strives to upgrade our
technology according to the latest trends in the denim industry. As a result of it now
has the latest technological addition in the development, processing and finishing of
our denim fabrics:
1. ORGANIC
Organic Denim is made of organically grown cotton.Organic cotton is grown without use of harmful
chemicals & pesticides, etc as such it is completely
natural and free of chemicals. Even during fabric and
finishing stages, special treatment is given to these
fabrics to retain the organic character by using
environment friendly chemicals. The colours are
deeper and nicer and the fabric feel is amazing!!!

7/27/2019 Final Mohit Project
http://slidepdf.com/reader/full/final-mohit-project 21/55
MALWA COTTON SPINNING MILLS LIMITED
Working Capital Management Page 21
2. JAPANESE CHIMICA FINISH
The finishing machine used for this finish is one of its
kinds. It gives a special finish to the fabric, soft to feel
& better to handle. The character or drape of the fabric
gives a better lusture and sheen to the fabric. The
colors are embedded deeper, as the denim fades
naturally it gives an excellent depth to the fabric color.
The process is innovative & requires special
chemicals & expertise for finishing the fabric.
3. MOLECULAR FINISH
Molecular finish is a high blend and combination o
chemicals & colors whereby it gives a very fine coat
on the fabric. The finish penetrates deep in the fabric,
deep to the molecular level, to give the fabric a new
look.
MILESTONES TO SUCCESS
Mcsml is flagship Company of Malwa Group. The company is looked after by sh.
Jangi lal Oswal, chairman cum managing director who has varied experience & well
known in industry. Mcsml is regular exporter & exporting all type of yarn & their
blends. Its exports have grown over last twenty yeaIn Lacs. From Rs 7.84 lacs in
1989 to Rs 8854 lacs in 2007- 08.
The company had come under top 100 companies of India & awarded corporate
excellence awards of year 1995. The company has been awarded special status of
export house by govt of India
The cotton textile export promotion Council (texprocil) of India awarded two silver
trophies to company for the year 1996-97 for outstanding performance in yarn
amongst.
1. for top exporters (mills)
2. for non-quota exports

7/27/2019 Final Mohit Project
http://slidepdf.com/reader/full/final-mohit-project 22/55
MALWA COTTON SPINNING MILLS LIMITED
Working Capital Management Page 22
The company has awarded a quality system Certificate of ISO-9002 for
manufacturing for its products.
PRODUCTS
DENIM
Malwa made a foray into cotton denims almost a decade ago in 1997. Since then,
there has been no looking back and Malwa's presence
in denims has gone from strength to strength. Being
situated in the heart of the cotton producing belt in
India, Malwa has access to a consistent and
uninterrupted supply of best quality raw material
thereby ensuring finest cotton Denim fabrics to its
valued customers. In sync with the emerging trends in
Denim, Malwa's in-house Design team works closely
with leading International Design Consultants to come
out with an array of breathtaking designs & finishes in denim a year ahead for every
season.
Through its state-of-the-art denim plant in India , Malwa rolls out premium and basic
denim fabrics employing
- Ring yarns ,
- Open-end yarns ,
- Slubs ,
- Mixed Warps ,
- Multi-count yarns &- Colored yarns in weft as well as in warp .

7/27/2019 Final Mohit Project
http://slidepdf.com/reader/full/final-mohit-project 23/55
MALWA COTTON SPINNING MILLS LIMITED
Working Capital Management Page 23
From classical to contemporary, basic twills to fil-a-fils , cross-hatches to stripes and
from vintage to raw, Malwa belts out a staggering range of denims through clever
variations that are sometimes pronounced and sometimes subtle ; each variation
distinct & different from the other and unique in its own right. Add to this Malwa's
vast repertoire of advanced wash effects & finishes and you step into a world of
infinite possibilities to choose from.
Season Theme
The Spring / Summer 2009 collection is a unique blend of sophisticated and raw lookscreated through an intriguing play of Colors, Weaves, Yarns & Fibers.
With real time knowledge of the latest trends, finishes & looks in denimwear from its
Italian promises to leave you spellbound).
Spring / Summer '11/12
Autumn / Winter '10/11
Spring / Summer '10 INDIGO WOOL
Indigo wool is a range of indigo, warp dyed wool products that have been developed
and produced by unique manufacturing techniques. Introduced by Malwa to enable
the consistent commercial production of wool and wool blend garments,this new
breakthrough in wool products uses unique modern technology and advanced indigo
dyestuffs.
Commercially developed by Malwa, in conjunction with The Wool Mark Company,
the method takes thousands of yarn ends at one time and dyes them through a
commercial continous wrap dyeing system. After dyeing, the yarns are woven using
technically challenging methods which are adapted to process the softer wool yarns.
Following an extensive trial period, Malwa has now created a continous method of
producing indigo dyed wool – Indigo Wool.

7/27/2019 Final Mohit Project
http://slidepdf.com/reader/full/final-mohit-project 24/55
MALWA COTTON SPINNING MILLS LIMITED
Working Capital Management Page 24
KNITWEAR Oswal Knit offers a range of premium woolen
knitwear and clothing through “Pringle of
Scotland” and “Casablanca” lines. As the sole
licencee of international brand “ Pringle of
Scotland” it manufactures top -of-the-line
Woolen Knitwear, T-shirts, Shirts, Trousers,
Jackets and Accessories to complement the
life-style of the crème-de-la-crème segment. Its home-grown brand 'Casablanca'
offers winter wear to the customer in the mid and upper mid-price segment and gives
the company, presence across all major price segments. A strategic tie-up with an
Italian Design Studio ensures that Oswal Knit has access to the latest international
designs, trends and styles which gets translated into a line of high fashion
contemporary clothing for the Indian consumer. To ensure quality of the highest
order, raw materials are sourced from the topmost Italian manufacturers and the
technology is replenished and updated from time to time to ensure that it has the
requisite cutting edge.
YARNS
Malwa Cotton Spinning Mills Limited (MCSM) is a major yarn producer andmanufactures a wide range of yarns at its state-of-the-art units across Punjab &
Himachal Pradesh. Yarns ranging from Ne 10 to 40 in single, double and multi folds
are manufactured. These include
100 % Cotton Combed Raw White Yarns (range includes 20, 24, 30, 32, 34 & 40)
100 % Cotton Carded Raw White Yarns (range includes 10, 12, 16, 20, 30 & 36)
100 % Cotton Dyed Yarns (ranging from Ne 10 to 40)
100 % Cotton Mélange Dyed Yarns (range includes 16, 24, 30 & 40) Cotton-Viscose blended Dyed Mélange Yarns (range includes Ne 16, 24 & 30)

7/27/2019 Final Mohit Project
http://slidepdf.com/reader/full/final-mohit-project 25/55
MALWA COTTON SPINNING MILLS LIMITED
Working Capital Management Page 25
Yarns in blends of Lycra & Cotton and Lycra & Acrylic
Acrylic-Cotton yarns (Dyed & Grey) in any blend ratio using Combed as well as
Carded Cotton {For Combed category, yarn range includes 30 & 2/18. For Carded
category, yarn range includes 10, 12, 16, 20, 30 & 2/16, 2/18 & 2/30}. Polyester-Cotton yarns (Dyed & Grey) in any blend ratio using Combed as well as
Carded Cotton (range includes Ne 20/1, 24/1, 30/1, 34/1, 36/1, 40/1 & 42/1 )
100% Acrylic High bulk dyed yarns on Hanks/Cones ( range includes 2/10, 2/19,
2/24, 2/28, 2/32, 3/8, 4/8, 1/15 etc)
100% Acrylic Raw white yarns suitable for Bulking (range includes 2/10, 2/19, 2/24,
2/28, 2/32, 3/8, 4/8, 1/15 etc)
100% Acrylic non-bulk Raw white & Dyed yarns (range includes 33/1, 40/1, 50/1,2/40, 2/30 etc).
100% Polyester Raw White & Dyed yarns
Polyester-Viscose Raw White & Dyed yarns in any blend ratio
Worsted yarns for suiting fabrics
MARKETS
Malwa s exports span America, Europe, Middle East, Far East & Africa and are well accepted
by discerning customers across the world on the strength of their exemplary quality, range &
design. The major countries where our products are being exported include:
Asia Europe Africa America
Japan
China
Korea
U.A.E.
Hongkong
Singapore
Germany
U.K.
Russia
Spain
Italy
Switzerland
South Africa
Egypt
Kenya
Mauritius
Nigeria
Sudan
USA
Canada
Panama
Cuba

7/27/2019 Final Mohit Project
http://slidepdf.com/reader/full/final-mohit-project 26/55
MALWA COTTON SPINNING MILLS LIMITED
Working Capital Management Page 26
Cyprus
Israel
Malaysia
Taiwan
Turkey
Vietnam
Bangladesh
Belgium
Greece
Portugal
Slovenia
Sweden
Tanzania
7/27/2019 Final Mohit Project
http://slidepdf.com/reader/full/final-mohit-project 27/55
MALWA COTTON SPINNING MILLS LIMITED
Working Capital Management Page 27
WORKING CAPITAL MANAGEMENT

7/27/2019 Final Mohit Project
http://slidepdf.com/reader/full/final-mohit-project 28/55
MALWA COTTON SPINNING MILLS LIMITED
Working Capital Management Page 28
OBJECTIVES
The main objectives to undertake this project to study:-
Analyse the operating cycle of the company.
To study management of working capital by the company. To study which factors affects the working capital of the company
To properly and effectively operate the working capital cycle of the management.
To analyze the day-to-day working of the company, whether they are able to meet
their daily expenses.
To determine the liquidity position of the company.
DATA COLLECTION Primary as well as secondary data is used for the project. The research management.
Secondary data is collected from annual reports, relevant records of Avon Cycle
Limited.
ANALYSIS OF DATA
Analysis is done in terms of theoretical concepts. Analysis of working capital
performance is done with help of percentages by showing graphs, ratios ets.
INTRODUCTION
“Working capital means the part of the total assets of the business that change from
one form to another from in the ordinary course of business”
The word working capital is made of two words:-
Working
Capital
The word working means day to operation of the business, whereas the word capital
means monetary value of all assets of the business.
WORKING CAPITAL
Working capital may be regarded as the life blood of business. working capital is of major
importance to internal and external analysis because of its close relationship with the current
day-to-day operations of a business.
Every business needs funds for two purpose:-

7/27/2019 Final Mohit Project
http://slidepdf.com/reader/full/final-mohit-project 29/55
MALWA COTTON SPINNING MILLS LIMITED
Working Capital Management Page 29
Long-term funds are required to create production facilities through purchase of fixed assets
such as plants, machineries, lands, buildings etc.
Short-term funds are required for the purchase of raw materials, payments of wages, and other
day-to-day expenses. It is otherwise known as revolving or circulating capital.
In other words, working capita l refers to that part of the firm s capital, which is required for
financing short-term current assets such as cash, marketable securities, bill receivable,
debtors, inventories etc. However, working capital is also known as Revolving or circulating
Capital. Businesses use capital for construction, renovation, furniture, software, equipment, or
machinery. It also commonly used to purchase inventory, or to make payroll. Working capital
is essential for any business to succeed. It is becoming increasingly important to have access
to more working capital when we need it.
NEED FOR WORKING CAPITAL
The basic objectives of financial management is to maximize shareholders wealth. This is
possible only when the company earns sufficient profit. The amount of such profit largely
depend upon the magnitude of sales. However, sales do not convert into cash instantaneously.
There is always time gap between the sale of goods and receipt of cash. Working capital is
required for this period in order to sustain the sales activity.
Working capital is needed for the following purpose:
For purchase of raw material, components and spares.
To pay wages and salaries.
To incur daily expenses and overhead cost such as fuel, power and office expenses etc.
To maintain the inventories of raw material, work in progress, spares and finished stock.
To provide credit facility to customeIn Lacs.
To meet the selling costs.
MANAGEMENT OF WORKING CAPITAL
Working capital, in general practice, refers to the excess of current assets over current
liabilities positions are bad for any business. Management of working capital therefore, is
concerned with the problems that arise in attempting to manage the current assets, the current
liabilities and the inter relationship that exits between them. In other words, it refers to all
aspects of administration of both current assets and current liabilities. The basic goal of
working capital management is to manage the current assets and current liabilities of the firm

7/27/2019 Final Mohit Project
http://slidepdf.com/reader/full/final-mohit-project 30/55
MALWA COTTON SPINNING MILLS LIMITED
Working Capital Management Page 30
in such a way that a satisfactory level of working capital is maintained, i.e., it is neither
inadequate nor excessive. This is so because both inadequate as well as excessive working
capital positions are bad for any business. Inadequacy of working capital may lead a firm to
insolvency and excessive working capital implies idle funds, which earn no profits for the
business. Working capital management policies of a firm have a great effect on its
profitability, liquidity and structural health of the organization.
In this context, working capital management is three dimensional in nature:-
Dimension I is concerned with the formation of the policies with regard to profitability, risk
and liquidity.
Dimension II is concerned with the decisions regarding the composition and level of current
assets.
Dimension III is concerned with the decisions about the composition and level of current
liabilities.
There is a definite inverse relationship between the degree of risk and profitability.
A conservation management prefers to minimize risk by maintaining a higher level of current
assets while a liberal management assumes greater risk by reducing working capital.
TYPES OF WORKING CAPITAL
ON THE BASIS OF BALANCE SHEET CONCEPT
There are two interpretation of working capital under the balance sheet concept:-
Gross Working Capital
Net Working Capital
Types of WorkingCapital
On the basis of B/S Concept
Gross WorkingCapital
Net WorkingCapital
On the basis of time
PermanentWorkingCapital
TemporaryWorkingCapital
SeasonalWorkingCapital
SpecificWorkingCapital

7/27/2019 Final Mohit Project
http://slidepdf.com/reader/full/final-mohit-project 31/55
MALWA COTTON SPINNING MILLS LIMITED
Working Capital Management Page 31
a) Gross Working Capital
In the board sense, the term working capital refer to the gross working capital and represents
the amount of funds invested in current assets. Thus, the gross working capital is the invested
in total current assets of the enterprise. Current assets are those assets, which in the ordinary
course of business can be converted into cash with in a short period of normally one
accounting year.
Gross Working Capital = Current Assets
Particulars As at
31.3.2012
(in Lacs)
As at
31.3.2011
(in Lacs)
As at
31.3.2010
(in Lacs)
As at
31.3.2009
(in Lacs)
Current Assets
Inventories
Sundry Debtors
Cash and Bank balance
Loan and Advances
1400.52
13777.00
504.79
2406.65
15139.52
12265.29
315.53
2283.85
12395.91
13060.05
339.94
2310.12
10588.42
12847.03
402.33
2471.31
Gross Working capital and Total
Current Assets
31088.96 30004.19 28105.42 26309.09
INTERPRETATION
The above figures indicate the gross working capital is increasing every year. In 2009
it was 26309.09 which increase to Rs. 28105.42 lac, Rs. 30004.19 lac and Rs.
31088.96 lac in the year 2010, 2011 and 2012 respectively. As sales are increasing
so not much funds are blocked in current assets as gross working capital, which
indicate that it is not alarming situation.
7/27/2019 Final Mohit Project
http://slidepdf.com/reader/full/final-mohit-project 32/55
MALWA COTTON SPINNING MILLS LIMITED
Working Capital Management Page 32
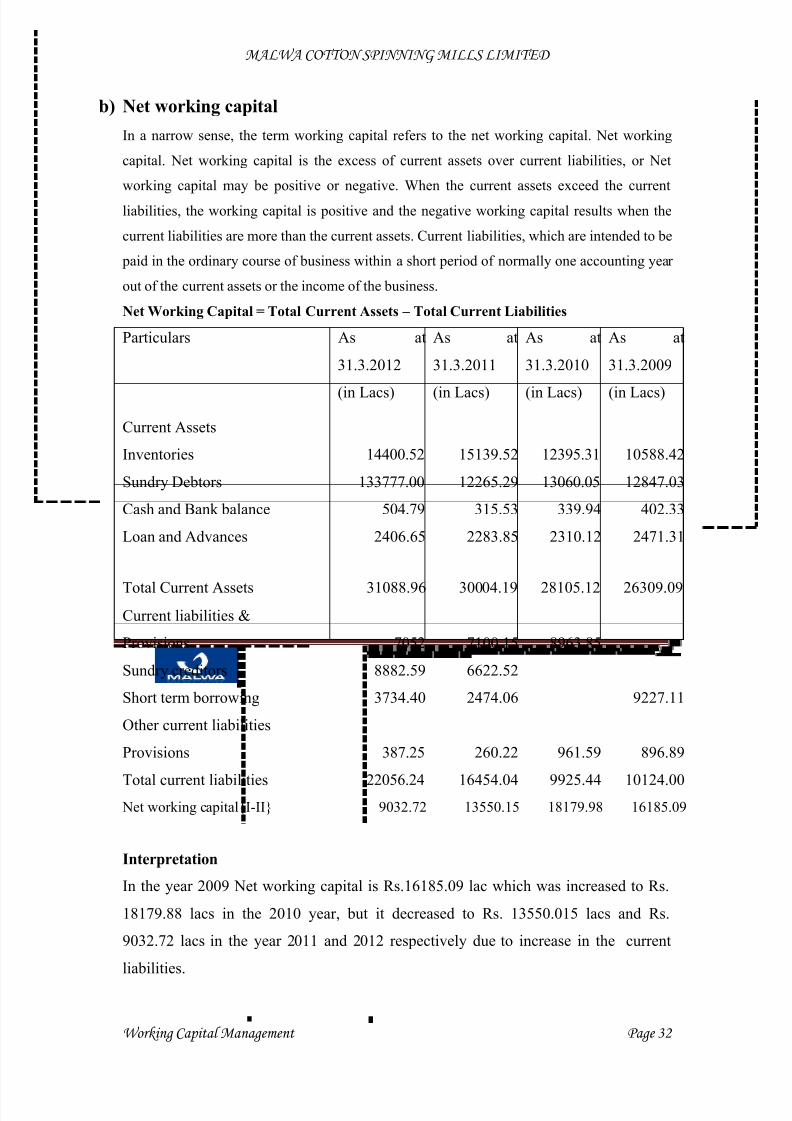
b) Net working capital
In a narrow sense, the term working capital refers to the net working capital. Net working
capital. Net working capital is the excess of current assets over current liabilities, or Net
working capital may be positive or negative. When the current assets exceed the current
liabilities, the working capital is positive and the negative working capital results when the
current liabilities are more than the current assets. Current liabilities, which are intended to be
paid in the ordinary course of business within a short period of normally one accounting year
out of the current assets or the income of the business.
Net Working Capital = Total Current Assets – Total Current Liabilities
Particulars As at
31.3.2012
(in Lacs)
As at
31.3.2011
(in Lacs)
As at
31.3.2010
(in Lacs)
As at
31.3.2009
(in Lacs)
Current Assets
Inventories
Sundry Debtors
Cash and Bank balance
Loan and Advances
14400.52
133777.00
504.79
2406.65
15139.52
12265.29
315.53
2283.85
12395.31
13060.05
339.94
2310.12
10588.42
12847.03
402.33
2471.31
Total Current Assets 31088.96 30004.19 28105.12 26309.09Current liabilities &
Provisions
Sundry creditors
Short term borrowing
Other current liabilities
Provisions
Total current liabilities
7052
8882.59
3734.40
387.25
22056.24
7100.15
6622.52
2474.06
260.22
16454.04
8963.85
961.59
9925.44
9227.11
896.89
10124.00 Net working capital{I-II} 9032.72 13550.15 18179.98 16185.09
Interpretation
In the year 2009 Net working capital is Rs.16185.09 lac which was increased to Rs.
18179.88 lacs in the 2010 year, but it decreased to Rs. 13550.015 lacs and Rs.
9032.72 lacs in the year 2011 and 2012 respectively due to increase in the current
liabilities.
7/27/2019 Final Mohit Project
http://slidepdf.com/reader/full/final-mohit-project 33/55
MALWA COTTON SPINNING MILLS LIMITED
Working Capital Management Page 33
ON THE BASIS OF TIME Permanent working capital
Temporary or variable working capital
a) Permanent Working Capital
The refers to that minimum amount of investment in all current assets which is required to all
times to carry out minimum level of business activities. It represents the current assets
required on a continuing basis over the entire year.
The following are the characteristics of this type of working capital:-
Amount of permanent working capital remains in the business in one form or another. This is
particularly important from the point of view of financing. The suppliers of such working
capital should not expect its return during the lifetime of the firm. It also grows with the size of the business.
Permanent working capital is permanently needed for the business and therefore it should be
financed out of long-term funds.
Permanent working capital is permanently needed for the business and therefore it should be
financed out of long-term funds.
This is the reason why the current ratio has to be substantially more than „I .
b) Temporary or Variable Working Capital
The amount of working capital is required to meet the seasonal demands and some special
exigencies. The amount of such working capital keeps on fluctuating from time to time on the
basis of business activities.
In another words, it represents additional current assets required at different times during the
operating year.

7/27/2019 Final Mohit Project
http://slidepdf.com/reader/full/final-mohit-project 34/55
MALWA COTTON SPINNING MILLS LIMITED
Working Capital Management Page 34

7/27/2019 Final Mohit Project
http://slidepdf.com/reader/full/final-mohit-project 35/55
MALWA COTTON SPINNING MILLS LIMITED
Working Capital Management Page 35
OPERATING CYCLE
Cash
Rawmaterial
Work inProgress
FinishedGoods
Sales
Debtors

7/27/2019 Final Mohit Project
http://slidepdf.com/reader/full/final-mohit-project 36/55
MALWA COTTON SPINNING MILLS LIMITED
Working Capital Management Page 36
Operating cycle is the time duration required to convert sales, after the conversion of resources,
into cash. Cash inflows are not certain because sales & collection, which give rise to cash
inflows, are difficult to forecast accurately. Cash outflows, on other hand are relatively certain.
The firm is, therefore, required to invest in current assets for smooth, uninterrupted functioning.
It needs to maintain liquidity to purchase raw material liquidity to purchase raw materials &
pay expenses such as wages & taxes as there is hardly a matching between cash inflows and
cash outflows.
Cash is hold to meet any future exigencies. Stock of raw material and work – in-progress and
kept to ensure smooth production and to guard against non-availability of raw material and
other components. The firm holds stock of finished goods to meet the demand of customers on
continuous basis and sudden demand from some customerIn Lacs. Thus, a firm makes adequate
investment in inventories, for smooth, uninterrupted production and sale.
Operating Cycle Analysis
In order to understood the length of times which reports are committed to various components
of working capital, operating cycle analysis has been done. The operating cycle of a firm with
the acquisition of raw material and ends with the collection of receivable. There are four
aspects of operating cycle, which involves commitment of resources, a material stage, and
accounts finished stage.
Gross Operating Cycle Period = RMCP + WIPCP + FMCG + RCP
RMCP = Raw Material Conversion Period
WIPCP = Work-in-Progress Conversion Period
FMCG = Finished Goods Conversion PeriodRCP = Receivables Conversion period

7/27/2019 Final Mohit Project
http://slidepdf.com/reader/full/final-mohit-project 37/55
MALWA COTTON SPINNING MILLS LIMITED
Working Capital Management Page 37
A. Raw Material Conversion Period
a) Average Stock of Ram Material = (Opening Stock + Closing Stock) / 2
ParticularsAs at
31.3.2012 (InLacs.)
As at31.3.2011 (In
Lacs.)
As at31.3.2010 (In
Lacs.)
As at31.3.2009 (In
Lacs.)
I Opening Stock of RawMaterial 1839.63 2044.41 1054.42 1980.05
II Closing Stock of RawMaterial 1396.94 1839.63 2044.41 1054.42
Average Stock of RawMaterial [ (I + II ) / 2} 1618.285 1942.02 1549.415 1517.235
b) Raw Material Consumption per Day = (Opening Stock + Purchases - Closing Stock) / 365
I Opening Stock of RawMaterial 1839.63 2044.41 1054.42 1980.05
II Purchases 23550.96 28914.83 28616.74 28074.76
III Closing Stock of RawMaterial 1396.94 1839.63 2044.41 1054.42
Raw Material ConsumptionPer Day [(I + II - III) / 365} 66 80 76 79
A) Raw Material Conversion Period {a / b} 25 daysapprox.
24 daysapprox.
20 daysapprox.
19 daysapprox.
B. Work-in-progress conversion period
Average Stock of Raw MaterialRMCP = -----------------------------------------
Raw Material Consum tion er Da
Average Stock of Work-in-ProgressWIPCP = ---------------------------------------------
Total Cost of Production per day
7/27/2019 Final Mohit Project
http://slidepdf.com/reader/full/final-mohit-project 38/55
MALWA COTTON SPINNING MILLS LIMITED
Working Capital Management Page 38
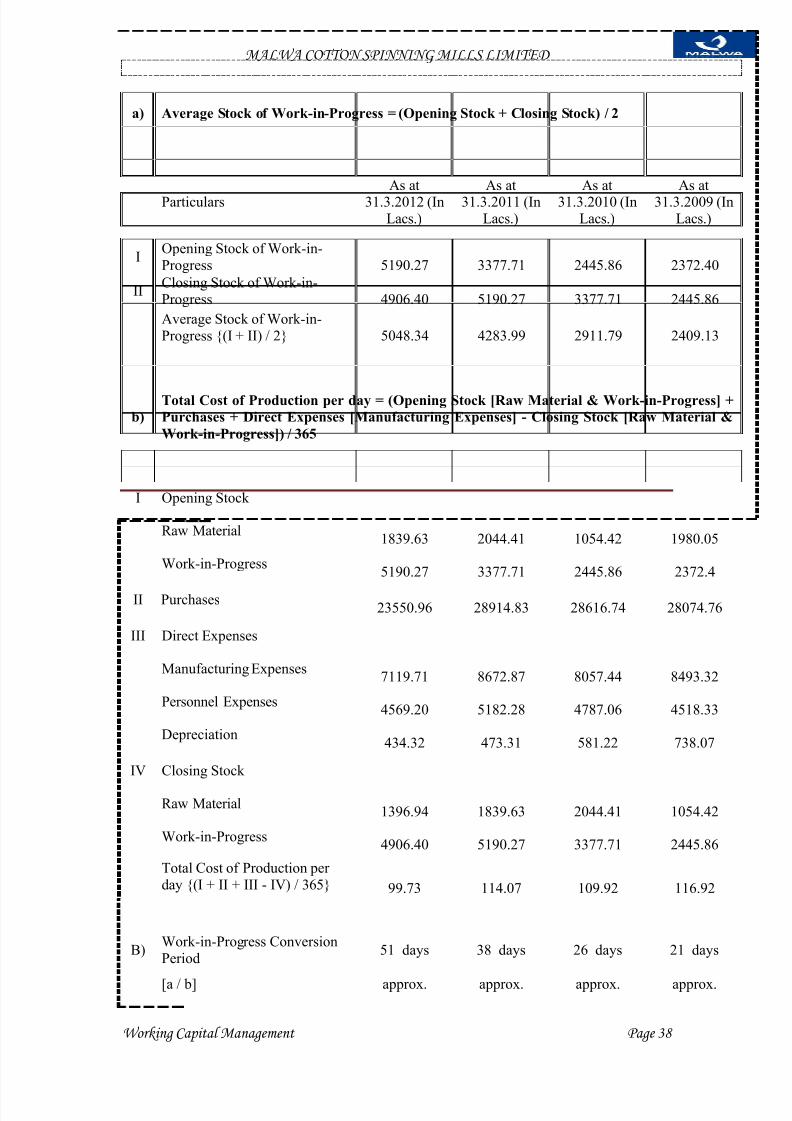
a) Average Stock of Work-in-Progress = (Opening Stock + Closing Stock) / 2
ParticularsAs at
31.3.2012 (InLacs.)
As at31.3.2011 (In
Lacs.)
As at31.3.2010 (In
Lacs.)
As at31.3.2009 (In
Lacs.)
I Opening Stock of Work-in-Progress 5190.27 3377.71 2445.86 2372.40
II Closing Stock of Work-in-Progress 4906.40 5190.27 3377.71 2445.86Average Stock of Work-in-Progress {(I + II) / 2} 5048.34 4283.99 2911.79 2409.13
b)Total Cost of Production per day = (Opening Stock [Raw Material & Work-in-Progress] +Purchases + Direct Expenses [Manufacturing Expenses] - Closing Stock [Raw Material &Work-in-Progress]) / 365
I Opening Stock
Raw Material 1839.63 2044.41 1054.42 1980.05
Work-in-Progress 5190.27 3377.71 2445.86 2372.4
II Purchases 23550.96 28914.83 28616.74 28074.76
III Direct Expenses
Manufacturing Expenses 7119.71 8672.87 8057.44 8493.32
Personnel Expenses 4569.20 5182.28 4787.06 4518.33
Depreciation 434.32 473.31 581.22 738.07
IV Closing Stock
Raw Material 1396.94 1839.63 2044.41 1054.42
Work-in-Progress 4906.40 5190.27 3377.71 2445.86
Total Cost of Production per day {(I + II + III - IV) / 365} 99.73 114.07 109.92 116.92
B) Work-in-Progress ConversionPeriod 51 days 38 days 26 days 21 days
[a / b] approx. approx. approx. approx.

7/27/2019 Final Mohit Project
http://slidepdf.com/reader/full/final-mohit-project 39/55
MALWA COTTON SPINNING MILLS LIMITED
Working Capital Management Page 39
C. Finished Goods Conversion Period
a)Average Stock of Finished Goods = (Opening Stock + Closing Stock) / 2
Particulars As at 31.3.2012(In Lacs.)
As at 31.3.2011(In Lacs.)
As at31.3.2010 (In
Lacs.)
As at31.3.200
9 (InLacs.)
IOpening Stock of Finished Goods 7413.81 6256.18 6404.42 7888.35
II Closing Stock of FinishedGoods 7456.17 7413.81 6256.18 6404.42
Average Stock of Finished Goods [(I + II) /2}
7434.99 6835.00 6330.30 7146.39
b)Total Cost of Goods Sold per Day = (Opening Stock [Raw Material, Finished Goods &Work-in-Progress] + Purchases + Direct Expenses [Manufacturing Expenses] -Closing Stock [Raw Material, Finished Goods & Work-in-Progress]) / 365
I Opening Stock
Raw Material 1839.63 2044.41 1054.42 1980.05
Finished Goods 7413.81 6256.18 6404.42 7888.35
Work-in-Progress 5190.27 3377.71 2445.86 2372.4
II Purchases 23550.96 28914.83 28616.74 28074.76
III Direct Expenses
Manufacturing 7119.71 8672.87 8057.44 8493.32
Personnel Expenses 4569.20 5182.28 4787.06 4518.33
Depreciation 434.32 473.31 581.22 738.07
IV Closing Stock
Raw Material 1396.94 1839.63 2044.41 1054.42
Finished Goods 7456.17 7413.81 6256.18 6404.42
Average Stock of Finished Goods
FGCP = ---------------------------------------------Total Cost of Goods Sold per day

7/27/2019 Final Mohit Project
http://slidepdf.com/reader/full/final-mohit-project 40/55
MALWA COTTON SPINNING MILLS LIMITED
Working Capital Management Page 40
Work-in-Progress 4906.40 5190.27 3377.71 2445.86
Total Cost of Goods Sold per day {(I + II + III - IV)/ 365}
100 111 110 121
C) Finished Stock Conversion Period {a / b} 74 daysapprox.
62 daysapprox.
58 daysapprox.
59 daysapprox.
D. Receivables Conversion Period
a) Average Debtors = (Opening Stock + Closing Stock) / 2
ParticularsAs at
31.3.2012 (InLacs.)
As at31.3.2011 (In
Lacs.)
As at31.3.2010 (In
Lacs.)
As at31.3.2009 (In
Lacs.)
I Opening Stock of Debtors 12265.29 13060.05 12847.03 12201.84
II Closing Stock of Debtors 13777.00 12265.29 13060.05 12847.03
Average Debtors {(I +II) / 2} 13021.15 12662.67 12953.54 12524.44
b) Net Credit Sales Per Day = Sales / 365
I Sales 39823.24 45504.23 43241.4 45890.1
Net Credit Sales per Day {I / 365} 109.10 124.67 118.47 125.73
D) Receivables Conversion Period {a / b}119days
approx.
102days
approx.
109days
approx.
100days
approx.
Average DebtorsRCP = ---------------------------------------
Net Credit Sales per day

7/27/2019 Final Mohit Project
http://slidepdf.com/reader/full/final-mohit-project 41/55
MALWA COTTON SPINNING MILLS LIMITED
Working Capital Management Page 41
Gross Operating Cycle Period
Gross Operating Cycle Period = RMCP (A) + WIPCP (B) + FGCP © + RCP (D)
Particulars As at 31.3.2012 (InLacs.)
As at31.3.2011(In Lacs.)
As at31.3.2010(In Lacs.)
As at31.3.2009(In Lacs.)
A) Raw Material Conversion Period 25 days approx. 24 daysapprox.
20 daysapprox.
19 daysapprox.
B) Work-in-Progress ConversionPeriod 51 days 38 days 26 days 21 days
C) Finished Stock Conversion Period 74 days approx. 62 daysapprox.
58 daysapprox.
59 daysapprox.
D) Receivables Conversion Period 119 days approx. 102 daysapprox.
109 daysapprox.
100 daysapprox.
Gross Operating Cycle Period [A+ B + C + D} 269 day approx. 226 day
approx.213 dayapprox.
199 dayapprox.
Interpretation
Gross operating cycle is 269 days in 2012 which was decreased to 2011 days in the
year 2010 respectively but in the year 2012 it increased to 269 days.

7/27/2019 Final Mohit Project
http://slidepdf.com/reader/full/final-mohit-project 42/55

7/27/2019 Final Mohit Project
http://slidepdf.com/reader/full/final-mohit-project 43/55
MALWA COTTON SPINNING MILLS LIMITED
Working Capital Management Page 43
ParticularsAs at
31.3.2012(In Lacs.)
As at31.3.2011(In Lacs.)
As at31.3.2010(In Lacs.)
As at31.3.2009(In Lacs.)
I Gross Operating Cycle Period269 dayapprox.
226 dayapprox.
213 dayapprox.
199 dayapprox.
II Payable Deferred Period 163 dayapprox.
113 dayapprox.
117 dayapprox.
95 dayapprox.
Net Operating Cycle {I - II} 106 daysapprox.
113 daysapprox.
96 daysapprox.
104 daysapprox.
Interpretation
Net Operating Cycle has been from the year 2008-09 is 104 days respectively but in2009-10 it has been decreased to 96 days. In the year 2010-11 net operating cycle has
been also increased to 113 days and 2011-12 it has been decreased to 106 days approx
respectively.

7/27/2019 Final Mohit Project
http://slidepdf.com/reader/full/final-mohit-project 44/55

7/27/2019 Final Mohit Project
http://slidepdf.com/reader/full/final-mohit-project 45/55
MALWA COTTON SPINNING MILLS LIMITED
Working Capital Management Page 45
A. Current Ratio
The current ratio is very popular financial ratio measure as the ability of the firm to
met current liabilities. Current assets are converted into cash for the payment of
current liabilities. Apparently, higher the current ratio the greater the short termsolvency. The ratio may be expressed as-
ParticularsAs at
31.3.2012(In Lacs.)
As at31.3.2011(In Lacs.)
As at31.3.2010(In Lacs.)
As at31.3.2009(In Lacs.)
I Current Assets
Inventories 14400.52 15139.52 13295.31 10588.42
Sundry Debtors 13777.00 12665.29 13060.05 12847.03
Cash & Bank Balances 504.79 315.53 339.94 402.33
Loans & Advances 2406.65 2283.85 2310.12 2471.31
Total Current Assets 31088.96 30404.19 29005.42 26309.09
II Current Liabilities
Sundry Creditors 12229.74 8931.27 8963.85 9227.11
Total outstanding Dues to small scaleindustrial undertaking - - - -
Total outstanding Dues of creditors other thansmall scale - - - -
Trade deposits and advances 22.29 21.30 25.30 23.30
Other Liabilities 1778.32 1614.01 1474.6 1324.84
Unclaimed Dividends - - - -
Interest accrued but not due 210.49 195.81 18.90 -
Total Current Liabilities 14240.84 10762.39 10482.65 10575.25
Current Ratio {I / II} 2.18 2.83 2.77 2.49
Current AssetsCurrent Ratio = -----------------------------
Current Liabilities

7/27/2019 Final Mohit Project
http://slidepdf.com/reader/full/final-mohit-project 46/55
MALWA COTTON SPINNING MILLS LIMITED
Working Capital Management Page 46
INTERPRETATION
As a conventional rule, a current ratio of 2:1 or more is consider satisfactory ratio for
the concern. So the current ratio of firm shows from the year 2006 which is 3:95:1
respectively but in the year 2007 and 2008 it decrease to 3.35:1 to 2.70:1 which is
satisfactory to the firm.
B. Quick or Acid Test or Liquid Ratio
Although current ratio is a valuable indicator of liquidity, yet it may lead to
misleading conclusion, in case of inventories forms a major component of current
assets, the quick ratio is a stringent measure of liquidity. It is based on those current
assets which are the highly liquid or which are easily converted into cash. Inventories
and prepaid expenses are excluded from this category, because these are the best
liquid component of and has the ability to pay its current liabilities in time when these
are due, the ratio may be expressed as :-
Liquid Assets = Current Assets - (Inventories + Prepaid Expenses)
ParticularsAs at
31.3.2012(In Lacs.)
As at31.3.2011(In Lacs.)
As at31.3.2010(In Lacs.)
As at31.3.2009(In Lacs.)
Current Assets
Inventories 14400.52 15139.52 13295.31 10588.42
Sundry Debtors 13777.00 12265.29 13060.05 12847.03
Cash & Bank Balances 504.79 315.53 339.94 402.33
Loan & Advances 2406.65 2283.85 2310.12 2471.31
Quick/Liquid AssetsQuick/Liquid or Acid Test Ratio = -----------------------------
Current Liabilities

7/27/2019 Final Mohit Project
http://slidepdf.com/reader/full/final-mohit-project 47/55
MALWA COTTON SPINNING MILLS LIMITED
Working Capital Management Page 47
Total Current Assets 31088.96 30004.19 29005.42 26309.09
Less Inventories (14400.52) (15139.52) (13295.31) (10588.42)
Liquid Inventories 16688.44 14864.67 15710.11 15720.67
II Current Liabilities
Sundry Creditors 12229.74 8931.27 8963.85 9227.11
Total outstanding Dues to small scaleindustrial undertaking - - - -
Total outstanding Dues of creditors other than small scale - - - -
Trade deposits and advances 22.29 21.30 25.30 23.30
Other Liabilities 1778.32 1614.01 1474.60 1324.84
Unclaimed Dividends - - - -
Interest accrued but not due 210.49 195.81 18.90 -
14240.84 10762.39 10482.65 10575.25
Quick/Liquid or Acid Test Ratio {I / II} 1.17 : 1 1.38 : 1 1.5 : 1 1.49 : 1
Interpretation
Quick ratio is generally considered satisfactory if ratio is 1:1. Above figures show that
the quick ratio has been from 2006 is 2.52:1 respectively but in the year 2007 and
2008 it decrease to 1.91:1 to 1.44:1 although it is satisfactory to the firm.

7/27/2019 Final Mohit Project
http://slidepdf.com/reader/full/final-mohit-project 48/55
MALWA COTTON SPINNING MILLS LIMITED
Working Capital Management Page 48
CURRENT ASSETS MOVEMENTS OR EFFICIENCY OR
ACTIVITY RATIOS
Funds are invested in various assets in business to make sales and earn profits. The
efficiency with which assets are managed directly affect the value of sales. The better
the management of assets, the larger is the amount of sales and the profits. Activity
ratios measure the efficiency or effectiveness with which a firm manages its resources
or assets. These ratios are also called Turnover Ratios because they indicate the
speed with which assets are converted or turned over into sales.
A). Inventory Turnover Ratio
Inventory turnover ratio is also known as stock velocity. This ratio indicates the
efficiency of the firm in selling its products. It shows how rapidly the inventory is
turning in to receivable through sales. It is calculate by dividing the cost of goods sold
by the average inventory. It can be expressed as:
a) Cost of Goods Sold = Opening Stock [Raw Material, Finished Goods &Work-in-Progress] + Purchases + Direct Expenses [ManufacturingExpenses] - Closing Stock [Raw Material, Finished goods & Work-in-Progress]
ParticularsAs at
31.3.2012(In Lacs.)
As at31.3.201
1 (InLacs.)
As at31.3.2010(In Lacs.)
As at31.3.2009(In Lacs.)
I Opening Stock
Raw Material 1839.63 2044.41 1054.42 1980.05
Finished Goods 7413.81 6256.18 6404.42 7888.35
Work-in-Progress 5190.27 3377.71 2445.86 2372.4
II Purchases 23550.96 28914.83 28616.74 28074.76
Cost of Goods SoldInventory Turnover Ratio = ---------------------------------
Average Inventory at Cost

7/27/2019 Final Mohit Project
http://slidepdf.com/reader/full/final-mohit-project 49/55
MALWA COTTON SPINNING MILLS LIMITED
Working Capital Management Page 49
III Direct Expenses
Manufacturing 7119.71 8672.87 8057.44 8493.32
Personnel Expenses 4569.2 5182.28 4787.06 4518.33
Deprection 434.32 473.31 581.22 738.07IV Closing Stock
Raw Material 1396.94 1839.63 2044.41 1054.42
Finished Goods 7456.17 7413.81 6256.18 6404.42
Work-in-Progress 4906.4 5190.27 3377.71 2445.86
Cost of Goods Sold {I +II + III - IV} 36358.39 40477.88 40268.86 44160.58
b) Average Inventory = (Opening Stock + Closing Stock) / 2
I Opening Stock
Raw Material 1839.63 2044.41 1054.42 1980.05
Finished Goods 7413.81 6256.18 6404.42 7888.35
Work-in-Progress 5190.27 3377.71 2445.86 2372.4
II Closing Stock
Raw Material 1396.94 1839.63 2044.41 1054.42
Finished Goods 7456.17 7413.81 6256.18 6404.42
Work-in-Progress 4906.4 5190.27 3377.71 2445.86Average Inventory at Cost [(I +II) / 2} 14101.61 13061.005 10791.5 11072.75
Inventory Turnover Ratio {a / b}3 times 3 times 4 times 4 times
Interpretation
The inventory turnover ratio is decreasing in every yaer i.e. in the year 2005-06 it was
9 which was decreased to 4 and 3 in the year 2006-07 and 2007-08 respectively. It
indicates that the firm is converting its inventory of finished goods into sale
efficiently.

7/27/2019 Final Mohit Project
http://slidepdf.com/reader/full/final-mohit-project 50/55
MALWA COTTON SPINNING MILLS LIMITED
Working Capital Management Page 50
B) Inventory Conversion Period
It may be taken to see average time taken for clearing the stocks. This can be possible
by calculating inventory conversion period. The formula may be as :-
ParticularsAs at
31.3.2012(In Lacs.)
As at31.3.2011(In Lacs.)
As at31.3.2010(In Lacs.)
As at31.3.2009(In Lacs.)
I Inventory Turnover Ratio 3 times 3 times 4 times 4 times
Inventory Conversion Period {365 /I} 122 daysapprox. 122 daysapprox. 91 daysapprox. 91 daysapprox.
Interpretation
Inventory conversion period is continuously increasing from 2010-11 to 2012-13 from
91 days to 122 days.
C) Debtors or Receivables Turnover Period
Debtor turnover ratio indicates the velocity of debt collection of the firm. It can be
expressed as:-
a) Net Credit Sales = Sales
ParticularsAs at
31.3.2012(In Lacs.)
As at31.3.2011(In Lacs.)
As at31.3.2010(In Lacs.)
As at31.3.2009 (In
Lacs.)
I Net Credit Sales or Sales 39823.24 45504.23 43241.40 45890.1
b) Average Debtors = (Opening Stock + Closing Stock) / 2
Days in a year (365)Inventory Conversion Period = ---------------------------------
Inventory Turnover Ratio
Net Credit Annual SalesDebtors or Receivables Turnover Period = ---------------------------------
Average Trade Debtors

7/27/2019 Final Mohit Project
http://slidepdf.com/reader/full/final-mohit-project 51/55
MALWA COTTON SPINNING MILLS LIMITED
Working Capital Management Page 51
ParticularsAs at
31.3.2012(In Lacs.)
As at31.3.2011(In Lacs.)
As at31.3.2010(In Lacs.)
As at31.3.2009(In Lacs.)
I Opening Stock of Debtors 12265.29 13060.05 12847.03 12201.84
II Closing Stock of Debtors 13777.00 12265.29 13060.05 12847.03
Average Debtors {(I + II) / 2} 13021.15 12662.67 12953.54 12524.44
Debtors or Receivables Turnover Ratio {a / b} 3.06 times 3.59
times3.34times
3.66times
Interpretation
Debtors Turnover Ratio is continuously decreasing from 2009-10 to 2012-13 from3.06 days to 119 days.
D). Average Collection Period
The average collection period represents the average number of days from which a
firm has to wait before its receivable are converted into cash. The ratio can be
calculated as follows:
ParticularsAs at
31.3.2012(In Lacs.)
As at31.3.2011(In Lacs.)
As at31.3.2010(In Lacs.)
As at31.3.2009(In Lacs.)
I Debtors or Receivables Turnover
Ratio3.06 times 3.59
times
3.34
times
3.66
timesAverage Collection Period {365 /I}
119 daysapprox.
102 daysapprox.
109 daysapprox.
100 daysapprox.
Interpretation
Average Conversion is continuously increasing from 2009-10 to 2012-13 days 119.
Days in year (365)Average Collection Period = ------------------------------
Debtors Turnover Ratio

7/27/2019 Final Mohit Project
http://slidepdf.com/reader/full/final-mohit-project 52/55
MALWA COTTON SPINNING MILLS LIMITED
Working Capital Management Page 52
E). Creditors/Payable Turnover Ratio
A firm has to make credit purchases and incur short-term liabilities. A supplier of
goods, i.e. credit is naturally interested in finding out how much time the firm is likely
to take in repaying its trade creditor In Lacs. The ratio can be expressed as follows :-
a) Net Crediot Purchases = Purchases
Particulars
As at
31.3.2012(In Lacs.)
As at
31.3.2011(In Lacs.)
As at
31.3.2010(In Lacs.)
As at
31.3.2009(In Lacs.)
I Purchases 23550.96 28914.83 28616.74 28074.76
b) Average Creditors = (Opening Stock + Closing Stock) / 2
I Opening Stock of Creditors 8931.27 8963.85 9227.11 5386.06
II Closing Stock of Creditors 12229.74 8931.27 8963.85 9227.11
Average Creditors {(I + II) / 2} 10580.505 8947.560 9095.480 7306.585
Creditors / Payable Turnover Ratio {a / b} 2.23 times 3.23 times 3.15 times 3.84 times
Interpretation
Creditors Turnover Ratio is continuously decreasing from 2009-10 to 2012-13 from3.84 times to 2.23 times.
Net Credit Annual PurchaseCreditors/Payable Turnover Ratio = -----------------------------------
Average Trade Creditors

7/27/2019 Final Mohit Project
http://slidepdf.com/reader/full/final-mohit-project 53/55
MALWA COTTON SPINNING MILLS LIMITED
Working Capital Management Page 53
F). Creditors/Payable Turnover Ratio
The average payment period ratio represents the average number of days taken by the
firm to pay its creditors in Lacs. The ratio can be expressed as :-
ParticularsAs at
31.3.2012(In Lacs.)
As at31.3.2011(In Lacs.)
As at31.3.2010(In Lacs.)
As at31.3.2009(In Lacs.)
I Creditors / Payable Turnover Ratio 2.23 times 3.23 times 3.15 times 3.84 times
Average Payment Period {365 / I} 164 daysapprox. 113 daysapprox. 116 daysapprox. 95 daysapprox.
Interpretation
Creditor conversion period is decreasing in every year. In the year 2009 it was 95
days. But in the year 2012 it was increased to 164 days. It was due to increased in the
creditors and increase in the purchase.
G). Working Capital Turnover Ratio
Net working capital turnover ratio indicates the velocity of the utilization of working
capital. A higher ratio indicates the effective utilization of working capital and a law
ratio indicates otherwise, the ratio can be expressed:
a) Cost of Sale = Cost of Goods Sold
ParticularsAs at
31.3.2012 (InLacs.)
As at31.3.2011(In Lacs.)
As at 31.3.2010(In Lacs.)
As at31.3.2009 (In
Lacs.)
Cost of Sale / Cost of Goods Sold 36358.39 40477.88 40268.86 44160.58
b) Average Working Capital = (Opening + Closing) / 2
Net Credit Annual SalesDebtors or Receivables Turnover Period = ---------------------------------
Average Trade Debtors
Cost of SalesWorking Capital Turnover Period = ---------------------------------
Average Working Capital

7/27/2019 Final Mohit Project
http://slidepdf.com/reader/full/final-mohit-project 54/55
MALWA COTTON SPINNING MILLS LIMITED
Working Capital Management Page 54
I Opening WorkingCapital 12265.29 13060.05 12847.03 12201.84
II Closing WorkingCapital 13777.00 12265.29 13060.05 12847.03
Average WorkingCapital {(I + II) / 2} 13021.145 12662.670 12953.540 12524.435
Working CapitalTurnover Ratio {a / b} 2.79 times 3.19 times 3.10 times 3.52 times
Interpretation
Working capital turnover ratio indicate that in the year 2009, ratio was 3.52 times
which means that in a that year 3.10 times working capital is turned over i.e.
converted into cash but it also increased in the year 2010 and 2011 to 3.19 and 2.79
times respectively.

7/27/2019 Final Mohit Project
http://slidepdf.com/reader/full/final-mohit-project 55/55
MALWA COTTON SPINNING MILLS LIMITED
CONCLUSION On making overall analysis of company. We arrive at conclusion that
company s performing satisfactorily. It should make effort to reduce the
operating cycle period, debtors „conversion period and increasing creditorsconversion period so as to realize early profits and cash. The liquidity position
of company is satisfactory. It can pay off its obligation in time. A company is
managing its inventory properly but efforts must be made to reduce the yearly
holding of inventory with the company it is having conservative approach in
financing of working capital.
Current ratio of the firm is according to the rule to which is 2:1 and the quick ratio of the company is also satisfactory.
The working capital turnover ratio of the company is fluctuating year by year.
Inventory turnover ratio is decreased year by year which indicate that its
inventory of finished good convert into sales efficiently.
Management of cash by the company is good.