Final Marketing Plan - SquarespaceMarketing+Plan.pdf · Team International Marketing Plan Team...
20
Team International Marketing Plan Team 01-01 Andrea Plotts Douglas Teixeira Shawn Rembecky The College of New Jersey May 2, 2011 Dr. Al Quinton Marketing 440-01 International Marketing Management
Transcript of Final Marketing Plan - SquarespaceMarketing+Plan.pdf · Team International Marketing Plan Team...

Team International Marketing Plan
Team 01-01
Andrea Plotts
Douglas Teixeira
Shawn Rembecky
The College of New Jersey
May 2, 2011
Dr. Al Quinton
Marketing 440-01 International Marketing Management

2
Table of Contents I. Executive Summary 3 II. Preliminary Country Analysis 3 III. Long-Term Goals 5 IV. Phase 1: Periods 1, 2, and 3 5 V. Phase 2: Periods 4, 5, 6, and 7 9 VI. Phase 3: Periods 8, 9, and 10 12 VII. Phase 4: Periods 11, 12, and 13 16 VIII. Lessons 17 IX. Improvements 17 X. Appendix 18

3
I. Executive Summary A. Our company, AllStar Brands, has decided to enter the Latin American toothpaste
market. A Current Situational Analysis, Marketing Strategy, and Financial Analysis were produced in order to determine the most attractive markets among the countries, consumer segments, and which products should be marketed to those segments. Of the countries in Latin America, Argentina, Brazil, and Mexico were deemed to have the most attractive markets and provided the best opportunity to increase our international market share. We entered all three of the aforementioned countries as well as built a manufacturing plant in Brazil, while continuing to utilize our plant in the United States, by completion of Phase 1. Throughout the simulation, AllStar Brands had been positioned in the minds of the consumers as a low cost leader. This strategy helped us to gain a positive net. regional contribution midway through Phase 2 and helped us be brand equity leaders in each market by completion of Phase 3.
B. Although AllStar Brands experienced great success in Brazil, production in Mexico and Argentina tapered off towards the end of the simulation. It was concluded that the problem could have been avoided in the two countries if we had not positioned ourselves as the low cost leader. The team could have also greatly benefited from better SKU diversification in each country, better salespeople allocation in each distribution channel, and a stronger focus with advertising campaigns in order to better target consumer segments.
C. By the end of the simulation, AllStar Brands enjoyed the greatest success of all competing brands in each of the three Latin markets. Our team, Team 01-01, had also finished in the top half of the final rankings of all teams participating in the simulation. Had the simulation continued, the team determined that we would not have been able to enjoy the same success for much longer and a new strategy would need to be deployed in order to keep AllStar Brands a strong presence in the Latin American toothpaste market. In response to our eminent decline, our team concluded that it would be beneficial for us to (1) enter a fourth market, Chile, while (2) diversifying our product line into dental health instead of strictly toothpaste products, and also (3) introduce a new brand that would be sold at a premium to compete with the other international toothpaste brands.
II. Preliminary Country Analysis A. Based on economic and cultural data, we limited our analysis to just the top four
most appealing markets amongst the Latin American countries: Argentina, Brazil, Chile, and Mexico
B. Economy 1. Gross Domestic Product
a. Brazil has the highest GDP, followed by Mexico, Argentina, and then Chile

4
b. The chart indicates that Brazil and Mexico would be best to enter
because of their ability to generate and spend capital C. Sociocultural
1. Population a. Brazil and Mexico have the highest populations and thus the
largest potential consumer markets
D. Industry Analysis
1. Manufacturing Sales a. Brazil and Mexico are the top Latin markets in terms of
manufacturing sales
$558
$2,024
$244
$1,466
$0
$500
$1,000
$1,500
$2,000
$2,500
Argen0na Brazil Chile Mexico
GDP
(inbillion
s)
Country
GDP(PurchasingPowerParity)
0
50,000,000
100,000,000
150,000,000
200,000,000
250,000,000
Argen0na Brazil Chile Mexico
Popu
la9o
n
Country
Popula9on
Exhibit 1
Exhibit 2

5
III. Long-Term Goals
A. Our long term goals were based on our preliminary country analysis B. Enter three Latin American markets
1. Mexico, Brazil, Argentina 2. All three were deemed to generate the most revenue because of their
growth potential C. Highest unit sales in each market D. Highest manufacturing sales in each market E. Minimize expenses in order to maximize net margin/net profit
1. Adjust advertising and promotional budget each period in order to increase cumulative net. regional contribution
F. Utilize appropriate channels 1. Focus on traditional and hypermarkets initially and then branch out into
web/other channels G. Low cost leader
1. Gain sales through competitive pricing H. Positive gross margin by the end of Phase 1
1. Ensure profitability of our brand I. Brand equity leaders in each market
1. Establish a strong customer base IV. Phase 1: Periods 1, 2, and 3
A. Short-Term Objectives B. Our numerical objectives for Phase 1 were based off of the practice Periods at the
beginning of the simulation 1. Unit sales of at least 500.0 million 2. Total manufacturing sales of at least $1,000.0 million
a. Estimated profit of $2 per unit sold 3. At least 25.0% share of total manufacturing sales 4. Brand equity of at least 75 5. Positive net regional contribution by the end of Phase 1
a. Anticipated initial spending (depreciation cost, etc.) in order to eventually become profitable
$192.70
$534.80
$113.10
$238.90
$0.00
$100.00
$200.00
$300.00
$400.00
$500.00
$600.00
Argen0na Brazil Chile MexicoMan
ufacturin
gSales(mill.U
SD)
Country
ManufacturingSales
Exhibit 3
6
C. Decisions 1. Market Entry/Exit
a. Mexico, entered market in Period 1 i. Served as a “guinea pig” country so that Team 01-01 could
get a grasp for the simulation ii. Since the plant in Brazil would not be available until Period
2, Team 01-01 found that it would be a good decision to only sell in Mexico because the plant in the U.S. would minimize shipping costs per unit as well as offer no tariffs, duties, or fees as a result of the NAFTA agreement between the United States and Mexico
b. Argentina, entered market in Period 2 i. Uncertainty surrounded Argentina and Chile when it came
to deciding which market offered the most potential for growth
ii. Ultimately, Argentina was decided upon because it slightly edged out Chile during a comparison of key market attractiveness factors between the two countries
c. Brazil, entered market in Period 2 i. Offered the most attractive market due to its high GDP,
large population, and manufacturing sales ii. Although there would be tough competition in Brazil,
proper positioning within the market could mean great success for Allsmile. Entering an industry with low switching costs to consumers, Team 01-01 did not believe the high competition to be a determining factor.
2. Distribution a. Focus on Traditional, Self Serve, Hypermarket, and Wholesale
channels i. The fifth distribution channel, Web/Other Home, had not
been utilized by our competitors and was deemed to be an unproven method of distribution at this point in the simulation
b. Large amount of promotion spending to begin the simulation i. To create brand awareness early so that AllStar Brands
could taper off spending later in the simulation and depend on our SKUs selling themselves
3. Production a. Built plant in Brazil in Period 1 for Period 2
i. This plant would serve Brazil and Argentina while the plant in the U.S. would serve Mexico.
ii. A plant in Brazil for Brazil and Argentina would minimize shipping costs per unit as well as offer no tariffs, duties, or fees as a result of the MERCOSUR agreement between Argentina, Brazil, and Chile.
b. Began with a plant capacity of 40 million units i. Since the team was unsure of how many units would be
sold between Argentina and Brazil after Period 2,

7
calculations showed a plant capacity of 40 million to be the most cost effective number until we could better determine a number based on anticipated sales
c. Grew to 100 million units i. Total unit sales for Argentina and Brazil amounted to 153.9
million. Considering the team was still getting used to the simulation, a decision was reached to only increase the plant capacity by 60 million in anticipation that sales may either decrease or level out following Period 3
4. Advertising a. The same three advertising campaigns were deployed in each
country: i. Families/Economy
ii. Families/White iii. Families/Healthy
b. Our campaigns targeted Families because a preliminary consumer analysis determined that the Family segment offered the largest population with the strongest purchasing power
c. Updated all of the ads every other Period i. Rather than discontinuing our current ads and creating new
ones, our team deemed it more cost effective to update the ads
ii. This method would also help to keep our ads fresh rather than letting them run for years and become outdated
d. Large advertising spending to begin the simulation i. Similar to promotion, the team wanted to create brand
awareness early so that AllStar Brands could taper off spending later in the simulation and depend on our SKUs selling themselves
5. SKUs & Pricing a. Began with three SKUs in each country
i. As with everything else, the team was still getting used to the simulation and decided it was safest to offer three generic medium-sized SKUs that were guaranteed to sell well while the simulation became more familiar
b. Grew to 5 SKUs in Argentina, 5 in Brazil, and 11 Mexico i. Since the team entered Mexico first, it was growing at a
quicker rate than Argentina and Brazil and Team 01-01 decided that it would be a good idea to expand the offered SKUs in order to take advantage of Mexico’s growing market
c. Positioned Allsmile as the low cost leader of the industry d. The product mix for each country was both tailored to the different
environments and used as a way to test which SKUs worked versus those that did not
8
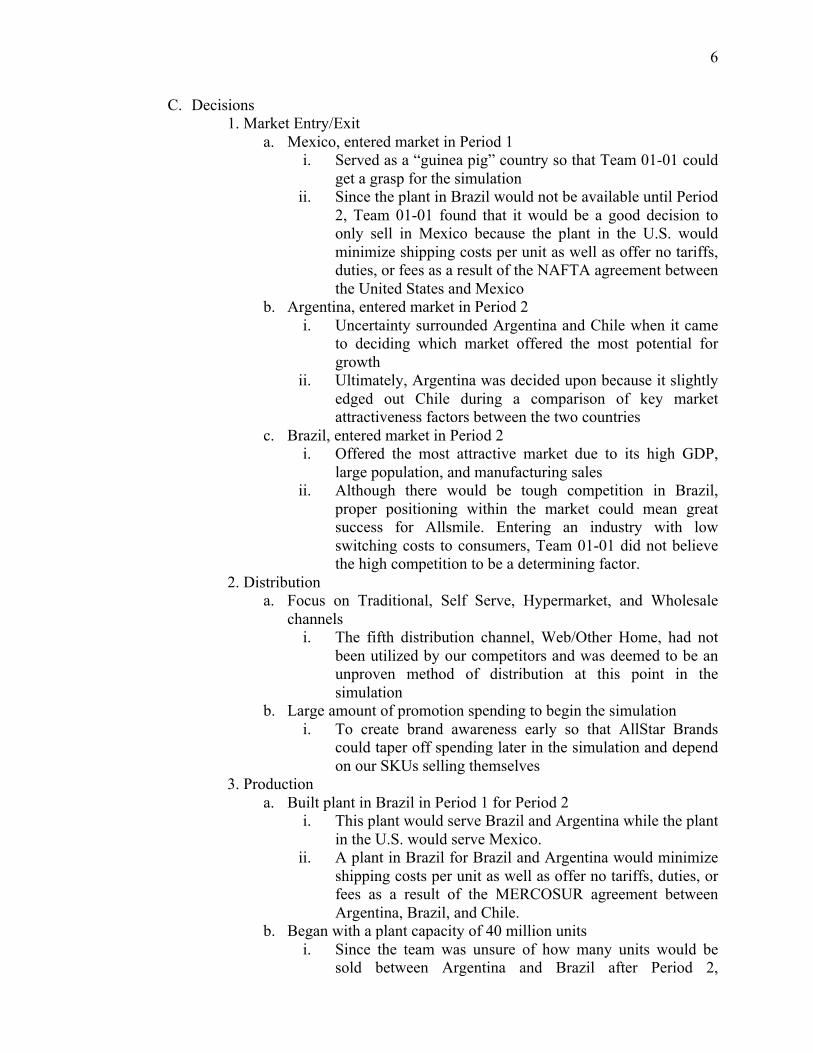
D. Results 1. Short-term objectives for Phase 1 compared to our actual numbers:
Unit Sales (mill.)
Total Mfr. Sales (mill.$)
Share of Mfr. Sales
(%)
Net. Regional Contribution
(mill.$) Brand Equity
Objective 500.0 $1,000.0 25.0% Positive Net.
Regional Contribution
75
Actual 655.8 $730.9 26.9% -$103.0 75
Result Achieved objective
Did not achieve objective
Achieved objective
Did not achieve objective
Achieved objective
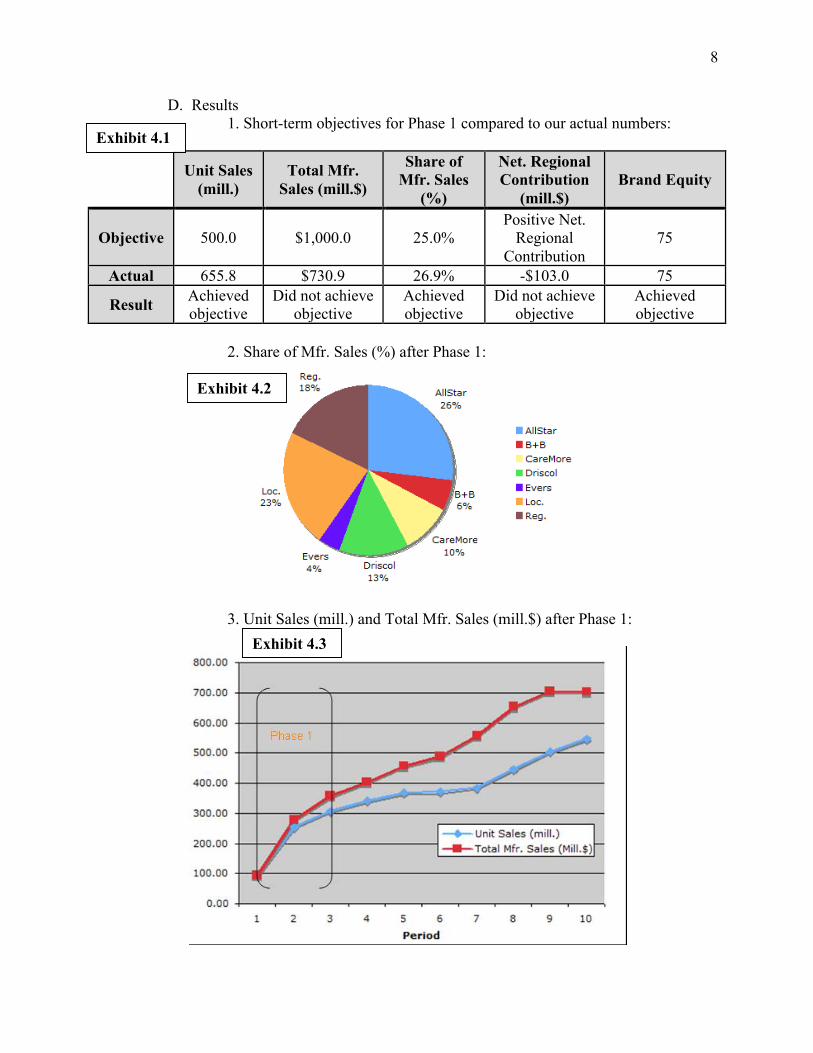
2. Share of Mfr. Sales (%) after Phase 1:
3. Unit Sales (mill.) and Total Mfr. Sales (mill.$) after Phase 1:
Exhibit 4.1
Exhibit 4.2
Exhibit 4.3

9
4. Full results of Phase 1:
V. Phase 2: Periods 4, 5, 6, and 7 A. Short-Term Objectives
1. Unit sales of at least 2,000.0 million a. Quadrupled sales objective from previous period
2. Total manufacturing sales of at least $1,500.0 million a. Increased sales objective, but failed to account for marginal
discrepancies 3. Maintain 25.0% share of total manufacturing sales 4. Maintain brand equity of 75 5. Net regional contribution of at least $100.0 million
a. By Phase 2, the team anticipated for our company to be profitable in Latin America
B. Decisions 1. Market Entry/Exit
a. None. We had already entered three Latin markets in Phase 1 and all three countries appeared to be working well for AllStar Brands
2. Distribution a. The distribution channels extended to Web/Other Home
i. Although still an unproven method of distribution, the team did not want to restrict distribution to just the other four channels to only later discover that Web/Other Home was being utilized by our competitors while AllStar Brands was left to play catch up
ii. In order to be an innovator, rather than a follower, in the industry, the team decided it optimal to take the chance with the Web/Other Home distribution channel
b. At this point, all three countries utilized all five distribution channels
c. Cut back on promotion expense i. The unit sales, manufacturing sales, and brand equity had
been steadily rising in all three countries from Phase 1 and throughout Phase 2. Because of this, the team decided AllStar no longer needed to spend as much on promotions because the products could “sell themselves”
3. Production a. Grew to 300 million units
i. As unit sales appeared to be leveling out in Argentina, unit sales in Brazil continued to grow as the Periods progressed. In anticipation of this growth, a plant capacity of 300
Exhibit 4.4

10
million was deemed to accurately account for projected sales over the last few Periods of the simulation
4. Advertising a. Cut back on advertising expense
i. As previously mentioned, our unit sales, manufacturing sales, and brand equity had been steadily rising in all three countries from Phase 1 throughout Phase 2. Because of this trend, the team decided we no longer needed to spend as much on advertising because the products could “sell themselves”
b. Continued to use the same three advertisements in each country and updated all of the ads every other Period
5. SKUs & Pricing a. In order to combat a negative period contribution in Argentina,
total SKUs grew to 14 total i. The new SKUs were positioned to target kids by
introducing kid products of small, medium, and large sizes as well as featuring the gel and/or pump
b. Balanced approach in Brazil with only 8 SKUs, all of which were medium-sized
c. More diversified approach in Mexico. All 11 SKUs were of different sizes and textures
i. Since Mexico was proving to be a strong market for our team, we enjoyed the flexibility of offering different SKUs in order to see which ones worked versus which ones did not so that we could feature the more successful ones in the other two countries
d. Continued to position Allsmile as the low cost leader i. At this point in the simulation, being the low cost leader
helped generate a high volume of unit sales and rake in even more in manufacturing sales
ii. Since this strategy appeared to be working, our team decided to continue with the plan of being the low cost leader
C. Results 1. Short-term objectives for Phase 2 compared to our actual numbers:
Unit Sales (mill.)
Total Mfr. Sales (mill.$)
Share of Mfr. Sales (%)
Net. Regional Contribution
(mill.$)
Brand Equity
Objective 1,500.0 $2,000.0 25.0% $100.0 75 Actual 2,126.6 $2,641.0 26.6% $140.0 77
Result Achieved objective
Achieved objective
Achieved objective
Achieved objective
Achieved objective
Exhibit 5.1
11
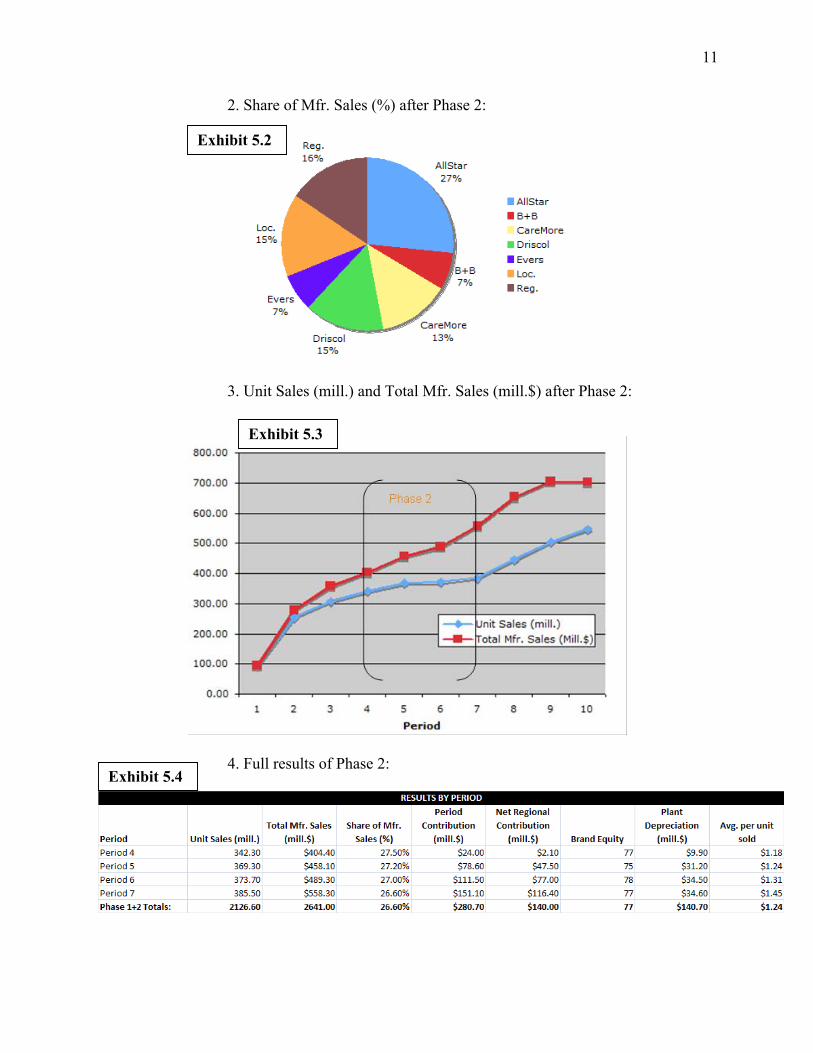
2. Share of Mfr. Sales (%) after Phase 2:
3. Unit Sales (mill.) and Total Mfr. Sales (mill.$) after Phase 2:
4. Full results of Phase 2:
Exhibit 5.4
Exhibit 5.2
Exhibit 5.3

12
VI. Phase 3: Periods 8, 9, and 10 A. Short-Term Objectives
1. Unit sales of at least 3,500.0 million 2. Total manufacturing sales of at least $5,000.0 million
a. Significantly higher sales objective due to adjustments in pricing strategy
3. At least 30.0% share of total manufacturing sales a. Wanted to capture a significant percent of the market by Phase 3
4. Brand equity of at least 80 a. Hoped to strengthen our brand by the final phase
5. Net regional contribution of at least $500.0 million B. Decisions
1. Market Entry/Exit a. None. We had already entered three Latin markets in Phase 1 and,
although we had run into great difficulty with our production in Argentina, our team decided to stay with the same three countries we had occupied throughout the entire simulation
2. Distribution a. All three countries continued to utilize all five distribution
channels b. Increased promotion expense upon observing competitors
increasing their promotion expense i. Unfortunately, we had resorted to playing “catch up” by
increasing our promotion expense in response to our competitors eating up large chunks of marketing share
3. Production a. Grew to 400 million units
i. Towards the end of the simulation, unit sales seemed fairly consistent in Argentina while unit sales in Brazil continued to grow. In anticipation of Brazil’s growth, plant capacity was increased to 400 million in order to account for projected sales during the last Periods of the simulation
4. Advertising a. Argentina, 3 advertisements:
i. Developed a more focused approach by eliminating the Family/Economy advertisement because that SKU was already experiencing high sales
ii. Added a new Young/White advertisement to target a new consumer segment
b. Brazil, 2 advertisements: i. Developed a more focused approach by eliminating the
Family/Economy advertisement because that SKU was already experiencing high sales
c. Kept the same 3 advertisements in Mexico d. Increased advertising expenses upon observing competitors
increasing their advertising expense e. Continued to update all of the ads in each country every other
Period

13
5. SKUs & Pricing a. Kept all 14 SKUs in Argentina
i. Unlike Brazil and Mexico, sales in Argentina were driven by which competitor offered the highest allowance and not by the MSRP
ii. Increasing allowances in Argentina served as a temporary solution to a problem that was just about to get worse
b. Added new SKUs to bring Brazil’s total count to 12 i. The 4 new SKUs were selected because of observed
competitors’ success offering those SKUs c. Kept all 11 SKUs in Mexico
i. Sales in Mexico remained relatively consistent and there was no perceived need to add any more SKUs than the ones we had offered throughout the entire simulation
C. Results 1. Short-term objectives for Phase 3 compared to our actual numbers:
Unit Sales (mill.)
Total Mfr. Sales (mill.$)
Share of Mfr. Sales (%)
Net. Regional Contribution
(mill.$) Brand Equity
Objective 3,500.0 $5,000.0 30.0% $500.0 80 Actual 3,637.9 $4,707.3 28.9% $447.4 78
Result Achieved objective
Did not achieve objective
Did not achieve objective
Did not achieve objective
Did not achieve objective
2. Share of Mfr. Sales (%) after Phase 3:
Exhibit 6.1
Exhibit 6.2

14
3. Unit Sales (mill.) and Total Mfr. Sales (mill.$) after Phase 3:
4. Full results of Phase 3:
Exhibit 6.4
Exhibit 6.3

15
5. Full results of all three countries at completion of the simulation:
Exhibit 6.5

16
VII. Phase 4: Periods 11, 12, and 13 A. Short-Term Objectives
1. Unit sales of at least 5,500.0 million 2. Total manufacturing sales of at least $7,000.0 million 3. At least 30.0% share of total manufacturing sales 4. Brand equity of at least 80 5. Net regional contribution of at least $800.0 million
B. Decisions 1. The Plan:
a. To create a new brand that will carry AllStar’s higher priced products to be sold at a premium
i. Since Allsmile was positioned as the low cost leader in each country, this tactic really restricted the growth of the company
ii. With a new brand, the company can afford to continue to position Allsmile as the low cost leader of the industry
b. Create a new advertising campaign for the new brand that will target a new consumer market
i. With Allsmile, we were able to target Families and sell Kid formulations
ii. With the new brand, we will be able to target a Young consumer market with Whiteness and Healthy formulations
c. With a well-established brand name throughout three Latin American countries, AllStar brands can also diversify the product line into dental health instead of strictly toothpaste products
i. In order to better penetrate the market, AllStar should start creating basic dental health products like toothbrushes and floss
ii. If these products are successful, then its recommended that AllStar diversify the product mix even further
2. Market Entry/Exit a. Chile, enter market in Period 11
i. As mentioned at the beginning of the market plan, great uncertainty surrounded Argentina and Chile when it came to deciding which market offered the most potential for growth
ii. Considering Allsmile was struggling in Argentina, the team was looking forward to testing the market in Chile
iii. Should Chile offer more promise and growth than Argentina, Allsmile would then deploy an exit strategy from the failing Argentinean market
3. Distribution a. Continue to utilize all five distribution channels in each of the
three countries b. Allocate salespeople according to anticipated sales in each channel c. Increase spending on promotion as Allsmile prepares for a
transitional period where they move towards appealing to a new consumer market

17
4. Production a. Increase plant capacity to 600 million units
i. The plant in Brazil would begin to serve Chile as well as continue to serve Argentina and Brazil. The increase in plant capacity would anticipate the continued growth in Brazil, the new unit sales in Chile, and the rather stagnant sales in Argentina
5. Advertising a. Move away from the advertising campaigns we have been using
for the past ten Periods and feature new campaigns that appeal to a new consumer market while the more popular SKUs, previously advertised, continue to sell themselves
6. SKUs & Pricing a. Progressively move towards increasing MSRPs and competing
more with the international brands who sell at a premium that the local and regional brands
VIII. Lessons A. Pricing issues
1. Do not cannibalize our own sales 2. Make sure gross margins for substitute products are similar
B. Oversimplification 1. Increasing one variable does not necessarily mean an increase in other
variables 2. Some decisions, such as sales force allocation, need to be set individually
by each distribution channel instead of setting them based upon overall expense level
C. Be mindful of contributions 1. Made the mistake of lowering prices and increasing expenses too much 2. Just because the gross margins are positive, it does not mean that the end
result will be profitability 3. Should we increase marketing expenses and lower prices at the same
time, the end result could be disastrous if it is not well planned out D. Benchmarking
1. Pay closer attention to the activity of competitors 2. Going along with the aforementioned lesson of oversimplification,
benchmarking competitor activities should not be oversimplified and should be scrutinized with attention to detail
3. If strategies are devised from competitor positioning and strategy, then it is crucial that those activities are fully understood
a. For example, it is not good enough to look at competitor overall promotional spending because the promotional dollars may not even be spent in the channels that closely compete with AllStar brands
IX. Improvements A. Low cost leader
1. Positioning ourselves as the low cost leader limited our growth 2. Should have positioned AllStar Brands as the low cost leader at first to
gain market share, but slowly raised prices as our market share improved

18
and our brand was more established in order to increase our margins and ultimately become more profitable
3.An overall price positioning as the medium priced alternative to competitor’s low or high priced products would be optimal
B. SKU diversification 1. Keep a closer eye on gross margins of each SKU so that we can turn in a
bigger, quicker profit 2. Adding more SKUs to the product mix is beneficial as long as the new
SKUs do not cannibalize the sales of existing AllStar products 3. If the individual SKU gross margins are comparable, then it does not
matter if AllStar customers switch to our new SKUs because we will not be losing money and will be giving the customer what they want. In an attempt to gain more sales and market share, we minimized pricing without acknowledging the impact on gross margin. In general, it is crucial to future success that sales margins stay high enough to cover all expenses.
C. Salespeople 1. Better allocation of salespeople earlier in the simulation in order to
establish a stronger presence in each distribution channel. 2. Because of the learning curve with getting to know the simulation, the
sales force was not set to optimal capacity until the end. 3. It was discovered that once the sales force reached a certain level in each
distribution channel in each country, there was little impact by adding more. By setting the sales force above this optimal capacity, there was too much wasted expense
4. Finding the optimal sales force for each individual channel early on would minimize wasted expense and help to maximize net profit
D. Advertising 1. Alternate advertising campaigns rather than continuing to run the same
ads throughout the entire simulation. 2. Since AllStar brands offered a variety of SKU benefits in Latin America,
it would be more beneficial to overall brand equity to advertise all of the benefits in a rotation basis.
3. Instead of constantly offering the same three advertisements, a strategy that alternated ad benefits every two years could raise awareness and sales of each different benefit
a. Given an alternating advertisement strategy, customers would see new ads every two years instead of the same ads ones year after year.
4. The majority of AllStar’s Latin American sales resulted from the few SKUs that were advertised throughout the simulation
a. Alternating ad benefits would boost the overall sales of all of the SKUs offered and it would promote an image of AllStar brands continually updating and changing, instead of staying stagnant throughout the simulation.
X. Appendix A. Appendix A: Marketing Plan Checklist B. Appendix B: Future Marketing Plan Guidelines

19
Appendix A Marketing Plan Checklist
Copy this checklist and have each person initial at the end of each section to indicate understanding of what is required.
1. We thoroughly analyzed the firm's current business situation and organized relevant data. We did not include "filler" sentences to increase page length and only included information that was crucial to the problem definition, provision of alternatives, and alternative recommendation. _________
2. We did not present vague generalities or platitudes. Our statements were specific and used numerical information. _______
3. Our analysis provided implications and conclusions based on case facts and did not just restate and organize case facts into situation analysis sections. __________
4. Our situation analysis included a discussion of the industry environment (size, growth, and attractiveness), the customer/consumer (who are they and why do they buy the product), the company (size, growth, quality of management, mission/objectives, strategies, constraints, competencies), and the competition (shares, strategies, competencies). __________
5. We presented appropriate exhibits. Our exhibits either tables, charts or other graphics provide significant data used in our analysis. _________
6. We summarized the situation analysis presenting the internal strengths and weaknesses of the company, the external opportunities and threats facing the company. ___________
7. We either presented the objectives that the company has articulated and/or presented our opinion as to the objectives that the company should have. These objectives are specific, measurable, consistent with each other, and realistic in light of the situation. This statement of objectives (and the SWOT analysis) guided my choice of alternatives/decisions. _________
8. We stated the firm's problems/opportunities in a way that calls for decisions and did not confuse the problems with symptoms such as declining sales or profitability. _______
9. We presented only those decision alternatives that solved the problem or exploited an opportunity. _______ 10. We separated strategic (general direction) and tactical (implementation) alternatives. _______ 11. We organized the alternatives in a logical way (strategic first, then tactical) and evaluated these alternatives
separately. Each set of alternatives is mutually exclusive (so that only one can be chosen). __________ 12. We did not offer options such as: do nothing or do something; do more market research to find a solution
to the problem, or hire a consultant to analyze the situation, offer alternatives, or make a decision. ___________
13. We thoroughly evaluated each alternative by stating advantages and disadvantages of each alternative in specific terms using data from my situation analysis and exhibit analysis. __________
14. The recommended alternatives and tactical implementations are consistent with the objectives that we presented and the situation facing the firm. __________
15. The recommended course of action included an adequate discussion of sufficient implementation details to ensure that the firm is capable of implementing that course of action, including a pro-forma income statement. _______
16. Our recommendations and implementations may have emphasized one of the 4 "P's", but we discussed the other "P's" so that the marketing decisions in one area must be consistent with other marketing areas. _______
17. Our report is: a. Well organized, including adequate use of heading, subheading, and coherent paragraphs. _______ b. Clear, with simple, complete, and understandable sentences. _______ C. Persuasive, logical, and internally consistent. _______ d. Correct grammar and spelling. _______

20
Appendix B Future Marketing Plan Guidelines
1. Our executive summary provided key (specific/numerical) information about the company’s (brand’s)
situation including sales level, growth, profitability (growth), and share. It provided important recent events such as successful (unsuccessful) new product introductions (you your firm or competitors). It asked for a budget (increase) and justification in terms of expected increase in sales and profit.
2. Our introduction discussed an overview of company performance and industry performance, recent strategy.
3. Our situation analysis included: a) A discussion of the industry environment (market size, growth, attractiveness, and
opportunities), b) The chosen customer segment (including needs, purchase criteria, purchase frequency, and
shopping habits), c) The company (size, sales and profit growth, portfolio/composition of sales, history of
achievement of objectives, diagnosis of symptoms, constraints, previous strategies, competencies/strengths and weaknesses),
d) And the competition (shares, spending strategies, competitive strategies, strengths/weaknesses, reasons for success/failure).
This discussion is not just a recitation of facts but provide your conclusions and implications for strategies and tactics.
4. We provided specific and measurable company and brand objectives including forecasted sales level, share, justified by objectives for distribution, awareness, and trial. The objectives are internally consistent (logical) and externally consistent (realistic). Our short-term objectives are consistent with our long-term objectives.
5. We justified target market selection based on segment attractiveness and ability to provide superior value compared to competition.
6. We provided appropriate exhibits, analyzed (math, percentages, ratios) those exhibits, and referred to the analysis throughout the plan. We used the numbers from this analysis to justify any conclusion. We provided a pro-forma income statement for the company and each brand (including budgets). For the Country Manager simulation all data is available on line.
7. Prior to marketing mix tactical decisions (for each brand) we discussed overall growth strategies (e.g. penetration), competitive strategies (e.g. low cost), and R&D strategies (e.g. innovation leadership). The marketing mix discussion was thorough including justification for price level (versus competition), product features, advertising research spending, copy emphasis, promotion spending emphasis, and sales force allocation. There is an adequate discussion of how this marketing mix will accomplish the brand and marketing objectives.
8. Throughout our plan we use specific language (including numerical data) and avoided vague generalities or platitudes.
9. Our plan is well organized and flowed logically. We used paragraph headings and subheadings. The discussion after a heading was consistent with that heading.
10. There is an adequate discussion of new product plans for the future and a timetable of activities involved with those new products.
11. The implementation section provides an adequate discussion of pro-forma income statements, budgets, timetables, and standards of performance.