Final LIHEAP Survey 2013v4
48
Arkansas LIHEAP Survey Results 2013 i Arkansas Low- Income Home Energy Assistance Program (LIHEAP) Survey FY 2013 This report is a compilation of payment amounts and numbers of applicants served by the Arkansas LIHEAP program in FY 2013. Arkansas Community Action Agencies Association, Inc. November 5, 2014
-
Upload
ludwik-kozlowski-jr -
Category
Documents
-
view
32 -
download
0
Transcript of Final LIHEAP Survey 2013v4

Arkansas LIHEAP Survey Results 2013
i
Arkansas Low-Income Home Energy Assistance Program (LIHEAP) Survey
FY 2013
This report is a compilation of payment amounts and numbers of applicants served by the Arkansas LIHEAP program in FY 2013. Arkansas Community Action Agencies Association, Inc. November 5, 2014

Arkansas LIHEAP Survey Results 2013
ii
Table of Contents
Letter to OCS p. 1
Executive Summary p. 2
LIHEAP Overview p. 5
LIHEAP Payments on Behalf of Eligible Clients p. 7
Payments by Congressional District p. 14
1st Congressional District Payments p. 15
2nd Congressional District Payments p. 16
3rd Congressional Districts Payments p. 17
4th Congressional District Payments p. 18
Winter Program Payment Breakdown by Congressional District p. 19
Summer Program Breakdown by Congressional District p. 20
FY 2013 Overall Amounts Paid by Congressional District p. 21
Payments to Utilities, Other Vendors, and Applicants for FY 2013 p. 23
Total Applicants Served p. 27
Applicants Served by 1st Congressional District p. 28
Applicants Served by 2nd Congressional District p. 30
Applicants Served by 3rd Congressional District p. 31
Applicants Served by 4th Congressional District p. 32
Observations and Analysis p. 33
Average Payment per Applicant p. 39
Arkansas LIHEAP Survey Results 2013
1
Arkansas Community Action Agencies Association, Inc. (ACAAA) 300 S. Spring Street, Suite 1020
Little Rock, AR 72201 (501)372-0807
November 5, 2014
Ms. Lorie Williams
Arkansas DHS/OCS
P.O. Box 1437, Slot S330
Little Rock, AR 72203-1437
Dear Ms. Williams:
Enclosed is a report of the results of the FY 2013 LIHEAP survey with data compiled or
provided by the 16 community action agencies that administer the program at the local
level.
If you have any questions regarding this report, please contact me at 501-372-0807.
Sincerely,
Ludwik J. Kozlowski, Jr.
ACAAA Energy Policy Coordinator

Arkansas LIHEAP Survey Results 2013
2
Executive Summary
In Fiscal Year (FY) 2013, The Fourth and First Congressional Districts received most of the LIHEAP payments and had a majority of the applicants served. These are also the two Congressional Districts in the state with the highest aggregate poverty rates.
In FY 2013, as in the previous year, all four Congressional Districts had more applicants for the winter program than for the summer program. In FY 2011, the two more southern districts (Second and Fourth) had more applicants in the summer than winter, but FY 2011 had a higher funding level, allowing for a higher number of clients to be served during the summer LIHEAP program. Fewer funds available in FY 2013 resulted in five subgrantees not being able to open a Summer Crisis program for the first time in recent years.
Statewide winter payments were $14,652,165.00, and summer program payments were
$5,575,641.52 for a total of $20,227,806.52 paid out in LIHEAP FY 2013. This total is
$4,019,934.55 (or 17%) less than the FY 2012 funds of $24,247,741.07.1
Of the $20,230,109.52 paid out to vendors2 in FY 2013, $15,081,452.70 (75%) went to
electric utilities, while 23%3 went to various other heating sources, and approximately
2% was paid directly to applicants.
Over 31% of the total applicants served in Arkansas in FY 2013 received assistance during the summer cooling program. This is down from over 41% in 2012 when funding was higher. There was $3,832,706.07 less allocated for summer 2013 than in summer 2012, which resulted in nearly 26,000 fewer applicants being helped during the period.4
The average payment overall across all programs during the FY 2013 LIHEAP year was $154.55. This is up $4.72 from the 2012 average of $149.83 but down $11.67 from the FY 2011 average of $166.225, when more funds were available.
1 Figures shown here reflect the payment breakdown by county and congressional district. However, the breakouts by vendors showed $2,303.00 more in winter. 2 Amounts paid out by Congressional District differed by $2,303.00 less. 3 Mid-Delta Community Services did not have breakdowns by vendor but rather just an overall amount paid out of $955,120.00. The unspecified vendor payment was grouped under the various heating sources category since no specifics were available for winter by vendor. 4 Statistics taken from the Congressional District payments which was $2,303.00 less than the vendors total. 5 The total number of applicants does not represent an unduplicated count. Applicants potentially can receive help under Regular Winter LIHEAP, Crisis Winter LIHEAP, Summer Regular LIHEAP, and Summer Crisis LIHEAP, although this is an extreme example. FY 2012 was the first
Arkansas LIHEAP Survey Results 2013
3
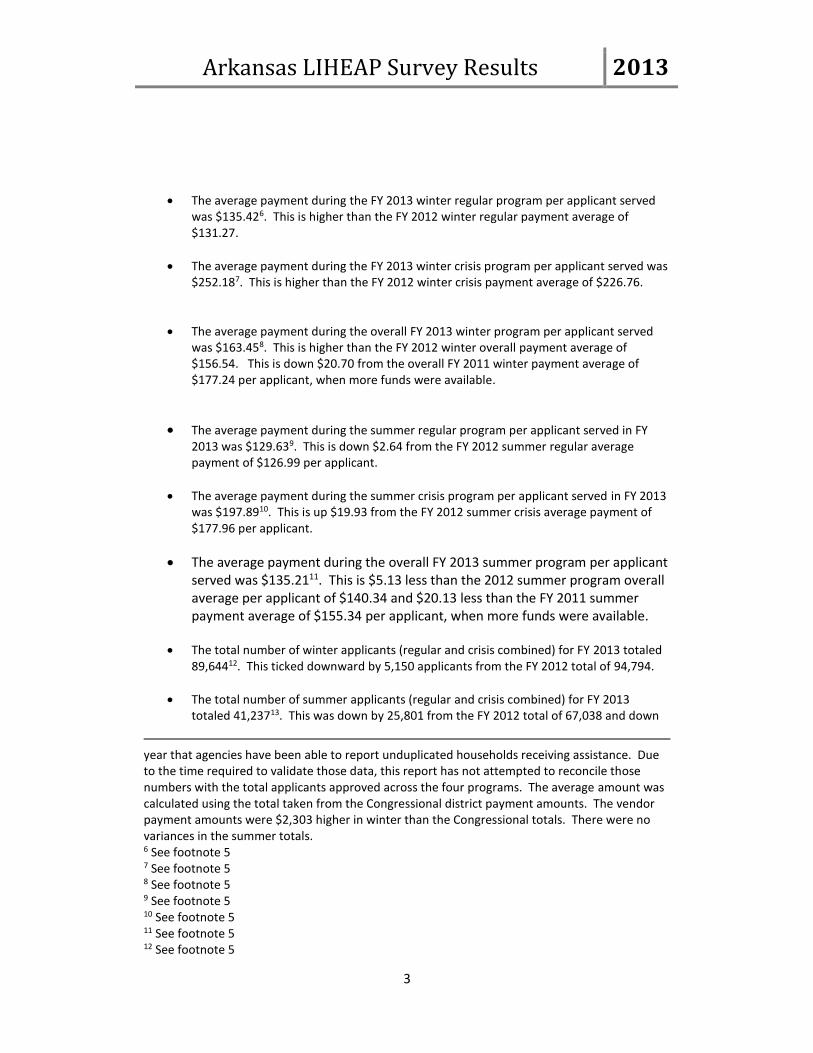
The average payment during the FY 2013 winter regular program per applicant served was $135.426. This is higher than the FY 2012 winter regular payment average of $131.27.
The average payment during the FY 2013 winter crisis program per applicant served was $252.187. This is higher than the FY 2012 winter crisis payment average of $226.76.
The average payment during the overall FY 2013 winter program per applicant served was $163.458. This is higher than the FY 2012 winter overall payment average of $156.54. This is down $20.70 from the overall FY 2011 winter payment average of $177.24 per applicant, when more funds were available.
The average payment during the summer regular program per applicant served in FY 2013 was $129.639. This is down $2.64 from the FY 2012 summer regular average payment of $126.99 per applicant.
The average payment during the summer crisis program per applicant served in FY 2013 was $197.8910. This is up $19.93 from the FY 2012 summer crisis average payment of $177.96 per applicant.
The average payment during the overall FY 2013 summer program per applicant served was $135.2111. This is $5.13 less than the 2012 summer program overall average per applicant of $140.34 and $20.13 less than the FY 2011 summer payment average of $155.34 per applicant, when more funds were available.
The total number of winter applicants (regular and crisis combined) for FY 2013 totaled 89,64412. This ticked downward by 5,150 applicants from the FY 2012 total of 94,794.
The total number of summer applicants (regular and crisis combined) for FY 2013 totaled 41,23713. This was down by 25,801 from the FY 2012 total of 67,038 and down
year that agencies have been able to report unduplicated households receiving assistance. Due to the time required to validate those data, this report has not attempted to reconcile those numbers with the total applicants approved across the four programs. The average amount was calculated using the total taken from the Congressional district payment amounts. The vendor payment amounts were $2,303 higher in winter than the Congressional totals. There were no variances in the summer totals. 6 See footnote 5 7 See footnote 5 8 See footnote 5 9 See footnote 5 10 See footnote 5 11 See footnote 5 12 See footnote 5

Arkansas LIHEAP Survey Results 2013
4
53,231 from the FY 2011 number of summer applicants, which was 94,46814. With $3,832,706.07 less for the summer FY 2013 program to spend than in summer 2012, this resulted in a great decline in the number of clients who were helped during the critical hot, summer months. Having 41% less money to spend overall in Summer FY 2013 compared to Summer FY 2012 also had an impact on the summer program resulting in several agencies being unable to operate a Summer Crisis program.
The total number of all applicants (Winter Regular, Winter Crisis, Summer Regular, Summer Crisis) for FY 2013 totaled 130,881. This was down by 30,951 compared to the FY 2012 total of 161,832 and down 56,879 from the FY 2011 number of total applicants which was 187,76015.
The number of applicants served In FY 2013 (130,881), was 20% less than the number served in FY 2012 (161,832), resulting in less clients receiving assistance.16
13 See footnote 5 14 See footnote 5 15 See Footnote 5 16 See footnote 5

Arkansas LIHEAP Survey Results 2013
5
LIHEAP Overview The LIHEAP program is a local-state-federal program established in 1981 by legislation approved by Congress and the President to help people of low and moderate income pay for home energy. It is funded by the Office of Community Services (OCS) of the U.S. Department of Health and Human Services; is administered in Arkansas by the state OCS; and is operated by the state’s 16 private, nonprofit community action agencies (CAAs), in cooperation with the state’s electric and natural gas utilities and other energy providers.
Figure 1 – Map of the 16 CAAs across the state of Arkansas17
The agencies inform the public of the service through newspapers, television, radio, Web sites, partner organizations, fliers, and word of mouth. Persons who are elderly or disabled may apply in writing; others may apply in person. Typically, LIHEAP has a Winter Regular and Winter Crisis program. If funds are available, there is also a summer program for electric cooling only. The regular program helps eligible clients with an energy bill once per program period (once in winter; once in summer, should there be funds). For Regular Assistance, a payment must be made to the household or home energy supplier within 35 days after the date the application is received in the respective CAA’s office.
17 Source: Arkansas Community Action Agencies Association, Inc. http://www.acaaa.org

Arkansas LIHEAP Survey Results 2013
6
The Crisis Program helps clients who have a shut-off notice effective within seven days or less from the date of application or in the event that a shut-off has already occurred. Assistance that will resolve the household’s crisis situation must be provided within 48 hours after a signed application is received by the CAA, if the household is eligible for such assistance. If the energy crisis or emergency is creating a life-threatening situation for the household, assistance must be provided within 18 hours after a signed application is received. For crisis applicants, payments must be made within 20 days. A household that has received Regular help during the program period could be eligible for Crisis funds in the same program period, should there be funds available and they have a shut-off notice. In Fiscal Year (FY 2013), the eligibility ceiling was based on 60% of the state’s median income for all households. Clients are served on a first-come, first-served basis until funds are depleted.

Arkansas LIHEAP Survey Results 2013
7
LIHEAP Payments on Behalf of Eligible Clients In FY 2013, the total amount of LIHEAP funds paid out in Arkansas to utilities/vendors/applicants was $20,230,109.5218, as reported to ACAAA by the 16 CAAs and as indicated in Tables 1 and 2. This is $4,017,631.55 less than the $24,247,741.07 paid out in FY 2012. Table 1 - Agency Paid Out Totals FY 2013
Action Agency Winter Regular Winter Crisis Summer Regular Summer Crisis Total
ARVAC $728,227.61 $153,392.77 $444,448.00 $100,056.93 $1,426,125.31
BRAD $296,168.00 $130,954.64 $105,975.00 $0.00 $533,097.64
CADC $2,076,727.00 $1,711,225.61 $810,608.00 $0.00 $4,598,560.61
CAPCA $409,655.72 $195,192.32 $307,406.00 $63,333.24 $975,587.28
CRDC $956,353.00 $530,203.34 $527,751.00 $104,036.25 $2,118,343.59
C-SCDC $463,683.00 $229,585.19 $273,233.00 $93,239.14 $1,059,740.33
CSO $198,211.00 $73,837.41 $208,935.00 $55,135.35 $536,118.76
EOAWC $389,796.00 $186,644.01 $164,274.00 $0.00 $740,714.01
MCAEOC $282,526.93 $184,487.42 $144,463.00 $126,750.99 $738,228.34
MDCS $600,296.00 $354,824.00 $127,552.00 $4,037.00 $1,086,709.00
NADC $391,391.00 $248,800.26 $233,497.00 $0.00 $873,688.26
OHC $280,753.00 $170,150.65 $233,522.00 $0.00 $684,425.65
OOI $395,030.00 $140,878.33 $334,573.00 $60,327.67 $930,809.00
PBJCEOC $660,280.00 $502,064.87 $280,440.00 $0.00 $1,442,784.87
SEACAC $463,510.00 $283,678.00 $358,237.00 $29,077.86 $1,134,502.86
SWADC $593,764.05 $372,176.87 $353,821.00 $30,912.09 $1,350,674.01
Totals $9,186,372.31 $5,468,095.69 $4,908,735.00 $666,906.52 $20,230,109.52
18 Figures shown here reflect the payment breakdown to vendors and applicants. The payments by county showed $2,303.00 less in the Winter Regular program than what is seen in the table above.
Arkansas LIHEAP Survey Results 2013
8
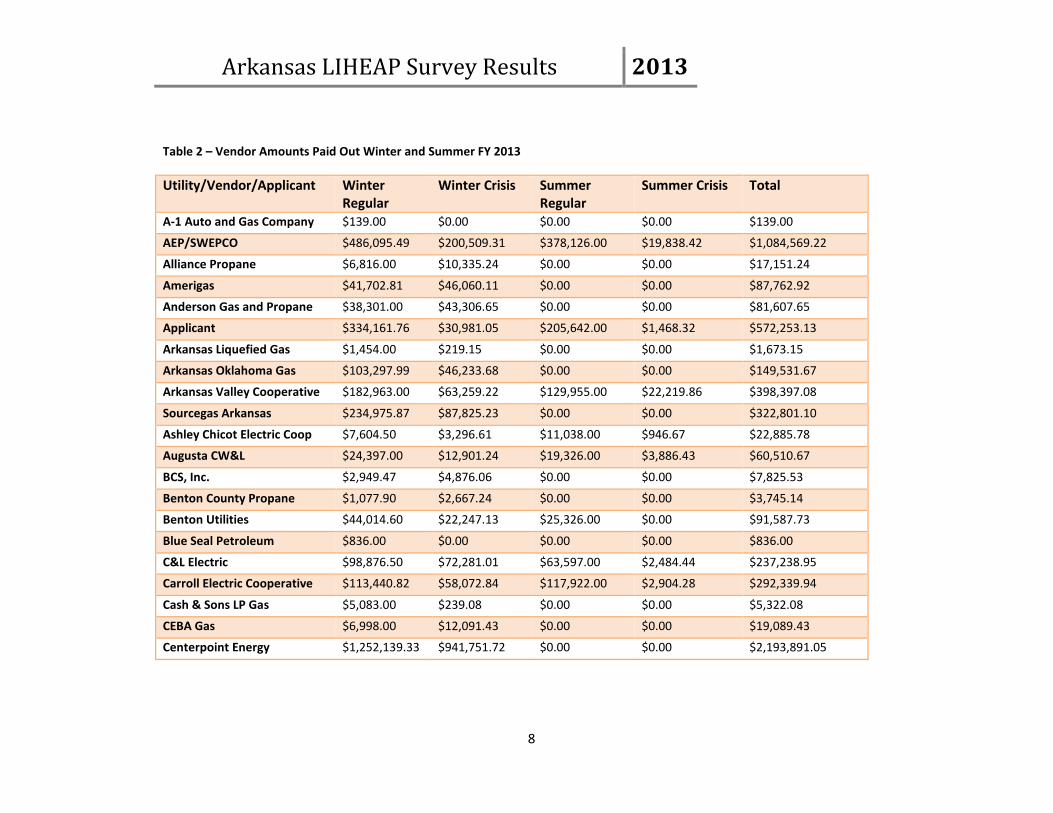
Table 2 – Vendor Amounts Paid Out Winter and Summer FY 2013
Utility/Vendor/Applicant Winter Regular
Winter Crisis Summer Regular
Summer Crisis Total
A-1 Auto and Gas Company $139.00 $0.00 $0.00 $0.00 $139.00
AEP/SWEPCO $486,095.49 $200,509.31 $378,126.00 $19,838.42 $1,084,569.22
Alliance Propane $6,816.00 $10,335.24 $0.00 $0.00 $17,151.24
Amerigas $41,702.81 $46,060.11 $0.00 $0.00 $87,762.92
Anderson Gas and Propane $38,301.00 $43,306.65 $0.00 $0.00 $81,607.65
Applicant $334,161.76 $30,981.05 $205,642.00 $1,468.32 $572,253.13
Arkansas Liquefied Gas $1,454.00 $219.15 $0.00 $0.00 $1,673.15
Arkansas Oklahoma Gas $103,297.99 $46,233.68 $0.00 $0.00 $149,531.67
Arkansas Valley Cooperative $182,963.00 $63,259.22 $129,955.00 $22,219.86 $398,397.08
Sourcegas Arkansas $234,975.87 $87,825.23 $0.00 $0.00 $322,801.10
Ashley Chicot Electric Coop $7,604.50 $3,296.61 $11,038.00 $946.67 $22,885.78
Augusta CW&L $24,397.00 $12,901.24 $19,326.00 $3,886.43 $60,510.67
BCS, Inc. $2,949.47 $4,876.06 $0.00 $0.00 $7,825.53
Benton County Propane $1,077.90 $2,667.24 $0.00 $0.00 $3,745.14
Benton Utilities $44,014.60 $22,247.13 $25,326.00 $0.00 $91,587.73
Blue Seal Petroleum $836.00 $0.00 $0.00 $0.00 $836.00
C&L Electric $98,876.50 $72,281.01 $63,597.00 $2,484.44 $237,238.95
Carroll Electric Cooperative $113,440.82 $58,072.84 $117,922.00 $2,904.28 $292,339.94
Cash & Sons LP Gas $5,083.00 $239.08 $0.00 $0.00 $5,322.08
CEBA Gas $6,998.00 $12,091.43 $0.00 $0.00 $19,089.43
Centerpoint Energy $1,252,139.33 $941,751.72 $0.00 $0.00 $2,193,891.05

Arkansas LIHEAP Survey Results 2013
9
Utility/Vendor/Applicant Winter Regular
Winter Crisis Summer Regular
Summer Crisis Total
City of Bentonville $33,139.05 $9,727.81 $35,340.00 $0.00 $78,206.86
City of Siloam Springs $10,908.63 $1,972.47 $12,888.00 $0.00 $25,769.10
Clarksville Light and Water $26,217.00 $3,544.54 $23,112.00 $3,177.41 $56,050.95
Clay County Electric Coop $46,540.50 $32,057.97 29,504.00 $0.00 $108,102.47
Coleman Butane $3,956.00 $5,360.79 $0.00 $0.00 $9,316.79
Conway Corporation $83,835.82 $19,871.87 $73,286.00 $6,995.13 $183,988.82
Craft LP Gas $2,203.00 $1,725.02 $0.00 $0.00 $3,928.02
Craighead Electric Coop $75,928.00 $52,453.40 $41,833.00 $2,730.04 $172,944.44
Cunningham $1,139.00 $551.00 $0.00 $0.00 1,690.00
Danmar Propane $5,202.00 $2,902.90 $0.00 $0.00 $8,104.90
DeClerk LP Gas $8,473.00 $2,777.10 $0.00 $0.00 $11,250.10
Dee's Propane Store $139.00 $0.00 $0.00 $0.00 $139.00
Empire Distric Electric $16,992.10 $18,003.54 $17,879.00 $0.00 $52,874.64
Entergy Arkansas $3,326,005.35 $1,985,029.22 $2,536,540.00 $351,452.51 $8,199,027.08
EZE Cook LP Gas $3,466.00 $2,840.72 $0.00 $0.00 $6,306.72
Farmer's Electric Coop $25,123.00 $10,256.50 $24,728.00 $2,982.07 $63,089.57
Farmer's Oil $6,975.00 $8,143.71 $0.00 $0.00 $15,118.71
Farmer's Supply $2,647.00 $399.88 $0.00 $0.00 $3,046.88
Ferrell Gas $42,589.50 $40,617.97 $0.00 $0.00 $83,207.47
First Electric Cooperative $190,206.08 $97,739.00 $116,795.00 $9,052.62 $413,792.70
Fricks $1,911.00 $0.00 $0.00 $0.00 $1,911.00
George's Propane $2,145.16 $2,483.51 $0.00 $0.00 $4,628.67
Graves Propane $9,715.00 $9,124.69 $0.00 $0.00 $18,839.69
Gresham Petroleum $15,397.50 $35,960.05 $0.00 $0.00 $51,357.55
Arkansas LIHEAP Survey Results 2013
10
Utility/Vendor/Applicant Winter Regular
Winter Crisis Summer Regular
Summer Crisis Total
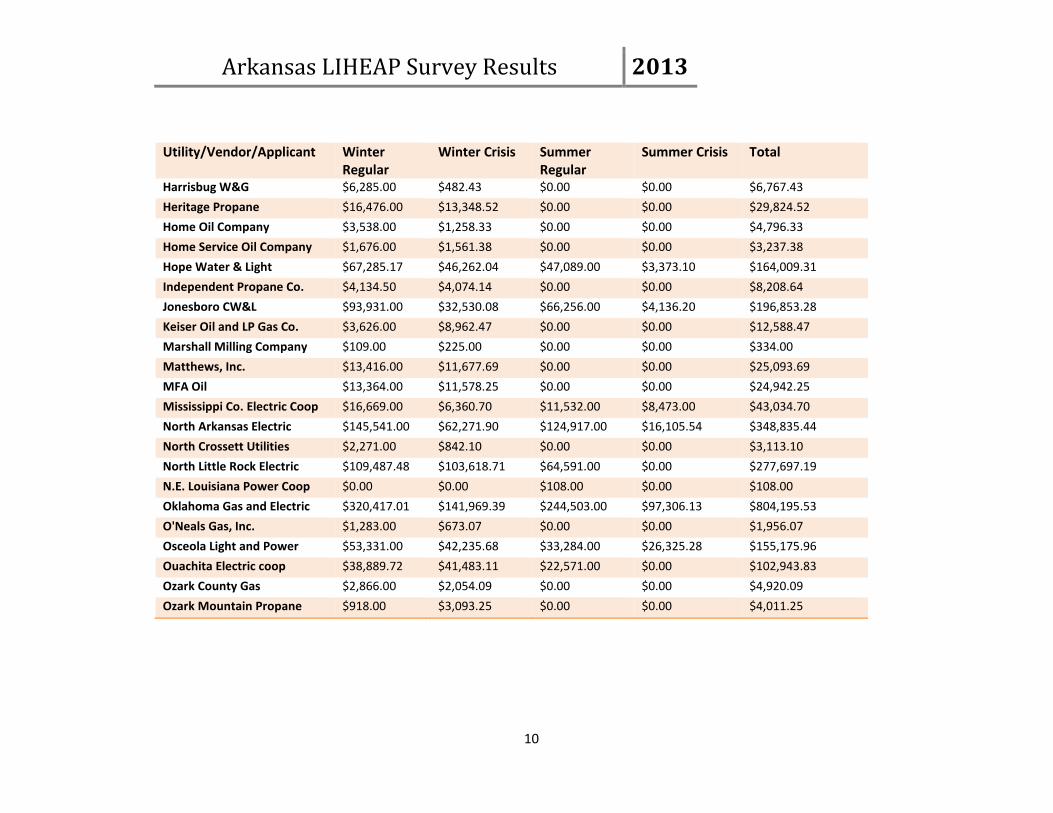
Harrisbug W&G $6,285.00 $482.43 $0.00 $0.00 $6,767.43
Heritage Propane $16,476.00 $13,348.52 $0.00 $0.00 $29,824.52
Home Oil Company $3,538.00 $1,258.33 $0.00 $0.00 $4,796.33
Home Service Oil Company $1,676.00 $1,561.38 $0.00 $0.00 $3,237.38
Hope Water & Light $67,285.17 $46,262.04 $47,089.00 $3,373.10 $164,009.31
Independent Propane Co. $4,134.50 $4,074.14 $0.00 $0.00 $8,208.64
Jonesboro CW&L $93,931.00 $32,530.08 $66,256.00 $4,136.20 $196,853.28
Keiser Oil and LP Gas Co. $3,626.00 $8,962.47 $0.00 $0.00 $12,588.47
Marshall Milling Company $109.00 $225.00 $0.00 $0.00 $334.00
Matthews, Inc. $13,416.00 $11,677.69 $0.00 $0.00 $25,093.69
MFA Oil $13,364.00 $11,578.25 $0.00 $0.00 $24,942.25
Mississippi Co. Electric Coop $16,669.00 $6,360.70 $11,532.00 $8,473.00 $43,034.70
North Arkansas Electric $145,541.00 $62,271.90 $124,917.00 $16,105.54 $348,835.44
North Crossett Utilities $2,271.00 $842.10 $0.00 $0.00 $3,113.10
North Little Rock Electric $109,487.48 $103,618.71 $64,591.00 $0.00 $277,697.19
N.E. Louisiana Power Coop $0.00 $0.00 $108.00 $0.00 $108.00
Oklahoma Gas and Electric $320,417.01 $141,969.39 $244,503.00 $97,306.13 $804,195.53
O'Neals Gas, Inc. $1,283.00 $673.07 $0.00 $0.00 $1,956.07
Osceola Light and Power $53,331.00 $42,235.68 $33,284.00 $26,325.28 $155,175.96
Ouachita Electric coop $38,889.72 $41,483.11 $22,571.00 $0.00 $102,943.83
Ozark County Gas $2,866.00 $2,054.09 $0.00 $0.00 $4,920.09
Ozark Mountain Propane $918.00 $3,093.25 $0.00 $0.00 $4,011.25

Arkansas LIHEAP Survey Results 2013
11
Utility/Vendor/Applicant Winter Regular
Winter Crisis Summer Regular
Summer Crisis Total
Ozarks Electric Cooperative $116,223.53 $52,507.94 $58,792.00 $0.00 $227,523.47
Paragould CL&W $59,127.00 $20,757.01 $38,333.00 $3,749.26 $121,966.27
Petit Jean Electric Coop $61,470.00 $18,885.24 $69,283.00 $9,694.27 $159,332.51
Piggott Light, Water, and Gas $16,192.00 $23,517.29 $6,404.00 $0.00 $46,113.29
Pinnacle Propane $13,301.10 $8,999.19 $0.00 $0.00 $22,300.29
Pioneer Propane $11,745.00 $7,684.09 $0.00 $0.00 $19,429.09
Prescott Water and Light $26,288.81 $35,383.87 $36,970.00 $6,636.70 $105,279.38
Reeves Tri-Co. $14,488.00 $16,135.25 $0.00 $0.00 $30,623.25
Reynold's Brother's Propane $282.00 $504.94 $0.00 $0.00 $786.94
Rich Mountain Electric Coop $35,659.00 $10,519.96 $22,721.00 $2,790.96 $71,690.92
Rick's LP Gas Co. $1,657.00 $2,044.05 $0.00 $0.00 $3,701.05
River Valley Oil $2,989.00 $422.42 $0.00 $0.00 $3,411.42
Roper Gas $0.00 $309.64 $0.00 $0.00 $309.64
Russell LP Gas $1,321.00 $1,180.71 $0.00 $0.00 $2,501.71
S & B Propane $4,159.00 $3,902.73 $0.00 $0.00 $8,061.73
Sanner Oil Company $412.00 $370.62 $0.00 $0.00 $782.62
Scott's Petroleum $10,106.00 $6,355.56 $0.00 $0.00 $16,461.56
Simmons Energy $109.00 $710.48 $0.00 $0.00 $819.48
S. Central AR. Electric Coop. $30,990.26 $24,933.97 $22,970.00 $183.01 $79,077.24
Southwest AR. Electric Coop $80,953.00 $52,510.67 $70,756.00 $9,671.69 $213,891.36
Southern LP Gas $31,782.50 $46,188.03 $0.00 $0.00 $77,970.53
Spring River Gas $11,061.00 $6,272.42 $0.00 $0.00 $17,333.42
Arkansas LIHEAP Survey Results 2013
12
Utility/Vendor/Applicant Winter Regular
Winter Crisis Summer Regular
Summer Crisis Total
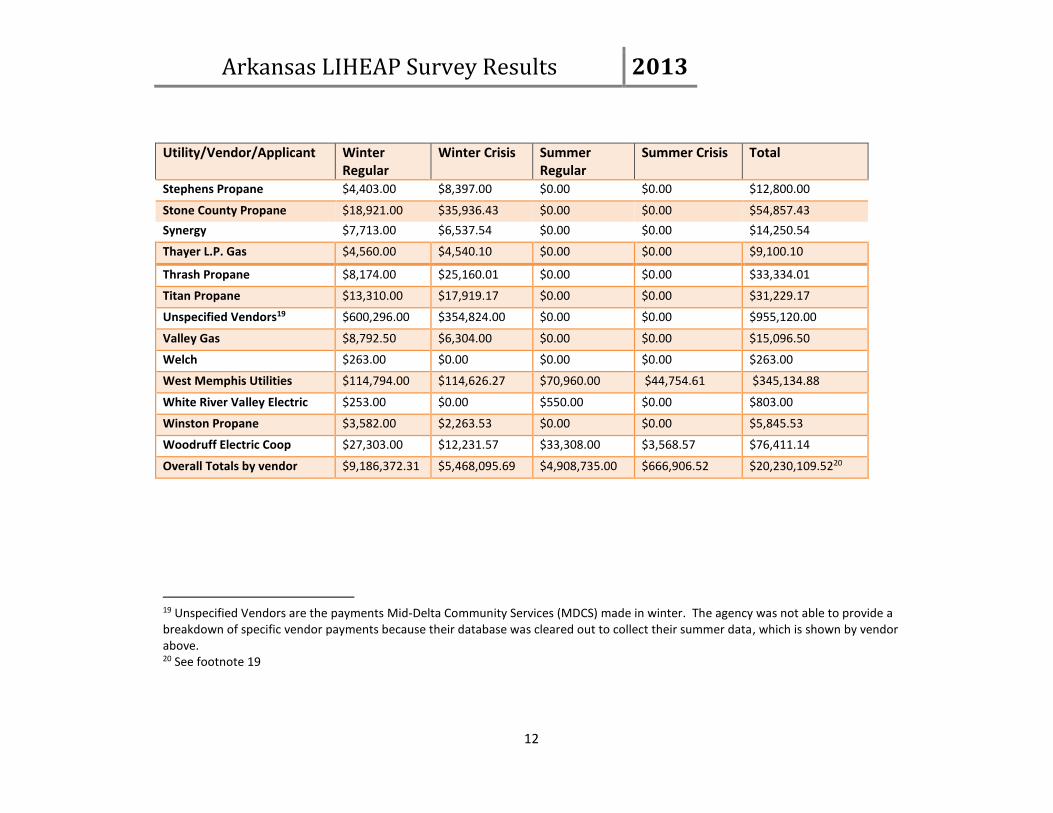
Stephens Propane $4,403.00 $8,397.00 $0.00 $0.00 $12,800.00
Stone County Propane $18,921.00 $35,936.43 $0.00 $0.00 $54,857.43
Synergy $7,713.00 $6,537.54 $0.00 $0.00 $14,250.54
Thayer L.P. Gas $4,560.00 $4,540.10 $0.00 $0.00 $9,100.10
Thrash Propane $8,174.00 $25,160.01 $0.00 $0.00 $33,334.01
Titan Propane $13,310.00 $17,919.17 $0.00 $0.00 $31,229.17
Unspecified Vendors19 $600,296.00 $354,824.00 $0.00 $0.00 $955,120.00
Valley Gas $8,792.50 $6,304.00 $0.00 $0.00 $15,096.50
Welch $263.00 $0.00 $0.00 $0.00 $263.00
West Memphis Utilities $114,794.00 $114,626.27 $70,960.00 $44,754.61 $345,134.88
White River Valley Electric $253.00 $0.00 $550.00 $0.00 $803.00
Winston Propane $3,582.00 $2,263.53 $0.00 $0.00 $5,845.53
Woodruff Electric Coop $27,303.00 $12,231.57 $33,308.00 $3,568.57 $76,411.14
Overall Totals by vendor $9,186,372.31 $5,468,095.69 $4,908,735.00 $666,906.52 $20,230,109.5220
19 Unspecified Vendors are the payments Mid-Delta Community Services (MDCS) made in winter. The agency was not able to provide a breakdown of specific vendor payments because their database was cleared out to collect their summer data, which is shown by vendor above. 20 See footnote 19
Arkansas LIHEAP Survey Results 2013
13
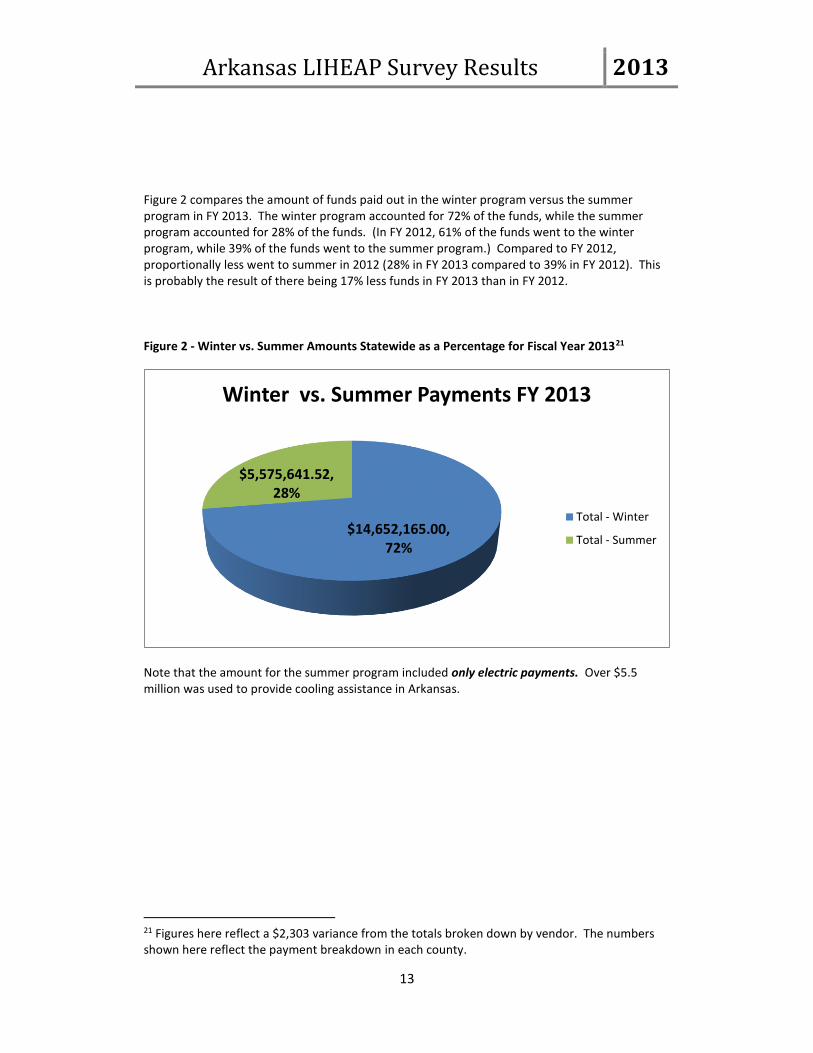
Figure 2 compares the amount of funds paid out in the winter program versus the summer program in FY 2013. The winter program accounted for 72% of the funds, while the summer program accounted for 28% of the funds. (In FY 2012, 61% of the funds went to the winter program, while 39% of the funds went to the summer program.) Compared to FY 2012, proportionally less went to summer in 2012 (28% in FY 2013 compared to 39% in FY 2012). This is probably the result of there being 17% less funds in FY 2013 than in FY 2012. Figure 2 - Winter vs. Summer Amounts Statewide as a Percentage for Fiscal Year 201321
$14,652,165.00, 72%
$5,575,641.52, 28%
Winter vs. Summer Payments FY 2013
Total - Winter
Total - Summer
Note that the amount for the summer program included only electric payments. Over $5.5 million was used to provide cooling assistance in Arkansas.
21 Figures here reflect a $2,303 variance from the totals broken down by vendor. The numbers shown here reflect the payment breakdown in each county.
Arkansas LIHEAP Survey Results 2013
14
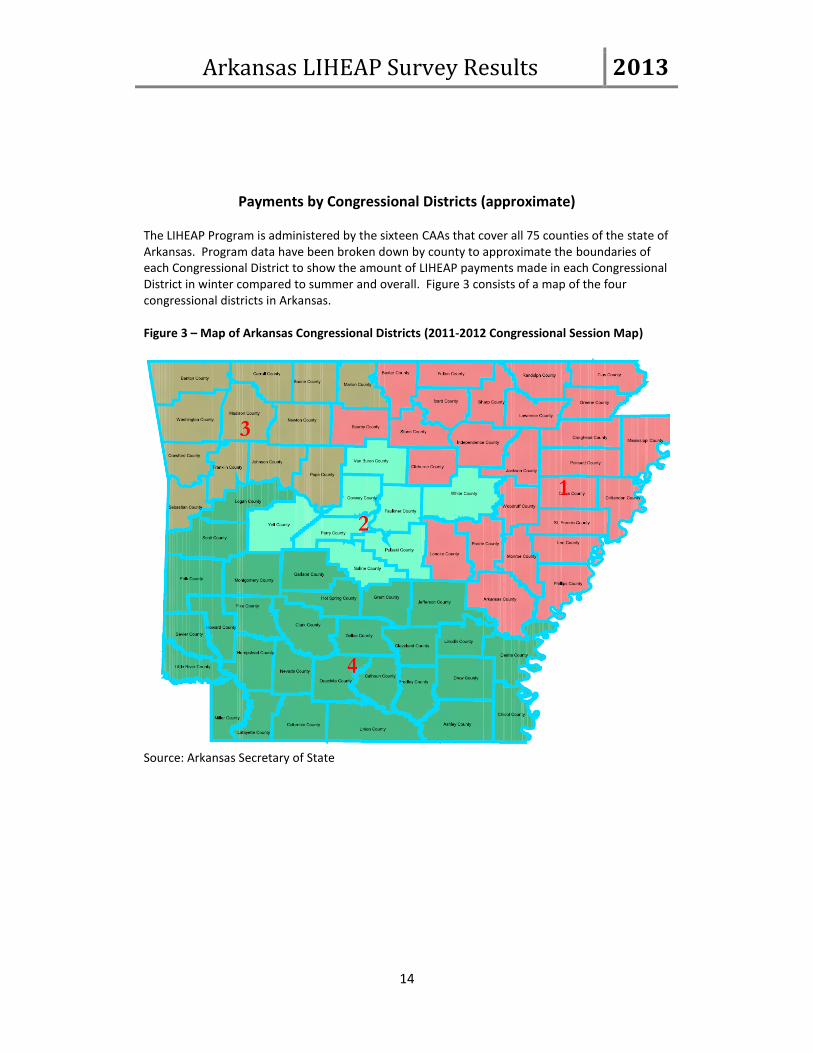
Payments by Congressional Districts (approximate)
The LIHEAP Program is administered by the sixteen CAAs that cover all 75 counties of the state of Arkansas. Program data have been broken down by county to approximate the boundaries of each Congressional District to show the amount of LIHEAP payments made in each Congressional District in winter compared to summer and overall. Figure 3 consists of a map of the four congressional districts in Arkansas. Figure 3 – Map of Arkansas Congressional Districts (2011-2012 Congressional Session Map)
Source: Arkansas Secretary of State

Arkansas LIHEAP Survey Results 2013
15
1st Congressional District Payments
For the First Congressional District for the state of Arkansas, program data for the counties of Arkansas, Baxter, Clay, Cleburne, Craighead, Crittenden, Cross, Fulton, Green, Independence, Izard, Jackson, Lawrence, Lee, Lonoke, Mississippi, Monroe, Phillips, Poinsett, Prairie, Randolph, Searcy, Sharp, St. Francis, Stone, and Woodruff were used. The total amount of LIHEAP payments in the First Congressional District for FY 2013 was $6,378,304.60 ($4,684,077.18 for winter and $1,694,227.42 for summer). This represents a $1,676,456.38 (approximately 21%) decrease from FY 2012 and a $3,149,929.90 (approximately 33%) decrease from FY 2011. Table 3 - First Congressional District Payment Amounts Winter vs. Summer FY 201322
1st Congressional District Amount
Winter Program Funds Paid Out $4,684,077.18
Summer Program Funds Paid Out $1,694,227.42
Grand Total $6,378,304.60 Figure 4 – First Congressional District Winter vs. Summer Amounts FY 2012
73% $4,684,077.18
27% $1,694,227.42
1st Congressional District Winter vs. Summer Program FY 2013
Winter Program Funds PaidOut
Summer Program FundsPaid Out
The First Congressional District had 73% of its funds go to winter applicants, which was just above the statewide average of 72%. This is a huge shift from FY 2012 when 58% of payments went to the Winter Program and 42% went to the Summer Program. The Winter percentage increase in FY 2013 is most likely due to lower funding levels in FY 2013. Fewer funds resulted in some subgrantees not having a Summer Crisis Program for the first time in recent years.
22 See footnote 21
Arkansas LIHEAP Survey Results 2013
16
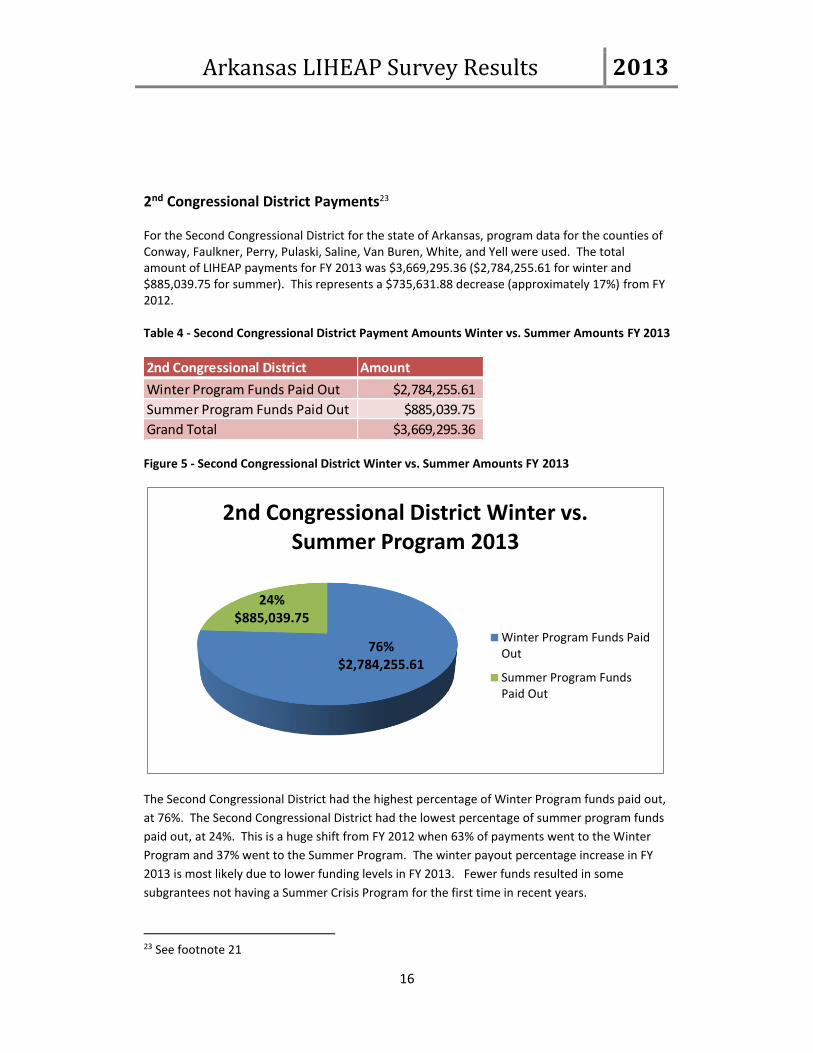
2nd Congressional District Payments23 For the Second Congressional District for the state of Arkansas, program data for the counties of Conway, Faulkner, Perry, Pulaski, Saline, Van Buren, White, and Yell were used. The total amount of LIHEAP payments for FY 2013 was $3,669,295.36 ($2,784,255.61 for winter and $885,039.75 for summer). This represents a $735,631.88 decrease (approximately 17%) from FY 2012. Table 4 - Second Congressional District Payment Amounts Winter vs. Summer Amounts FY 2013
2nd Congressional District Amount
Winter Program Funds Paid Out $2,784,255.61
Summer Program Funds Paid Out $885,039.75
Grand Total $3,669,295.36
Figure 5 - Second Congressional District Winter vs. Summer Amounts FY 2013
76% $2,784,255.61
24%$885,039.75
2nd Congressional District Winter vs. Summer Program 2013
Winter Program Funds PaidOut
Summer Program FundsPaid Out
The Second Congressional District had the highest percentage of Winter Program funds paid out,
at 76%. The Second Congressional District had the lowest percentage of summer program funds
paid out, at 24%. This is a huge shift from FY 2012 when 63% of payments went to the Winter
Program and 37% went to the Summer Program. The winter payout percentage increase in FY
2013 is most likely due to lower funding levels in FY 2013. Fewer funds resulted in some
subgrantees not having a Summer Crisis Program for the first time in recent years.
23 See footnote 21

Arkansas LIHEAP Survey Results 2013
17
3rd Congressional District Payments24
For the Third Congressional District for the state of Arkansas, program data for the counties of Benton, Boone, Carroll, Crawford, Franklin, Johnson, Madison, Marion, Newton, Pope, Sebastian, and Washington were used. The total amount of LIHEAP payments for FY 2013 was $3,547,868.82 ($2,343,569.05 for winter and $1,204,299.77 for summer). This represents a $435,513.16 (about 11%) decrease from FY 2012.
Table 5 – Third Congressional District Payment Amounts Winter vs. Summer FY 2013
3rd Congressional District Amount
Winter Program Funds Paid Out $2,343,569.05
Summer Program Funds Paid Out $1,204,299.77
Grand Total $3,547,868.82
Figure 6 – Third Congressional District Winter vs. Summer Amounts FY 2013
66% $2,343,569.05
34% $1,204,299.77
3rd Congressional District Winter vs. Summer Program FY 2013
Winter Program FundsPaid Out
Summer Program FundsPaid Out
The Third Congressional District had the lowest percentage of Winter Program funds paid out at 66% and the highest percentage of summer program funds paid out at 34%. This is a huge shift from FY 2012 when 60% of LIHEAP payments went to the Winter Program and 40% went to the Summer Program. The winter payout percentage increase in FY 2013 is most likely due to lower funding levels in FY 2013. Fewer funds resulted in some subgrantees not having a Summer Crisis program for the first time in recent years.
24 See footnote 21
Arkansas LIHEAP Survey Results 2013
18
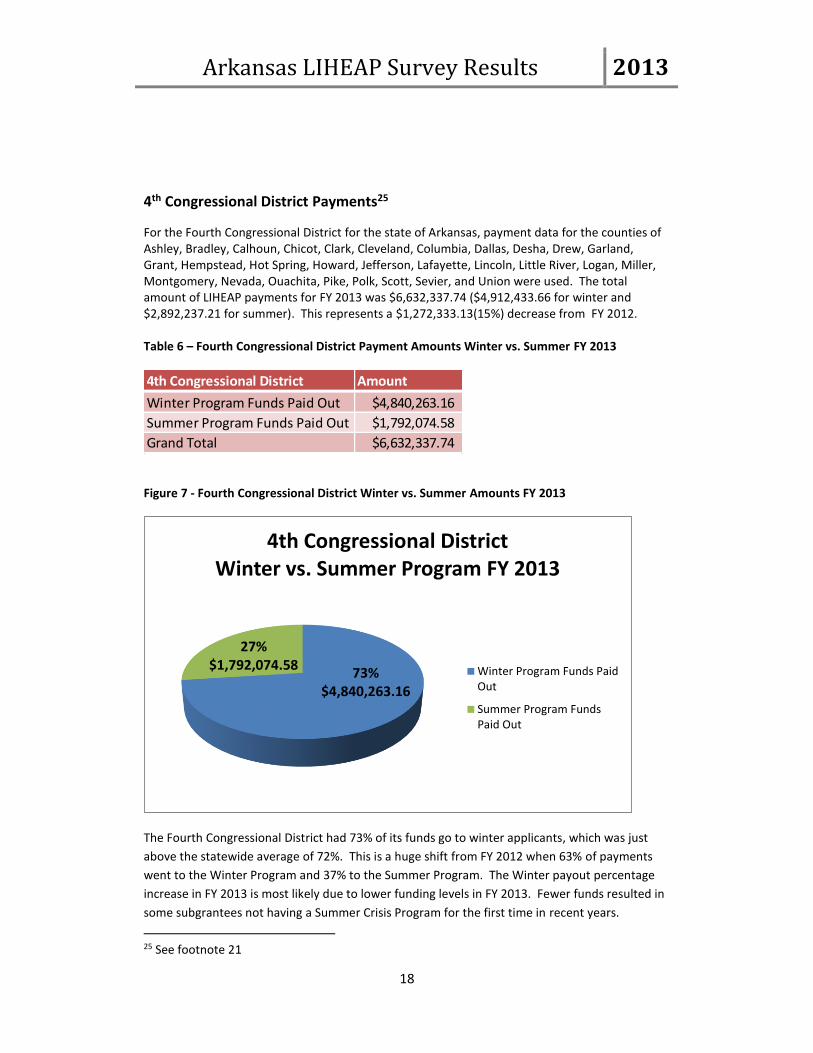
4th Congressional District Payments25
For the Fourth Congressional District for the state of Arkansas, payment data for the counties of Ashley, Bradley, Calhoun, Chicot, Clark, Cleveland, Columbia, Dallas, Desha, Drew, Garland, Grant, Hempstead, Hot Spring, Howard, Jefferson, Lafayette, Lincoln, Little River, Logan, Miller, Montgomery, Nevada, Ouachita, Pike, Polk, Scott, Sevier, and Union were used. The total amount of LIHEAP payments for FY 2013 was $6,632,337.74 ($4,912,433.66 for winter and $2,892,237.21 for summer). This represents a $1,272,333.13(15%) decrease from FY 2012. Table 6 – Fourth Congressional District Payment Amounts Winter vs. Summer FY 2013
4th Congressional District Amount
Winter Program Funds Paid Out $4,840,263.16
Summer Program Funds Paid Out $1,792,074.58
Grand Total $6,632,337.74
Figure 7 - Fourth Congressional District Winter vs. Summer Amounts FY 2013
73%$4,840,263.16
27%$1,792,074.58
4th Congressional DistrictWinter vs. Summer Program FY 2013
Winter Program Funds PaidOut
Summer Program FundsPaid Out
The Fourth Congressional District had 73% of its funds go to winter applicants, which was just
above the statewide average of 72%. This is a huge shift from FY 2012 when 63% of payments
went to the Winter Program and 37% to the Summer Program. The Winter payout percentage
increase in FY 2013 is most likely due to lower funding levels in FY 2013. Fewer funds resulted in
some subgrantees not having a Summer Crisis Program for the first time in recent years.
25 See footnote 21

Arkansas LIHEAP Survey Results 2013
19
Winter Program Breakdown by Congressional District26 Table 7 and Figure 8 show the breakdown by amount and percentage of LIHEAP payments made in each Congressional District during the Winter Program of FY 2013. Table 7 – Winter Breakdown of Funds for FY 2013 by Congressional District
Winter Amount
1st Congressional District $4,684,077.18
2nd Congressional District $2,784,255.61
3rd Congressional District $2,343,569.05
4th Congressional District $4,840,263.16
Grand Total $14,652,165.00 Figure 8 –Winter Payments by Congressional District FY 2013
31% 1st District
19% 2nd District
16% 3rd District
33% 4th District
Winter Payments by Congressional District FY 2013
1st Congressional District
2nd Congressional District
3rd Congressional District
4th Congressional District
As seen in Figure 8, almost 2/3 of the winter payments (64%) were split between the First and Fourth Congressional Districts. Those two districts are home to some of the lowest income households in the state. About one-fifth (19%) of the total funds went to the Second Congressional District, while 16% of payments went to the Third Congressional District. The Second and Third Congressional Districts encompass major population centers of the state, though all Congressional Districts are configured to roughly represent population around the state equally. The Fourth and First Congressional Districts have the 1st and 2nd largest geographic areas in the state. The Winter FY 2013 percentage breakdown of payments by Congressional District nearly mirrored that of FY 2012.
26 See footnote 21

Arkansas LIHEAP Survey Results 2013
20
Summer Program Breakdown by Congressional District Table 8 and Figure 9 show the breakdown by amount and percentage of LIHEAP payments made in each Congressional District during the Summer Program of FY 2013. Table 8 – Summer Breakdown of Payments Made for FY 2013 by Congressional District
Summer Amount
1st Congressional District $1,694,227.42
2nd Congressional District $885,039.75
3rd Congressional District $1,204,299.77
4th Congressional District $1,792,074.58
Grand Total $5,575,641.52
Figure 9 –Summer Payments Made by Congressional District FY 2013
30%$1,694,227.42
16%$885,039.75
22%$1,204,299.77
32%$1,792,074.58
Summer Payments by Congressional District FY 2013
1st Congressional District
2nd Congressional District
3rd Congressional District
4th Congressional District
Data for the Summer Program reveal a slight variation in percentages from the Winter Program.
For summer, approximately 3/5 (or 62%) of the payments were split between the First and
Fourth Congressional Districts. The Second and Third Congressional Districts received around 2/5
(38%) of the summer payments for FY 2013. The First and Third Congressional District had a
lower percentage of funds paid out in Summer FY 2013 compared to FY 2012.

Arkansas LIHEAP Survey Results 2013
21
Fiscal Year 2013 Overall Amounts Paid by Congressional District27
Table 9 and Figure 10 show the total FY2013 payments for LIHEAP (Winter and Summer
Programs combined) by Congressional District.
Table 9 - Overall FY 2013 Amounts Paid by Congressional District
FY 2013 Amount
1st Congressional District $6,378,304.60
2nd Congressional District $3,669,295.36
3rd Congressional District $3,547,868.82
4th Congressional District $6,632,337.74
Grand Total $20,227,806.52
Figure 10 – FY 2013 Total Amounts by Congressional District
31%$6,378,304.60
18%$3,669,295.36
18%$3,547,868.82
33%$6,632,337.74
Total Payment By Congressional District FY 2013
1st Congressional District
2nd Congressional District
3rd Congressional District
4th Congressional District
As seen in Figure 10, nearly 2/3 (64%) of the LIHEAP payments were made on behalf of First and
Fourth Congressional District clients, while slightly more than 1/3 (36%) were made in the
Second and Third Congressional Districts. The data are consistent with census data, which show
that the Fourth and First Congressional Districts are the two districts in the state with the highest
percentages of households in poverty. The breakdown nearly mirrors that of FY 2012.
27 See footnote 21

Arkansas LIHEAP Survey Results 2013
22
Figure 11 shows a side-by-side comparison of payments made by Congressional District in Winter
versus Summer Program statewide.
Figure 11 – Congressional District Side-by-Side Comparison Winter vs. Summer FY 201328
$4
,68
4,0
77
.18
$2
,78
4,2
55
.61
$2
,34
3,5
69
.05
$4
,84
0,2
63
.16
$1
,69
4,2
27
.42
$8
85
,03
9.7
5
$1
,20
4,2
99
.77
$1
,79
2,0
74
.58
1ST CONGRESSIONAL
DISTRICT
2ND CONGRESSIONAL
DISTRICT
3RD CONGRESSIONAL
DISTRICT
4TH CONGRESSIONAL
DISTRICT
CONGRESSIONAL DISTRICT SIDE-BY-SIDE COMPARISON WINTER VS. SUMMER
FY 2013 Winter
Summer
28 See footnote 21
23
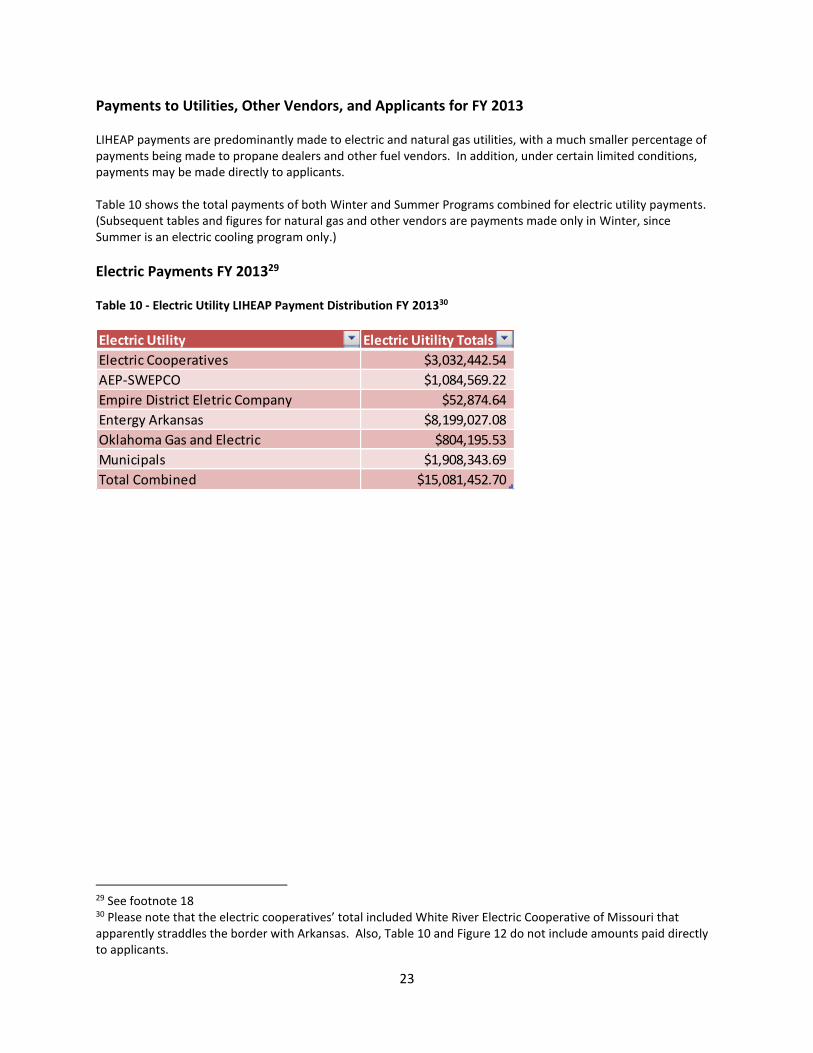
Payments to Utilities, Other Vendors, and Applicants for FY 2013 LIHEAP payments are predominantly made to electric and natural gas utilities, with a much smaller percentage of payments being made to propane dealers and other fuel vendors. In addition, under certain limited conditions, payments may be made directly to applicants. Table 10 shows the total payments of both Winter and Summer Programs combined for electric utility payments. (Subsequent tables and figures for natural gas and other vendors are payments made only in Winter, since Summer is an electric cooling program only.)
Electric Payments FY 201329 Table 10 - Electric Utility LIHEAP Payment Distribution FY 201330
Electric Utility Electric Uitility Totals
Electric Cooperatives $3,032,442.54
AEP-SWEPCO $1,084,569.22
Empire District Eletric Company $52,874.64
Entergy Arkansas $8,199,027.08
Oklahoma Gas and Electric $804,195.53
Municipals $1,908,343.69
Total Combined $15,081,452.70
29 See footnote 18 30 Please note that the electric cooperatives’ total included White River Electric Cooperative of Missouri that apparently straddles the border with Arkansas. Also, Table 10 and Figure 12 do not include amounts paid directly to applicants.

Arkansas LIHEAP Survey Results 2013
24
Figure 12 – FY 2013 Electric LIHEAP Payment Distribution31
Electric Cooperatives $3,032,442.54 or
20%
AEP-SWEPCO $1,084,569.22
or 7%
Empire District Eletric
Company $52,874.64
or <1%
Entergy Arkansas $8,199,027.08 or
55%
Oklahoma Gas and Electric $804,195.53
or 5%
Municipals $1,908,343.69 or
13%
As seen in Figure 12, Entergy received 55% of LIHEAP funds paid to electric utilities. This was followed by the Co-ops at 20%, Municipals at 13%, SWEPCO at 7%, OG&E at 5%, and Empire District receiving less than 1% of the total. The payment percentage breakdown by electric utility almost follows the exact breakdown reported in FY 2012.
31 Please note that the electric cooperatives’ percentage included White River Electric Cooperative of Missouri that apparently straddles the border with Arkansas. Also, Table 10 and Figure 12 do not include amounts paid directly to applicants.
Arkansas LIHEAP Survey Results 2013
25
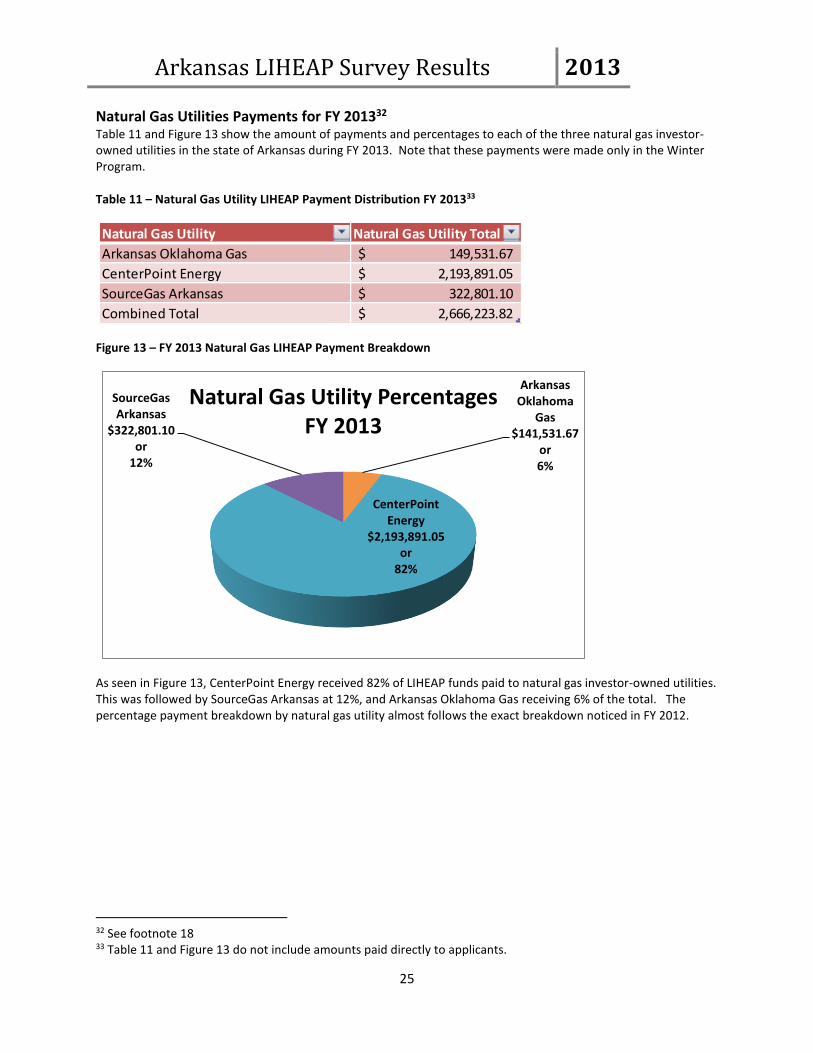
Natural Gas Utilities Payments for FY 201332 Table 11 and Figure 13 show the amount of payments and percentages to each of the three natural gas investor-owned utilities in the state of Arkansas during FY 2013. Note that these payments were made only in the Winter Program. Table 11 – Natural Gas Utility LIHEAP Payment Distribution FY 201333
Natural Gas Utility Natural Gas Utility Total
Arkansas Oklahoma Gas 149,531.67$
CenterPoint Energy 2,193,891.05$
SourceGas Arkansas 322,801.10$
Combined Total 2,666,223.82$
Figure 13 – FY 2013 Natural Gas LIHEAP Payment Breakdown
Arkansas Oklahoma
Gas $141,531.67
or6%
CenterPoint Energy
$2,193,891.05 or
82%
SourceGas Arkansas
$322,801.10 or
12%
Natural Gas Utility PercentagesFY 2013
As seen in Figure 13, CenterPoint Energy received 82% of LIHEAP funds paid to natural gas investor-owned utilities. This was followed by SourceGas Arkansas at 12%, and Arkansas Oklahoma Gas receiving 6% of the total. The percentage payment breakdown by natural gas utility almost follows the exact breakdown noticed in FY 2012.
32 See footnote 18 33 Table 11 and Figure 13 do not include amounts paid directly to applicants.

Arkansas LIHEAP Survey Results 2013
26
Overall Payments to Utilities, Other Vendors, and Applicants34 Table 12 and Figure 14 show the breakdown of the $20,230,109.5235 in LIHEAP payments made to various parties in FY 2013.
Table 12- Categorized LIHEAP Program Distribution Amounts FY 2013
Payment Source Amount
Electric Utilities (munis, Co-Ops, IOUs) $15,081,452.70
Natural Gas Investor-Owned Utilities $2,666,223.82
Applicants/Landlords $572,253.13
Vendors/Natural Gas Municipals 1,910,179.87$
Totals $20,230,109.52
Figure 14 – Categorized LIHEAP Payment by Percentage FY 2013
75%
13%
3%
9%
LIHEAP Payments By Category FY 2013
Electric Utilities (munis,Co-Ops, IOUs)
Natural Gas Investor-Owned Utilities
Applicants/Landlords
Vendors/Natural GasMunicipals
As seen in Figure 14, at least 75% of LIHEAP payments went to electric Co-ops/Munis/IOU’s. Heating vendors/natural gas utilities made up a combined 22% of the total, with 3% going to applicants directly. When comparing these categorical payments to FY 2012 it should be noted that the percentage for electric utilities went down slightly while the natural gas vendor payments went up slightly. The electric utility payment drop could be attributed to the fact that some subgrantees could not open a Summer Crisis program for the first time in recent years.
34 See footnote 18 35 See footnote 18

Arkansas LIHEAP Survey Results 2013
27
Total Applicants Served
During the FY 2013 LIHEAP program year, when combining the Winter Regular, Winter Crisis, Summer Regular, and Summer Crisis programs, a total of 130,881 applicants received LIHEAP payments over the course of the year.36 Table 13 breaks down the number of winter applicants served versus the number of summer applicants served for 2013. Table 13 – Total Applicants Served Statewide Winter vs. Summer Program FY 2013
Program Regular Crisis Total Applicants
Winter Applicants 67,961 21,683 89,644
Summer Applicants 37,867 3,370 41,237
Grand Total 105,828 25,053 130,881 Figure 15 shows the percentage breakdown of applicants served statewide for the Summer and Winter LIHEAP programs. Note that more applicants were served in the Winter than in the Summer Program. More money was paid out in the winter (see Figure 2) compared to the summer. The Summer Program was strictly a cooling program, which is limited to electricity assistance. In Fiscal Year 2013 there was a substantial increase in the percentage of applicants that were served in the winter and a substantial decrease in the percentage of applicants that were served in the summer compared to FY 2012. The decrease in the total number of applicants served during the Summer Program in FY 2013 could be due to the fact that some subgrantees were not able to open a Summer Crisis program for the first time in recent years due to lower funding levels. While the number of households served is significant, this number represents only a fraction of households potentially eligible for assistance through the program. This is not an entitlement program but one operated on a first-come, first-served basis until funds are depleted. In recent years, even with higher funding levels, fewer than 30% of estimated eligible Arkansans have received the service prior to depletion of funds
36 At the end of FY 2013 data was gathered from each of the 16 community action agencies and compiled for the FY 2013 LIHEAP survey. Information that the state received may have had slight differences, due to timing of response. There may be some duplication in the total number of applicants reported here, as some applicants may have received assistance more than once in the program year (e.g., once in the winter and once in summer). Since FY 2012 the agencies have been able to report unduplicated households receiving assistance. Due to the time required to validate that data, this report has not attempted to reconcile those numbers with the total applicants reported across the four programs.

Arkansas LIHEAP Survey Results 2013
28
Figure 15 – Breakdown by Percentage of Summer vs. Winter Applicants
Winter Program
89,644 or 68%
Summer Program41,237 or
32%
Winter vs. Summer Total Applicants FY 2013
Applicants Served by Congressional District The LIHEAP Program is administered by the sixteen CAAs that cover all 75 counties in the state of Arkansas. Applicant data have been broken down by county to approximate the boundaries of each Congressional District to show the number of LIHEAP applicants receiving assistance in each Congressional District in winter compared to summer.
Applicants Served by 1st Congressional District For the First Congressional District for the state of Arkansas, program data show that the number of total applicants receiving assistance in FY 2013was 40,367 (28,357 in winter and 12,010 in summer). Table 14 and Figure 16 break it down accordingly. Table 14 – 1st Congressional District Applicants Served
1st Cong. District Regular Crisis Total Applicants
Winter Applicants 21,788 6,569 28,357
Summer Applicants 10,695 1,315 12,010
Grand Total 32,483 7,884 40,367

Arkansas LIHEAP Survey Results 2013
29
Figure 16 – FY 2013 1st Congressional District # of Applicants Served Winter vs. Summer
Winter Program 28,357 or
70%
Summer Program 12,010 or
30%
FY 2013: 1st Congressional District # of Applicants Served Winter Vs. Summer
The First District serves the northeast portion of the state, dipping down into east-central and a portion in extreme north-central Arkansas. With this in mind, it probably is not surprising that more applicants received assistance during the winter program than during the summer program, given the colder climate in the northern part of the state. The percentage of applicants assisted during the Summer Program dropped to 30% in FY 2013. In FY 2012, 46% of the applicants served received assistance during the Summer Program. The increased percentage of applicants receiving help during the winter program is most likely due to the 17% reduction in funding from the FY 2012 program. Fewer funds resulted in some subgrantees not having a Summer Crisis Program for the first time in recent years.

Arkansas LIHEAP Survey Results 2013
30
Applicants Served by 2nd Congressional District For the Second Congressional District for the state of Arkansas, program data show that the number of total applicants receiving assistance in FY 2013 was 24,327 (17,318 for winter and 7,009 in summer). Table 15 and Figure 17 break it down accordingly. Table 15 – 2nd Congressional District Applicants Served in FY 2013
2nd Cong. District Regular Crisis Total Applicants
Winter Applicants 12,765 4,553 17,318
Summer Applicants 6,517 492 7,009
Grand Total 19,282 5,045 24,327 Figure 17 – FY 2013 2nd Congressional District # of Applicants Served
Winter Program
17,318 or 71%
Summer Program
7,009 or 29%
FY 2013 2nd Congressional District # of Applicants Served Winter vs. Summer
The Second Congressional District serves the central portion of the state. In this district, there were many more winter applicants than summer applicants in FY 2013. The percentage of applicants assisted during the Summer Program dropped to 29% in FY 2013. In FY 2012, 37% of the applicants served received assistance during the Summer Program. The increased percentage of applicants receiving help during the winter program is most likely due to the 17% reduction in funding from the FY 2012 program. Fewer funds resulted in some subgrantees not having a Summer Crisis Program for the first time in recent years.

Arkansas LIHEAP Survey Results 2013
31
Applicants Served by 3rd Congressional District For the Third Congressional District for the state of Arkansas, program data show that the number of total applicants receiving assistance in FY 2013 was 23,723 (15,038 for winter and 8,685 in summer). Table 16 and Figure 18 break it down accordingly. Table 16 – 3rd Congressional District Applicants Served in FY 2013
3rd Cong. District Regular Crisis Total Applicants
Winter Applicants 11,852 3,186 15,038
Summer Applicants 7,896 789 8,685
Grand Total 19,748 3,975 23,723 Figure 18 – FY 2013 3rd Congressional District # of Applicants Served
Winter Program
15,038 or 63%
Summer Program
8,685 or 37%
FY 2013 3rd Congressional District # of Applicants Winter vs. Summer
The Third Congressional District serves the northwest corner of the state. It probably is not surprising that more applicants received assistance during the Winter Program than during the Summer Program, given the colder climate in the northwestern part of the state. The percentage of applicants assisted during the Summer Program dropped to 37% in FY 2013. In FY 2012, 41% of the applicants served received assistance during the Summer Program. The increased percentage of applicants receiving help during the winter program is most likely due to 17% reduction in funding from the FY 2012 program. Fewer funds resulted in some subgrantees not having a Summer Crisis Program for the first time in recent years.
Arkansas LIHEAP Survey Results 2013
32
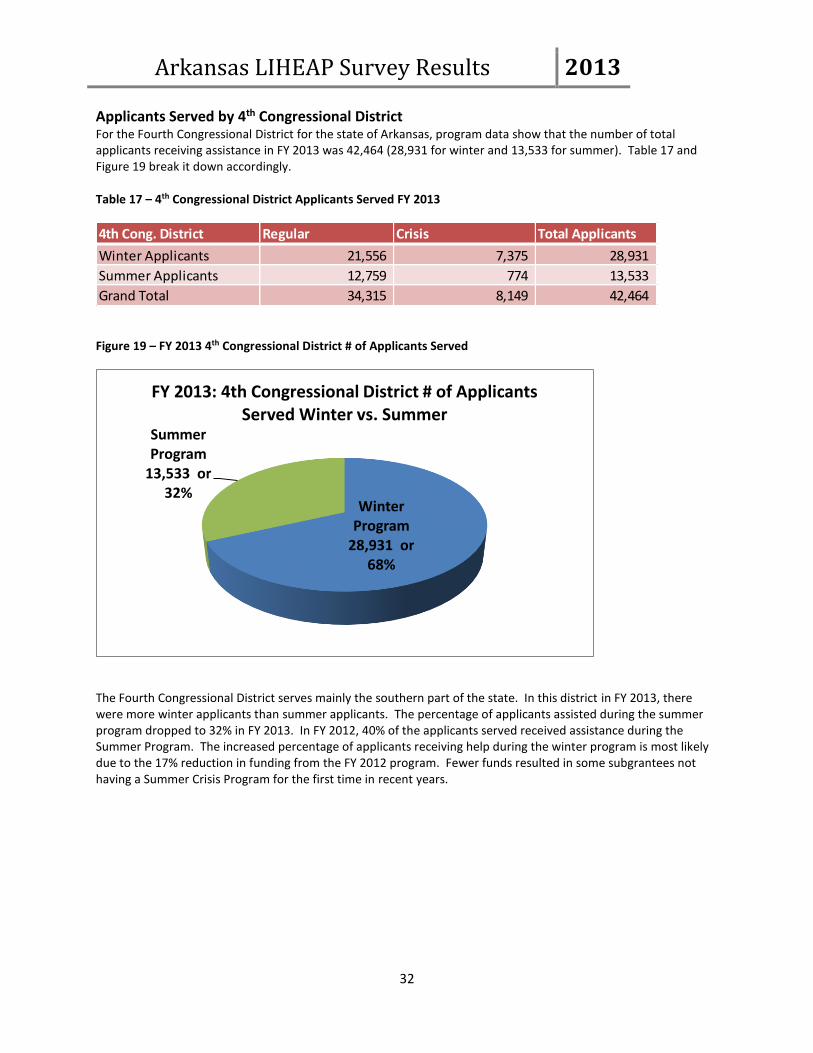
Applicants Served by 4th Congressional District For the Fourth Congressional District for the state of Arkansas, program data show that the number of total applicants receiving assistance in FY 2013 was 42,464 (28,931 for winter and 13,533 for summer). Table 17 and Figure 19 break it down accordingly. Table 17 – 4th Congressional District Applicants Served FY 2013
4th Cong. District Regular Crisis Total Applicants
Winter Applicants 21,556 7,375 28,931
Summer Applicants 12,759 774 13,533
Grand Total 34,315 8,149 42,464
Figure 19 – FY 2013 4th Congressional District # of Applicants Served
Winter Program
28,931 or 68%
Summer Program
13,533 or 32%
FY 2013: 4th Congressional District # of Applicants Served Winter vs. Summer
The Fourth Congressional District serves mainly the southern part of the state. In this district in FY 2013, there were more winter applicants than summer applicants. The percentage of applicants assisted during the summer program dropped to 32% in FY 2013. In FY 2012, 40% of the applicants served received assistance during the Summer Program. The increased percentage of applicants receiving help during the winter program is most likely due to the 17% reduction in funding from the FY 2012 program. Fewer funds resulted in some subgrantees not having a Summer Crisis Program for the first time in recent years.

Arkansas LIHEAP Survey Results 2013
33
Observations and Analysis
Figure 20 shows the pattern of a decrease in LIHEAP payments from FY 2011 to FY 2013. FY 2013 had approximately $11 million37 less to assist clients when compared to FY 2011. Funding has been reduced by 35% since FY 2011. Figure 20 - LIHEAP Total Funds Paid Out FY 2011 vs. FY 2012 vs. FY 2013
$0.00
$10,000,000.00
$20,000,000.00
$30,000,000.00
$40,000,000.00
FY 2011FY 2012
FY 2013
$31,210,359.13 $24,247,741.07
$20,227,806.52
LIHEAP Total Funds Paid Out FY 2011 vs. FY 2012 vs. FY 2013
37 The difference was calculated by subtracting the total funds paid out to vendors in FY 2013 from the total funds paid out to vendors in FY 2011. Vendor payments in FY 2013 showed $2,303 more being disbursed in the Winter Program when compared to the funds distributed by county in FY 2013.

Arkansas LIHEAP Survey Results 2013
34
In Figure 21, it is apparent that, while the number of applicants served in the Winter decreased by 5,150 when compared to FY 2012, the 17%38 reduction in LIHEAP funding from FY 2012 resulted in almost 26,000 fewer summer applicants served in FY 2013. Over 53,000 fewer applicants were served in FY 2013 than in the same period in FY 2011. The drastic reduction in clients receiving assistance during the summer could be attributed to the fact that some subgrantees could not open a Summer Crisis program for the first time in recent years, due to lack of funding. Figure 21 - LIHEAP Total Applicants Served FY 2011 vs. FY 2012 vs. FY 2013
0
10,000
20,000
30,000
40,000
50,000
60,000
70,000
80,000
90,000
100,000
FY 2011 FY 2012 FY 2013
LIHEAP Total Applicants Served FY 2011 vs. FY 2012 vs. FY 2013
Winter Applicant Total
Summer Applicant Total
38 The percentage decrease was calculated using the overall total paid out in FY 2013 by counties of $20,227,806.52, which was $2,303.00 less than the total amount by vendor.

Arkansas LIHEAP Survey Results 2013
35
Figures 22, 23, 24, and 25, and Table 18 show the total applicants for winter, the total applicants for summer, and overall applicants by Congressional District. Figure 22 –Winter Applicants by Congressional District in FY 2013
1st 32% or 28,357
2nd 19% or 17,318
3rd 17% or 15,038
4th 32% or 28,931
Winter Applicants Served byCongressional District FY 2013
1st
2nd
3rd
4th
As seen in Figure 22, almost 2/3 (64%) of the winter applicants served were split between the 1st and 4th Congressional Districts. Those two districts are home to some of the lowest income households in the state. Almost one-fifth (19%) of winter program applicants were from the Second Congressional District, while 17% were from the 3rd Congressional District. The current 2nd and 3rd Congressional Districts encompass major population centers of the state, though all Congressional Districts are configured to roughly represent population around the state equally. The 4th and 1st Congressional Districts have the first and second largest geographic areas in the state.

Arkansas LIHEAP Survey Results 2013
36
Figure 23 –Summer Applicants by Congressional District in FY 2013
1st 29% or12,010
2nd 17% or 7,0093rd 21% or
8,685
4th 33% or 13,533
Summer Applicants Served by Congressional District FY 2013
1st
2nd
3rd
4th
As seen in Figure 23, nearly 3/5 of the summer applicants (62%) served were split between the First and Fourth Congressional Districts. Those two districts are home to some of the lowest income households in the state. Over 17% of summer program applicants were from the Second Congressional District, while just over 1/5 (21%) were from the Third Congressional District. The current Second and Third Congressional Districts encompass major population centers of the state, though all Congressional Districts are configured to roughly represent population around the state equally. The Fourth and First Congressional Districts have the 1st and 2nd largest geographic areas in the state. What is striking is that, while the numbers and percentage of applicants for the 2013 Winter programs remained similar to the FY 2012 Winter data, the FY 2013 Summer Cooling programs saw a dramatic reduction in applicants served among districts. The FY 2013 LIHEAP allocation for Arkansas continued its downward trend since FY 2011. The lower funding continued to result in fewer applicants receiving assistance during the hottest time of the year. The most drastic drop occurred in the First Congressional District where nearly 14,000 fewer clients received assistance, followed by the 4th Congressional District, with nearly 6,000 fewer clients receiving assistance. This is reflected in the overall figures reported in Figure 24 and Table 18.
Arkansas LIHEAP Survey Results 2013
37
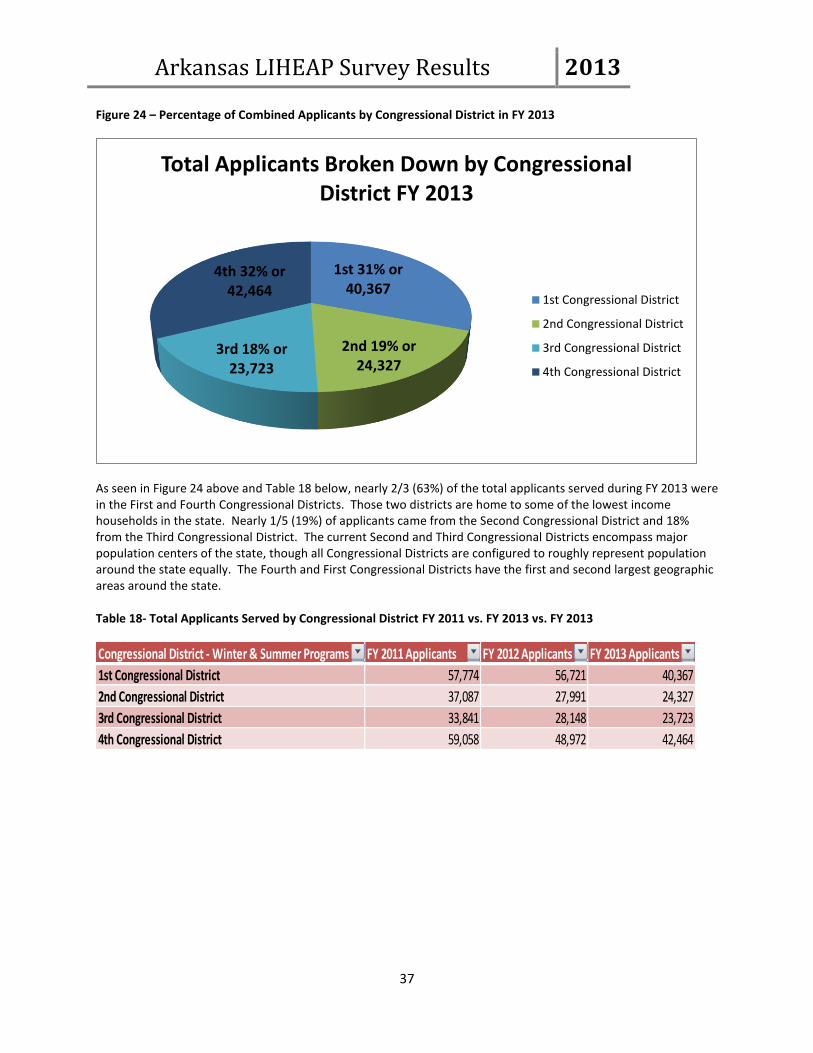
Figure 24 – Percentage of Combined Applicants by Congressional District in FY 2013
1st 31% or 40,367
2nd 19% or 24,327
3rd 18% or 23,723
4th 32% or 42,464
Total Applicants Broken Down by Congressional District FY 2013
1st Congressional District
2nd Congressional District
3rd Congressional District
4th Congressional District
As seen in Figure 24 above and Table 18 below, nearly 2/3 (63%) of the total applicants served during FY 2013 were in the First and Fourth Congressional Districts. Those two districts are home to some of the lowest income households in the state. Nearly 1/5 (19%) of applicants came from the Second Congressional District and 18% from the Third Congressional District. The current Second and Third Congressional Districts encompass major population centers of the state, though all Congressional Districts are configured to roughly represent population around the state equally. The Fourth and First Congressional Districts have the first and second largest geographic areas around the state. Table 18- Total Applicants Served by Congressional District FY 2011 vs. FY 2013 vs. FY 2013
Congressional District - Winter & Summer Programs FY 2011 Applicants FY 2012 Applicants FY 2013 Applicants
1st Congressional District 57,774 56,721 40,367
2nd Congressional District 37,087 27,991 24,327
3rd Congressional District 33,841 28,148 23,723
4th Congressional District 59,058 48,972 42,464
Arkansas LIHEAP Survey Results 2013
38
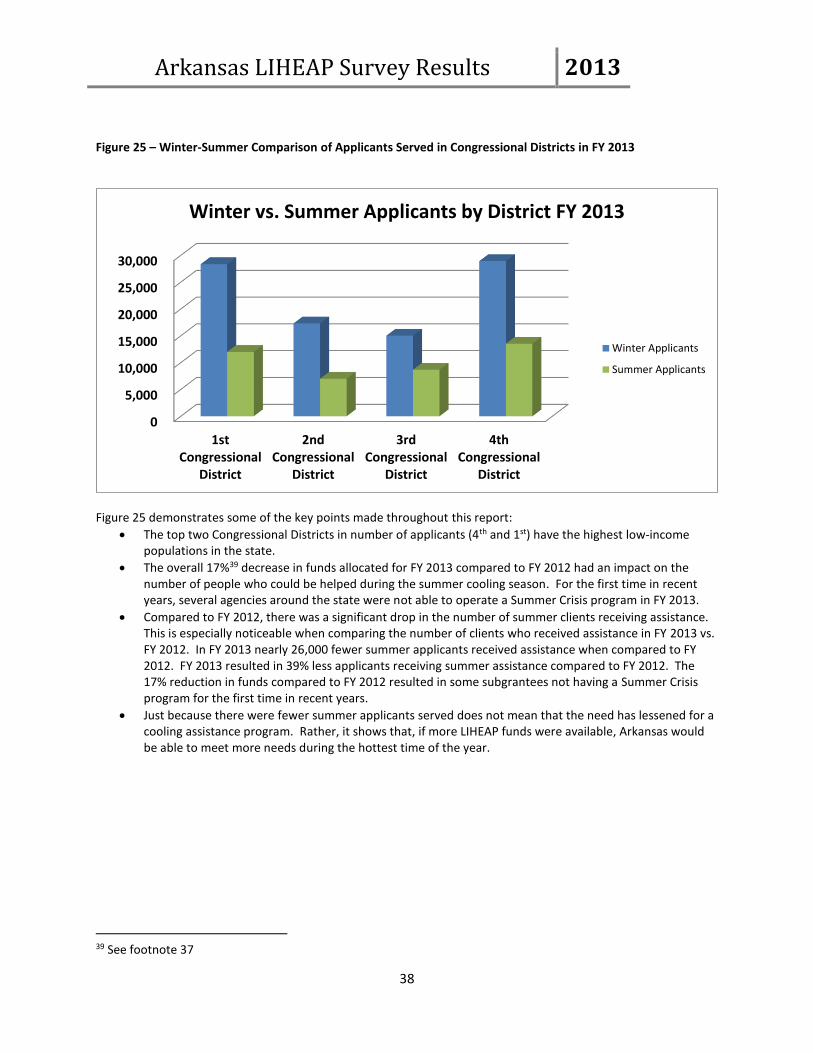
Figure 25 – Winter-Summer Comparison of Applicants Served in Congressional Districts in FY 2013
0
5,000
10,000
15,000
20,000
25,000
30,000
1stCongressional
District
2ndCongressional
District
3rdCongressional
District
4thCongressional
District
Winter vs. Summer Applicants by District FY 2013
Winter Applicants
Summer Applicants
Figure 25 demonstrates some of the key points made throughout this report:
The top two Congressional Districts in number of applicants (4th and 1st) have the highest low-income populations in the state.
The overall 17%39 decrease in funds allocated for FY 2013 compared to FY 2012 had an impact on the number of people who could be helped during the summer cooling season. For the first time in recent years, several agencies around the state were not able to operate a Summer Crisis program in FY 2013.
Compared to FY 2012, there was a significant drop in the number of summer clients receiving assistance. This is especially noticeable when comparing the number of clients who received assistance in FY 2013 vs. FY 2012. In FY 2013 nearly 26,000 fewer summer applicants received assistance when compared to FY 2012. FY 2013 resulted in 39% less applicants receiving summer assistance compared to FY 2012. The 17% reduction in funds compared to FY 2012 resulted in some subgrantees not having a Summer Crisis program for the first time in recent years.
Just because there were fewer summer applicants served does not mean that the need has lessened for a cooling assistance program. Rather, it shows that, if more LIHEAP funds were available, Arkansas would be able to meet more needs during the hottest time of the year.
39 See footnote 37
Arkansas LIHEAP Survey Results 2013
39
Average Payment per Applicant
Winter Regular (Statewide)
As indicated in Table 2, the total amount of payments during the Winter Regular program was $9,186,372.3140. The total number of applicants who received assistance for the Winter Regular program was 67,961, resulting in an average payment of $135.17 for Regular Winter applicants served under the LIHEAP program in FY 2013.
Winter Crisis (Statewide) As indicated in Table 2, the total amount of payments during the Winter Crisis program was $5,468,095.69. The total number of applicants who received assistance for the Winter Crisis program was 21,683, resulting in an average payment of $252.18 for Winter Crisis applicants served under the LIHEAP program in FY 2013.
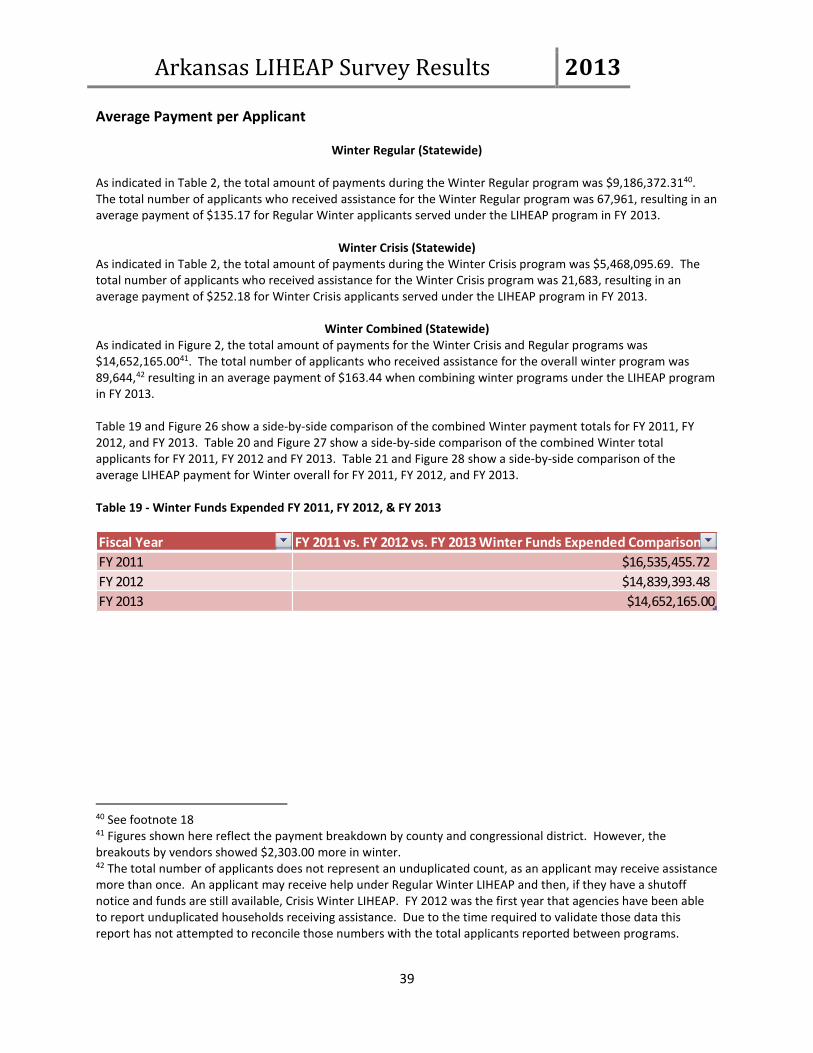
Winter Combined (Statewide) As indicated in Figure 2, the total amount of payments for the Winter Crisis and Regular programs was $14,652,165.0041. The total number of applicants who received assistance for the overall winter program was 89,644,42 resulting in an average payment of $163.44 when combining winter programs under the LIHEAP program in FY 2013. Table 19 and Figure 26 show a side-by-side comparison of the combined Winter payment totals for FY 2011, FY 2012, and FY 2013. Table 20 and Figure 27 show a side-by-side comparison of the combined Winter total applicants for FY 2011, FY 2012 and FY 2013. Table 21 and Figure 28 show a side-by-side comparison of the average LIHEAP payment for Winter overall for FY 2011, FY 2012, and FY 2013. Table 19 - Winter Funds Expended FY 2011, FY 2012, & FY 2013
Fiscal Year FY 2011 vs. FY 2012 vs. FY 2013 Winter Funds Expended Comparison
FY 2011 $16,535,455.72
FY 2012 $14,839,393.48
FY 2013 $14,652,165.00
40 See footnote 18 41 Figures shown here reflect the payment breakdown by county and congressional district. However, the breakouts by vendors showed $2,303.00 more in winter. 42 The total number of applicants does not represent an unduplicated count, as an applicant may receive assistance more than once. An applicant may receive help under Regular Winter LIHEAP and then, if they have a shutoff notice and funds are still available, Crisis Winter LIHEAP. FY 2012 was the first year that agencies have been able to report unduplicated households receiving assistance. Due to the time required to validate those data this report has not attempted to reconcile those numbers with the total applicants reported between programs.
Arkansas LIHEAP Survey Results 2013
40
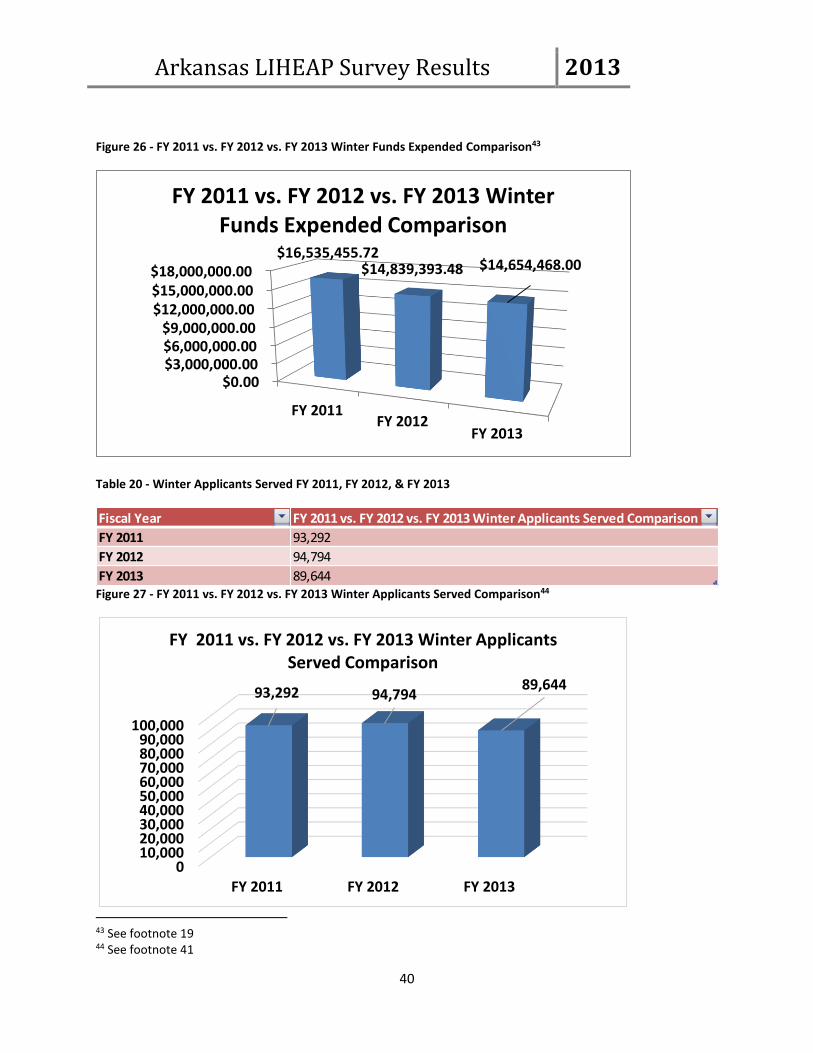
Figure 26 - FY 2011 vs. FY 2012 vs. FY 2013 Winter Funds Expended Comparison43
$0.00$3,000,000.00$6,000,000.00$9,000,000.00
$12,000,000.00$15,000,000.00$18,000,000.00
FY 2011FY 2012
FY 2013
$16,535,455.72 $14,839,393.48 $14,654,468.00
FY 2011 vs. FY 2012 vs. FY 2013 Winter Funds Expended Comparison
Table 20 - Winter Applicants Served FY 2011, FY 2012, & FY 2013
Fiscal Year FY 2011 vs. FY 2012 vs. FY 2013 Winter Applicants Served Comparison
FY 2011 93,292
FY 2012 94,794
FY 2013 89,644 Figure 27 - FY 2011 vs. FY 2012 vs. FY 2013 Winter Applicants Served Comparison44
010,00020,00030,00040,00050,00060,00070,00080,00090,000
100,000
FY 2011 FY 2012 FY 2013
93,292 94,79489,644
FY 2011 vs. FY 2012 vs. FY 2013 Winter Applicants Served Comparison
43 See footnote 19 44 See footnote 41

Arkansas LIHEAP Survey Results 2013
41
Table 21 – Winter Average Payment Comparison FY 2011, FY 2012, & FY 2013
Fiscal Year FY 2011 vs. FY 2012 vs. FY 2013 Winter Average Payment Comparison
FY 2011 $177.24
FY 2012 $156.54
FY 2013 $163.44
Figure 28 - FY 2011 vs. FY 2012 vs. FY 2013 Winter Average Payout Comparison45
$0.00$20.00$40.00$60.00$80.00
$100.00$120.00$140.00$160.00$180.00
FY 2011 FY 2012 FY 2013
$177.24 $156.54 $163.44
FY 2011 vs. FY 2012 vs. FY 2013 Winter Average Payment Comparison
Summer Regular (Statewide) As indicated in Table 2, the total amount of payments made during the Summer Regular program was $4,908,735.00. The total number of applicants who received assistance for the Summer Regular program was 37,867, resulting in an average payment of $129.63 for Summer Regular applicants served in FY 2013.
Summer Crisis (Statewide) As indicated in Table 2, the total amount of payments during the Summer Crisis program was $666,906.52. The total number of applicants who received assistance for the Summer Crisis program was 3,370, resulting in an average payment of $197.89 for Summer Crisis applicants served in FY 2013.
Summer Combined (Statewide)
As indicated in Figure 2, the total amount of payments during the Summer program was $5,575,641.52. The total number of applicants who received assistance for the summer program was 41,237,46 resulting in an average payment of $135.21 for Summer applicants served under the LIHEAP program in FY 2013.
45 See footnote 41 46 The total number of applicants does not represent an unduplicated count, as an applicant may receive assistance more than once. An applicant may receive help under Regular Summer LIHEAP and then, if they have a shutoff notice and funds are still available, Crisis Summer LIHEAP. FY 2012 was the first year that agencies have been able

Arkansas LIHEAP Survey Results 2013
42
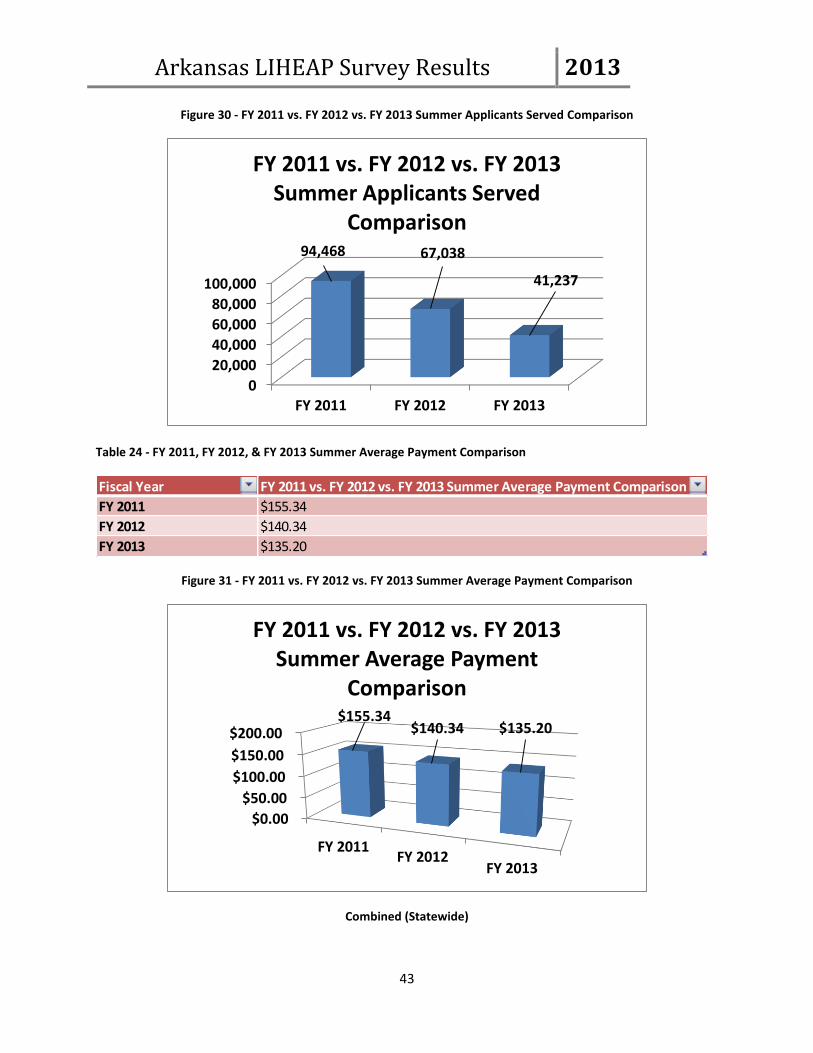
Table 22 and Figure 29 show a side-by-side comparison of the combined Summer totals for FY 2011, FY 2012, and FY 2013. Table 23 and Figure 30 show a side-by-side comparison of the combined summer applicants served in FY 2011 vs. FY 2012 vs. FY 2013. Table 24 and Figure 31 show a side-by-side comparison of the average LIHEAP payment for summer overall in FY 2011 vs. FY 2012 vs. FY 2013. Table 22 - Summer Funds Expended FY 2011, FY 2012, & FY 2013
Fiscal Year FY 2011 vs. FY 2012 vs. FY 2013 Summer Funds Expended Comparison
FY 2011 $14,674,903.41
FY 2012 $9,408,347.59
FY 2013 $5,575,641.52 Figure 29 - FY 2011 vs. FY 2012 vs. FY 2013 Summer Funds Expended Comparison
$0.00
$5,000,000.00
$10,000,000.00
$15,000,000.00
FY 2011 FY 2012 FY 2013
$14,674,903.41 $9,408,347.59
$5,575,641.52
FY 2011 vs. FY 2012 vs. FY 2013 Summer Funds Expended
Comparison
Table 23 - Summer Applicants Served FY 2011, FY 2012, & FY 2013
Fiscal Year FY 2011 vs. FY 2012 vs. FY 2013 Summer Applicants Served Comparison
FY 2011 94,468
FY 2012 67,038
FY 2013 41,237
to report unduplicated households receiving assistance. Due to the time required to validate those data this report has not attempted to reconcile those numbers with the total applicants reported between programs.
Arkansas LIHEAP Survey Results 2013
43
Figure 30 - FY 2011 vs. FY 2012 vs. FY 2013 Summer Applicants Served Comparison
0
20,000
40,000
60,000
80,000
100,000
FY 2011 FY 2012 FY 2013
94,468 67,038
41,237
FY 2011 vs. FY 2012 vs. FY 2013 Summer Applicants Served
Comparison
Table 24 - FY 2011, FY 2012, & FY 2013 Summer Average Payment Comparison
Fiscal Year FY 2011 vs. FY 2012 vs. FY 2013 Summer Average Payment Comparison
FY 2011 $155.34
FY 2012 $140.34
FY 2013 $135.20
Figure 31 - FY 2011 vs. FY 2012 vs. FY 2013 Summer Average Payment Comparison
$0.00
$50.00
$100.00
$150.00
$200.00
FY 2011FY 2012
FY 2013
$155.34 $140.34 $135.20
FY 2011 vs. FY 2012 vs. FY 2013 Summer Average Payment
Comparison
Combined (Statewide)

Arkansas LIHEAP Survey Results 2013
44
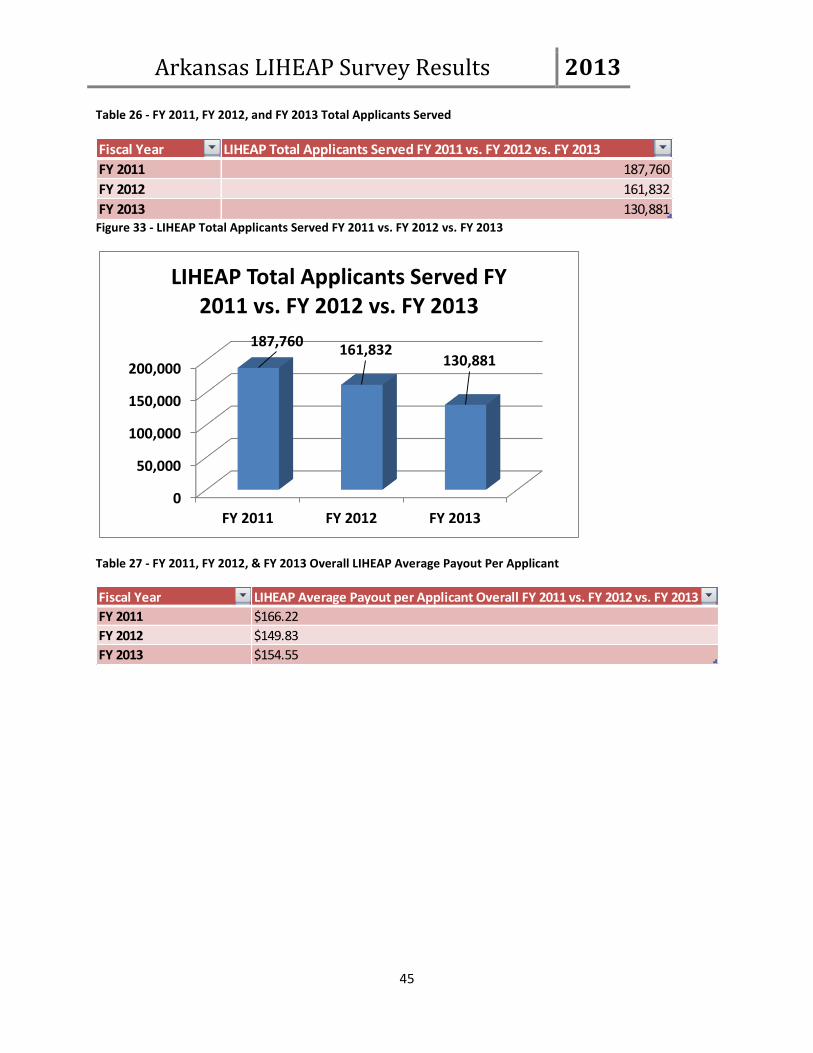
As indicated in Table 1, the total amount paid out on behalf of applicants during the FY 2013 LIHEAP Program was $20,230,109.5247. The total number of applicants who received payment assistance during FY 2013 was 130,88148, resulting in an average payment of $154.55 overall. Table 25 and Figure 32 show a side-by-side comparison of the total amount paid out in FY 2011, FY 2012, and FY 2013. Table 26 and Figure 33 show a side-by-side comparison of the total number of combined applicants served in FY 2011, FY 2012, and FY 2013. Table 27 and Figure 34 show a side-by-side comparison of the average overall LIHEAP payment made in FY 2011, FY 2012, and FY 2013. . Table 25 - FY 2011, FY 2012, and FY 2013 LIHEAP Payment Totals
LIHEAP Payment Totals Amount
FY 2011 $31,210,359.13
FY 2012 $24,247,741.07
FY 2013 $20,230,109.52
Figure 32 - LIHEAP Total Funds Paid Out FY 2011 vs. FY 2012 vs. FY 2013
$0.00
$10,000,000.00
$20,000,000.00
$30,000,000.00
$40,000,000.00
FY 2011FY 2012
FY 2013
$31,210,359.13 $24,247,741.07
$20,227,806.52
LIHEAP Total Funds Paid Out FY 2011 vs. FY 2012 vs. FY 2013
47 See footnote 18 48 At the end of FY 2013 data was gathered from each of the 16 community action agencies and compiled for the FY 2013 LIHEAP survey. Information that the state received may have had slight differences, due to timing of response. There may be some duplication in the total number of applicants reported here, as some applicants may have received assistance more than once in the program year (e.g., once in the winter and once in summer). Since FY 2012 the agencies have been able to report unduplicated households receiving assistance. Due to the time required to validate that data, this report has not attempted to reconcile those numbers with the total applicants reported across the four programs.
Arkansas LIHEAP Survey Results 2013
45
Table 26 - FY 2011, FY 2012, and FY 2013 Total Applicants Served
Fiscal Year LIHEAP Total Applicants Served FY 2011 vs. FY 2012 vs. FY 2013
FY 2011 187,760
FY 2012 161,832
FY 2013 130,881 Figure 33 - LIHEAP Total Applicants Served FY 2011 vs. FY 2012 vs. FY 2013
0
50,000
100,000
150,000
200,000
FY 2011 FY 2012 FY 2013
187,760161,832
130,881
LIHEAP Total Applicants Served FY 2011 vs. FY 2012 vs. FY 2013
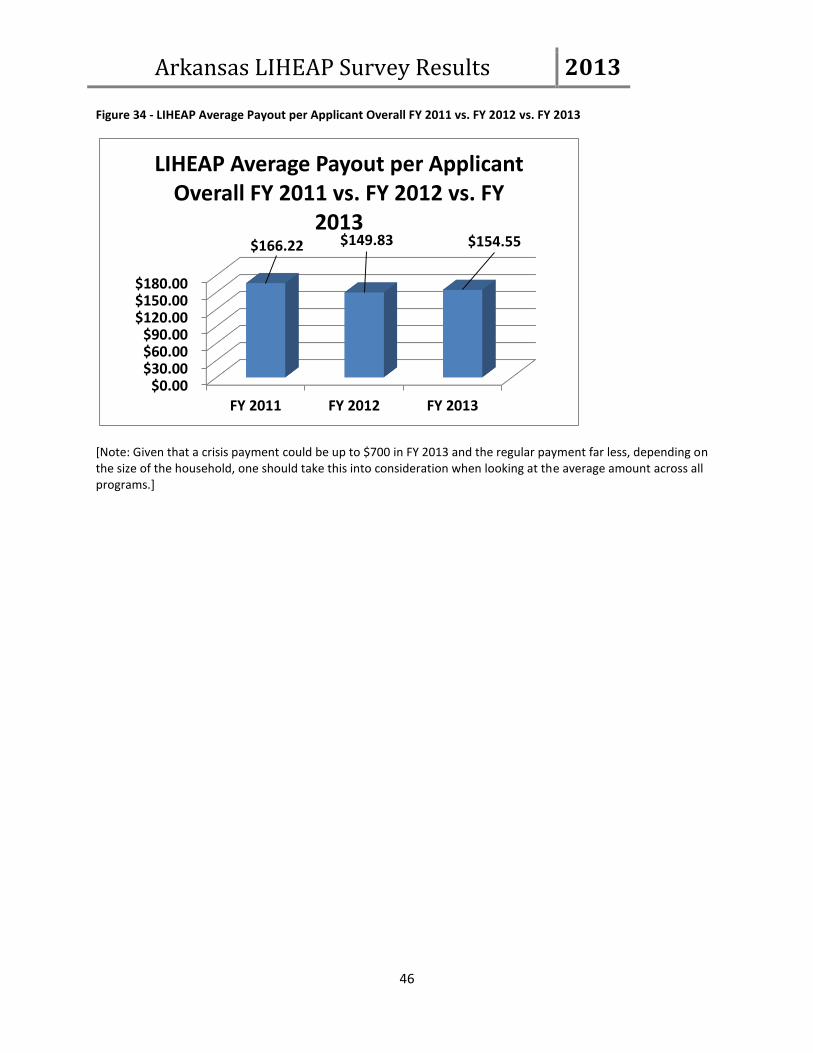
Table 27 - FY 2011, FY 2012, & FY 2013 Overall LIHEAP Average Payout Per Applicant
Fiscal Year LIHEAP Average Payout per Applicant Overall FY 2011 vs. FY 2012 vs. FY 2013
FY 2011 $166.22
FY 2012 $149.83
FY 2013 $154.55
Arkansas LIHEAP Survey Results 2013
46
Figure 34 - LIHEAP Average Payout per Applicant Overall FY 2011 vs. FY 2012 vs. FY 2013
$0.00$30.00$60.00$90.00
$120.00$150.00$180.00
FY 2011 FY 2012 FY 2013
$166.22 $149.83 $154.55
LIHEAP Average Payout per Applicant Overall FY 2011 vs. FY 2012 vs. FY
2013
[Note: Given that a crisis payment could be up to $700 in FY 2013 and the regular payment far less, depending on the size of the household, one should take this into consideration when looking at the average amount across all programs.]