FINAL GAMMA RADIATION SCANNING SAMPLING AND … · Figure 1.2 Study Area Map, Santa Susana Field...
80
FINAL GAMMA RADIATION SCANNING SAMPLING AND ANALYSIS PLAN AREA IV RADIOLOGICAL STUDY SANTA SUSANA FIELD LABORATORY VENTURA COUNTY, CALIFORNIA EPA Contract Number: EP-S7-05-05 Task Order Number: 0038 Prepared for: U.S. Environmental Protection Agency, Region 7 901 North 5th Street Kansas City, KS 66101 and U.S. Environmental Protection Agency, Region 9 75 Hawthorne Street San Francisco, CA 94105 February 2010
Transcript of FINAL GAMMA RADIATION SCANNING SAMPLING AND … · Figure 1.2 Study Area Map, Santa Susana Field...

FINAL GAMMA RADIATION SCANNING SAMPLING AND ANALYSIS PLAN AREA IV RADIOLOGICAL STUDY
SANTA SUSANA FIELD LABORATORY VENTURA COUNTY, CALIFORNIA
EPA Contract Number: EP-S7-05-05 Task Order Number: 0038
Prepared for:
U.S. Environmental Protection Agency, Region 7 901 North 5th Street
Kansas City, KS 66101
and
U.S. Environmental Protection Agency, Region 9 75 Hawthorne Street
San Francisco, CA 94105
February 2010

FINAL GAMMA RADIATION SCANNING SAMPLING AND ANALYSIS PLAN AREA IV RADIOLOGICAL STUDY
SANTA SUSANA FIELD LABORATORY VENTURA COUNTY, CALIFORNIA
USEPA Contract Number: EP-S7-05-05
Task Order Number: 0038
Prepared for:
U.S. Environmental Protection Agency, Region 7 901 North 5th Street
Kansas City, KS 66101
and
U.S. Environmental Protection Agency, Region 9 75 Hawthorne Street
San Francisco, CA 94105
Prepared by: The Palladino Company, Inc.
720 Fillmore Street San Francisco, CA 94117
and
HydroGeoLogic, Inc.
5023 North Parkway Calabasas Calabasas, CA 91302
February 2010

This page was intentionally left blank.

U. S. EPA Region 9 Gamma Scanning SAP i HydroGeoLogic, Inc. 2/22/2010
TABLE OF CONTENTS Section Page
1.0 INTRODUCTION ................................................................................. 1-1 1.1 PROJECT OBJECTIVES ............................................................... 1-1 1.2 SCOPE OF WORK ....................................................................... 1-2 1.3 ORGANIZATION OF THE SAMPLING AND ANALYSIS PLAN ........... 1-2
2.0 SITE BACKGROUND ............................................................................ 2-1 2.1 SITE LOCATION AND DESCRIPTION ............................................ 2-1 2.2 SITE HISTORY ........................................................................... 2-1 2.3 RADIONUCLIDES OF CONCERN .................................................. 2-2
PART 1: FIELD SAMPLING PLAN .................................................................. 3-1
3.0 SITE PREPARATION AND MANAGEMENT ............................................. 3-1 3.1 ACCESS .................................................................................... 3-1
3.1.1 Obstacles......................................................................... 3-1 3.1.2 Vegetation ....................................................................... 3-1
3.2 PROTECTION OF ANIMALS AND HABITAT ................................... 3-2 3.3 INVESTIGATION-DERIVED WASTE MANAGEMENT ....................... 3-3
4.0 DETECTION SYSTEMS AND INSTRUMENTATION ................................... 4-1 4.1 ENHANCED RADIATION GROUND SCANNER II ............................ 4-1 4.2 MULE-MOUNTED GAMMA SCANNER .......................................... 4-3 4.3 WHEEL-MOUNTED GAMMA SCANNER ........................................ 4-4 4.4 HAND-HELD GAMMA SCANNER ................................................. 4-5 4.5 HIGH PURITY GERMANIUM DETECTION SYSTEM ........................ 4-7 4.6 FIDLER DETECTION SYSTEM ..................................................... 4-8 4.7 DIFFERENTIAL GLOBAL POSITIONING SYSTEM ........................... 4-9 4.8 GAMMA SPECTROMETRY MODE ................................................ 4-9
5.0 RADIOLOGICAL SCANNING SURVEY STRATEGIES ................................ 5-1 5.1 GAMMA RADIATION ANOMALIES .............................................. 5-1
5.1.1 Definition of Gamma Radiation Anomaly ................................. 5-1 5.1.2 Identification of a Gamma Radiation Anomaly ........................... 5-2
5.2 GAMMA RADIATION SCANNING STRATEGY ................................ 5-3 5.3 INACCESSIBLE LOCATIONS ........................................................ 5-6 5.4 LIMITED ACCESS LOCATIONS .................................................... 5-7 5.5 CORRELATION OF FIELD MEASUREMENTS AND LABORATORY
DATA RESULTS ......................................................................... 5-7 5.6 EQUIPMENT DECONTAMINATION .............................................. 5-7
6.0 SENSITIVITY TESTING ........................................................................ 6-1 6.1 BACKGROUND DETERMINATION ............................................... 6-1

TABLE OF CONTENTS (continued)
Section Page
U. S. EPA Region 9 Gamma Scanning SAP ii HydroGeoLogic, Inc. 2/22/2010
6.2 SENSITIVITY TESTING ............................................................... 6-1 6.2.1 Scanning Minimum Detectable Count Rate ............................... 6-2 6.2.2 Static Minimum Detectable Count Rate .................................... 6-5
6.3 CONDITIONS AFFECTING DETECTOR SENSITIVITY ...................... 6-5 6.3.1 Soil Moisture and Density .................................................... 6-6 6.3.2 Contaminant Characteristics ................................................. 6-6 6.3.3 Background ..................................................................... 6-7 6.3.4 Scanning Rate and Detector Height ......................................... 6-8 6.3.5 Meteorological Conditions ................................................... 6-8
PART 2: QUALITY ASSURANCE PROJECT PLAN .............................................. 7-1
7.0 QUALITY ASSURANCE AND QUALITY CONTROL REQUIREMENTS .......... 7-1 7.1 FIELD QUALITY CONTROL ........................................................ 7-1 7.2 INSTRUMENT/EQUIPMENT TESTING, INSPECTION, AND
MAINTENANCE REQUIREMENTS ................................................ 7-2 7.3 INSTRUMENT CALIBRATION AND FREQUENCY ........................... 7-2 7.4 DATA ACQUISITION REQUIREMENTS .......................................... 7-2
8.0 DATA QUALITY OBJECTIVES ............................................................... 8-1 8.1 STEP 1: STATE THE PROBLEM .................................................... 8-1 8.2 STEP 2: IDENTIFY THE GOALS OF THE STUDY ............................. 8-1 8.3 STEP 3: IDENTIFY INFORMATION INPUTS ................................... 8-2 8.4 STEP 4: DEFINE THE BOUNDARIES OF THE STUDY ...................... 8-3 8.5 STEP 5: DEVELOP THE ANALYTIC APPROACH ............................. 8-3 8.6 STEP 6: SPECIFY PERFORMANCE OR ACCEPTANCE CRITERIA ....... 8-4 8.7 STEP 7: DEVELOP THE DETAILED PLAN FOR OBTAINING DATA .... 8-5
9.0 DATA VERIFICATION, VALIDATION, AND QUALITY ASSESSMENT ......... 9-1 9.1 VERIFICATION AND VALIDATION .............................................. 9-1
9.1.1 Data Verification ............................................................... 9-1 9.1.2 Data Validation ................................................................. 9-1
9.2 DATA QUALITY ASSESSMENT .................................................... 9-2 9.2.1 Step 1: Review Data Quality Objectives and Survey Design ........... 9-2 9.2.2 Step 2: Conduct Preliminary Data Review ................................ 9-2 9.2.3 Step 3: Conduct Statistical Tests ............................................ 9-3 9.2.4 Step 4: Verify Assumptions of the Statistical Test ....................... 9-3 9.2.5 Step 5: Draw Conclusions from the Data .................................. 9-3
10.0 REFERENCES ................................................................................... 10-1

U. S. EPA Region 9 Gamma Scanning SAP iii HydroGeoLogic, Inc. 2/22/2010
LIST OF TABLES
Table 4.1 Enhanced Radiation Ground Scanner II Specifications Table 4.2 Mule Mounted Gamma Scanner Specifications Table 4.3 Wheel Mounted Gamma Scanner Specifications Table 4.4 Hand-Held Gamma Scanner Specifications Table 4.5 HPGe Detection System Specifications Table 5.1 Surface Attributes Table 5.2 Survey Area Categories
LIST OF FIGURES
Figure 1.1 Site Location, Santa Susana Field Laboratory Figure 1.2 Study Area Map, Santa Susana Field Laboratory Figure 4.1 ERGS Surface Soil Radiation Survey Anaconda Mine Project Figure 6.1 Site and Radiological Background Reference Area Location Map
LIST OF APPENDICES ______________________________________________________________________________
Appendix A Gamma Radiation Emitting Radionuclides of Concern Potentially Detectable with Project Field Radiological Instrumentation
Appendix B Photographs Appendix C Standard Operating Procedures

This page was intentionally left blank.

U. S. EPA Region 9 Gamma Scanning SAP iv HydroGeoLogic, Inc. 2/22/2010
LIST OF ACRONYMS AND ABBREVIATIONS
Boeing The Boeing Company cpm counts per minute DGPS differential global positioning system DOE Department of Energy DQA data quality assessment DQO data quality objective ERGS enhanced radiation ground scanner °F degrees Fahrenheit FIDLER field instrument for detection of low energy radiation FOV field of view FSP Field Sampling Plan GPS global positioning system GRAY gamma radiation anomaly GBTV gamma background threshold levels HGL HydroGeoLogic, Inc. HHGS hand-held gamma scanner HPGe high purity germanium HSA Historical Site Assessment IEEE The Institute of Electrical and Electronic Engineers, Inc. in3 cubic inches keV kilo electron volts µR microroentgen MARSSIM Multi-Agency Radiation Site Survey and Investigation Manual MDCR minimum detectable count rate MeV mega electron volts min minutes MMGS mule mounted gamma scanner NaI sodium iodide NASA National Aeronautics and Space Administration NBZ northern buffer zone NDG nuclear density gauge NIST National Institute of Standards and Technology

LIST OF ACRONYMS AND ABBREVIATIONS (continued)
U. S. EPA Region 9 Gamma Scanning SAP v HydroGeoLogic, Inc. 2/22/2010
NPDES National Pollutant Discharge Elimination System PPE personal protective equipment QAPP Quality Assurance Project Plan QA Quality Assurance QC Quality Control RBRA Radiological Background Reference Area ROC radionuclide of concern RSI Radiation Solutions, Inc. SAP Sampling and Analysis Plan SMP Site Management Plan SOP standard operating procedure SSFL Santa Susana Field Laboratory SSA sub-survey area USEPA United States Environmental Protection Agency VDC volts direct current WMGS wheel mounted gamma scanner

U. S. EPA Region 9 Gamma Scanning SAP 1-1 HydroGeoLogic, Inc. 2/22/2010
FINAL GAMMA RADIATION SCANNING SAMPLING AND ANALYSIS PLAN AREA IV RADIOLOGICAL STUDY
SANTA SUSANA FIELD LABORATORY VENTURA COUNTY, CALIFORNIA
1.0 INTRODUCTION HydroGeoLogic, Inc. (HGL) has been tasked by the United States Environmental Protection Agency (USEPA) to conduct an extensive radiological characterization study of the Santa Susana Field Laboratory (SSFL) at Area IV and the Northern Buffer Zone (NBZ) located in Ventura County, California (Figure 1.1). This work is being executed under USEPA Region 7 Architect and Engineering Services Contract EP-S7-05-05, Task Order 038. The technical lead on the project is USEPA Region 9. Various data collection activities will be completed for the Area IV Radiological Study with a gamma radiation scanning survey scheduled as the first phase of USEPA’s on site data collection effort. This Gamma Radiation Scanning Sampling and Analysis Plan (SAP) for the SSFL Area IV Radiological Study details the approach for collecting real-time measurements to determine the presence of surface soil and, to a limited degree, subsurface soil radiological gamma radiation anomalies (GRAY) in the areas within the boundaries of Area IV and the NBZ (Figure 1.2); herein after referred to as the Study Area. Such GRAYs may indicate the presence of site related contamination in the Study Area. USEPA’s subsequent soil and water sampling and analysis strategies will further characterize each GRAY.
1.1 PROJECT OBJECTIVES
This SAP describes the USEPA’s approach for collecting gamma radiation measurements in the Study Area of the SSFL to determine the presence of GRAYs in surface soil and, to a limited degree, subsurface soil. The surveys will cover 100 percent of the accessible areas within the study boundaries of the Study Area. The data obtained from the surveys will support the design of additional investigations. The scope and procedures for conducting additional investigations (if required) will be detailed in subsequent planning documents; i.e., the Field Sampling Plan for Soil Sampling (HGL, 2010a) and Field Sampling Plan for Groundwater, Surface Water, and Sediment (HGL, 2010b), both provided in separate documents. An important consideration for this project is while multiple alpha, beta, and gamma radiation emitting radionuclides were used at the SSFL during its operational history, only a small suite of radionuclides with strong gamma radiation energies can be detected with current field scanning detection technologies. However, the advantage of scanning the Study Area for gamma radiation outweighs the limitations inherent to the technologies.

HGL—Final Gamma Radiation Sampling and Analysis Plan, SSFL—Ventura County, California
U. S. EPA Region 9 Gamma Scanning SAP 1-2 HydroGeoLogic, Inc. 2/22/2010
1.2 SCOPE OF WORK
The scope of the gamma radiation scanning effort is to determine the presence of GRAYs in the Study Area of the SSFL using real-time measurement technologies to achieve the data quality objectives (DQO) outlined in Section 8.0. A GRAY is defined in Section 5.1.1. Activities that will be conducted to meet the project objectives include:
• Conduct gamma radiation scanning surveys of 100 percent of accessible surface soil in the Study Area;
• Collect gamma radiation measurements at the Radiological Background Reference Areas (RBRA) to establish surface soil background gamma radiation levels for the Santa Susana and Chatsworth geological formations;
• Define the reason for using a less sensitive gamma radiation measurement technology and documenting the decision making process (e.g., difficult terrain restricts access);
• Perform an evaluation of gamma radiation measurements to determine the presence of GRAYs;
• Evaluate gamma spectroscopy data to determine the identity of certain radionuclides associated with a GRAY;
• Perform data analysis, review, and validation of collected data to determine its usability for decision making;
• Prepare interim reports, as appropriate, summarizing data findings for completed areas; and
• Prepare a final report summarizing all activities completed to implement this SAP including all field activities and data findings.
Not within the scope of this gamma radiation scanning effort is soil sampling and analysis to determine if a GRAY is associated with site related contamination. Soil sampling and analysis is the final arbiter that a GRAY is the result of site related contamination as discussed in the Field Sampling Plan for Soil Sampling (HGL, 2010a).
1.3 ORGANIZATION OF THE SAMPLING AND ANALYSIS PLAN
This SAP is composed of the Field Sampling Plan (FSP) and Quality Assurance Project Plan (QAPP). The following sections are included in this SAP: Section 1.0 Introduction Section 2.0 Site Background Part 1: Field Sampling Plan Section 3.0 Site Preparation and Management Section 4.0 Detection Systems and Instrumentation Section 5.0 Radiological Scanning Survey Strategies Section 6.0 Sensitivity Testing
HGL—Final Gamma Radiation Sampling and Analysis Plan, SSFL—Ventura County, California
U. S. EPA Region 9 Gamma Scanning SAP 1-3 HydroGeoLogic, Inc. 2/22/2010
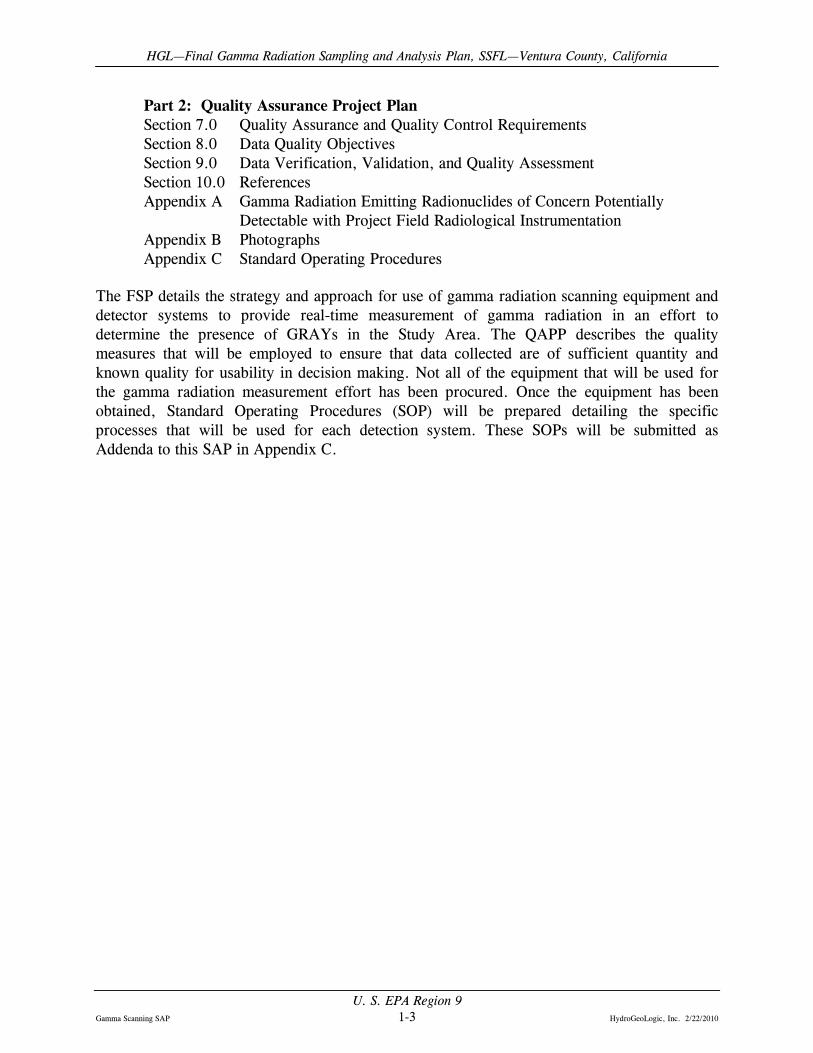
Part 2: Quality Assurance Project Plan Section 7.0 Quality Assurance and Quality Control Requirements Section 8.0 Data Quality Objectives Section 9.0 Data Verification, Validation, and Quality Assessment Section 10.0 References
Appendix A Gamma Radiation Emitting Radionuclides of Concern Potentially Detectable with Project Field Radiological Instrumentation
Appendix B Photographs Appendix C Standard Operating Procedures The FSP details the strategy and approach for use of gamma radiation scanning equipment and detector systems to provide real-time measurement of gamma radiation in an effort to determine the presence of GRAYs in the Study Area. The QAPP describes the quality measures that will be employed to ensure that data collected are of sufficient quantity and known quality for usability in decision making. Not all of the equipment that will be used for the gamma radiation measurement effort has been procured. Once the equipment has been obtained, Standard Operating Procedures (SOP) will be prepared detailing the specific processes that will be used for each detection system. These SOPs will be submitted as Addenda to this SAP in Appendix C.

This page was intentionally left blank.

HGL—Final Gamma Radiation Sampling and Analysis Plan, SSFL—Ventura County, California
U. S. EPA Region 9 Gamma Scanning SAP 2-1 HydroGeoLogic, Inc. 2/22/2010
2.0 SITE BACKGROUND
2.1 SITE LOCATION AND DESCRIPTION
The SSFL is located in southeastern Ventura County, California, approximately 2 miles south of Simi Valley and 30 miles northwest of downtown Los Angeles between the Simi and San Fernando Valleys in the Simi Hills. The site is divided into four administrative areas (I, II, III, and IV) and undeveloped buffer properties to the northwest and south as described below (Figure 1.1).
• Area I consists of approximately 671 acres owned by The Boeing Company (Boeing) and approximately 42 acres owned by the National Aeronautics and Space Administration (NASA) in the northeast portion of the Site. Area I contains administrative and laboratory facilities and was formerly used for rocket engine testing. This area also includes the former Area I Thermal Treatment Facility and three rocket engine test areas, the Bowl, Canyon, and Advanced Propulsion Test Facility.
• Area II consists of approximately 410 acres in the north-central portion of the site and is owned by NASA and operated by Boeing. Area II contains four former rocket test firing facilities (Alfa, Bravo, Coca, and Delta).
• Area III consists of approximately 114 acres in the northwest portion of the site and is owned and operated by Boeing. Area III includes the systems test area (STL-IV) and associated laboratories.
• Area IV consists of approximately 290 acres owned and operated by Boeing; including approximately 90 acres previously leased by the United States Department of Energy (DOE). DOE and its contractors operated nuclear reactors and associated facilities within this area.
• The NBZ and southern buffer zone consist of approximately 182 and approximately 1,143 acres, respectively. Industrial activities have never occurred on these naturally vegetated areas. A lawsuit settlement stipulated that Boeing purchase the NBZ from the adjoining American Jewish University’s Brandeis-Bardin Campus; the land purchased was completed on January 23, 1998.
The focus of the ongoing study is to characterize radiological contamination within the boundaries of Area IV and the NBZ.
2.2 SITE HISTORY
USEPA is conducting a Historical Site Assessment (HSA), which will document the site history. Therefore, the site history is not included in this document. However, data collected in the implementation of this SAP will be reviewed in conjunction with the HSA as well as other data collected in accordance with the Field Sampling Plan for Soil Sampling (HGL, 2010a) and the Field Sampling Plan for Groundwater, Surface Water, and Sediment (HGL, 2010b), provided in separate documents. Adjustments to this SAP may be warranted based on review of the HSA and analytical data. For example, if the HSA or soil analysis identifies a potential

HGL—Final Gamma Radiation Sampling and Analysis Plan, SSFL—Ventura County, California
U. S. EPA Region 9 Gamma Scanning SAP 2-2 HydroGeoLogic, Inc. 2/22/2010
contaminated area for a non-gamma radiation emitting radionuclide, the area may be revisited to conduct additional scanning with appropriate field instruments such as a field instrument for detection of low energy radiation (FIDLER) detector (see Section 4.6 for a description). Planning is currently underway to conduct a detailed investigation of radiological contamination at the SSFL within the Study Area. This study is being led by the USEPA Region 9. Field activities related to this investigation are scheduled to begin in the spring of 2010 and terminate in 2011.
2.3 RADIONUCLIDES OF CONCERN
The SSFL Radiological Background Study developed a list of 77 radionuclides of concern (ROC) to determine background surface and subsurface soil concentrations (HGL, 2009). This list was developed as a preliminary list of radionuclides which may have been used at the SSFL. The Radiological Background Study acknowledged the list of ROCs was subject to change based on USEPA’s HSA; the HSA is currently scheduled for completion in October 2010. This SAP will also use the same 77 ROCs until further information from the HSA warrants amending the list. Many of the radionuclides on the Radiological Background Study ROC list do not emit gamma radiation detectable by real-time, field portable instrumentation and fall into one or more of the following three categories:
• Radionuclides that emit only alpha radiation; for example polonium-210; • Radionuclides that emit only beta radiation; for example strontium-90; and • Radionuclides that emit only very low energy gamma radiation; for example iodine-
129. Therefore, the Radiological Background Study ROC list has been modified to include only ROCs that emit gamma radiation potentially detectable by field portable, real-time instruments as summarized in Appendix A.

HGL—Final Gamma Radiation Sampling and Analysis Plan, SSFL—Ventura County, California
U. S. EPA Region 9 Gamma Scanning SAP 3-1 HydroGeoLogic, Inc. 2/22/2010
PART 1: FIELD SAMPLING PLAN
3.0 SITE PREPARATION AND MANAGEMENT A primary challenge in many areas in the Study Area is restricted accessibility due to numerous obstacles, rough terrain, heavy vegetation, and threatened or endangered plants. Each of these restrictions will be reviewed and addressed on a case-by-case basis. However, for the purpose of this SAP, this section presents the overall approach to obtaining maximum access.
3.1 ACCESS
The terrain in the Area IV Study Area ranges from flat, gently, sloping areas with easy access to rugged, steep terrain with rocky outcrops and dense vegetation with restricted access. For planning purposes, the Study Area terrain will be classified by the surface type and vegetation density to determine the most appropriate scanning technology and methodology. This is discussed further in Section 5.2. During the gamma radiation scanning effort, care will be taken not to damage or otherwise compromise National Pollutant Discharge Elimination System (NPDES) filtration structures or check dams in place at the site. Boeing personnel will monitor work around these structures. In addition, disturbance or damage to sensitive vegetation will be mitigated. Identified cultural resources will be avoided.
3.1.1 Obstacles
In general, obstacles, such as buildings, asphalt roads, concrete pads, fencing, etc. that restrict or prevent access will not be altered to gain access to the surface soil beneath the feature. If the project team determines it is feasible to relocate or otherwise alter a site feature, such as a temporary fence, to gain access, a request to DOE or Boeing, as applicable, will be made to move the obstacle temporarily or permanently. Some obstacles, such as asphalt paving and concrete, will significantly shield the gamma radiation emitted from the underlying soil but can be scanned at a reduced sensitivity. In such a case, these locations will be designated as “restricted access” in the gamma radiation scanning reports and USEPA presumes the underlying soil will be investigated in a similar manner as described in the SAP after the feature has been removed. However, if a GRAY is suspected beneath a hard surface then soil samples can be collected at discrete locations by coring through the hard surface; this effort will be addressed in the Field Sampling Plan for Soil Sampling (HGL, 2010a). The project team will attempt to scan over obstacles, if feasible.
3.1.2 Vegetation
The height of vegetation on the site affects the height of the gamma radiation scanning detector; increased distance of the detector from the ground surface generally decreases the sensitivity of the scanner and detection capabilities. Ideally, vegetation in each survey area will be trimmed to an acceptable length, without causing irreparable damage to the vegetation, to allow unimpeded access before conducting the scanning surveys. The priority for trimming vegetation in descending priority is as follows:

HGL—Final Gamma Radiation Sampling and Analysis Plan, SSFL—Ventura County, California
U. S. EPA Region 9 Gamma Scanning SAP 3-2 HydroGeoLogic, Inc. 2/22/2010
1. Less than 6 inches from the ground surface; 2. Greater than 6 inches from the ground surface, but as short as possible; and 3. No reduction in height.
In accordance with Boeing’s Plant Cuttings Management Plan, native vegetation debris will be mulched and left in pre-defined localized areas to reduce the movement of native seeds and nonnative plants to other areas. Special precautions will be taken when removing or trimming poison oak to prevent exposure to workers. The use of herbicides to remove poison oak will be prohibited. The poison oak trimmings will be separated and stored in a bin for off-site disposal in accordance with Boeing procedures. Certain types of vegetation will not be removed or trimmed, such as trees, sensitive or protected species, and vegetation that provides habitat for sensitive or protected species, unless approved by applicable agencies. These vegetation types will be identified by a qualified biologist or plant specialist, including but not limited to:
• Braunton’s Milk Vetch (Astragalus brauntonii) – endangered, critical habitat; • Santa Susana Tarplant (Deinandra minthornii) – state-listed rare species; • Lyon’s Pentachaeta (Pentachaeta lyonii) – endangered; • Spreading navarretia (Navarretia fossalis) – threatened; • Conejo dudleya (Dudleya abramsii ssp. Parva [Dudleya parva]) – threatened; • Santa Monica Mountains dudleya (Dudleya cymosa ssp. ovatifolia [inclusive of Dudleya
cymosa ssp. agourensis) – threatened; • Marcescent dudleya (Dudleya cymosa ssp. marcescens) – threatened; and • San Fernando Valley spineflower (Chorizanthe parryi var. Fernandina) – candidate.
The qualified biologist or plant specialist will be retained under subcontract and will have previous, relevant experience with the federal Endangered Species Act and the United States Fish and Wildlife Section 7.0 Informal and Formal Consultation procedures. The subcontractor also will have experience working with native plant societies and other interested stakeholders (California Native Plant Society, Santa Monica Mountains Conservancy, Mountains Recreation and Conservation Authority, and Santa Susana Mountain Park Association, etc.). Additional requirements of the Biological Assessment associated with vegetation protection and management, including dust suppression measures, will be detailed in the Site Management Plan (SMP) to be provided in a separate document. In addition, field crews will be trained on recognition of these species so they can avoid unmarked plants.
3.2 PROTECTION OF ANIMALS AND HABITAT
During the execution of field activities, care will be taken to avoid harming animals and their habitat to the extent practicable. A qualified biologist with relevant regulatory experience will be retained under subcontract to conduct a biological survey to identify animals and habitat protection requirements. In particular, special precautions will be taken for the two primary

HGL—Final Gamma Radiation Sampling and Analysis Plan, SSFL—Ventura County, California
U. S. EPA Region 9 Gamma Scanning SAP 3-3 HydroGeoLogic, Inc. 2/22/2010
sensitive species found in the Study Area: the San Diego horned lizard (Phrynosoma coronatum blainvillei), a state species of special concern; and the California legless lizard (Anniella pulchra pulchra), a state species of special concern. Other species that may be encountered in the study area includes but is not limited to:
• Coastal California Gnatcatcher (Polioptila californica californica) – threatened; • Least Bell’s vireo (Vireo bellii pusillus) – endangered; • California Condor (Gymnogyps californianus) – endangered; • California red-legged frog (Rana aurora draytonii) – threatened; • Quino checkerspot butterfly (Euphydryas editha quino) – endangered; and • Listed vernal pool branchiopod species (e.g. Branchinecta lynchi) – threatened.
Field crews will be trained on recognition of identified species so they can avoid them. Also, care will be taken to avoid the nests of migratory birds during the nesting season of February 15 through August 15. If encountered in a survey area, the location of the identified species or nest will be flagged and the survey crew will move to a different location. Upon confirmation that the animal or nest is not at the location of interest, scanning will be completed. Two poisonous animals are expected: rattlesnakes and black widow spiders. Crews will be trained on recognition, typical habitat, avoidance, and first aid for these species. A qualified person will remove poisonous animals if necessary. Additional requirements related to protection of animals and habitat will be detailed in the SMP.
3.3 INVESTIGATION-DERIVED WASTE MANAGEMENT
Because this effort includes only collection of gamma radiation measurements, the primary investigation-derived waste that will be generated is expected to consist of spent personal protective equipment (PPE) and general municipal refuse. A mule will likely be used to perform a portion of the gamma radiation scanning survey. Mule dung will be prevented from falling to the ground or picked up immediately upon contact with the ground. The dung is being removed to reduce the potential for introducing high nitrate materials that may potentially cause an exceedance in NPDES-permitted areas, and minimize the potential for non-indigenous vegetation species from being introduced through seeds contained in the mule dung. All mule dung will be removed from the site for disposal as general municipal refuse. Used PPE and general refuse will be collected in garbage bags and disposed of as solid municipal waste. No radioactive waste is anticipated. Nevertheless, filled garbage bags will be surveyed for radioactivity before disposal in accordance with the SMP. Contaminated gamma radiation scanning equipment will be decontaminated in accordance with the SMP. All wastes generated by the decontamination process will be managed appropriately in accordance with the SMP. In the event of a spill of fuel from a gamma radiation scanning vehicle, the spill response plan detailed in the SMP will be activated and waste materials disposed of accordingly.

This page was intentionally left blank.

HGL—Final Gamma Radiation Sampling and Analysis Plan, SSFL—Ventura County, California
U. S. EPA Region 9 Gamma Scanning SAP 4-1 HydroGeoLogic, Inc. 2/22/2010
4.0 DETECTION SYSTEMS AND INSTRUMENTATION Gamma radiation detection systems will be constructed by USEPA with the assistance of HGL. Most gamma radiation scanning detection systems will consist of four basic components: a single or array of sodium iodide (NaI) scintillation detectors with lead shielding, a differential global positioning system (DGPS), a data acquisition module, and a transportation mechanism. The shield will surround the detectors on the sides and top and leave a “window” facing the ground surface; this type of shield is typically called a collimator. The collimator reduces extraneous gamma radiation from surrounding surface soil and/or objects, like buildings, rocks, etc. and lowers the background count rate (see Section 6.3.3 for a discussion on background) and the detection limit of the detection system; i.e., increases sensitivity. USEPA has conducted numerous gamma radiation surface soil surveys at various types of sites throughout the United States. An example investigation utilized the USEPA’s Scanner Van to locate and assess anomalously high gamma radiation emitting sources (USEPA, 2005). A description of a similar Scanner Van is located in the document USEPA-02 Surface Gamma Scanner System (Bendix, 1981).
4.1 ENHANCED RADIATION GROUND SCANNER II
The design of USEPA’s Enhanced Radiation Ground Scanner (ERGS) is the model for the ERGS II. The ERGS consists of eight NaI detectors with a shield surrounding the detectors on all sides and the top. The detector and shield is mounted to a forklift attachment on an off-road forklift. A DGPS antenna is mounted on the detector with the gamma radiation and DGPS signals integrated on a laptop computer located in the tractor cab. Photograph 1 in Appendix B shows the current USEPA ERGS. Similar scanning systems have been constructed and used to conduct gamma radiation scanning surveys (Bechtel, 1999). The ERGS II will have a commercially available detection system developed by Radiation Solutions Inc. (RSI). The system consists of two carbon fiber cases, each containing a set of four NaI detectors. The gamma radiation measurements are integrated with a DGPS signal and sent to a computer data acquisition system. Each of the NaI detectors has a multichannel analyzer to perform gamma spectroscopy. Advanced software provides various visual outputs. The two carbon fiber cases will have a lead shield surrounding all sides and the top to reduce extraneous gamma radiation from the sky and adjacent contamination and objects. Figure 4.1 illustrates an example of the ERGS gamma radiation scanning results from an USEPA investigation of a non-operational mine site in Nevada. Photograph 2 in Appendix B shows a single RSX-4 detector which will comprise part of the detector system for the ERGS II. Preliminary specifications of the ERGS II detection system are summarized in Table 4.1.

HGL—Final Gamma Radiation Sampling and Analysis Plan, SSFL—Ventura County, California
U. S. EPA Region 9 Gamma Scanning SAP 4-2 HydroGeoLogic, Inc. 2/22/2010
Table 4.1 Enhanced Radiation Ground Scanner II Specifications
Detection System Manufacturer Radiation Solutions Inc. Model RSX-4 (four 4-inch by 4-inch by 16-inch spectral grade NaI) Detector volume 2,048 cubic inches (in3); two Model RSX-4 Weight Approximately 400 pounds Power 10 to 40 volts direct current (VDC), nominally 12 VDC Operating temperature -22 to +113 degrees Fahrenheit (°F) Detector height above ground surface
6- to 12-inches depending on sensitivity test results; actual height is dependent on height of vegetation/obstacles
Detector scanning speed 6- to 18-inches per second depending on sensitivity test results Spectrometer Channels 1024 Resolution 3 kilo electron volts (keV) per channel linear response Gamma energy response 20 keV to 3 mega electron volts (MeV) with a cosmic window above 3.5
MeV
Dead time Zero (live time clock adjusts for loss of system measured pile-up rejections to give an apparent dead time ensuring absolute count rate is correct)
Sampling rate 1 per second with capability range of 0.1 to 10 per second Count rate Up to 250,000 counts per second
Spectral stabilization Automatic spectral stabilization at approximately every two minutes to maintain the peak position +/- 0.2 percent over 1024 channels
Control and Data Analysis
Data Integration Data from both RSX-4 modules are integrated with the DGPS signal via a RS-501 interface console
Communication Data transfer from the RS-501 interface console to computer via ethernet cable
Computer Panasonic Toughbook Model CF-30 Software RadAssist (RSI proprietary) Shield Construction 1/4-inch steel with 1-inch thick lead
Size Approximately 49-inch wide by 32-inch long by 9-inch high without forklift handles
Weight Approximately 1,250 pounds Forklift Handles 1/4-inch steel sized for standard forks DGPS Manufacturer Trimble Model Ag332 Differential correction WAAS, beacon, real time satellite via Omni Star, and other systems Accuracy Minimum of sub-meter; optional sub-decimeter Transportation Mechanism Manufacturer To be determined; examples are Genie, Caterpillar, Case, JCB Model To be determined depending on manufacturer Type Off road, telehandler forklift Power Train Hydraulic

HGL—Final Gamma Radiation Sampling and Analysis Plan, SSFL—Ventura County, California
U. S. EPA Region 9 Gamma Scanning SAP 4-3 HydroGeoLogic, Inc. 2/22/2010
4.2 MULE-MOUNTED GAMMA SCANNER
The Mule-Mounted Gamma Scanner (MMGS) is a unique design for conducting gamma radiation scanning surveys in rough terrain. The detector transportation mechanism for the MMGS is a mule (Equis mulus). A saddle, harness, and detector support mechanism is attached to the mule with a detector mounted on each side the animal. The detector system consists of two NaI detectors. Each detector will have a lead shield on the front, the top, and the side facing away from the mule to create a detection window on the bottom. The mule acts as a shield for the detector side facing the animal; this design reduces the weight of shielding. In addition, the shielding will not cover the entire side of the detector case to reduce weight, thus only the length of the detector NaI crystal will be shielded. The electronics package acts as a partial shield for the rear portion of the NaI crystal. A DGPS antenna is mounted on a support mechanism with a data acquisition module to data log the gamma radiation measurements with integrated DGPS data. The data acquisition module sends the data to a computer data processing system. Each of the NaI detectors will have a multichannel analyzer for gamma spectroscopy. Photograph 3 in Appendix B shows a mule carrying a saddle and harness which will be used to mount two detectors with a DGPS. The exact design is to be determined based on available and appropriate equipment. The mule will be guided by a trained person. Preliminary specifications of the MMGS detection system are summarized in Table 4.2. Operationally, it is desirable that the mule is used for a limited duration, since the care and feeding of the animal is more extensive than maintaining the other gamma radiation detection systems. The mule can be rented and used for brief periods after identifying the survey areas that will utilize the MMGS. Scheduling the use of the MMGS in this manner is more desirable than having the mule idle for a length of time.
Table 4.2 Mule-Mounted Gamma Scanner Specifications
Detection System Manufacturer Radiation Solutions Inc. Model RSX-1 (4-inch by 4-inch by 16-inch spectral grade NaI) Detector volume 512 in3; two Model RSX-1 Weight Approximately 100 pounds Power 10 to 40 VDC, nominally 12 VDC Operating temperature -22 to +113°F Detector height above ground surface
24-inches depending on size of mule and sensitivity test results; actual height is dependent on height of vegetation/obstacles
Detector scanning speed 6- to 18-inches per second depending on sensitivity test results Spectrometer Channels 1024 Resolution 3 keV per channel linear response Gamma energy response 20 keV to 3 MeV with a cosmic window above 3.5 MeV Dead time Zero (live time clock adjusts for loss of system measured pile-up rejections
to give an apparent dead time ensuring absolute count rate is correct)
HGL—Final Gamma Radiation Sampling and Analysis Plan, SSFL—Ventura County, California
U. S. EPA Region 9 Gamma Scanning SAP 4-4 HydroGeoLogic, Inc. 2/22/2010
Table 4.2 (Continued) Mule-Mounted Gamma Scanner Specifications
Spectrometer (Continued) Sampling rate 1 per second with capability range of 0.1 to 10 per second Count rate Up to 250,000 counts per second
Spectral stabilization Automatic spectral stabilization at approximately every two minutes to maintain the peak position +/- 0.2 percent over 1024 channels
Control and Data Analysis
Data Integration Data from both RSX-1 detectors are integrated with the DGPS signal via a RSI RS-701 interface console
Communication Data transfer from the RS-701 interface console to computer via ethernet cable
Computer Panasonic Toughbook Model CF-30 Software RadAssist (RSI proprietary) Shield
Construction 1/4-inch thick lead lined with copper to shield the 78 keV X-ray peak from the interaction of cosmic radiation with lead
Size Approximately 7-inch wide by 17-inch long by 7-inch high on the front, top and outside of each detector (the side facing the mule will not have shielding)
Weight Approximately 29.4 pounds each DGPS Manufacturer Trimble Model Ag332 Differential correction WAAS, beacon, real time satellite via Omni Star, and other systems Accuracy Minimum of sub-meter; optional sub-decimeter Transportation Mechanism Type Mule (Equis mulus) led by a trained handler
4.3 WHEEL-MOUNTED GAMMA SCANNER
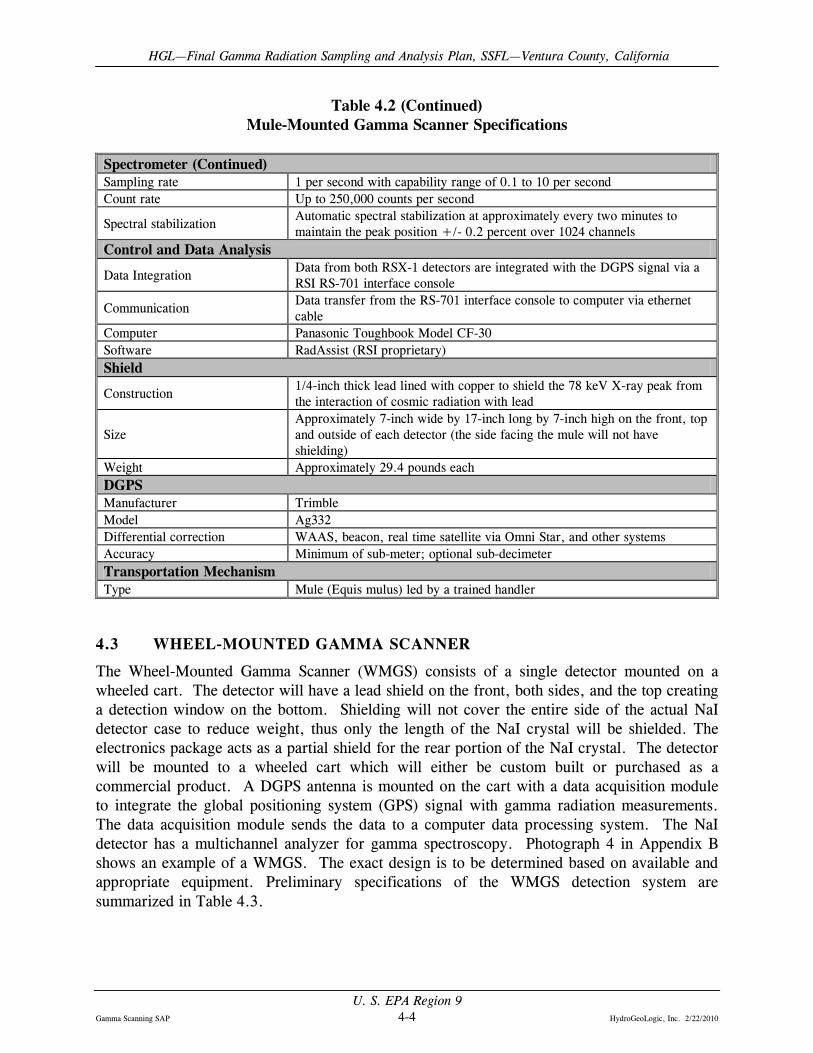
The Wheel-Mounted Gamma Scanner (WMGS) consists of a single detector mounted on a wheeled cart. The detector will have a lead shield on the front, both sides, and the top creating a detection window on the bottom. Shielding will not cover the entire side of the actual NaI detector case to reduce weight, thus only the length of the NaI crystal will be shielded. The electronics package acts as a partial shield for the rear portion of the NaI crystal. The detector will be mounted to a wheeled cart which will either be custom built or purchased as a commercial product. A DGPS antenna is mounted on the cart with a data acquisition module to integrate the global positioning system (GPS) signal with gamma radiation measurements. The data acquisition module sends the data to a computer data processing system. The NaI detector has a multichannel analyzer for gamma spectroscopy. Photograph 4 in Appendix B shows an example of a WMGS. The exact design is to be determined based on available and appropriate equipment. Preliminary specifications of the WMGS detection system are summarized in Table 4.3.

HGL—Final Gamma Radiation Sampling and Analysis Plan, SSFL—Ventura County, California
U. S. EPA Region 9 Gamma Scanning SAP 4-5 HydroGeoLogic, Inc. 2/22/2010
Table 4.3 Wheel Mounted Gamma Scanner Specifications
Detection System Manufacturer Radiation Solutions Inc. Model RSX-1 (4-inch by 4-inch by 16-inch spectral grade NaI) Detector volume 256 in3; one Model RSX-1 Weight Approximately 50 pounds Power 10 to 40 VDC, nominally 12 VDC Operating temperature -22 to +113°F Detector height above ground surface
6- to 12-inches depending on sensitivity test results; actual height is dependent on height of vegetation/obstacles
Detector scanning speed 6- to 18-inches per second depending on sensitivity test results Spectrometer Channels 1024 Resolution 3 keV per channel linear response Gamma energy response 20 keV to 3 MeV with a cosmic window above 3.5 MeV Dead time Zero (live time clock adjusts for loss of system measured pile-up rejections to
give an apparent dead time ensuring absolute count rate is correct) Sampling rate 1 per second with capability range of 0.1 to 10 per second Count rate Up to 250,000 counts per second Spectral stabilization Automatic spectral stabilization at approximately every two minutes to
maintain the peak position +/- 0.2 percent over 1024 channels Control and Data Analysis Data Integration Data from both detectors are integrated with the DGPS signal via a to be
determined automated system Communication Data transfer from the RS-701 interface console to computer via ethernet
cable Computer Panasonic Toughbook Model CF-30 Software RadAssist (RSI proprietary) Shield Construction 1/4-inch thick lead lined with copper to shield the 78 keV X-ray peak from
the interaction of cosmic radiation with lead or 3/8-inch thick steel Size Approximately 7-inch wide by 17-inch long by 7-inch high Weight Approximately 43 pounds DGPS Manufacturer Trimble Model Ag332 Differential correction WAAS, beacon, real time satellite via Omni Star, and other systems Accuracy Minimum of sub-meter; optional sub-decimeter Transportation Mechanism Type Three or four wheeled cart pulled or pushed by a radiation technician
4.4 HAND-HELD GAMMA SCANNER
The Hand-Held Gamma Scanner (HHGS) is a common design for conducting gamma radiation surveys. It consists of a single 3-inch by 3-inch NaI detector surrounded by a ¼-inch lead shield. Although the detector will not have lead on the top it will be shielded by the photomultiplier tube that sits atop the detector. It is designed to have greater sensitivity on the

HGL—Final Gamma Radiation Sampling and Analysis Plan, SSFL—Ventura County, California
U. S. EPA Region 9 Gamma Scanning SAP 4-6 HydroGeoLogic, Inc. 2/22/2010
bottom facing the ground surface. The detector probe will be integrated with a ratemeter with a RS-232 data port. A technician will carry the detector and ratemeter with a backpack containing a DGPS antenna and digibox. The digibox is a simple, commercial product that merges the signal from the ratemeter with the GPS signal and sends the data to a laptop computer for processing and storage. This system will not have gamma spectroscopy capabilities. Photograph 5 in Appendix B depicts a person conducting a radiation survey with a hand-held 3-inch by 3-inch NaI detector. Preliminary specifications of the HHGS detection system are summarized in Table 4.4.
Table 4.4 Hand-Held Gamma Scanner Specifications
Detection System Manufacturer Ludlum Instruments Inc. Detector Model 44-20 (3-inch by 3-inch NaI) Ratemeter Model 2221 with RS-232 data port Detector volume 21.1 in3 Total weight Approximately 9.2 pounds Power Four D-cell alkaline batteries Operating temperature -4 to +122 °F Sampling rate 1 per second Sensitivity Approximately 2,700 counts per minute per microroentgen per hour
(cpm/µR/hr) Operating point Optimized for radium-226 Detector height above ground surface
6- to 12-inches depending on sensitivity test results; actual height is dependent on height of vegetation/obstacles
Detector scanning speed 6- to 18-inches per second depending on sensitivity test results Control and Data Analysis Data Integration Digibox Communication Data transfer from the Model 2221 via RS-232 port to digibox then via RS-
232 cable to computer Computer Panasonic Toughbook Model CF-30 Software USEPA’s RAT Shield Construction 1/4-inch thick lead lined with copper to shield the 78 keV X-ray peak from
the interaction of cosmic radiation with lead or 3/8-inch thick steel Size Approximately 3.6-inch diameter by 3.6-inch high Weight Approximately 10.7 pounds each DGPS Manufacturer Trimble Model Ag332 Differential correction WAAS, beacon, real time satellite via Omni Star, and other systems Accuracy Minimum of sub-meter; optional sub-decimeter Transportation Mechanism Type Hand-held by a radiation technician.

HGL—Final Gamma Radiation Sampling and Analysis Plan, SSFL—Ventura County, California
U. S. EPA Region 9 Gamma Scanning SAP 4-7 HydroGeoLogic, Inc. 2/22/2010
4.5 HIGH PURITY GERMANIUM DETECTION SYSTEM
A high purity germanium (HPGe) detector system may be used to identify radionuclides and determine estimated concentrations of radionuclides in surface soil; i.e., estimate the picocuries per gram. The HPGe is a gamma spectrometer with much higher resolution than a NaI gamma spectroscopy system. The higher resolution allows for enhanced identification and estimation of radionuclides concentrations. This detector is placed at a single location for a specified time period depending on the detection limits requirements; i.e., minutes to hours. The collected data is processed by a software program which provides radionuclide identification with estimated, field screening level data. This detection system can minimize fixed-laboratory analytical costs and provide data much faster. However, the detection limits of this system are much higher than a laboratory so it does not replace laboratory sample analysis for locations below the detection limits of the HPGe. Instead, the HPGe system can be used to supplement measurements by other gamma radiation scanning detection systems proposed for the Area IV Radiological Study and provide enhanced radionuclide identification with estimated soil concentrations for some gamma radiation emitting radionuclides. In addition, the HPGe system could be deployed at locations where elevated spectral counts are observed at lower energies and NaI detectors have lower resolution, such as in the 44keV, 60keV or 100keV regions, thus obtaining measurements with increased spectral resolution and thereby more definitive identification of certain radionuclides. Each measurement location will be documented with DGPS. Precise quantification of radionuclides in the field is problematic and highly dependent on the distribution of the radionuclide as well as other variables. There are many uncontrollable variables, such as homogeneity, depth and type of source, and soil characteristics, which complicate precise quantification. Thus, this technology will be used as an estimation tool as the detector system can be a cost effective tool and provide useful information to guide determination of areas of potential contamination. However, an advantage of an HPGe is that it can measure the radiation flux from a larger surface area than practical with soil sampling and analyses. The total surface area measured is controlled by the detector height above the ground surface and whether a detector collimator is used. The USEPA’s Center for Environmental Restoration, Monitoring and Emergency Response located at the Radiation and Indoor Environments National Laboratory in Las Vegas, Nevada, has an HPGe system available for use for this project. Equipment and training will be provided by the USEPA for the project field staff as needed. Preliminary specifications of the HHGS detection system are summarized in Table 4.5.

HGL—Final Gamma Radiation Sampling and Analysis Plan, SSFL—Ventura County, California
U. S. EPA Region 9 Gamma Scanning SAP 4-8 HydroGeoLogic, Inc. 2/22/2010
Table 4.5 HPGe Detection System Specifications
Detection System Manufacturer Canberra Detector Model 5020 (Broad energy germanium) Detector height above ground surface
30- to 100-centimeters depending on sensitivity test results; actual height is dependent on height of vegetation/obstacles
Detector scanning speed None, detector remains stationary at a fixed location during data collection Spectrometer Resolution Variable depending on energy (0.35 keV resolution for 5.9 keV energy and
2.00 keV resolution for 1332 keV energy) Gamma energy response 3 keV to 3 MeV Count time variable depending on desired minimum detectable concentration Control and Data Analysis Data Integration Inspector 2000 Communication Data cable Computer Laptop Software Genie-2000, ISOCS, and quality control package Shield (Optional) Type ISOCS DGPS Manufacturer Trimble Model Ag332 Differential correction WAAS, beacon, real time satellite via Omni Star, and other systems Accuracy Minimum of sub-meter; optional sub-decimeter Transportation Mechanism Type Cart with detector stand, hand operated by a radiation technician.
4.6 FIDLER DETECTION SYSTEM
A Bicron Model G5 or equivalent FIDLER may be used to detect low energy gamma radiation. A FIDLER has a thin NaI detector with dimensions of 1.6 millimeter thick and 13 centimeters in diameter with a high efficiency detection range for gamma radiation energies from 30 to 700 keV. The window is 2 millimeters thick of beryllium with a quiet photomultiplier tube with low noise characteristics. The FIDLER will be used when the presence of x-ray radiation from americium-241, plutonium-238, and plutonium-239 are suspected. In addition, the low energy gamma radiation emitted from uranium-235 can be detected by a FIDLER. Deployment of the FIDLER will depend on the nature of the objectives for data collection to be determined as a need arises. The USEPA’s Center for Environmental Restoration, Monitoring and Emergency Response, located at the Radiation and Indoor Environments National Laboratory in Las Vegas, Nevada, has several FIDLER detector systems available for use for this project. Equipment will be provided by the USEPA for the project field staff as needed.

HGL—Final Gamma Radiation Sampling and Analysis Plan, SSFL—Ventura County, California
U. S. EPA Region 9 Gamma Scanning SAP 4-9 HydroGeoLogic, Inc. 2/22/2010
4.7 DIFFERENTIAL GLOBAL POSITIONING SYSTEM
Each gamma radiation detection system will be integrated with commercial DGPS and data management system. The detection system records the detector’s physical location associated with the radiation measurements during scanning or static surveys. The system produces real-time positioning for the survey data collected at a rate of a measurement every second. All the data and posting plots of the area surveyed can also be produced from the detection system. The positioning system is based on a commercial DGPS. The software with the system identifies the location of the data collection point and assigns coordinates to the gamma radiation measurement for later analysis. The positioning system is accurate to within a few feet or few inches depending on the DGPS device used. See Sections 4.1 to 4.5 for the proposed DGPS units for each detector system.
4.8 GAMMA SPECTROMETRY MODE
The ERGS II, MMGS, and WMGS can be operated in a spectrometry mode. This allows for radionuclide identification in real-time during scanning. The NaI detectors used in each detection system can provide both gross gamma radiation count rate and the spectroscopic data. Each detector can provide spectroscopic data independent of the other detectors in the system; i.e., the ERGS II can provide eight separate gamma spectroscopy data sets. However, the data processing to obtain this data is much more intense than in count rate mode. The data are analyzed by a sophisticated and proprietary software program to identify the radionuclides present, using their characteristic gamma radiation energies. This spectroscopy mode can be used when suspected anomalous gamma radiation readings are encountered; although natural background levels of radionuclides can also be identified, like potassium-40, uranium-238, radium-226, etc. Isotopic ratios of naturally occurring radionuclides can be analyzed to differentiate a potential GRAY from naturally occurring materials. The detection systems are capable of collecting both count rate and gamma spectroscopy data simultaneously. Thus, both types of data can be post-processed after data collection to determine the location and potentially the identity of detected radionuclides. Besides the detection systems described in Sections 4.1 to 4.4, USEPA’s HPGe spectroscopy system is available (see Section 4.5). This is a field system that can also identify individual radionuclides. The HPGe system uses a germanium detector, while the other detection systems use NaI detectors. The germanium detectors are better able to discriminate between radionuclides while the NaI detectors are better at accumulating gross gamma radiation data. Both systems will be used as needed.

This page was intentionally left blank.

HGL—Final Gamma Radiation Sampling and Analysis Plan, SSFL—Ventura County, California
U. S. EPA Region 9 Gamma Scanning SAP 5-1 HydroGeoLogic, Inc. 2/22/2010
5.0 RADIOLOGICAL SCANNING SURVEY STRATEGIES The Study Area and the RBRAs have diverse terrain, vegetation, obstacles, accessibility, and other challenges to conducting a gamma radiation scanning survey. Several considerations must be addressed: accessibility with the available detection systems, sensitivity of the detection systems, and available fiscal and temporal schedules. The fiscal and temporal schedules for the overall SSFL project will be addressed in the SMP.
5.1 GAMMA RADIATION ANOMALIES
The primary objective of this Work Plan is to identify GRAYs within the project Study Area. A definitive description of a GRAY is challenging due to the complexity of the site terrain and features as well as fluctuations in natural background (see Section 6.3.3 for a discussion on background). In addition, confirmation of a GRAY as site related contamination is important to future activities on the SSFL. However, this activity is beyond the scope of this SAP and will be addressed in the Field Sampling Plan for Soil Sampling (HGL, 2010a).
5.1.1 Definition of Gamma Radiation Anomaly
A GRAY is a measurement or set of measurements that indicate the presence of gamma radiation greater than natural background radiation levels which can vary depending on numerous factors including the following:
• Soil composition (within a geological formation); • Soil density and moisture content; • Weather conditions; • Presence of above ground physical features (buildings, asphalt, rock outcrops, etc.); • Presence of below ground physical features (rocks, buried materials, etc.); • Instrument noise and construction materials; and • Cosmic radiation.
A baseline gamma background threshold value (GBTV) is required to differentiate between natural background and a GRAY. The GBTV will be determined based on statistical analyses of the background data sets obtained from measurements collected at each RBRA. The GBTV may require adjustment depending on the influence from natural background sources as listed above. Data analysis techniques are available to adjust a GBTV based on changes in background; i.e., time graphs, graphical representations of the measurements, statistical analyses, etc. Each data set will be carefully evaluated to determine the proper GBTV has been applied. The proposed approach for calculating the GBTV or distinguishing a GRAY from natural background cannot be identified before measurements are collected. Therefore, after RBRA data has been evaluated, the USEPA will present the proposed approach and data results to the SSFL Radiological Study Technical Workgroup for consideration. Likewise, after collection of gamma radiation scanning data in the Study Area, the proposed approach of identifying

HGL—Final Gamma Radiation Sampling and Analysis Plan, SSFL—Ventura County, California
U. S. EPA Region 9 Gamma Scanning SAP 5-2 HydroGeoLogic, Inc. 2/22/2010
GRAYs will be presented for consideration at a regularly scheduled SSFL Radiological Study Technical Workgroup Meeting.
5.1.2 Identification of a Gamma Radiation Anomaly
The identification of a GRAY will be a stepwise approach as follows:
• Step 1: Gamma radiation scanning measurements will be collected and potential GRAYs will be identified during data collection. For example, a technician may notice a large increase in the gamma radiation count rate that clearly indicates a potential GRAY.
• Step 2: Gamma radiation measurements will be reviewed and evaluated to identify additional potential GRAYs. For example, spatial analysis of the data set through detailed mapping may indicate gamma radiation measurements in a small area greater than the surrounding areas; this would be a potential GRAY.
• Step 3: Potential GRAYs will be evaluated with consideration for natural changes in background from adjacent structures, rock formations, variable terrain, soil variation (density, composition, etc.), and other site obstacles and features in the determination if a potential GRAY warrants verification. For example, the elevated measurements of a potential GRAY near a rock formation may be determined to have occurred from a naturally occurring uranium deposit; thus, the potential GRAY would not require verification.
• Step 4: Each potential GRAY will be verified to determine if it can be documented as a GRAY. Verification techniques could consists of any or all of the of the following: o Reproduce gamma radiation measurements using the same detection system o Collection of additional measurements using a different technology o Statistical analyses of the data set, if necessary o Spatial analyses of the data set o Modeling the GRAY with MicroShield or similar modeling software program
For example, the use of mapping techniques to identify a potential GRAY may be indeterminate. The data set may then be analyzed by various statistical methods, which may or may not assist the data reviewer with a final decision. In this case, the data reviewer may request collection of additional measurements to confirm the presence of a GRAY.
The contamination characteristics are another important factor to identifying a GRAY. A GRAY can be a very small, discrete location, such as a point source, or a larger, dispersed area of elevated gamma radiation measurements. Neither the natural background or contamination characteristics are within the control of this project. Thus, various verification techniques as listed above will be used on a case by case basis to determine if a potential GRAY represents anomalously elevated gamma radiation. Ultimately, professional judgment combined these verification techniques will be used to identify a GRAY. The data and decision-making process for verification of a GRAY will be documented. Soil sampling and analysis is the final arbiter that a GRAY represents site related contamination; this

HGL—Final Gamma Radiation Sampling and Analysis Plan, SSFL—Ventura County, California
U. S. EPA Region 9 Gamma Scanning SAP 5-3 HydroGeoLogic, Inc. 2/22/2010
determination is beyond the scope of this SAP and will be discussed in the Field Sampling Plan for Soil Sampling (HGL, 2010a).
5.2 GAMMA RADIATION SCANNING STRATEGY
The gamma radiation scanning survey will be initiated in Area IV. Surveys in the NBZ will be conducted upon completion of the Area IV gamma radiation scanning survey or when staff and equipment are not allocated to efforts in Area IV. All detector systems will be operated in accordance with the manufacturer’s requirements and recommendations. Project specific procedures will be developed and included as SOPs. These SOPs will be submitted as Addenda to this SAP in Appendix C. This section provides an overview of the expected scanning procedure. The nominal detector height above the ground surface is dependent on the detection system and will be measured from the ground surface to the bottom of the detector (not the structure surrounding the detector, but the actual NaI crystal). The detector height may require adjustment based on sensitivity testing to maximize the detection capability and the field of view (FOV) of each system. In addition, the height of a detector may be adjusted as necessary due to vegetation trimming restrictions or while scanning over an immobile obstacle; e.g., boulders that protrude from the ground surface. As detector height above the ground surface increases, detector sensitivity can decrease. This is a tradeoff between not scanning an area with obstructions versus scanning the area at a lower sensitivity. Priority will be given to the collection of data over as much of the Study Area as possible and practicable with the highest sensitivity (see Section 5.3 and 5.4 for additional discussion). The scan rate for each detection system will be initially set at within the range of 6- to 18-inches per second and will be adjusted based on sensitivity test results as discussed in Section 6.0. The overall approach to conducting a 100 percent surface gamma radiation scanning survey is to divide the Study Area into Survey Areas based on accessibility for the various detection systems. The Survey Areas are not the same as Multi-Agency Radiation Survey and Site Investigation Manual (MARSSIM) survey units which are based on different classification criteria. The most sensitive detection system will be used in each Survey Area as possible and practicable. In general, the Survey Areas will be categorized by three surface attributes: slope gradient, surface type, and vegetation height as summarized in Table 5.1.

HGL—Final Gamma Radiation Sampling and Analysis Plan, SSFL—Ventura County, California
U. S. EPA Region 9 Gamma Scanning SAP 5-4 HydroGeoLogic, Inc. 2/22/2010
Table 5.1 Surface Attributes
ATTRIBUTE DESCRIPTION DETECTOR SYSTEM ACCESSIBILITY
Slope Gradient
Mild (G1) Less than 25 percent grade ERGS II, MMGS, WMGS, and HHGS
Moderate (G2) Greater than 25 percent and less than 40 percent grade
MMGS, potentially WMGS, and HHGS
Steep (G3) Greater than 40 percent grade HHGS with fall protection Surface Type
Smooth (S1) Less than 20 percent change in detector height and geometry
ERGS II, MMGS, WMGS, and HHGS
Rough (S2)
Potential for greater than 20 percent change in detector height and geometry for wheeled vehicles
MMGS and HHGS
Rugged (S3) Inaccessible by wheeled vehicles Potentially MMGS and HHGS
Vegetation Height1
Low (V1) Less than 6-inch height ERGS II, MMGS, WMGS, and HHGS
Medium (V2) Greater than 6-inches and less than 12-inches
ERGS II, MMGS, WMGS, and HHGS
High (V3) Greater than 12-inches ERGS II, potentially MMGS, potentially WMGS, and potentially HHGS
Note: 1. Flexible vegetation may be trimmed to a height greater than 6-inches if the detector system can pass over it with minimal damage.
Survey Areas will be categorized by a combination of one surface attribute from each category in Table 5.1. There are 27 possible combinations of the nine surface attributes plus a category representing inaccessible locations as described in Section 5.3 and a category for limited access locations as described in Section 5.4. A survey team will map the Study Area based on each surface attribute category independently. When the three surface attribute maps are combined, Survey Areas will be categorized into one of the 29 categories as summarized in Table 5.2. Therefore, up to 29 Survey Areas will be identified, each with a different Survey Area category number.

HGL—Final Gamma Radiation Sampling and Analysis Plan, SSFL—Ventura County, California
U. S. EPA Region 9 Gamma Scanning SAP 5-5 HydroGeoLogic, Inc. 2/22/2010
Table 5.2 Survey Area Categories
SA Category Number
Surface Attributes
Detector System Prioritization (Listed in Order of Priority)
C111 G1, S1, V1 ERGS II, MMGS, WMGS, and HHGS C112 G1, S1, V2 ERGS II, MMGS, WMGS, and HHGS C113 G1, S1, V3 ERGS II, potentially MMGS, potentially WMGS, and potentially HHGS C121 G1, S2, V1 MMGS and HHGS C122 G1, S2, V2 MMGS and HHGS C123 G1, S2, V3 potentially MMGS and potentially HHGS C131 G1, S3, V1 MMGS and HHGS C132 G1, S3, V2 MMGS and HHGS C133 G1, S3, V3 potentially MMGS and potentially HHGS C211 G2, S1, V1 MMGS, potentially WMGS, and HHGS C212 G2, S1, V2 MMGS, potentially WMGS, and HHGS C213 G2, S1, V3 potentially MMGS, potentially WMGS, and potentially HHGS C221 G2, S2, V1 MMGS and HHGS C222 G2, S2, V2 MMGS and HHGS C223 G2, S2, V3 potentially MMGS and potentially HHGS C231 G2, S3, V1 MMGS and HHGS C232 G2, S3, V2 MMGS and HHGS C233 G2, S3, V3 potentially MMGS and potentially HHGS C311 G3, S1, V1 HHGS C312 G3, S1, V2 HHGS C313 G3, S1, V3 potentially HHGS C321 G3, S2, V1 HHGS C322 G3, S2, V2 HHGS C323 G3, S2, V3 potentially HHGS C331 G3, S3, V1 HHGS C332 G3, S3, V2 HHGS C333 G3, S3, V3 potentially HHGS CLA Variable ERGS II, MMGS, WMGS, and HHGS CIX Not Applicable None
Notes: CLA – limited access CIX - inaccessible
Within each Survey Area, the most sensitive detection system will be selected to conduct the gamma radiation scanning survey. If the most sensitive detection system is not capable or practicable for a portion of the Survey Area, then the next less sensitive detection system will be selected. Locations with site features that limit access to the surface soil will be documented as “Limited Access”. If no detection system is capable of surveying a portion of the Survey Area, it will be documented as “Inaccessible”. The information presented in Tables 5.1 and 5.2 will be field validated by testing each applicable detection system in the 28 different Survey Areas (not including the inaccessible category) and revised as necessary. For example, the Slope Gradient surface attribute may be adjusted based on field validation tests to accommodate the maximum gradient the ERGS II can safely access.

HGL—Final Gamma Radiation Sampling and Analysis Plan, SSFL—Ventura County, California
U. S. EPA Region 9 Gamma Scanning SAP 5-6 HydroGeoLogic, Inc. 2/22/2010
After the Study Area has been divided into Survey Areas based on the 29 categories, smaller Sub-Survey Areas (SSA) will be established based on roughly the area that can be scanned in half a work day, depending on the selected detection system. A survey crew will mark the boundaries of a SSA and demarcate scanning lanes with biodegradable chalk, highly visible string, flags, or other appropriate method. The width of the scanning lanes will be based on the FOV of the selected detector. The lane width will be set at less than the width of the FOV for the respective detection system; i.e., if the ERGS II detector system has a 4-foot wide FOV the scanning lane will be set at approximately 3-feet 6-inches wide. This will allow for overlapping measurements between scanning lanes to ensure 100 percent coverage; e.g., similar to how grass is mowed by overlapping each pass to ensure strips of uncut grass do not remain. Upon completion of a scanning lane, the next adjacent lane is scanned until all the lanes within the SSA are completed. The data will be evaluated within each SSA and in conjunction with adjacent SSAs to determine the presence of GRAYs as described in Section 5.1. This process will continue until 100 percent of accessible areas of the Study Area have been scanned and the data evaluated. The scanning speed of the detector systems is critical to the detector sensitivity. Since all measurements will have an associated GPS location with a time stamp, the scan speed can be mathematically verified by comparing one GPS location to the next. Operators of the detection system will also use visual aids and stopwatches to verify their scanning speed; e.g., place a yard stick on the ground and time the duration to scan the entire length.
5.3 INACCESSIBLE LOCATIONS
Although a primary objective of the gamma radiation scanning in the Study Area is to cover 100 percent of the ground surface, there are locations without access by any of the detection systems. Inaccessible locations will not be altered to gain access to the surface soil beneath certain features such as the following:
• Existing structures; i.e., buildings, sheds, etc.; • Immobile equipment; i.e., surface pipes, very heavy equipment, etc.; • Restricted access areas; i.e., Radioactive Material Handling Facility and Hazardous
Waste Management Facility, soil pile waiting for disposal, etc.; and • Dangerous areas; i.e., unstable boulders and slopes, unstable soil conditions, steep
faces of rock outcrops, etc. There are numerous structures in Area IV but none in the NBZ. However, NPDES discharge outfalls are located in the NBZ; any outfall features will not be disturbed by the gamma radiation scanning activities as discussed in Section 3.1. As it is not possible to scan underneath the features listed above, these locations will be documented as CIX in a final report so presumably a scanning survey can be conducted after the feature has been removed in the future.

HGL—Final Gamma Radiation Sampling and Analysis Plan, SSFL—Ventura County, California
U. S. EPA Region 9 Gamma Scanning SAP 5-7 HydroGeoLogic, Inc. 2/22/2010
Each SSA will be assessed for safety concerns by the project Site Safety and Health Officer and the Radiation Safety Officer. If the safety concerns can be mitigated to a safe level, scanning will be allowed; else, the area will be categorized CIX. Areas that may be deemed as dangerous are very steep terrain or unstable ground surfaces. All dangerous areas will be documented accordingly in the final report for future reference.
5.4 LIMITED ACCESS LOCATIONS
Some areas in the Study Area will have limited access due to various restrictions. Features restricting access or that reduce the sensitivity of the selected detector system will be considered limited access areas. Potential limited access areas include:
• Vegetation that exceeds the scanning height of the detectors; • Hard surfaces such as asphalt or concrete which attenuate gamma radiation from the
underlying surface soil; • Fencing; • Above ground pipes and; • Other features.
The following locations will be surveyed with limited sensitivity due to the shielding nature of the obstacle and will not be altered to gain access to the surface soil beneath the feature:
• Concrete surfaces; • Asphalt surfaces; and • Other features.
These locations will be documented as CLA for future investigation after the feature is removed from the site.
5.5 CORRELATION OF FIELD MEASUREMENTS AND LABORATORY DATA RESULTS
Gamma radiation measurements will be compared with laboratory analytical results to determine if a correlation can be determined. Correlation of field measurements and sample results in picocuries per gram is complex and requires careful planning. An acceptable correlation can assist in reducing the number of soil samples collected for laboratory analyses, which optimizes analytical costs while providing real-time data to focus characterization efforts for both gamma radiation measurements and soil sampling and analysis. The procedures and considerations for developing correlations will be addressed in a SOP or in a separate plan if USEPA proposes to conduct such data analyses. If a SOP is developed it will be submitted as Addenda to this SAP in Appendix C.
5.6 EQUIPMENT DECONTAMINATION
Decontamination will be conducted when equipment comes in contact with soil in a potential or confirmed GRAY or in areas where poison oak is encountered. Any equipment or parts of equipment, such as the wheels on detector transportation mechanisms, will undergo

HGL—Final Gamma Radiation Sampling and Analysis Plan, SSFL—Ventura County, California
U. S. EPA Region 9 Gamma Scanning SAP 5-8 HydroGeoLogic, Inc. 2/22/2010
decontamination before exiting the Study Area to prevent migration of potential contamination (radiological or poison oak oil). A designated decontamination area will be established and managed as described in the SMP. Decontamination fluids will be managed as investigation-derived waste in accordance with the SMP.

HGL—Final Gamma Radiation Sampling and Analysis Plan, SSFL—Ventura County, California
U. S. EPA Region 9 Gamma Scanning SAP 6-1 HydroGeoLogic, Inc. 2/22/2010
6.0 SENSITIVITY TESTING This section outlines the proposed tests to be conducted to determine the sensitivity of each detection system. Sensitivity is comparable to a detection limit. However, determining the sensitivity or detection limit of a portable detection system in the field is more complicated than in laboratory setting as there are many more variables to consider. These variables are discussed in this section.
6.1 BACKGROUND DETERMINATION
Sensitivity of the various detection systems is largely dependent on gamma radiation background levels (see Sections 6.3.3 for further explanation of background). A background data set will be obtained for each detection system at the locations of the Radiological Background Study RBRAs (Figure 6.1). The Lang Ranch RBRA will be used for the Chatsworth geological formation while the Bridal Path RBRA will be used for the Santa Susana geological formation. The Rocky Peak RBRA, a Chatsworth geological formation, will not be scanned due to access restrictions; the road is in poor condition and the ERGS II vehicle cannot drive the entire route. If possible, 100 percent of each RBRA will be scanned in accordance with the scanning strategies in Section 5.0. If scanning of the entire RBRA is not permitted, the maximum area permitted will be scanned to obtain a representative background data set. If the RBRAs cannot be scanned, then an alternative plan will be developed in consultation with the SSFL Radiological Study Technical Workgroup. Once the background data sets for each geological formation have been determined, the GBTVs will be calculated using similar statistical techniques proposed for the SSFL Radiological Background Study (Singh, 2009) . In addition, an area with a statistically similar data set will be located on the SSFL, preferably in Area IV or near the on-site field office (location to be determined). This location will represent “background conditions” for the purposes of conducting operational and QC checks, determining background for new detectors, determining background for detectors after calibration or configuration changes, etc. The location will be called the site Field Quality Control Area and will be statistically comparable to the RBRA datasets.
6.2 SENSITIVITY TESTING
Validation of sensitivities is obtained by field testing. There are several validation methods and all involve deploying the gamma radiation detection system over a known radioactive sealed source (or sources) of radiation. Radioactive sources that simulate contaminated soil and/or discrete objects can be procured and placed in an area and surveyed. These radioactive sources are completely sealed and can be removed from the area without causing contamination. Results of this survey are then compared to modeled results. The radioactive sources can be designed to match the soil conditions and radioactive contaminants of concern at SSFL Area IV.

HGL—Final Gamma Radiation Sampling and Analysis Plan, SSFL—Ventura County, California
U. S. EPA Region 9 Gamma Scanning SAP 6-2 HydroGeoLogic, Inc. 2/22/2010
The sensitivity of each system for surface soil and subsurface soil will be determined for a set of common radionuclides; e.g., cesium-137 and cobalt-60. A subsurface soil sensitivity test will require installing a borehole at a 45 degree angle to a depth of 10 feet in Area IV at a location not suspected of subsurface contamination. A 12-foot long polyvinyl chloride pipe will be inserted into the borehole. National Institute of Standards and Technology (NIST) traceable gamma radiation emitting radioactive sources will then be inserted into the pipe at various depths. The detection system will collect a measurement over the pipe to measure the gamma radiation field. Since the source will have a known activity, the sensitivity of the detector can be calculated based on the measurements obtained at various depths. This procedure will generate a depth profile with sensitivity versus depths so the SSFL Radiological Study Technical Workgroup can understand the capabilities of each detector system. Alternatively, pre-constructed test pad, trenches, and boreholes can be used in the same manner. Several such features are available at Grand Junction Regional Airport in Grand Junction, Colorado; Grants, New Mexico; Casper, Wyoming; and George West, Texas. These will be evaluated for possible use for validation/calibration of each gamma radiation detection system.
6.2.1 Scanning Minimum Detectable Count Rate
The scanning minimum detectable count rate (MDCR) can be estimated by using the methodology in Section 6.7.2.1 of MARSSIM (USEPA, 2000a). MDCR estimates are based on nominal, anticipated values of background, instrument response (efficiency), other variables, and are intended for survey planning and design purposes only. MDCRs for specific instruments and background conditions will be determined on site after each detection system has been constructed, integrated, and tested. An example step-by-step calculation is provided as an illustration of the process of determining the MDCR for a 3-inch by 3-inch NaI scintillation detector. For a 3-inch by 3-inch NaI scintillation detector, the typical background count rate for surface soil is approximately 25,000 cpm. The size of the area of elevated activity (area of concern) is assumed at 2-feet in diameter and that the detector is moved across this area at a speed of 6-inches per second. The detector height is fixed at 6-inches above the ground surface; however, this variable is not used in the determination of the MDCR. Step 1: Determine the observation time The time the detector passes over the hypothetical area of elevated activity is called the observation interval which determined by the following equation: Equation 6.1
Whereas, i = observation interval in seconds
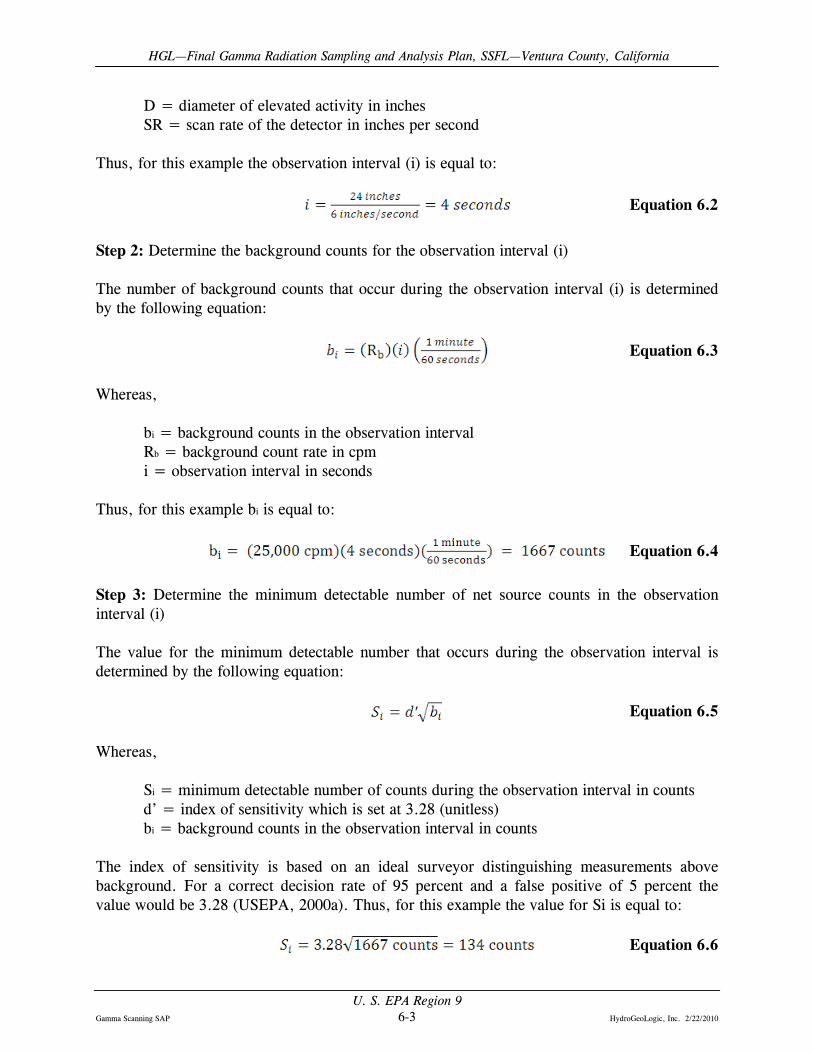
HGL—Final Gamma Radiation Sampling and Analysis Plan, SSFL—Ventura County, California
U. S. EPA Region 9 Gamma Scanning SAP 6-3 HydroGeoLogic, Inc. 2/22/2010
D = diameter of elevated activity in inches SR = scan rate of the detector in inches per second Thus, for this example the observation interval (i) is equal to:
Equation 6.2
Step 2: Determine the background counts for the observation interval (i) The number of background counts that occur during the observation interval (i) is determined by the following equation:
Equation 6.3
Whereas, bi = background counts in the observation interval Rb = background count rate in cpm i = observation interval in seconds Thus, for this example bi is equal to: Equation 6.4
Step 3: Determine the minimum detectable number of net source counts in the observation interval (i) The value for the minimum detectable number that occurs during the observation interval is determined by the following equation: Equation 6.5 Whereas, Si = minimum detectable number of counts during the observation interval in counts d’ = index of sensitivity which is set at 3.28 (unitless) bi = background counts in the observation interval in counts The index of sensitivity is based on an ideal surveyor distinguishing measurements above background. For a correct decision rate of 95 percent and a false positive of 5 percent the value would be 3.28 (USEPA, 2000a). Thus, for this example the value for Si is equal to: Equation 6.6

HGL—Final Gamma Radiation Sampling and Analysis Plan, SSFL—Ventura County, California
U. S. EPA Region 9 Gamma Scanning SAP 6-4 HydroGeoLogic, Inc. 2/22/2010
Step 4: Determine the MDCR The MDCR is calculated by the following equation: Equation 6.7
Whereas,
MDCR = minimum detectable count rate in cpm Si = minimum detectable number of net source counts in the observation
interval (i) in counts i = observation interval in seconds
Thus, for this example the MDCR equals:
Equation 6.8 Step 5: Determine the scan minimum detectable count rate for a surveyor (MDCRsurveyor) An ideal surveyor will observe measurements during scanning surveys and identify measurements above background flawlessly. However, this is not realistic and a surveyor will not perform at 100 percent efficiency. A correction for the surveyor’s efficiency (p) is warranted and typically ranges from 0.5 to 0.75. The following equation is used to determine the MDCR for the surveyor, thus named the MDCRsurveyor. Equation 6.9
Assuming a skilled surveyor conducts the survey, a value of 0.75 can be selected for the surveyor efficiency (p), thus, yielding a surveyor MDCR for this example as: Equation 6.10
For this example, if the background count rate on SSFL is 25,000 cpm for a 4-second observation interval and using an index of sensitivity of 3.28 (95 percent true positive rate and 5 percent false positive rate); the MDCR is 2,010 cpm net or 27,010 cpm gross with an MDCRsurveyor rate of 2,320 cpm net or 27,320 cpm gross. Therefore, then the surveyor observes a measurement of 27,320 cpm or greater the location is marked for further investigation. The MDCRsurveyor is used only in situations when a surveyor observes and interprets the detector signal (measurements) to determine the location of areas of elevated activity while
HGL—Final Gamma Radiation Sampling and Analysis Plan, SSFL—Ventura County, California
U. S. EPA Region 9 Gamma Scanning SAP 6-5 HydroGeoLogic, Inc. 2/22/2010
conducting a survey. If a survey is conducted by data logging measurements, the MDCR value is used to determine the minimum detectable count rate since a more precise data analysis can be performed without surveyor error or inefficiency affecting the interpretation of the data.
6.2.2 Static Minimum Detectable Count Rate
The static MDCR is the radiation level that is practically measureable by the overall measurement process. The following equation is used to calculate instrument MDCRs in cpm when the background and sample are counted for the same time intervals.
B
BB
T
TCMDCR
65.43+= Equation 6.11
Where:
CB = background count rate (cpm) TB = background counting time (minute [min])
If the background and sample are counted for different time intervals, this equation is used to calculate the MDCR in cpm.
BS
B
BSBSB
TT
TTRMDCR
+
++
++
=
129.33 Equation 6.12
Where:
RB = background count rate (cpm) TB = background counting time (min) TS+B = sample counting time (min)
For the instruments to be used in this study, static MDCRs will be calculated based on applicable background count rates and count times. Upon completion of the sensitivity tests for all the detector systems, the USEPA will present the results at a regularly scheduled SSFL Radiological Study Technical Workgroup Meeting.
6.3 CONDITIONS AFFECTING DETECTOR SENSITIVITY
The following sections describe conditions that affect the sensitivity of a detection system. The conditions having the greatest impact on sensitivity vary from site to site—each study is unique. Calculational modeling can help understand the impacts of the conditions. Theoretical modeling of the gamma radiation fields is possible using the MicroShield or similar software program. This will be used to predict the response and sensitivity of the gamma radiation detection system. For example, the detector FOV can be examined by modeling various contaminated soil geometries. Depth of detection can also be evaluated by modeling

HGL—Final Gamma Radiation Sampling and Analysis Plan, SSFL—Ventura County, California
U. S. EPA Region 9 Gamma Scanning SAP 6-6 HydroGeoLogic, Inc. 2/22/2010
contamination at various depths. Finally, the effect of soil moisture on gamma radiation detection capability can be examined by modeling contaminated soil at various moisture levels and by conducting empirical field tests. Detection system response is evaluated at the various moisture levels.
6.3.1 Soil Moisture and Density
Increasing soil moisture content tends to decrease detection sensitivity. Moisture fills pore space in the soil and attenuates gamma radiation. Likewise, increasing soil density can result in a decrease or increase in sensitivity depending on the actual soil composition and radionuclides present. Both of these normal characteristics of soil influence detector sensitivity. Soil moisture and soil density can be measured with high accuracy with a field portable nuclear density gauge (NDG). A NDG contains two sealed radioactive sources, typically a cesium-137 and an americium-241:beryllium source. The radiation emitted from the NDG interacts with the soil to create a characteristic “signal” used to calculate soils moisture and density. The device does not release radioactive materials nor cause the soil to become contaminated. After any precipitation, the soil moisture in the SSAs scheduled for assessment will be measured. If moisture exceeds 15 percent (dry soil), then scanning will not be conducted in the respective SSA and it will continue to be tested on subsequent days until the criterion is met. Alternate SSAs may be tested for soil moisture compliance and scanned if the criterion is met. A soil moisture content of 15 percent or less is considered a dry soil. The gamma radiation measurements from soil will typically decrease as soil moisture increases with the exception of the presence of uranium-238. Due to radon emanation, which is also dependant on soil type, increasing or decreasing secular equilibrium conditions can cause gamma radiation measurements to increase or decrease with increasing soil moisture. Calculations have shown that gamma radiation measurements for areas with uranium do not increase until soil saturation reached over 60 percent. (Grasty, 1997) At that point, gamma radiation emitted from all other radionuclides of concern will be significantly attenuated. This 15 percent moisture content is the recommended maximum soil moisture for calibration of in situ gamma radiation detection systems (The Institute of Electrical and Electronic Engineers, Inc. [IEEE], 2004). The attenuation of gamma radiation is negligible at this moisture content. However, empirical field tests will be performed to determine the influence of soil moisture content. A GRAY with soil moisture of 15 percent will be selected for this test. When the soil moisture is less than and greater than 15 percent additional gamma radiation measurement will be collected. These measurements will be compared to the measurements collected at 15 percent soil moisture to determine the difference in gamma radiation flux. Results of this test will be reported to the SSFL Radiological Study Technical Workgroup.
6.3.2 Contaminant Characteristics
Contaminants can be discrete objects, encompass small areas, or encompass larger areas. The activity of contamination can vary widely from very low activities undetectable with field

HGL—Final Gamma Radiation Sampling and Analysis Plan, SSFL—Ventura County, California
U. S. EPA Region 9 Gamma Scanning SAP 6-7 HydroGeoLogic, Inc. 2/22/2010
instrumentation to very high activities easily detectable with field instrumentation. Contamination may be located on the surface, below surface at a single depth, below surface at multiple depths, or a combination of all distributions. The accurate detection of any radioactive contamination requires a priori knowledge of the contamination characteristics. Since contamination characteristics cannot be controlled by or known before this study has been completed, a conservative approach has been developed for identification of GRAYs.
6.3.3 Background
There are various sources of background radiation. Four basic source categories are summarized below:
• Terrestrial - Terrestrial sources are based on the composition of geological formations and gamma radiation is emitted from nearly all types of soil and rocks (and for all practical purposes includes the contribution from radioactive fallout, radon gas, etc.). Therefore, each of the two geological formations (RBRAs) will be measured for terrestrial background as described in Section 6.1.
• Cosmic - Cosmic radiation is fairly constant, does not change based on terrestrial influences, and for all practicable purposes is the same from one location to another within the Study Area or from day to day (small temporal changes are possible but rare).
• Objects - Virtually all objects emit some amount (sometimes minute, undetectable amounts with field instrumentation) of gamma radiation including concrete, asphalt, structures, vegetation, humans, animals, etc. depending on the exact composition of the object.
• Instruments - Instrument electronic noise and gamma radiation from construction materials make up the instrument background which remains very consistent regardless of location or temporal change. The combination of all these natural sources of gamma radiation is considered background.
As previously discussed, background gamma radiation count rates will factor into detection sensitivity. High background counts will tend to mask counts from ROCs. Conversely, lower background levels increase instrument sensitivity (or decreases the detection limit). The affects of background cannot be completely controlled by this study. However, the use of gamma radiation shielding for the detectors reduces cosmic radiation and influences from objects as well as terrestrial sources not within the detector FOV; i.e., soil contaminated with elevated radioactivity. Thus, to the extent possible all detectors will be shielded; see Section 4.0 for proposed shielding of each detector system. Terrestrial background can change widely from one geological formation to another as well as within the same geological formation. The RBRAs were selected during the Radiological Background Study as representative of the SSFL geological formations while meeting the requirements of a MARSSIM reference area. Heterogeneity within each geological formation can cause identification of a false GRAY. However, as described in Section 5.1, certain

HGL—Final Gamma Radiation Sampling and Analysis Plan, SSFL—Ventura County, California
U. S. EPA Region 9 Gamma Scanning SAP 6-8 HydroGeoLogic, Inc. 2/22/2010
investigation techniques can be employed to reduce this occurrence. As previously stated, soil sampling and analysis will be the final arbiter that a GRAY is due to site-related contamination.
6.3.4 Scanning Rate and Detector Height
The speed the detection system moves over the surface of interest is the scanning rate. Slower rates increase sensitivity when detecting a point source or small areas of contamination (commonly called a “hotspot”), but does not affect detection of a large planar source. A point source is defined as an area less than the detector FOV, whereas a planar source is defined as an area larger than the detector FOV. Scanning rate based on point sources results in a more conservative rate. There is a practical limit to scanning rate. If the rate is too slow, the entire study area cannot be scanned in the allotted time and budget and may only improve sensitivity by a small margin; i.e., there is a diminishing return with slower scanning rates. The scan rate will be set as slow as possible, allowing for the need to cover the large study area. USEPA proposes an initial scanning rate of approximately 6 inches per second, which may be adjusted based on sensitivity test of the detection systems, project schedule, and practicality. The scanning rate most likely will fall within the range of 6- to 18-inches per second. Detector height affects detector sensitivity. There is an optimal detector height influenced by the detector FOV. The FOV is defined as the area of the source in which 90 percent of gamma radiation is detected (IEEE, 2004). If a detector is placed on contact with a surface, the detector height is zero and the sensitivity will likely be near optimal. As the detector is raised above the surface, the sensitivity typically decreases as the FOV increases. However, at some height above the surface, the sensitivity may increase due to detection of radiation emitted from more surface mass. There needs to be a balance between the optimal sensitivity/FOV and the number of scanning passes required for a given FOV. The detection systems described in Section 4.0 have shielded detectors that reduce the FOV but increase the sensitivity by reducing background. Theoretical modeling and field testing will be used to optimize the detector height and sensitivity, using actual field conditions (shield geometry, soil density, scanning rate, etc.).
6.3.5 Meteorological Conditions
Barometric pressure, ambient temperature, humidity, atmospheric stability class, wind speed and wind direction can affect radiation measurements. For example, natural radon-222 emanating from surface soil is highly dependent on barometric pressure. Meteorological data will be tracked on a daily basis.

HGL—Final Gamma Radiation Sampling and Analysis Plan, SSFL—Ventura County, California
U. S. EPA Region 9 Gamma Scanning SAP 7-1 HydroGeoLogic, Inc. 2/22/2010
PART 2: QUALITY ASSURANCE PROJECT PLAN
7.0 QUALITY ASSURANCE AND QUALITY CONTROL REQUIREMENTS
Quality Assurance (QA)/QC requirements are designed to identify and implement data collection and analytical methodologies which limit error into data. This site-specific QAPP was developed in accordance with the USEPA guidance documents Guidance for Developing Quality Systems for Environmental Programs (EPA QA/G-1) (USEPA, 2002a), and Guidance for Quality Assurance Project Plans (EPA QA/G-5) (USEPA, 2002b) will be followed for this project. All field data collection activities will be conducted in accordance with the procedures detailed in this SAP, with oversight conducted by the project Field Supervisor. Data will be classified as screening level data without definitive confirmation. However, collocated surface soil samples may be collected for laboratory analysis which may provide a level of confirmation of gamma spectroscopy data; these samples will be collected in accordance with the Field Sampling Plan for Soil Sampling (HGL, 2010a),.
7.1 FIELD QUALITY CONTROL
Field QC is centered on procedures, checks and controls. Radiological instruments will be factory calibrated before first use. Daily calibration checks for all instruments will be performed and documented on project QC forms in accordance with the applicable instrument operating procedure. Additional operational checks will be conducted if an instrument is suspected of malfunction during data collection, is suspected as damaged, or critical data acquisition procedures require more frequent checks. QC limits will be determined during the initial setup and tuning of each detector system at the SSFL in accordance with the respective instrument operating procedure. New QC limits will be established after subsequent calibrations and significant repairs which may have affected detector performance. A lower control limit and an upper control limit will be determined for each detector system at a two or three sigma tolerance level. The tolerance level will be selected based on the data quality requirements and the particular instrument. Control charts to monitor each detector system’s performance will be maintained. Calibration checks will ensure that the instruments are functioning within the project’s acceptable QC tolerances. All instrument checks will be documented and the Project Manager or designee will review them daily. Field QC Documentation will be retained on site in project files. Each operational check will consist of a background and source check set at a fixed and consistent geometry. The source check involves exposing the detection system to a known radioactive sealed source (for example, 10 microcuries of cesium-137) of specific activity for a predetermined duration (typically one minute). These sealed sources will be exempt activities not requiring a radioactive materials license. If either or both of the QC checks fail, the operational check procedure will be repeated. After three failures, the instrument will be taken

HGL—Final Gamma Radiation Sampling and Analysis Plan, SSFL—Ventura County, California
U. S. EPA Region 9 Gamma Scanning SAP 7-2 HydroGeoLogic, Inc. 2/22/2010
out of service until the cause of the failure is determined and corrected. Upon resolution, the instrument must pass the operational checks and QC limits before returned to service.
7.2 INSTRUMENT/EQUIPMENT TESTING, INSPECTION, AND MAINTENANCE REQUIREMENTS
All instruments and equipment used during scanning will be serviced and maintained only by qualified personnel in accordance with the manufacturer's guidelines and recommendations. Routine equipment maintenance and calibration will be summarized in the QAPP. All equipment maintenance will be recorded in project field logbooks. Instruments will be operated by the project team according to the manufacturers’ instructions. Each radiological instrument will receive a unique identification code to allow easy tracking of equipment and to associate data with the appropriate instrument. This tracking system allows data reviewers to identify instruments that may have malfunctioned, track trends in data which may indicate slow degradation of the detection system, and other adverse conditions affecting data quality.
7.3 INSTRUMENT CALIBRATION AND FREQUENCY
All detection systems will be calibrated in accordance with the manufacturer’s specifications or annually. The detector systems will be calibrated if it fails a performance check or after repairs potentially affecting its response. Calibration will be performed by either the manufacturer, qualified vendor, or the project team following the manufacturer’s calibration specification and procedures in accordance with American National Standard, Radiation Protection Instrumentation Test and Calibration, Portable Survey Instruments, N323A-1997 (IEEE, 1997) and American National Standard for Calibration of Germanium Detectors for In-Situ Gamma-Ray Measurements, N42.28-2002 (IEEE, 2004), if possible and applicable. Calibration sources will be traceable to the NIST. If NIST standards are not available, industry recognized standards will be used. The RSI detectors are factory calibrated before delivery of the system. The system has an auto calibration feature to stabilize the detector along with self-diagnostic software to check the health of the system. The system does not require annual calibration unless a major system failure occurs which cannot be repaired in the field by project staff or RSI engineers, in which case the system will be sent to RSI for repair and recalibration.
7.4 DATA ACQUISITION REQUIREMENTS
All field measurements will be data logged and stored within the detector system’s data management module; i.e., laptop computer or data logger. Data will be downloaded on a daily basis and checked for completeness. Data gaps or lost data will be noted for recollection at an appropriate time; likely within the following days after discovery. Data obtained during the gamma radiation scanning effort will be used to characterize the presence of GRAYs over the accessible areas of the Study Area, which may assist to determine

HGL—Final Gamma Radiation Sampling and Analysis Plan, SSFL—Ventura County, California
U. S. EPA Region 9 Gamma Scanning SAP 7-3 HydroGeoLogic, Inc. 2/22/2010
optimal locations for surface and subsurface soil samples to be collected for off-site laboratory analysis in accordance with the Field Sampling Plan for Soil Sampling (HGL, 2010a). Gamma radiation measurement data will be collected in electronic format. The data will be reviewed and summarized by the project team in periodic reports and a final report to the USEPA. The interim data will also be presented to the SSFL Radiological Study Technical Workgroup on an on-going basis at regularly scheduled workgroup meetings. Data summary forms will be provided to the USEPA as an appendix to the final report, or earlier upon request. The collected radiological data will be coupled with DGPS and Geographical Information System data producing a coded map of radiation levels across the Study Area. Details regarding the data management protocols for the SSFL site will be provided in the SMP.

This page was intentionally left blank.

HGL—Final Gamma Radiation Sampling and Analysis Plan, SSFL—Ventura County, California
U. S. EPA Region 9 Gamma Scanning SAP 8-1 HydroGeoLogic, Inc. 2/22/2010
8.0 DATA QUALITY OBJECTIVES The DQO process, as set forth in the USEPA guidance document Guidance on Systematic Planning Using the Data Quality Objectives Process (EPA QA/G-4), was followed to establish the DQOs for the gamma radiation measurement collection effort (USEPA, 2006). The DQO steps and the outputs are discussed below.
8.1 STEP 1: STATE THE PROBLEM
Radiological surface soil contamination at the Study Area at the SSFL is not fully characterized. Data gaps remaining from previous investigations indicate the necessity for additional characterization. In addition, the DOE committed to the public and the SSFL Radiological Study Technical Workgroup that 100 percent of accessible areas in the Study Area would be scanned for gamma radiation.
Describe the Problem
The planning team is the SSFL Radiological Study Technical Workgroup, which consists of the following members:
Establish the Planning Team
• USEPA and contractors; • DOE and contractors; • NASA and contractors; • Boeing and contractors; • California Department of Toxic Substances Control and contractors; and • community members and organizations.
Past operations in Area IV of the SSFL site have resulted in radionuclide and chemical contamination of environmental media. These operations ranged from experimental nuclear reactors to waste disposal. Those operations have now ended, but some site related contamination remains which may be located on the surface or in the subsurface. A primary concern is migration of the contamination to a receptor, or population of receptors, that can be harmed by exposure.
Describe the Conceptual Model of the Potential Hazard
Highly sensitive commercially available gamma radiation detectors will be obtained and trained staff will operate the gamma radiation detector systems; the detectors for the ERGS II were purchased before completion of this SAP. Funds will be allocated to complete the scope of work outlined in this SAP. The study is estimated to take approximately 6 to 12 months to complete. Currently, the project schedule requires completion of all gamma radiation scanning surveys by February 2011.
Identify Available Resources, Budget, Personnel, and Schedule
8.2 STEP 2: IDENTIFY THE GOALS OF THE STUDY
Identify Principal Study Question
HGL—Final Gamma Radiation Sampling and Analysis Plan, SSFL—Ventura County, California
U. S. EPA Region 9 Gamma Scanning SAP 8-2 HydroGeoLogic, Inc. 2/22/2010
Are there GRAYs in the Study Area?
If a GRAY is identified, then further investigations may be conducted such as soil sampling for geological composition analysis or for radiochemical analysis in accordance with the Field Sampling Plan for Soil Sampling (HGL, 2010a), or
Alternative Actions that Could Result from the Resolution of the Study Questions
If a GRAY is not identified, then no additional gamma radiation measurements will be collected; however, soil sampling and analysis may be conducted as described in the Field Sampling Plan for Soil Sampling (HGL, 2010a).
Determine the location of GRAYs in the Study Area. Decision Statement
8.3 STEP 3: IDENTIFY INFORMATION INPUTS
• Spatial location of gamma radiation measurements from surface soil within the RBRAs and the Study Area.
Information Required to Resolve the Decision Statement
• Background gamma radiation measurements from surface soil within the RBRAs. • Gamma radiation measurements from surface soil within the Study Area.
Information sources are data and documentation generated during the collection of gamma radiation measurements of surface soil at the RBRAs and in the Study Area.
Identify Sources of Information
Investigation levels are variable and based on a combination of techniques to determine the presence of a GRAY. These techniques involve one or more of the following:
Identify How the Investigation Level will be Determined
• Comparison of measurements to GBTVs for each RBRA. • Creating graphical maps of measurements using various modeling techniques; i.e.,
kriging, isopleths, etc. • Evaluation of naturally occurring radiation from soil, rock outcrops, buildings, the
cosmos, instrumentation, and other site features. • Comparison of gamma radiation measurements to laboratory analytical results for soil
samples, if a correlation is established. • Use of professional judgment.
Collection of physical media for laboratory analysis will not be performed to determine total gamma radiation levels. Field portable, real-time detection systems exist that can detect gamma radiation. The sensitivity of these detection systems are limited in their ability to distinguish
Identify Appropriate Sampling and Analysis Methods

HGL—Final Gamma Radiation Sampling and Analysis Plan, SSFL—Ventura County, California
U. S. EPA Region 9 Gamma Scanning SAP 8-3 HydroGeoLogic, Inc. 2/22/2010
radiation emitted from site related contamination resulting from past SSFL operations and natural background radiation (emitted from soil, rock outcrops, buildings, the cosmos, instrumentation, etc.). Generated data will be screening level quality. Methodologies for collection of data will be developed after the various gamma radiation scanning and measurement systems are developed and sensitivity tests completed and documented in SOPs. These SOPs will be submitted as Addenda to this SAP in Appendix C.
8.4 STEP 4: DEFINE THE BOUNDARIES OF THE STUDY
The population of interest consists of gamma radiation emitting radionuclides in surface soils, detectable by the scanning detection systems, summarized in Section 4.0, within data collection methodologies and limitations summarized in this SAP.
Specify the Target Population
The spatial boundaries of this Study are defined as surface soil located within the geographical boundaries of the Study Area consisting of Area IV and the NBZ. The depth of surface soil is indeterminate at this time. However, each proposed detection system will be tested to determine an estimated subsurface gamma radiation sensitivity profile. The spatial boundaries of the RBRAs are defined by the SSFL Radiological Background Study (HGL, 2009).
Specify Spatial and Temporal Boundaries and Other Practical Constraints
Site gamma radiation levels are not influenced by temporal constraints. Currently, the project schedule requires completion of all gamma radiation scanning surveys by February 2011. Current gamma radiation detection technology is limited in detection sensitivity. The detection limits of instruments are dependent on numerous variables, some of which are controllable (such as scanning rate) while others are not (such as soil density and background). Another practical constraint is the difficulty of working on steep and rough terrain present in the Study Area.
The area covered by a single gamma radiation measurement (i.e., FOV) is dependent on each gamma radiation detection system and will be determined during sensitivity testing.
Specify the Scale of Inference for Decision Making
8.5 STEP 5: DEVELOP THE ANALYTIC APPROACH
The investigation level is variable depending on natural background as described in Section 8.3.
Specify the Investigation Level for the Decision
Principal Study Question: Specify the Decision Rule
If gamma radiation measurements at a location indicate a GRAY, then the location will be considered for further investigations for site related contamination by soil sampling and analysis in accordance with the Field Sampling Plan for Soil Sampling (HGL, 2010a), or

HGL—Final Gamma Radiation Sampling and Analysis Plan, SSFL—Ventura County, California
U. S. EPA Region 9 Gamma Scanning SAP 8-4 HydroGeoLogic, Inc. 2/22/2010
If gamma radiation measurements at a location do not indicate a GRAY, then the location will require no further gamma radiation measurements; however, the location may be subject to additional soil sampling and analysis in accordance with the Field Sampling Plan for Soil Sampling (HGL, 2010a).
8.6 STEP 6: SPECIFY PERFORMANCE OR ACCEPTANCE CRITERIA
Gamma radiation measurements may vary significantly but the range is unknown. Determine the Possible Range of the Parameter of Interest:
Decision Statement: Decision Errors Type I and II Define Both Types of Decision Errors and Establish the True Nature for each Decision Error
Type I - Decide that a measurement location is not a GRAY when, in fact, it is a GRAY. Type II - Decide that a measurement location is a GRAY when, in fact, it is not a GRAY. The first decision error occurs when the investigation results are erroneously documented and reported as a location not meeting the requirements of a GRAY. This decision error could result from a measurement error (i.e., errors in field measurement collection and data processing, detector calibration errors, calculation errors, malfunction of instrument, improper detection system use, etc.), and/or from judgment errors (i.e., error in data interpretation, error in identifying natural conditions as the cause of measurements, etc.). The second decision error occurs when the investigation results are erroneously documented and reported as a location meeting the requirements of a GRAY. This decision error could result from measurement error (i.e. errors in field measurement collection and data processing, detector calibration errors, calculation errors, malfunction of instrument, improper detection system use, etc.), and/or from judgment errors (i.e., error in data interpretation, error in identifying natural conditions as the cause of measurements, etc.).
Decision Statement: Decision Errors Type I and II Consequences of the Decision Errors
Type I - This decision error could possibly result in an increase in risk to human health and the environment. Type II - This decision error could possibly result in unnecessary expenditures for further investigation and remediation.
Decision Error Type I: Establish which Decision Error has the More Severe Consequences near the Action Level
Decision error Type I has more severe consequences near the respective GBTV as people or the environment could be exposed to hazardous conditions potentially increasing risk to human health or the environment.
Decision Error Type I: Define the baseline condition

HGL—Final Gamma Radiation Sampling and Analysis Plan, SSFL—Ventura County, California
U. S. EPA Region 9 Gamma Scanning SAP 8-5 HydroGeoLogic, Inc. 2/22/2010
Ho= A measurement is documented as a GRAY and the location may require additional investigation.
Ha= A measurement is not documented as a GRAY and the location may not require additional investigation.
The Null Hypothesis is when a measurement is documented as a GRAY based on Section 5.1 and potentially requires additional investigation to determine the presence of site related contamination. A false positive decision error occurs when the Null Hypothesis is falsely rejected. In this case, a false positive occurs if the decision maker decides that a measurement is not a GRAY and does not require additional investigation, when in fact, it does. False positive decision errors will be reduced by the collection and analysis of soil samples as described in the Field Sampling Plan for Soil Sampling (HGL, 2010a) described under separate cover. A false negative occurs when the Null Hypothesis is falsely accepted. False negative decision errors will be reduced by careful review and analysis of field measurements with consideration for natural environmental conditions (e.g., terrain features, geological characteristics, naturally occurring radionuclides not attributable to the SSFL such as potassium-40, atmospheric conditions, etc.). Professional judgment will be used to determine if a false negative decision error has been made. Decision errors can occur when measurements are incorrectly acquired or interpreted. These occurrences are reduced by implementation of field operating procedures and data verification, validation and quality assessment. Ultimately, soils sampling and analysis will be the final arbiter of that a GRAY is site related contamination.
8.7 STEP 7: DEVELOP THE DETAILED PLAN FOR OBTAINING DATA
All data collection activities will be conducted in accordance with this SAP and subsequent USEPA-approved SOPs. The documents will be completed and approved prior to data collection. SOPs will be developed for each measurement system to guide field teams in the proper use and acquisition of data. These SOPs will be submitted as Addenda to this SAP in Appendix C.
This study is designed to surface soil GRAYs located in the Study Area on the SSFL. The conceptual sampling design is described in this SAP including the assumptions and limitations.
Sampling Design
This page was intentionally left blank.

HGL—Final Gamma Radiation Sampling and Analysis Plan, SSFL—Ventura County, California
U. S. EPA Region 9 Gamma Scanning SAP 9-1 HydroGeoLogic, Inc. 2/22/2010
9.0 DATA VERIFICATION, VALIDATION, AND QUALITY ASSESSMENT
Data verification, validation and quality assessment is an integral and important step to documenting data that has been collected in accordance with the QAPP/FSP and meets the requirements for the intended use. The assessment phase of the Data Life Cycle consists of three phases: data verification, data validation, and Data Quality Assessment (DQA). The USEPA document Guidance for Data Quality Assessment (EPA QA/G-9) will be followed for data verification, validation and quality assessment (USEPA, 2000b). In addition, MARSSIM provides additional guidance in Sections 8.0 and 9.0, and Appendix E (USEPA, 2000a). Assessment of data is used to evaluate whether the data meet the objectives of the survey and whether the data are sufficient to determine if a GRAY exists. Assessment of data quality is an ongoing activity throughout all phases of the Area IV Radiological Study. This section outlines the methods to be used for evaluating the results obtained from the project. Additional details will be included in subsequent SOPs to be submitted as Addenda to this SAP in Appendix C.
9.1 VERIFICATION AND VALIDATION
This section provides guidance on verifying and validating data collected to identify a GRAY.
9.1.1 Data Verification
Data verification ensures that the requirements stated in the planning documents; e.g., QAPP/FSP, and SOP are implemented as prescribed. Deficiencies or problems that occur during implementation will be documented and reported to management. Corrective actions undertaken will be reviewed for adequacy and appropriateness and documented in response to the findings. Data verification activities will be planned and documented throughout the project. These assessments may include but are not limited to: inspections, QC checks, surveillance, technical reviews, performance evaluations, and audits.
9.1.2 Data Validation
Data validation activities ensure that the results of data collection activities support the objectives of the survey as documented in the QAPP/FSP, or support a determination that these objectives should be modified. Data usability is the process of ensuring or determining whether the quality of the data produced meets the intended use of the data. Data verification compares the collected data with the prescribed activities documented in the SOPs; data validation compares the collected data to the DQOs documented in the QAPP/FSP. Corrective actions may improve data quality and reduce uncertainty, and may eliminate the need to qualify or reject data. Data validation is often defined by six data descriptors:
1. Reports to decision maker; 2. Documentation; 3. Data sources;

HGL—Final Gamma Radiation Sampling and Analysis Plan, SSFL—Ventura County, California
U. S. EPA Region 9 Gamma Scanning SAP 9-2 HydroGeoLogic, Inc. 2/22/2010
4. Data collection method and detection limit; 5. Data review; and 6. Data quality indicators.
The reviewer will examine the data, documentation, and reports for each of the six data descriptors to determine if performance is within the limits specified in the DQOs developed during survey planning. The data validation process will be conducted according to procedures documented in the QAPP/FSP.
9.2 DATA QUALITY ASSESSMENT
The DQA process is a scientific and statistical evaluation to determine if collected data are the right type, quality, and quantity to support their intended use. The five steps in the DQA process are:
1. Review the DQOs and survey design; 2. Conduct a preliminary data review; 3. Conduct statistical tests, if applicable; 4. Verify the assumptions of the statistical tests, if applicable; and 5. Draw conclusions from the data.
These five steps are presented in a linear sequence, but the DQA process is iterative much like the DQO process. The DQA process is designed to promote an understanding of how well the data will meet their intended use by progressing in a logical and efficient manner.
9.2.1 Step 1: Review Data Quality Objectives and Survey Design
The first step in the DQA evaluation is a review of the DQO outputs to ensure that they are still applicable. The sampling design and data collection documentation will be reviewed for consistency with the DQOs. If data does not meet the DQOs, the measurement procedure will be reviewed and modified accordingly.
9.2.2 Step 2: Conduct Preliminary Data Review
A knowledgeable individual who is not involved in the direct data collection process will review the survey data on a daily basis. Since all data will be electronically logged, a detailed data evaluation will be available. It is anticipated that thousands of data points will be collected each day. The individual will review data frequently to determine the validity of the results and adequate coverage of the survey area. This will ensure an ongoing independent review for consistency of survey data collected. The reviewer activities can consist of the following:
• reviewing quality assurance reports; • calculating statistical quantities (e.g., mean, standard deviation, minimum, maximum,
relative standing, central tendency, dispersion, shape, and association) as required; and

HGL—Final Gamma Radiation Sampling and Analysis Plan, SSFL—Ventura County, California
U. S. EPA Region 9 Gamma Scanning SAP 9-3 HydroGeoLogic, Inc. 2/22/2010
• graphing and spatially displaying the data (e.g., kriging, contouring, radiological time graphs, histograms, scatter plots, confidence intervals, ranked data plots, quantile plots, stem-and-leaf diagrams, spatial or temporal plots) as required.
Additional statistical analyses may be used as appropriate with guidance from the project statistician.
9.2.3 Step 3: Conduct Statistical Tests
If statistical tests are used a statistician will be consulted to assist the project team with analysis of the data using robust and scientifically valid and accepted statistical tests. Since spatial locations will be available for all measurements, mapping and geostatistical methods (e.g., ordinary block kriging, indicator kriging, etc.) can be used to generate gamma radiation maps for contiguous regions in the Study Area. Radiation contour maps, as well as other spatial maps, can be used (instead of performing point-by-point comparisons) to identify areas exhibiting gamma radiation trends and areas that excess background threshold values; i.e., thus identifying a GRAY.
9.2.4 Step 4: Verify Assumptions of the Statistical Test
An evaluation to determine that the data are consistent with the any underlying statistical assumptions helps to validate the use of selected statistical tests, if applicable. It may be determined that certain departures from these assumptions are acceptable when given the actual data and other information about the study. The following activities are typically performed:
• Determining the approach for verifying the assumptions; • Performing tests of the assumptions; and • Determining corrective actions, if any.
9.2.5 Step 5: Draw Conclusions from the Data
After data has been verified, validation and reviewed in accordance with this section, the final results will be reviewed to determine the location and extent of GRAYs. The occurrence of GRAYs will assist in planning the surface and subsurface soil data collection activities for the Area IV Radiological Study. Modifications to the survey design will be implemented if necessary or appropriate.

This page was intentionally left blank.

HGL—Final Gamma Radiation Sampling and Analysis Plan, SSFL—Ventura County, California
U. S. EPA Region 9 Gamma Scanning SAP 10-1 HydroGeoLogic, Inc. 2/22/2010
10.0 REFERENCES Bechtel Nevada, 1999, A Radiological Characterization of the Kiwi-I Vehicle,
DOE/NV/11718-298, Remote Sensing Laboratory, Nellis Air Force Base, Las Vegas Nevada. March.
Bendix Field Engineering Corporation, 1981, EPA-02 Gamma Surface Scanning System,
BFEC-1981-7, Grand Junction, CO. September. Grasty, Robert L., 1997, Radon emanation and soil moisture effects on airborne gamma-ray
measurements, Geophysics, Vol. 62, No. 5, September-October 1997; P. 1379–1385, HydroGeoLogic, Inc. (HGL), 2009. Final Sampling and Analysis Plan, Radiological
Background Study, Santa Susana Field Laboratory, Ventura County, California. August.
HGL, 2010a. Draft, Field Sampling Plan, for Soil Sampling, Area IV Radiological Study,
Santa Susana Field Laboratory, Ventura County. HGL, 2010b. Draft, Field Sampling Plan, for Groundwater, Surface Water, and Sediment,
Area IV Radiological Study, Santa Susana Field Laboratory, Ventura County. The Institute of Electrical and Electronics Engineers, Inc. (IEEE), 2004. American National
Standard for Calibration of Germanium Detectors for In-Situ Gamma-Ray Measurements, ANSI N42.28-2002, New York, NY. February.
IEEE, 1997. American National Standard for Radiation Protection Instrumentation Test and
Calibration, Portable Survey Instruments, ANSI N323A-1997, New York, NY. April. Singh, A., 2009. Statistical Methods to Address Stakeholders’ Concerns and Statistical Issues
Described in Radiological background Study, Sampling and Analysis Plan for Santa Susana Field Laboratory. August.
U.S. Department of Energy, 2003. Environmental Assessment for Cleanup and Closure of the
Energy Technology Engineering Center, Final. Oakland, CA. March. U.S. Environmental Protection Agency, U.S. Department of Defense, U.S. Department of
Energy, and Nuclear Regulatory Commission, 2000a. Multi-Agency Radiation Survey and Site Investigation Manual. August.
USEPA, 2000b. Quality Guidance for Data Quality Assessment, Practical Methods for Data
Analysis, EPA/600/R-96/084. December. U.S. Environmental Protection Agency, (USEPA). 2002. Multi-Agency Radiological Survey
and Site Investigation Manual (MARSSIM), EPA 402-R-97-016. October.

HGL—Final Gamma Radiation Sampling and Analysis Plan, SSFL—Ventura County, California
U. S. EPA Region 9 Gamma Scanning SAP 10-2 HydroGeoLogic, Inc. 2/22/2010
USEPA, 2002a. Guidance for Developing Quality Systems for Environmental Programs, EPA/240/R-02/008, November.
USEPA, 2002b. Guidance for Quality Assurance Project Plans, EPA/240/R-02/009.
December. USEPA, 2005, EPA Radiation and Indoor Environments National Laboratory Scanner Van
Survey of the Yerington Mine Site and Surrounding Areas, Yerington, Nevada, April. USEPA, 2006, Guidance on Systematic Planning Using the Data Quality Objectives Process
(EPA QA/G-4), EPA/240/B-06/001. February.

FIGURES

NorthernBuffer Zone
AREA I
Southern Buffer Zone
AREA IIAREA IV
AREA III Legend
NorthernBuffer Zone
AREA I
Southern Buffer Zone
AREA IIAREA IV
AREA III
Figure 1.1Site Location
Santa Susana Field Laboratory
N
0 0.5 10.25
Miles
HGL—Gamma Radiation Sampling and Analysis Plan SSFL—Ventura County, California
Filepath: Y:/Santa_Susana/EP9038/SAP_01-2010/(01)SiteMap_Updated.mxdProject: EP9038Edited: CLimoges 20100219Source: USGS, Calabasas Quadrangle, 1967
U.S. EPA Region 9
Santa Susana Field LaboratoryProperty Boundary
Santa SusanaField Laboratory
0 150 30075
Scale In Miles

HGL—Gamma Radiation Sampling and Analysis Plan SSFL—Ventura County, California
AREA IV
NorthernBuffer Zone
NorthernBuffer Zone
Legend
AREA IV
NorthernBuffer Zone
NorthernBuffer Zone
Figure 1.2Study Area Map
Santa Susana Field Laboratory
0 1000 2000500
Scale In Feet
Filepath: Y:/Santa_Susana/EP9038/SAP_01-2010/Study_Area_Map_AreaIV.mxdProject: EP9038Edited: CLimoges 20100118Source: CaSil, NAIP 2005
U.S. EPA Region 9
Santa Susana Field LaboratoryArea IV Boundary
³
Northern BufferZone Boundary

Legend
Figure 4.1ERGS Surface Soil
Gamma Radiation SurveyAnaconda Mine Project
N
0 100 20050
Scale In Feet
HGL—Gamma Radiation Sampling and Analysis Plan SSFL—Ventura County, California
Filename: Y:/Santa_Susana/EP9038/SAP_01-2010/(4-1)_Sampling_Depiction.mxdProject: EP9038Created by: CLimoges 11/06/2009Revised: CLimoges 01/21/2010Source: URS Corporation, March 2007
U.S. EPA Region 9
ERGS Counts per Second
0-20,828
20,829 - 23,268
23,269 - 48,375

UV118
UV118
UV27
tu101
Thousand Oaks
Los Angeles
Calabasas
Agoura Hills
Westlake
Village
tu101
tu101
ChatsworthReservoir
BardReservoir
Simi Valley
SouthernBuffer Zone
AREA I
AREA II
AREA IV
AREA III
NorthernBuffer Zone
Rocky PeakLocation
Bridle PathLocation
Lang RanchLocation
Legend
UV118
UV118
UV27
tu101
Thousand Oaks
Los Angeles
Calabasas
Agoura Hills
Westlake
Village
tu101
tu101
ChatsworthReservoir
BardReservoir
Simi Valley
SouthernBuffer Zone
AREA I
AREA II
AREA IV
AREA III
NorthernBuffer Zone
Rocky PeakLocation
Bridle PathLocation
Lang RanchLocation
Figure 6.1Site and Radiological Background
Reference Area Location Map
N
0 1 20.5
Scale In Miles
Filepath: Y:/Santa_Susana/EP9038/SAP_01-2010/Study_Area_Map_AreaIV.mxdProject: EP9038Edited: CLimoges 20100118Source: CaSil, NAIP 2005
Geology
Santa Susana Field LaboratoryProperty Boundary
Surface Water
U.S. EPA Region 9
Chatsworth Formation
Santa Susana Formation
Radiological BackgroundReference Area Location
!!
HGL—Gamma Radiation Sampling and Analysis Plan SSFL—Ventura County, California

APPENDIX A
GAMMA RADIATION EMMITTING RADIONUCLIDES OF CONCERN POTENTIALLY DETECTABLE WITH PROJECT FIELD
RADIOLOGICAL INSTRUMENTATION

Table A-1 Gamma Emitting Radionuclides of Concern Potentially Detectable with Project Field
Radiological Instrumentation
U. S. EPA Region 9 Gamma Scanning SAP A-1 HydroGeoLogic, Inc. 2/22/2010
Radionuclide Half-life Gamma Photon Energy (keV)
Gamma Photon Abundance (%)
Actinium-227 (Ac-227) 21.772 years 236.0 11.2
265.3 6.8
Actinium-228 (Ac-228) 6.15 hours 338.4 12.01
911.1 29 968.9 17.46
Americium-241 (Am-241) 432.6 years 59.5 35.7
Antimony-125 (Sb-125) 2.7586 years
176.3 6.3 428.0 29.6 463.5 10 600.8 18.4 636.2 11.2
Barium-133 (Ba-133) 10.5 years
276.3 7.3
302.7 18.62
355.9 62.27 383.7 8.84
Bismuth-212 (Bi-212) 60.55 minutes 727.2 6.47 785.4 2 1620.6 2.75
Cadium-113m (Cd-113m) 14.1 years 236.7 0.0062
Californium-249 (Cf-249) 351 years 333.4 15.51 388.0 66
Cesium-134 (Cs-134) 2.0652 years
563.3 8.38 569.3 15.43 604.7 97.6 801.8 8.73
Cesium-137 (Cs-137) 30.08 years 661.6 84.62
Cobalt-60 (Co-60) 5.275 years 1173.2 99.86
1332.5 99.98
Europium-152 (Eu-152) 13.537 years
344.3 27 778.9 12.99 1112.1 13.58 1408.1 21.21
Europium-154 (Eu-154) 8.593 years
873.2 11.3 996.3 10.7
1004.8 17.6 1274.8 35.5
Europium-155 (Eu-155) 4.753 years 105.3 21.8
Holium-166m (Ho-166m) 1,230 years
184.4 73.9
280.5 29.7 410.9 11.3 711.7 55.9

Table A-1 (continued) Gamma Emitting Radionuclides of Concern Potentially Detectable with Project Field
Radiological Instrumentation
U. S. EPA Region 9 Gamma Scanning SAP A-2 HydroGeoLogic, Inc. 2/22/2010
Radionuclide Half-life Gamma Photon Energy (keV)
Gamma Photon Abundance (%)
Holium-166m (Ho-166m) (continued)
752.3 12.5
1,230 years 810.3 59.7
Lead-210 (Pb-210) 20.40 years 46.5 4
Lead-212 (Pb-212) 10.64 days 238.6 43.1 300.1 3.27
Nobium-94 (Nb-94) 20,400 years 702.5 100 871.1 100
Neptunium-236 (Np-236) 153,000 years 111.0 38.48
114.5 14.23 160.2 27.56
Neptunium-239 (Np-239) 2.256 days 228.2 10.72 277.6 14.1
Plutonium-238 (Pu-238) 87.7 years 13.6 17.1 20.3
5.17 4.17 1.15
Plutonium-239 (Pu-239) 24,110 years 13.0 18.0
Potassium-40 (K-40) 1,250,000,000
years 1460.8 10.7
Protactinium-231 (Pa-231) 32,760 years 283.7 1.6 300.1 2.3 302.7 2.3
Radium-226 (Ra-226) 1,600 years
295.2 19.2
352.0 37.1
609.3 46.09
1120.3 15.04 1764.5 15.92
Silver-108m (Ag-108m) 418 years 433.7 90 614.4 90
Sodium-22 (Na-22) 2.6027 years 511.0 179.8 1274.5 99.94
Tin-126 (Sn-126) 130,000 years 694.0 86
Thorium-234 (Th-234) 24.1 days 63.3 3.9 92.6 5.57
Thallium-208 (Tl-208) 30.53 minutes 277.4 6.5 583.1 86 860.5 12
Tullium-171 (Tm-171) 1.91 years 66.7 0.24
Uranium-235 (U-235) 704,000,000
years
143.8 163.4 205.3
0.105 0.047 0.047

HGL—Final Gamma Radiation Sampling and Analysis Plan, SSFL—Ventura County, California
U. S. EPA Region 9 Gamma Scanning SAP A-3 HydroGeoLogic, Inc. 2/22/2010
Not all the radionuclides summarized in Table A-1 are necessarily detectable under all conditions. There are many factors as discussed in the SAP influencing a detector system’s sensitivity to these radionuclides, most are due to natural conditions and not controllable. In addition, the activity and distribution of a particular or mixture of radionuclides can have a dramatic affect on distinguishing gamma radiation anomalies from the gamma radiation background threshold values. Technical comments regarding the SSFL Area IV Radiological Study gamma radiation library are limited to the list of gamma radiation emitting radionuclides included in Table A-1. Other combinations of radionuclides, equilibrium assumptions, and photo-peaks used for analysis may affect the validity of the comments in this bulletin. The values used in the creation of the library are taken from the National Nuclear Data Center Database, Brookhaven National Laboratory, via the Ortec Nuclide Navigator® software program, version 3.4. In cases where multiple gamma radiation emissions are used to quantify activity, the most abundant emission should be used for quantification in the absence of any supporting gamma radiation emissions. It is noted that the resolution and de-convolution of closely spaced photo-peaks is highly dependent on the gamma spectrometry software package. If the software program is limited by a specific photo-peak resolution tolerance, the use of this library may result in resolution interferences. Consequently, any gamma radiation emissions occurring within the photo-peak resolution range may suffer interference, thereby preventing accurate quantification. Typically, a minimum peak resolution tolerance of at least ±2 keV is available for conventional gamma spectrometry software for analytical laboratories. However, field portable gamma spectroscopy systems typically resolve at +3 keV thus increasing potential interference. Nuclide-specific information regarding analysis using the SSFL library is as follows. Not all radionuclides listed in Table A-1 require technical comments. Radionuclide: Actinium-227 Energy: various Photon Abundance: various Actinium-227 (227Ac) does not emit any gamma photons useful for quantification. However, it can be assumed to be in secular equilibrium with the short-lived 227Th daughter product. Therefore, the activity for 227Ac is determined from the 236.0 and 265.3 keV gamma emissions of 227Th using the half-life, t1/2=21.8 years, of the long-lived 227Ac parent. Radionuclides: Actinium-228, Radium-228 Energy: various Photon Abundance: various Activity values for Actinium-228 ( 228Ac), are calculated using the half-life, t1/2=5.75 years, of the long-lived Radium-228 (228Ra) parent. It is assumed that secular equilibrium is achieved

HGL—Final Gamma Radiation Sampling and Analysis Plan, SSFL—Ventura County, California
U. S. EPA Region 9 Gamma Scanning SAP A-4 HydroGeoLogic, Inc. 2/22/2010
between the 228Ra parent and the 228Ac progeny. If the requested analysis involves the quantification of both 228Ac and 228Ra, the reported results for each nuclide will be identical. The quantification will be obtained from the measurement of the observed 228Ac photo-peaks with energies of 338.40, 794.8, 911.07, 964.9, and 968.90 keV. In the attached library, only 228Ac is selected as an analyte of interest. The photo-peak energies and abundance values are not repeated for 228Ra, to prevent inappropriate “interference correction” algorithms from being incorrectly applied to the spectral data. If desired, 228Ra is reported via the clerical/administrative mechanism of simply duplicating the 228Ac results, and assigning them to the 288Ra parent radionuclide. Radionuclide: Americium-241 Energy: 59.5 Photon Abundance: 35.7 The quantification of americium-241 (241Am) by the 59.5 keV photopeak is subject to spectral interference from a low-abundance 59.3 keV photopeak emitted by 171Tm, which is also an analyte of interest in this project. Due to the low emission abundance from 171Tm at that energy and the relatively high emission abundance from 241Am, the effect of introducing a high bias to the 241Am result is not expected to be significant except in the presence of very high levels of 171Tm. Radionuclides: Silver-108m, Silver-108 Energy: various Photon Abundance: various
Silver-108m (108mAg) is included in the attached library, with photo-peak energies at 433.7 and 614.4 keV. Silver-108 (108Ag) is not included as a separate radionuclide in the library because it is assumed to be in a state of equilibrium with 108mAg, after accounting for the 9.3% branching ratio of 108Ag. While 108Ag may be analyzed directly by gamma spectrometry, the reduced photon emission abundance that results from the low branching ratio described above increases the uncertainty of the 108Ag direct measurement and the associated limits of detection. It is preferable, therefore, to report 108Ag activity via the clerical/administrative mechanism of calculating the product of the reported 108mAg activity and the 9.3% branching ratio for 108Ag, and reporting that value as the 108Ag result. Radionuclides: Bismuth-212, Lead-212, Thallium-208, Radon-220 Energy: various Photon Abundance: various All activity values for bismuth-212 (212Bi), lead-212 (212Pb), and thallium-208 (208Tl) are calculated using the half-life, t1/2=1.91 years, of the long-lived thorium-228 (228Th) parent. It is assumed that secular equilibrium is achieved between the 228Th parent and the 212Bi, and 212Pb progeny, as well as the 208Tl progeny, after consideration of the 35.9% branching ratio.

HGL—Final Gamma Radiation Sampling and Analysis Plan, SSFL—Ventura County, California
U. S. EPA Region 9 Gamma Scanning SAP A-5 HydroGeoLogic, Inc. 2/22/2010
In the attached library, radon-220 (220Rn) is not selected as an analyte of interest, as no useful gamma emissions are produced directly by 220Rn. If desired, 220Rn is reported via the clerical/administrative mechanism of calculating the average of the 212Bi and 212Pb results, and reporting that value as the 220Rn result.
Radionuclide: Cadmium-133m Energy: 236.7 Photon Abundance: 0.00006 Cadmium-133m (113mCd) suffers from potential interference from the 236.0 keV emission from 227Ac. The 236.7 keV photon emission, however, is the only useful gamma emission for quantification of 113mCd by routine gamma spectrometry, and that photo-peak has an extraordinarily low emission abundance. Consequently, even small amounts of 227Ac will cause a significant high bias in the reported 113mCd results. Even in the absence of measurable activity at the 236.7 keV emission energy, the reported Minimum Detectable Activity of 113mCd will be extraordinarily high. In the reporting of 113mCd analytical results, a technical review of the gamma spectrum should be performed by a qualified gamma spectroscopist. The presence of a 265.3 keV photo-peak, supporting the presence of 227Ac should cause the 113mCd results to be flagged as an estimated value, subject to significant high bias. Radionuclide: Cesium-134 Energy: 604.66 Photon Abundance: 0.9762 Cesium-134 (134Cs) suffers from coincidence summing, due to the multiple simultaneous photon emissions during each decay event. This results in a potentially low bias in the final analytical results. The magnitude of this low bias is highly dependent on the 134Cs activity levels and the specific counting geometry. Any 134Cs activity reported above the associated Minimum Detectable Concentration (MDC) should be considered to have a potential low bias. The most abundant gamma emission specified for quantification of this nuclide suffers from possible resolution interference due to the antimony-124 (124Sb) gamma emission occurring at 602.71 keV (0.9826, abundance). Therefore, a possibility of a high bias to the 134Cs results may occur in the presence of elevated 124Sb activity.
Other gamma emissions used for quantification of this nuclide suffer from possible resolution interference due to multiple gamma emissions of 228Ac. Therefore, a possible high bias to the 134Cs activity results may occur in the presence of elevated 228Ac activity. Radionuclides: Cesium-137, Barium-137m Energy: 661.62 keV Photon Abundance: 0.8512

HGL—Final Gamma Radiation Sampling and Analysis Plan, SSFL—Ventura County, California
U. S. EPA Region 9 Gamma Scanning SAP A-6 HydroGeoLogic, Inc. 2/22/2010
Cesium-137 (137Cs) does not emit any gamma photons useful for quantification. However, it can be assumed to be in secular equilibrium with its short-lived barium-137m (137mBa) daughter product. Therefore, the activity for 137Cs is determined from the 661.62 keV gamma emission of the 137mBa daughter product. The calculated gamma photon abundance used in the library is the product of the 0.8998 abundance of the 661.62 keV 137mBa photon and the 0.946 branching ratio between 137Ba and 137mBa. The independent quantification of 137mBa is not typically performed in conventional gamma spectrometry analysis, as it is always (and only) found in secular equilibrium with its 137Cs parent, the primary radionuclide of interest. In addition, 137mBa photo-peak energies and abundance values are not repeated for both 137Cs and 137mBa, to prevent inappropriate “interference correction” algorithms from being incorrectly applied to the spectral data. If desired, 137mBa is reported via the clerical/administrative mechanism of simply duplicating the 137Cs results, multiplying those results by the 0.946 branching ratio of 137mBa, and assigning that calculated result to the 137mBa daughter radionuclide. Radionuclide: Europium-155 Energy: 105.31 Photon Abundance: 0.2120 The gamma emission useful for quantification of this nuclide suffers from possible resolution interference due to the uranium-235 (235U) gamma emission occurring at 105 keV (0.0210, abundance). Therefore, a possibility of a high bias to the europium-155 (155Eu) results may occur in the presence of elevated 235U activity. Europium-155 also emits gamma photons at 86.47 keV; however this emission energy is subject to significant lead x-ray interference and is therefore excluded from the library. Radionuclides: Plutonium-238, Plutonium-239 Energy: various Photon Abundance: various Plutonium-238 emits a primary x-ray photopeak at a very low energy of 13.6 keV, with additional supporting photopeaks at similarly low emission energies. This range of energies suffers from numerous and potentially significant interferences from a wide range of naturally occurring and anthropogenic radionuclides. The accurate field identification and resolution of photon emissions at those energies is highly dependent on the quality and configuration of the FIDLER detectors. Even under ideal conditions the practical limits of detection are high and 238Pu will only be detected when it is present in elevated quantities. In addition, the primary 13.6 keV photopeak is not distinguishable from the 13.0 keV photopeak of 239Pu. Identification of plutonium isotopes by FIDLER field measurements should be considered tentative and should be regarded as combined 238/239Pu results.

HGL—Final Gamma Radiation Sampling and Analysis Plan, SSFL—Ventura County, California
U. S. EPA Region 9 Gamma Scanning SAP A-7 HydroGeoLogic, Inc. 2/22/2010
Radionuclide: Potassium-40 Energy: 1460.75 Photon Abundance: 0.1100 The only gamma emission useful for quantification of this nuclide suffers from possible resolution interference due to the 228Ac gamma emission occurring at 1459.2 keV (0.0104, abundance). Therefore, a possibility of a high bias to the potassium-40 (40K) results may occur in the presence of extremely elevated 228Ac activity. Radionuclides: Radium-226, Bismuth-214, Lead-214, Radon-222 Energy: various Photon Abundance: various All activity values for radium-226 (226Ra) are calculated using the observed photo-peaks from the bismuth-214 (214Bi) and lead-214 (214Pb) progeny, with a half-life, t1/2=1600 years. This approach assumes that the laboratory has sealed the sample in an appropriate container and allowed sufficient in-growth time for the radon-222 (222Rn), 214Bi, and 214Pb progeny to achieve secular equilibrium prior to analysis. In the attached library, only 226Ra is selected as the analyte of interest. The photo-peak energies and abundance values are not repeated for 214Bi and 214Pb, to prevent inappropriate “interference correction” algorithms from being incorrectly applied to the spectral data. If desired, 214Bi and 214Pb may be analyzed separately using the individual photo-peaks for each radionuclide. These separated values are listed at the end of the attached library. It is noted that, in cases where the sample is not sealed in an appropriate container, as described above, the library must
incorporate the individual 214Bi and 214Pb results, rather than inferring secular equilibrium wit h the 226Ra parent. In that case, 226Ra activity may not be accurately quantified by gamma spectrometry.
In the attached library, 222Rn is not selected as an analyte of interest, as no useful gamma emissions are produced directly by 222Rn. If desired, 222Rn is reported via the clerical/administrative mechanism of simply duplicating the 226Ra results, and assigning them to the 222Rn progeny. Where 214Bi and 214Pb are reported instead of 226Ra, the average of those results may be reported as the 222Rn value. Radionuclides: Antimony-125, Tellurium-125m Energy: 600.77 Photon Abundance: 0.1786
The 600.77 keV gamma emission specified for this nuclide suffers possible resolution interference with the antimony-124 (124Sb) gamma emission occurring at 602.71 keV (0.9826, abundance). Therefore, this photo-peak will be used as an identifier only and not in the activity calculations for this nuclide.

HGL—Final Gamma Radiation Sampling and Analysis Plan, SSFL—Ventura County, California
U. S. EPA Region 9 Gamma Scanning SAP A-8 HydroGeoLogic, Inc. 2/22/2010
In the attached library, tellurium-125m (125mTe) is not included as a separate radionuclide because it is assumed to be in a state of equilibrium with antimony-125 (125Sb), after accounting for the 23.1% branching ratio of 125mTe. Tellurium-125m activity, therefore, is reported via the clerical/administrative mechanism of calculating the product of the reported 125Sb activity and the 23.1% branching ratio for 125mTe, and reporting that value as the 125mTe result. Radionuclide: Tin-126 Energy: 694.0 keV Photon Abundance: 0.86 Quantification of tin-126 (126Sn) is via the 694.0 keV photo-peak of the antimony-126m (126mSb) daughter product, which is assumed to be in secular equilibrium with 126Sn, with the parent half life, t1/2=1.0 x 105 years.
Radionuclide: Thorium-234 Energy: 92.50 Photon Abundance: 0.0553 The 92.50 keV photo-peak used in this library for thorium-234 (234Th) quantification is actually two separate photo-peaks, occurring at 92.4 keV and 92.8 keV. Common software products used for gamma spectroscopic analysis cannot generally resolve two photo-peaks that occur in such close proximity to each other. Consequently, these two photo-peaks are typically observed as a single photo-peak and the average of the two photo-peak energies is used in this library. Also, the sum of the two photo-peak abundances, 0.0553, is used in the activity calculations for this observed ‘single’ photo-peak. All activity values for 234Th are calculated using the half-life, t1/2=4.468E+09 yrs, of the long-lived uranium-238 (238U) parent. It is assumed that secular equilibrium is achieved between the 238U parent and the 234Th progeny. Radionuclide: Uranium-235 Energy: various Photon Abundance: various The most abundant 235U photopeak, which has an emission energy of 185.7 keV, has spectral interference from the 186.1 keV photopeak emitted by radium-226 (226Ra). As 235U and 226Ra are both naturally occurring and are generally found together in environmental soils, this photopeak is not used in the identification or quantification of either radionuclide. The use of the less abundant 143.8 keV photopeak, and other supporting photopeaks, results in a somewhat increased detection limit for 235U, but prevents significant high bias to the results in the presence of 226Ra.

APPENDIX B
PHOTOGRAPHS

HGL—Final Gamma Radiation Sampling and Analysis Plan, SSFL—Ventura County, California
U. S. EPA Region 9 Gamma Scanning SAP B-1 HydroGeoLogic, Inc. 2/22/2010
Photograph 1: EPA ERGS detection system mounted on a tractor
Photograph 2: RSI RSX-4 detection system
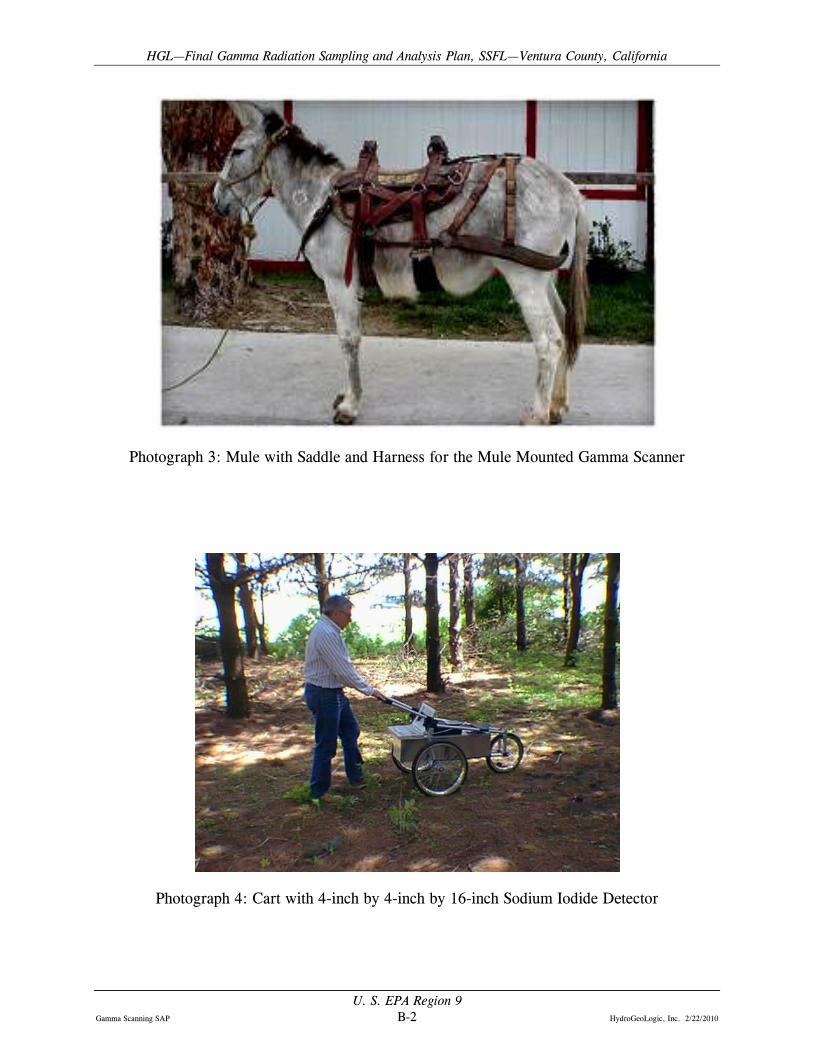
HGL—Final Gamma Radiation Sampling and Analysis Plan, SSFL—Ventura County, California
U. S. EPA Region 9 Gamma Scanning SAP B-2 HydroGeoLogic, Inc. 2/22/2010
Photograph 3: Mule with Saddle and Harness for the Mule Mounted Gamma Scanner
Photograph 4: Cart with 4-inch by 4-inch by 16-inch Sodium Iodide Detector

HGL—Final Gamma Radiation Sampling and Analysis Plan, SSFL—Ventura County, California
U. S. EPA Region 9 Gamma Scanning SAP B-3 HydroGeoLogic, Inc. 2/22/2010
Photograph 5: Hand-Held 3-inch by 3-inch Sodium Iodide Detector
Photograph 6: HPGe Detector Mounted on a Detector Stand
APPENDIX C
STANDARD OPERATING PROCEDURES