Stratified Sampling of Execution Traces: Execution Phases ...
Upload
asher-stoneCategory
view
244download
1
AP StatisticsFinal Exam Review!!!!!
Experimental DesignRandom SamplingStratified SamplingConvenience SamplingCluster SamplingSystematic SamplingMultistage SamplingCensus etc…………
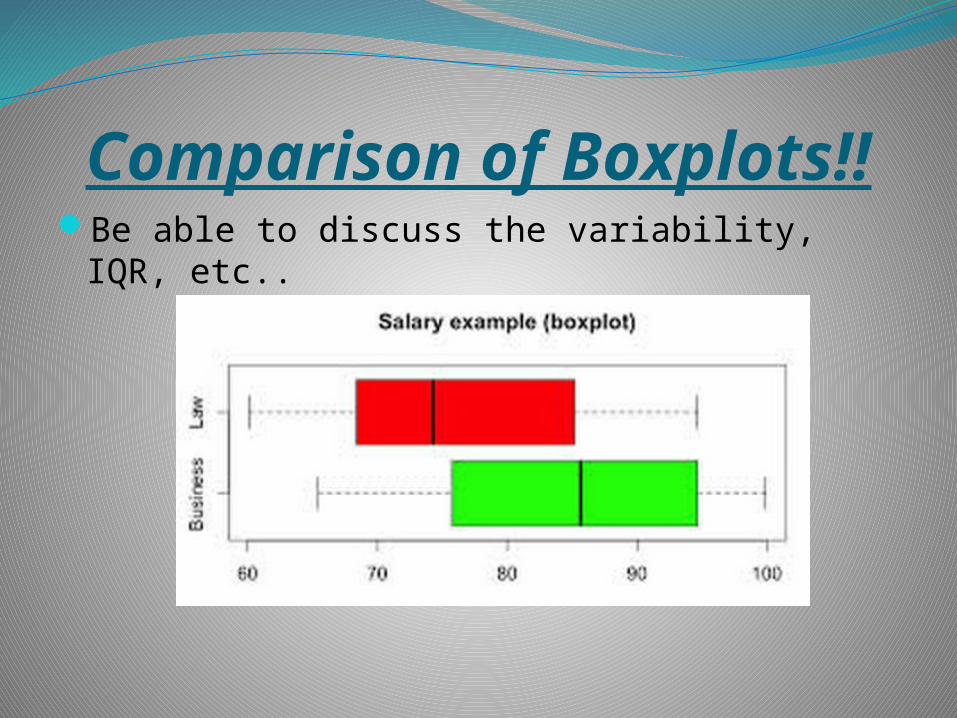
Comparison of Boxplots!!Be able to discuss the variability, IQR, etc..
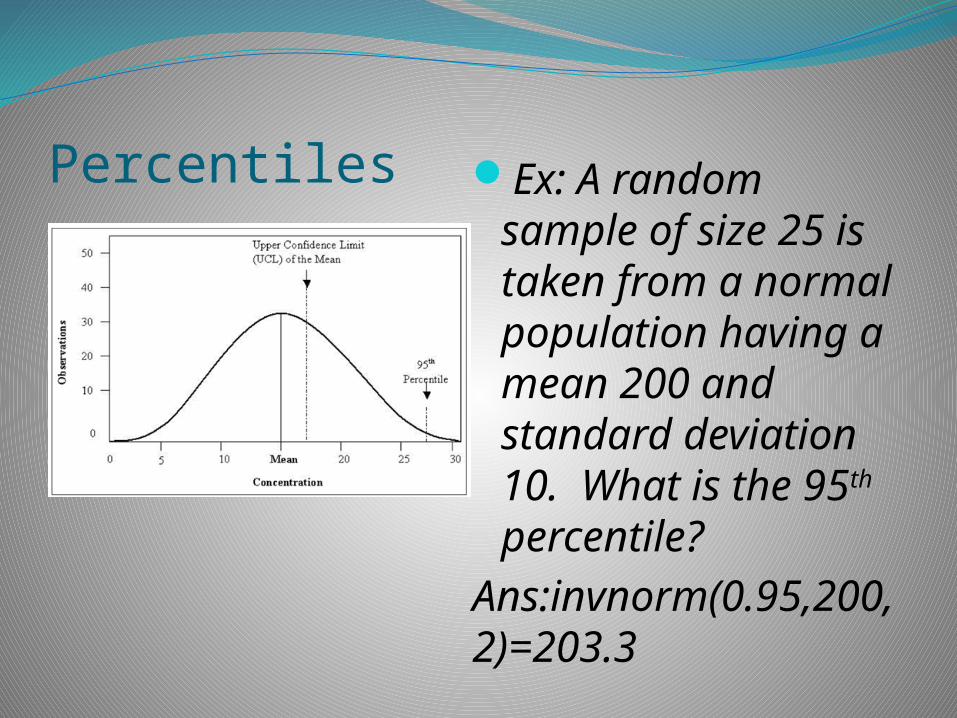
Percentiles Ex: A random sample of size 25 is taken from a normal population having a mean 200 and standard deviation 10. What is the 95th percentile?
Ans:invnorm(0.95,200,2)=203.3
Probability!!Formulas:P(A and B)=P(A)P(B) If they are independentP(A or B)=P(A) + P(B) If they are mutually exclusive
OR
P(A or B)=P(A) + P(B)- P(A and B) if they have two events in common!!
P(AІB)= P(A and B)/ P(B)
Probability Examples
Ex 1: The probability I like Pretzels is .45. The probability I likes Bagels is .25. The probability I like Pretzels and Bagels is .35. Are these 2 events independent?
Is P(P and B)=P(P)*P(B)? 0.35 ≠ (0.45)(0.25)
Therefore they are not independent!
Ex 2: The probability that I play volleyball on Tuesday is 0.9. The probability that I play volleyball and go running on Tuesday is 0.6. What is the probability I went running, given that I went to volleyball?
P(R|V)= 0.6/0.9=0.6667
Venn Diagram
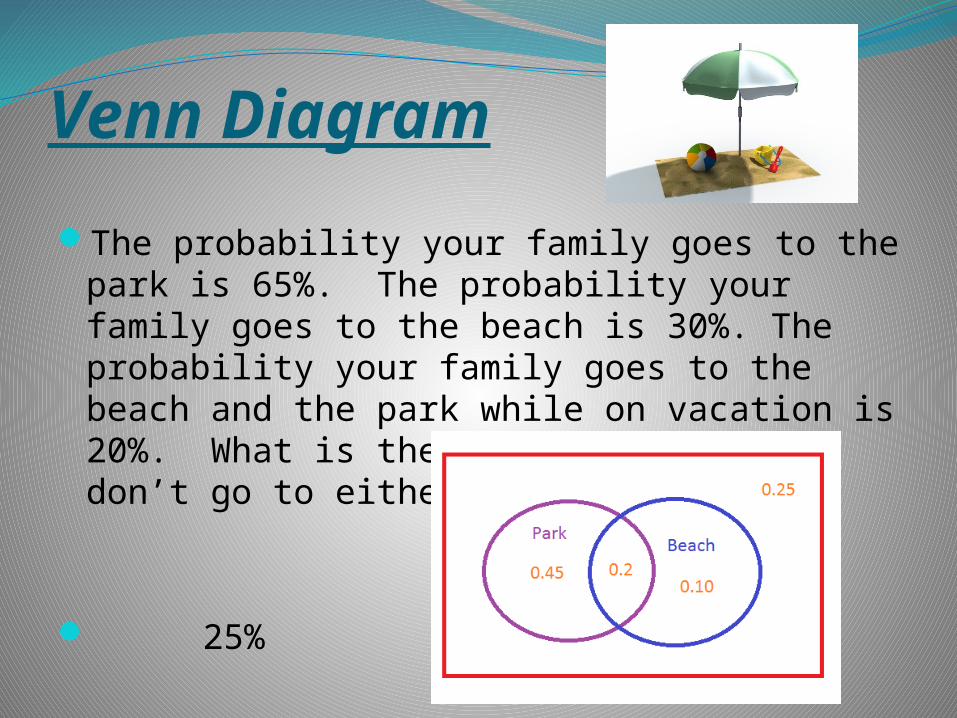
The probability your family goes to the park is 65%. The probability your family goes to the beach is 30%. The probability your family goes to the beach and the park while on vacation is 20%. What is the probability they don’t go to either?
25%
Mean and Standard Deviation of Independent Events
The mean amount of calories in a cup of cereal is 200 calories with a standard deviation of 20. The mean amount of calories in a cup of milk is 100 calories with a standard deviation of 10.
What is the mean and standard deviation of the amount of calories if you pour one cup of cereal and one cup of milk.
=
Error in a Significance TestType I: (α) -Reject H₀ when in fact H₀ is true.
Type II: (β) -Accept H₀, when in fact Ha is true.
** Remember to define and also state in terms of the problem
Increase Power????? Increase you sample size!!!!!!!
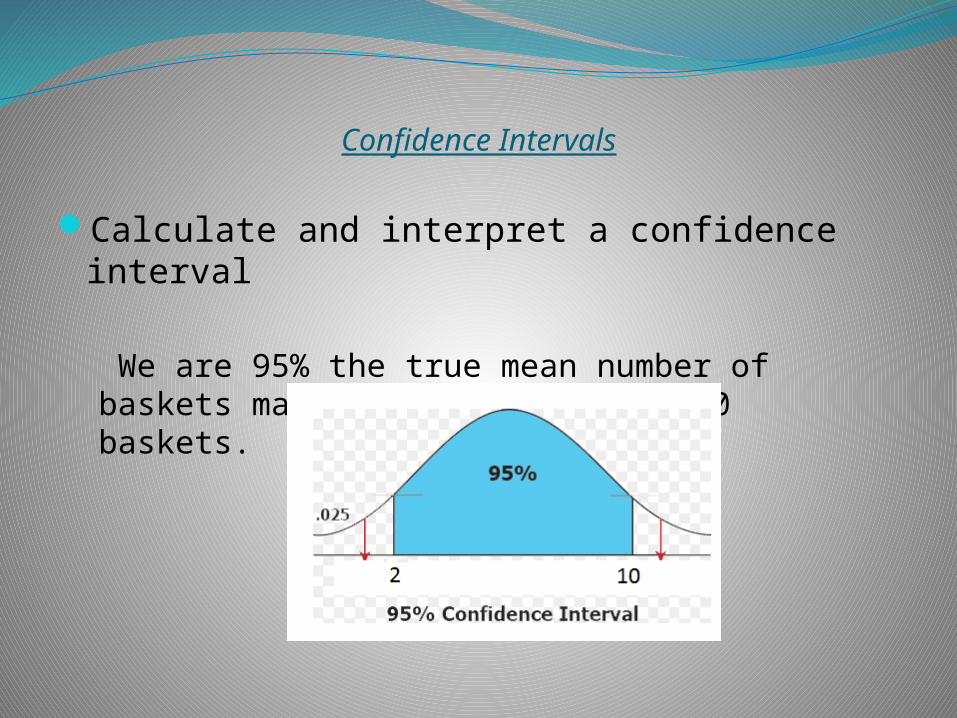
Confidence Intervals
Calculate and interpret a confidence interval
We are 95% the true mean number of baskets made was between 2 and 10 baskets.
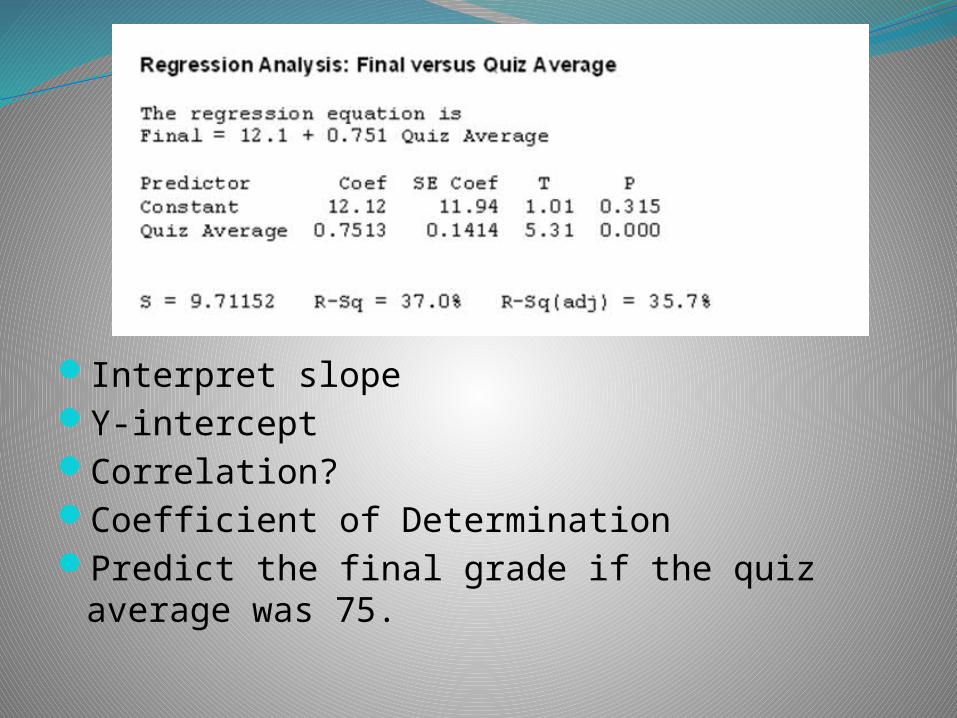
Interpret slopeY-interceptCorrelation?Coefficient of DeterminationPredict the final grade if the quiz average
was 75.
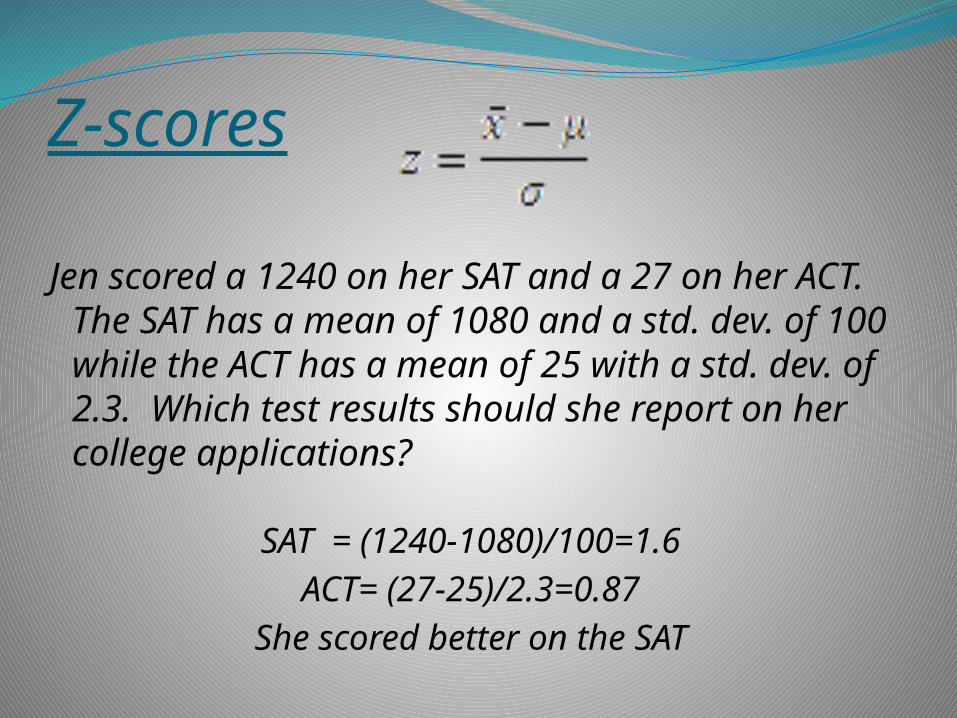
Z-scores
Jen scored a 1240 on her SAT and a 27 on her ACT. The SAT has a mean of 1080 and a std. dev. of 100 while the ACT has a mean of 25 with a std. dev. of 2.3. Which test results should she report on her college applications?
SAT = (1240-1080)/100=1.6ACT= (27-25)/2.3=0.87
She scored better on the SAT
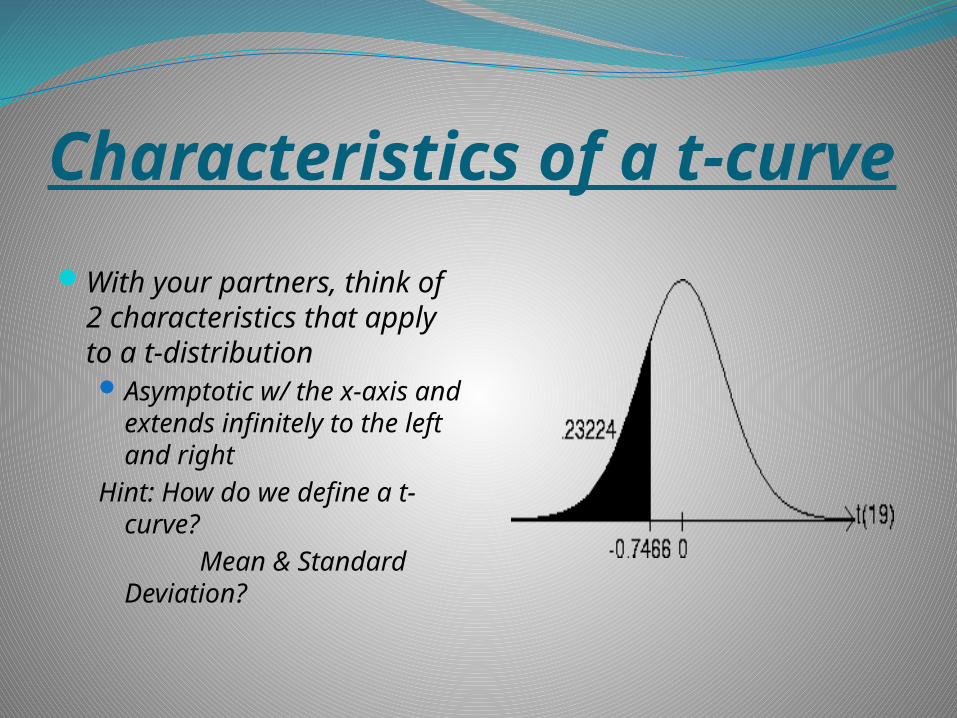
Characteristics of a t-curve
With your partners, think of 2 characteristics that apply to a t-distributionAsymptotic w/ the x-axis
and extends infinitely to the left and right
Hint: How do we define a t-curve?
Mean & Standard Deviation?
How measures of center are affectedWhat happens to the: -mean -standard deviation -median -correlationa) If I double everyone’s quiz grade.b) If I add 5 extra credit points to everyone’s
quiz grade.
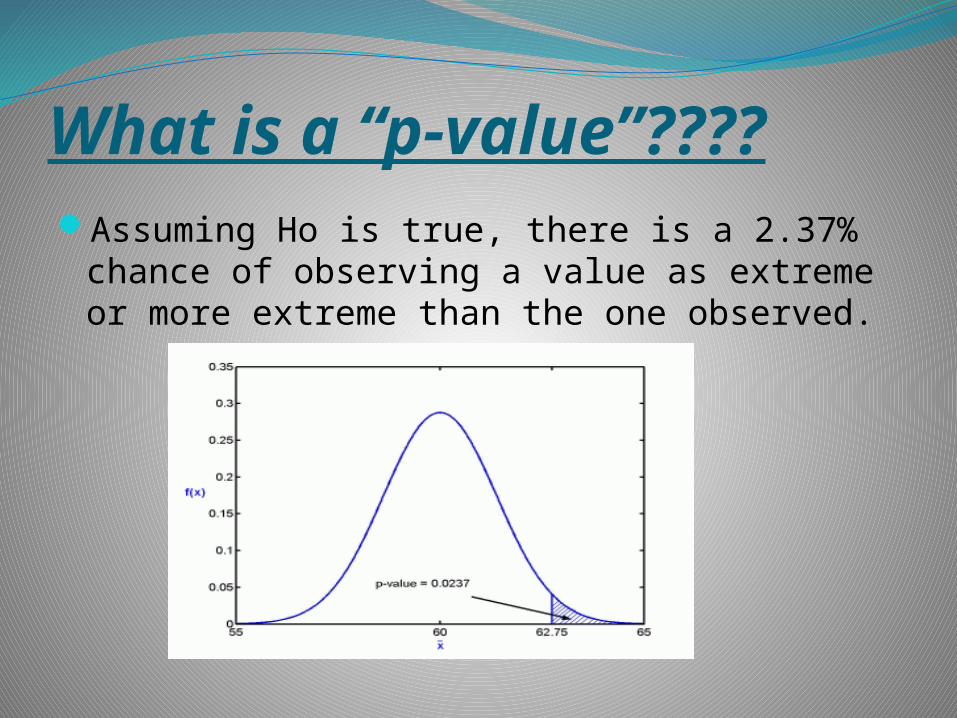
What is a “p-value”????Assuming Ho is true, there is a 2.37% chance
of observing a value as extreme or more extreme than the one observed.
Binomial Distribution-There are a fixed # of trials-They are independent-The probability of success, p, is the same
-There are 2 outcomes, success or failure.
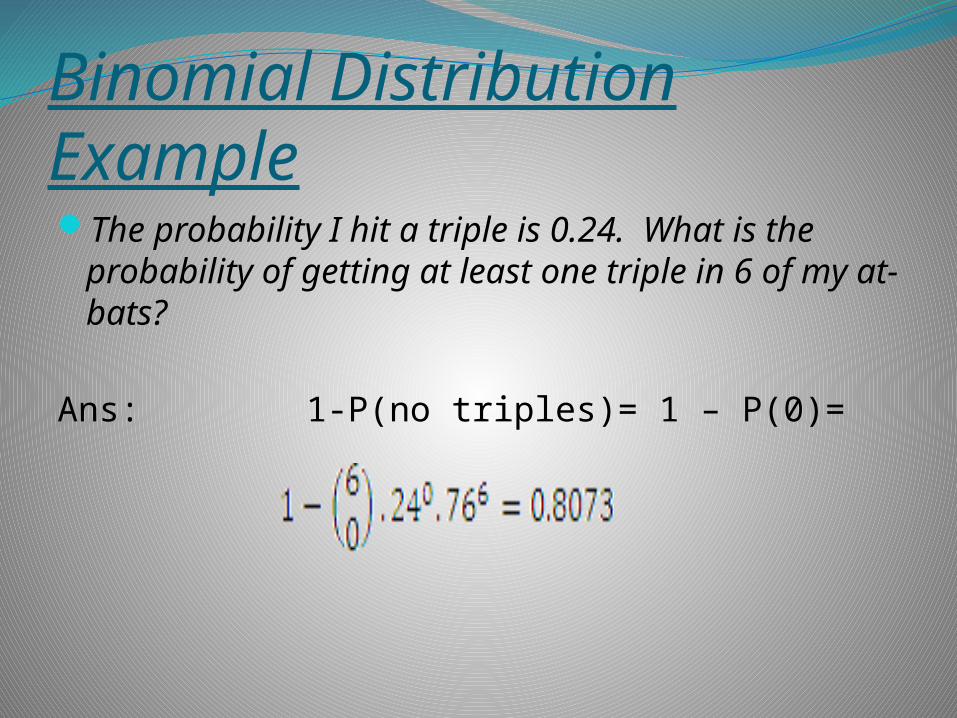
Binomial Distribution ExampleThe probability I hit a triple is 0.24. What is
the probability of getting at least one triple in 6 of my at-bats?
Ans: 1-P(no triples)= 1 – P(0)=
ResidualsResiduals: Observed – Predicted
R= O-PWhat does it mean if we get a negative
residual?Prediction was too high
Positive?Prediction was too low
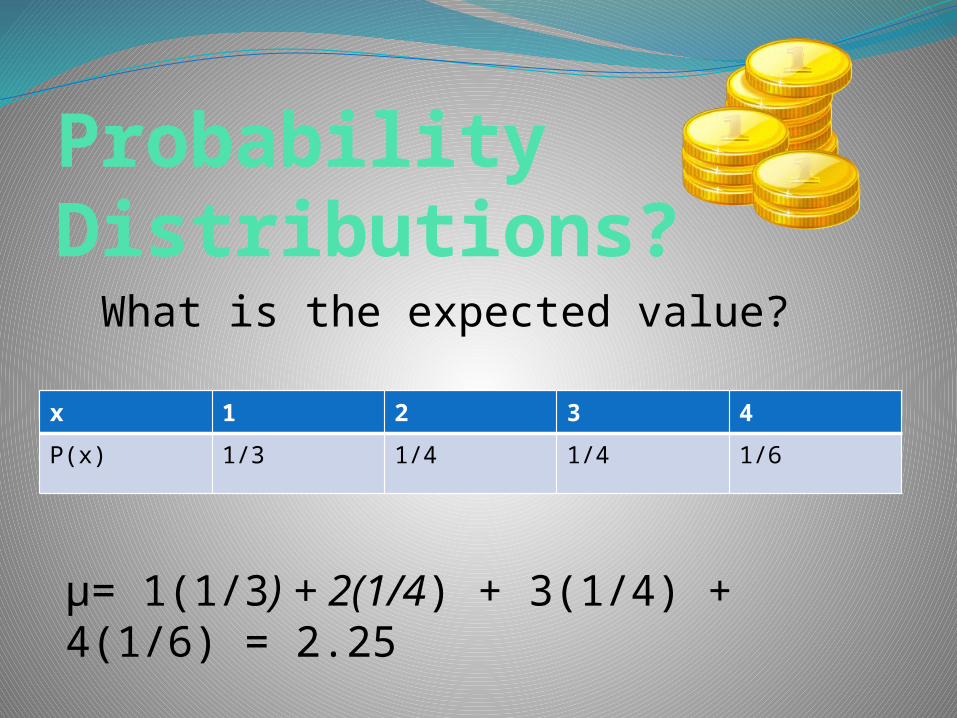
Probability Distributions?
What is the expected value?
x 1 2 3 4
P(x) 1/3 1/4 1/4 1/6
μ= 1(1/3) + 2(1/4) + 3(1/4) + 4(1/6) = 2.25
Central Limit TheoremWhat is the difference between the central limit theorem and the law of large numbers?
Margin of ErrorOne sample t-interval
One proportion z-interval
Free Response QuestionsThere will be 4 free response questions. They
could include any of the following topics.- Linear Regression Test (How to read the output) Interpet slope, y-int, residuals, y=a+bx,etc….-Probability- Are they independent?-Matched pairs t-test -2 Sample t-test-Chi-Squared Test
-know Goodness of fit, Homogeneity, and Independence